
Application of Areal Topography Parameters in Surface Characterization

 ,
,  ,
,  ,
,  and
and
Abstract
1. Introduction and Terminological Framework
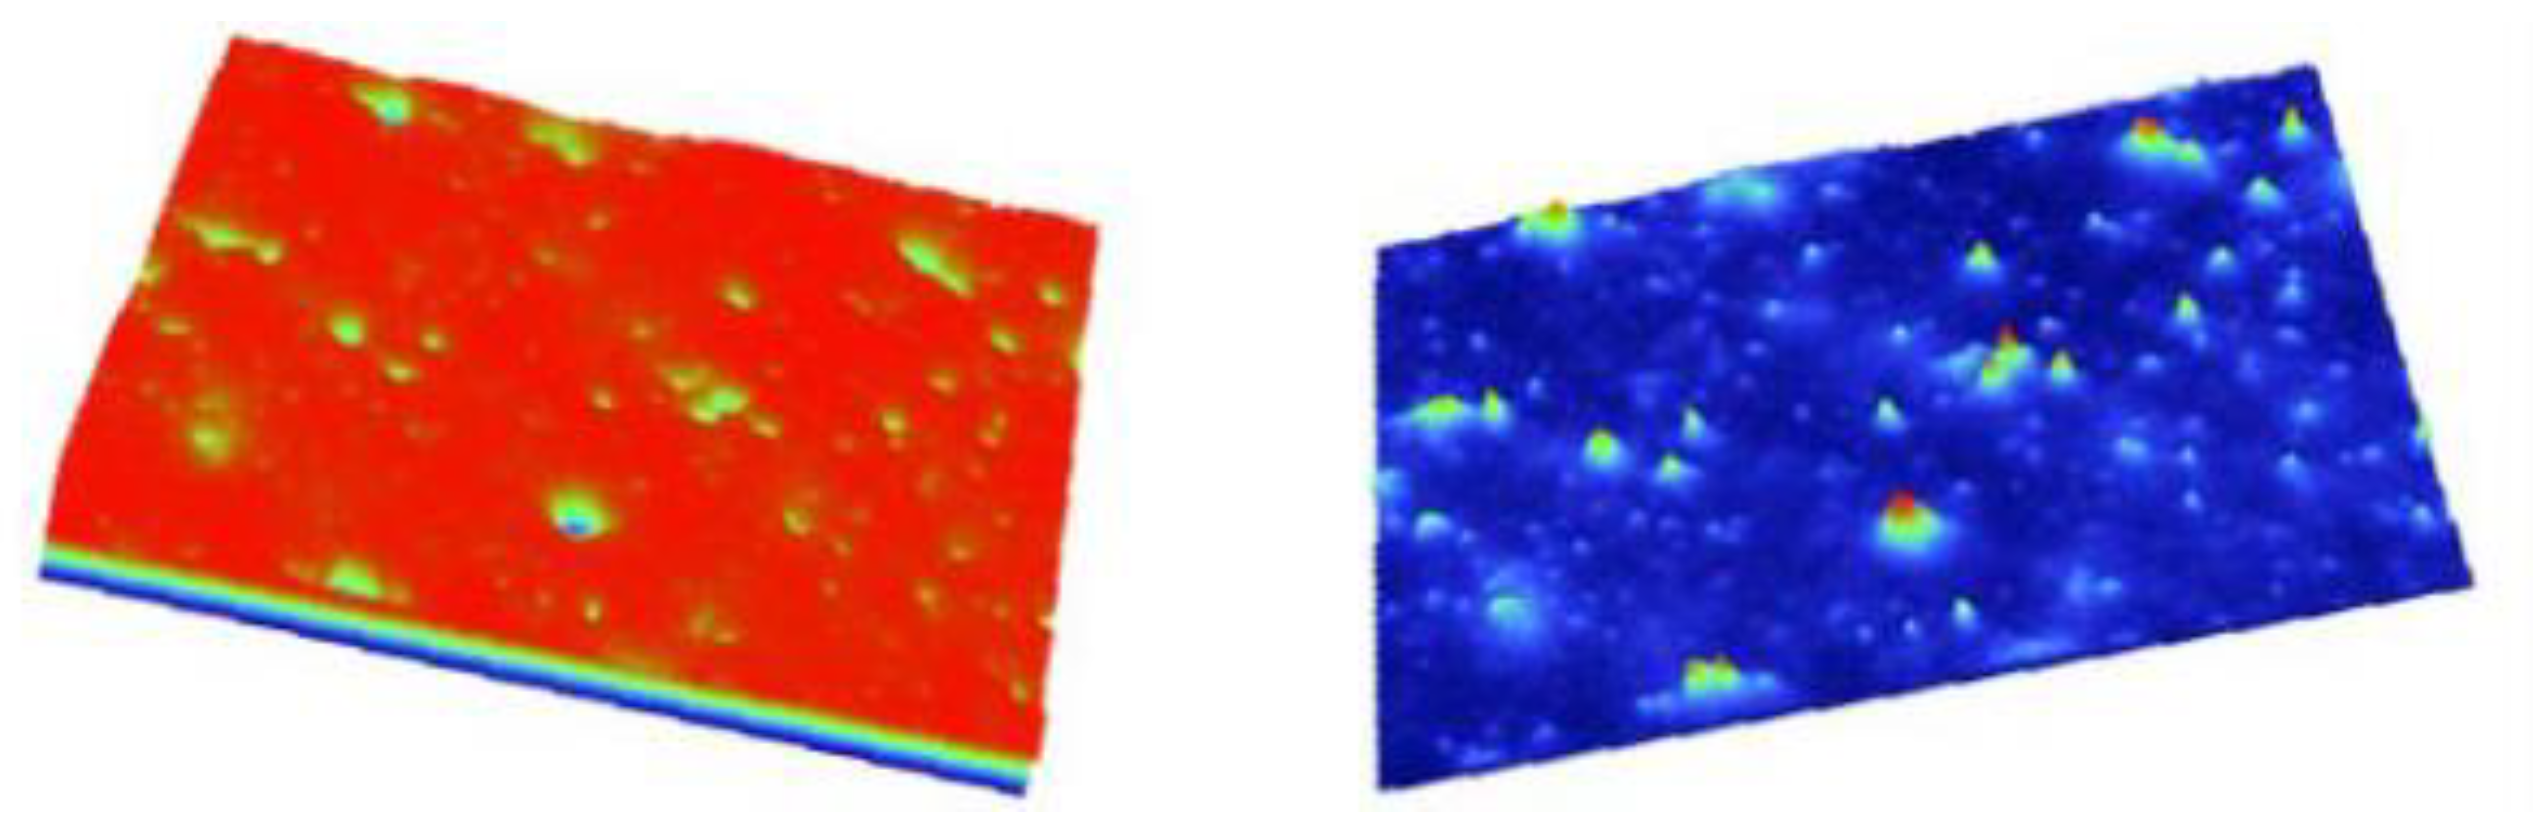
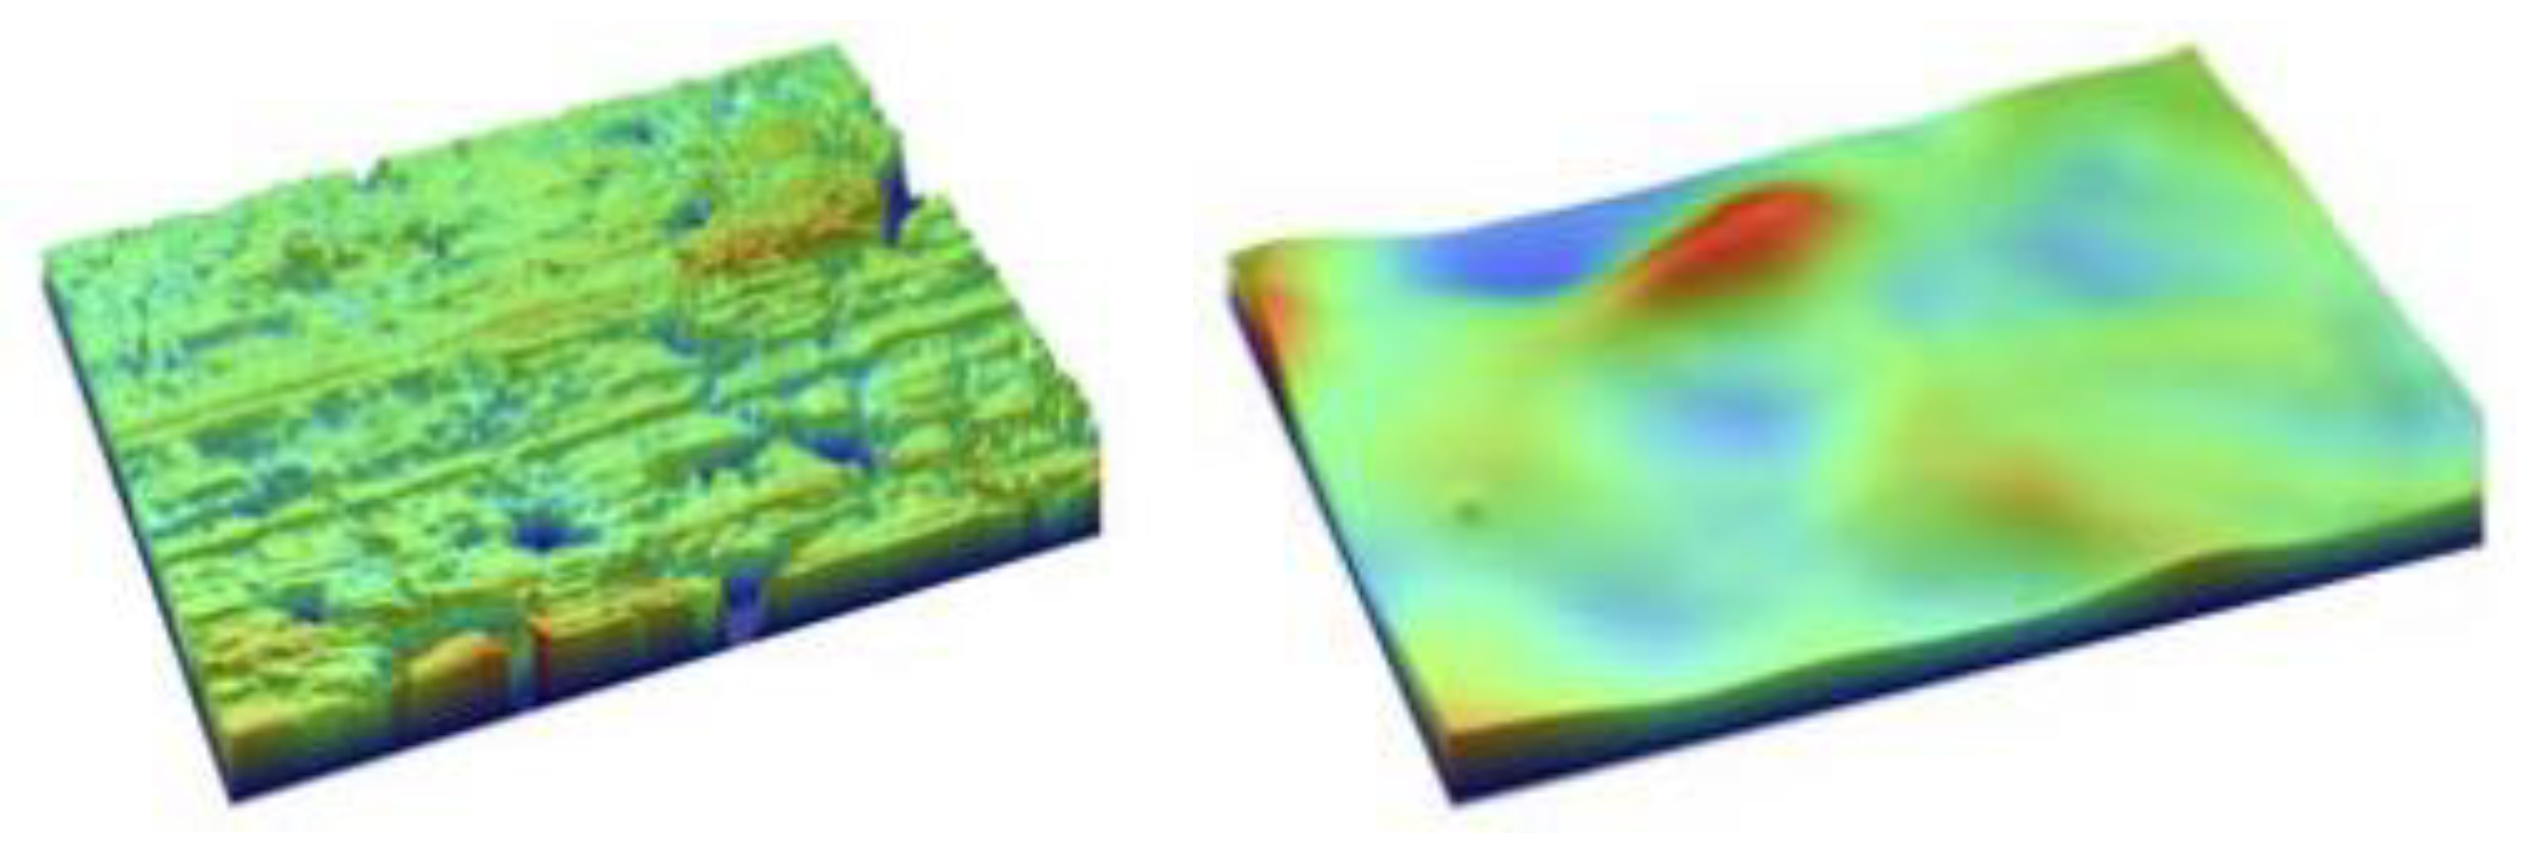
2. Areal Topography Parameters from Definition to Application
3. Assessment of the Quality of Measurement Results Obtained via an Atomic Force Microscope
Influence of Surface Profile Geometry on the Parameters in AFM Measurements: A Monte Carlo Approach
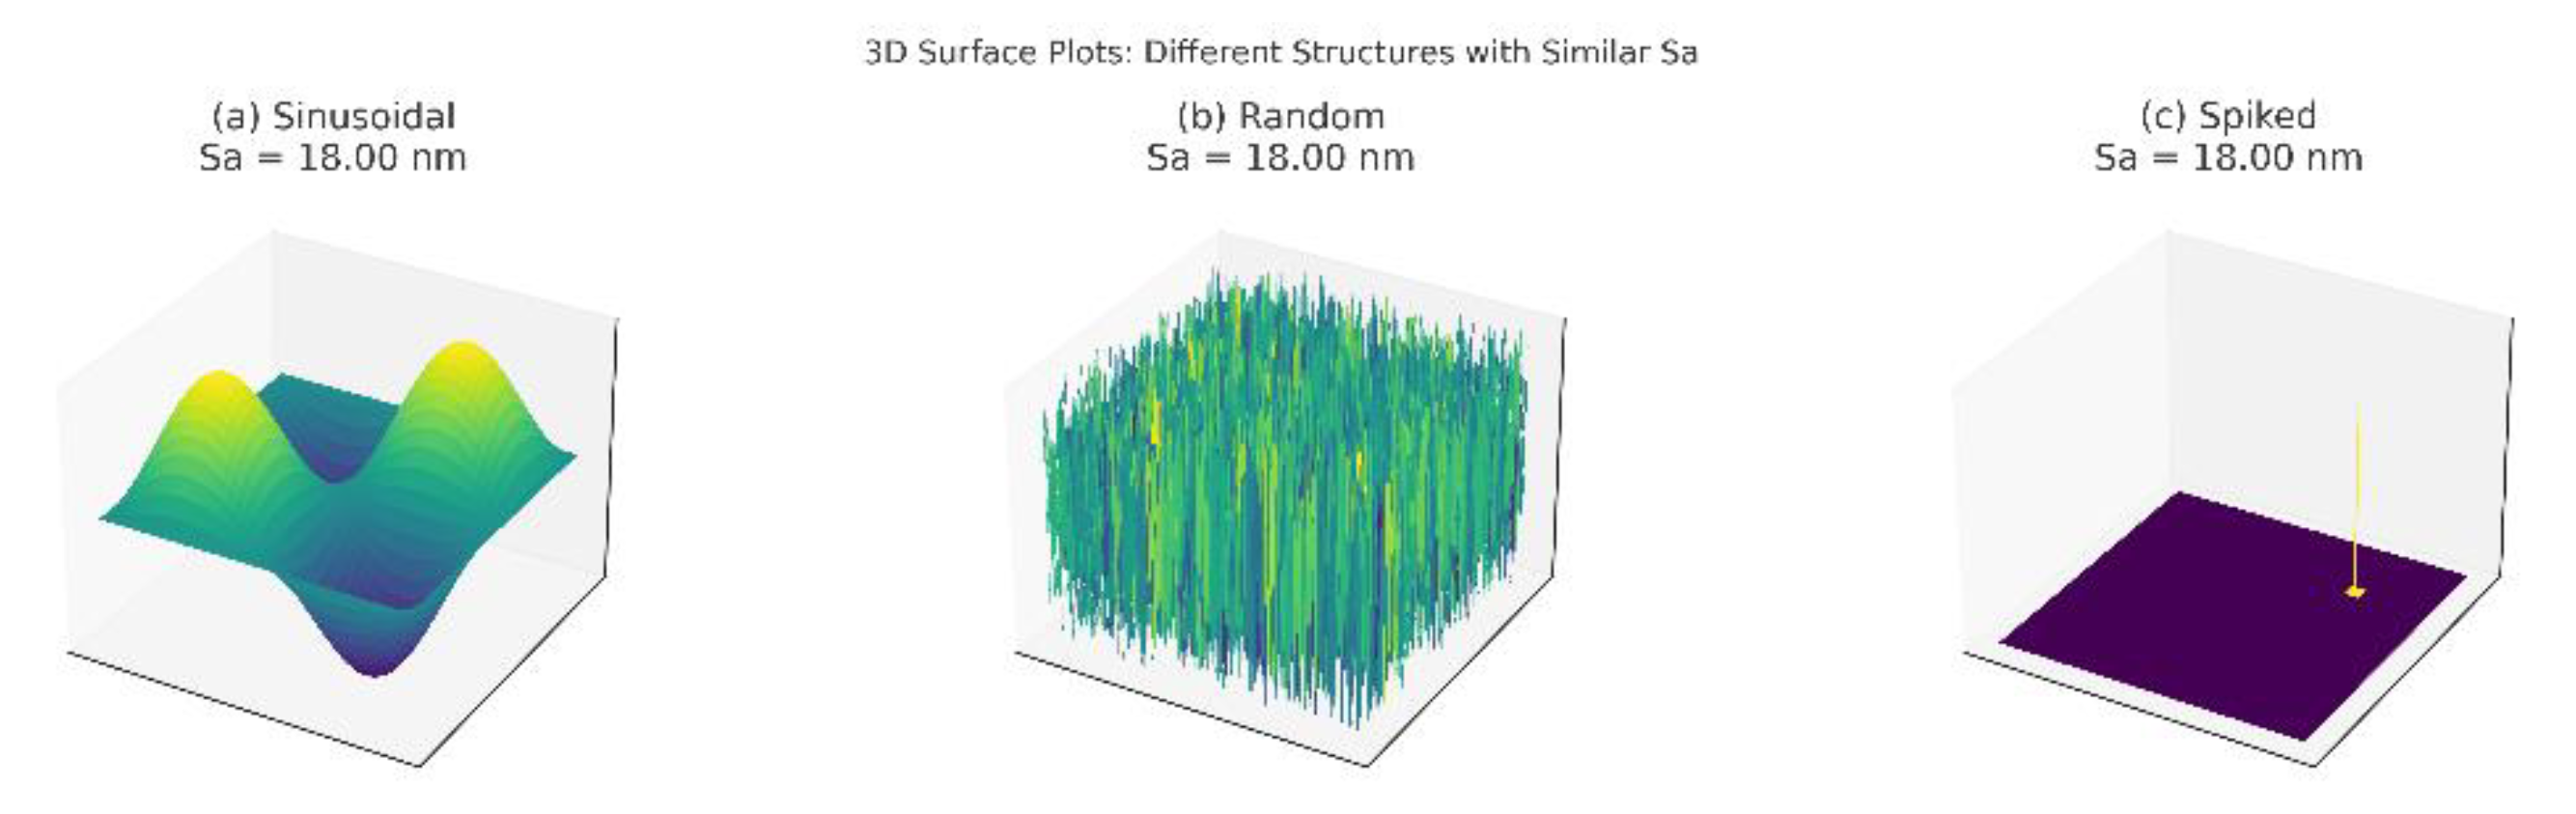
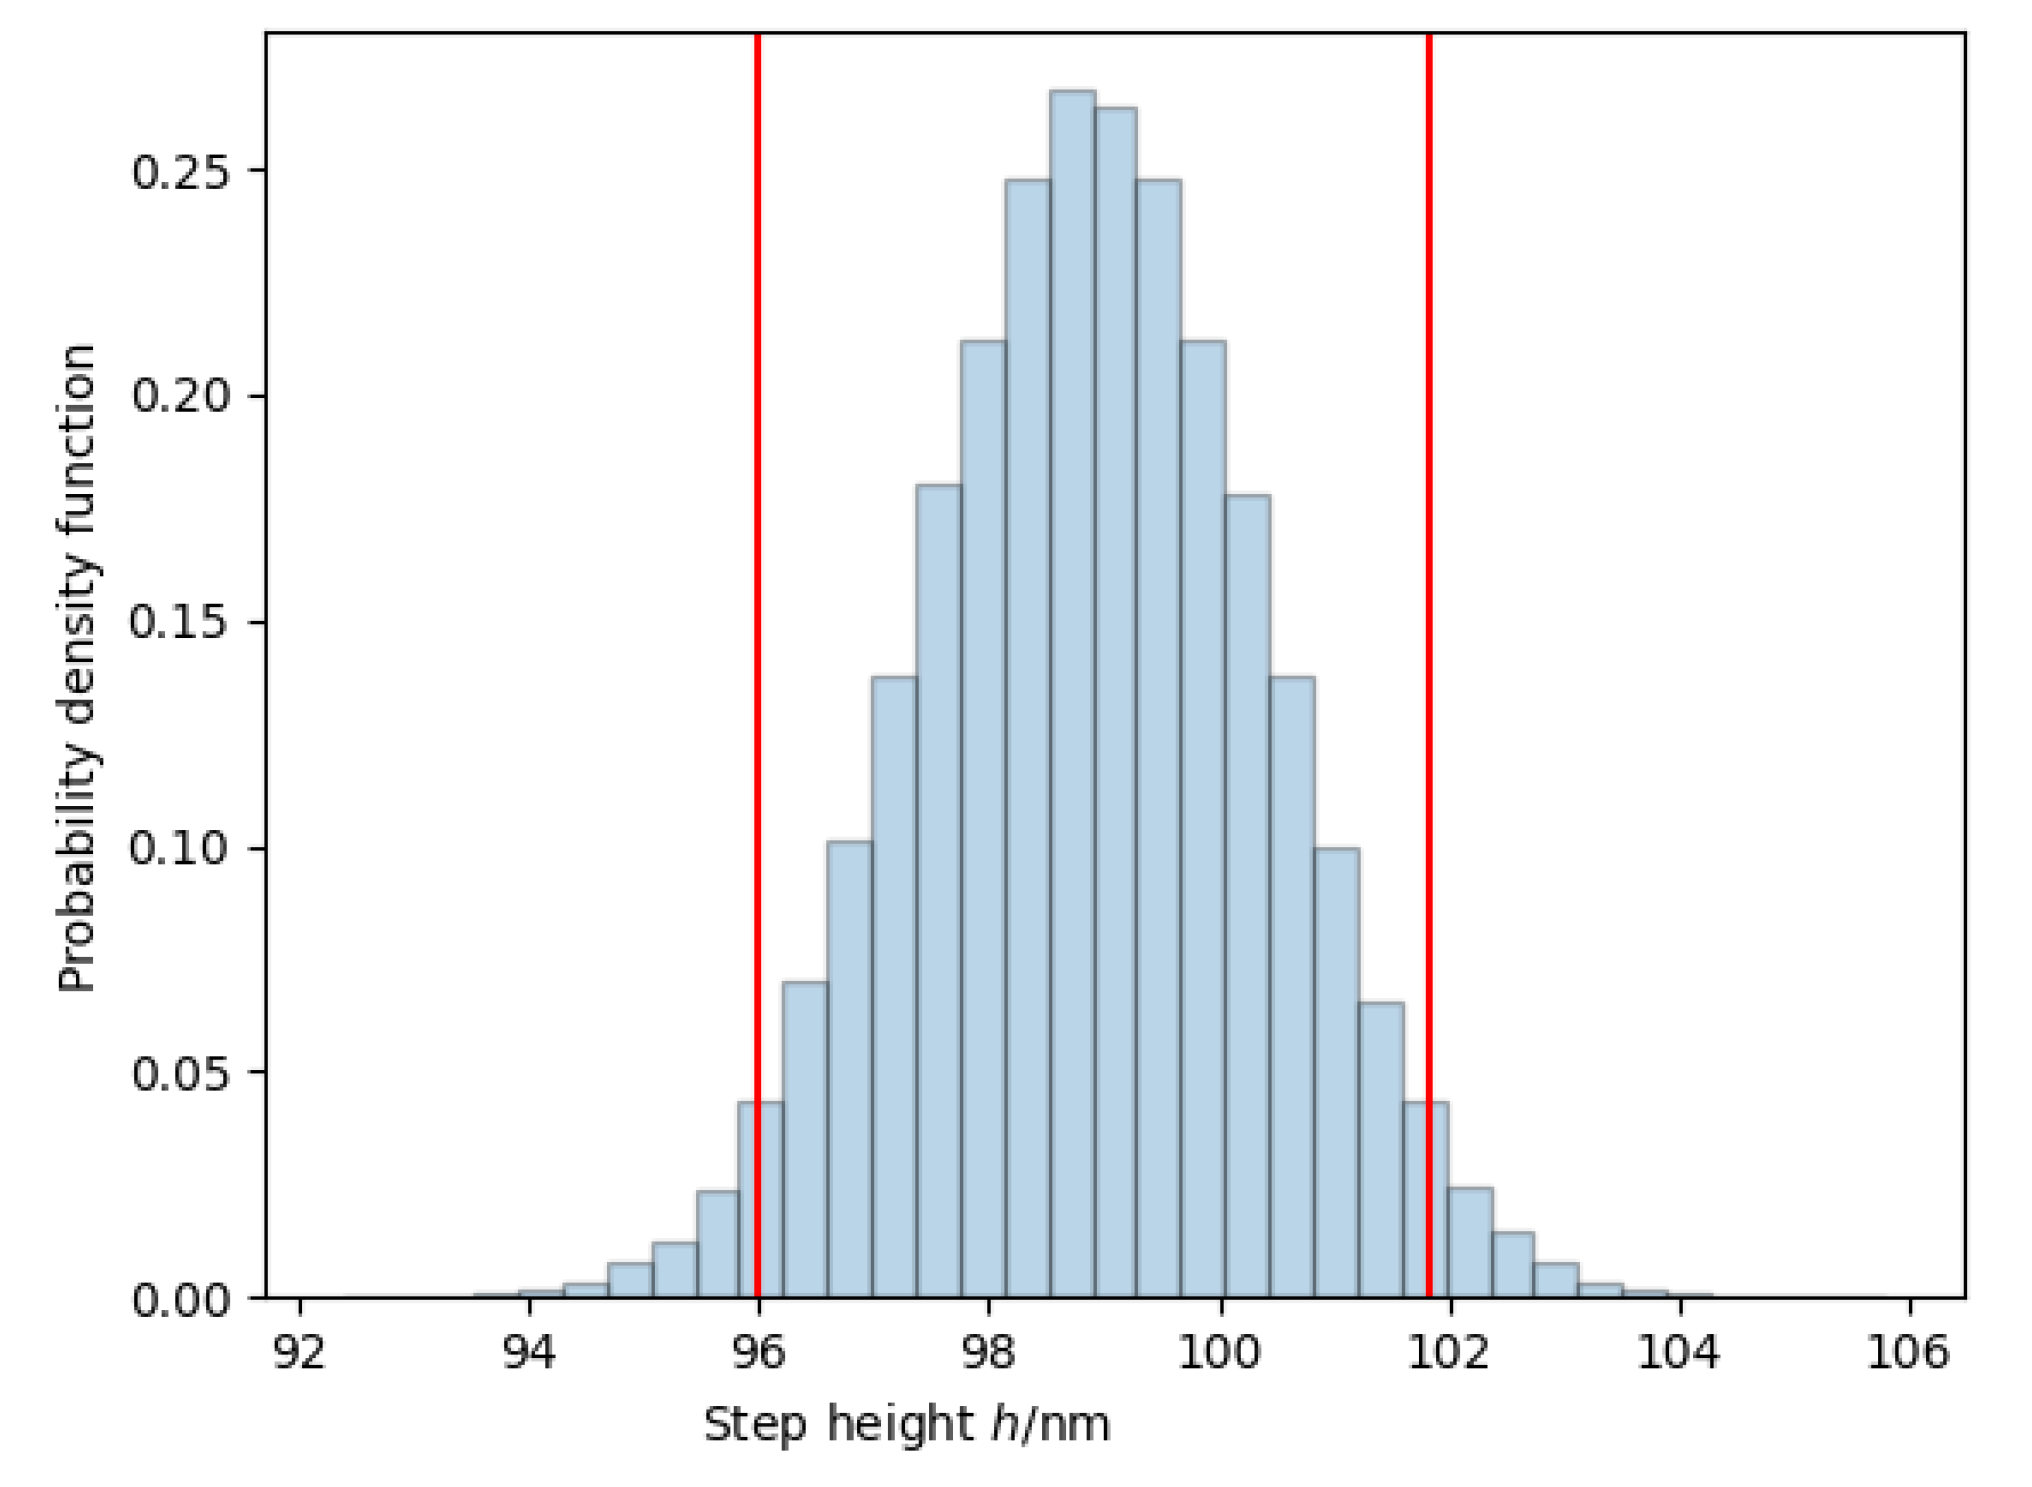
- The simulations clearly showed the following:
4. Conclusions
Author Contributions
Funding
Conflicts of Interest
References
- Pawlus, P.; Reizer, R.; Wieczorowski, M. Functional Importance of Surface Texture Parameters. Materials 2021, 14, 5326. [Google Scholar] [CrossRef] [PubMed]
- He, B.; Webb, D.P.; Petzing, J. Areal Surface Texture Parameters for Copper/Glass Plating Adhesion Characteristics. Meas. Sci. Rev. 2021, 21, 11–18. [Google Scholar] [CrossRef]
- Bazan, A.; Turek, P.; Sułkowicz, P.; Przeszłowski, Ł.; Zakręcki, A. Influence of the Size of Measurement Area Determined by Smooth-Rough Crossover Scale and Mean Profile Element Spacing on Topography Parameters of Samples Produced with Additive Methods. Machines 2023, 11, 615. [Google Scholar] [CrossRef]
- Razumić, A.; Runje, B.; Lisjak, D.; Kolar, D.; Horvatić Novak, A.; Štrbac, B.; Savković, B. Atomic Force Microscopy: Step Height Measurement Uncertainty Evaluation. Teh. Glas. 2024, 18, 209–214. [Google Scholar] [CrossRef]
- Razumić, A.; Runje, B.; Keran, Z.; Trzun, Z.; Pugar, D. Reproducibility of Areal Topography Parameters Obtained by Atomic Force Microscope. Teh. Glas. 2025, 19, 1–6. [Google Scholar] [CrossRef]
- Heikkinen, E.-P.; Fabritius, T.; Riipi, J. Holistic Analysis on the Concept of Process Metallurgy and Its Application on the Modeling of the AOD Process. Met. Mater. Trans. B 2010, 41, 758–766. [Google Scholar] [CrossRef]
- Shaat, M. Effects of Surface Integrity on the Mechanics of Ultra-Thin Films. Int. J. Solids Struct. 2018, 136–137, 259–270. [Google Scholar] [CrossRef]
- Bhattacharya, S.; Sahara, R.; Božić, D.; Ruzic, J. Data Analytics Approach to Predict the Hardness of Copper Matrix Composites. Metall. Mater. Eng. 2020, 26, 357–364. [Google Scholar] [CrossRef] [PubMed]
- Senin, N.; Thompson, A.; Leach, R. Feature-Based Characterisation of Signature Topography in Laser Powder Bed Fusion of Metals. Meas. Sci. Technol. 2018, 29, 045009. [Google Scholar] [CrossRef]
- Senin, N.; Thompson, A.; Leach, R.K. Characterisation of the Topography of Metal Additive Surface Features with Different Measurement Technologies. Meas. Sci. Technol. 2017, 28, 095003. [Google Scholar] [CrossRef]
- Molnar, V. Influence of Cutting Parameters and Tool Geometry on Topography of Hard Turned Surfaces. Machines 2023, 11, 665. [Google Scholar] [CrossRef]
- Das, J.; Linke, B. Evaluation and Systematic Selection of Significant Multi-Scale Surface Roughness Parameters (SRPs) as Process Monitoring Index. J. Mater. Process. Technol. 2017, 244, 157–165. [Google Scholar] [CrossRef]
- Lee, J.; Hossain, M.S.; Taheri, M.; Jameel, A.; Lakshmipathy, M.; Taheri, H. Characterization of Surface Topography Features for the Effect of Process Parameters and Their Correlation to Quality Monitoring in Metal Additive Manufacturing. Metrology 2022, 2, 73–83. [Google Scholar] [CrossRef]
- Muniappan, A.; Jayaraja, B.G.; Vignesh, T.; Singh, M.; Arunkumar, T.; Sekar, S.; Priyadharshini, T.R.; Pant, B.; Paramasivam, P. Artificial Intelligence Optimization of Turning Parameters of Nanoparticle-Reinforced P/M Alloy Tool. J. Nanomater. 2022, 2022, 9225185. [Google Scholar] [CrossRef]
- Yan, Z.; Yin, D.; Luo, L.; He, G.; Dai, Z. Integrated Product and Process Development of Powder Metallurgy Hub for Automotive Clutch. Powder Metall. 2019, 62, 247–257. [Google Scholar] [CrossRef]
- Abraham, A.M.; Venkatesan, S. A Critical Review on Biomaterials Using Powder Metallurgy Method. Eng. Res. Express 2024, 6, 012508. [Google Scholar] [CrossRef]
- Šugár, P.; Kováčik, J.; Šugárová, J.; Ludrovcová, B. A Study of Laser Micromachining of PM Processed Ti Compact for Dental Implants Applications. Materials 2019, 12, 2246. [Google Scholar] [CrossRef]
- Gomez, C.; Su, R.; Thompson, A.; DiSciacca, J.; Lawes, S.; Leach, R. Optimization of Surface Measurement for Metal Additive Manufacturing Using Coherence Scanning Interferometry. Opt. Eng. 2017, 56, 111714. [Google Scholar] [CrossRef]
- Božić, D.; Runje, B.; Razumić, A. Risk Assessment for Linear Regression Models in Metrology. Appl. Sci. 2024, 14, 2605. [Google Scholar] [CrossRef]
- Raeymaekers, B.; Berfield, T. Characterizing the As-Built Surface Topography of Inconel 718 Specimens as a Function of Laser Powder Bed Fusion Process Parameters. Rapid Prototyp. J. 2025, 31, 200–217. [Google Scholar] [CrossRef]
- Narasimharaju, S.R.; Liu, W.; Zeng, W.; See, T.L.; Scott, P.; Jiang, X.; Lou, S. Surface Texture Characterization of Metal Selective Laser Melted Part with Varying Surface Inclinations. J. Tribol. 2021, 143, 051106. [Google Scholar] [CrossRef]
- Zhang, G.P.; Liu, X.J.; Lu, W.L.; Jiang, X.Q. Investigation of Surface Topography at the End of Running-In Process. Appl. Mech. Mater. 2013, 437, 564–567. [Google Scholar] [CrossRef]
- Zhu, D.; Xu, L.; Wang, F.; Liu, T.; Lu, K. Evolution of Metal Surface Topography during Fatigue. Metals 2017, 7, 66. [Google Scholar] [CrossRef]
- Newton, L.; Thanki, A.; Bermudez, C.; Artigas, R.; Thompson, A.; Haitjema, H.; Leach, R. Optimisation of Imaging Confocal Microscopy for Topography Measurements of Metal Additive Surfaces. Metrology 2023, 3, 186–221. [Google Scholar] [CrossRef]
- Biesiekierski, A.; Li, Y.; Wen, C. The Application of the Rare Earths to Magnesium and Titanium Metallurgy in Australia. Adv. Mater. 2020, 32, 1901715. [Google Scholar] [CrossRef]
- ISO 25178-2:2021; Geometrical Product Specifications (GPS)—Surface Texture: Areal—Part 2: Terms, Definitions and Surface Texture Parameters. ISO: Geneva, Switzerland, 2021.
- 3D Characterization of Super-Smooth Surfaces of Diamond Turned OFHC Copper Mirrors: Materials and Manufacturing Processes: Volume 17, No 2. Available online: https://www.tandfonline.com/doi/abs/10.1081/AMP-120003534 (accessed on 30 May 2022).
- Cresti, S.; Itri, A.; Rebaudi, A.; Diaspro, A.; Salerno, M. Microstructure of Titanium-Cement-Lithium Disilicate Interface in CAD-CAM Dental Implant Crowns: A Three-Dimensional Profilometric Analysis. Clin. Implant Dent. Relat. Res. 2015, 17 (Suppl. S1), e97–e106. [Google Scholar] [CrossRef]
- Salerno, M.; Loria, P.; Matarazzo, G.; Tomè, F.; Diaspro, A.; Eggenhöffner, R. Surface Morphology and Tooth Adhesion of a Novel Nanostructured Dental Restorative Composite. Materials 2016, 9, 203. [Google Scholar] [CrossRef]
- Zagórski, I.; Korpysa, J. Surface Quality in Milling of AZ91D Magnesium Alloy. Adv. Sci. Technol. Res. J. 2019, 13, 119–129. [Google Scholar] [CrossRef]
- 3D S Height (Amplitude) Parameters—Michigan Metrology. Available online: https://www.michmet.com/3d_s_height_parameters.htm (accessed on 30 May 2022).
- Sedlaček, M.; Podgornik, B.; Vižintin, J. Correlation between Standard Roughness Parameters Skewness and Kurtosis and Tribological Behaviour of Contact Surfaces. Tribol. Int. 2012, 48, 102–112. [Google Scholar] [CrossRef]
- Micromorphological Characterization of Polymer-Oxide Nanocomposite Thin Films by Atomic Force Microscopy and Fractal Geometry Analysis—ScienceDirect. Available online: https://www.sciencedirect.com/science/article/pii/S0300944015300679?via%3Dihub (accessed on 30 May 2022).
- He, B.; Ding, S.; Shi, Z. A Comparison between Profile and Areal Surface Roughness Parameters. Metrol. Meas. Syst. 2021, 28, 413–438. [Google Scholar] [CrossRef]
- Stojanović, I.; Cindrić, I.; Turkalj, L.; Kurtela, M.; Rakela-Ristevski, D. Durability and Corrosion Properties of Waterborne Coating Systems on Mild Steel Dried under Atmospheric Conditions and by Infrared Radiation. Materials 2022, 15, 8001. [Google Scholar] [CrossRef] [PubMed]
- Reizer, R.; Pawlus, P. 3D Surface Topography of Cylinder Liner Forecasting during Plateau Honing Process. J. Phys. Conf. Ser. 2011, 311, 012021. [Google Scholar] [CrossRef]
- Jansons, E.; Lungevics, J.; Kanders, U.; Leitans, A.; Civcisa, G.; Linins, O.; Kundzins, K.; Boiko, I. Tribological and Mechanical Properties of the Nanostructured Superlattice Coatings with Respect to Surface Texture. Lubricants 2022, 10, 285. [Google Scholar] [CrossRef]
- Prajapati, D.K.; Tiwari, M. Assessment of Topography Parameters During Running-In and Subsequent Rolling Contact Fatigue Tests. J. Tribol. 2019, 141, 051401. [Google Scholar] [CrossRef]
- Razumić, A.; Turkalj, L.; Novak, A.H.; Stojanović, I.; Runje, B. Influence of the Mild Steel Coating Application Process, Drying Method and Pigment on the Surface Topography. Mater. Test. 2022, 64, 1773–1781. [Google Scholar] [CrossRef]
- 3D S Hybrid Parameters—Michigan Metrology. Available online: https://www.michmet.com/3d_s_hybrid_parameters.htm (accessed on 30 May 2022).
- Berglund, J.; Brown, C.A.; Rosén, B.-G.; Bay, N. Milled Die Steel Surface Roughness Correlation with Steel Sheet Friction. CIRP Ann. 2010, 59, 577–580. [Google Scholar] [CrossRef]
- Dzierwa, A.; Pawlus, P.; Zelasko, W. The Influence of Disc Surface Topography after Vapor Blasting on Wear of Sliding Pairs under Dry Sliding Conditions. Coatings 2020, 10, 102. [Google Scholar] [CrossRef]
- 3D Functional Parameters—Michigan Metrology. Available online: https://www.michmet.com/3d_s_functional_parameters.htm (accessed on 30 May 2022).
- Dzierwa, A.; Reizer, R.; Pawlus, P.; Grabon, W. Variability of Areal Surface Topography Parameters Due to the Change in Surface Orientation to Measurement Direction. Scanning 2014, 36, 170–183. [Google Scholar] [CrossRef]
- Shao, Y.; Yin, Y.; Du, S.; Xia, T.; Xi, L. Leakage Monitoring in Static Sealing Interface Based on Three Dimensional Surface Topography Indicator. J. Manuf. Sci. Eng. 2018, 140, 101003. [Google Scholar] [CrossRef]
- Qi, Q.; Liu, X.; Jiang, X. Functions and Three Dimensional Parameters of Surface Texture. In Proceedings of the Fifth International Symposium on Instrumentation Science and Technology, Shenyang, China, 15–18 September 2008; SPIE: Bellingham, WA, USA, 2009; Volume 7133, pp. 32–38. [Google Scholar]
- Bourebia, M.; Meddah, S.; Samia, L.; Achouri, S.; Oulabbas, A.; Laouar, L. Study of the Influence of Volume Parameters on the Paint Coating Adhesion. In Recent Advances in Environmental Science from the Euro-Mediterranean and Surrounding Regions, 4th ed.; Advances in Science, Technology & Innovation; Springer Nature: Cham, Switzerland, 2024; pp. 61–65. ISBN 978-3-031-51903-1. [Google Scholar]
- Shi, R.; Wang, B.; Yan, Z.; Wang, Z.; Dong, L. Effect of Surface Topography Parameters on Friction and Wear of Random Rough Surface. Materials 2019, 12, 2762. [Google Scholar] [CrossRef]
- Michigan Metrology—Surface Texture Parameters List by Name. Available online: https://www.michmet.com/texture_parameters_index_by_name.html (accessed on 30 May 2022).
- 3D Spatial Parameters—Michigan Metrology. Available online: https://www.michmet.com/3d_s_spatial_parameters.htm (accessed on 30 May 2022).
- Waikar, R.A.; Guo, Y.B. A Comprehensive Characterization of 3D Surface Topography Induced by Hard Turning versus Grinding. J. Mater. Process. Technol. 2008, 197, 189–199. [Google Scholar] [CrossRef]
- Keran, Z.; Stojanović, I.; Horvatić Novak, A.; Runje, B.; Razumić, A.; Vidović, D. Corrosion Resistance of Open Die Forged Austenitic Stainless Steel Samples Prepared with Different Surfaces. Sustainability 2021, 13, 5871. [Google Scholar] [CrossRef]
- ISO 25178-700; Geometrical Product Specifications (GPS)—Surface Texture: Areal—Part 700: Calibration, Adjustment and Verification of Areal Topography Measuring Instruments. ISO: Geneva, Switzerland, 2022.
- Joint Committee for Guides in Metrology. International Vocabulary of Metrology, 3rd ed.; JCGM: Sèvres, France, 2008. [Google Scholar]
- JCGM 100:2008; Evaluation of Measurement Data—Guide to the Expression of Uncertainty in Measurement. JCGM: Sèvres, France, 2008.
- AIAG. Measurement Systems Analysis: Reference Manual, 4th ed.; AIAG: Southfield, MI, USA, 2010. [Google Scholar]
- Razumić, A. Procjena Mjerne Nesigurnosti Rezultata Mjerenja na Području Mikroskopije Atomskih sila u Dimenzijskom Nanomjeriteljstvu. Ph.D. Thesis, Faculty of Mechanical Engineering and Naval Architecture, University of Zagreb, Zagreb, Croatia, 2024. [Google Scholar]


| Symbol | Parameter Name | Category | Description | Formula | Typical Application |
|---|---|---|---|---|---|
| Sa | Average Roughness | Height | Arithmetic mean of absolute deviations from the mean plane. | Machined surfaces, general surface assessment | |
| Sq | Root Mean Square Roughness | Height | Root mean square of surface deviations; sensitive to outliers. | Optical surfaces, additive manufacturing | |
| Ssk | Skewness | Height | Indicates asymmetry of surface profile; distinguishes pits vs. peaks. | Wear monitoring, honing, porosity analysis | |
| Sku | Kurtosis | Height | Measures sharpness of peaks and valleys. | Defect detection, surface quality control | |
| Sp | Maximum Peak Height | Height | Height of the highest peak. | Sp = max(z(x,y)) | Coatings, surface anomalies |
| Sv | Maximum Valley Depth | Height | Depth of the deepest valley. | Sv = min(z(x,y)) | Lubrication systems, sealing |
| Sz | Maximum Height of Surface | Height | Total vertical range of the surface. | Surface anomalies, roughness extremes | |
| Sal | Autocorrelation Length | Spatial | Measures texture feature spacing. | Tribology, friction, wear, optics | |
| Str | Texture Aspect Ratio | Spatial | Describes surface texture isotropy. | Tool wear, directional texture analysis | |
| Sdq | Root Mean Square Surface Slope | Hybrid | Average slope of the surface texture. | Sealing, appearance, coatings | |
| Sdr | Developed Interfacial Area Ratio | Hybrid | Increased surface area due to roughness. | Adhesion, coatings, complexity | |
| Sds | Summit Density | Hybrid | Number of summits per unit area. | Defined as count of summits per area | Contact mechanics, material interactions |
| Ssc | Mean Summit Curvature | Hybrid | Average curvature of surface summits. | Statistical curvature average | Mechanical contact analysis |
| Sdc(mr) | Inverse Areal Material Ratio | Functional | Height corresponding to a specific material ratio. | Defined by material ratio function | Bearing surface estimation |
| Sk | Core Roughness Depth | Functional | Height of core material zone. | Defined from material ratio curve | Wear resistance, plateau honing |
| Smr(c) | Areal Material Ratio | Functional | Material ratio at a given height. | From Abbott-Firestone curve | Cylinder bore, sealing analysis |
| Spk | Reduced Peak Height | Functional | Height of peaks above core zone. | From material ratio curve | Wear and tribological analysis |
| Svk | Reduced Valley Depth | Functional | Depth of valleys below core zone. | From material ratio curve | Lubricant retention, surface wear |
| Sxp(p,q) | Peak Extreme Height | Functional | Height of extreme peaks within defined percentiles. | Height between q% and p% | Critical peak identification |
| Vm(mr) | Material Volume | Functional | Volume of material above a height level. | Integral of material ratio above mr | Bearing surface, wear analysis |
| Vmc(p,q) | Core Material Volume | Functional | Volume of core material between p and q levels. | Difference in volumes at p% and q% | Load-bearing capacity |
| Vmp(p) | Peak Material Volume | Functional | Volume of material in peak zone above p%. | Volume from p% to top | Surface coating, sealing |
| Vv(mr) | Void Volume | Functional | Volume of voids below a height level. | Integral of void volume below mr | Fluid retention, surface roughness |
| Vvc(p,q) | Core Void Volume | Functional | Void volume between p and q material ratios. | Vvc = Vv(p) − Vv(q) | Residual volume after wear |
| Vvv(p) | Dale Void Volume | Functional | Void volume in deepest part of surface. | Volume from p% to valley base | Debris entrapment, lubrication |
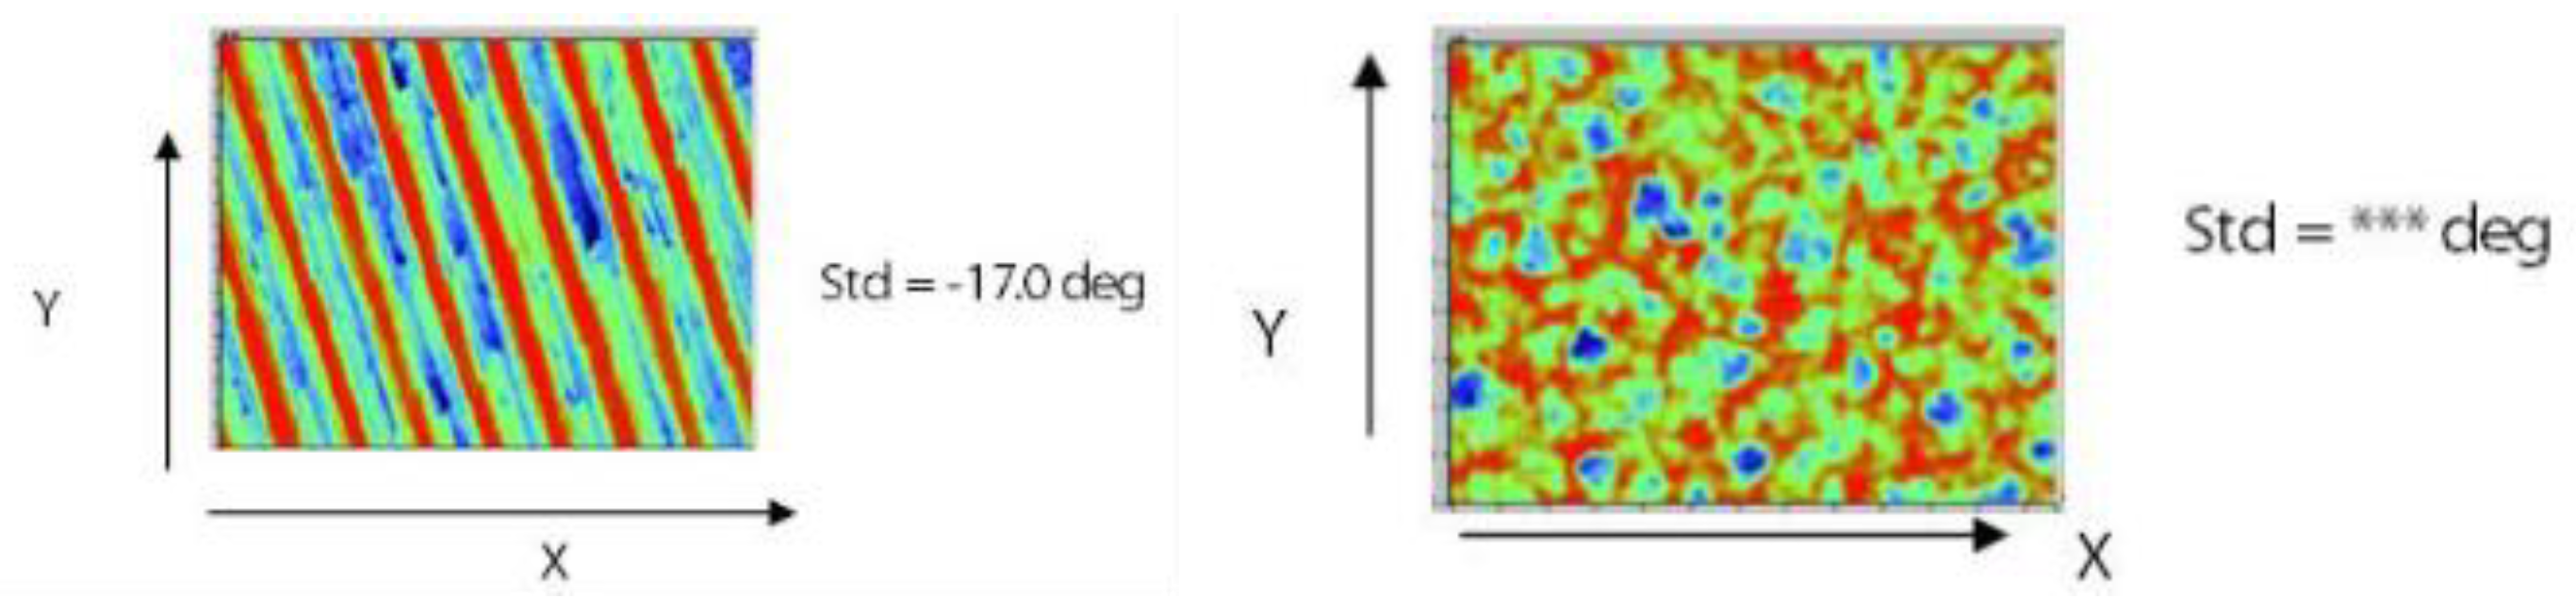
| Std | Texture Direction | Miscellaneous | Angular direction of surface texture. | Angle from y-axis | Sealing, directional surface analysis |
| Certificate of Calibration | Lab A | |
|---|---|---|
| /nm | 97.6 | 98.9 |
| u/nm | 0.7 | 1.45 |
| Lab A | Lab B | Lab C | Lab D | |
|---|---|---|---|---|
| /nm | 98.9 | 101.3 | 100.2 | 100.8 |
| u(h)/nm | 1.45 | 2.55 | 1.75 | 2.80 |
| En(h) | 0.40 | 0.70 | 0.69 | 0.55 |
| Sa/nm | 15.60 | 29.68 | 25.45 | 16.76 |
| En(Sa) | 3.32 | 4.14 | 1.89 | 2.71 |
| Sz/nm | 116.9 | 122.8 | 117.8 | 122.1 |
| En(Sz) | 0.98 | 0.95 | 0.69 | 0.73 |
| Parameter | Value/Range |
|---|---|
| Step pitch | (2.98–3.12) µm |
| Step width | (0.25–0.35) µm |
| Surface rotation | up to 10° |
| Surface slope | linear increase in the y-direction |
| Lateral noise | ±1 to ±100 nm |
| Step height | fixed at 97.6 nm |
| Sampling area | random sampling over a 20 µm × 20 µm area |
| Vertical noise (z-axis) | ±3 nm (to mimic measurement uncertainty) |
| Base profile | rectangular, 3.0 µm pitch, 0.3 µm step width |
| Step Pitch (µm) | Step Width (µm) | Simulated Sa (nm) | Simulated Sq (nm) | Simulated Sz (nm) | Simulated Sdq (–) | Simulated Sdr (%) |
|---|---|---|---|---|---|---|
| 2.98 | 0.25 | 15.65 | 27.67 | 100.44 | 0.22 | 2.12 |
| 3.02 | 0.28 | 17.18 | 28.96 | 100.39 | 0.21 | 2.11 |
| 3.08 | 0.30 | 18.41 | 29.98 | 100.40 | 0.20 | 1.82 |
| 3.12 | 0.35 | 21.92 | 32.71 | 100.49 | 0.20 | 1.82 |
| 2.98 | 0.35 | 21.06 | 32.09 | 100.99 | 0.24 | 2.09 |
| 3.12 | 0.25 | 15.68 | 27.67 | 101.35 | 0.22 | 2.14 |
| Sa (nm) | Sq (nm) | Sz (nm) | Sdq | Sdr (%) | |
|---|---|---|---|---|---|
| 15.60 | 28.72 | 117.02 | 0.17 | 1.76 | |
| Measurement uncertainty U; k = 2; p = 95% | 4.5 | 4.5 | 7 | 0.4 | 0.6 |
Disclaimer/Publisher’s Note: The statements, opinions and data contained in all publications are solely those of the individual author(s) and contributor(s) and not of MDPI and/or the editor(s). MDPI and/or the editor(s) disclaim responsibility for any injury to people or property resulting from any ideas, methods, instructions or products referred to in the content. |
© 2025 by the authors. Licensee MDPI, Basel, Switzerland. This article is an open access article distributed under the terms and conditions of the Creative Commons Attribution (CC BY) license (https://creativecommons.org/licenses/by/4.0/).
Share and Cite
Alar, V.; Razumić, A.; Runje, B.; Stojanović, I.; Kurtela, M.; Štrbac, B. Application of Areal Topography Parameters in Surface Characterization. Appl. Sci. 2025, 15, 6573. https://doi.org/10.3390/app15126573
Alar V, Razumić A, Runje B, Stojanović I, Kurtela M, Štrbac B. Application of Areal Topography Parameters in Surface Characterization. Applied Sciences. 2025; 15(12):6573. https://doi.org/10.3390/app15126573
Chicago/Turabian StyleAlar, Vesna, Andrej Razumić, Biserka Runje, Ivan Stojanović, Marin Kurtela, and Branko Štrbac. 2025. "Application of Areal Topography Parameters in Surface Characterization" Applied Sciences 15, no. 12: 6573. https://doi.org/10.3390/app15126573
APA StyleAlar, V., Razumić, A., Runje, B., Stojanović, I., Kurtela, M., & Štrbac, B. (2025). Application of Areal Topography Parameters in Surface Characterization. Applied Sciences, 15(12), 6573. https://doi.org/10.3390/app15126573