Article

Predictive Models for Single-Droplet Ignition in Static High-Temperature Air in Different Gravity Environments

1
Fluid Machinery Engineering Technology Research Center, Jiangsu University, Zhenjiang 212013, China
2
Institute of Engineering Thermophysics, Chinese Academy of Sciences, Beijing 100190, China
3
National Key Laboratory of Science and Technology on Advanced Light-Duty Gas-Turbine, Beijing 100190, China
*
Author to whom correspondence should be addressed.
Appl. Sci. 2025, 15(12), 6558; https://doi.org/10.3390/app15126558
Submission received: 18 April 2025 / Revised: 23 May 2025 / Accepted: 9 June 2025 / Published: 11 June 2025

Abstract

:
To address the design and optimization of the ignition system for the microgravity single-droplet combustion experiment module within the Combustion Science Experimental System (CSES) aboard the Chinese Space Station (CSS), it is essential to first determine the ignition temperatures required for typical liquid fuel droplets. In this study, ignition experiments were conducted on droplets of three representative hydrocarbon fuels—ethanol, n-heptane, and n-dodecane—in static air at high temperatures ranging from 760 K to 1100 K. The experimental results show that the initial droplet diameter is inversely correlated with the ambient temperature at which ignition occurs. Subsequently, based on Frank-Kamenetskii’s analytical method and combined with experimental data, a semi-empirical predictive model for droplet ignition temperatures in a normal-gravity environment was derived. Building upon this, and considering the characteristics of the microgravity environment, an appropriate empirical formula was applied to refine the model, resulting in a predictive model for droplet ignition temperatures in the microgravity environment. Furthermore, by comparing the experimental data and the observed phenomena from existing microgravity experiments, this semi-empirical predictive model used in the microgravity environment effectively reflects the trend of droplet ignition temperature variations.

1. Introduction

The Combustion Science Experimental System (CSES) in the China Space Station serves as an experimental platform for research on fundamental combustion science in a microgravity environment. The CSES provides a comprehensive experimental platform capable of supporting combustion studies with gaseous, liquid, and solid fuels [1,2,3,4,5,6]; the structure is shown in Figure 1. Since its commissioning, multiple series of microgravity gaseous combustion experiments have been successfully conducted through this system, yielding significant experimental results that advance fundamental combustion theory.
According to the CSES construction plan, in the next stage, microgravity liquid combustion experimental modules will be designed and developed based on the structural framework of the existing gaseous combustion experimental modules. Three experimental modules capable of performing single-droplet combustion, droplet array combustion, and droplet atomization combustion functions, respectively, will be designed and installed into the combustion chamber on the CSES through an interchangeable modular framework.
The gaseous combustion experimental module employs a 10 W heating wire as the igniter, as shown in Figure 2. However, experimental observations revealed that this igniter struggles to achieve stable ignition for liquid fuels with slow vaporization rates, such as n-dodecane. Understanding ignition limits helps in the design of combustion systems with reliable and controllable igniters [7]. Therefore, prior to optimizing the ignition scheme, it is essential to analyze the ignition characteristics of single fuel droplets, establish a single-droplet ignition model, determine the required ignition temperature range for combustion experiments, and provide theoretical guidance for the design and optimization of ignition solutions in the single-droplet combustion experimental module.
The classical theory of single-droplet combustion is the D 2 law [8], which states that the square of the droplet diameter changes proportionally to time during the combustion process. However, compared to studies on the combustion characteristics of single droplets, there is relatively limited research on droplet ignition processes and the criteria for determining ignition. Based on the assumptions of quasi-steady-state and single-step overall chemistry, Chiu [9] developed the droplet group combustion theory and derived a dimensionless number that can predict the combustion modes of droplet groups: individual droplet combustion, internal group combustion, external group combustion, and enveloping combustion. However, this droplet group combustion theory, based on the quasi-steady-state assumption, was later found to be incapable of accurately predicting the transient ignition behavior of droplets. The classical Frank-Kamenetskii method analyzed the ignition conditions of homogeneous gas mixtures [10]. Zhuang and Zhou conducted an experimental investigation into the ignition of Unsymmetrical Dimethylhydrazine (UDMH) liquid droplets, proposing both steady-state analysis theory and steady-state simplified model theory [11]. The researchers proposed the correlation between the ignition characteristics of droplets and parameters such as temperature, pressure, boundary layer thickness, and droplet radius, predicting that the droplet autoignition temperature exhibits a negative correlation with droplet radius. However, studies on droplet ignition behavior in microgravity environments remain limited and predominantly qualitative. Although foundational research has explored aspects such as droplet evaporation and combustion in microgravity, comprehensive quantitative analyses of transient ignition phenomena are scarce [12,13,14,15,16]. This necessitates further experimental and theoretical investigations.
In both normal-gravity and microgravity liquid combustion studies, ethanol, n-heptane, and n-dodecane are commonly used as research subjects. Ethanol is one of the most prevalent fuels and organic solvents in daily life and industry. Extensive investigations have been conducted on the combustion characteristics of n-heptane and n-dodecane under microgravity [17,18,19,20,21]. Furthermore, n-dodecane is frequently employed as a representative surrogate fuel for diesel due to its physical properties closely resembling those of real diesel fuels [22]. In this study, ignition experiments were conducted on droplets of these three typical hydrocarbon fuels to investigate the influence of droplet size on their ignition characteristics. Subsequently, based on the classical Frank-Kamenetskii analysis method, a functional relationship between the ignition temperature and droplet diameter was established. Finally, through validation against experimental data, two predictive models for droplet ignition temperature in normal-gravity and microgravity environments were developed.

2. Experimental Equipment Setup

Single-droplet combustion is a type of diffusion combustion. The liquid fuel volatilizes into vapor and subsequently mixes with the surrounding air, constituting a pre-vaporized combustion mode [10]. Due to the constant temperature difference between the exposed heating wire and the surrounding air, natural convection driven by the temperature difference persists around the heating wire. This phenomenon not only significantly disturbs the temperature field in the vicinity of the heating wire, but also influences the distribution of the vapor mixture surrounding the droplet. In the microgravity environment, the buoyant lift caused by gravity is greatly reduced in fluids, resulting in convective effects being reduced to a negligible level [1,2,3,4]. Consequently, it is necessary to establish a uniform-temperature static-air environment prior to conducting ignition experiments. The diagram of the facility is shown in Figure 3.
The heating vessel was constructed from a high-borosilicate quartz glass cylinder with high temperature endurance, externally wrapped with a heat-resistant insulating material, as shown in Figure 4a. The heating device consists of two segments with a 0.5 mm diameter heating wire capable of reaching a maximum temperature of 1354 K. The heating wires were placed at the top and bottom of the heating vessel and connected in parallel to the temperature control module, which consists of three parts: a PID-based control panel, a solid-state relay, and a 400 W power supply, as shown in Figure 4b.
After entering the set temperature on the control panel, the actual temperature detected by the K-type thermocouple inside the vessel was compared with the set value, and the solid-state relay dynamically regulated the power output to realize automatic temperature control. The thermocouple was aligned coaxially with a vertical support fiber at a 20 mm separation distance, as shown in Figure 5. This distance ensures that the thermocouple junction does not influence the droplet ignition process through heat conduction and allows for the accurate measurement of the ambient temperature during droplet ignition. A viewing window is reserved to allow for the recording of the ignition process by a camera. The right endcap is equipped with a small orifice to enable the fiber with the droplet to enter the vessel interior. The droplet is suspended on a nichrome wire with a diameter of 0.2 mm. In a relatively static environment, heat conduction between the droplet and the nichrome wire can have a certain impact. However, studies have shown that as the ambient temperature increases, the influence of the support fiber on the experimental results diminishes [23]. Specifically, under high-temperature conditions exceeding 1000 K, the effect of the support fiber on the experimental outcomes becomes negligible. In the literature [24], it was found that the difference in droplet lifetime is no more than 2% when the diameters of the thermocouple and the support fiber are both 0.21 mm. In this study, a 0.2 mm diameter nichrome wire was employed to suspend the droplet, with experimental temperatures ranging from 750 K to 1250 K. Considering the findings from references [23,24], the influence of the supporting fiber on the experimental results is deemed negligible. The high-speed camera is equipped with an infrared cut-off filter (IR-cut filter) on its photosensitive element that can minimize the impact of thermal radiation.

3. Experimental Process and Results

Prior to conducting the droplet ignition experiments, the internal temperature of the heating vessel was set to 1073 K. The temperatures at five points on three cross-sectional planes within the heating vessel were measured using thermocouples through the small orifice; the measurement points are shown in Figure 6, with the measurement results presented in Table 1. The maximum temperature difference was less than 10% of the set temperature, and the uncertainty at a 95% confidence level is ± 24.7   K , indicating that the temperature field within the heating vessel could be considered uniform with weak air convection, thereby satisfying an experimental condition for high-temperature static air.
The temperature inside the heating vessel was set at the start of the experiment. After the temperature had stabilized, the fuel droplet was suspended on the fiber and subsequently introduced into the heating vessel at a constant speed via the sliding guide. Simultaneously, the high-speed camera began to record the combustion evolution of the droplet throughout the reaction process at a 5000 frame rate. If droplet ignition occurred, the fuel loading volume in subsequent experiments was reduced until ignition could not be achieved. Observed results of the droplet ignition process are shown in Figure 7.
To minimize the influence of the fiber’s insertion on the internal flow field of the vessel and to ensure that premature ignition did not occur before the droplet reached the camera’s observation position, following repeated tuning and experimentation, we set the movement speed of the support fiber to a constant 20 mm/s. The high-speed camera recordings indicated that, before reaching the observation position and undergoing ignition, the droplet has sufficient time to resume stable evaporation, and the droplet exhibits minimal oscillation and deformation, which can be considered negligible. Therefore, it is considered that both the droplet and the surrounding flow field are in a relatively stable state at the moment of ignition.
Under the combined influence of gravity and surface tension, the droplet assumes an ellipsoidal shape in the normal-gravity environment. However, in the microgravity environment, the droplet assumes a standard spherical shape. Therefore, to facilitate the modeling of droplet ignition in microgravity, the standard spherical diameter of the droplets was used as the measured parameter in this study. The spherical diameter is determined by calculating the volume equivalence between the actual ellipsoidal droplet and its standard spherical shape. Given the major axis diameter d a   and minor axis diameter d b   of the ellipsoid, the equivalent diameter d 0 of the standard spherical droplet is derived as follows:
d 0 = d a 1   3     d b 2   3  
The major and minor axis diameters of the actual droplets can be calculated using the images before ignition. By measuring the actual diameter of the fiber and its imaged width, a scale can be established, as shown in Figure 8. Subsequently, through image analysis, the transverse and longitudinal dimensions of the droplet can be measured, enabling the calculation of the actual diameter of the major and minor axes.
To ensure measurement accuracy, three clear images before ignition were selected for each experimental group. The major and minor axis diameters were calculated for each image and then averaged. To verify the accuracy of the calculations, fuel droplets of different sizes were quantitatively generated using a micropipette. Then, the droplet sizes were calculated from the images. The results calculated from the images were compared with the readings from the micropipette, as quantitatively demonstrated in Table 2. By comparison, it was found that the error in droplet size calculated from the images was no greater than 5%, indicating that this method can be regarded as accurate.
The droplet undergoes a preheating process before ignition. Kuznetsov et al. [25] conducted a study focusing on droplets with a diameter of 1.68 mm. They discovered that the time required for the internal temperature field of a droplet to reach a uniform maximum temperature increases exponentially with rising ambient temperature. At ambient temperatures above 650 K, the average heating rate of the droplets is relatively high, resulting in a significantly shorter time to reach the maximum internal temperature compared to the ignition delay times observed in this study. Therefore, it is considered that the droplet has reached a fully heated state prior to the ignition occurring within the vapor layer.
The minimum ignition equivalent diameter   d 0   of anhydrous ethanol, n-heptane, and n-dodecane across different temperatures is systematically presented in Appendix A. Due to the large number of experimental measurements, to more intuitively illustrate the ignition boundary of the droplet, some duplicate and highly dispersed data were removed from the table. Finally, the equivalent diameter   d 0   of droplets versus ignition temperature   T   was plotted in a scatter plot, as shown in Figure 9.
The scatter plots of the three fuels clearly demonstrate a negative correlation between the equivalent diameter   d 0   and ignition temperature   T   of the droplets. Specifically, larger droplet diameters correspond to lower ignition temperatures, while smaller droplets require higher temperatures to achieve ignition. Zhou [10] concluded that this phenomenon originates from the pre-vaporized diffusion combustion mechanism, where fuel vapor from the droplet surface mixes with ambient air to establish a combustible mixture. In the brief moment just before ignition, the droplet is in a state of evaporation, the concentration of fuel vapor decreases with increasing distance from the droplet surface, and the temperature distribution increases with distance from the droplet surface, approaching the ambient temperature. Zhou performed numerical integration based on the energy and diffusion equations derived by previous scholars [10], and summarized the characteristic curves of fuel concentration   Y f , oxygen concentration   Y o x , and temperature   T f variations with radial distance within the gas-phase region surrounding the fuel droplet in the evaporation regime.
As is evident from Figure 10, if the ambient temperature at a certain interface reaches the ignition point under the local fuel vapor concentration, droplet ignition occurs. As the droplet size further decreases, the droplet may completely evaporate before ignition occurs [26]. This results in the fuel vapor concentration no longer increasing, thereby preventing ignition.
Due to differences in the volatilities of the three fuels, their evaporation rates vary under identical surface area and temperature conditions. The evaporation rate of fuels is positively correlated with their equilibrium vapor pressures [27]. The equilibrium vapor pressures of the three fuels are presented in Table 3. It can be seen that, under the same conditions, ethanol has the highest evaporation rate, while n-dodecane has the lowest. Therefore, under the same conditions, ethanol has a lower ignition temperature, while n-dodecane has a higher ignition temperature. This is consistent with the scatter plot of the experimental results for the three fuels presented in this paper.

4. Single-Droplet Ignition Prediction Models

Existing research primarily focuses on the combustion processes of droplets, with scholars paying particular attention to burning rates, micro-explosion phenomena during combustion, and the analysis of combustion products. In contrast, research on droplet ignition has predominantly focused on factors such as fuel vapor and oxygen concentrations, as well as chemical reaction kinetics, to derive analytical expressions for ignition conditions [29,30,31,32,33]. Since these parameters are difficult to measure under actual conditions, their application in engineering fields is relatively difficult. This study extends existing droplet ignition analysis methods to derive ignition models for droplets in both normal-gravity and microgravity environments.

4.1. Droplet Ignition Prediction Model Under Normal Gravity

First, it is assumed that the droplet is stationary relative to the environment, and after vaporization, the fuel molecules only undergo spherically symmetric radial one-dimensional flow caused by the Stefan flow, with the heat radiation and thermal dissociation reactions of the fuel being neglected. In the short time before ignition, the droplet remains in a pure evaporation state, with the fuel vapor diffusing outward from the droplet surface, while the air diffuses inward toward the droplet surface. When the droplet ignites, the reaction is most intense in a thin layer close to the hot boundary, and the temperature gradient at the outer boundary of this layer is zero. Based on the experience of solving ignition problems [10], the order of magnitude of the parameter changes in the reaction zone thin layer at ignition is approximately R T / E , where R is the gas constant, T is the ambient temperature inside the heating vessel, E is the activation energy of the fuel, parameters with an asterisk ‘ ’ denote values at the reactive zone’s inner boundary, subscript ‘ w ’ indicates values at the droplet surface, and the subscript ‘ ’ represents ambient parameters. The boundary conditions for ignition can be approximated as follows.
In the reaction zone, the average concentration of fuel gas is
Y f Y f w R T E
The average concentration of oxygen is
Y o x Y o x ,
The boundary temperature of the reaction zone is
T * T R T E
Due to the extremely small actual scale of the thin layer, curvature variations can be neglected, and the convective effects caused by temperature changes are negligibly weak, allowing the convective terms in the equations to be ignored. Therefore, we have
d 2 T d r 2 w s λ Q s
In the equation, Q s represents the heat of combustion.
Integrating this equation results in
d T d r I = 2 Q s λ T * T w s d T 1   2  
The parameter ‘ w s ’ in the equation is calculated using the following expression:
w s = k o s ρ 2 Y f w Y o x , e E   R T  
In the equation, k o s represents the reaction kinetics parameter, and ρ denotes the environmental density.
Integrating Equation (6) yields
T * T w s d T 1 1 e R 2 T 3   E 2 k o s ρ 2 Y f w Y o x , e E   R T  
Introducing the analytical expression d T d r I I for droplet combustion, and assuming that the temperature gradient at the outer boundary of the reaction zone’s thin layer is approximately equal to that under pure evaporation without combustion, we have
d T d r I I = G c p T T w + q e 4 π r 1 2 λ
In Equation (9), G represents the total mass flux, c p is the specific heat capacity at constant pressure, q e denotes the latent heat of evaporation, λ is the thermal diffusivity, and   r 1 is the radius of the reaction zone’s thin layer after being converted to a film. The parameters G and   r 1 can be calculated using the following expressions:
G = 2 π λ c p N u * r w l n 1 + c p T T w q e
r 1 = r w N u * N u * 2  
Due to the temperature gradient in the atmospheric space near the droplet surface, slight natural convection occurs. The Nusselt number under natural convection conditions can be calculated using an empirical formula, and its expression is
N u * = 2 + 0.6 R a 0.5 P r 0.33
In this expression, R a denotes the Rayleigh number, representing the influence of buoyancy induced by the temperature gradient. It can be calculated using the following expressions:
R a = c p ρ g β T d w 3 λ  
In this equation, β represents the chemical equivalence ratio. Given the relatively low concentration magnitude of fuel vapor within the thin-film reaction zone, and considering that thermal condition T T w , for ease of application in engineering contexts, certain thermophysical parameters such as c p , ρ , and λ are approximated by the corresponding properties of air at the same temperature, as shown in Table 4. The parameters within temperature ranges are fitted using power functions, and interpolation is performed accordingly.
The ignition conditions for droplets given by Zhou are [10]
d T d r I = d T d r I I
By equating Equations (6) and (9), and substituting Equation (12) into them, the semi-empirical ignition condition for a single fuel droplet in the stationary air environment in normal-gravity conditions can be derived as follows:
d w = T T w + q e c p l n 1 + c p T T w q e 2 Q s λ k o s Y f w Y o x , 1 1 e 0.5 R ρ   E T 1.5 N u * 2 2 N u * e E   R T  
Due to the challenges in directly measuring parameters such as fuel vapor and oxygen concentrations within the reaction layer surrounding the droplet under practical conditions, and considering that determining the reaction kinetics parameters and latent heat of vaporization in Equation (15) involves complex calculations and measurement processes, alternative approaches are often employed. These include utilizing simplified models or indirect measurement techniques to estimate the necessary parameters [10,35].
To solve engineering problems, the complex components of Equation (15) are simplified in this study by employing a power model based on ambient temperature and summarizing it in the form of a semi-empirical formula.
A T n T T w + q e c p l n 1 + c p T T w q e 2 Q s λ k o s Y f w Y o x , 1 1 e 0.5 R ρ   E T 1.5
d w = A T n N u * 2 2 N u *   e E   2 R T  
The empirical constants A and n can be determined through experimental data. Regarding the selection of activation energy values for chemical reactions, some existing studies indicate that fuels exhibit negative temperature coefficient (NTC) behavior within certain temperature ranges [36]. This phenomenon arises from the complex mechanisms of fuel oxidation reactions and may be accompanied by cool-flame combustion [37]. However, the focus of this study is on the autoignition phenomena of fuel droplets. The flames observed in the experiments are not characteristic of cool flames. Therefore, based on the experimental data obtained in the high-temperature reaction regime [37,38,39], three activation energies for chemical reactions were determined, as shown in Table 5.
The relative sensitivity coefficient S E of d w   with respect to E is calculated by
S E = d w   E · E d w   = E 2 R T  
At T   = 800   K , the relative sensitivity coefficients for the three fuels are as shown in Table 6.
The above results indicate that, under the experimental conditions of this study, the minimum ignition diameter of the droplets is minimally influenced by the activation energy.
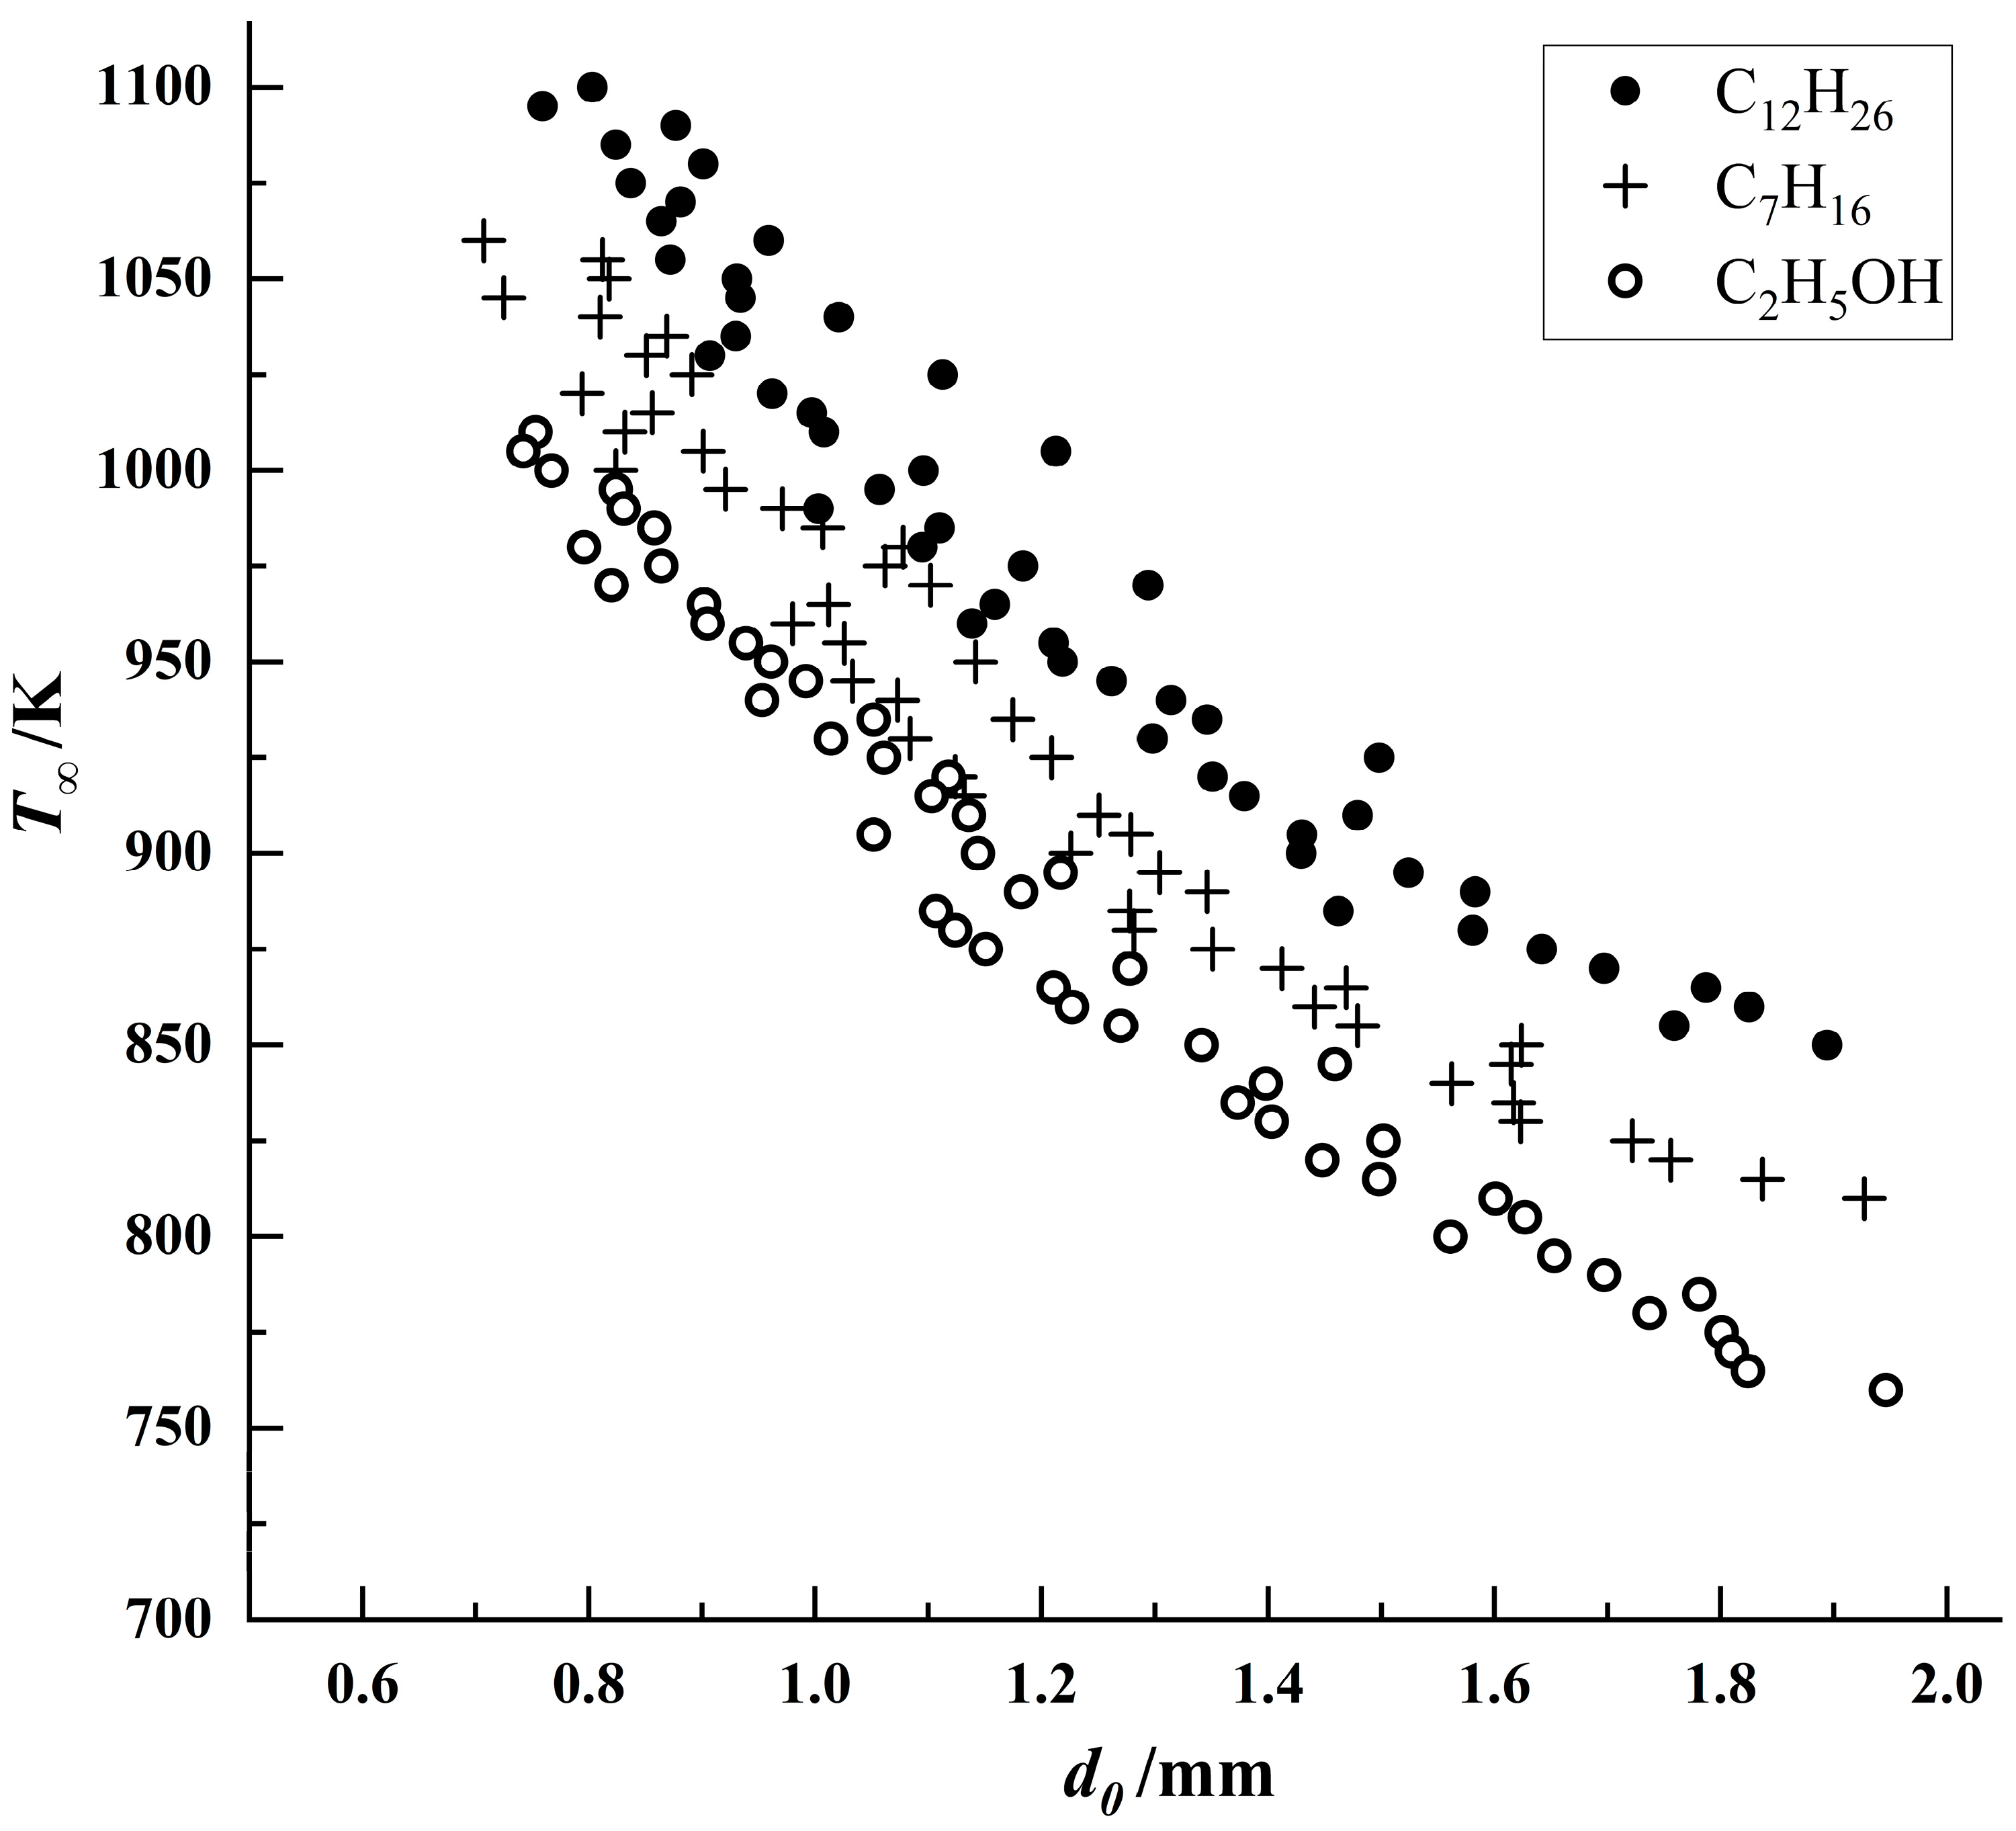
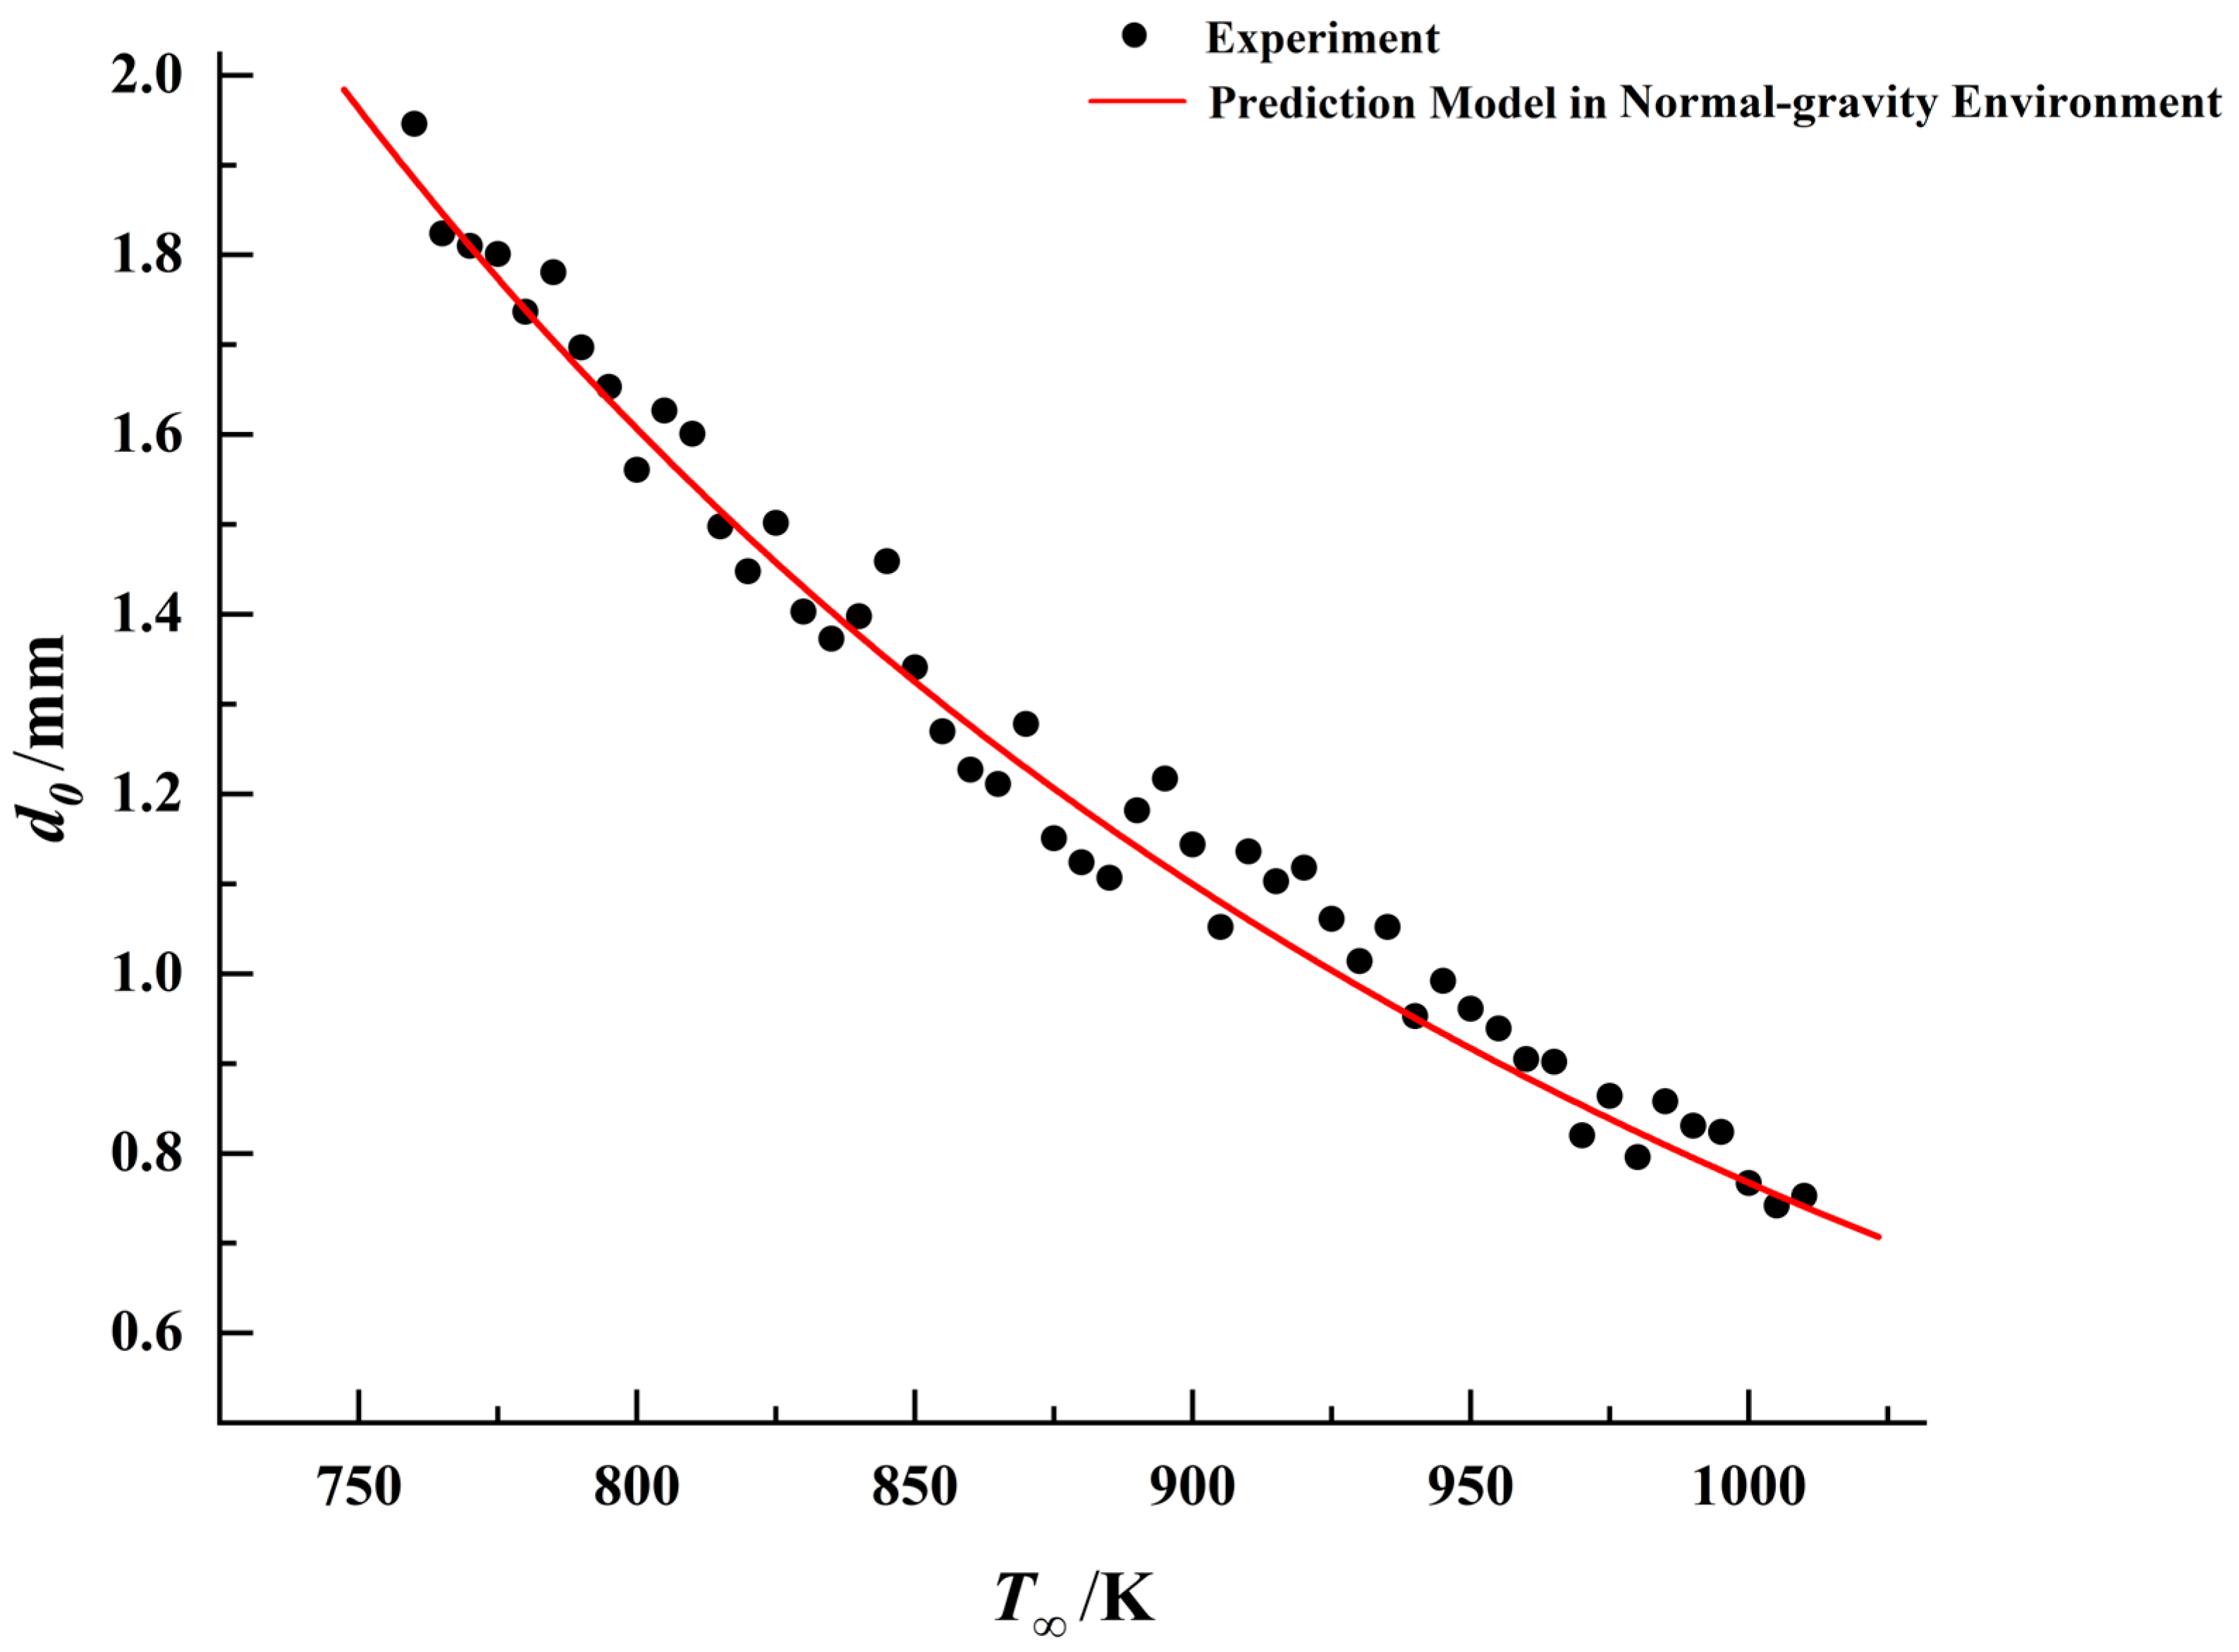
The aforementioned droplet ignition model was fitted against the experimental data for the three fuels, with the comparative results presented in Figure 11, Figure 12 and Figure 13.
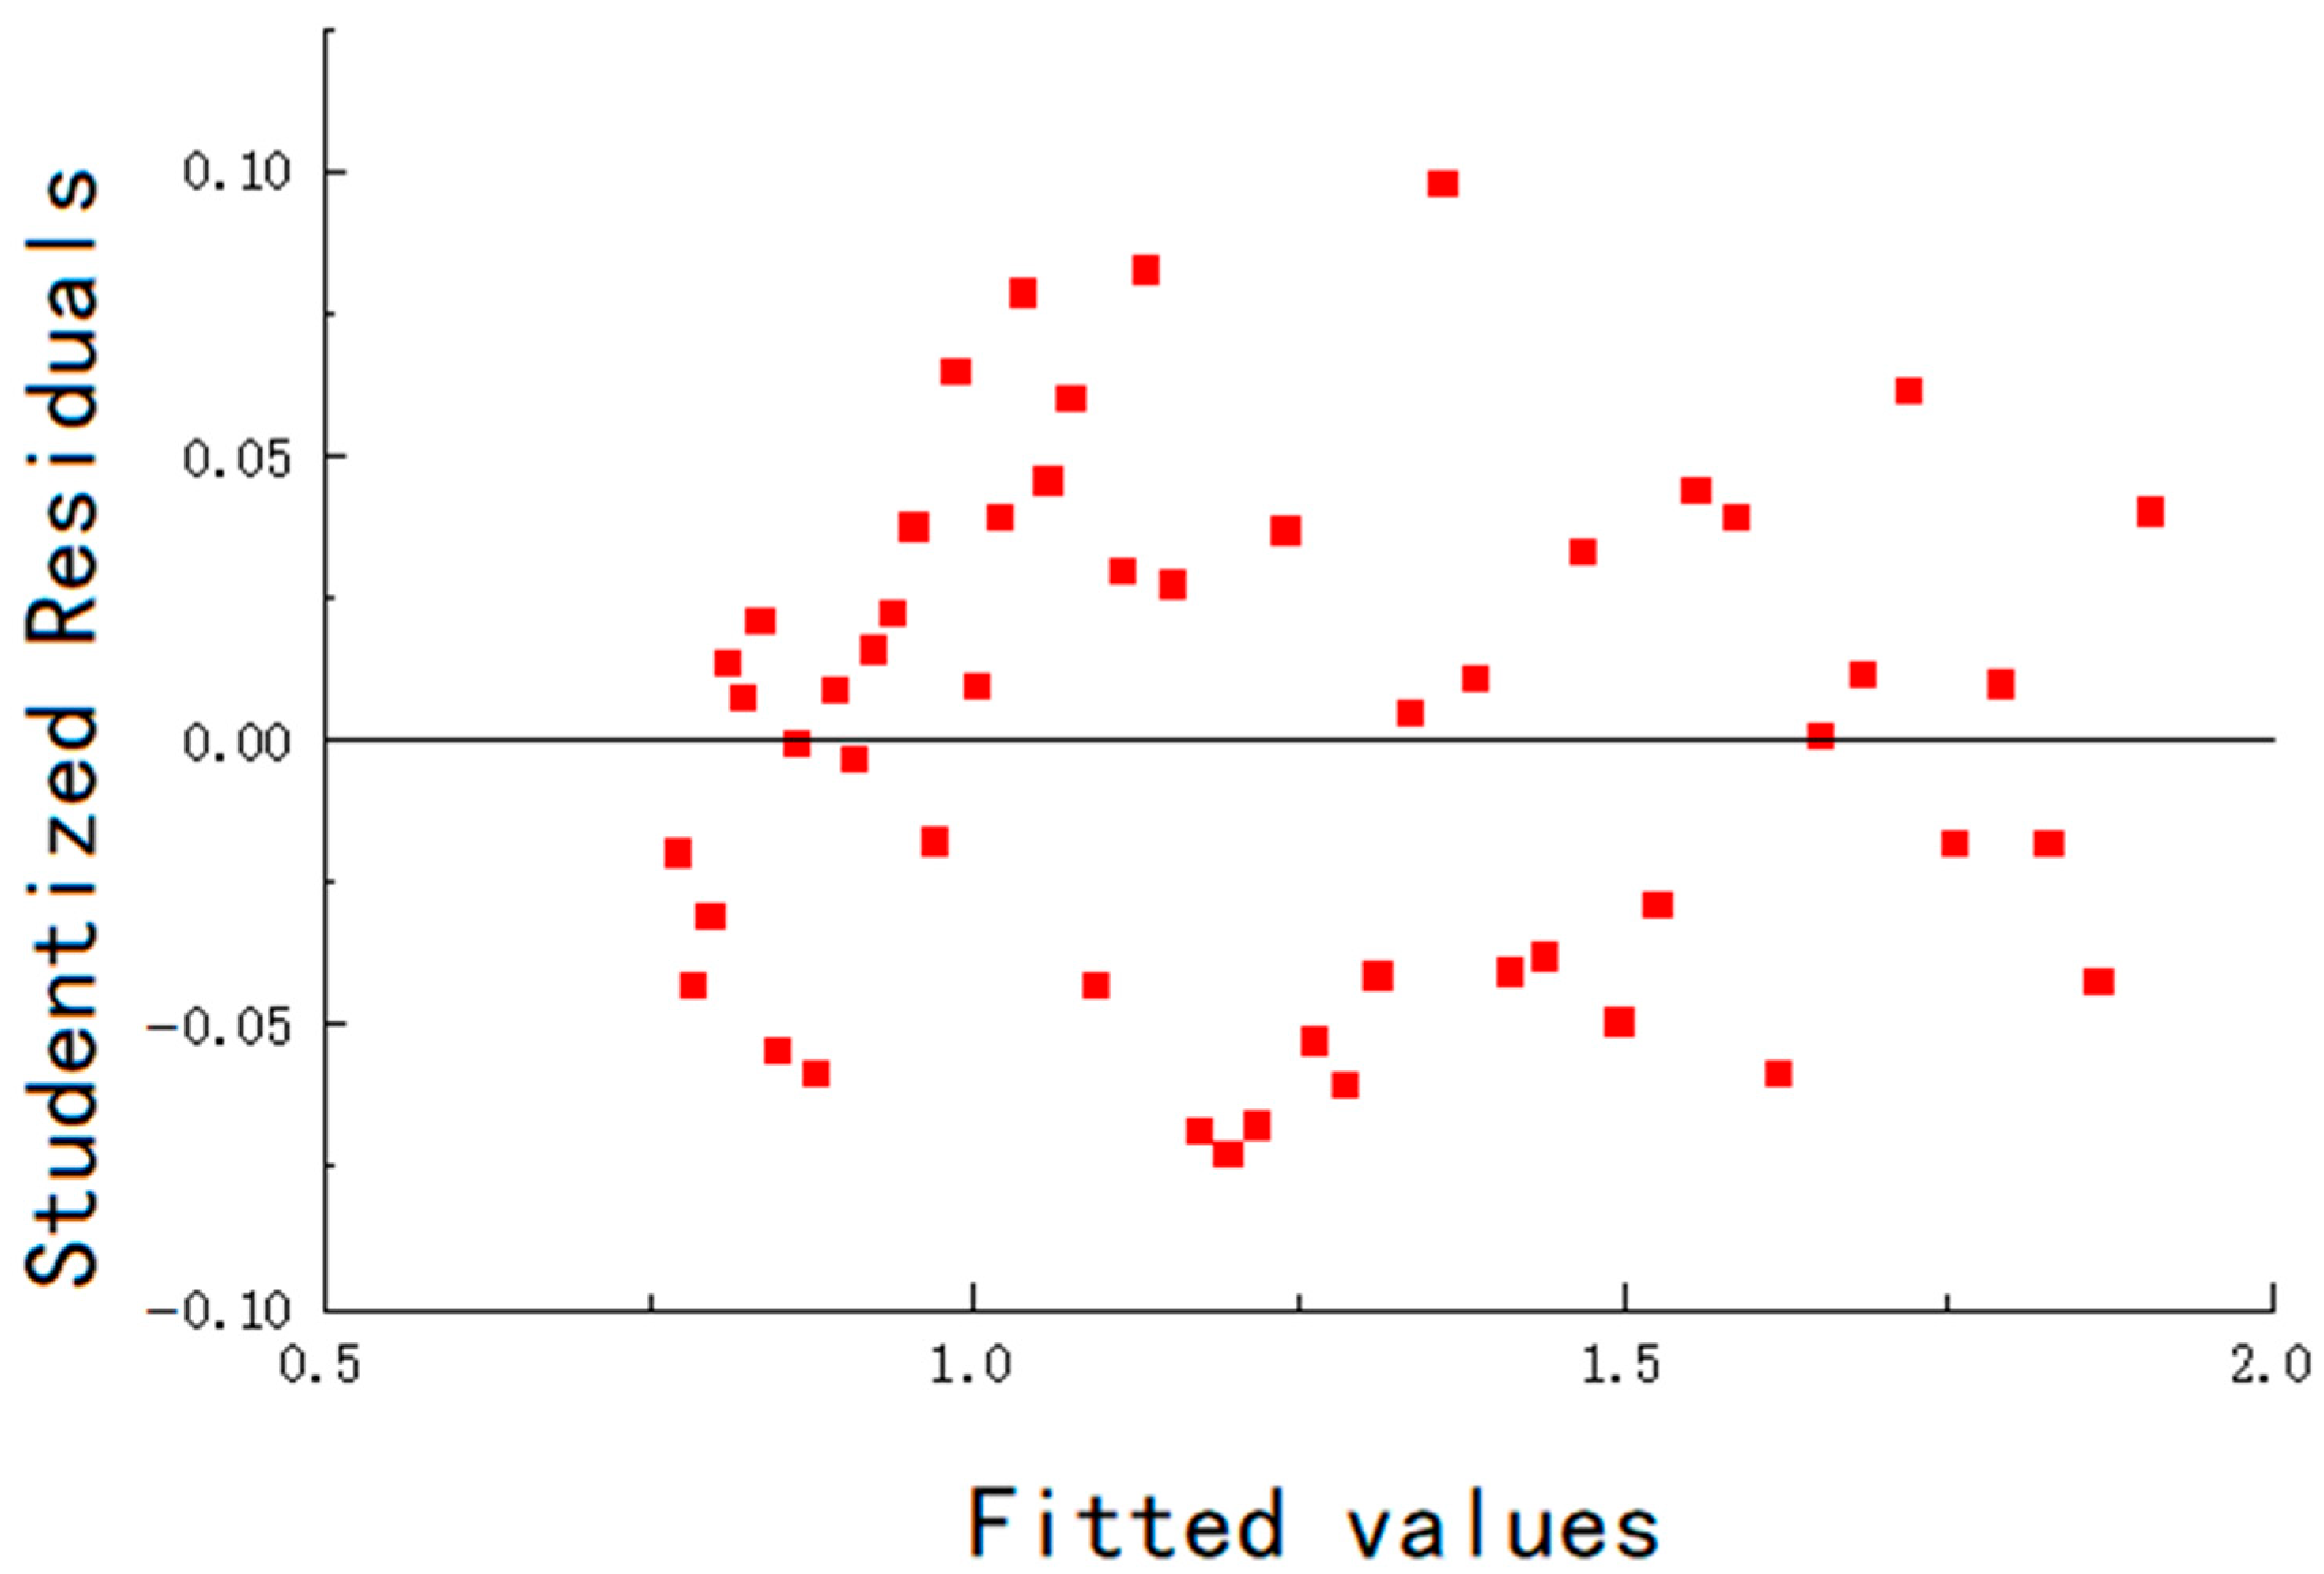
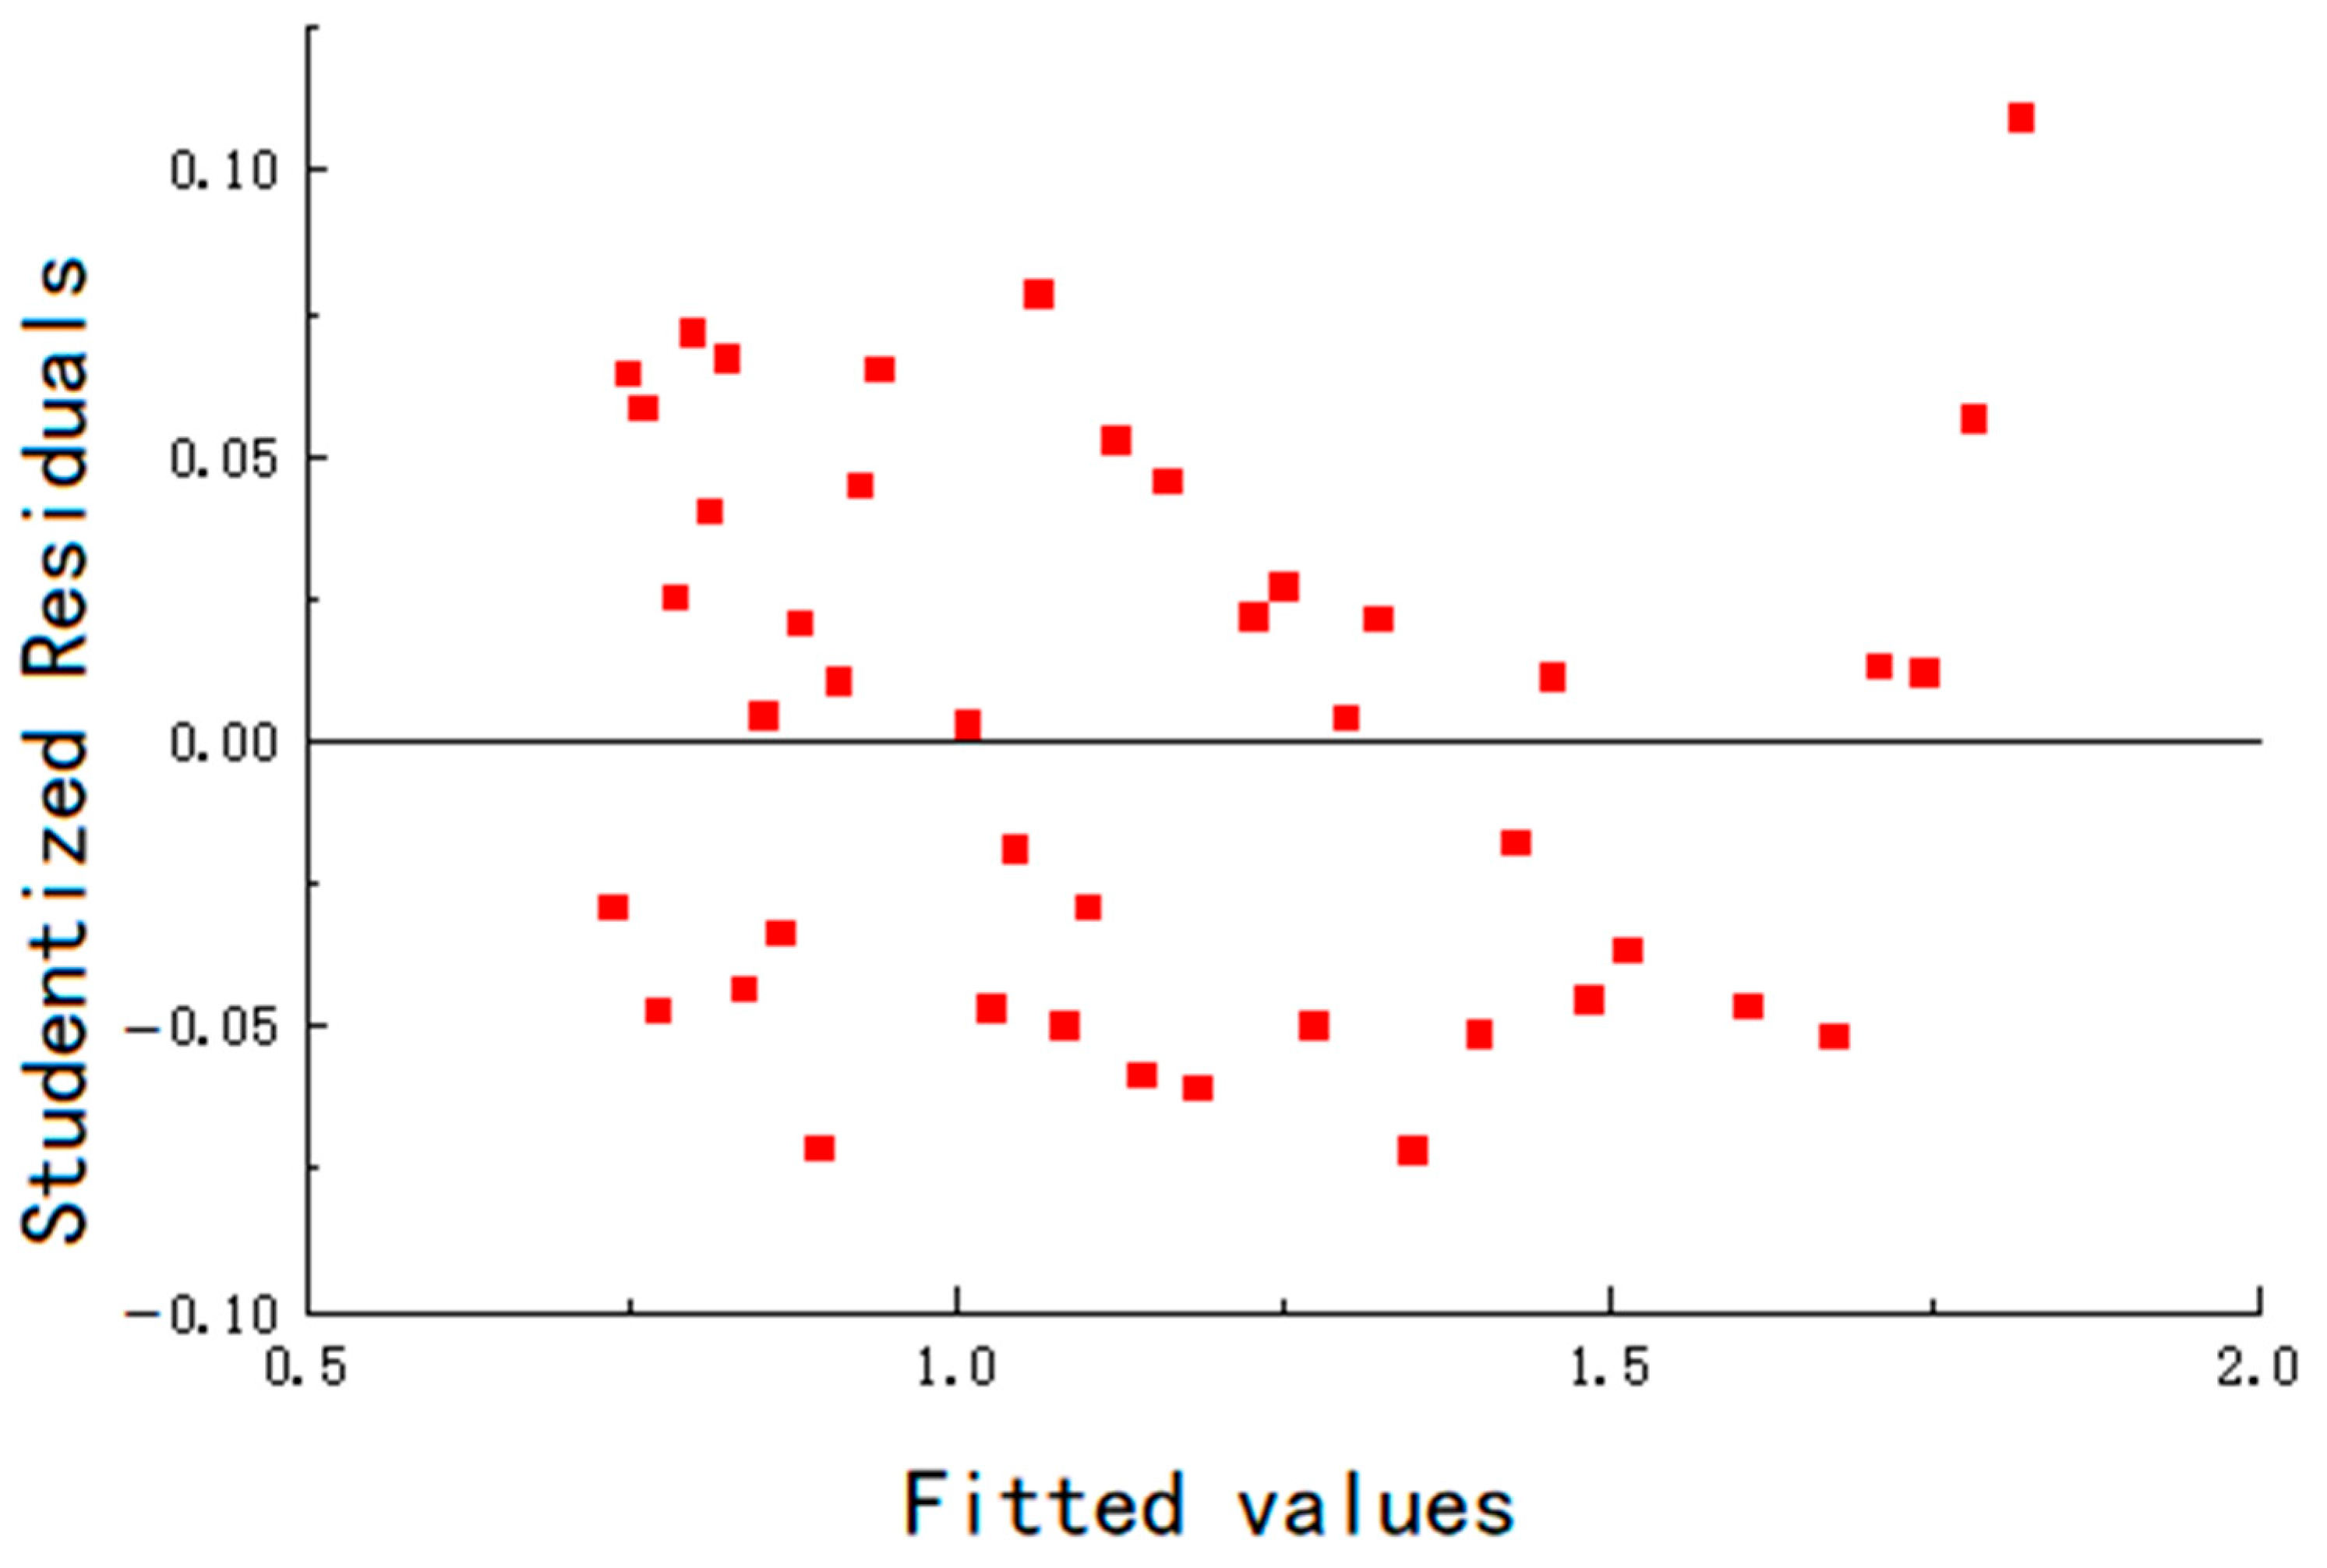
The residuals of the fitting are shown in Figure 14, Figure 15 and Figure 16. The standard errors of the empirical parameters A and n are shown in Table 7. The maximum error remains below 6.5%, and the goodness of fit is greater than 0.96, indicating that the mathematical model fits the experimental data well.
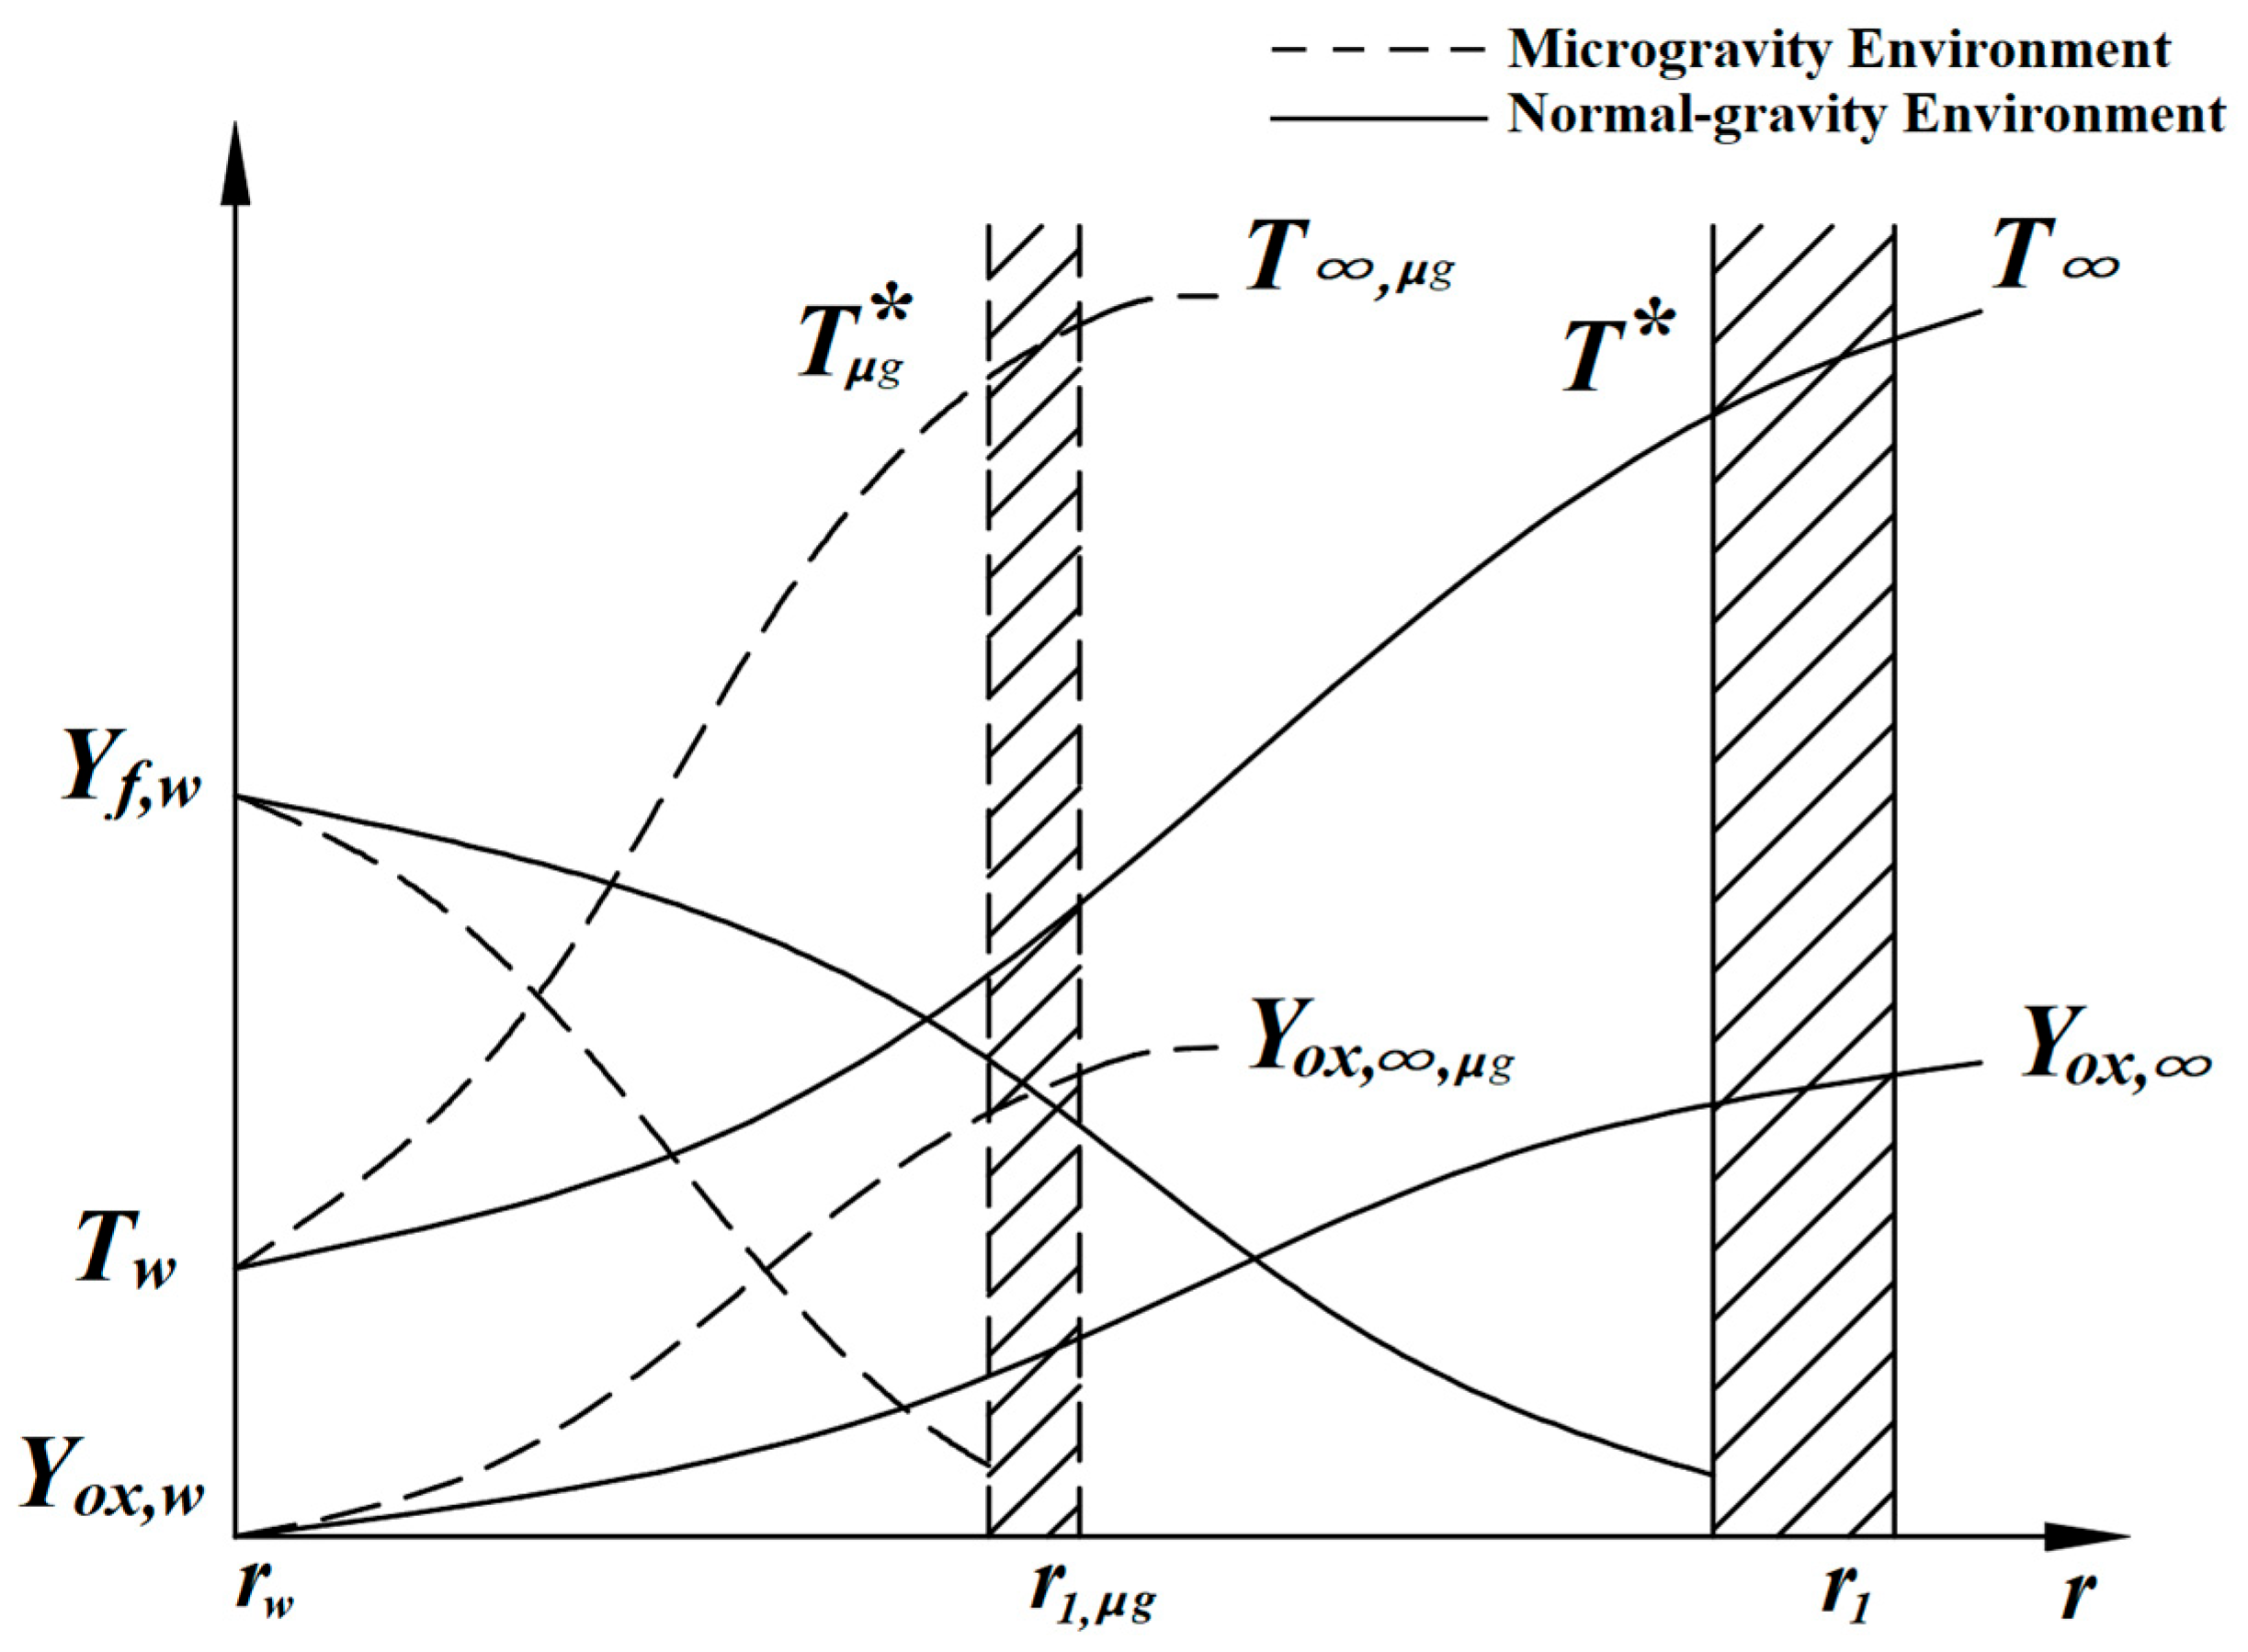
In microgravity environments, natural convection driven by buoyancy is nearly eliminated. The movement of fuel vapor occurs primarily through diffusion driven by molecular thermal motion. Because the flow pattern remains the spherically symmetric radial one-dimensional flow caused by the Stefan flow, the previously assumed boundary conditions are still applicable. Due to the absence of natural convection, the diffusion rate of fuel vapor significantly decreases compared to the normal-gravity environment. Consequently, the scale of the mixed vapor field surrounding the droplet decreases markedly, and the reaction zone becomes closer to the droplet’s surface [12,13]. In the Stefan flow, the temperature field can be analyzed using the generalized Reynolds analogy and concentration distribution.

4.2. Droplet Ignition Prediction Model Under Microgravity

In the microgravity environment, thermal motion is the primary cause of the formation of diffusion mass flow. Therefore, the Lewis number is [10]
L e = D ρ λ / c p 1
The generalized Reynolds analogy between the temperature field and the fuel vapor concentration field is expressed as
c p T T w q e = Y f 1 Y f w
Through the Reynolds analogy, combined with the distribution trends of fuel vapor concentration, by referring to Figure 9, approximate parameter profiles in the gas-phase region surrounding the droplet in the microgravity environment can be plotted, as in 
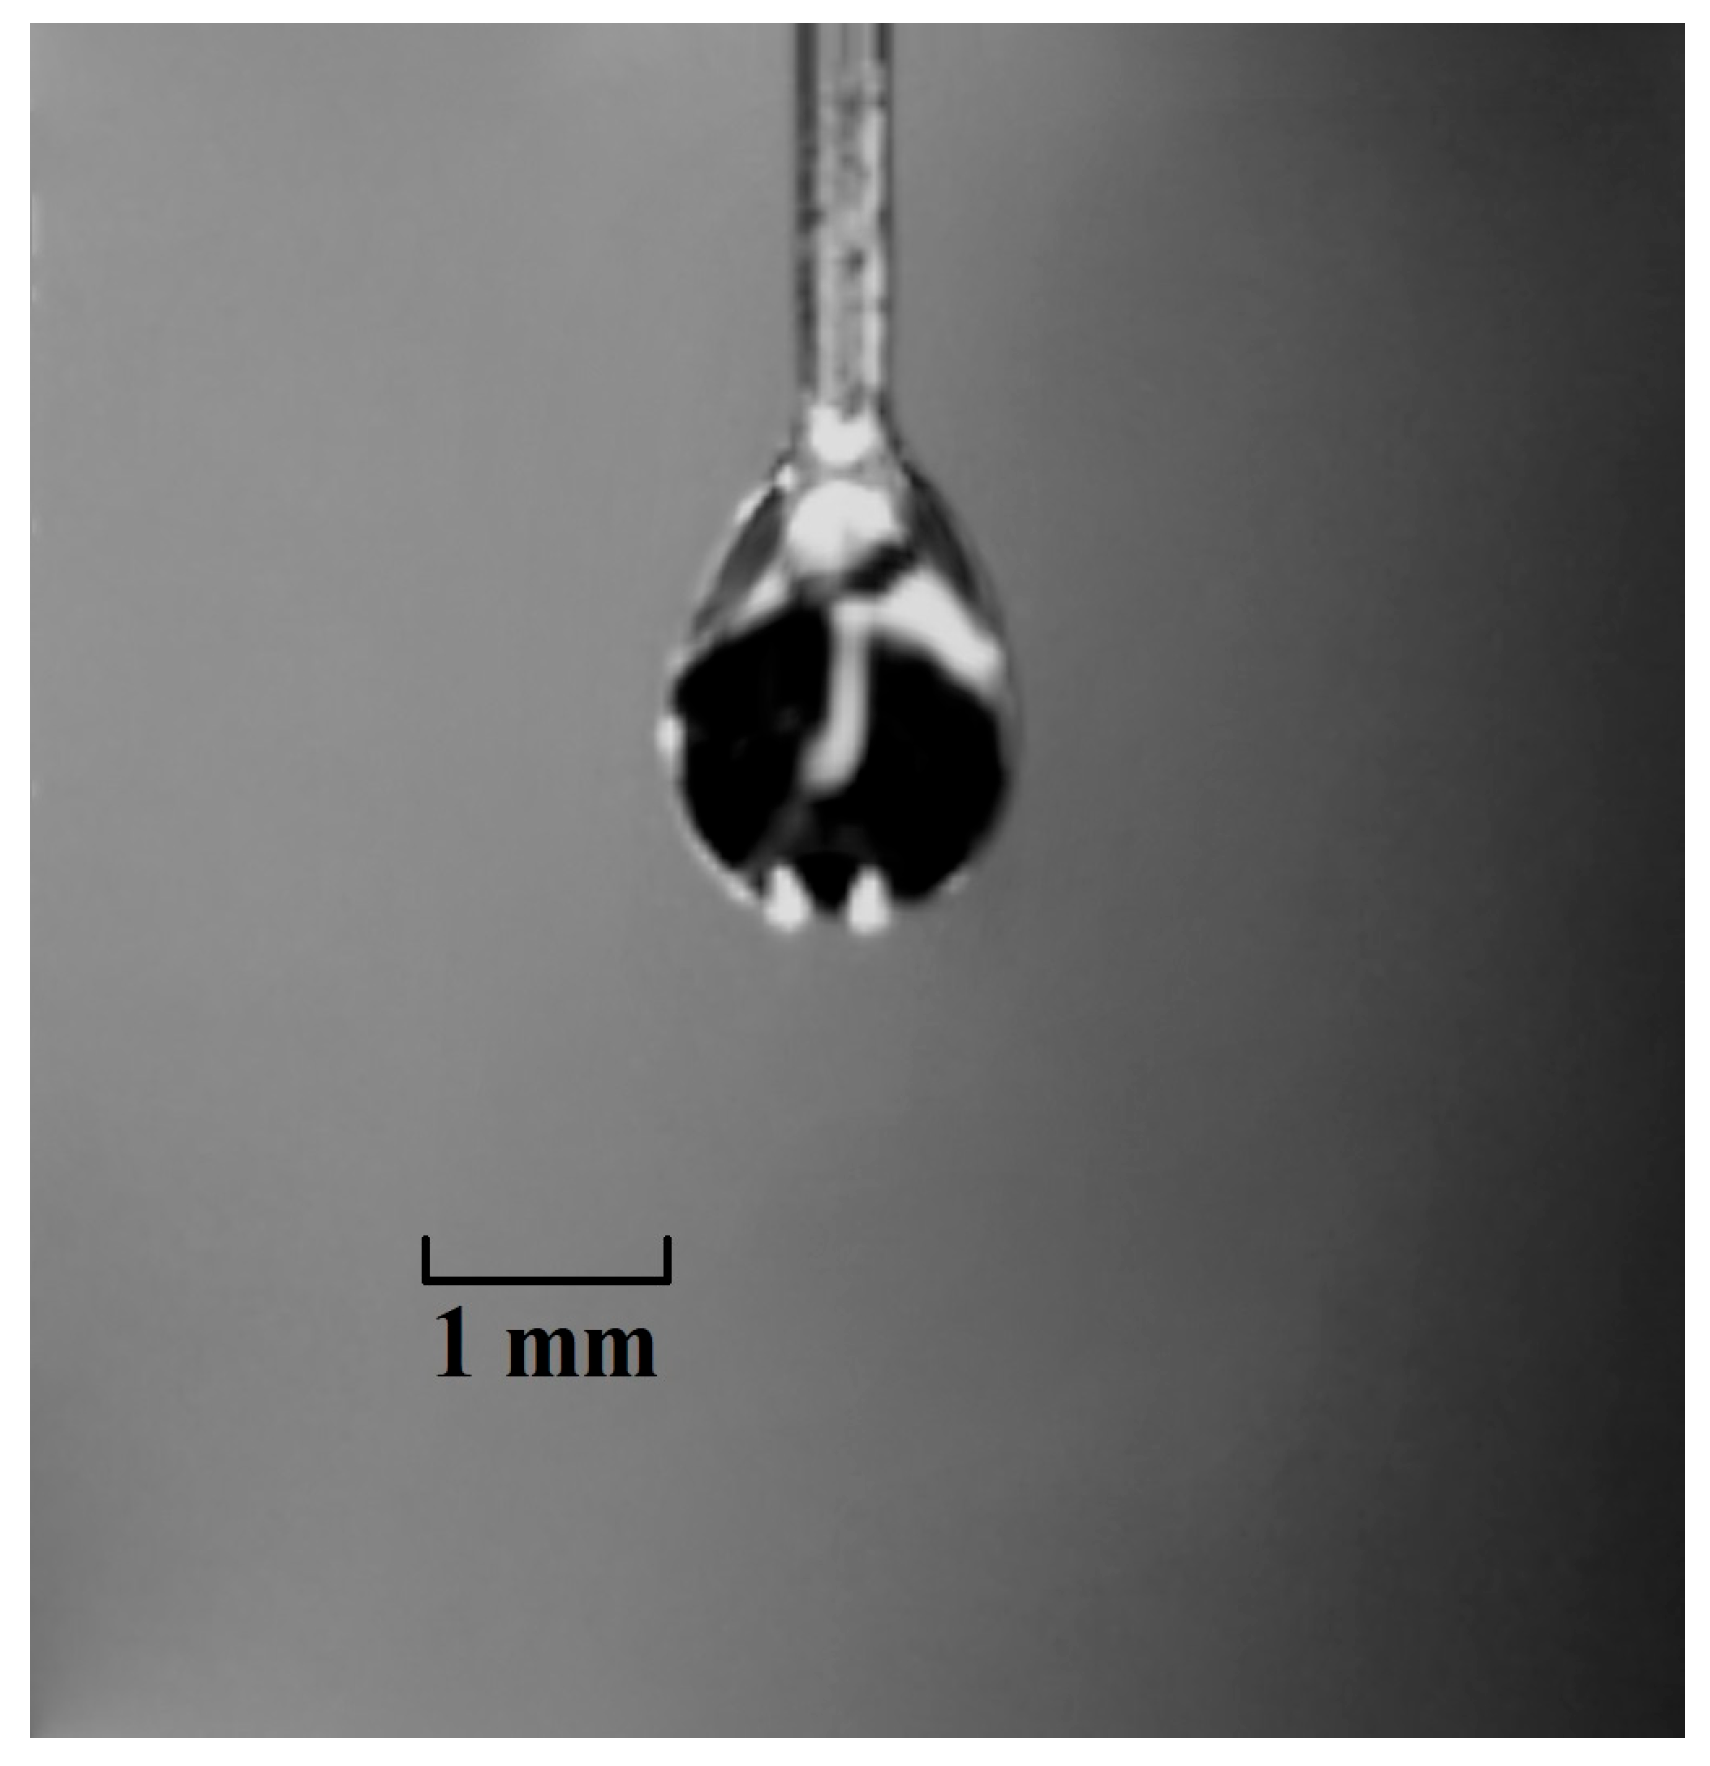
Figure 17. It can be seen that the variation trends of all parameters are basically the same as those in the normal-gravity environment, but their scales are compressed due to reduced diffusion speed. In the microgravity environment, the convective effects are extremely weak.
Therefore, the empirical expression for the Nusselt number calculated using Equation (14) is no longer applicable. In the droplet evaporation process dominated by low Reynolds numbers and Stefan flow, the Nusselt number can be modified using the Spalding number correction. The modified empirical formula is [40]
N u μ g * = l n 1 + B B 2 + N u * 2 F
F = 1 + B 0.7 l n 1 + B B
B = Y f 1 Y f = c p T T w q e
By substituting the modified   N u μ g *   into Equation (17), the ignition condition for stationary air droplets in the microgravity environment can be derived as
d w , μ g = A T n N u μ g * 2 2 N u μ g * e E 2 R T
In microgravity, the scale of the reaction zone has changed; however, the concentration of fuel vapor within the reaction zone remains largely unaffected. Because the parameters q e , c p , and λ in Equation (16) are determined by the physical properties of the fuel, the parameters Q s , k o s , and E are determined by the chemical reaction pathway of the fuel and the enthalpy changes in the reactants and products. The influence of variations in gravity on these parameters is relatively minor and can be considered negligible. Therefore, the empirical coefficients A and n remain applicable in the microgravity environment. By combining the empirical coefficients derived from experiments conducted in normal gravity with the modified   N u μ g * 
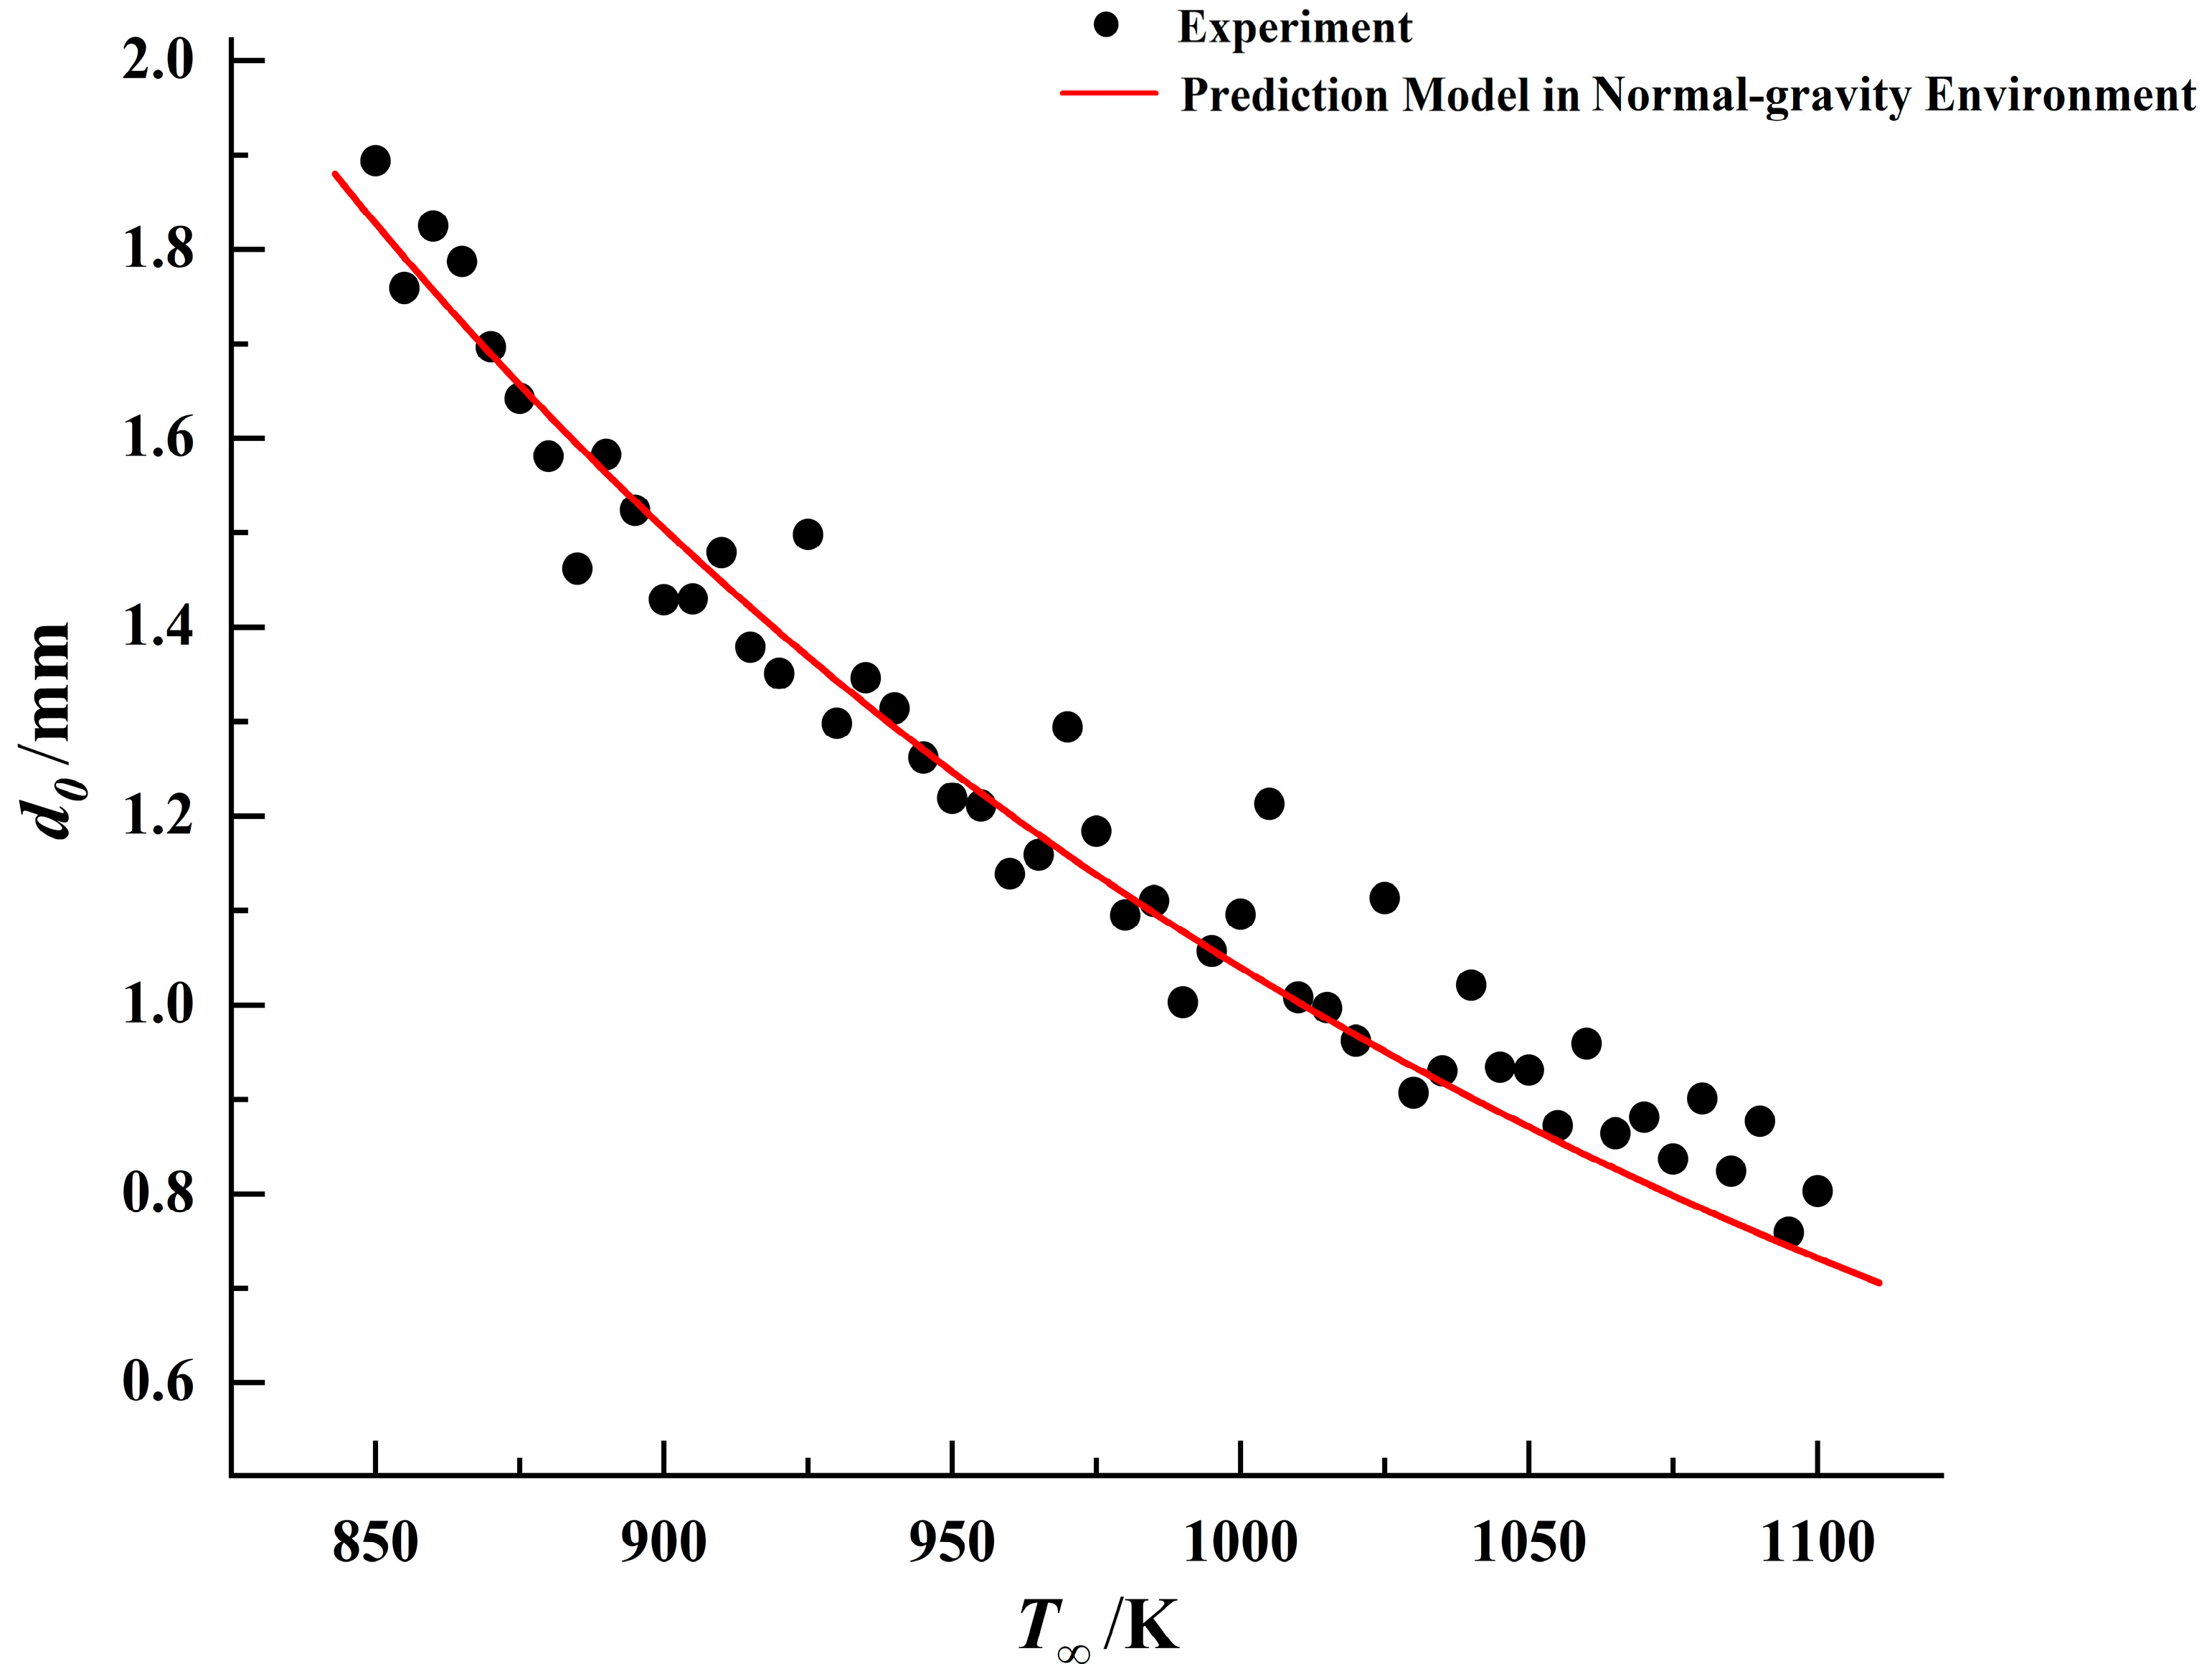
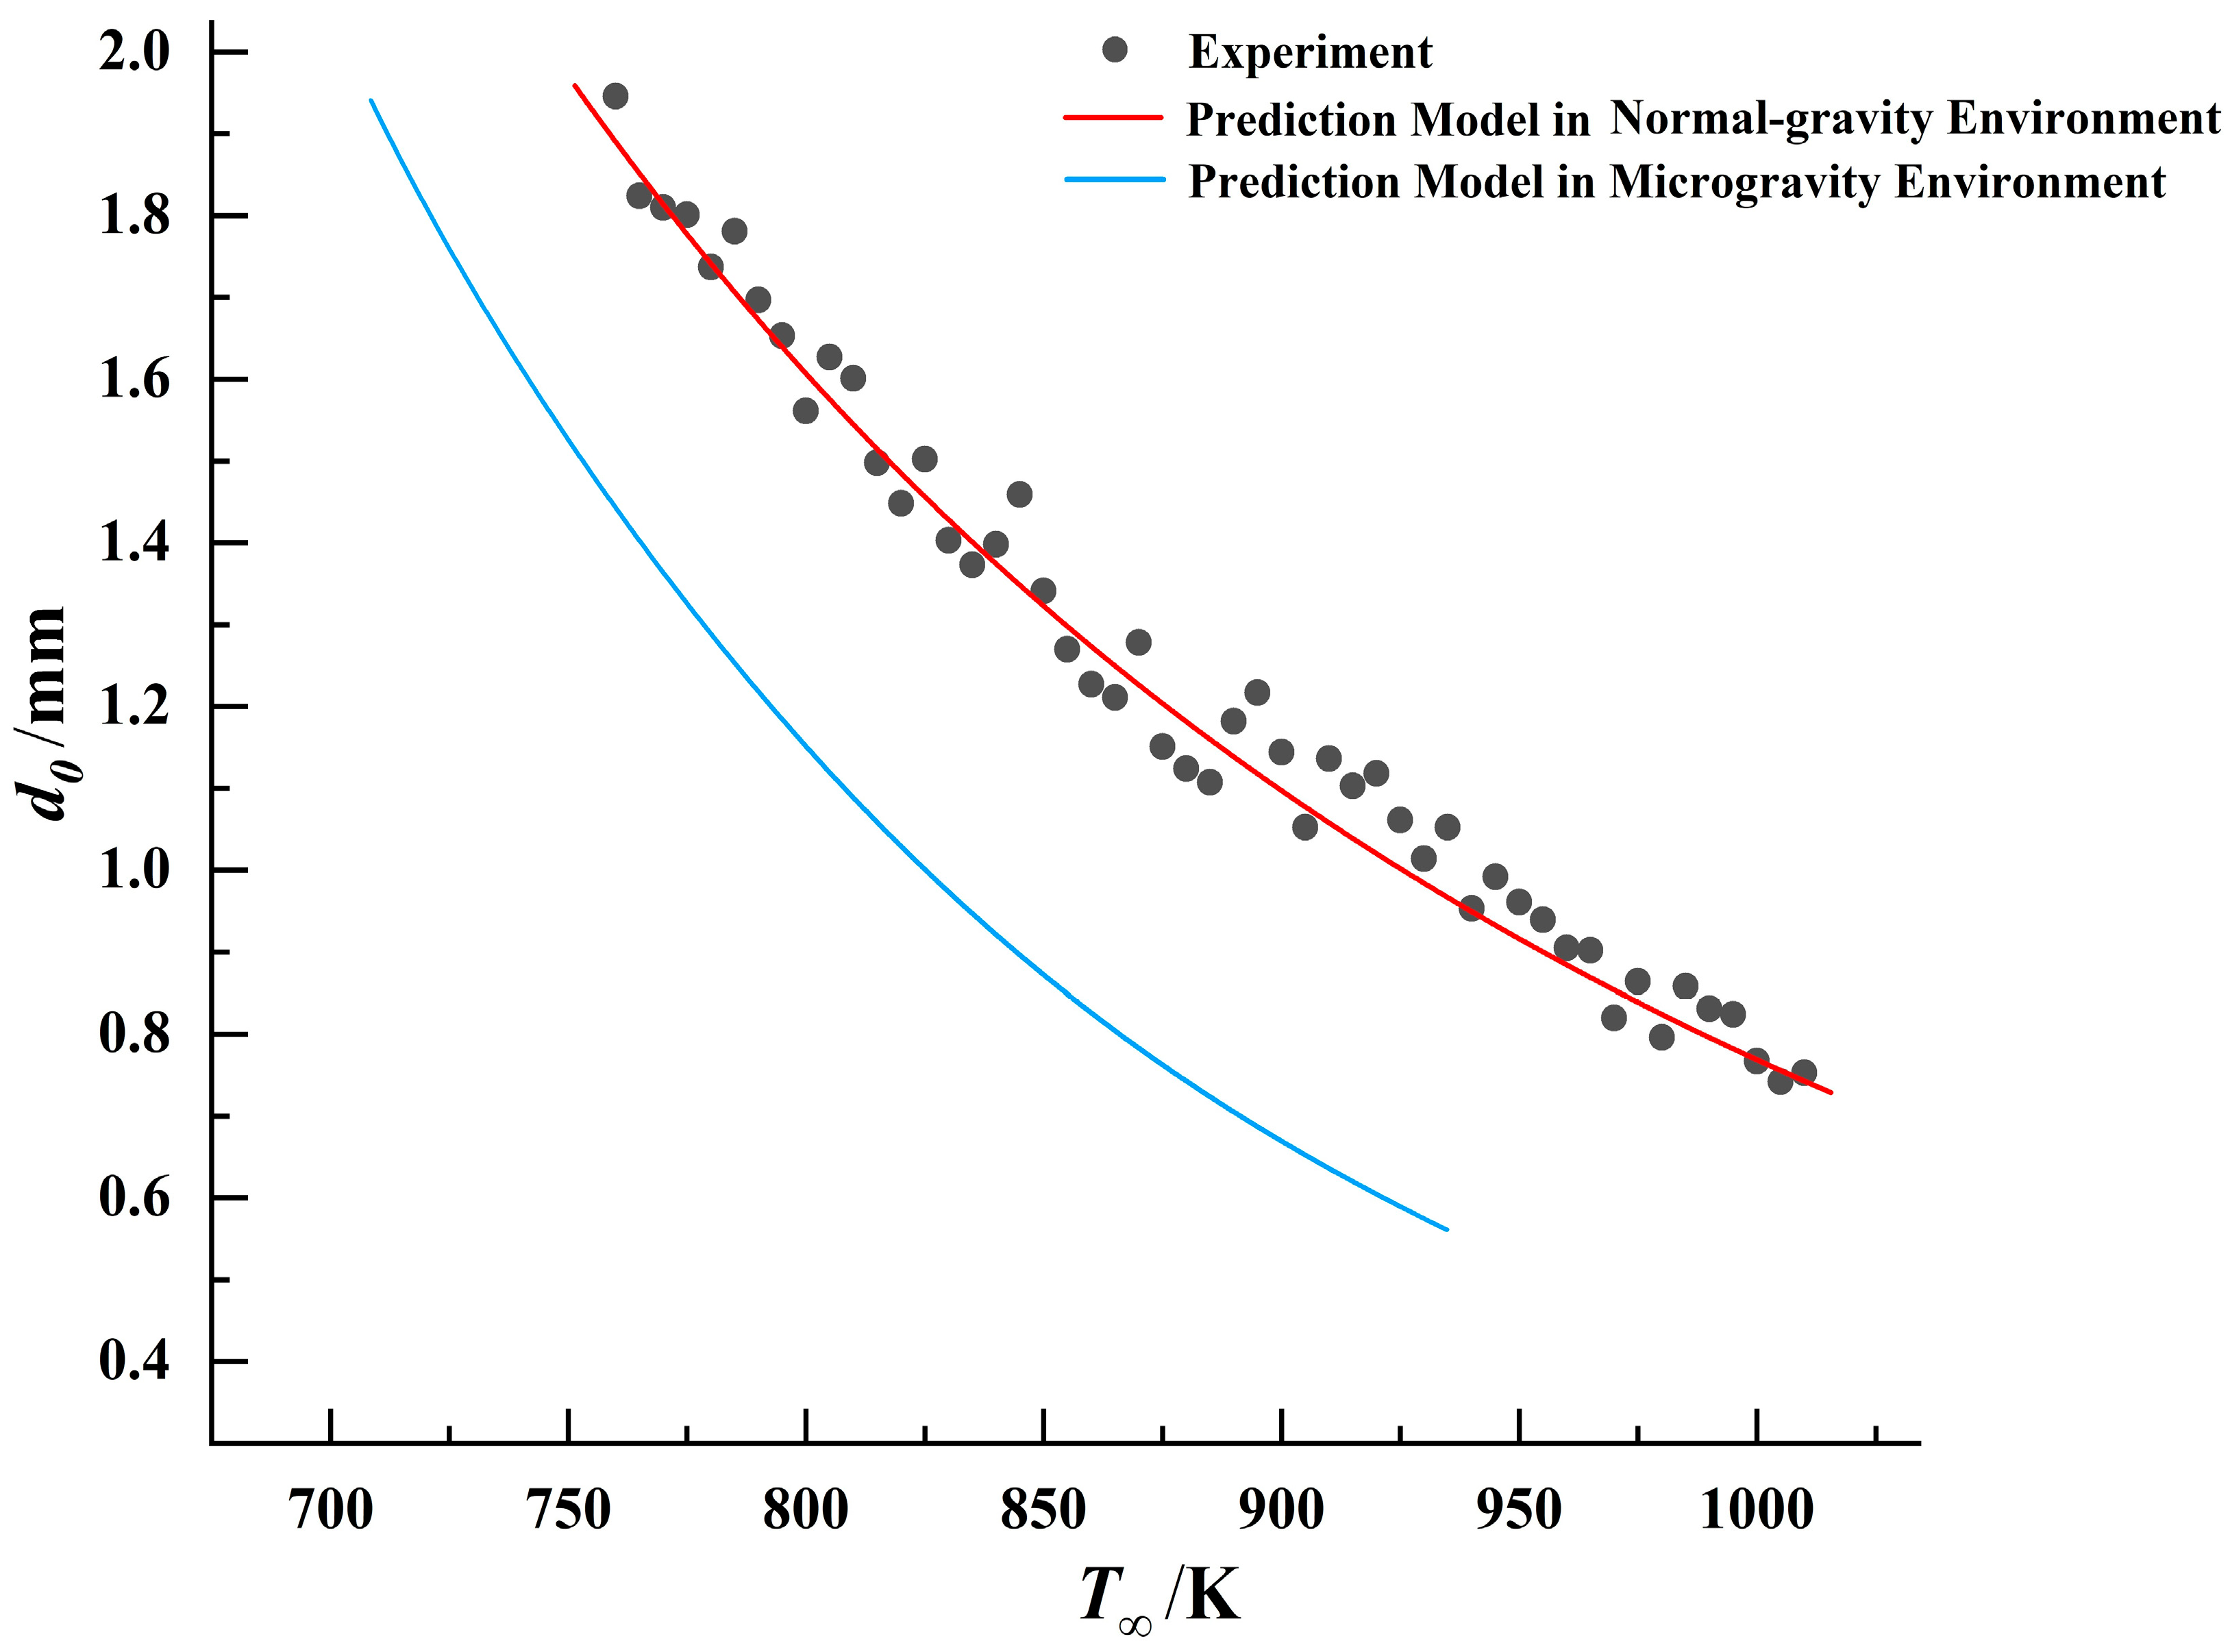
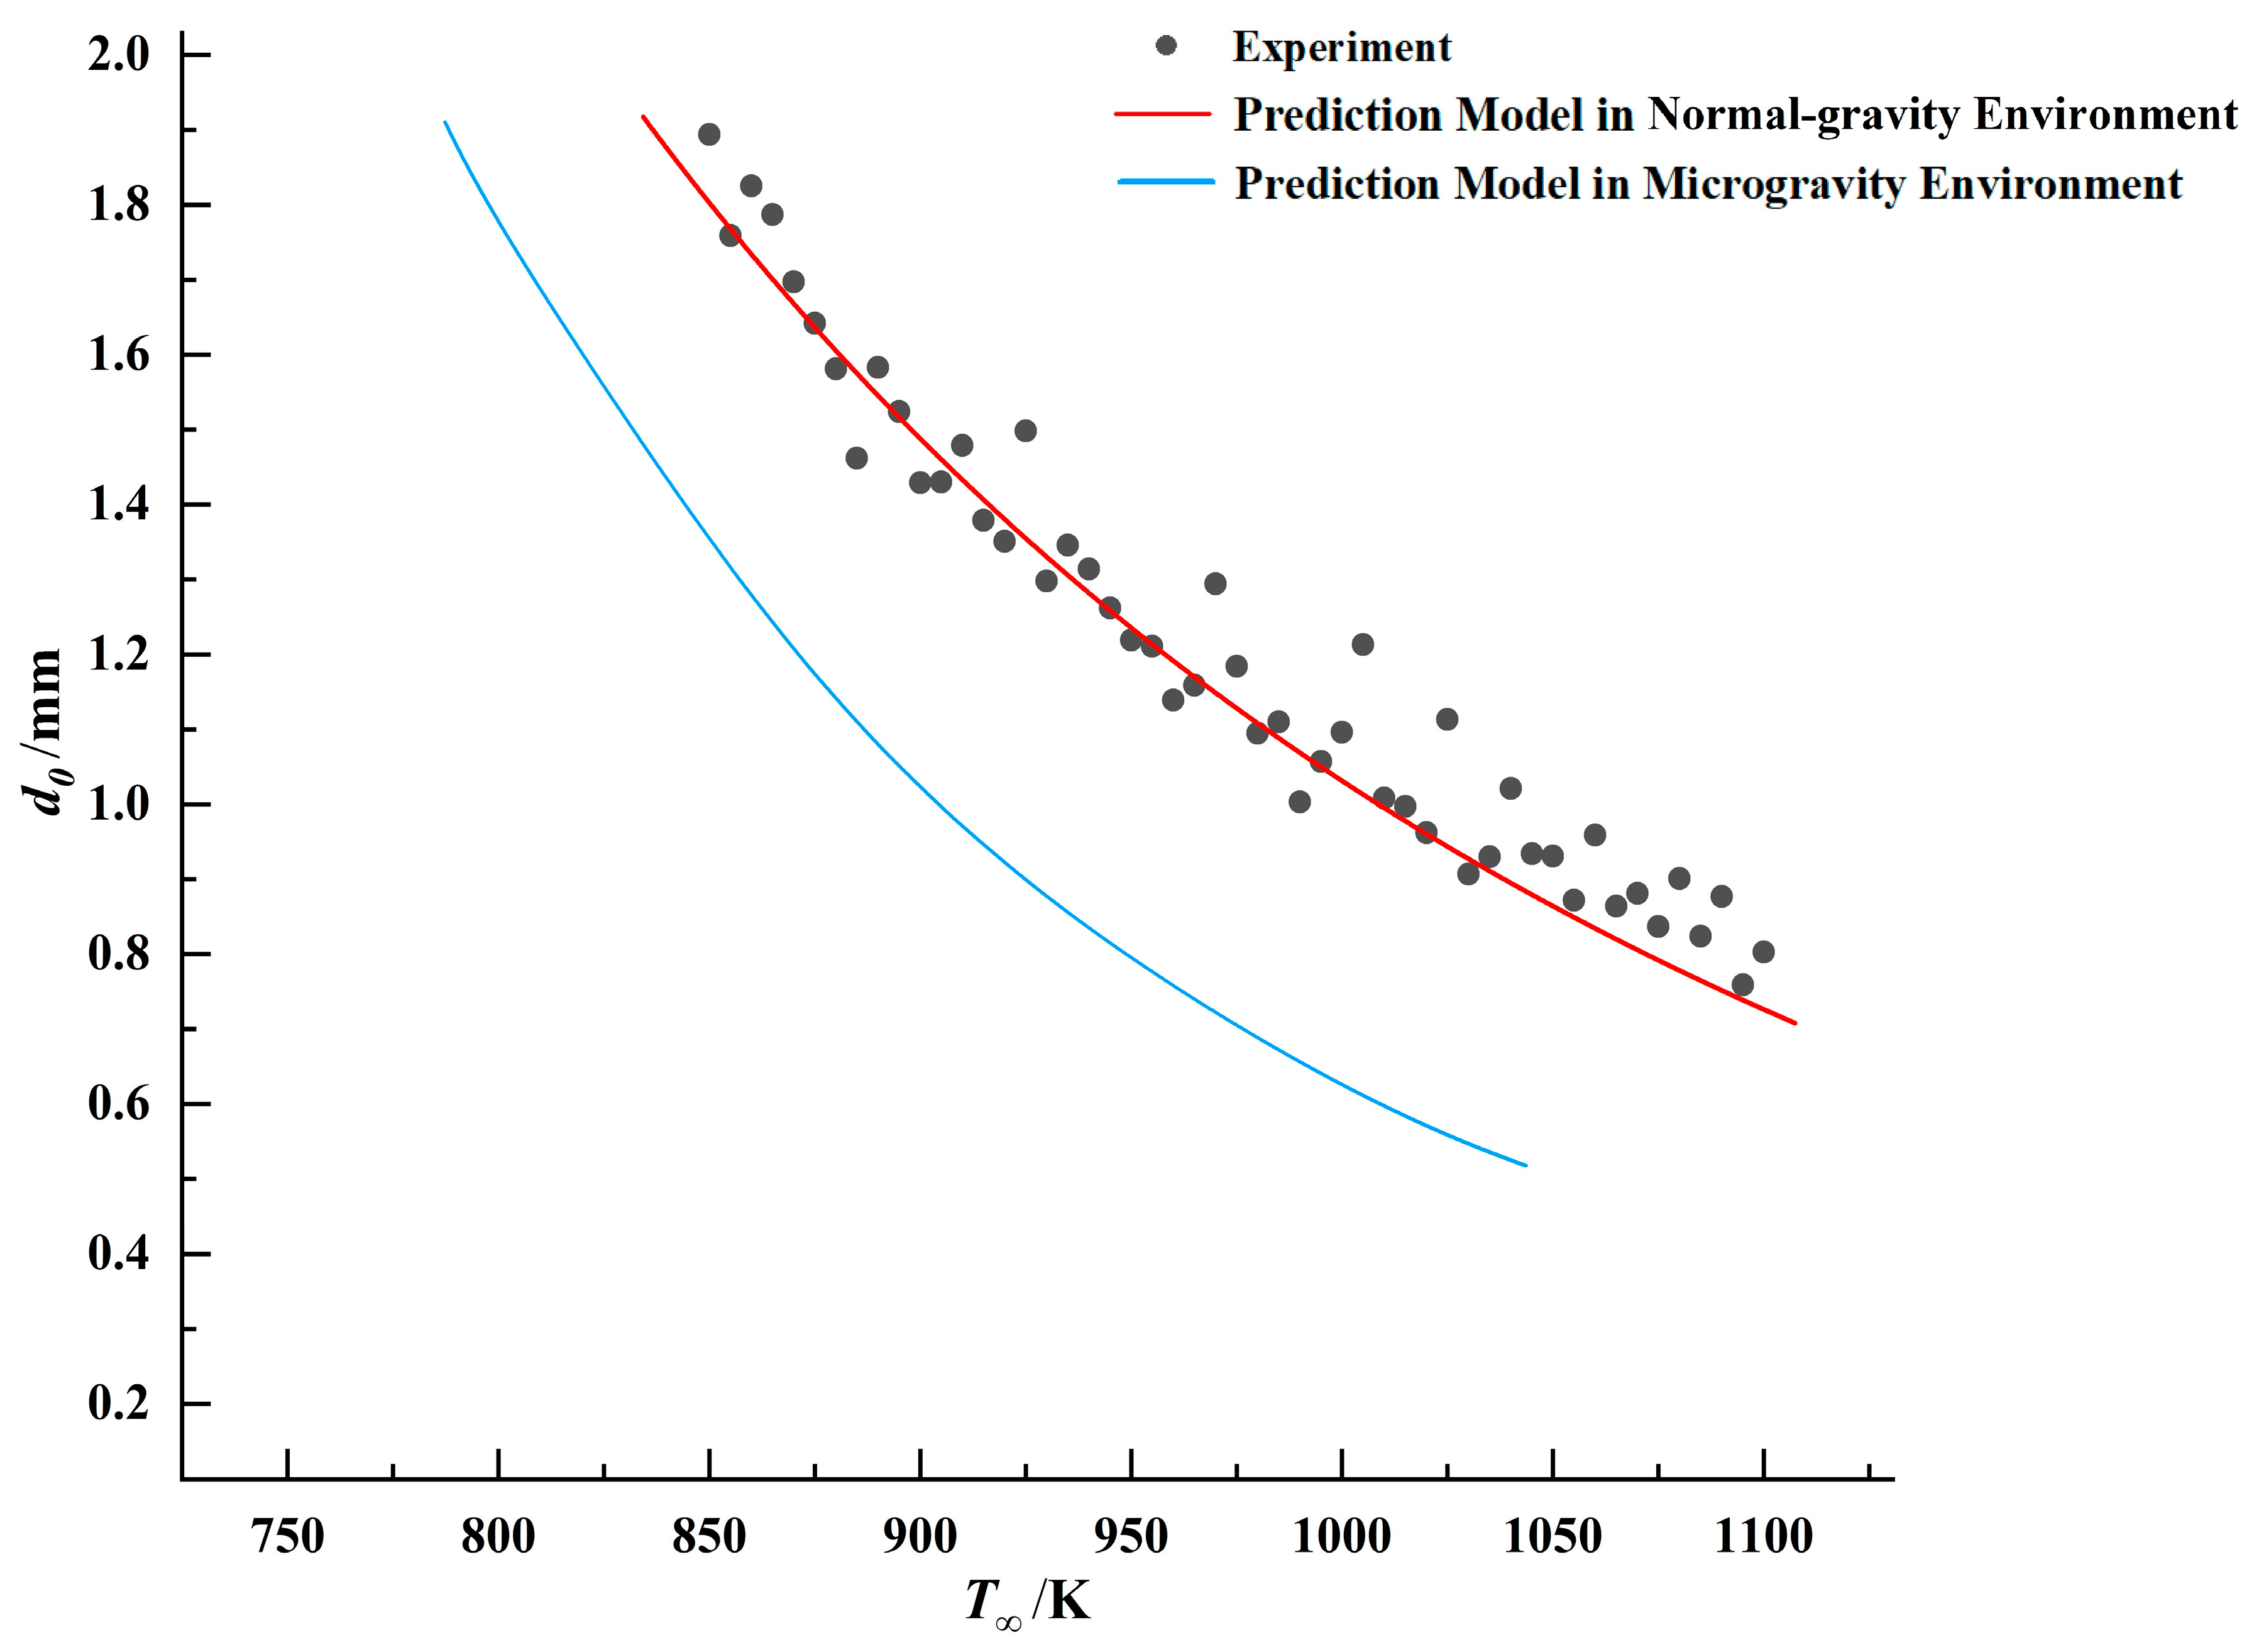
, a predictive model for droplet ignition in microgravity can be established. Comparisons between the ignition models in different gravitational environments and experimental data for the three fuels are presented in Figure 18, Figure 19 and Figure 20.
By comparing the results, it was observed that under identical droplet diameter conditions, all three fuels exhibited lower ignition threshold temperatures in the microgravity environment. This indicates that droplets are more readily ignited in this environment. This conclusion aligns with phenomena observed in numerous prior microgravity combustion experiments [15,16,18,19,40,41]. Therefore, the proposed model effectively predicts the ignition boundaries of droplets in microgravity. However, due to the current lack of specific experimental data available from the microgravity environment, certain parameters in the derivation of empirical coefficients were approximated using the thermophysical properties of the fuels in normal gravity and those of air. Consequently, the semi-empirical and semi-theoretical predictive model presented in this study requires further experiments for refinement. However, the microgravity liquid combustion experiment module intended for use on the China Space Station’s Combustion Science Experimental System is not yet operational. As a result, there is a lack of direct experimental data to refine and optimize the mathematical model.

5. Conclusions

In this study, we first designed a heating vessel to simulate a high-temperature static-air environment. Subsequently, hanging-droplet experiments were conducted to measure and investigate the relationship between ignition temperature and initial diameter for single droplets of ethanol, n-heptane, and n-dodecane fuels. The analysis of the experimental results revealed that, within the temperature range studied, the minimum initial diameter required for the ignition of single droplets of ethanol, n-heptane, and n-dodecane decreases as the ambient temperature increases; conversely, it increases as the ambient temperature decreases. Furthermore, at the same ambient temperature, the minimum initial diameter required for ignition is the largest for n-dodecane droplets, followed by n-heptane, with ethanol droplets requiring the smallest minimum initial diameter. In the analysis of the experimental data, this study, building upon the classical Frank-Kamenetskii method, derived a predictive model for single-droplet ignition in a high-temperature static-air environment in normal gravity. By incorporating the empirical-formula-corrected Nusselt number using the Spalding number, a predictive model for single-droplet ignition in the microgravity environment was proposed. Comparisons between the experimental results and existing observations revealed that this semi-theoretical, semi-empirical ignition model effectively characterizes the ignition conditions for single droplets, thereby laying a foundation for future related research. According to the future research plan for the CSS, once the microgravity liquid combustion module is successfully developed and deployed, microgravity combustion experiments of fuel droplets will be conducted to further investigate the combustion behavior and characteristics of droplets in a microgravity environment.

Author Contributions

Conceptualization, H.Z.; methodology, X.L. and H.Z.; validation, X.L. and Y.F.; formal analysis, X.L.; investigation, X.L., Y.F. and X.P.; data curation X.L.; writing—original draft preparation, X.L.; writing—review and editing, H.Z., X.L., X.Z., X.Y. and Y.F.; supervision, H.Z. and X.L.; project administration, H.Z.; funding acquisition, H.Z. All authors have read and agreed to the published version of the manuscript.

Funding

This research received no external funding.

Institutional Review Board Statement

Not applicable.

Informed Consent Statement

Not applicable.

Data Availability Statement

The original contributions presented in the study are included in the article; further inquiries can be directed to the corresponding author.

Acknowledgments

The authors sincerely appreciate the support provided by the China Space Station Combustion Science Experimental System Project.

Conflicts of Interest

The authors declare no conflicts of interest.

Appendix A

Table A1. Experimental conditions for ethanol.
Serial Number Ignition   Temperature   T / K Equivalent   Diameter   d 0 / m m
17601.946
27651.824
37701.810
47751.801
57801.737
67851.781
77901.697
87951.653
98001.561
108051.627
118101.601
128151.498
138201.448
148251.502
158301.403
168351.373
178401.398
188451.459
198501.341
208551.270
218601.227
228651.211
238701.278
248751.151
258801.124
268851.107
278901.182
288951.217
299001.144
309051.052
319101.136
329151.103
339201.118
349251.061
359301.014
369351.052
379400.953
389450.992
399500.961
409550.939
419600.905
429650.902
439700.820
449750.864
459800.796
469850.858
479900.831
489950.824
4910000.767
5010050.742
5110100.753
Table A2. Experimental conditions for n-heptane.
Serial Number Ignition   Temperature   T / K Equivalent   Diameter   d 0 / m m
18101.927
28151.837
38201.756
48251.722
58301.623
68351.617
78401.562
88451.615
98501.624
108551.479
118601.441
128651.469
138701.412
148751.351
158801.282
168851.278
178901.346
188951.304
199001.226
209051.279
219101.251
229151.132
239201.124
249251.209
259301.084
269351.175
279401.073
289451.033
299501.142
309551.026
319600.980
329651.012
339701.102
349751.062
359801.078
369851.007
379900.971
389950.921
3910000.824
4010050.901
4110100.832
4210150.856
4310200.794
4410250.891
4510300.851
4610350.869
4710400.810
4810450.725
4910500.818
5010550.812
5110600.707
Table A3. Experimental conditions for n-dodecane.
Serial Number Ignition   Temperature   T / K Equivalent   Diameter   d 0 / m m
18501.894
28551.759
38601.825
48651.787
58701.697
68751.642
78801.581
88851.462
98901.583
108951.524
119001.429
129051.430
139101.479
149151.379
159201.351
169251.498
179301.298
189351.346
199401.314
209451.262
219501.219
229551.211
239601.139
249651.159
259701.294
269751.184
279801.095
289851.110
299901.003
309951.057
3110001.096
3210051.213
3310101.008
3410150.997
3510200.962
3610251.113
3710300.907
3810350.930
3910401.021
4010450.934
4110500.931
4210550.872
4310600.959
4410650.864
4510700.881
4610750.837
4710800.901
4810850.824
4910900.877
5010950.759
5111000.803

References

  1. He, L.F. Technical Research and Experimental Analysis of Trace Particle Imaging in Combustion Science Experimental System of Chinese Space Station. Master’s Thesis, Jiangsu University, Zhenjiang, China, 2022. [Google Scholar]
  2. Zhang, X.W.; Zheng, H.L.; Wang, K.; Yang, X.F. Combustion Chamber Design and Analysis of the Space Station Combustion Science Experimental System. Chin. J. Space Sci. 2021, 41, 301–309. [Google Scholar] [CrossRef]
  3. Fang, Y. Research on Diagnostic Technology Based on Flame Radiation Imaging in Combustion Science Experimental System Aboard China Space Station. Master’s Thesis, Jiangsu University, Zhenjiang, China, 2022. [Google Scholar]
  4. Zhang, Z.Z.; Kong, W.J.; Zhang, H.L. Design of Combustion Science Experimental System for China Space Station. Chin. J. Space Sci. 2020, 40, 72–78. [Google Scholar] [CrossRef]
  5. Kong, W.J.; Zhao, R.L.; Yuan, Z.W. Study on ground matching experiments for smallscale weakintensity turbulent combustion. J. Chin. Space Sci. Technol. 2023, 43, 51–57. [Google Scholar] [CrossRef]
  6. Zhang, L.; Liu, Y.C. Research Status and Outlook of Microgravity Combustion in Space Station. J. Manned Spacefl. 2015, 21, 603–610. [Google Scholar] [CrossRef]
  7. Sadeq, A.M. Combustion Advancements: From Molecules to Future Challenges, 1st ed.; Independently Published: Doha, Qatar, 2023; ISBN 979-8-9907836-1-4. [Google Scholar]
  8. Spalding, D.B. The combustion of liquid fuels. Symp. Int. Combust. 1953, 4, 847–864. [Google Scholar] [CrossRef]
  9. Chiu, H.H.; Kim, H.Y.; Croke, E.J. Internal group combustion of liquid droplets. Symp. Int. Combust. 1982, 19, 971–980. [Google Scholar] [CrossRef]
  10. Zhou, L. Comnbustion Thcory and Chemical Fluid Mechanics; Science Press: Beijing, China, 1986; pp. 120–166. [Google Scholar]
  11. Zhuang, P.; Zhou, J. The Steady-State Theory for Ignition Computation of UDMH Droplet. J. Eng. Thermophys. 1983, 4, 85–91. [Google Scholar]
  12. Konishi, C.; Mudawar, I. Review of flow boiling and critical heat flux in microgravity. Int. J. Heat Mass Transfer 2015, 80, 469–493. [Google Scholar] [CrossRef]
  13. Sanjeev, K.; Marc, M.; David, B. Numerical model for sessile drop evaporation on heated substrate under microgravity. Int. J. Heat Mass Transf. 2022, 195, 123150. [Google Scholar]
  14. Machrafi, H.; Dauby, P. Impact of initial conditions and gas dynamics on the evaporation of a sessile droplet in microgravity and on-ground explained by a numerical model. Int. J. Heat Mass Transf. 2023, 204, 123867. [Google Scholar] [CrossRef]
  15. Mikami, M.; Oyagi, H.; Kojima, N.; Wakashima, Y.; Kikuchi, M.; Yoda, S. Microgravity experiments on flame spread along fuel-droplet arrays at high temperatures. J. Combust. Flame 2006, 146, 391–406. [Google Scholar] [CrossRef]
  16. Johnson, M.J.; Krause, T.S.; Xu, Y.; Nayagam, V.; Dietrich, D.L. n-decane droplet autoignition experiments in microgravity. Combust. Flame 2024, 268, 113624. [Google Scholar] [CrossRef]
  17. Schnaubelt, S.; Moriue, O.; Coordes, T.; Eigenbrod, C.; Rathzarm, H.J. Detailed Numerical Simulations of the Multistage Self-Ignition Process of n-Heptane Isolated Droplets and Their Verification by Comparison with Microgravity Experiments. Proc. Combust. Inst. 2000, 28, 953–960. [Google Scholar] [CrossRef]
  18. Zhang, W.; Zhou, H.; Liu, Y. Autoignition Regime Boundaries for n-Heptane Droplets Under Microgravity. Microgravity Sci. Technol. 2022, 34, 57. [Google Scholar] [CrossRef]
  19. Moriue, O.; Matsuo, K.; Murase, E.; Schnaubelt, S.; Eigenbrode, C. Verification of a Numerical Simulation Model of Fuel Droplet Ignition through Microgravity Experiments and its Further Application. J. Jpn. Soc. Microgravity Appl. 2007, 24, 251–254. [Google Scholar]
  20. Frolov, S.M.; Basevich, V.Y. Simulation of low-temperature oxidation and combustion of n-dodecane droplets under microgravity conditions. Fire 2023, 6, 70. [Google Scholar] [CrossRef]
  21. Frolov, S.M.; Basevich, V.Y.; Medvedev, S.N.; Frolov, F.S. Low-temperature flameless combustion of a large drop of n-dodecane under microgravity conditions. Russ. J. Phys. Chem. B 2018, 12, 245–257. [Google Scholar] [CrossRef]
  22. Frassoldati, A.; D’Errico, G.; Lucchini, T.; Stagni, A.; Cuoci, A.; Faravelli, T.; Onorati, A.; Ranzi, E. Reduced kinetic mechanisms of diesel fuel surrogate for engine CFD simulations. Combust. Flame 2015, 162, 3991–4007. [Google Scholar] [CrossRef]
  23. Vershinina, K.Y.; Egorov, R.I.; Strizhak, P.A. The ignition parameters of the coal-water slurry droplets at the different methods of injection into the hot oxidant flow. Appl. Therm. Eng. 2016, 107, 10–20. [Google Scholar] [CrossRef]
  24. Han, K.; Song, G.; Ma, X.; Yang, B. An experimental and theoretical study of the effect of suspended thermocouple on the single droplet evaporation. Appl. Therm. Eng. 2016, 101, 568–575. [Google Scholar] [CrossRef]
  25. Kuznetsov, G.; Piskunov, M.; Volkov, R.; Strizhak, P. Unsteady temperature fields of evaporating water droplets exposed to conductive, convective and radiative heating. Appl. Therm. Eng. 2018, 131, 340–355. [Google Scholar] [CrossRef]
  26. Aggarwal S, K. Single droplet ignition: Theoretical analyses and experimental findings. J. Progress in Energy and Combustion Science 2014, 45, 79–107. [Google Scholar] [CrossRef]
  27. Dai, S.; Jia, X.; Tian, W.; Ding, S.; Zhang, X.; Tang, J.; Zhu, X. Experiments on the Evaporation Characteristics of Sessile Fuel Droplets on Hot Surfaces. J. Tsinghua Univ. Sci. Technol. 2024, 64, 1597–1607. [Google Scholar] [CrossRef]
  28. Huber, M.L. NIST Thermophysical Properties of Hydrocarbon Mixtures Database (SUPERTRAPP), version 3.2; National Institute of Standards and Technology Standard Reference Database: Gaithersburg, MD, USA, 2007. [Google Scholar]
  29. Wang, H.; Xiong, Y.; Lu, Y. Combustion Characteristics of Hydrocarbon Fuel Droplet in Sub- and Super-Critical Pressure Environments. Trans. CSICE 2014, 32, 328–333. [Google Scholar] [CrossRef]
  30. Ma, Z.; Li, Z.; Zhu, Y.; Chen, Z.; Jia, Y.; Xu, S. Evaporation and Combustion Characteristics of Hydrocarbon Fuel Droplet at Sub- and Super-Critical Environments. Trans. CSICE 2016, 34, 443–448. [Google Scholar] [CrossRef]
  31. Li, Q.; Shu, C.; Zhang, H. On the evolution of fuel droplet evaporation zone and its interaction with flame front in ignition of spray flames. Combust. Theory Model. 2022, 26, 1131–1158. [Google Scholar] [CrossRef]
  32. Chang, Y.; Jia, M.; Wang, P.; Niu, B.; Liu, J. Construction and derivation of a series of skeletal chemical mechanisms for n-alkanes with uniform and decoupling structure based on reaction rate rules. Combust. Flame 2022, 236, 111785. [Google Scholar] [CrossRef]
  33. Chen, J.; Zhang, Y.; Zhang, H. Single Droplet Ignition and Combustion Characteristics of Multi-Component Heavy Oil. J. Tsinghua Univ. Sci. Technol. 2023, 63, 603–611. [Google Scholar] [CrossRef]
  34. Tao, W. Heat Transfer, 5th ed.; Higher Education Press: Beijing, China, 2019; pp. 536–537. [Google Scholar]
  35. Fang, W.; Tieshi, Z.; Min, L.; Rui, L.; Jie, J. Single droplet ignition models via evaporation and ignition competition. Meas. Sensors 2021, 13, 100029. [Google Scholar] [CrossRef]
  36. Narayanaswamy, K.; Pepiot, P.; Pitsch, H. A chemical mechanism for low to high temperature oxidation of n-dodecane as a component of transportation fuel surrogates. Combust. Flame 2014, 161, 866–884. [Google Scholar] [CrossRef]
  37. Farouk, T.; Dietrich, D.; Dryer, F. Three stage cool flame droplet burning behavior of n-alkane droplets at elevated pressure conditions: Hot, warm and cool flame. Proc. Combust. Inst. 2019, 37, 3353–3361. [Google Scholar] [CrossRef]
  38. Goldsborough, S.S.; Hochgreb, S.; Vanhove, G.; Wooldridge, M.S.; Curran, H.J.; Sung, C.-J. Advances in rapid compression machine studies of low-and intermediate-temperature autoignition phenomena. Prog. Energy Combust. Sci. 2017, 63, 1–78. [Google Scholar] [CrossRef]
  39. Curran, H.; Gaffuri, P.; Pitz, W.; Westbrook, C. A comprehensive modeling study of n-heptane oxidation. Combust. Flame 1998, 114, 149–177. [Google Scholar] [CrossRef]
  40. Castanet, G.; Perrin, L.; Caballina, O.; Lemoine, F. Evaporation of closely-spaced interacting droplets arranged in a single row. Int. J. Heat Mass Transf. 2016, 93, 788–802. [Google Scholar] [CrossRef]
  41. Dietrich, D.L.; Struk, P.M.; Ikegami, M.; Xu, G. Single droplet combustion of decane in microgravity: Experiments and numerical modelling. Combust. Theory Model. 2005, 9, 569–585. [Google Scholar] [CrossRef]
Figure 1. Spatial layout of the Combustion Science Experimental System [4].
Applsci 15 06558 g001
Figure 2. (a) Heating wire igniter on the gas combustion experiment plugin; (b) unsatisfactory ignition performance.
Applsci 15 06558 g002
Figure 3. Diagram of experimental facility. 1. Temperature control module. 2. Thermocouple. 3. Heating wire. 4. Heating vessel. 5. Bracket for vertical support fiber. 6. Sliding guide. 7. High-speed camera.
Applsci 15 06558 g003
Figure 4. Partial experimental instruments. (a) Reaction vessel; (b) temperature control module.
Applsci 15 06558 g004
Figure 5. The relative position of the thermocouple and the drop.
Applsci 15 06558 g005
Figure 6. Temperature measurement point inside the heating vessel. (a) Three cross-sectional planes; (b) five points on the planes.
Applsci 15 06558 g006
Figure 7. The ignition process of an n-heptane single droplet.
Applsci 15 06558 g007
Figure 8. Droplet image and scale factor.
Applsci 15 06558 g008
Figure 9. Scatter plots of the three fuels.
Applsci 15 06558 g009
Figure 10. Parameter distribution curves during fuel droplet evaporation [10]. T w : temperature at the droplet surface; T * : temperature at the reactive zone’s inner boundary; T : ambient temperature; Y f , w : the concentration of fuel gas at the droplet surface; Y f * : the concentration of fuel gas at the reactive zone’s inner boundary; Y o x * : the concentration of oxygen at the reactive zone’s inner boundary; Y o x , : ambient oxygen concentration; r w : the radius of the droplet surface; r 1 : the radius of the reaction zone’s thin layer.
Applsci 15 06558 g010
Figure 11. Comparison between droplet ignition model predictions and experimental results of ethanol (A = 6.78909 × 10⁻¹³; n = 5.89138).
Applsci 15 06558 g011
Figure 12. Comparison between droplet ignition model predictions and experimental results of n-heptane (A = 1.74129 × 10⁻¹⁶; n = 7.06683).
Applsci 15 06558 g012
Figure 13. Comparison between droplet ignition model predictions and experimental results of n-dodecane (A = 5.12171 × 10⁻¹⁷; n = 7.22623).
Applsci 15 06558 g013
Figure 14. Studentized residuals vs. fitted values plot for ethanol.
Applsci 15 06558 g014
Figure 15. Studentized residuals vs. fitted values plot for n-heptane.
Applsci 15 06558 g015
Figure 16. Studentized residuals vs. fitted values plot for n-dodecane.
Applsci 15 06558 g016
Figure 17. Schematic representation of parameter distribution curves for different gravity environments.
Applsci 15 06558 g017
Figure 18. Comparisons between the ignition models in different gravitational environments and experimental data for ethanol (A = 6.78909 × 10⁻¹³; n = 5.89138).
Applsci 15 06558 g018
Figure 19. Comparisons between the ignition models in different gravitational environments and experimental data for n-heptane (A = 1.74129 × 10⁻¹⁶; n = 7.06683).
Applsci 15 06558 g019
Figure 20. Comparisons between the ignition models in different gravitational environments and experimental data for n-dodecane (A = 5.12171 × 10⁻¹⁷; n = 7.22623).
Applsci 15 06558 g020
Table 1. Measurement results of temperature at each point.
Measurement PointPlane APlane BPlane C
11092 K1047 K1086 K
21177 K1117 K1168 K
31061 K1043 K1056 K
41179 K1140 K1178 K
51095 K1076 K1091 K
Table 2. Comparison of calculation results.
Serial NumberMicropipette MeasurementCalculated from ImageUncertainty (95%)
11.500 μL1.437 μL±0.082 μL
21.000 μL0.976 μL±0.042 μL
30.500 μL0.491 μL±0.008 μL
Table 3. Physical parameters of three liquid fuels at a temperature of 298 K and a pressure of 1.00 kPa [28].
ParameterEthanolN-HeptaneN-Dodecane
Boiling Point/K351371.5489.2
Saturation Vapor Pressure/kPa7.976.360.15
Latent Heat of Evaporation at Boiling Point/kJ·kg−1836.9316.4308.3
Table 4. Thermophysical properties of dry air under atmospheric pressure (p = 1.013 kPa) [34].
T/Kρ/kg·m−1CP/kJ·(kg·K)−1λ/W·(m·K)−1Pr
6730.5241.0680.05200.678
7730.4561.0930.05740.687
8730.4041.1140.06220.699
9730.3621.1350.06710.706
10730.3291.1560.07180.713
11730.3011.1720.07630.717
Table 5. Activation energies for three fuels.
EthanolN-HeptaneN-Dodecane
130 kJ/mol120 kJ/mol155 kJ/mol
Table 6. Relative sensitivity coefficients for the three fuels.
EthanolN-HeptaneN-Dodecane
0.977%0.902%1.128%
Table 7. Error range of fitting results.
FuelStandard Error of Parameter AStandard Error of Parameter nR2
Ethanol2.56661 × 10−130.050710.98227
N-heptane8.43382 × 10−170.063010.97683
N-dodecane1.93909 × 10−170.048840.99209
Disclaimer/Publisher’s Note: The statements, opinions and data contained in all publications are solely those of the individual author(s) and contributor(s) and not of MDPI and/or the editor(s). MDPI and/or the editor(s) disclaim responsibility for any injury to people or property resulting from any ideas, methods, instructions or products referred to in the content.

