Article

PGA Estimates for Vertical Ground Motion and Varying Deep Geology Site Surroundings—A Case Study of Banja Luka

by
Borko Bulajić
1,
Silva Lozančić
2,
Senka Bajić
1,*,
Anka Starčev-Ćurčin
1,
Miloš Šešlija
1,
Miljan Kovačević
3 and
Marijana Hadzima-Nyarko
2
1
Faculty of Technical Sciences, University of Novi Sad, Trg Dositeja Obradovića 6, 21000 Novi Sad, Serbia
2
Faculty of Civil Engineering and Architecture Osijek, Josip Juraj Strossmayer University of Osijek, Vladimir Prelog St. 3, 31000 Osijek, Croatia
3
Faculty of Technical Sciences, University of Pristina, Knjaza Milosa 7, 38220 Kosovska Mitrovica, Serbia
*
Author to whom correspondence should be addressed.
Appl. Sci. 2025, 15(12), 6542; https://doi.org/10.3390/app15126542
Submission received: 3 May 2025 / Revised: 28 May 2025 / Accepted: 5 June 2025 / Published: 10 June 2025

Abstract

Vertical PGA is frequently included in civil engineering regulations simply by multiplying the horizontal PGA by a constant. Moreover, most design codes, including Eurocode 8, do not consider the impact of the local soil on vertical ground motion at all. In this study, we demonstrate that such practices increase earthquake risks. The article examines vertical PGA strong-motion estimations for the city of Banja Luka. Banja Luka serves as a case study for areas with records of moderate to strong earthquakes and diverse deep geological conditions. Regional equations for scaling vertical PGA are presented. The vertical PGA values and vertical to horizontal PGA ratios are calculated and analyzed. The findings indicate that the vertical to horizontal PGA ratios for the rock sites depend on the source-to-site distance and deep geology and fall between 0.30 and 0.66. Hence, these ratios cannot be approximated by a single value of 0.90 and 0.45, as specified by Eurocode 8 for Type 1 and Type 2 spectra, respectively. Moreover, the results show that the deep geology effects on vertical ground motion can exceed the local soil effects. When the amount of recorded data from comparable areas increases, we will be able to properly calibrate the existing scaling equations and obtain more reliable estimates of vertical PGA.

1. Introduction

Civil engineering regulations often incorporate vertical PGA by simply multiplying the horizontal PGA by a constant. In Eurocode 8 [1], the vertical design PGA values are simply calculated by multiplying the horizontal PGA by a constant that depends only on the spectrum type [1]. Furthermore, the effect of local soil on vertical ground motion is not taken into account at all in many design regulations worldwide. In Eurocode 8 [1], vertical design spectra remain the same for all ground types. However, a recent study on the vertical ground motion at deep soils in Osijek, Croatia, showed that the vertical PGA values can be approximated as 0.61 of the horizontal PGA values, which is a 37% higher ratio than the one given by Eurocode 8 for Type 2 spectra [2]. Another study on the vertical ground motion recorded during the two 6 February 2023 Kahramanmaraş earthquakes showed that it was higher than expected and that the vertical earthquake effects were not assessed correctly in the Turkish code as well [3].
The reason why most codes do not take into account local soil effects on the vertical PGA can be found in to the so-called H/V methodology, first presented by Nogoshi and Igarashi [4,5] and later popularized by Nakamura [6,7,8]. This methodology is widely used to determine the natural period of soil vibrations using microtremors. The H/V approach assumes that local soil amplification happens only horizontally, not vertically. Although recent research has shown that this method will not always provide realistic amplification factors [9], most codes continue to be based on the assumption that local soil effects are not existent in the vertical ground motion direction.
In this study, we will define site effects in terms of “local soil” and “deep geology”. The term “deep geology” will be used to describe the geological site conditions on a scale of at least a few hundred meters, while the deep geology categories are defined as rock, intermediate sites, and sediments, according to Trifunac and Brady’s classifications [10]. The term “local soil” will be used to describe soil with a thickness of up to 100 or so meters, and the local soil types are defined in this study according to classifications by Seed et al. [11,12]. We use the same classifications as in our previous studies [2,13,14,15,16,17] for the same key reasons. First, we acquire the associated deep geology data from the EQINFOS database [18], which contains the majority of our input strong motion data and is the only strong motion database besides the Californian database [19] for which such data exist. Following the classification suggested by Trifunac and Brady [10], an international team of 13 geologists and earthquake engineers interpreted the description of the corresponding site geology and defined the deep geology site condition parameters for the recording sites [20]. As for local soil classification, Trifunac et al. [20] initially presented the local soil classification of the accelerograph locations in the former Yugoslavia, following the classifications of Seed et al. [11,12]. Lee and Trifunac [21] and Lee and Manić (1994) [22] subsequently revised and improved these classifications. Rock soil sites are defined by an average shear wave velocity, VS, of more than 800 m/s and a soil layer thickness of less than 10 m. Stiff soil sites feature a soil layer that is 15–75 m deep on top of a layer with a VS > 800 m/s. Deep soil locations have an overlaying soil layer that is more than 100 m deep. The second key reason why we use these classifications is that many recent regional microzonation research studies [23,24,25,26,27], which used GMPEs that take into account deep geology and are based only on the data recorded in former Yugoslavia, demonstrated that the resulting empirical predictions were in excellent agreement with newer regional ground motion records and observed macro-seismic intensities. This is why, despite the constraints of the database, we will use the scaling equation described here for the probabilistic hazard analyses in Banja Luka. It will be simple to update the GMPEs and rerun the PSHA analyses as the number of acceleration records increases.
This study is focused on the deep geology effects on the vertical PGA values in regions with a history of moderate to strong earthquakes. For the case study, we chose a location in the city of Banja Luka in Bosnia and Herzegovina, where all three types of deep geology can be found. The paper is structured as follows. In the next Section, we first describe the regional seismicity, Banja Luka geological site surroundings, as well as all past official estimates of vertical PGA. In Section 3, we present regional empirical GMPEs that can predict the effects of the deep geology and compare them to real strong motion records. We also compare the empirical vertical to horizontal PGA ratios (hereinafter, VHpga) to the VHpga ratios suggested by ex-Yugoslav codes, Eurocode 8, and other researchers. In Section 4 we will compute PSHA estimates for vertical PGA, and finally we will compare them to the vertical PGA values given for Banja Luka in various previous ex-Yugoslav codes as well as in the Eurocode 8 National Annex for Bosnia and Herzegovina.

2. Regional Seismicity, Geological Site Surroundings, and Official Vertical PGA Estimates for Banja Luka

Banja Luka is located between the Pannonian basin and the Dinaric Alps fold-and-thrust belt. According to a recent study, the contractional reactivation of Late Palaeogene to Middle Miocene normal faults, which postdates the deposition of the youngest strata in the Pannonian Basin of the Pontian age, may be the cause of earthquakes in the Banja Luka epicentral area [28]. Figure 1 depicts the epicenters of earthquakes with MW ≥ 3.0 detected in the region between 1900 and April 2025 [29]. Also visible are the epicenters of two recent major earthquakes in Croatia and a few of the largest regional historical earthquakes. The strongest earthquake close to Banja Luka occurred on 27 October 1969, as part of the seismic activity from 1968 to 1969, with an epicenter around 10 km northeast of Banja Luka (see Figure 1) and a magnitude of MW = 6.1, while the intensity in Banja Luka was predominantly VIII (°MCS). On 22 March 2020, a MW = 5.3 earthquake struck the Croatian capital, Zagreb, and this was the strongest earthquake near Zagreb since the MW = 6.3 earthquake near Zagreb in 1880 [30]. On 29 December 2020, a destructive MW = 6.4 event devastated the city of Petrinja, with the epicenter located 40 km south of Zagreb and 100 km northwest of Banja Luka [31]. Both earthquakes had a focal depth of around ten kilometers. Ustaszewski et al. [28] proposed reverse faulting along ESE–WNW striking nodal planes after analyzing fault plane solutions for the two 1969 Banja Luka earthquakes. Furthermore, Ustaszewski et al. [28] discovered evidence of an ongoing shortening in the interior Dinarides, which accounts for a component of the current Adria–Europe convergence, based on comparable findings for a number of minor earthquakes in the area. To learn more about Banja Luka seismotectonics, readers are referred to this exceptionally comprehensive study.
In this study, we will base our insights into the geological settings around the analyzed site on the geological map compiled by Mojičević et al. for Banja Luka and neighboring areas [33]. In a previous microzonation study for Banja Luka [32], this map was divided into 30 × 30 s cells for the area shown in the bottom plot of Figure 1. The geology of each of these 1200 cells was then defined using the major lithostratigraphic formations and their depths. Site geology was evaluated for each cell per Trifunac and Brady’s classification [10]. Each cell’s geology categorization was assigned as “alluvial and sedimentary deposits” (s = 0), “intermediate sites” (s = 1), or “basement rock” (s = 2)—see Figure 1. We have deliberately chosen the location in Banja Luka with coordinates 44°46.5′ N, 17°15′ E (see blue circle in Figure 1) as this location is surrounded by all three types of deep geology. To the west, there is a lower terrace of the river Vrbas atop of marl, clay, and sand, and we defined this formation with s = 0. To the north, there is a diabase-cherty formation (or metamorphic ophiolitic melange), which we defined with s = 1. To the east, there is a spilite formation, which we designated by s = 2.
In 2018, Bosnia and Herzegovina introduced new seismic hazard maps as part of the National Annex to Eurocode 8 [34,35]. The horizontal PGA values represent the seismic hazard, whereas the vertical PGA is obtained from the horizontal PGA and the ratios provided by Eurocode 8. The two 2018 maps were generated using the PSHA approach, for ground type A (rock), one for the 95-year return period and the other for the 475-year return period. These maps show that the horizontal PGA values for the site in Banja Luka are 0.08 g for the 95-year return period and 0.17 g for the 475-year return period. Multiplying the horizontal values by the Eurocode 8 values of 0.90 and 0.45, the vertical PGA values for the Type 1 Spectrum (with MS > 5.5 for the “most contributing” earthquakes) become 0.072 and 0.153, and 0.036 and 0.077 for the Type 2 Spectrum (MS ≤ 5.5), for the 95- and 475-year return periods, respectively. Table 1 shows these values and the corresponding macroseismic intensities, as well as the MCS intensities for Banja Luka, as provided by seismic zoning maps in the former Yugoslavia.
All former Yugoslav maps expressed the hazard in terms of seismic intensity and for average soil conditions [36,37,38,39]. The map that was issued in 1950 was used in conjunction with the first design code for earthquake-resistant structures in the former Yugoslavia, enacted in 1964 [36]. This map was compiled based on the data on the greatest MCS intensities ever recorded. The 1982 interim seismic zoning map was based on the greatest observed intensities at the time and utilized in conjunction with the 1981 code [37,39]. In 1990, six new maps, for the 50-, 100-, 200-, 500-, 1000-, and 10,000-year return periods, were added to the 1981 code [38]. Although the seismic hazard was still displayed in terms of MCS intensity and for average ground conditions, the 1990 maps were the first in the former Yugoslavia to be created using a PSHA method.
For each MCS intensity, Table 1 also displays the associated empirical vertical PGA estimates, obtained using the equation [20]:
l o g P G A v e r t = 0.593 + 0.331 I ± P σ , σ = 0.016 ,
where PGAvert is the vertical peak ground acceleration [cm/s2] and I is the MCS (Mercalli–Cancani–Sieberg Macroseismic Scale) intensity degree. Furthermore, P = 0 for the median empirical estimate and ±1 for the median ±1 standard deviation, σ. Table 1 displays the vertical PGA values computed by Equation (1) for P equal to −1 and 1, for each intensity degree.
The vertical PGA predictions for Banja Luka based on seismic intensities from the 1950 and 1982 maps are fairly consistent with the vertical PGA values obtained from the current official hazard maps. However, the 2018 vertical PGAs for the 475-year return period are significantly lower than the 1990 vertical PGAs for the 500-year return period. Even the vertical PGA values for the Type 1 Spectrum, which imply higher seismic activity, are significantly smaller than the 1990 values. Unfortunately, we do not have any information regarding the seismic source models and attenuation functions that were used to compile the 1990 maps. Hence, we were unable to provide a systematic interpretation of a significant discrepancy between the vertical PGA values from the 1990 maps and the more recent 2018 Eurocode-based estimates.
Table 2 shows the vertical PGA values (divided by the gravitational constant, g) estimated by Equation (1) for various intensities, as well as the empirical VHpga [20]. Table 3 includes the VHpga values used by the earthquake-resistant design codes in the former Yugoslavia [36,39], as well as those defined by two empirical GMPEs that incorporate the simultaneous effects of deep geology and local soil, one for California [19] and the other for the former Yugoslavia [22]. While both GMPEs neglect the local soil effect on vertical ground motion, the equation constructed for California, USA, which was based on 1482 acceleration components, takes into account the effects of deep geology on the amplification of vertical ground motion [22].
We can see from Table 2 that the VHpga values differ significantly from the ones suggested by Eurocode 8. However, they are in good agreement with the ratios suggested by the 1981 former Yugoslav regulations [39], shown in Table 3, as well as the ratios suggested by the empirical GMPEs for the former Yugoslavia [22] and California [19].

3. GMPEs for Vertical PGA Values for Varying Deep Geology

We will next present empirical GMPEs for estimating vertical PGA values when local soil and deep geology effects are to be considered together. The equations will be expressed in the following mathematical form:
log [ P G A v e r t ] = c 1 + c 2 M + c 3 log ( R 2 + R 0 T 2 ) + c 4 S L 1 + c 5 S L 2 + c 6 S G 1 + c 7 S G 2 + σ l o g P .
In Equation (1), PGAvert is the vertical maximum acceleration (in g), M represents the earthquake magnitude, and R represents the epicentral distance. Equations for hypocentral distance were also generated in our prior studies [2,14,15,16]. Table 4 lists the categorical factors SL1, SL2, SG1, and SL1. The local soil conditions were classified as per Seed et al. [11,12], and the deeper geological conditions were in line with Trifunac and Brady’s classification [10].
Before we proceed to discuss the magnitude types we used, we should reiterate that the EQINFOS database [18], which includes records from earthquakes in the northwest Balkan region, serves as the foundation for our analysis. For the largest events (magnitudes that exceeded 6.0), the database’s authors employed the MS magnitude; for all other events, they employed the ML magnitude as specified by Lee et al. [40]. The local magnitude, ML, was deliberately selected for the majority of events, as it was deemed most suitable for the so-called “strong motion”—the frequency content between 0.1 and 30 Hz that civil engineers are most interested in (see, for example, the related discussion in [41]). A later study that converted the ML magnitudes of the earthquakes in Croatia and the surrounding regions to moment magnitudes (MW) revealed that the difference in magnitudes between 3.5 and 6.5 was less than 2% [42]. Additionally, according to Scordilis [43], for magnitudes between 6.2 and 7.0, the difference between MS and MW magnitudes is approximately 0.2%. We therefore think that we can utilize our GMPEs in seismic hazard calculations with the seismic source zones determined by using the MW-based seismicity data, taking into account the other constraints of the given database. Here, we must note that even the MW magnitude has significant restrictions. As shown in recent studies by Das et al. [44] and Das and Das [45], the Mwg scale should be used to adjust the seismicity data in order to improve the accuracy of seismic hazard estimates. In our future research, we plan to modify our calculations by using other magnitude scales. However, this will wait until additional regional seismicity and strong motion data are collected, and further discussions on this topic will have to be left out of the purview of this study.
The database used to derive equations for scaling PGAvert consists of 218 vertical components of ground motion records from the region of the former Yugoslavia from 112 earthquakes of magnitude 3 < M ≤ 6.8 [18,46,47]. Detailed descriptions of the data can be found in [2,15,17]. The database has no records from events with magnitudes above 7, and less than 20% of the data is from events with magnitudes greater than 6.0. As a result, the generated predictive equations will be most useful in areas with low to moderate seismic activity. However, a comparison to real records from a 6.8 magnitude earthquake [17] demonstrates that these equations can be generalized to zones of moderate-to-high seismicity, assuming that magnitudes do not exceed 7. It should also be noted that the proposed attenuation equations do not account for potential PGAvert variations as a function of fault rupture directionality (relative to the investigated site). As shown in a recent study, the directivity phenomenon (the presence of high-velocity pulses) can have a significant impact on low- and mid-rise masonry structures like those found in Banja Luka [48]. However, due to the limited quantity of near-fault pulse data in regional strong motion records, this will stay outside the scope of our current research.
We conducted multiple linear regression analyses to compute the scaling coefficients, with R0 systematically adjusted to lower the root mean squared error. Since the majority of the data was obtained over short distances, we performed a supplementary analysis that only included data acquired at epicentral distances of less than 30 km. Finally, because we also conducted regression analyses for the pseudo-spectral accelerations at 61 vibration periods (and in both horizontal and vertical directions), in all our analyses the scaling coefficients were smoothed in MATLAB® (version 8.5, release 2015a) by “weighted linear least squares and a second degree polynomial model” [49,50,51]. We utilized a log-normal distribution for all regression analyses, with σlog being the standard deviation of the decadic logarithm of PGA and ε being equal to 0 for median estimations. The resulting scaling equation for the PGAvert, based on the data recorded at all distances, is as follows:
log [ P G A v e r t ] = 1.6833 + 0.3947 M 1.3186 log ( R 2 + 16.8 2 ) + 0.1575 S L 1 0.0165 S L 2 0.1204 S G 1 0.0678 S G 2 + 0.2428 P ,
while based solely on the data recorded at distances of not more than 30 km, we got the following equation:
log [ P G A v e r t ] = 3.9665 + 0.4045 M 4.5446 log ( R 2 + 40.0 2 ) + 0.1328 S L 1 0.0165 S L 2 0.1949 S G 1 0.0630 S G 2 + 0.2506 P .
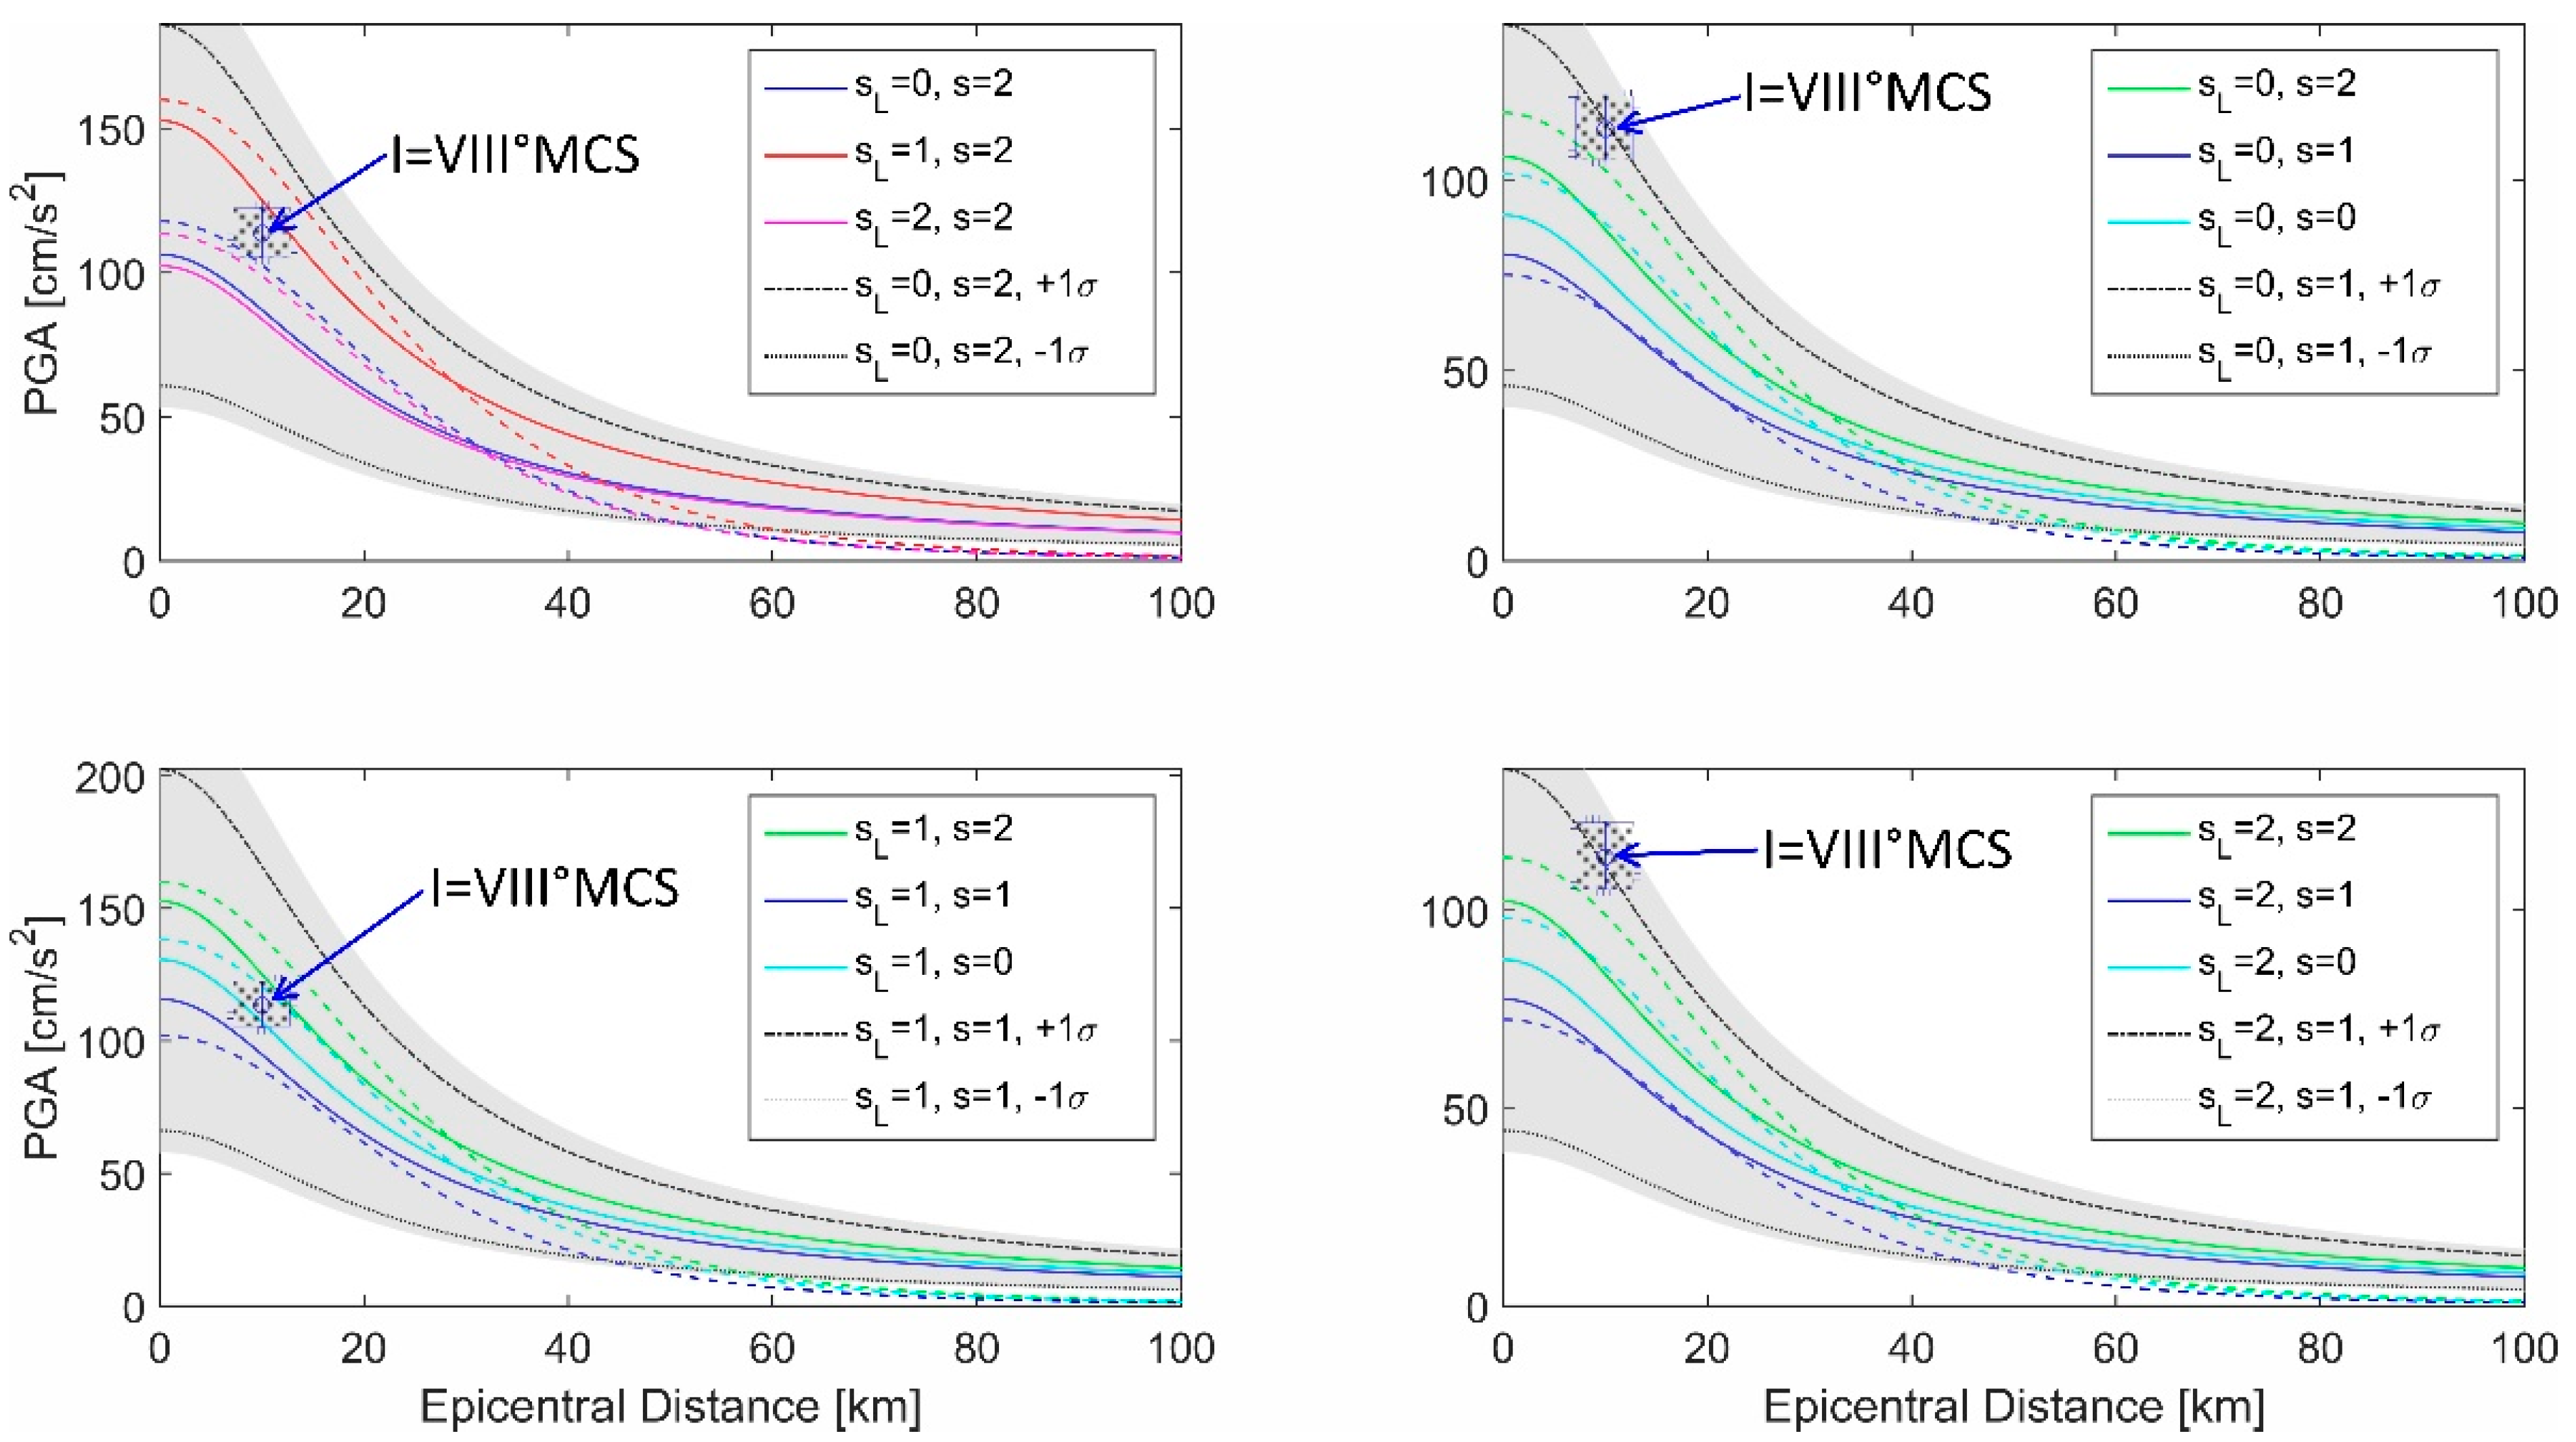
As illustrated in Figure 2, both deep geology and local soil influence PGAvert. The coefficients of the variables SL and SG can be used to compute the differences in the PGA calculated for different site conditions. For example, if the deep geology parameters remain constant and Equation (3) is utilized, the PGA value for stiff soil sites is 100.1575 = 1.44 times that for rock sites and 10−0.0165 = 0.96 times that for deep soil. In other words, for deep soil, seismic waves are de-amplified as energy dissipation outweighs local soil amplification.
Likewise, if the local soil type remains the same, the PGA values will be lower at geological sediments and intermediate sites than at geological rock sites, since short-period waves travel more easily through compact hard rocks like granites or basalts. Specifically, the PGA estimates at geological rock will be 1/10−0.1949 = 1.57 times larger than at intermediate locations, and 1/10−0.0630 = 1.16 times larger than at geological sediment locations. All of these statistics demonstrate not only that site conditions have a significant impact on PGAvert but also that the deep geology effects are even greater than the local soil effects.
For the epicentral distance of 10 km, Figure 2 shows PGAvert ranges estimated with Equation (1) (median ± one standard deviation) for VIII °MCS. The intensity of VIII °MCS was predominant during the 1969 earthquake in Banja Luka, and the epicenter was at a distance of around 10 km. We can see that only the combination of stiff soil and deep geology rocks may produce a median empirical PGAvert equivalent to that associated with VIII °MCS.
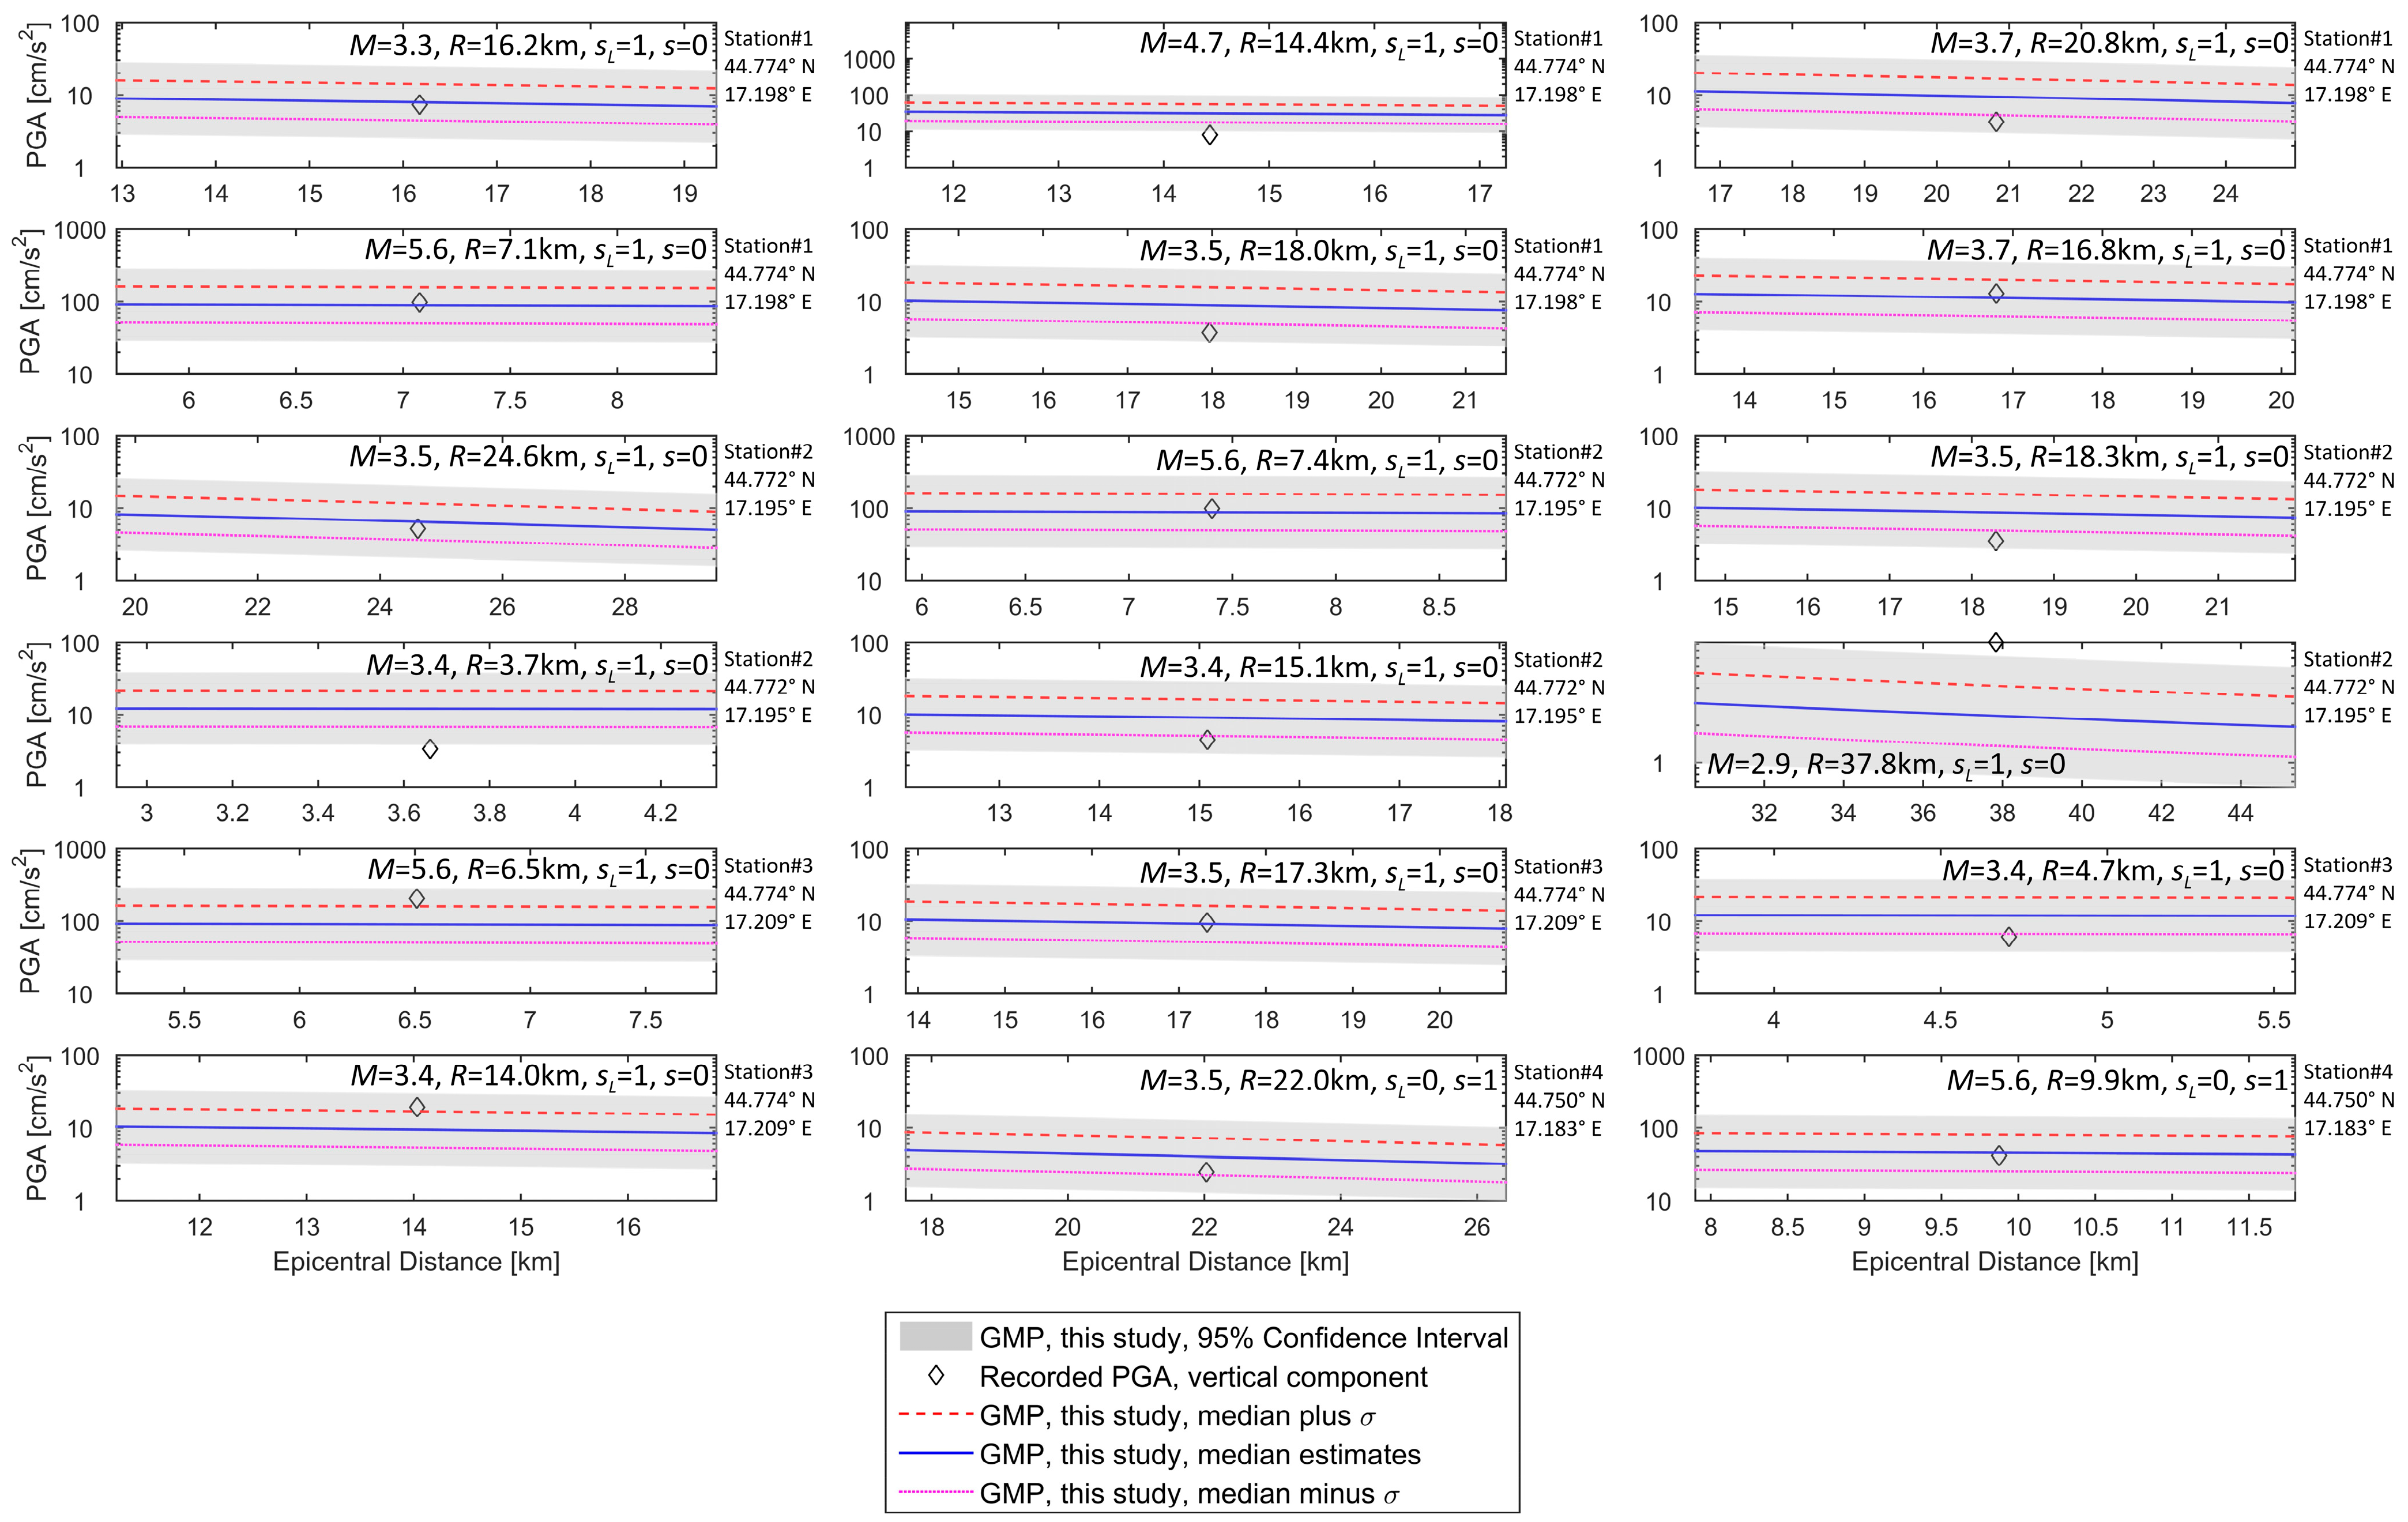
Figure 3 compares 18 PGAvert values recorded at the four different accelerograph stations in Banja Luka [18] (see the red circles in the bottom plot of Figure 1) with the median and median ± σlog empirical estimates, which were obtained using Equation (3). The empirical estimates for PGAvert are in good agreement with the actual records in Banja Luka, as Figure 4 illustrates.
Figure 4 displays the VHpga for different site conditions and distances. The VHpga values, as shown, are influenced by deep geology, local soil, source-to-site distance, and the probability level of empirical estimates. For distances up to 100 km, the empirical VHpga ranges from 0.30 to 0.66 for the rock soil sites, from 0.30 to 0.65 for the stiff soil sites, and from 0.36 to 0.78 for the deep soils.

4. PSHA for the Case Study Site in Banja Luka

In this section, we will conduct a PSHA analysis for the location in Banja Luka with coordinates 44°46.5′ N, 17°15′ E, using Equation (3) as the GMPE. PSHA estimations will be generated with the REASSESS V2.1 software [52], which is based on Cornell–McGuire “deductive” methodology [53,54]. The PSHA computations are used to evaluate the likelihood of encountering a certain value of PGAvert while accounting for all earthquakes that may occur in the analyzed area over the expected life of a building. The seismic sources in the surrounding area of the analyzed site are first identified. In the present study, we will employ the SHARE Project’s pan-European seismic source zone model [55,56,57]—see Figure 5, which also displays the epicenters of several large historical earthquakes, as well as a few recent catastrophic earthquakes in the northwestern Balkans [29]. This source zone model was based on the new homogeneous earthquake catalogue (SHEEC—the “SHARE European Earthquake Catalogue” [58]), which was compiled for the scope of the SHARE project. Thorough explanations and details regarding the completeness, homogeneity with respect to MW, and other important features of this catalog can be found in [56,58,59,60] and will not be repeated here.
In Figure 5, the two larger circles, whose radii are 103.5 and 73.0 km, respectively, show the maximum distances that we must include in the PSHA computations to achieve 99 percent of the estimated hazard at the analyzed location for the return periods of 95 and 475 years; the two smaller circles with radii of 52.5 and 32.5 km, respectively, show the maximum distances needed to obtain 90 percent of the total hazard for the same return periods. Figure 5 shows that the PGAvert probabilistic estimates are dominated by local seismicity, with only the M6.4 1969 Banja Luka and M6.4 2020 Petrinja earthquakes occurring within the depicted radii, while all other events occur in areas that are not significantly contributing to the seismic hazard.
After the designation of seismic sources, the next step in the PSHA analysis will be to estimate the severity of ground motion at different distances. In the present study, we shall apply Equation (3) to this aim. Finally, the contributions from all analyzed source zones are aggregated and tallied across all magnitudes and distances. Recent regional microzonation investigations [23,24,25,26,27] found that horizontal PGA is dominated by local seismicity and is not particularly responsive to distant and very strong earthquakes, such as those that occur in the Vrancea area in Romania. It is reasonable to suppose that the PGAvert in Banja Luka will be dominated by local seismicity as well. Hence, we did not use a different scaling equation for the Vrancea region [61,62].
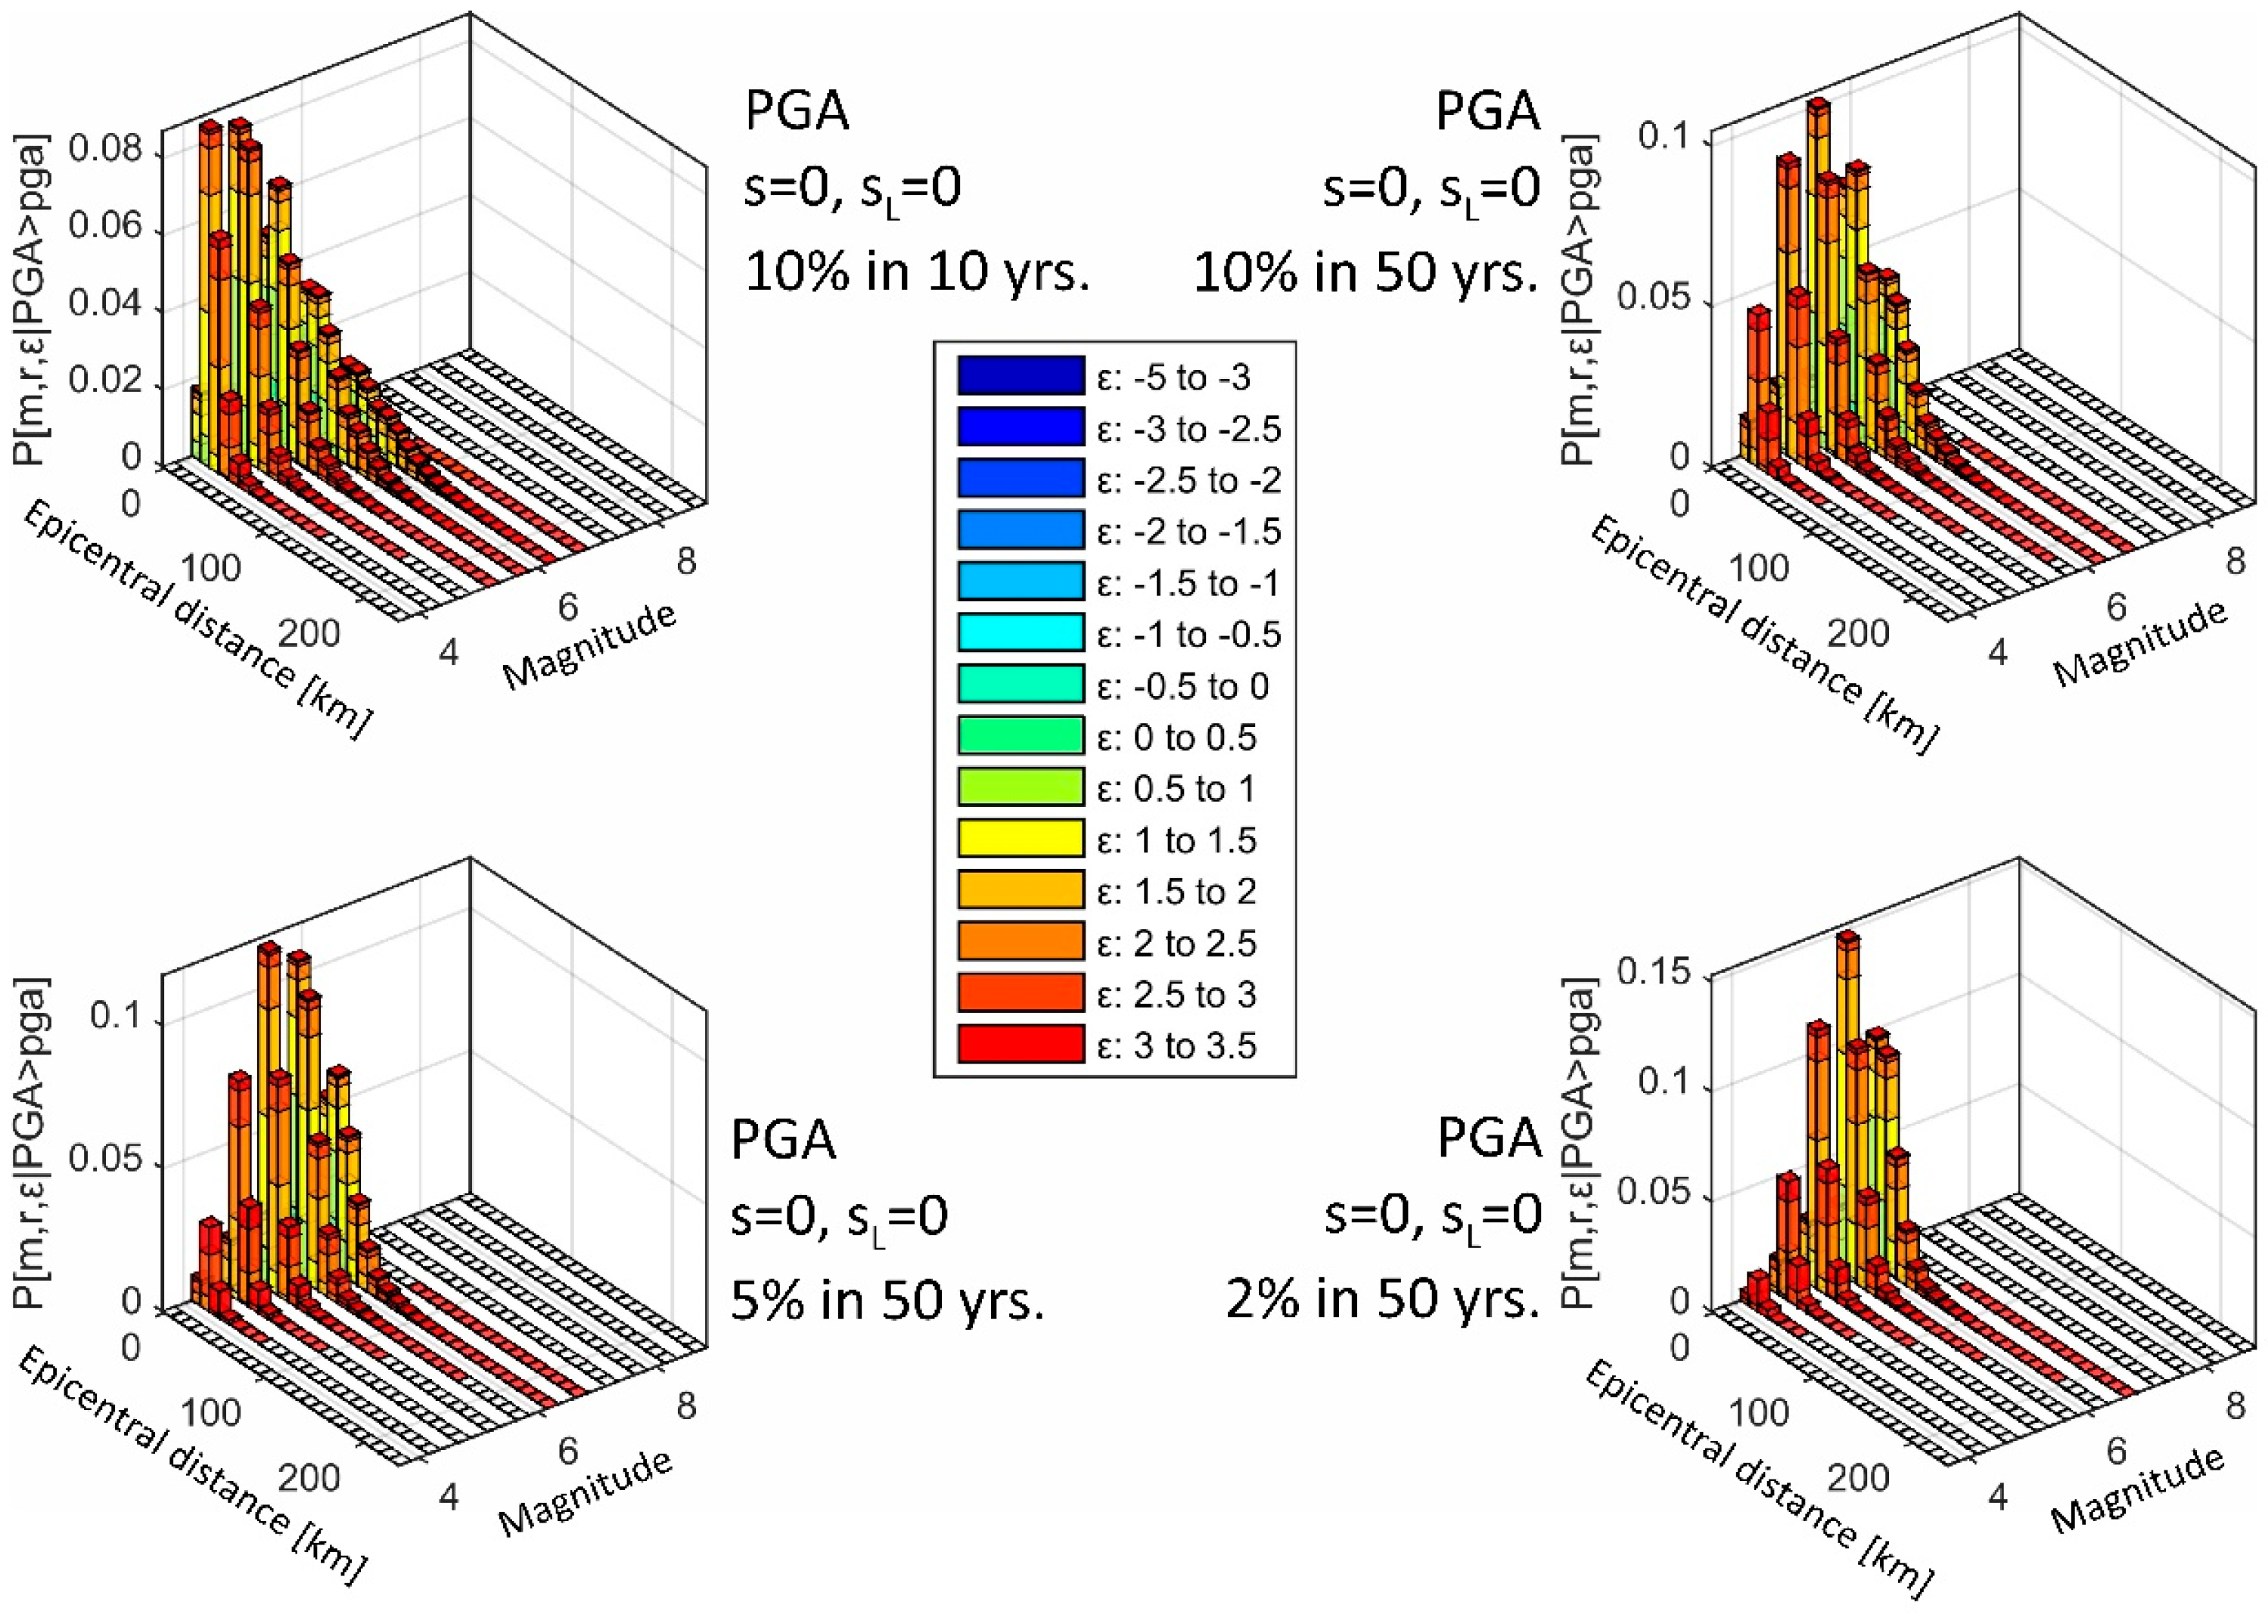
Earthquakes that contribute the most to the seismic hazard can be assessed using the technique commonly known as seismic hazard disaggregation [63]. Figure 6 shows the seismic hazard disaggregation at 44°46.5′ N, 17°15′ E (refer to Figure 1 and Figure 5) for the 95-, 475-, 975-, and 2475-year return periods.
The four plots displayed in Figure 6 show the PSHA disaggregation of PGAvert estimates for the location 44°46.5′ N, 17°15′ E (solid blue circles in Figure 1 and Figure 5) and the probabilities of exceedance of 10% in 10 years, and 10%, 5%, and 2% in 50 years. These probabilities correspond to the so-called return period, Tr, with values of 95, 475, 975, and 2475 years. These plots show that the most contributing magnitudes increase with the return period, Tr.
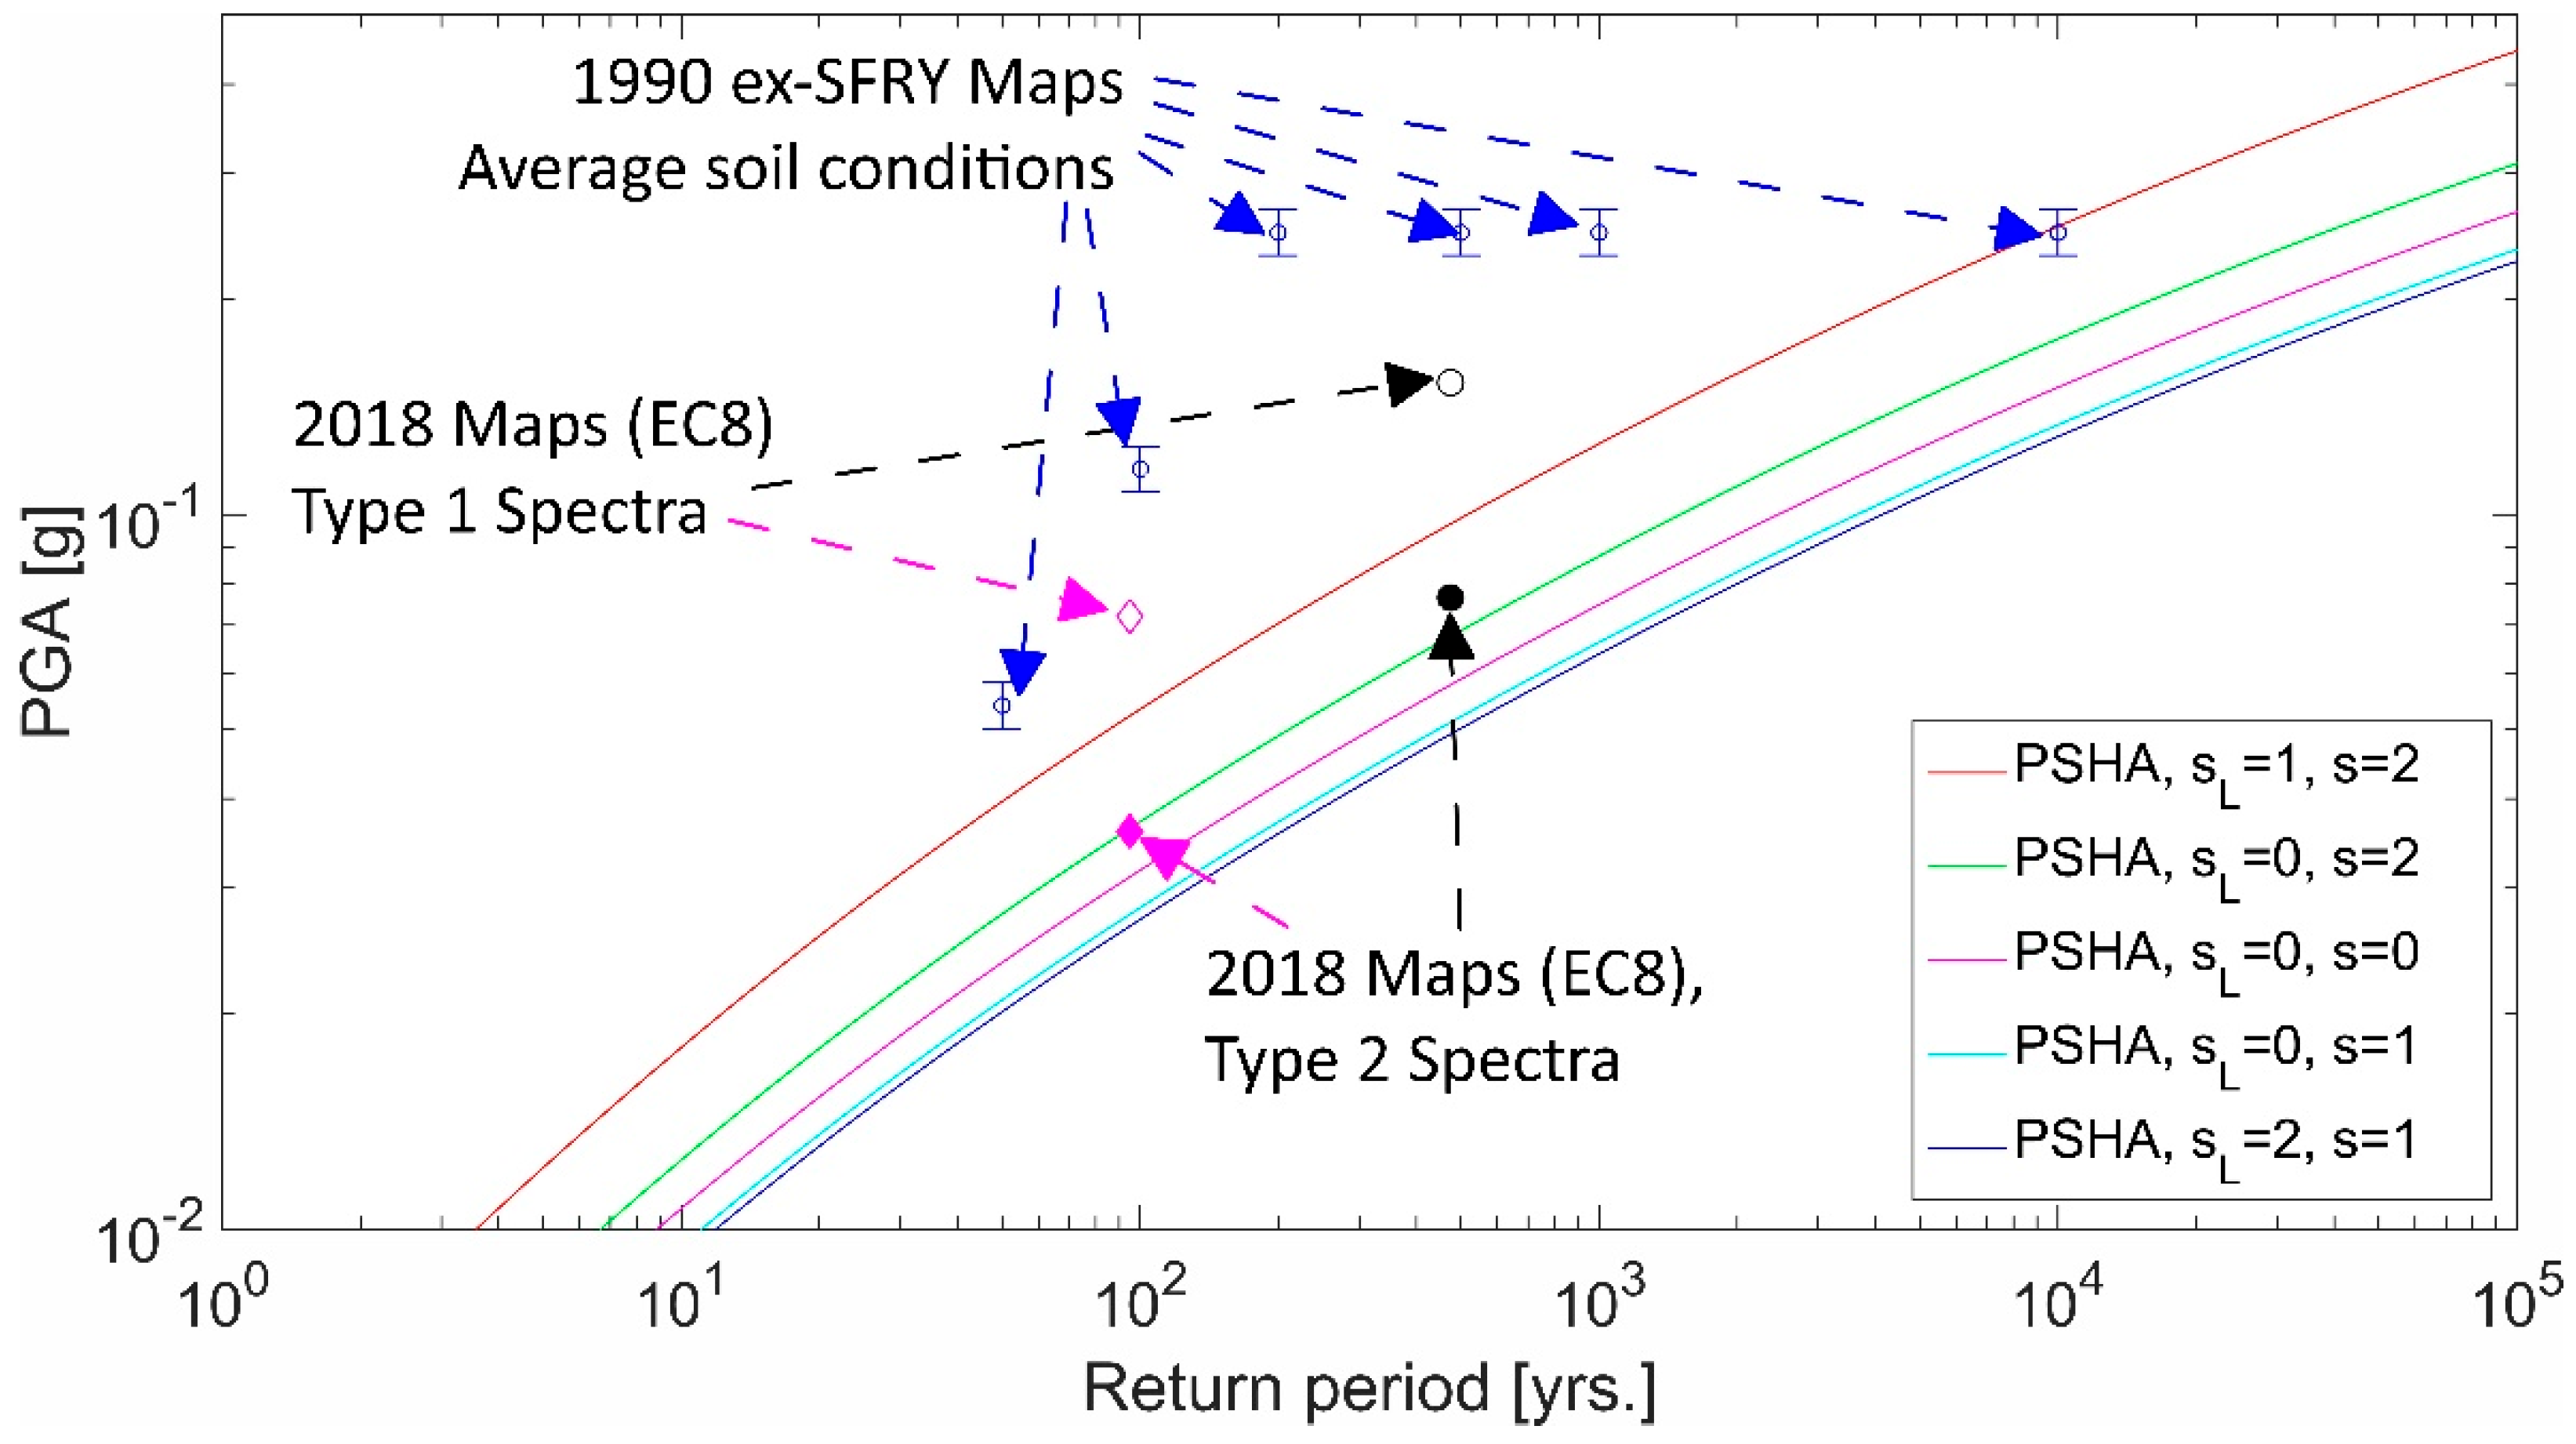
To verify our PSHA estimates of PGAvert, in Figure 7 we compare the hazard curves for the analyzed location in Banja Luka (coordinates 44°46.5′ N, 17°15′ E—see the solid blue circles in Figure 1 and Figure 5) with the PGAvert values given in Table 1. We will also compare our PSHA estimates to the PGAvert calculated based on the horizontal PGA from the 2018 hazard maps [34]. It is worth noting here that former Yugoslav official maps were given for the average local soil conditions [36,37,38,39] and that none of the regional official seismic hazard maps so far considered the deeper geological formations beneath the local soil.
We can see in Figure 7 that the PGAvert values pertaining to the former Yugoslav maps from 1990 [38] are significantly larger than our PGAvert estimates for all return periods except for 10,000 years. However, our PGAvert probabilistic estimates for deep geological rocks and “rock” soil sites agree very well with the 2018 maps [34].

5. Conclusions

With a population of around 180,000, Banja Luka is the cultural and financial center of the Republic of Srpska and the second most populated city in Bosnia and Herzegovina. The city is located between the Pannonian Basin and the Dinaric Alps and has scattered outcrops of geological rocks as well as areas of complex deep geology, in addition to areas with deep geological sediments. The city was struck by the catastrophic MW = 6.1 Banja Luka earthquake on 27 October 1969, when 60% of all buildings were damaged beyond repair [64]. This demands a constant re-evaluation and update of Banja Luka’s seismic hazard estimations, including vertical PGA values.
Regional attenuation equations for vertical PGA are first described, and then PSHA analyses were done using these GMPEs, which take into account both local soil conditions and deep geology. Despite the small number of accelerograms from the northwestern Balkans utilized to produce the GMPEs, the empirical estimates are highly consistent with observed intensities in Banja Luka.
The most important findings of this study can be summarized as follows:
  • Site conditions have a significant impact on the vertical PGA,
  • The deep geology effects are even greater than the local soil effects,
  • VHpga values are influenced by deep geology, local soil, source-to-site distance, and the probability level of empirical estimates,
  • Only the combination of stiff soil and deep geology rocks may produce a median empirical vertical PGA equivalent to that associated with VIII °MCS, which was the predominant intensity of the 1969 Earthquake in Banja Luka,
  • Vertical PGA probabilistic hazard estimates are dominated by local seismicity.
Furthermore, we should mention that the latest official (2018) hazard maps [34] provide PGA estimates that are comparable to our estimates of horizontal PGA for Banja Luka. It will be possible to obtain considerably better GMPEs only if the number of strong motion records in this region is increased. Until then, our results can be seen as a first step toward more realistic PHSA estimates for Banja Luka.

Author Contributions

Conceptualization, B.B., S.L. and S.B.; methodology, B.B. and S.L.; formal analysis, B.B., S.L., S.B. and M.K.; investigation, B.B., S.B., A.S.-Ć. and M.Š.; data curation, B.B.; writing—original draft preparation, B.B., S.L., S.B. and M.H.-N.; writing—review and editing, B.B., S.L., S.B., A.S.-Ć., M.Š. and M.H.-N.; visualization, B.B. All authors have read and agreed to the published version of the manuscript.

Funding

This research received no external funding.

Institutional Review Board Statement

Not applicable.

Informed Consent Statement

Not applicable.

Data Availability Statement

The original contributions presented in the study are included in the article, further inquiries can be directed to the authors.

Acknowledgments

The authors would like to thank the two anonymous reviewers for their insightful comments and suggestions, which lead to a significantly improved manuscript. For the first, third, fourth, and fifth authors, this research has been supported by the Ministry of Science, Technological Development and Innovation (Contract No. 451-03-137/2025-03/200156) and the Faculty of Technical Sciences, University of Novi Sad, through the project “Scientific and Artistic Research Work of Researchers in Teaching and Associate Positions at the Faculty of Technical Sciences, University of Novi Sad 2025” (No. 01-50/295).

Conflicts of Interest

The authors declare no conflicts of interest.

Abbreviations

The following abbreviations are used in this manuscript:
agHorizontal PGA value from the official seismic hazard map
EC8Eurocode 8
GMPEGround Motion Prediction Equations
PGAPeak Ground Acceleration
PGAvertPeak Ground Acceleration for vertical ground motion direction
PSHAProbabilistic Seismic Hazard Assessment
sDeep geology parameter
SSoil factor according to Eurocode 8
sLLocal soil parameter
TrReturn period
VHpgaVertical to horizontal PGA ratio
VSAverage shear wave velocity

References

  1. EN 1998-1:2004; Eurocode 8: Design of Structures for Earthquake Resistance. Part 1: General Rules, Seismic Actions and Rules for Buildings. CEN: Brussels, Belgium, 2004.
  2. Bulajić, B.Đ.; Pavić, G.; Hadzima-Nyarko, M. PGA vertical estimates for deep soils and deep geological sediments—A case study of Osijek (Croatia). Comput. Geosci. 2022, 158, 104985. [Google Scholar] [CrossRef]
  3. Nemutlu, Ö.F.; Sarı, A. Seismic Performance of the Kahramanmaraş Earthquakes: Ground Motion Prediction Models and the Role of Vertical Components. Bitlis Eren Üniversitesi Fen Bilim. Derg. 2025, 14, 610–632. [Google Scholar] [CrossRef]
  4. Nogoshi, M.; Igarashi, T. On the Amplitude Characteristics of Microtremor (Part 1). Zisin (J. Seismol. Soc. Japan. 2nd Ser.) 1970, 23, 281–303. [Google Scholar] [CrossRef]
  5. Nogoshi, M.; Igarashi, T. On the Amplitude Characteristics of Microtremor (Part 2). Zisin (J. Seismol. Soc. Japan. 2nd Ser.) 1971, 24, 26–40. [Google Scholar] [CrossRef]
  6. Nakamura, Y. Clear identification of fundamental idea of Nakamura’s technique and its applications. In Proceedings of the 12th World Conference on Earthquake Engineering, Auckland, New Zealand, 30 January–4 February 2000; pp. 1–8. [Google Scholar]
  7. Nakamura, Y. A method for Dynamic Characteristics Estimation of Subsurface Using Microtremor on The Ground Surface; Railway Technical Research Institute: Tokyo, Japan, 1989; pp. 25–30. [Google Scholar]
  8. Nakamura, Y. Real-time information systems for hazards mitigation. In Proceedings of the 11th World Conference on Earthquake Engineering, Acapulco, Mexico, 23–28 June 1996. [Google Scholar]
  9. Bonnefoy-Claudet, S.; Köhler, A.; Cornou, C.; Wathelet, M.; Bard, P.-Y. Effects of Love Waves on Microtremor H/V Ratio. Bull. Seismol. Soc. Am. 2008, 98, 288–300. [Google Scholar] [CrossRef]
  10. Trifunac, M.D.; Brady, A.G. On the correlation of seismic intensity scales with the peaks of recorded strong ground motion. Bull. Seismol. Soc. Am. 1975, 65, 139–162. [Google Scholar]
  11. Seed, H.B.; Murarka, R.; Lysmer, J.; Idriss, I.M. Relationships of maximum acceleration, maximum velocity, distance from source, and local site conditions for moderately strong earthquakes. Bull. Seismol. Soc. Am. 1976, 66, 1323–1342. [Google Scholar]
  12. Seed, H.B.; Ugas, C.; Lysmer, J. Site-dependent spectra for earthquake-resistant design. Bull. Seismol. Soc. Am. 1976, 66, 221–243. [Google Scholar] [CrossRef]
  13. Bulajić, B.Đ.; Bajić, S.; Stojnić, N. The effects of geological surroundings on earthquake-induced snow avalanche prone areas in the Kopaonik region. Cold Reg. Sci. Technol. 2018, 149, 29–45. [Google Scholar] [CrossRef]
  14. Bulajić, B.Đ.; Hadzima-Nyarko, M.; Pavić, G. Vertical to Horizontal UHS Ratios for Low to Medium Seismicity Regions with Deep Soil atop Deep Geological Sediments—An Example of the City of Osijek, Croatia. Appl. Sci. 2021, 11, 6782. [Google Scholar] [CrossRef]
  15. Bulajić, B.Đ.; Hadzima-Nyarko, M.; Pavić, G. Horizontal UHS Amplitudes for Regions with Deep Soil Atop Deep Geological Sediments—An Example of Osijek, Croatia. Appl. Sci. 2021, 11, 6296. [Google Scholar] [CrossRef]
  16. Bulajic, B.Đ.; Hadzima-Nyarko, M.; Pavic, G. PGA estimates for deep soils atop deep geological sediments—An example of Osijek, Croatia. Geomech. Eng. 2022, 30, 233–246. [Google Scholar] [CrossRef]
  17. Bulajić, B.Ð.; Manić, M.I.; Lađinović, Đ. Effects of shallow and deep geology on seismic hazard estimates: A case study of pseudo-acceleration response spectra for the northwestern Balkans. Nat. Hazards 2013, 69, 573–588. [Google Scholar] [CrossRef]
  18. Jordanovski, L.R.; Lee, V.W.; Manić, M.I.; Olumčeva, T.; Sinadnovski, C.; Todorovska, M.I.; Trifunac, M.D. Strong Earthquake Ground Motion Data in EQINFOS: Yugoslavia. Part I.; Department of Civil Engineering, University of Southern California: Los Angeles, CA, USA, 1987. [Google Scholar]
  19. Lee, V.W. Influence of Local Soil and Geologic Site Conditions on Pseudo Relative Velocity Spectrum Amplitudes of Recorded Strong Motion Accelerations; Department of Civil Engineering, University of Southern California: Los Angeles, CA, USA, 1987. [Google Scholar]
  20. Trifunac, M.; Lee, V.; Živčić, M.; Manić, M. On the correlation of Mercalli-Cancani-Sieberg intensity scale in Yugoslavia with the peaks of recorded strong earthquake ground motion. Eur. Earthq. Eng. 1991, 5, 27–33. [Google Scholar]
  21. Lee, V.; Trifunac, M. Empirical scaling of Fourier amplitude spectra in former Yugoslavia. Eur. Earthq. Eng. 1993, 7, 47–61. [Google Scholar]
  22. Lee, V.W.; Manić, M.I. Empirical scaling of response spectra in former Yugoslavia. In Proceedings of the 10th European Conference on Earthquake Engineering, Vienna, Austria, 28 August–2 September 1994; pp. 2567–2572. [Google Scholar]
  23. Lee, V.W.; Trifunac, M.D.; Bulajić, B.Đ. Seismic microzoning in Novi Sad, Serbia—A case study in a low-seismicity region that is exposed to large and distant earthquakes. J. Seismol. 2023, 27, 979–997. [Google Scholar] [CrossRef]
  24. Lee, V.W.; Trifunac, M.D.; Bulajić, B.Đ. Seismic hazard mapping for peak ground velocity: Microzonation of Novi Sad, Serbia—A case study in a low-seismicity region exposed to large and distant earthquakes. J. Seismol. 2025, 29, 85–105. [Google Scholar] [CrossRef]
  25. Lee, V.W.; Trifunac, M.D.; Bulajić, B.Đ.; Manić, M.I.; Herak, D.; Herak, M. Seismic microzoning of Belgrade. Soil Dyn. Earthq. Eng. 2017, 97, 395–412. [Google Scholar] [CrossRef]
  26. Lee, V.W.; Trifunac, M.D.; Bulajić, B.D.; Manić, M.I.; Herak, D.; Herak, M.; Dimov, G. Seismic microzoning in Skopje, Macedonia. Soil Dyn. Earthq. Eng. 2017, 98, 166–182. [Google Scholar] [CrossRef]
  27. Lee, V.W.; Trifunac, M.D.; Bulajić, B.Đ.; Manić, M.I.; Herak, D.; Herak, M.; Dimov, G.; Gičev, V. Seismic microzoning of Štip in Macedonia. Soil Dyn. Earthq. Eng. 2017, 98, 54–66. [Google Scholar] [CrossRef]
  28. Ustaszewski, K.; Herak, M.; Tomljenović, B.; Herak, D.; Matej, S. Neotectonics of the Dinarides–Pannonian Basin transition and possible earthquake sources in the Banja Luka epicentral area. J. Geodyn. 2014, 82, 52–68. [Google Scholar] [CrossRef]
  29. USGS. Earthquake Catalogue for all Earthquakes with Mw ≥ 3.0 in the Period Between 1900 and April 2025 for the Geographic Region Between 41° N and 47° N, and 13° E and 23° E; USGS: Reston, VA, USA, 2025.
  30. EMSC-CSEM. M 5.4–CROATIA–2020-03-22 05:24:02 UTC. Available online: https://www.emsc-csem.org/Earthquake/earthquake.php?id=840695#scientific (accessed on 17 April 2025).
  31. Ganas, A.; Elias, P.; Valkaniotis, S.; Tsironi, V.; Karasante, I.; Briole, P. Petrinja Earthquake Moved Crust 10 Feet. Available online: https://temblor.net/earthquake-insights/petrinja-earthquake-moved-crust-10-feet-12410/ (accessed on 17 April 2025).
  32. Lee, V.W.; Manić, M.I.; Bulajić, B.Ð.; Herak, D.; Herak, M.; Trifunac, M.D. Microzonation of Banja Luka for performance-based earthquake-resistant design. Soil Dyn. Earthq. Eng. 2015, 78, 71–88. [Google Scholar] [CrossRef]
  33. Mojičević, M.; Vilovski, S.; Tomić, B. Basic Geological Map–Banja Luka, L33-119; Federal Geologal Survey: Belgrade, Serbia, 1976. [Google Scholar]
  34. BAS EN 1998-1/NA:2018; Seismic Zone Maps and Reference Ground Accelerations Therein of B&H. Maps Accompanying National Annexes (NA): Bosnia and Herzegovina, 2018. Available online: http://eurokodovi.ba/seizmika/ (accessed on 1 May 2025).
  35. Ademović, N.; Demir, V.; Cvijić-Amulić, S.; Málek, J.; Prachař, I.; Vackář, J. Compilation of the seismic hazard maps in Bosnia and Herzegovina. Soil Dyn. Earthq. Eng. 2021, 141, 106500, Erratum in Soil Dyn. Earthq. Eng. 2023, 164, 107633. [Google Scholar] [CrossRef]
  36. SFRY. Temporary Technical Regulations for Construction in Seismic Areas; 39/64; Official Gazette of SFRY: Belgrade, Serbia, 1964. [Google Scholar]
  37. SFRY. Book of Rules on Technical Norms for Construction of High-Rise Buildings in Seismic Regions; 31/81, 49/82; Official Gazette of SFRY: Belgrade, Serbia, 1982. [Google Scholar]
  38. SFRY. Book of Rules on Technical Norms for Construction of High-Rise Buildings in Seismic Regions; 31/81, 49/82, 29/83, 21/88, 52/90; Official Gazette of SFRY: Belgrade, Serbia, 1990. [Google Scholar]
  39. SFRY. Book of Rules on Technical Norms for Construction of High-Rise Buildings in Seismic Regions; 31/81; Official Gazette of SFRY: Belgrade, Serbia, 1981. [Google Scholar]
  40. Lee, V.; Trifunac, M.; Herak, M.; Živčič, M.; Herak, D. MLSM computed from strong motion accelerograms recorded in Yugoslavia. Earthq. Eng. Struct. Dyn. 1990, 19, 1167–1179. [Google Scholar] [CrossRef]
  41. Datta, T.K. Seismic Analysis of Structures; John Wiley & Sons (Asia) Pte Ltd.: Singapore, 2010; p. 464. [Google Scholar]
  42. Herak, M. Conversion between the local magnitude (ML) and the moment magnitude (Mw) for earthquakes in the Croatian Earthquake Catalogue. Geofizika 2020, 37, 197–211. [Google Scholar] [CrossRef]
  43. Scordilis, E.M. Empirical Global Relations Converting MS and mb to Moment Magnitude. J. Seismol. 2006, 10, 225–236. [Google Scholar] [CrossRef]
  44. Das, R.; Sharma, M.L.; Wason, H.R.; Choudhury, D.; Gonzalez, G. A Seismic Moment Magnitude Scale. Bull. Seismol. Soc. Am. 2019, 109, 1542–1555. [Google Scholar] [CrossRef]
  45. Das, R.; Das, A. Limitations of Mw and M Scales: Compelling Evidence Advocating for the Das Magnitude Scale (Mwg)—A Critical Review and Analysis. Indian Geotech. J. 2025, in press. [Google Scholar] [CrossRef]
  46. Ambraseys, N.; Douglas, J.; Margaris, B.; Sigbjörnsson, R.; Berge-Thierry, C.; Suhadolc, P.; Costa, G.; Smit, P. Dissemination of European strong-motion data. In Proceedings of the 13th World Conference on Earthquake Engineering, Vancouver, BC, Canada, 1–6 August 2004. [Google Scholar]
  47. Ambraseys, N.; Douglas, J.; Margaris, B.; Sigbjörnsson, R.; Smit, P.; Suhadolc, P. Internet site for European strong motion data. In Proceedings of the 12th European Conference on Earthquake Engineering, London, UK, 9–13 September 2002. [Google Scholar]
  48. Bilgin, H.; Hysenlliu, M. Comparison of near and far-fault ground motion effects on low and mid-rise masonry buildings. J. Build. Eng. 2020, 30, 101248. [Google Scholar] [CrossRef]
  49. Bulajić, B.Đ.; Lozančić, S.; Bajić, S.; Radu, D.; Işık, E.; Negovanović, M.; Hadzima-Nyarko, M. UHS estimates for vertical strong ground motion and varying deep geological site surroundings—A case study of the city of Banja Luka. Appl. Sci. 2025. submitted for publication. [Google Scholar]
  50. Bulajić, B.Đ.; Lozančić, S.; Bajić, S.; Radu, D.; Işık, E.; Negovanović, M.; Hadzima-Nyarko, M. Horizontal UHS predictions for varying deep geology conditions—A case study of the city of Banja Luka. Sustainability 2025. submitted for publication. [Google Scholar]
  51. Bulajić, B.Đ.; Lozančić, S.; Bajić, S.; Starčev-Ćurčin, A.; Šešlija, M.; Kovačević, M.; Hadzima-Nyarko, M. Horizontal PGA estimates for varying deep geological conditions—A case study of Banja Luka. Appl. Sci. 2025. submitted for publication. [Google Scholar]
  52. Chioccarelli, E.; Cito, P.; Iervolino, I.; Giorgio, M. REASSESS V2.0: Software for single- and multi-site probabilistic seismic hazard analysis. Bull. Earthq. Eng. 2019, 17, 1769–1793. [Google Scholar] [CrossRef]
  53. McGuire, R.K. FORTRAN Computer Program for Seismic Risk Analysis; US Geological Survey: Reston, VA, USA, 1976; pp. 67–76. [Google Scholar]
  54. Cornell, C.A. Engineering seismic risk analysis. Bull. Seismol. Soc. Am. 1968, 58, 1583–1606. [Google Scholar] [CrossRef]
  55. Giardini, D.; Woessner, J.; Danciu, L.; Crowley, H.; Cotton, F.; Grünthal, G.; Pinho, R.; Valensise, L.; Consortium, S. European Seismic Hazard Map for Peak Ground Acceleration, 10% Exceedance Probabilities in 50 years; Swiss Seismological Servise: Zurich, Switzerland, 2013. [Google Scholar]
  56. Woessner, J.; Laurentiu, D.; Giardini, D.; Crowley, H.; Cotton, F.; Grünthal, G.; Valensise, G.; Arvidsson, R.; Basili, R.; Demircioglu, M.B.; et al. The 2013 European Seismic Hazard Model: Key components and results. Bull. Earthq. Eng. 2015, 13, 3553–3596. [Google Scholar] [CrossRef]
  57. Pagani, M.; Garcia-Pelaez, J.; Gee, R.; Johnson, K.; Poggi, V.; Styron, R.; Weatherill, G.; Simionato, M.; Viganò, D.; Danciu, L.; et al. Global Earthquake Model (GEM) Seismic Hazard Map (Version 2018.1–December 2018); GEM Foundation: Pavia, Italy, 2018. [Google Scholar]
  58. Stucchi, M.; Rovida, A.; Gomez Capera, A.A.; Alexandre, P.; Camelbeeck, T.; Demircioglu, M.B.; Gasperini, P.; Kouskouna, V.; Musson, R.M.W.; Radulian, M.; et al. The SHARE European Earthquake Catalogue (SHEEC) 1000–1899. J. Seismol. 2013, 17, 523–544. [Google Scholar] [CrossRef]
  59. Grünthal, G.; Wahlström, R.; Stromeyer, D. The SHARE European Earthquake Catalogue (SHEEC) for the time period 1900–2006 and its comparison to the European-Mediterranean Earthquake Catalogue (EMEC). J. Seismol. 2013, 17, 1339–1344. [Google Scholar] [CrossRef]
  60. Grünthal, G.; Wahlström, R. The European-Mediterranean Earthquake Catalogue (EMEC) for the last millennium. J. Seismol. 2012, 16, 535–570. [Google Scholar] [CrossRef]
  61. Lee, V.W.; Trifunac, M.D.; Bulajić, B.; Manić, M. A preliminary empirical model for frequency-dependent attenuation of Fourier amplitude spectra In Serbia from the Vrancea earthquakes. Soil Dyn. Earthq. Eng. 2016, 83, 167–179. [Google Scholar] [CrossRef]
  62. Lee, V.W.; Trifunac, M.D.; Bulajić, B.Đ.; Manić, M.I. Preliminary empirical scaling of pseudo relative velocity spectra in Serbia from the Vrancea earthquakes. Soil Dyn. Earthq. Eng. 2016, 86, 41–54. [Google Scholar] [CrossRef]
  63. Bazzurro, P.; Allin Cornell, C. Disaggregation of seismic hazard. Bull. Seismol. Soc. Am. 1999, 89, 501–520. [Google Scholar] [CrossRef]
  64. Trkulja, D. Earthquakes in Banja Luka. In Proceedings of the International Conference on Earthquake Engineering, Banja Luka, Bosnia and Herzegovina, 26–28 October 2009; pp. 43–57. [Google Scholar]
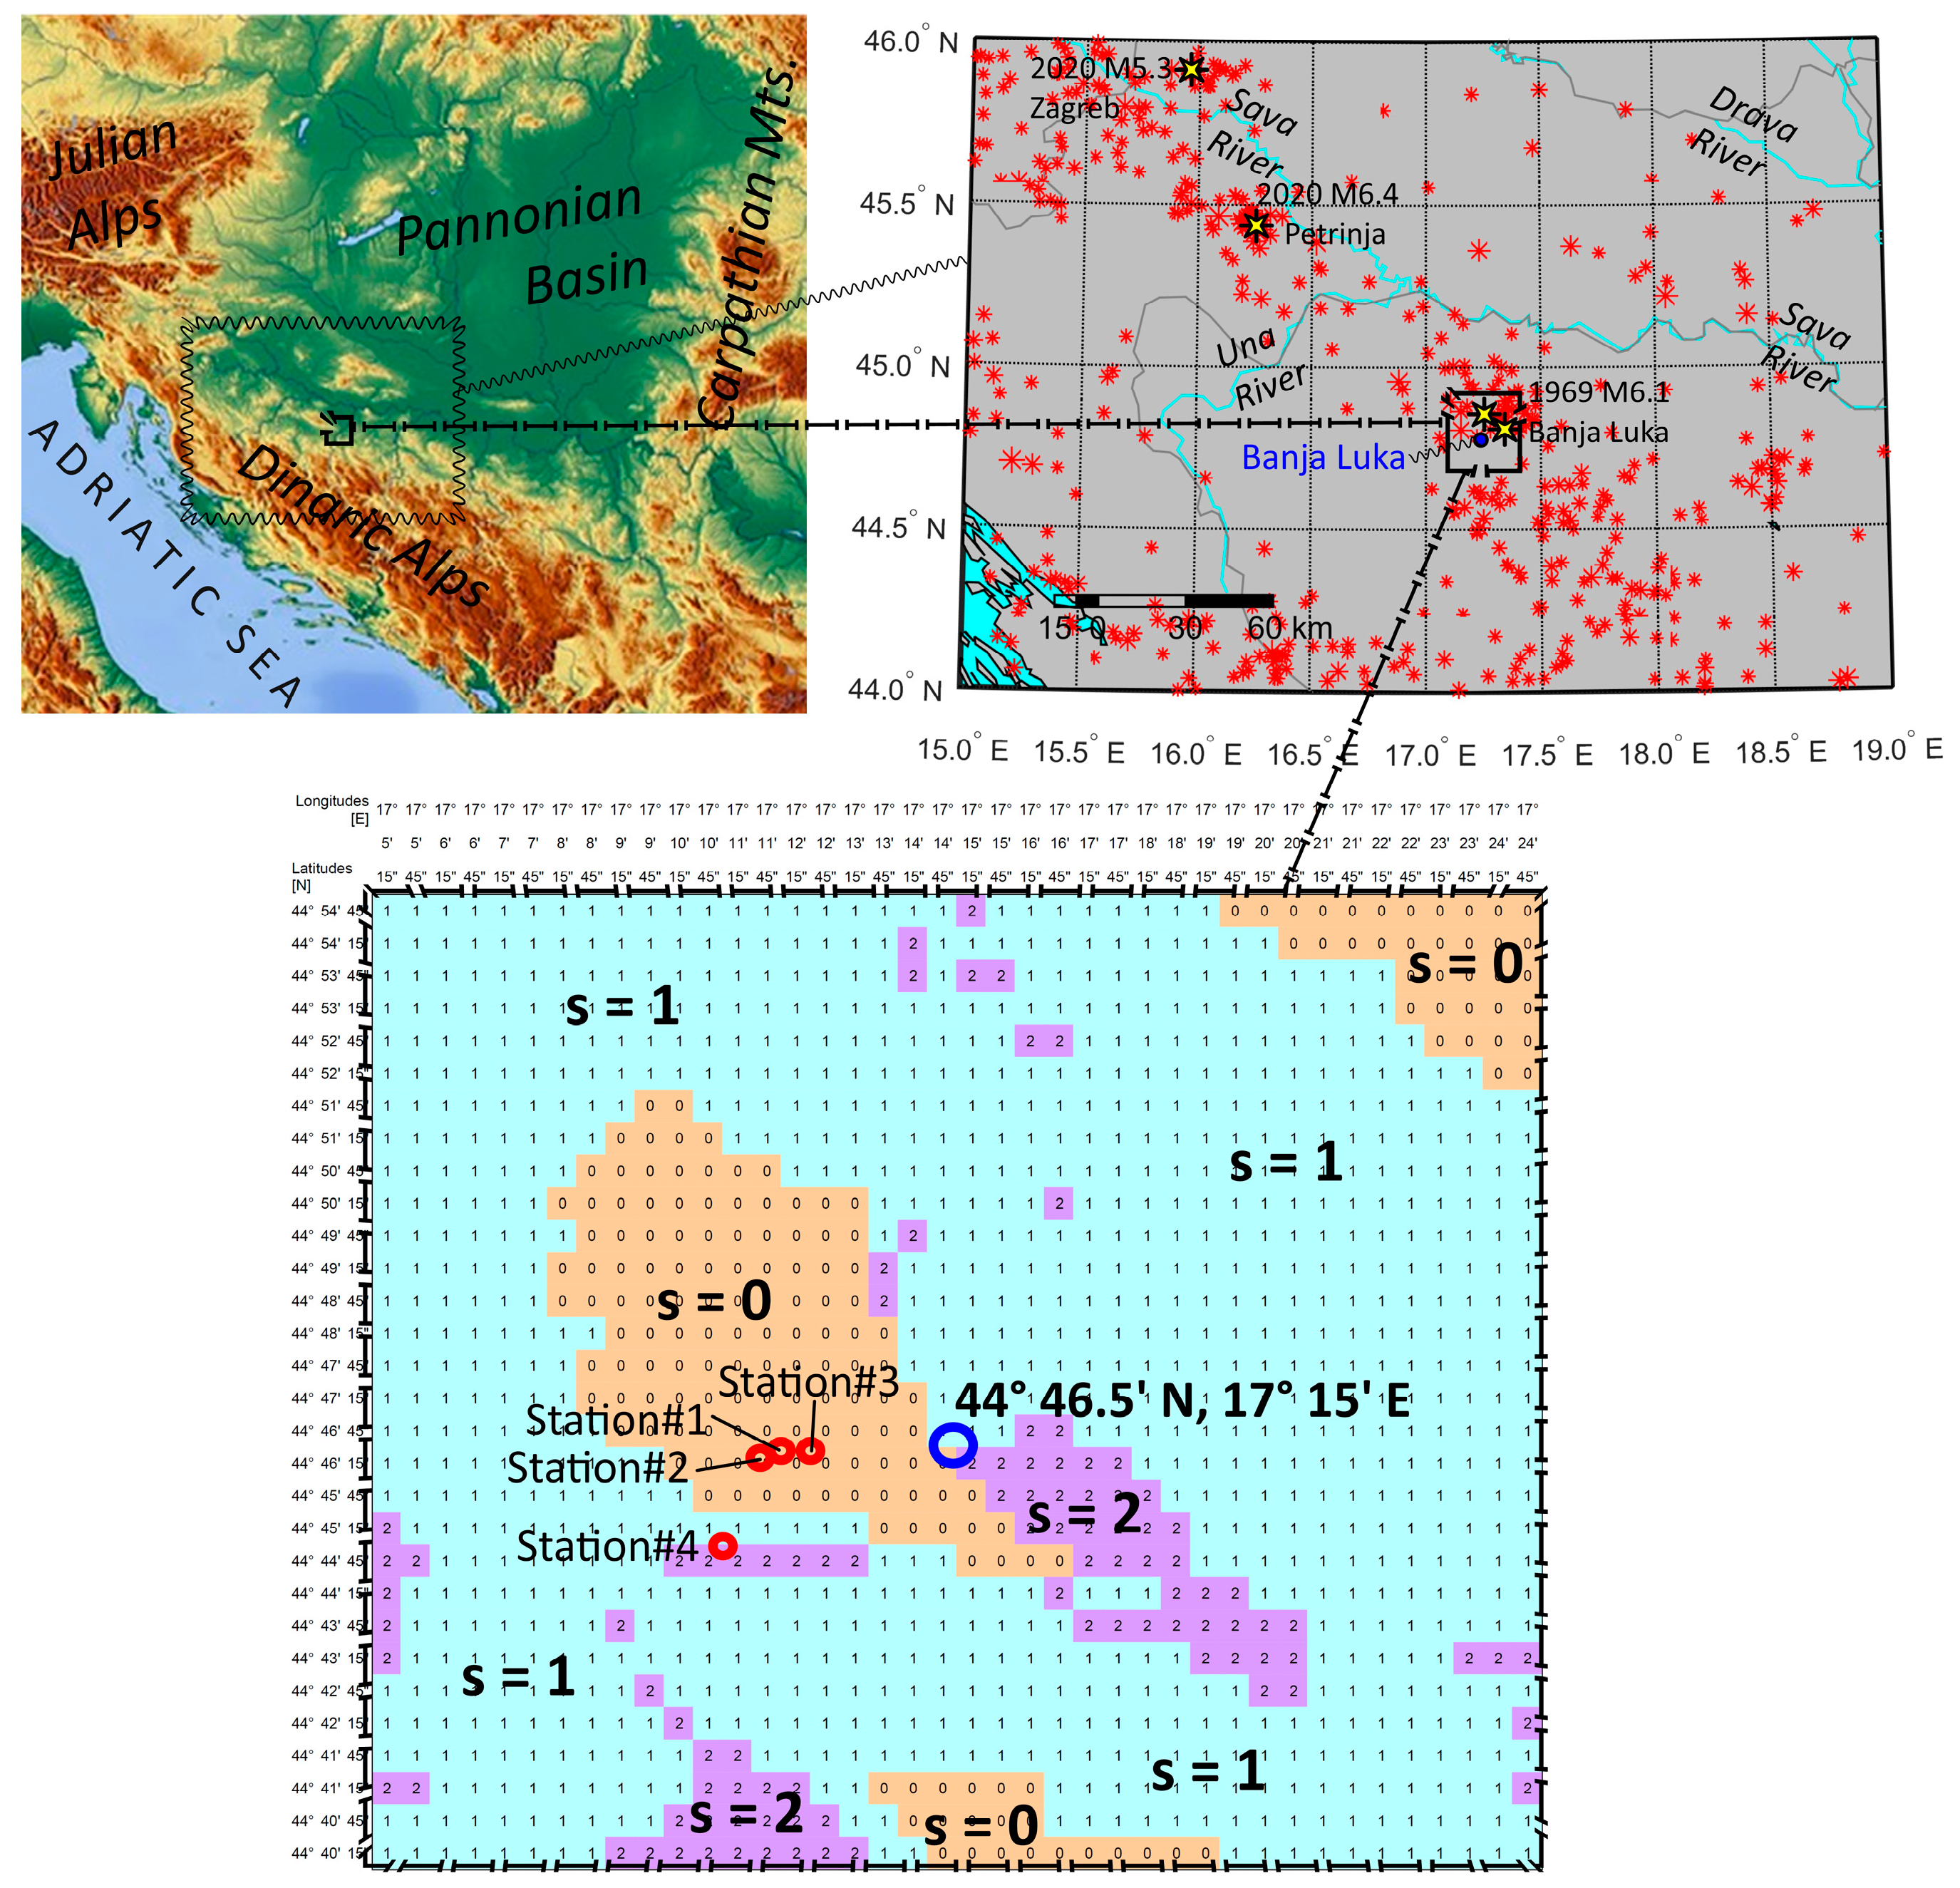
Figure 1. (Top left)—Dinaric Alps and Pannonian Basin, (top right)—epicenters of earthquakes with MW ≥ 3.0 recorded in the period of 1900—April 2025 [29] (red stars), including the largest historical event occurring close to Banja Luka and two recent destructive events in Croatia (yellow stars), (bottom)—the distribution of deep geology [10] parameters (s = 0 designates deep geological sediments, s = 1 complex or intermediate deep geology conditions, and s = 2 the rocks) for the rectangle between 44°40′ N and 44°55′ N, and 17°05′ E and 17°25′ E, modified from [32]. Blue circle shows the analyzed location in Banja Luka. Red circles show four accelerograph stations in Banja Luka that recorded strong ground motion time histories in the past.
Applsci 15 06542 g001
Figure 2. The empirical GMPEs for PGAvert, defined by Equations (3) (solid lines) and (4) (dashed lines), for different deep geology and local soil combinations (see Table 4). The gray area shows the 95% confidence interval (median ± 2∙σlog empirical PGAvert estimates) for sL = 2.
Applsci 15 06542 g002
Figure 3. The PGAvert values recorded by four different accelerograph stations in Banja Luka (see the red circles in Figure 1) vs. the median and median ± σlog empirical PGAvert estimates, which were calculated using Equation (3). The 95% confidence interval (median ± 2∙σlog empirical PGAvert estimates) is displayed by the gray area.
Applsci 15 06542 g003
Figure 4. VHpga values for source-to-site distances up to 100 km and different deep geology and local soil types, calculated by using Equations (3) (solid lines) and (4) (dashed lines), and corresponding equations for the horizontal direction [51].
Applsci 15 06542 g004
Figure 5. The seismic source zones from the SHARE Project [55,56,57] used to evaluate the PSHA for the site with coordinates 44°46.5′ N, 17°15′ E in Banja Luka.
Applsci 15 06542 g005
Figure 6. Seismic hazard disaggregation for location 44°46.5′ N, 17°15′ E (see Figure 1 and Figure 5) and four different probabilities of exceedance of PGA estimates.
Applsci 15 06542 g006
Figure 7. A comparison of the PGAvert values for the location with coordinates 44°46.5′ N, 17°15′ E, in Banja Luka, calculated for different return periods, to the PGAs based on current official hazard maps for Bosnia and Herzegovina [34] and the VHpga suggested by Eurocode 8 [1]. PGAvert estimates based on the macroseismic intensity degrees from ex-Yugoslav maps [38] are also shown.
Applsci 15 06542 g007
Table 1. The vertical PGA estimates calculated using Equation (1) for Banja Luka, based on the intensities depicted in the official zoning maps of the former Yugoslavia [36,37,38,39]. The vertical PGA values estimated using horizontal values from the 2018 official maps, which are used in conjunction with Eurocode 8 [34], are also given.
Official Zoning MapI [°MCS]PGA [g]
1950VII0.052–0.056
1982VIII0.112–0.120
1990—50 yrs.VII0.052–0.056
1990—100 yrs.VIII0.112–0.120
1990—200 yrs.IX0.239–0.257
1990—500 yrs.IX0.239–0.257
1990—1000 yrs.IX0.239–0.257
1990—10,000 yrs.IX0.239–0.257
2018—95 yrs.VI–VIII0.036–0.072
2018—475 yrs.VII–IX0.077–0.153
Table 2. Vertical empirical estimates of PGA and empirical VHpga computed by Equation (1) for different macroseismic intensities.
IPGA [g]VHpga
−1σMedian+1σ−1σMedian+1σ
V °MCS0.01130.01180.01220.5300.4910.455
VI °MCS0.02430.02520.02610.5820.5400.500
VII °MCS0.05210.05400.05600.6400.5930.550
VIII °MCS0.11150.11570.12010.7030.6520.604
IX °MCS0.23900.24800.25730.7730.7160.664
X °MCS0.51220.53150.55140.8490.7870.729
Table 3. The vertical PGA according to various design codes and researchers based on the horizontal PGA value, ag, as provided for the analyzed site on the corresponding seismic hazard map.
Eurocode 8 [1] Ground TypesVertical PGA
Eurocode 8, Type 1 Spectrum (MS > 5.5), all ground types [1]ag × 0.900
Eurocode 8, Type 2 Spectrum (MS ≤ 5.5), all ground types [1]ag × 0.450
1964 code of former Yugoslavia [36]ag × 0.330
1981 code of former Yugoslavia [39]ag × 0.700
GMPEs for California, USA [19], geological rocksag × 0.760
GMPEs for California, USA [19], intermediate geological sitesag × 0.718
GMPEs for California, USA [19], geological sedimentsag × 0.681
GMPEs for former Yugoslavia [22], all deep geology typesag × 0.720
Table 4. Categorical variables from Equations (2)–(4) for shallow and deeper geological site conditions.
Local Soil
Parameters
Local Soil
Categorical Variables
Deep Geology
Parameters
Deep Geology
Categorical Variables
“Rock” soil sites:
sL = 0
SL1 = SL2 = 0Basement (geological) rock:
s = 2
SG1 = SG2 = 0
Stiff soil sites:
sL = 1
SL1 = 1 and SL2 = 0Intermediate (or complex) sites:
s = 1
SG1 = 1 and SG2 = 0
Deep soil sites:
sL = 2
SL1 = 0 and SL2 = 1(Deep geological) Sediments:
s = 0
SG1 = 0 and SG2 = 1
Disclaimer/Publisher’s Note: The statements, opinions and data contained in all publications are solely those of the individual author(s) and contributor(s) and not of MDPI and/or the editor(s). MDPI and/or the editor(s) disclaim responsibility for any injury to people or property resulting from any ideas, methods, instructions or products referred to in the content.