Article

Acute Biomechanical and Physiological Responses with Concurrent Aerobic and Anaerobic Swimming Training

by
Ioannis S. Nikitakis
1,
Gavriil G. Arsoniadis
1 and
Argyris G. Toubekis
2,*
1
Division of Aquatic Sports, School of Physical Education and Sports Science, National and Kapodistrian University of Athens, 17237 Athens, Greece
2
Division of Aquatic Sports, Sports Performance Laboratory, School of Physical Education and Sports Science, National and Kapodistrian University of Athens, 17237 Athens, Greece
*
Author to whom correspondence should be addressed.
Appl. Sci. 2025, 15(12), 6522; https://doi.org/10.3390/app15126522
Submission received: 14 April 2025 / Revised: 26 May 2025 / Accepted: 4 June 2025 / Published: 10 June 2025
(This article belongs to the Special Issue Recent Advances in Applied Biomechanics and Sports Sciences)

Abstract

This study aimed to compare stroke rate (SR), stroke length (SL), and stroke index (SI) during aerobic-dominated training sets applied at speed corresponding to lactate threshold (LT) or to maximum aerobic speed (MAS) and following repeated sprints (SPR). Twelve male swimmers performed four sessions in a randomized order: (i) LT, (ii) SPR-LT, (iii) MAS, and (iv) SPR-MAS. Set LT consisted of 8 × 200 m at a speed corresponding to the lactate threshold (30 s recovery). Set MAS included 8 × 100 m at the maximal aerobic speed (30 s recovery). Set SPR included 8 × 25 m at maximal intensity (2 min recovery). Blood lactate (BL), SR, SL, SI, and rate of perceived exertion (RPE) were measured. SR, SL, and SI did not differ between LT and SPR-LT sessions (p > 0.05). In the SPR-MAS session, SR was higher and SL was lower compared to the MAS session (p < 0.05), while SI did not differ between the sessions (p > 0.05). BL at the start of LT and MAS and RPE at the end of sets were higher in the SPR-LT and SPR-MAS sessions (p < 0.05). BL and RPE were correlated with SR in 8 × 200 m during the SPR-LT session (p < 0.05). Repeated sprints may change the biomechanical and physiological response during a subsequent training set performed at MAS while preserving technical efficiency.

1. Introduction

During a swimming training session, various sets of repetitions may be included and applied at different exercise-intensity domains [1]. Maintaining performance in these training sets relies on the effectiveness of optimal limb coordination, which must remain consistent across consecutive stroke cycles [2]. Since 85% of the propulsive force in swimming is derived from the upper limbs [3], the effectiveness of upper limb coordination can be assessed through stroke rate (SR) and stroke length (SL) [4]. The aforementioned biomechanical variables are considered useful for monitoring swimming techniques [4], along with the stroke index (SI: the product of SL multiplied by swimming speed), which is strongly associated with low energy cost [5].
A decrease in SL and an increase in SR have been observed as swimming intensity increases [6,7]. Such modifications in biomechanical parameters are suggested to occur alongside changes in blood lactate concentration (BL) during incremental swimming [8,9]. Significant alterations in SR and SL have notably been observed around the maximal lactate steady state [7] or lactate threshold (LT) intensity [10]. The metabolic imbalance that occurs when swimming above LT (which delineates the transition between moderate and heavy intensity exercise [11]) is proposed as a key factor contributing to adjustments in SR and SL [7,12], likely serving as a compensatory mechanism to counteract hydrodynamic drag [13].
Specifically, swimming at a speed 2.5% above the maximal lactate steady state forced swimmers to adopt a higher SR to compensate for the loss of SL. In comparison, no difference was observed at intensity 2.5% lower than the maximal lactate steady state [7]. The decrease in SL as a function of speed resulted in a decrease in SI, indicating the importance of the ability to maintain technical efficiency as exercise intensity increases [7]. The abovementioned reports are in accordance with other studies at imposed paces [6,14,15]. Although no difference was observed over time in biomechanical parameters while swimming at the maximal lactate steady state intensity [6], a 3.3% decrease in SL and a 3.6% increase in SR may be meaningful. The latter was confirmed by Pelarigo and colleagues [7], who highlighted an increase in SR and a decline in SL and SI at the end of continuous swimming compared to the very start of the trial. These biomechanical adaptations may also be influenced by the physiological impact of localized muscle fatigue [6].
A metabolic imbalance may arise not only due to increasing swimming intensity but also as a consequence of a preceding high-intensity training set [16,17]. Specifically, repeated sprints performed as the initial set in a training session may alter the metabolic environment, subsequently affecting an aerobic-dominated training set conducted at intensities around the LT and the maximal aerobic speed (MAS) [16,17]. Such a substantial alteration in metabolic conditions may trigger neural feedback mediated by thin-fiber muscle afferents, leading to an inhibitory response in central motor drive [18]. This response is expressed as increased perceived exertion, enabling swimmers to sustain the required speed. Regardless of the underlying mechanism, swimmers naturally self-optimize their movement patterns to maintain performance levels while experiencing fatigue [12]. This optimization process can be observed through adjustments in SR and SL [2]. Furthermore, swimming efficiency and fatigue-induced modifications can be evaluated using the SI, where a decline in SI reflects reduced efficiency, whereas an increase indicates improved efficiency [5].
The purpose of this study was to compare the biomechanical responses (SR, SL, SI) during aerobic-dominated training sets when performed following repeated sprints versus when conducted as the initial set of a training session. It was hypothesized that preceding repeated sprints would lead to an increase in SR and a decrease in SL and SI during subsequent training sets, primarily relying on aerobic metabolism.

2. Materials and Methods

2.1. Participants

Twelve male swimmers (age: 19 ± 3 years, body mass: 77.1 ± 11.0 kg, height: 180.0 ± 5.6 cm) participated in the study. The swimmers were highly trained, national-level athletes [19], with their best performances in the 200 m front crawl ranking at or above the 90th percentile of the national record and the 84th percentile of the world record (121.5 ± 6.6 s, 615 ± 88 World Aquatics points). A priori power analysis using G*Power 3.1 statistical package indicated a required sample size of n = 10, given error probability (0.05), power (0.80), and a medium effect size (Cohen’s f: 0.25) [20]. Considering the sample size in the present study (n = 12) and a corresponding minimum partial eta-squared for the main effects (η2p = 0.08), a post hoc statistical power analysis was calculated to 0.99. All tests were carried out during the mesocycle of specific preparation (10–15 weeks before the national championship) and applied the same time of day, at least 48 h apart, in a 25 m indoors swimming pool with constant water and ambient temperature (24–25 °C and 27–28 °C, respectively). The swimmers agreed to participate by signing a written informed consent before the commencement of the study, which had received approval from the institutional ethical committee (1351/03-03-2022).

2.2. Preliminary Tests

Prior to each test, the swimmers completed a standardized warm up consisting of 400 m front crawl, 200 m front crawl drills, 4 × 50 m front crawl at pace 80% of personal best 400 m, and a 12.5 m sprint. During the first testing session, the swimmers performed two all-out efforts, specifically 25 and 400 m front crawl, starting with push off from inside the pool. These efforts were separated by 10 min of active recovery and 20 min of passive recovery. Performance time in the 25 and 400 m tests was used to assess maximal speed and MAS [21]. In the second training session, the swimmers completed five evenly paced repetitions of 200 m front-crawl (5 × 200 m), performed in 5 min cycles with progressively increasing speed in each repetition, starting from a push off inside the pool [22]. The completion time for each 200 m repetition was recorded by two independent researchers using a digital stopwatch (FINIS 3X300, Finis Inc., Livermore, CA, USA). Fingertip capillary blood samples were collected within the first 30 s of recovery following each 200 m repetition and analyzed for BL using a portable lactate analyzer (Lactate Scout+, SensLab GmbH, Leipzig, Germany). Individual speed vs. BL curves were drawn and used for the determination of the speed corresponding to LT by the x-axis projection of the intersection of the lines connecting the higher and lower points of the speed vs. lactate curve [22].

2.3. Study Design

The data collected during preliminary testing were utilized to design training sets with the following characteristics: (a) Set LT consisted of eight repetitions of 200 m (8 × 200 m) performed at an intensity corresponding to the speed at LT, with 30 s recovery intervals between repetitions [23]; (b) set MAS comprised eight repetitions of 100 m (8 × 100 m) at an intensity corresponding to MAS with 30 s recovery periods [24]; and (c) set SPR included eight repetitions of 25 m (8 × 25 m) sprint swimming (maximum effort), with 2 min recovery intervals, corresponding to a, i.e., 1:8 swimming-to-recovery ratio [25]. The LT and MAS intensities were chosen, since they represent the boundaries between different exercise intensity domains frequently used in swimming training [26], while the swimming distance in each training set was used based on previous reports proposing a training volume of about 1600–2000 m in heavy intensity (e.g., LT) and 800–1000 m in severe intensity (e.g., MAS) to improve aerobic endurance [1]. The rest intervals were short enough (i.e., 30 s) to maintain increased aerobic contribution in the LT and MAS sets and long enough (i.e., 2 min) to allow adequate PCr resynthesis in the SPR set [27,28].
In a crossover design, four training sessions performed in a randomized order, incorporating the aforementioned training sets: (i) set LT (session LT), (ii) set SPR, followed by set LT (session SPR-LT), (iii) set MAS (session MAS), and (iv) set SPR, followed by set MAS (session SPR-MAS). A 10 min passive recovery period was implemented between sets in sessions SPR-LT and SPR-MAS, allowing adequate but not complete recovery to ensure ecological validity of real training conditions. The design of the study is illustrated in Figure 1.

2.4. Measurements

Performance was assessed based on swimming time. SR was calculated by the time to complete three arm stroke cycles (expressed in cycles per minute), and SL was calculated by dividing the swimming speed every 50 m by SR (m·cycle−1). SR and SL were measured in each 50 m a of each repetition during the 8 × 200 m and 8 × 100 m while representing excellent reliability (ICC: >0.90) [29]. SI was calculated by multiplying SL by speed in each 50 m during 8 × 200 m and 8 × 100 m [5]. BL was assessed before and at the end of each set (30 s after the completion of each training set). The rate of the perceived exertion at a scale of 0–10 (RPE) was recorded after each repetition.

2.5. Statistical Analysis

Normal distribution of the data was tested using the Shapiro–Wilk test. The data are presented as mean ± SD. A two-way analysis of variance for repeated measures (sessions by repetitions) was used to examine differences in speed, biomechanical, and physiological responses between the sessions. When significant main effects were found, Tukey’s honest significant difference post hoc test was used to identify differences between the means. Partial eta squared (η2p) was used to calculate effect size and considered as small (≤0.06), medium (≤0.14), and large (>0.14) [30]. Pearson’s correlation coefficient was used to examine relationships between parameters interpreted as proposed by Schober and colleagues [31]. The alpha level was set at p ≤ 0.05. Jamovi v.2.6.2 software was used for the data analysis.

3. Results

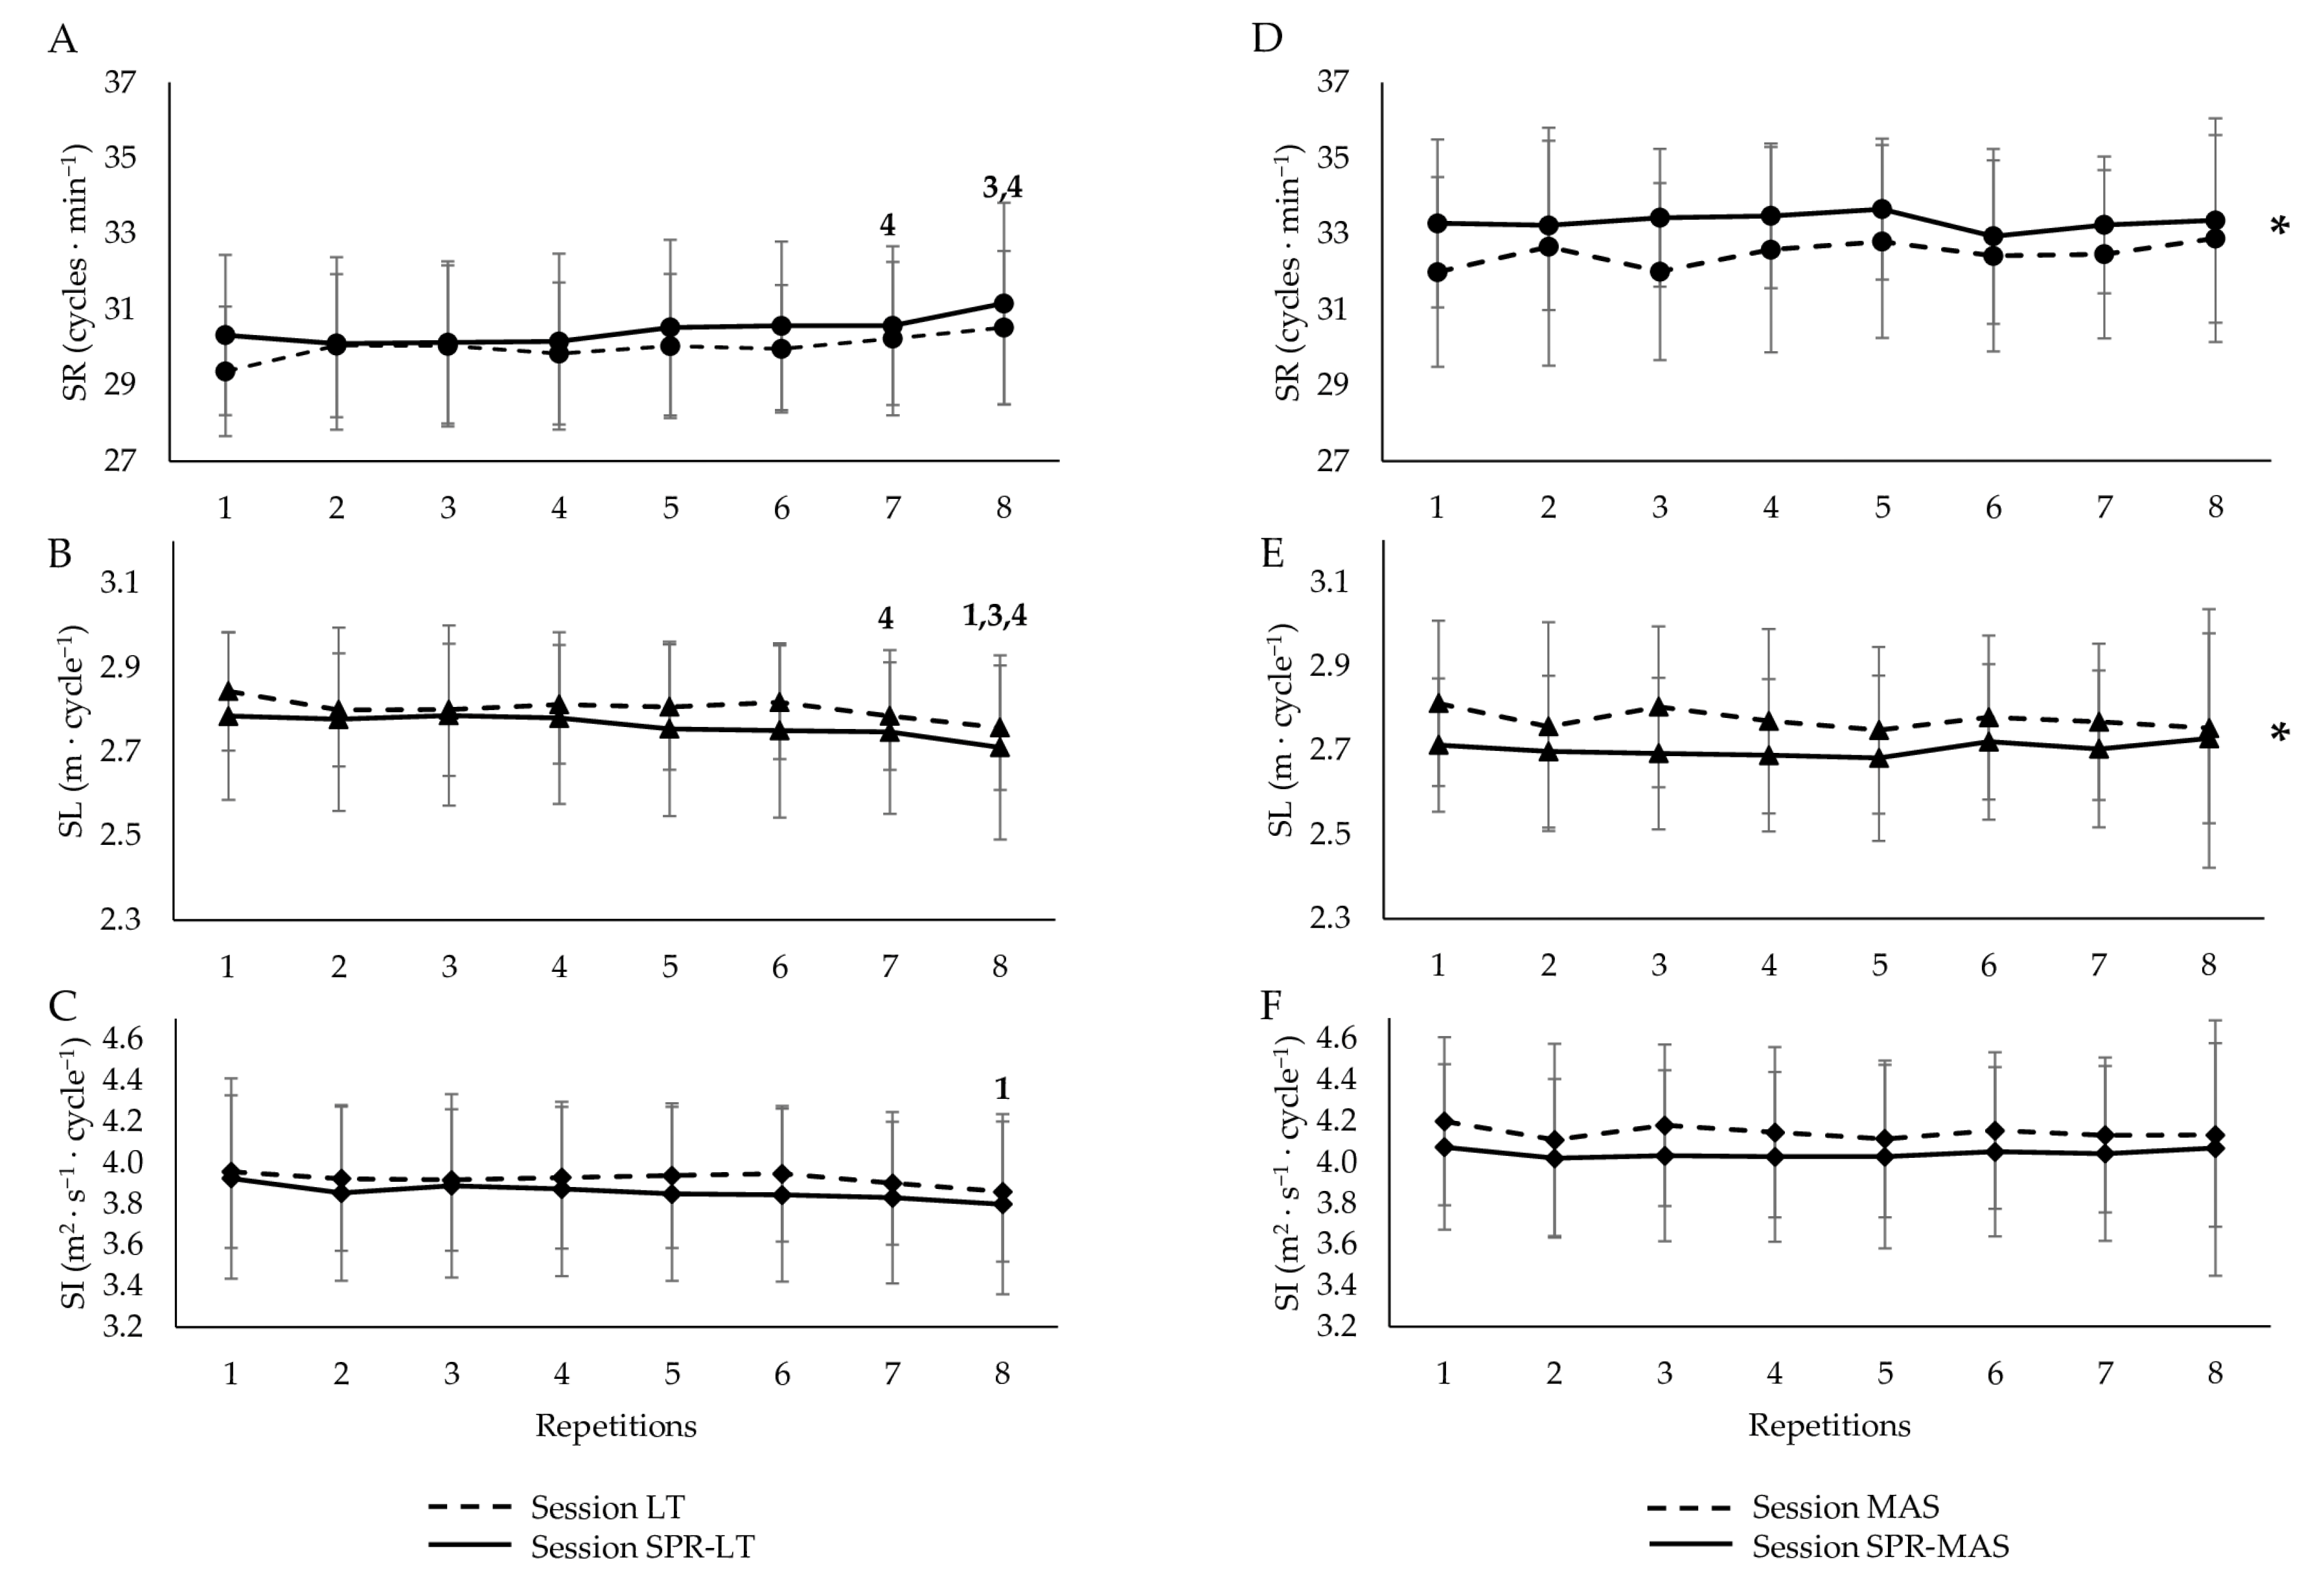
3.1. Swimming Speed and Biomechanical Variables

The mean speeds in the LT (8 × 200 m) and MAS (8 × 100 m) sets separately did not differ between the sessions (LT: 1.40 ± 0.08, SPR-LT: 1.39 ± 0.08 m·s−1, F1,11: 0.47, η2p: 0.04, p > 0.05; MAS: 1.49 ± 0.07, SPR-MAS: 1.49 ± 0.07 m·s−1, F1,11: 0.02, η2p: 0.00, p > 0.05).
No significant main effect on the session was found in SR, SL, and SI in 8 × 200 m (SR, F1,11: 1.9, η2p: 0.15, SL, F1,11: 2.3, η2p: 0.17, SI, F1,11: 2.4, η2p: 0.18, p > 0.05, Figure 2). On the other hand, SR was higher and SL was lower in 8 × 100 m when applied after 8 × 25 m (i.e., in the SPR-MAS session compared to the MAS session; SR, F1,11: 7.2, η2p: 0.40, SL, F1,11: 5.2, η2p: 0.32, p < 0.05, Figure 2), while SI did not differ between the sessions in 8 × 100 m (SI, F1,11: 4.6, η2p: 0.29, p > 0.05, Figure 2). A significant main effect on repetitions was found in SR, SL, and SI in 8 × 200 m during LT session compared to SPR-LT session (SR, F7,77: 6.4, η2p: 0.37, SL, F7,77: 8.1, η2p: 0.42, SI, F7,77: 5.9, η2p: 0.35, p < 0.05) while in 8 × 100 m no main effect was found on repetitions (SR, F7,77: 1.5, η2p: 0.12, SL, F7,77: 1.2, η2p: 0.10, SI, F7,77: 1.1, η2p: 0.09, p > 0.05, Figure 3). There was no significant interaction of sessions by repetitions in the LT and MAS sets (set LT, SR, F7,77: 1.8, η2p: 0.14, SL, F7,77: 1.1, η2p: 0.09, SI, F7,77: 0.7, η2p: 0.06, p > 0.05; set MAS, SR, F7,77: 0.6, η2p: 0.05, SL, F7,77: 0.5, η2p: 0.05, SI, F7,77: 0.2, η2p: 0.02, p > 0.05, Figure 3).

3.2. Blood Lactate Concentration and RPE

Mean BL was higher in the SPR-LT session compared to LT (LT: 3.1 ± 2.5, SPR-LT: 6.9 ± 3.2 mmol·L−1, F1,11: 43.4, η2p: 0.80, p < 0.05) and in the SPR-MAS session compared to the MAS session (MAS: 3.6 ± 2.8, SPR-MAS: 8.3 ± 3.8 mmol·L−1, F1,11: 30.7, η2p: 0.74, p < 0.05). BL at the start of sets 8 × 200 m and 8 × 100 m was higher in the SPR-LT and SPR-MAS sessions compared to LT and MAS sessions (Table 1, LT vs. SPR-LT, F1,11: 74.8, η2p: 0.87, MAS vs. SPR-MAS, F1,11: 40.9, η2p: 0.79, p < 0.05). However, BL at the end of both sets separately did not differ between the sessions (Table 1, p > 0.05). RPE was higher in the LT and MAS sets when applied after SPR set (set LT, F1,11: 31.4, η2p: 0.74, p < 0.05 between the sessions; set MAS, F1,11: 37.3, η2p: 0.77, p < 0.05 between the sessions, Table 1).

3.3. Correlations

Moderate correlation was observed between BL at the start and the end of 8 × 200 m when applied after 8 × 25 m and the average SR calculated during 8 × 200 m (Table 2, p < 0.05). Furthermore, the average RPE during 8 × 200 m in the SPR-LT training session was strongly correlated with the average SR calculated during 8 × 200 m (Table 2, p < 0.05). However, no significant correlations were observed between the BL, RPE, and biomechanical parameters in 8 × 100 m when applied after 8 × 25 m (Table 3, p > 0.05).

4. Discussion

The purpose of the present study was to examine differences in biomechanical parameters during aerobic-dominated swimming training sets performed either following a preceding sprint set or as the initial component of a training session. The findings indicated that swimming speed and biomechanical variables during the LT (8 × 200 m) training set were similar between the sessions; however, notable alterations in SR and SL were observed during the MAS (8 × 100 m) training set when it was implemented after repeated sprints. Additionally, BL was higher in the SPR-LT and SPR-MAS sessions compared to the LT and MAS sessions, respectively. Moreover, a relationship between BL and SR was observed in the SPR-LT session.
Focusing on biomechanical parameters, the results indicate that SR increased while SL decreased in the SPR-MAS (8 × 25 m and 8 × 100 m) condition compared to the MAS (8 × 100 m) condition. It is well established that implementing a sprint training set may result in the deterioration of biomechanical parameters [32], along with increased metabolic responses due to greater reliance on anaerobic metabolism [33]. Therefore, the recovery period of about 10 min, as implemented by the swimmers in the present study, may not be sufficient to fully restore physiological homeostasis before the next training set. This is supported by the higher BL observed at the start of the MAS set when it was preceded by a SPR set (see Table 1). This potential metabolic perturbation could affect swimmers’ technique during subsequent training sets.
Increased SR and decreased SL during swimming are associated with an increased energetic cost [34]. In our study, these changes occurred while the swimmers managed to maintain their SI during 8 × 100 m in both conditions. In this case, the swimmers in the current study may have adjusted their underwater movement, allowing them to maintain an efficient arm stroke by applying less force (lower SL). In this scenario, the swimmers may adjust their coordination pattern to maintain speed during 8 × 100 m [35].
However, the biomechanical parameters did not differ between the SPR-LT and LT sessions. Swimming intensity, rather than repetition distance, may be related to changes in biomechanical variables. Lactate threshold intensity represents the upper limit at which lactate production and removal are in equilibrium, reflecting a moderate ATP turnover primarily provided through aerobic metabolism [11]. Highly trained swimmers in this study (specializing in middle-distance events such as the 200 m race distance) may have developed aerobic capacity. Such an intensity (LT) can be achieved without modifications in SR and SL despite the higher BL observed at the start of the 8 × 200 m when applied after repeated sprints.
BL should not be considered a fatigue agent but rather as an energy substrate [36] that can be utilized by swimmers to maintain efficiency. A likely high aerobic capacity could enhance BL clearance, allowing the swimmers to perform well without needing to adjust their biomechanical parameters in the subsequent set. Indeed, during the LT set (8 × 200 m), there was a downward trend in lactate, while during the MAS set (8 × 100 m), it was maintained at high levels (higher than the LT set), indicating that LT corresponded to a tolerable intensity. However, in the MAS set, lactate levels remained high, suggesting a need for increased energy turnover and adjustments to biomechanical parameters to maintain performance.
Moreover, a correlation between BL and SR was observed during the SPR-LT session. This positive relationship may reflect a higher effort of swimmers to maintain the required speed in the LT set during the SPR-LT session compared to the LT session. The elevated BL at the beginning of the LT set suggests that the 10 min recovery period between sets was insufficient to restore the metabolic milieu to baseline levels, potentially leading to muscle fatigue and decreased force production [37,38]. Thus, swimmers need to modify biomechanical variables to maintain the required speed. The increased effort required during the LT set in the SPR-LT session may be confirmed by the higher RPE in this session and the positive relationship between the latter and SR. While there were no significant differences in SR between the sessions, even minor changes could have significant implications in actual training scenarios with multiple consecutive sets.
It is well established that SR can increase proportionally to the energy demand—reflected in elevated BL levels before and after the training session—while maintaining an energetically efficient profile. This efficiency is characterized by a constant swimming speed and the absence of decrements in SL and SI over a 200 m distance [34,39]. Additionally, the 8 × 200 m training session aligns with the exercise intensity domain recommended for improving endurance [40]. Recent research has highlighted a relationship between the slopes of SR or SL and the gas exchange threshold [2]. It is, therefore, plausible that the swimmers in the present study possess the ability to increase their SR without significantly impacting the energetic cost of swimming [2,35].
Certain limitations of the present study should be acknowledged. The small sample size and the mathematical model used to estimate swimming speed at the second lactate threshold may have influenced the results and should be considered when interpreting the findings. We acknowledge that a larger sample size could strengthen our findings. Additionally, the passive recovery applied between sets may not be applicable in actual training scenarios, and implementing active recovery of varying durations between sets could affect metabolic response and the biomechanical variables during the following training set.

5. Conclusions

In conclusion, highly trained swimmers are able to maintain swimming speed during training sets conducted at intensities corresponding to the lactate threshold (8 × 200 m) and the maximal aerobic speed (8 × 100 m) by modifying biomechanical parameters following repeated sprints. Performing a sprint training set approximately 10 min prior to an aerobic training set performed at maximal aerobic speed may alter swimmers’ stroke technique and physiological response in the latter. Coaches can incorporate repeated sprints with aerobic-dominated training sets in the same training session, but they should expect an acute impairment in stroke length during a training set performed at MAS when followed by repeated sprints, although overall technical efficiency is preserved.

Author Contributions

Conceptualization, I.S.N. and A.G.T.; methodology, I.S.N. and A.G.T.; software, I.S.N. and A.G.T.; validation, I.S.N. and A.G.T.; formal analysis, I.S.N.; investigation, I.S.N.; resources, I.S.N.; data curation, I.S.N.; writing—original draft preparation, I.S.N. and G.G.A.; writing—review and editing, A.G.T.; visualization, I.S.N.; supervision, A.G.T.; project administration, I.S.N. and A.G.T. All authors have read and agreed to the published version of the manuscript.

Funding

This research received no external funding.

Institutional Review Board Statement

The study was conducted in accordance with the Declaration of Helsinki and approved by the Ethics Committee of School of Physical Education and Sports Science (1351/03-03-2022).

Informed Consent Statement

Informed consent was obtained from all subjects involved in the study.

Data Availability Statement

Data is available upon reasonable request to the corresponding author.

Acknowledgments

The authors would like to thank the swimmers for their participation in the study.

Conflicts of Interest

The authors declare no conflicts of interest.

Abbreviations

The following abbreviations are used in this manuscript:
SRStroke rate
SLStroke length
SIStroke index
LTLactate threshold
MASMaximal aerobic speed
SPRRepeated sprints
BLBlood lactate
RPERate of perceived exertion

References

  1. Hermosilla, F.; González-Rave, J.M.; Del Castillo, J.A.; Pyne, D.B. Periodization and Programming for Individual 400 m Medley Swimmers. Int. J. Environ. Res. Public Health 2021, 18, 6474. [Google Scholar] [CrossRef] [PubMed]
  2. Almeida, T.A.F.; Espada, M.C.; Massini, D.A.; Macedo, A.G.; Castro, E.A.; Ferreira, C.C.; Reis, J.F.; Pessôa Filho, D.M. Stroke and Physiological Relationships during the Incremental Front Crawl Test: Outcomes for Planning and Pacing Aerobic Training. Front. Physiol. 2023, 14, 1241948. [Google Scholar] [CrossRef] [PubMed]
  3. Bartolomeu, R.F.; Costa, M.J.; Barbosa, T.M. Contribution of Limbs’ Actions to the Four Competitive Swimming Strokes: A Nonlinear Approach. J. Sports Sci. 2018, 36, 1836–1845. [Google Scholar] [CrossRef] [PubMed]
  4. Costa, R.J.; Bragada, A.; Marinho, D.A.; Silva, N.J.; Barbosa, T.M. Longitudinal Interventions in Elite Swimming: A Systematic Review Based on Energetics, Biomechanics, and Performance. J. Strength Cond. Res. 2012, 26, 2006–2016. [Google Scholar] [CrossRef]
  5. Barbosa, T.M.; Bragada, J.A.; Reis, V.M.; Marinho, D.A.; Carvalho, C.; Silva, A.J. Energetics and Biomechanics as Determining Factors of Swimming Performance: Updating the State of the Art. J. Sci. Med. Sport 2010, 13, 262–269. [Google Scholar] [CrossRef]
  6. Dekerle, J.; Nesi, X.; Lefevre, T.; Depretz, S.; Sidney, M.; Huot Marchand, F.; Pelayo, P. Stroking Parameters in Front Crawl Swimming and Maximal Lactate Steady State Speed. Int. J. Sports Med. 2005, 26, 53–58. [Google Scholar] [CrossRef]
  7. Pelarigo, J.G.; Greco, C.C.; Denadai, B.S.; Fernandes, R.J.; Vilas-Boas, J.P.; Pendergast, D.R. Do 5% Changes around Maximal Lactate Steady State Lead to Swimming Biophysical Modifications? Hum. Mov. Sci. 2016, 49, 258–266. [Google Scholar] [CrossRef]
  8. Psycharakis, S.G.; Cooke, C.B.; Paradisis, G.P.; O’Hara, J.; Phillips, G. Analysis of Selected Kinematic and Physiological Performance Determinants During Incremental Testing in Elite Swimmers. J. Strength Cond. Res. 2008, 22, 951–957. [Google Scholar] [CrossRef]
  9. Keskinen, K.L.; Komi, P.V. Stroking Characteristics of Front Crawl Swimming during Exercise. J. Appl. Biomech. 1993, 9, 219–226. [Google Scholar] [CrossRef]
  10. Carvalho, D.D.; Soares, S.; Zacca, R.; Sousa, J.; Marinho, D.A.; Silva, A.J.; Vilas-Boas, J.P.; Fernandes, R.J. Anaerobic Threshold Biophysical Characterisation of the Four Swimming Techniques. Int. J. Sports Med. 2020, 41, 318–327. [Google Scholar] [CrossRef]
  11. Fernandes, R.J.; Carvalho, D.D.; Figueiredo, P. Training Zones in Competitive Swimming: A Biophysical Approach. Front. Sports Act. Living 2024, 6, 1363730. [Google Scholar] [CrossRef] [PubMed]
  12. Figueiredo, P.; Morais, P.; Vilas-Boas, J.P.; Fernandes, R.J. Changes in Arm Coordination and Stroke Parameters on Transition through the Lactate Threshold. Eur. J. Appl. Physiol. 2013, 113, 1957–1964. [Google Scholar] [CrossRef] [PubMed]
  13. Komar, J.; Leprêtre, P.M.; Alberty, M.; Vantorre, J.; Fernandes, R.J.; Hellard, P.; Chollet, D.; Seifert, L. Effect of Increasing Energy Cost on Arm Coordination in Elite Sprint Swimmers. Hum. Mov. Sci. 2012, 31, 620–629. [Google Scholar] [CrossRef]
  14. Pelarigo, J.G.; Denadai, B.S.; Greco, C.C. Stroke Phases Responses around Maximal Lactate Steady State in Front Crawl. J. Sci. Med. Sport 2011, 14, 168.e1–168.e5. [Google Scholar] [CrossRef]
  15. Figueiredo, P.; Nazario, R.; Sousa, M.; Pelarigo, J.G.; Vilas, J.P.; Fernandes, R. Kinematical Analysis along Maximal Lactate Steady State Swimming Intensity. J. Sports Sci. Med. 2014, 13, 610. [Google Scholar]
  16. Nikitakis, I.S.; Bogdanis, G.C.; Paradisis, G.P.; Toubekis, A.G. Physiological Responses and Swimming-Performance Changes Induced by Altering the Sequence of Training Sets. Int. J. Sports Physiol. Perform. 2023, 19, 53–61. [Google Scholar] [CrossRef]
  17. Nikitakis, I.S.; Bogdanis, G.C.; Paradisis, G.P.; Toubekis, A.G. Effects of Training Sets Sequence on Swimming Performance, Training Load and Physiological Responses. Sports 2023, 11, 240. [Google Scholar] [CrossRef]
  18. Amann, M. Central and Peripheral Fatigue: Interaction during Cycling Exercise in Humans. Med. Sci. Sports Exerc. 2011, 43, 2039–2045. [Google Scholar] [CrossRef]
  19. McKay, A.K.A.; Stellingwerff, T.; Smith, E.S.; Martin, D.T.; Mujika, I.; Goosey-Tolfrey, V.L.; Sheppard, J.; Burke, L.M. Defining Training and Performance Caliber: A Participant Classification Framework. Int. J. Sports Physiol. Perform. 2022, 17, 317–331. [Google Scholar] [CrossRef]
  20. Faul, F.; Erdfelder, E.; Lang, A.-G.; Buchner, A. G*Power 3: A Flexible Statistical Power Analysis Program for the Social, Behavioral, and Biomedical Sciences. Behav. Res. Methods 2007, 39, 175–191. [Google Scholar] [CrossRef]
  21. Zacca, R.; Azevedo, R.; Peterson Silveira, R.; Vilas-Boas, J.P.; Pyne, D.B.; Castro, F.A.D.S.; Fernandes, R.J. Comparison of Incremental Intermittent and Time Trial Testing in Age-Group Swimmers. J. Strength Cond. Res. 2019, 33, 801–810. [Google Scholar] [CrossRef] [PubMed]
  22. Nikitakis, I.S.; Toubekis, A.G. Lactate Threshold Evaluation in Swimmers: The Importance of Age and Method. Int. J. Sports Med. 2021, 42, 818–824. [Google Scholar] [CrossRef] [PubMed]
  23. Skorski, S.; Faude, O.; Urhausen, A.; Kindermann, W.; Meyer, T. Intensity Control in Swim Training by Means of the Individual Anaerobic Threshold. J. Strength Cond. Res. 2012, 26, 3304–3311. [Google Scholar] [CrossRef]
  24. Libicz, S.; Roels, B.; Millet, G.P. Responses to Intermittent Swimming Sets at Velocity Associated With Max. Can. J. Appl. Physiol. 2005, 30, 543–553. [Google Scholar] [CrossRef]
  25. Toubekis, A.G.; Douda, H.T.; Tokmakidis, S.P. Influence of Different Rest Intervals during Active or Passive Recovery on Repeated Sprint Swimming Performance. Eur. J. Appl. Physiol. 2005, 93, 694–700. [Google Scholar] [CrossRef]
  26. Toubekis, A.G.; Tokmakidis, S.P. Metabolic Responses at Various Intensities Relative to Critical Swimming Velocity. J. Strength Cond. Res. 2013, 27, 1731–1741. [Google Scholar] [CrossRef]
  27. Bogdanis, G.C.; Nevill, M.E.; Lakomy, H.K.A.; Boobis, L.H. Power Output and Muscle Metabolism during and Following Recovery from 10 and 20 s of Maximal Sprint Exercise in Humans. Acta Physiol. Scand. 1998, 163, 261–272. [Google Scholar] [CrossRef]
  28. Shimoyama, Y.; Tomikawa, M.; Nomura, T. The Effect of Rest Periods on Energy System Contribution during Interval Swimming. Eur. J. Sport Sci. 2003, 3, 1–11. [Google Scholar] [CrossRef]
  29. Monteiro, A.S.; Carvalho, D.D.; Elói, A.; Silva, F.; Vilas-Boas, J.P.; Buzzachera, C.F.; Fernandes, R.J. Repeatability of Ventilatory, Metabolic and Biomechanical Responses to an Intermittent Incremental Swimming Protocol. Physiol. Meas. 2022, 43, 075009. [Google Scholar] [CrossRef]
  30. Lakens, D. Calculating and Reporting Effect Sizes to Facilitate Cumulative Science: A Practical Primer for t-Tests and ANOVAs. Front. Psychol. 2013, 4, 863. [Google Scholar] [CrossRef]
  31. Schober, P.; Boer, C.; Schwarte, L.A. Correlation Coefficients: Appropriate Use and Interpretation. Anesth. Analg. 2018, 126, 1763–1768. [Google Scholar] [CrossRef] [PubMed]
  32. Arsoniadis, G.G.; Botonis, P.G.; Bogdanis, G.C.; Terzis, G.; Toubekis, A.G. Acute Effects of Dryland Muscular Endurance and Maximum Strength Training on Sprint Swimming Performance in Young Swimmers. J. Sports Sci. 2024, 42, 938–946. [Google Scholar] [CrossRef] [PubMed]
  33. Williamson, D.; McCarthy, E.; Ditroilo, M. Acute Physiological Responses to Ultra Short Race-Pace Training in Competitive Swimmers. J. Hum. Kinet. 2020, 75, 95–102. [Google Scholar] [CrossRef] [PubMed]
  34. Barbosa, T.M.; Fernandes, R.J.; Keskinen, K.L.; Vilas-Boas, J.P. The Influence of Stroke Mechanics into Energy Cost of Elite Swimmers. Eur. J. Appl. Physiol. 2008, 103, 139–149. [Google Scholar] [CrossRef]
  35. Alberty, M.; Sidney, M.; Pelayo, P.; Toussaint, H.M. Stroking Characteristics during Time to Exhaustion Tests. Med. Sci. Sports Exerc. 2009, 41, 637–644. [Google Scholar] [CrossRef]
  36. Brooks, G.A. The Science and Translation of Lactate Shuttle Theory. Cell Metab. 2018, 27, 757–785. [Google Scholar] [CrossRef]
  37. Toubekis, A.G.; Peyrebrune, M.C.; Lakomy, H.K.A.; Nevill, M.E. Effects of Active and Passive Recovery on Performance during Repeated-Sprint Swimming. J. Sports Sci. 2008, 26, 1497–1505. [Google Scholar] [CrossRef]
  38. Dekerle, J.; Paterson, J. Muscle Fatigue When Swimming Intermittently Above and Below Critical Speed. Int. J. Sports Physiol. Perform. 2016, 11, 602–607. [Google Scholar] [CrossRef]
  39. Massini, D.A.; Almeida, T.A.F.; Vasconcelos, C.M.T.; Macedo, A.G.; Espada, M.A.C.; Reis, J.F.; Alves, F.J.B.; Fernandes, R.J.P.; Pessôa Filho, D.M. Are Young Swimmers Short and Middle Distances Energy Cost Sex-Specific? Front. Physiol. 2021, 12, 796886. [Google Scholar] [CrossRef]
  40. González-Ravé, J.M.; Hermosilla, F.; González-Mohíno, F.; Casado, A.; Pyne, D.B. Training Intensity Distribution, Training Volume, and Periodization Models in Elite Swimmers: A Systematic Review. Int. J. Sports Physiol. Perform. 2021, 16, 913–926. [Google Scholar] [CrossRef]
Figure 1. The study design is illustrated. In different sessions, training sets at the lactate threshold (LT) and the maximal aerobic speed (MAS) were performed alone or after repeated sprints (SPR). The swimming time (Applsci 15 06522 i001), rate of perceived exertion (RPE), stroke rate, stroke length, and stroke index were measured during each set, while blood lactate was measured before and after each set. Applsci 15 06522 i002: blood lactate; Applsci 15 06522 i003: stroke rate, stroke length, and stroke index.
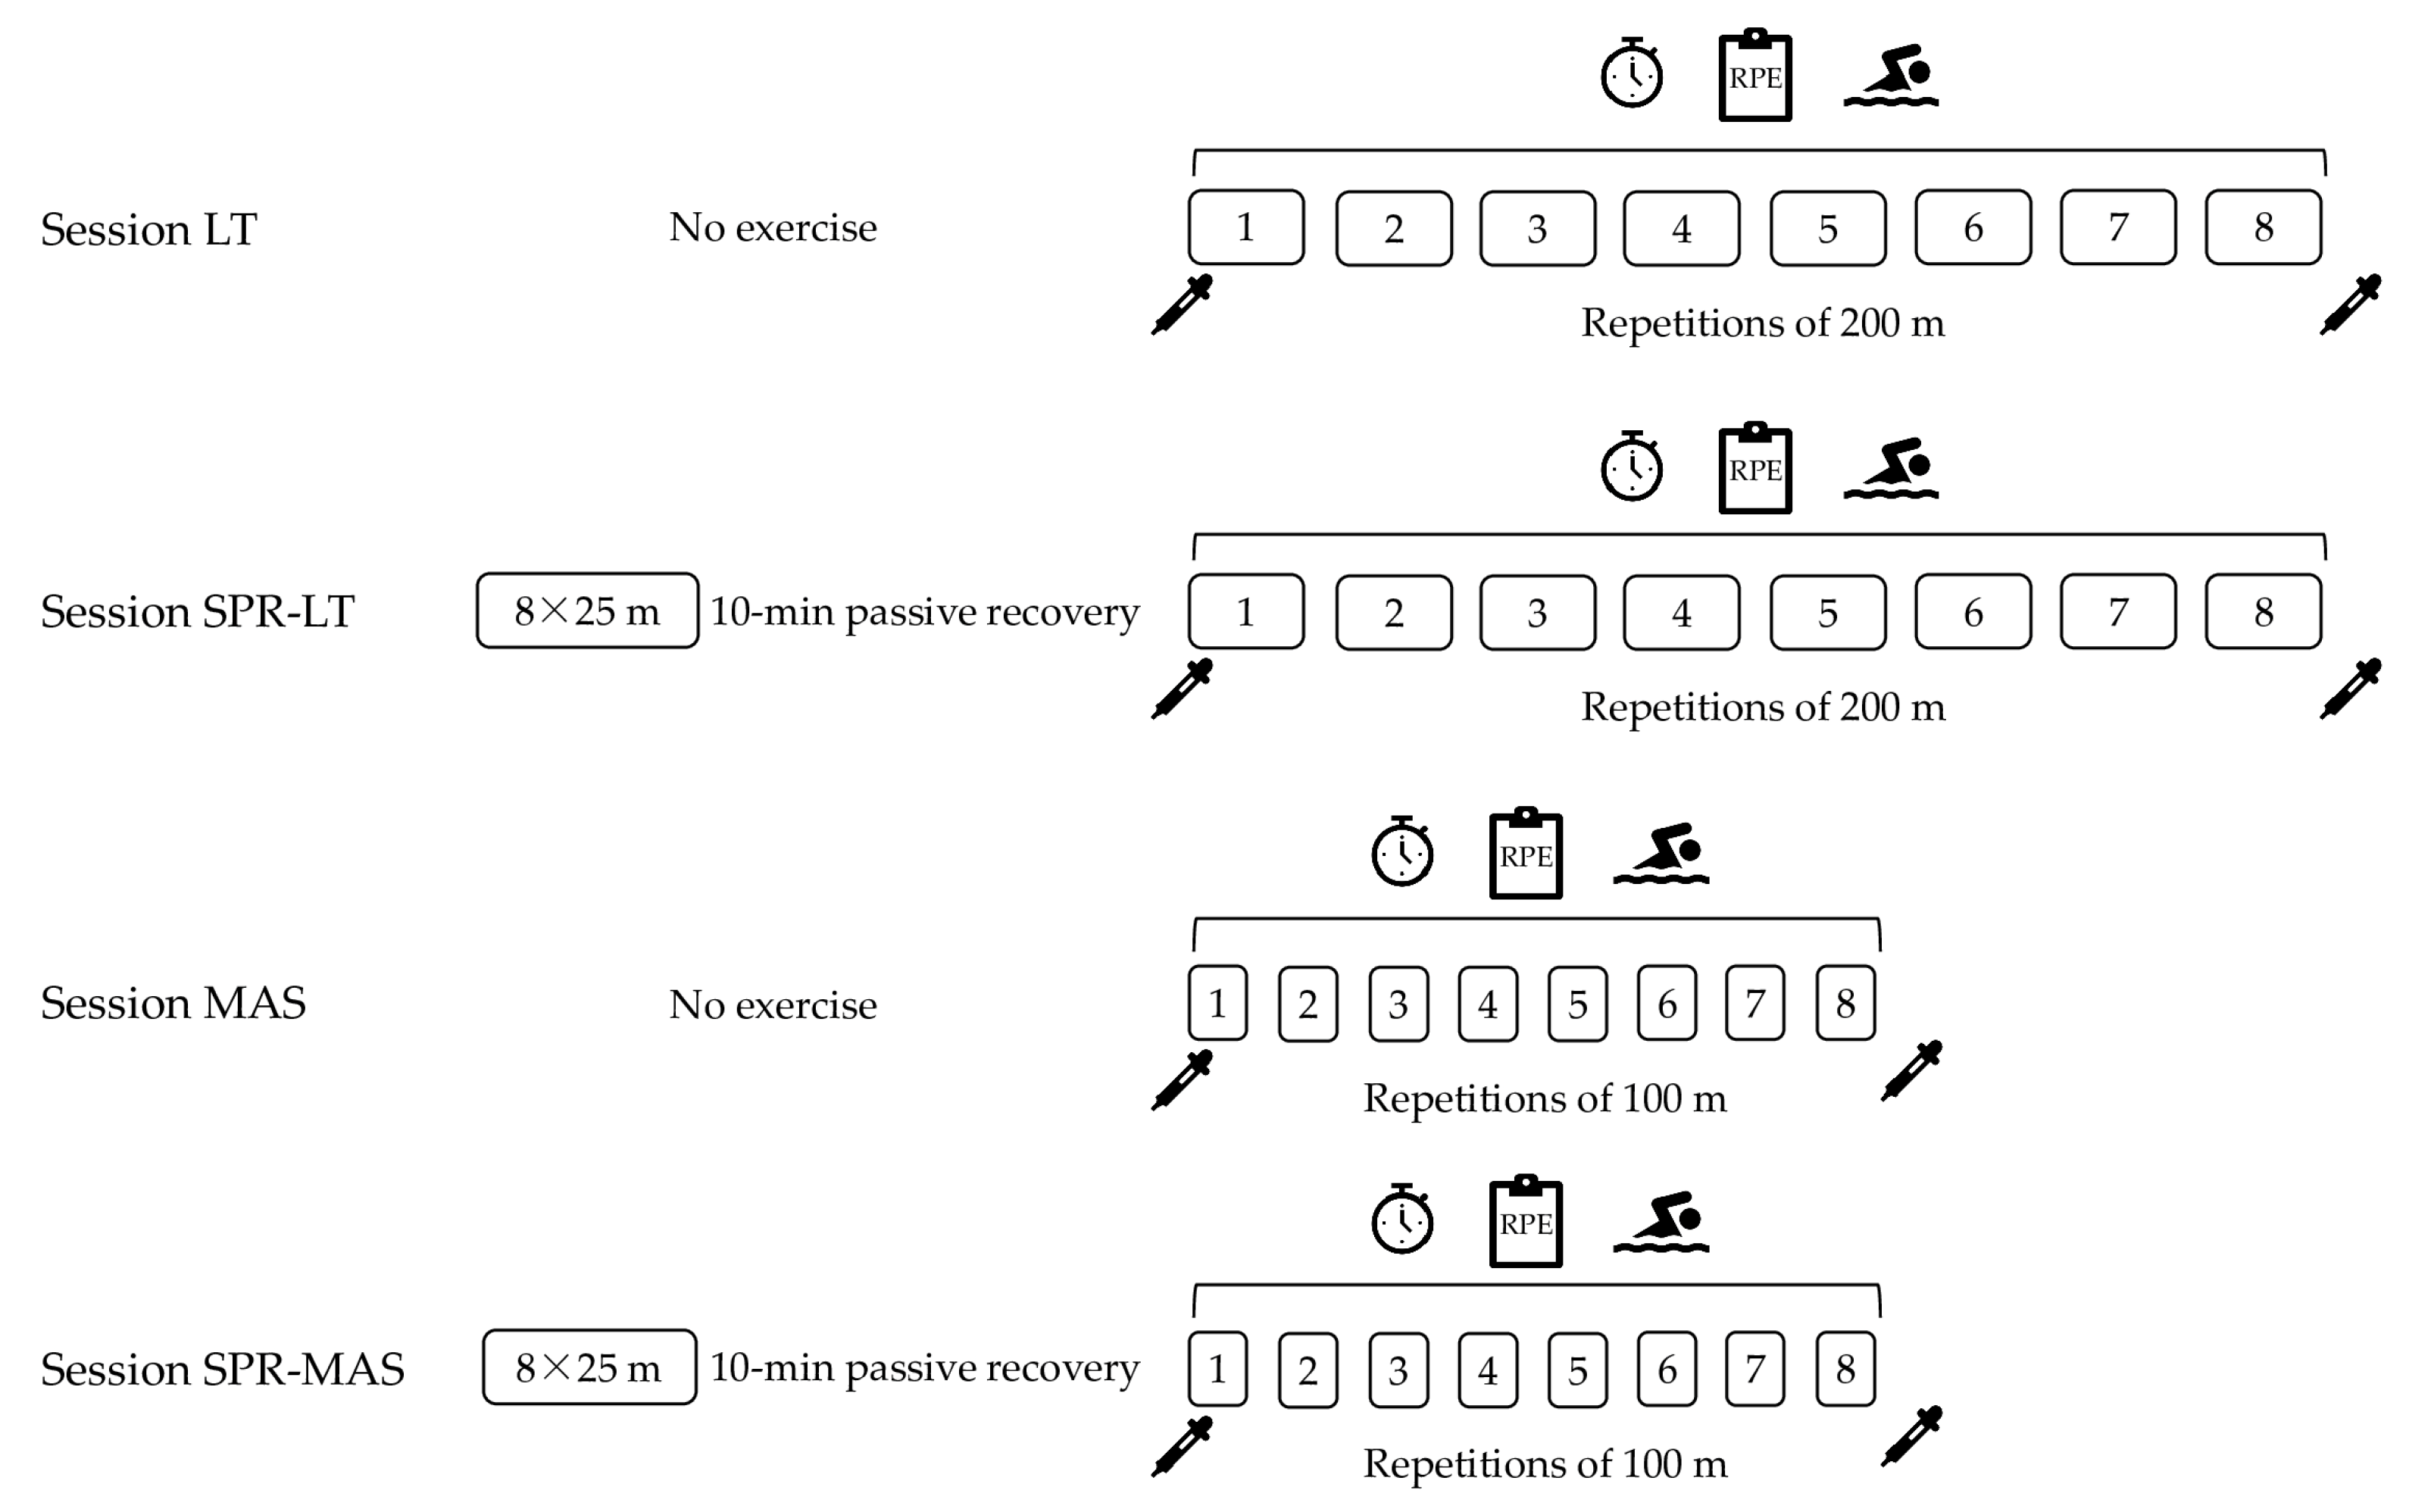
Applsci 15 06522 g001
Figure 2. Stroke rate (SR, panel A), stroke length (SL, panel B), and stroke index (SI, panel C) during 8 × 200 m performed at the lactate threshold (LT) and 8 × 100 m performed at maximal aerobic speed (MAS) in the training sessions conducted in the study. *: p < 0.05 compared to control session.
Applsci 15 06522 g002
Figure 3. Stroke rate (SR, panels A,D), stroke length (SL, panels B,E), and stroke index (SI, panels C,F) across repetitions of 8 × 200 m (panels A–C) and 8 × 100 m (panels DF) performed at the lactate threshold (LT) and the maximal aerobic speed (MAS), respectively. Numbers above repetition measurements indicate a significant main effect on repetition (p < 0.05) compared to the corresponding repetition. *: p < 0.05 between the sessions (main effect).
Applsci 15 06522 g003
Table 1. Blood lactate (BL, mmol·L−1) at the start and the end and the mean rate of perceived exertion (RPE, a.u.) in the lactate threshold (LT) and the maximal aerobic speed (MAS) sets conducted either alone (session LT and session MAS) or after repeated sprints (SPR, session SPR-LT, and session SPR-MAS).
Session LTSession SPR-LTSession MASSession SPR-MAS
BL start1.4 ± 0.57.8 ± 3.0 *1.5 ± 0.68.0 ± 3.1 #
BL end4.7 ± 2.76.3 ± 3.35.6 ± 2.68.6 ± 4.5
Mean RPE4.5 ± 1.66.0 ± 1.6 *4.4 ± 1.86.3 ± 1.3 #
*: p < 0.05 compared to session LT, #: p < 0.05 compared to session MAS.
Table 2. Pearson correlation coefficient between metabolic response (blood lactate, BL), perceived exertion (RPE), and biomechanical variables during the lactate threshold set (8 × 200 m) when applied after repeated sprints.
BL StartBL EndRPE Mean
SR0.67 *0.61 *0.74 *
SL−0.56−0.35−0.42
SI−0.34−0.09−0.09
SR: stroke rate, SL: stroke length, SI: stroke index, *: p < 0.05.
Table 3. Pearson correlation coefficient between metabolic response (blood lactate, BL), perceived exertion (RPE), and biomechanical variables during the maximal aerobic speed set (8 × 100 m) when applied after repeated sprints.
BL StartBL EndRPE Mean
SR0.160.430.34
SL−0.15−0.440.09
SI−0.11−0.340.29
SR: stroke rate, SL: stroke length, SI: stroke index.
Disclaimer/Publisher’s Note: The statements, opinions and data contained in all publications are solely those of the individual author(s) and contributor(s) and not of MDPI and/or the editor(s). MDPI and/or the editor(s) disclaim responsibility for any injury to people or property resulting from any ideas, methods, instructions or products referred to in the content.

