Article

Rugby Sevens sRPE Workload Imputation Using Objective Models of Measurement

1
Canadian Sport Institute, Victoria, BC V9E 2C5, Canada
2
Exercise Science, Physical & Health Education, University of Victoria, Victoria, BC V8W 2Y2, Canada
*
Author to whom correspondence should be addressed.
Appl. Sci. 2025, 15(12), 6520; https://doi.org/10.3390/app15126520
Submission received: 25 April 2025 / Revised: 26 May 2025 / Accepted: 30 May 2025 / Published: 10 June 2025
(This article belongs to the Special Issue Innovative Approaches in Sports Science and Sports Training)

Abstract

While accurate athlete load monitoring is crucial for preventing injury and optimizing performance, the commonly used session rating of perceived exertion training load or competition load method faces limitations due to compliance issues related to missing subjective data self-reported by the athlete and the subsequent challenges in imputing the sessional rating of perceived exertion (sRPE) component, an average value for a training or competition session. This study investigated the imputation of missing RPE scores from the mechanical work and from a Speed–Deceleration–Contact (SDC) model. A total of 1002 datasets were collected from women’s rugby sevens competitions. Using either the mechanical work or SDC, linear regression and random forest imputation models were assessed at different missingness levels and their results compared to those of a common method of daily team mean substitution (DTMS) using an ANOVA of the accuracy by the model type and missingness. The statistical equivalence was evaluated for true and imputed sRPE scores by the model and strategy. Significant interactions between the model type and missingness were found, with all the imputed scores being deemed statistically equivalent. From the ANOVA, DTMS was found to be the poorest-performing model and the random forest model was the best. However, the best-performing model was not superior to previously reported imputation approaches, which confirms the difficulty in using subjective measures of the load when missing data is a prevalent issue in team sports. Practitioners are encouraged to critically evaluate any method of imputation for an athlete’s load.

1. Introduction

In the women’s rugby sevens competition environment, teams play five or six games over two to three days, with multiple tournaments happening in the span of a few weeks. This high competition volume means that managing an athlete’s physical load to ensure safe and successful participation is of critical importance. By monitoring the physical output of athletes in the competition space, practitioners gain an understanding of their performance demands, allowing for the appropriate design and deployment of training programs to meet these demands, ensuring protective effects against injuries for athletes in future competitions [1]. More immediately, in rugby sevens tournaments, monitoring the physical load provides information on tactical strategies for the substitution of players to manage in-game fatigue and inform optimal recovery strategies [2]. The use of sensor technology, including athlete tracking devices (ATDs) like GNSS monitors, is a popular option for load monitoring in team sports and is permitted by the governing body for rugby sevens for use in competition [3,4]. However, proprietary algorithms may include metrics that are either not defined or not optimized to accurately quantify the loads experienced by female athletes [5,6].
With concerns regarding the suitability of proprietary ATD metrics, many teams continue to rely on subjective workload measures, such as the session rating of perceived exertion training load or competition load (sRPE-TL or sRPE-CL) [7,8,9]. The sRPE-TL, or the sRPE-CL when the data comes from competitions, is the product of an athlete’s playing time and their self-reported session rating of perceived exertion (sRPE), which is used to assign an average value to the level of effort at which the athlete felt they worked, or the intensity of their exertion, during the particular session or match [7]. While the use of the sRPE-CL is a fast way to glean insights into an athlete’s workload, it relies on regular reporting by athletes and is known to be sensitive to factors like experience with the sRPE scale [10]. While the sRPE scale acts as a proxy measure of the sessional intensity, it remains a subjective element as it reflects the perception of effort [7]. However, the use of the sRPE to inform the sRPE-CL enables a holistic approach to understanding an athlete’s response to the stress of training or a competition [10]. The imputation of sRPE data to ensure continuity in sRPE-CL athlete load data allows insights into the athlete’s psychological and physiological experiences to continue to be generated [10].
Further, in competition settings the demands on athletes between matches to recover and prepare for the upcoming matches mean that sRPE values may not be reported, with lower compliance and missing data, making the calculation of the sRPE-CL not feasible [11]. Missing or incomplete load information may create unnecessary risks for athletes due to an inability to consistently quantify athletes’ performance, either over- or underestimating the load experienced [12,13,14]. Therefore, there is a need to find ways to mitigate missing data, such as using imputation techniques, as well as potentially identifying other load monitoring approaches that may rely less on subjective inputs and compliance.
The use of mathematical techniques for the imputation of missing values presents a unique solution to incomplete sRPE datasets, potentially enabling the retention of elements of the athlete’s perception of the event [4,9,13]. Missing value imputation (MVI) commonly occurs in sport research using value substitution, classification, or regression models [14]. In sport data, the use of group mean substitution is a popular strategy for its ease of use [8,9]. While group mean substitution is a common approach, this technique was outperformed by multiple different models in the imputation of the competition sRPE for a cohort of rugby sevens athletes, including linear regression, random forest, support vector machine, k-nearest neighbors, and neural network models [13]. This evaluation relied upon the available sRPE data for group mean substitution and compared the results to those values of a simple multicomponent model (sRPE = match number + player + opponent + total distance + playing time + contact count) augmented with machine learning techniques [14]. It is important to note that the best-performing model in this study was a random forest classifier. While this approach resulted in improved imputation performance compared to that of the standard DTMS, the random forest model’s accuracy was still only 26.5% with an R2 of 0.407, compared to the daily team mean, which had a model accuracy of 20.6% and an R2 of 0.09 [14]. This suggests that the simple model employed may not have been a suitable approximation of athletes’ physical load or sRPE. Similar results were echoed in a study on training sRPE data for Australian football athletes, where a random forest model outperformed even the more complex neural network, C5.0 decision rule, and naïve Bayesian models [13]. This suggests an opportunity for other, statistically or theoretically driven objective models to improve the ability to impute missing sRPE data. Further, the performance of additional models developed will continue to need to be compared using a similar methodology for the imputation of the sRPE, as was originally presented by Epp Stobbe et al. (2022) [14].
An alternative workload metric which quantifies athletes’ physical load through the use of data gathered by ATDs is the mechanical work [14,15,16,17]. The use of the mechanical work is a popular strategy as it is minimally invasive to the athlete and represents a measure of both the intensity and duration [15,16,17,18]. The mechanical work is the product of the force and distance and can be calculated using data from an ATD, including the speed and session duration, alongside athletes’ mass data [14]. As an alternative to the mechanical work, other objective statistical models have been suggested to quantify athletes’ load [12,18]. One such example is the Speed–Deceleration–Contact (SDC) model proposed by Epp-Stobbe et al. (2024), which uses the distances traveled by the athlete in distinct speed and deceleration zones, as well as the number and frequency of contacts experienced by the athlete [19,20]. The SDC regression model is presented in Equation (1), where uathlete represents the random error of each athlete, and the distances in each zone are individualized to each athlete [18]. Epp-Stobbe et al. (2024) provide more detail on the specifics of how these zones are individualized [20]. This model was found to have reasonable explanatory power, with a moderate to strong relationship to the sRPE-CL (R2adjusted = 0.487), suggesting it may be used in place of the sRPE-CL as a load monitoring tool [20].
s R P E C L = 0.852 + 53.87 T o t a l   H i g h   D e c e l e r a t i o n   D i s t a n c e + 0.159 C o n t a c t   C o u n t   53.46 H i g h   S p e e d × H i g h   D e c e l e r a t i o n   D i s t a n c e   26.59 L o w   S p e e d × H i g h   D e c e l e r a t i o n   D i s t a n c e + u a t h l e t e ± 10.989
Considering the relationships between objective load metrics, such as the mechanical work and SDC, and the sRPE-CL and the need for the imputation of the sRPE, it is possible that the use of current metrics augmented using different statistical approaches could improve the ability to impute the sRPE compared to current methods.
The use of mathematical models like the mechanical work and the SDC are appealing alternatives to self-reported athlete data and may further be useful metrics to support MVI in the case of missing sRPE data when the sRPE-CL is used as an athlete load metric. Therefore, the purpose of this investigation was to assess the accuracy of the alternative load metrics of the mechanical work and SDC, augmented with linear regression and random forest classification, in computing the competition sRPE compared to that of DTMS. This novel approach assessed how two objective workload strategies behaved when used to impute sRPE-CL data. The outcomes of this novel investigation could provide important alternatives for the imputation of the sRPE, which could better support the use of the sRPE-CL to calculate athletes’ loads when missing data is experienced, supporting the continuity of data longitudinally across high-performance sport programs. The use of these objective workload strategies to impute missing data may allow practitioners to better understand and address changes in the training and competition environment to support optimal performance.

2. Materials and Methods

2.1. General Methods

Twenty-one women’s rugby sevens players (25.5 ± 3.90 years old, 169.4 ± 5.89 cm tall, and 71.0 ± 5.64 kg) in a full-time training and competition program provided data for 101 international matches over several years in a retrospective qualitative analysis. All the data were anonymized by team staff prior to analysis. Ethics approval was provided by the University of Victoria for voluntary data collection, with the investigation complying with the principles outlined in the Declaration of Helsinki (DoH) and the Ethical Principles for Medical Research Involving Human Participants (1964) and its latest amendments from the 75th General Assembly of the World Medical Association (WMA) in Finland on 19 October 2024.
The date, match number within the tournament, and opponent were provided for each match in the dataset. Objective variables from ATDs, worn between the shoulder blades in a custom harness by each athlete, collected data on the athletes’ playing time and total distance covered in each match (Apex v2.50, StatSports, Newry, UK) and were available as potential imputation model inputs. Athletes’ masses were collected before each match using a portable weighing scale (ES-310, Anyload, Burnaby, BC, Canada). Athletes’ self-reported sRPE scores were collected post-match using a modified Borg CR-10 scale familiar to the athletes [10]. The sRPE data collected through these means was considered to be ordinal data [10].
Further, the footage of each match was evaluated by one trained analyst to determine a summed count of all the contacts experienced during the match (tackles, carries, contested restarts, and rucks), developed by staff maintaining the team’s current match analysis practices (Sportscode v 11, Hudl, Lincoln, NE, USA) [19,20,21,22].
Overall, the absolute game mechanical work (W) was calculated as the cumulative sum of the product of the instantaneous absolute power (P) and time (t) (Equation (2)). The instantaneous absolute power was calculated as the product of the athlete’s mass, acceleration, and velocity.
W   = i = 1 n P i   ·   Δ t i

2.2. Imputation of sRPE

In order to model the relationship between the sRPE (dependent variable) and the imputation strategy (independent variable), statistical models were used to classify and predict the sRPE based on the daily team mean, the mechanical work, or the SDC model. Following this, comparisons between the true, calculated sRPE data and the imputed model data were made (R version 3.4.4, Vienna, Austria). A total of 1002 complete datasets were available for analysis.
DTMS was one imputation strategy used, which relied on the sRPE values of other teammates from the same match and day. Mechanical work data were used to impute the sRPE based on the player and match number. SDC model data were used to impute sRPE data based on the player, opponent, match number, playing time, contact count, and total distance covered in zones of high deceleration and high speed, and high deceleration and low speed [20].
This investigation used DTMS, linear regression models (linear, R stats package), and random forest models (R randomForest) to classify and predict the sRPE [8,9,23,24,25,26,27,28,29,30,31,32]. Linear regression was selected as it is a common and easy-to-administer approach currently used in sport research. Random forest regression was chosen as it has been shown to be a superior method for sRPE imputation that can be executed using open-source software [8,9,13,23,24,25,26,27,28,29,30,31,32]. Previous work by Epp-Stobbe et al. (2022) demonstrated that in a rugby sevens population, a random forest model outperformed other strategies including neural networks and lasso, ridge, and elastic net regression in the imputation of competition sRPE scores [14]. Carey et al. (2016) imputed missing training load data for an Australian football program and again identified that random forest models outperformed even naïve Bayesian models [13].
The data were split into training and test datasets, with 80% allocated for training the models and 20% for testing them. This process was repeated 100 times, and the mean values from these iterations were used for further analysis to generate predicted mechanical work scores. Following the process for the imputation of the sRPE from the mechanical work, the same models were used to impute the sRPE from the Speed–Deceleration–Contact (SDC) model using the same datasets, with a fixed random seed value set to 100.
In this random forest model, the primary tuning decision involved adjusting the number of predictor variables considered at each decision point in the trees. This value was set to the square root of the total number of predictors, introducing greater randomness between the trees, which can improve generalizability and reduce overfitting and is especially useful when predicting bounded outcomes like sRPE scores. All the other model settings were kept at their default values within the randomForest package [28]. Specifically, the model generated 500 trees, ensuring stability in the predictions without excessive computation time. Each tree was built using a bootstrap sample of the training data, supporting ensemble diversity [28]. The trees were allowed to grow fully, with a minimum of five observations required to create a terminal node, which enabled the model to capture subtle patterns in the data [28]. Collectively, these default parameters provided a strong balance between predictive power, model interpretability, and computational efficiency, making them suitable for exploratory analysis or imputation tasks in moderately sized datasets [28].
The predicted sRPE values were then compared to the true, calculated values from the test dataset. The accuracy, R2, and root mean square error (RMSE) were used to evaluate the models’ ability to impute the sRPE through a comparison with the true athlete-reported sRPE scores. The accuracy was defined as the proportion of the imputed sRPE scores that exactly matched the true sRPE scores. For each observation, an imputed score was considered accurate if it was numerically identical to the corresponding true score. The accuracy was then calculated as the number of exact matches divided by the total number of predictions.
To establish statistical equivalence as a means to consider the model interchangeability, through a paired-samples equivalent test (paired TOST), the values imputed from the test dataset at 20% missingness were compared against the true sRPE values [33,34]. Practically, 20% missingness was determined to be reasonable as that was equivalent to two to three missing sRPE values within a team, which represented the regular outcomes of data collection based on the advice of team staff [8,9]. The bounds of Cohen’s d × σ were used in the paired-samples equivalence test, specifically using a Cohen’s d of 0.2 to represent a small effect size [34]. While it is ideal to define equivalence margins based on domain-specific or normative benchmarks, such reference data are currently lacking or insufficient in this particular sporting population. A Cohen’s d = 0.2 is a conservative and widely accepted standard for identifying negligible differences [34]. This approach ensures that potentially meaningful discrepancies are not dismissed while still enabling a statistically grounded evaluation of equivalence.
To explore the cases where there was a divergence in accuracy, all the imputation strategies were tested at different levels of missingness increasing in 5% increments from 5% to 30% and iterated 100 times. A one-way ANOVA compared the model accuracy by the imputation strategy–model type, by the missingness, and by the interaction between the strategy–model type and missingness. A Bonferroni planned comparison test was performed to identify differences in the imputation strategy–model types at 20% missingness. This investigation hypothesized that different objective models using linear regression or a random forest classifier would exhibit improved accuracy over that of DTMS [35].
The methodology is summarized in Figure 1.

3. Results

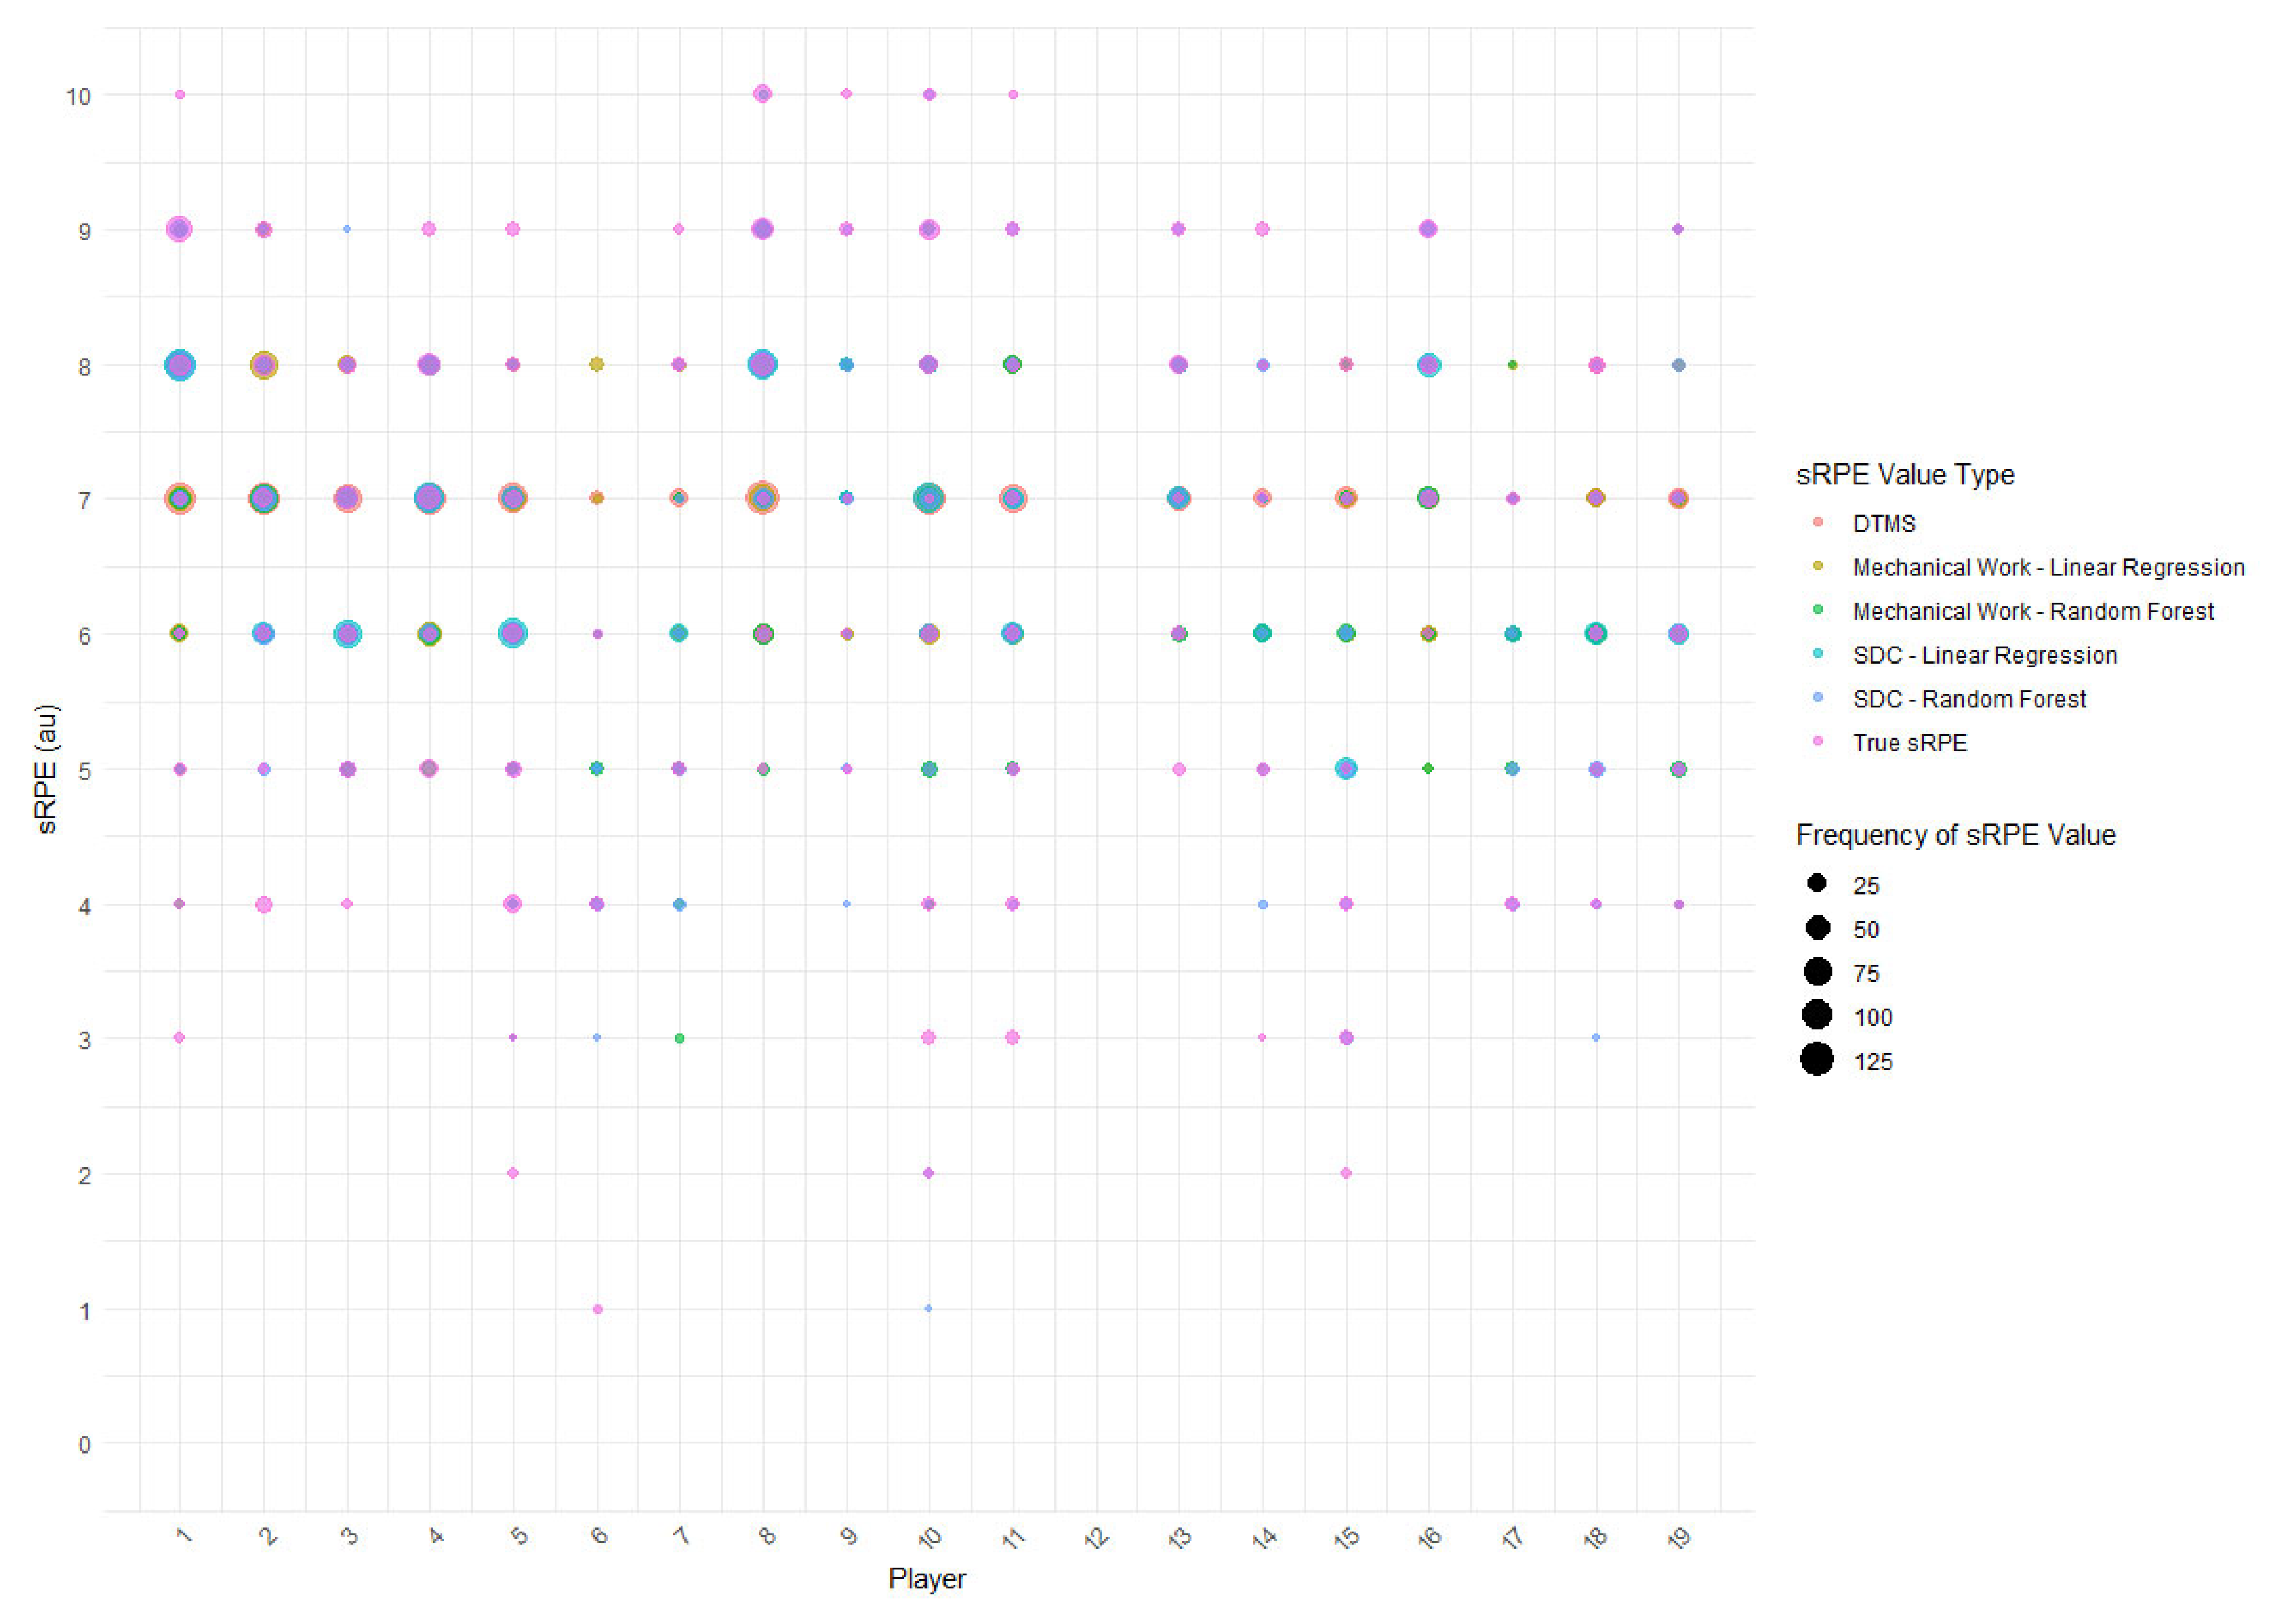
3.1. Description of Data

On average, the athletes covered 1082.86 m of distance in total (±439.78 m), played for 11.04 min (±4.67 min), and experienced 5 contacts (±3 contacts) per match and reported an sRPE of 7 au (±1.8 au) and an sRPE of 84.80 au (±43.67 au), with a mechanical work demand of 56,236.38 Joules (±21,413.36 Joules) and an SDC model workload of 7.77 au (±15.96 au). Figure 2 depicts the true and prediction sRPE values by the model and imputation type.
Figure 3, Figure 4, Figure 5 and Figure 6 depict the residuals and Q-Q plots from the linear regression at 20% missingness for the SDC model (Figure 3 and Figure 4) and mechanical work (Figure 5 and Figure 6).

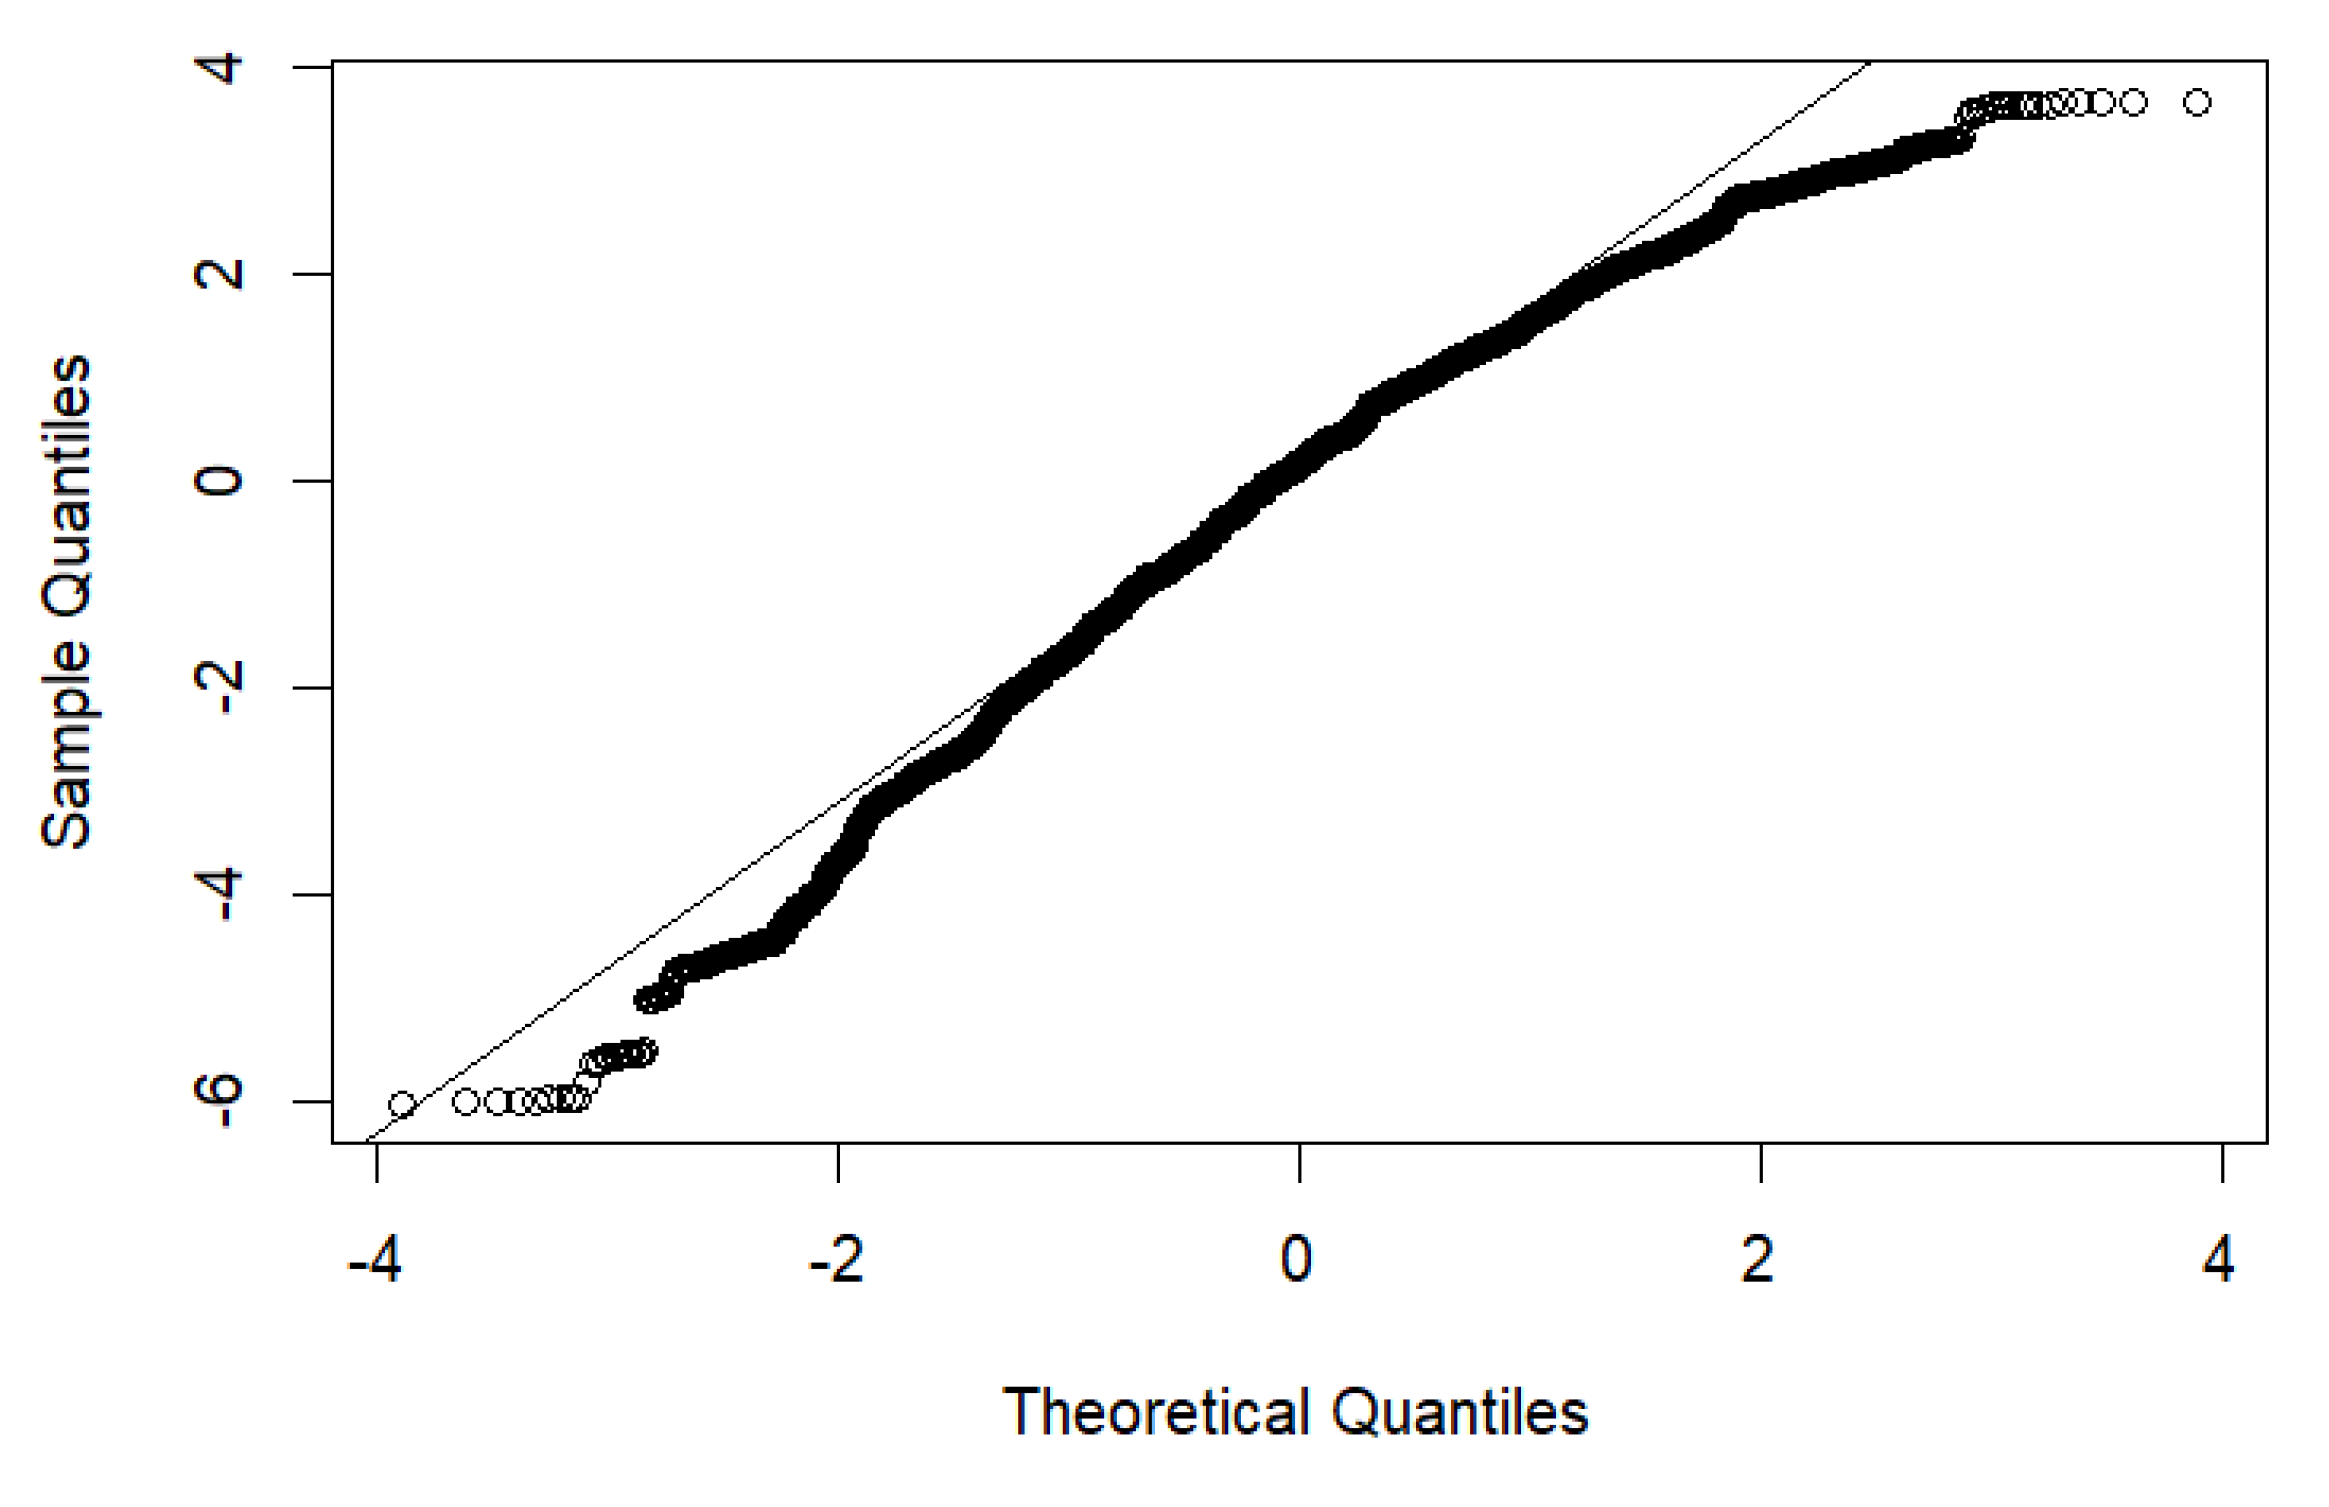
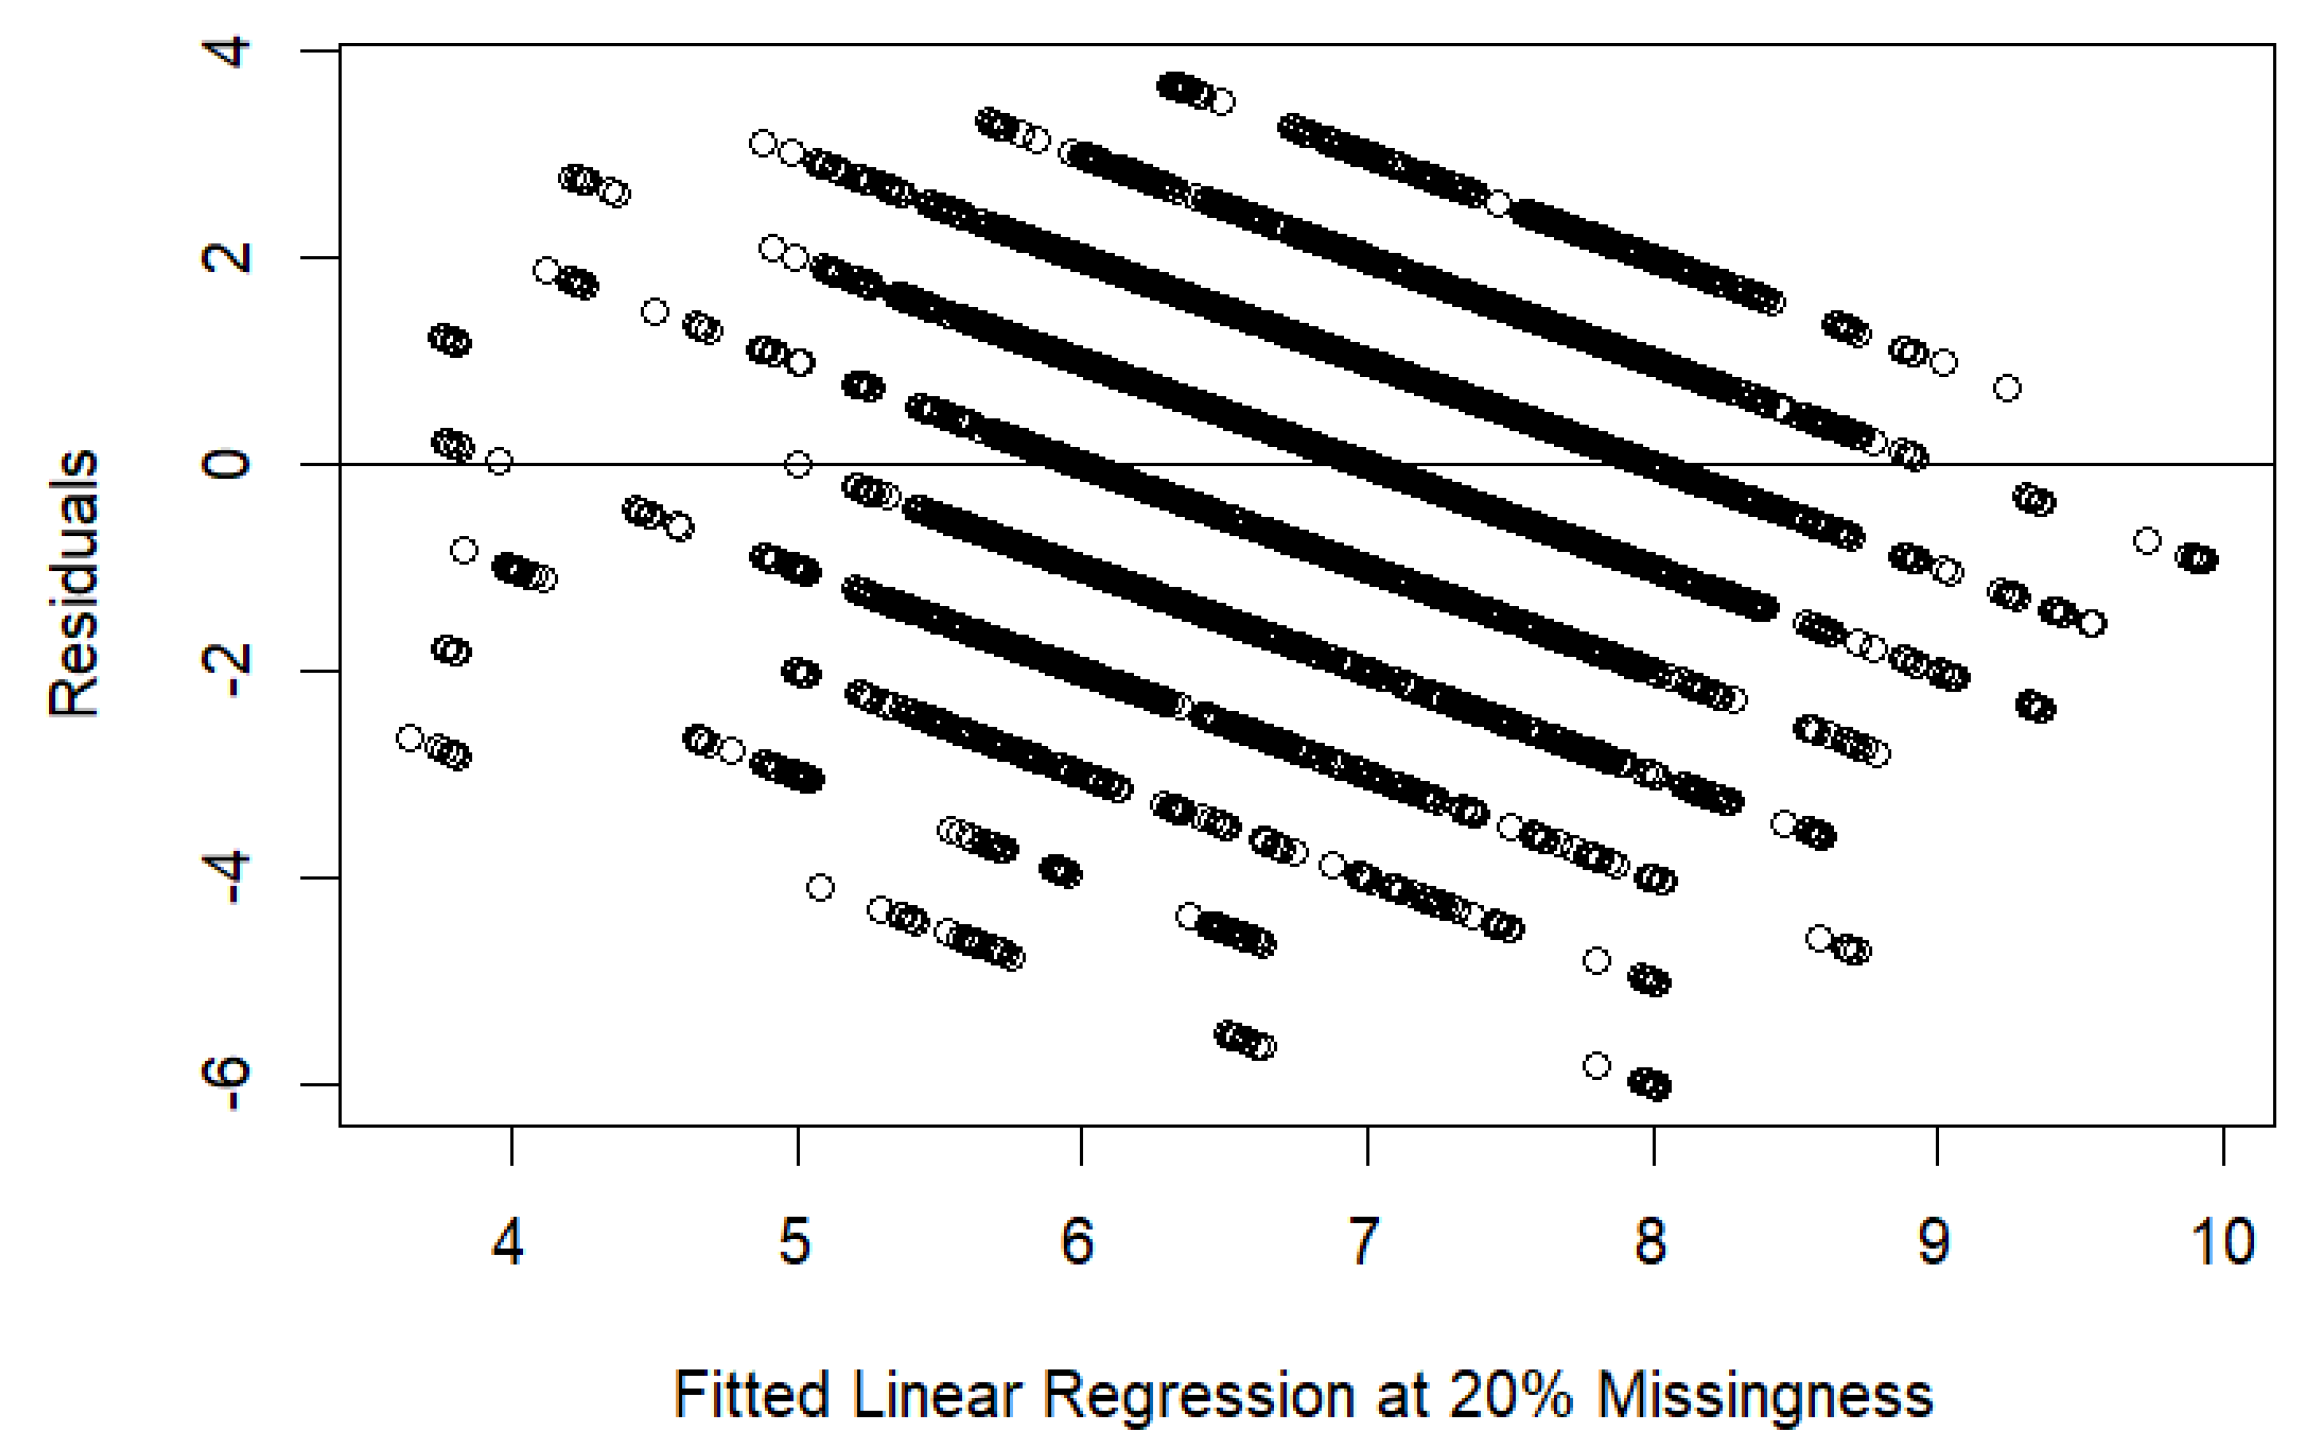
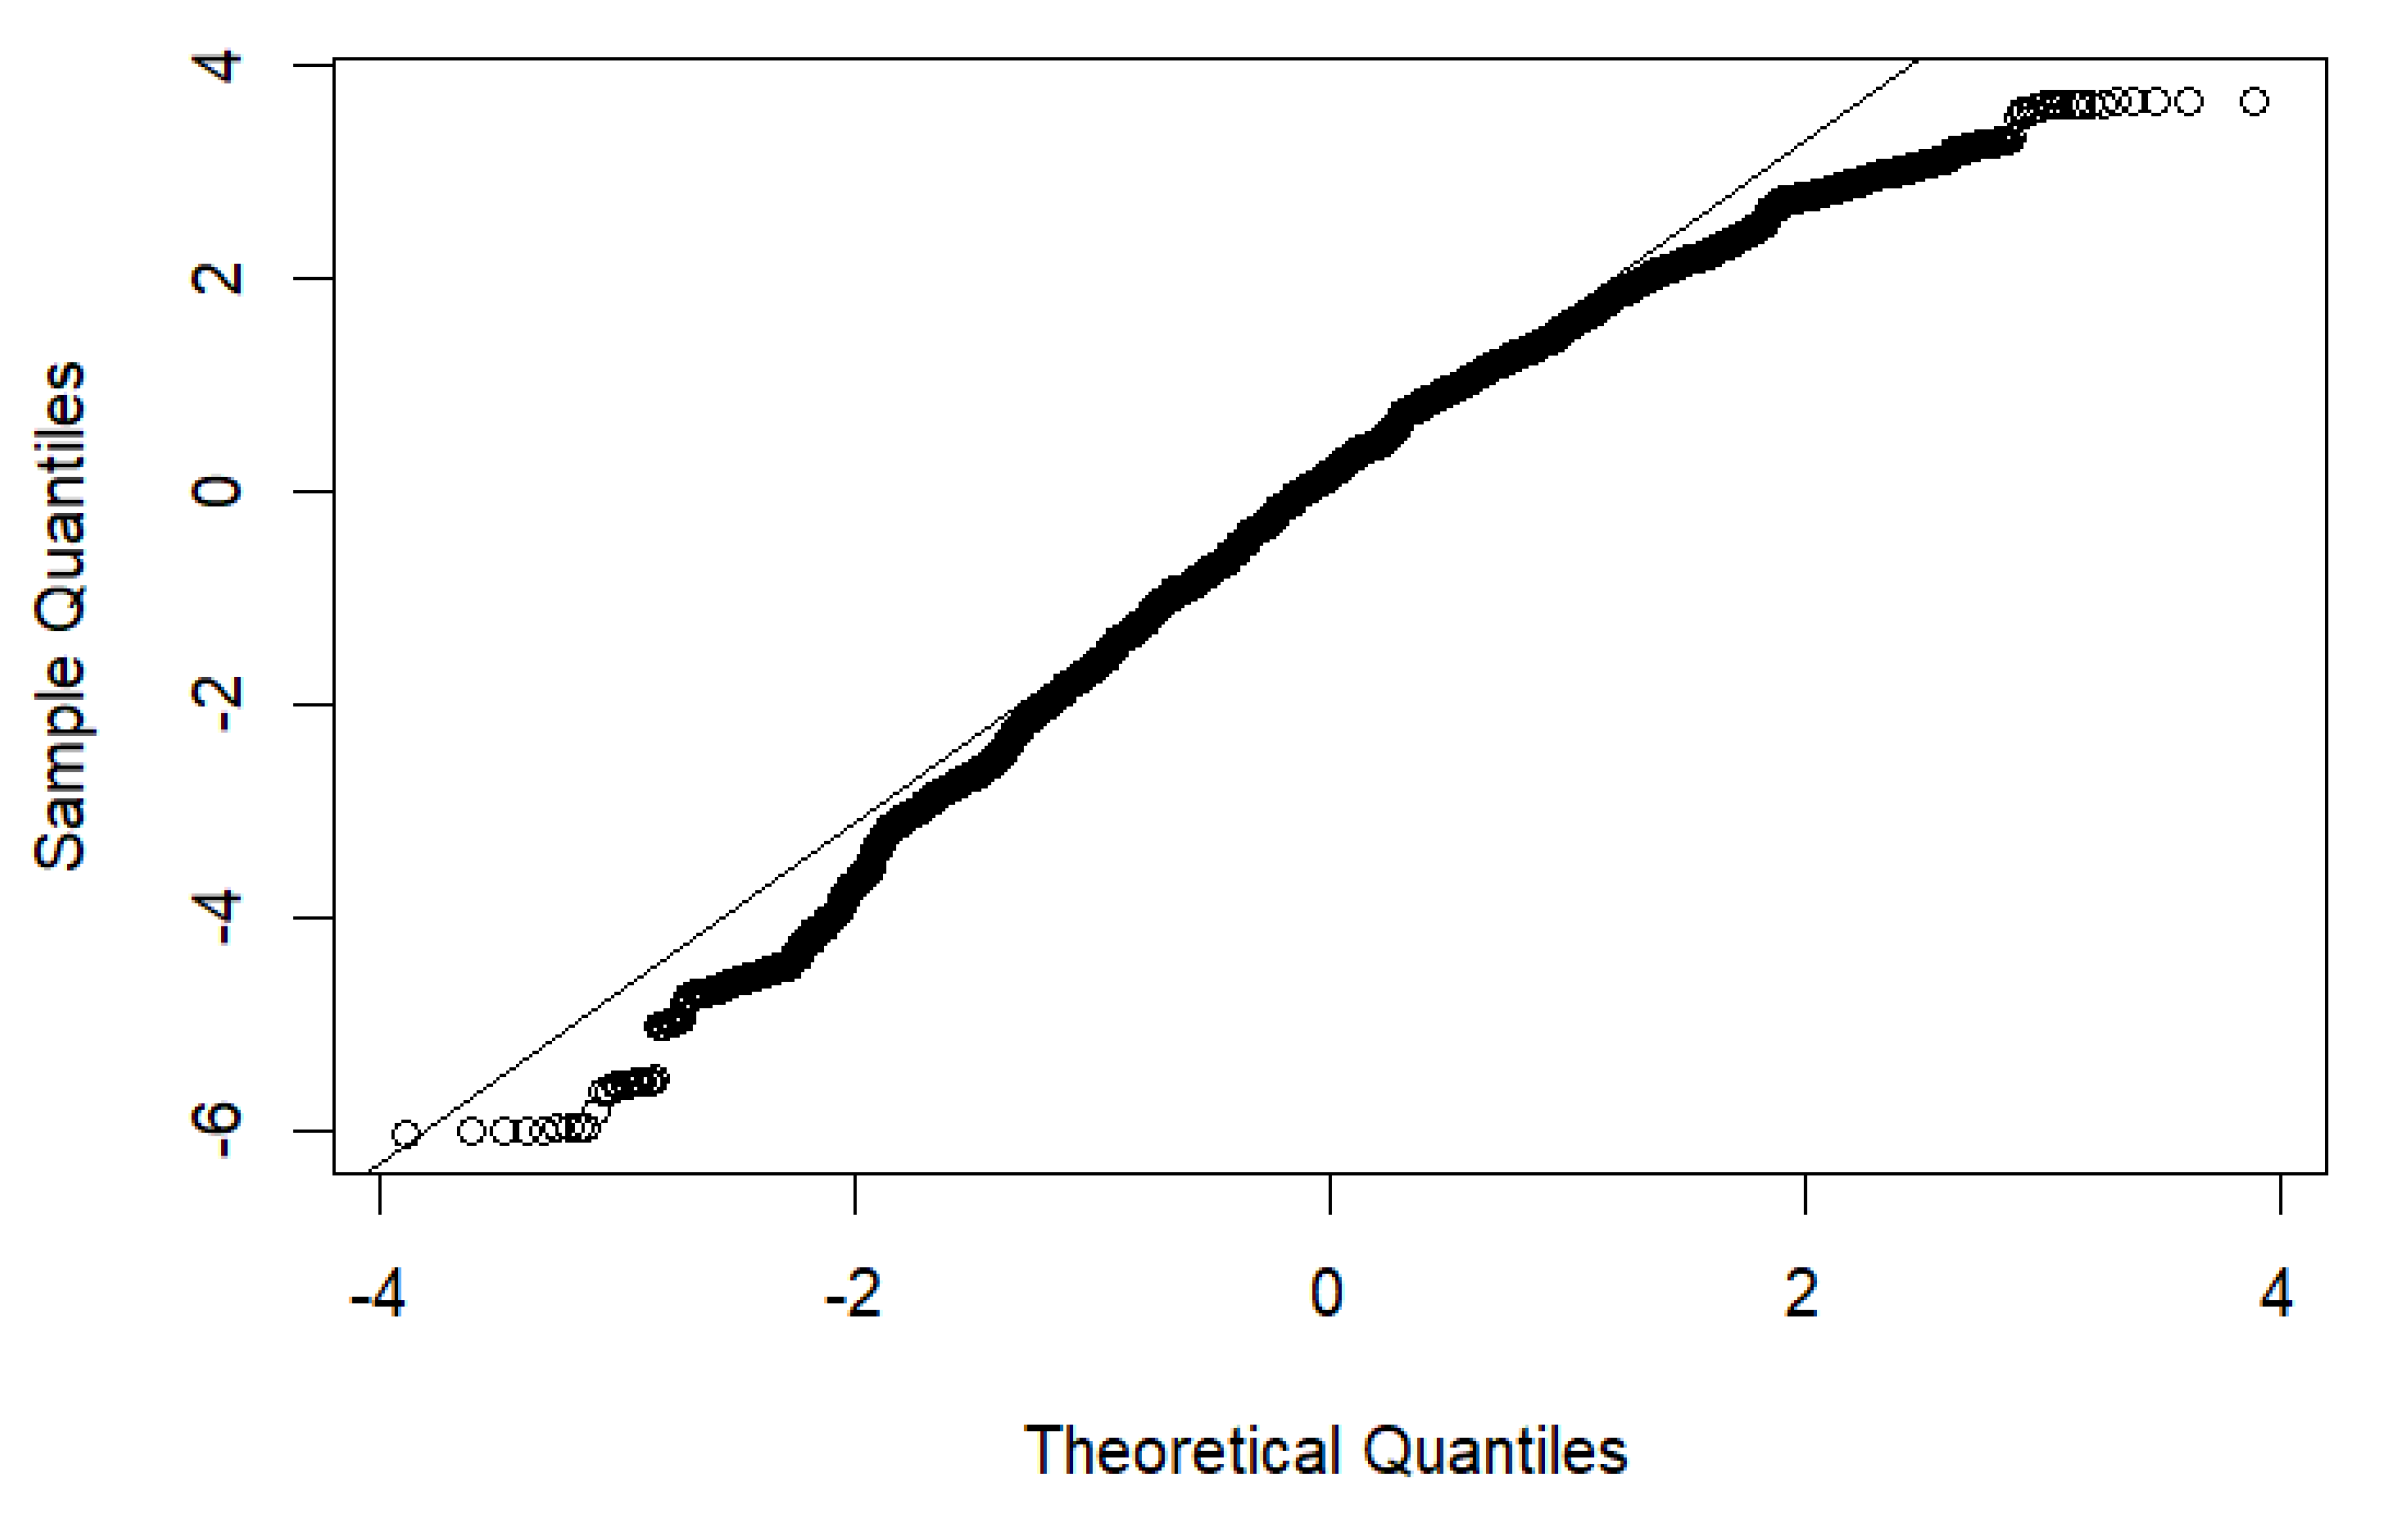
3.2. Model Performance for Imputation of sRPE

The imputation model accuracy, R2, and RMSE values are reported in Table 1.
Paired-samples equivalence tests of the mechanical work-imputed sRPE and SDC-imputed sRPE against the true sRPE resulted in all the tested models being deemed statistically equivalent to the true sRPE data (p < 0.05).
The one-way ANOVA of the data at 20% missingness found a statistically significant difference in the accuracy by the imputation strategy–model type (e.g., mechanical work–linear regression, SDC–random forest) (F (4, 2994) = 24.78, p < 0.05), by the missingness (F (5, 2994) = 0.39, p < 0.05), and by their interaction (F (20, 2994) = 0.89, p < 0.05). A Bonferroni planned comparison of the strategy–model type accuracy at 20% missingness found that all strategy–model types were significantly different from one another (p < 0.05) (Figure 7).

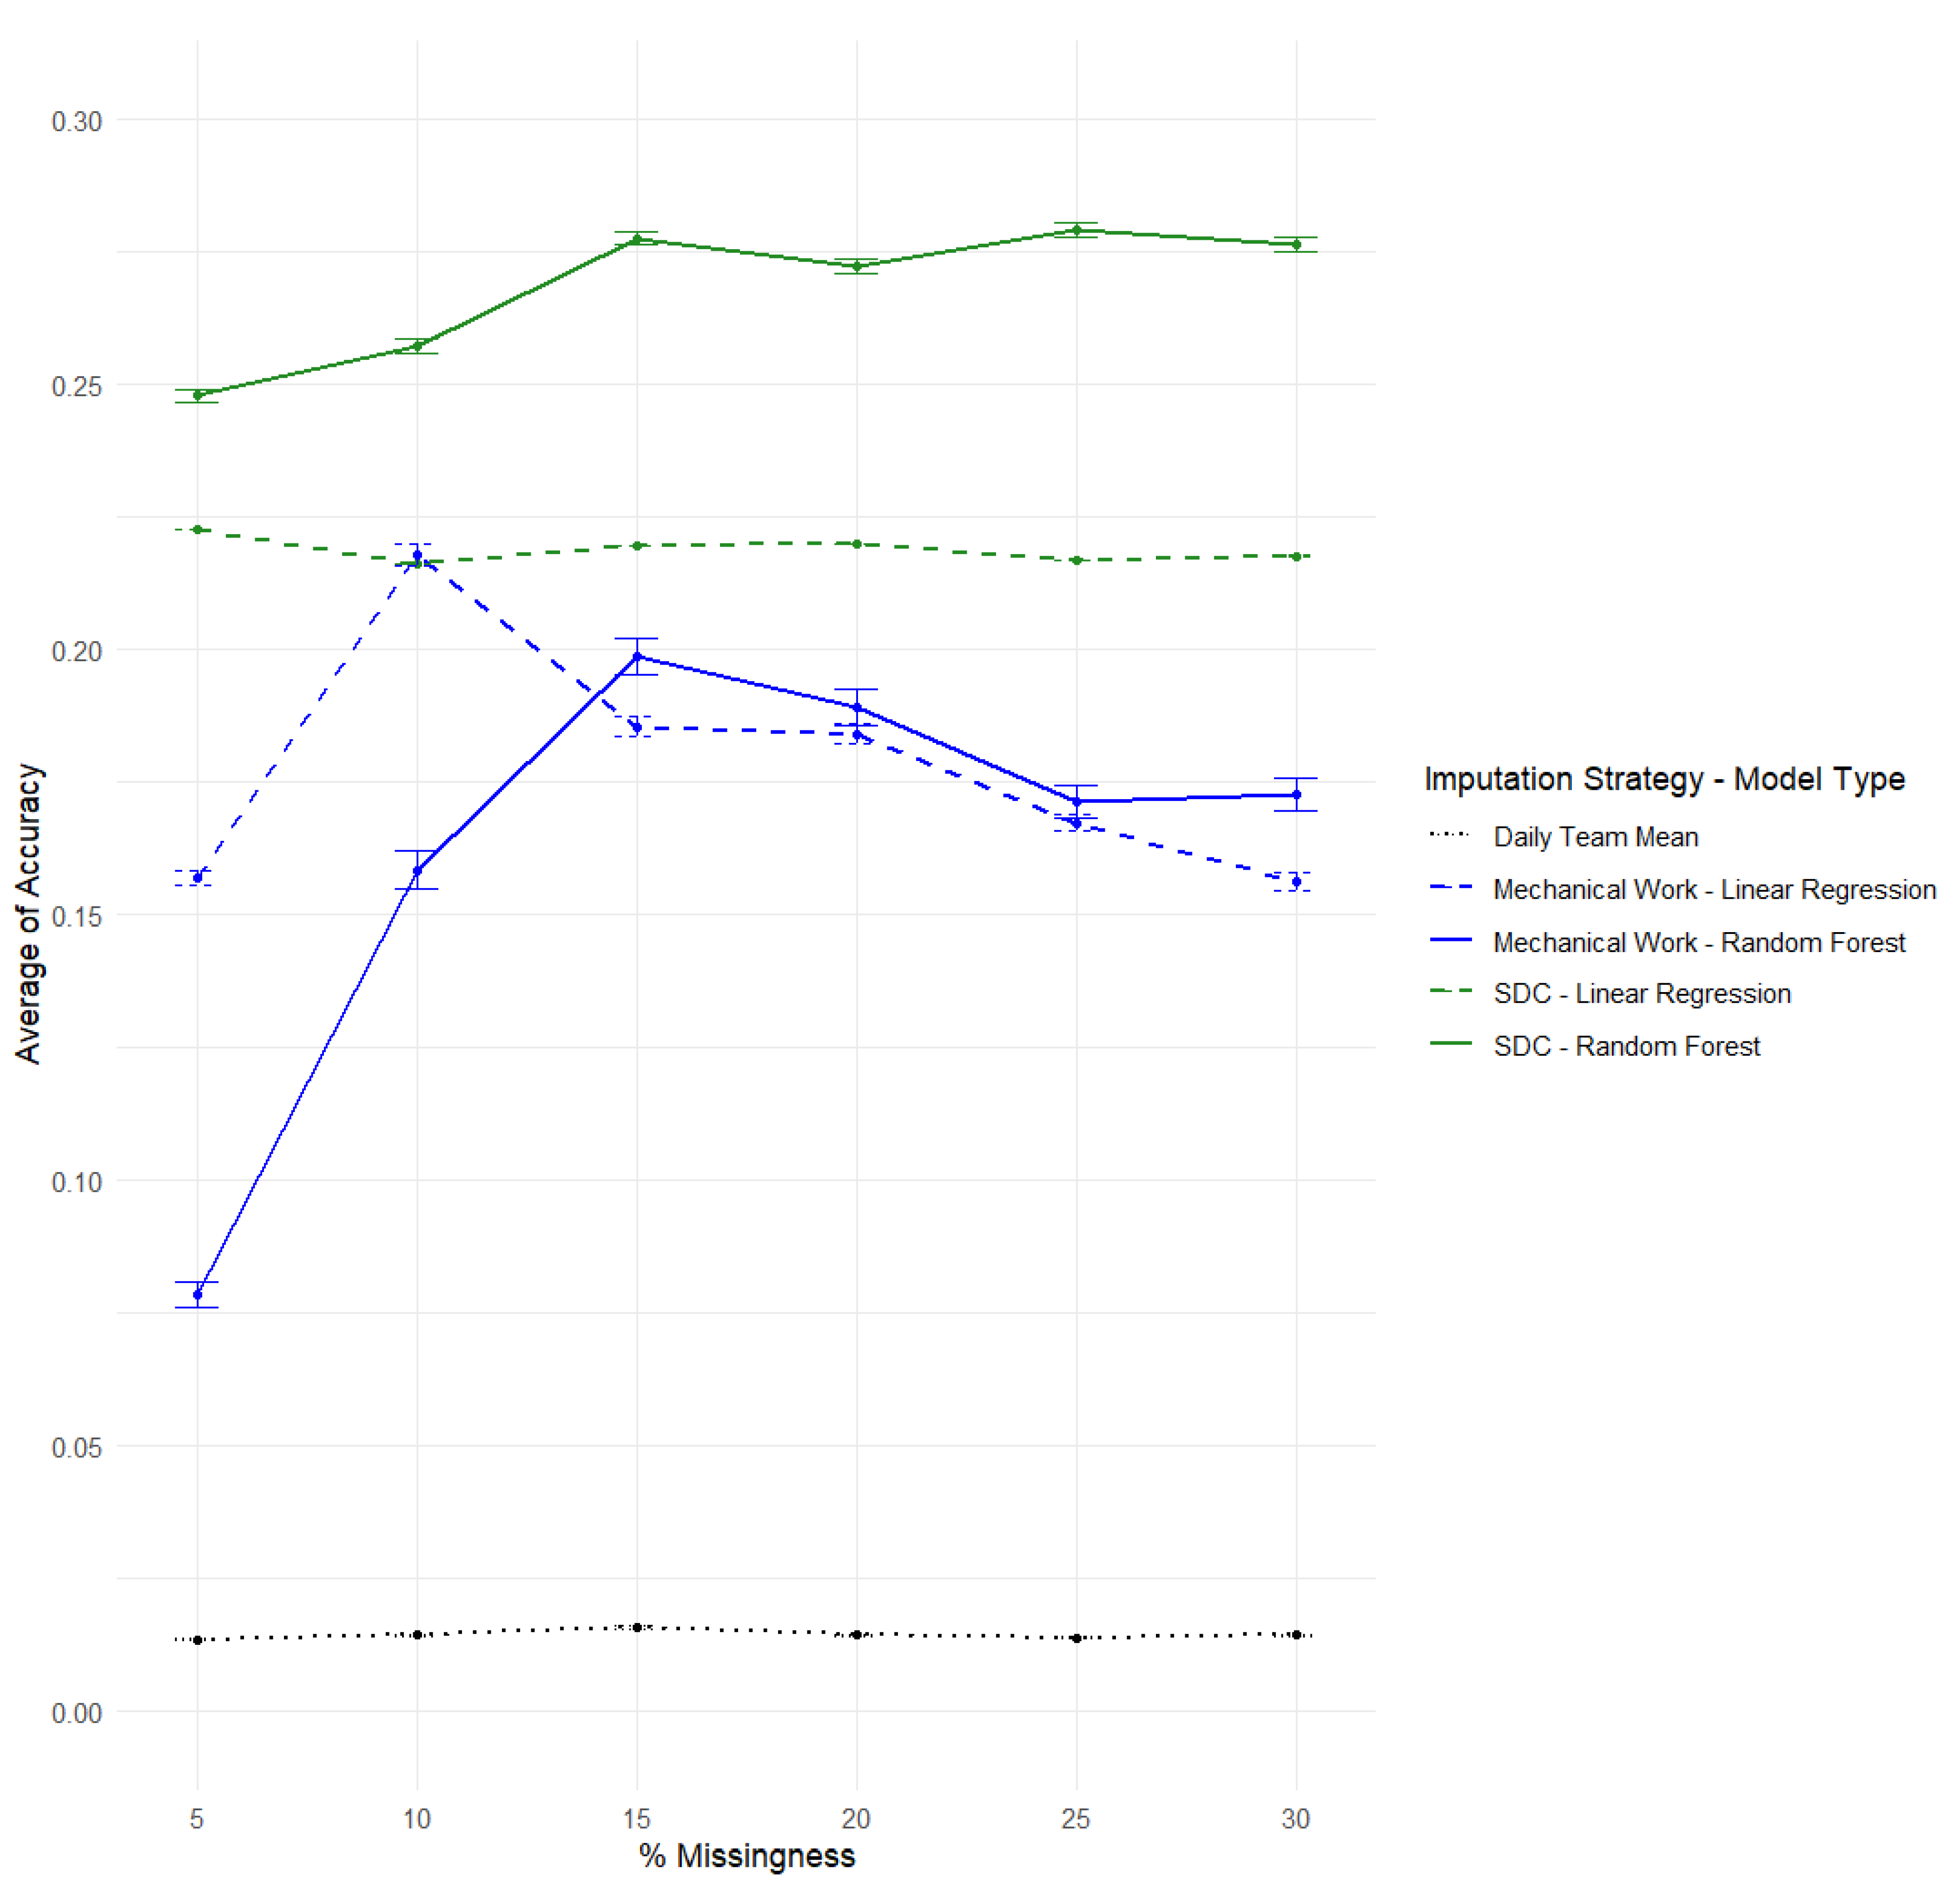
3.3. Comparison of All Models Regarding sRPE Imputation Explanatory Power by Missingness

The accuracy of all the models across all the levels of missingness for the sRPE imputation strategies of the daily team mean, mechanical work, and SDC model is shown in Figure 8.

4. Discussion

The aim of this investigation was to assess the accuracy of competition sRPE data imputed from mechanical work and the SDC model through linear regression random forest classification and using DTMS. This investigation was an important follow-up to previous work by Epp Stobbe et al. (2022), in which different imputation methods were used and one simple objective imputation method was included; the current investigation used more theoretically driven models that, while found to be equivalent, still demonstrated modest accuracy and R2 values with some differences based on the imputation strategy [14]. First, it was found that both objective workload measures, the mechanical work and the SDC model (using either linear regression or random forest regression), outperformed DTMS (Table 1, Figure 7 and Figure 8). Further, in terms of statistical approaches, for each model compared, the random forest model performed the best in terms of accuracy and explanatory power in imputing the sRPE. Finally, the SDC model using random forest regression resulted in the best accuracy and explanatory power of all the strategies and models. However, regardless of the models used, the model accuracy and goodness of fit statistics would be considered poor. This finding further substantiates the difficulty in using subjective measures for athlete load calculation when adherence may limit reporting and data missingness is possible. Overall, these results suggest that while objective models can be used to impute missing sRPE data for use in the calculation of the sRPE-CL, the true athlete-reported value is far superior, and it is recommended that either strategies are developed to minimize missing data or load metrics are used in place of subjective metrics [8,9,13,36].
The very poor performance of DTMS is consistent with previous imputation research on this women’s rugby cohort. This finding aligns with work in the medical and athletic fields suggesting that mean substitution is less effective, with greater errors and variability, compared to regression or classification strategies [13,14,37]. While mean substitution is an efficient strategy, the low accuracy suggests that it does not account for the variance of individual performances within a team sport where an athlete may be required to participate for different lengths of time (starter, substitute), perform specialized tactical activities (kicking, scrummaging), or experience different physical demands (sprints, tackles, carries). The consistently poor performance of mean substitution strategies in imputing the missing athlete workload data emphasizes the limitations of this strategy, including the inability to accurately reflect individual physical demands and individual athletes’ perceptions of the competition environment [13,14].
The results of the equivalence testing suggest that the imputed sRPE data were not different from the true sRPE scores, no matter whether the imputed data was produced using the mechanical work or the SDC model. However, these results must be considered in parallel with the results of the ANOVA test for the model accuracy, which suggested that there were significant differences between the models across the levels of missingness and imputation strategy–model types, as shown in Figure 7 and Figure 8. The differences by the imputation strategy–model type, as shown in Figure 7, indicate that while the models may have been statistically equivalent, they still produced workload values that were not entirely identical. The differences across the levels of missingness and imputation strategy–model types, as shown in Figure 8, suggest that the average accuracy was modest at best, with most models achieving peak accuracy when no more than 15% of the data was missing. With 1002 total rows of data available, 15% missing data would result in about 150 cases missing. In more practical terms, assuming there were six matches per tournament, in which 12 athletes provided post-match sRPE values, a per-tournament missingness rate of 15% would result in about 11 out of the 72 possible sRPE scores missing. This is almost two scores missed for each match played, which is quite high given that the injuries per team–match hover around 0.2 [38]. This suggests that the level of missing data is usually below 15%, which in some cases may mean it is entirely possible to interchange imputation strategies; for example, at 10% missingness linear regression produces the same accuracy whether using the SDC or mechanical work strategy (Figure 8). It remains critical, however, that practitioners understand the level of missingness across their particular datasets as well as consider their knowledge and the available resources when selecting an imputation strategy–model type.
From the results, it can be seen that the SDC model may be the better strategy for the imputation of missing sRPE values, and imputation using a random forest or linear regression model may be preferred over that using the daily team mean. Specifically, the random forest model explained the most global variability in the SDC model (highest R2) while having the highest accuracy. In other fields, Waljee et al. (2013) identified random forest classification as a highly accurate imputation strategy for medical data missing completely at random (MCAR) [37]. Similarly, Hong and Lynn (2020) noted that random forest imputation provides high predictive accuracy for data missing at random (MAR) [39]. In this analysis, missing values in the self-reported athlete sRPE were assumed to be MCAR. This assumption was based on the context in which the sRPE data were collected, typically following training sessions via standardized electronic or paper-based forms. sRPE entries were not dependent on the intensity, duration, or quality of the training session but were most commonly missing due to incidental, non-systematic factors such as non-submission unrelated to performance in cases where athletes may have been called to provide a post-match sample for doping control, required extensive medical treatment for an injury, or been asked to attend to media duties. In contrast, if the missingness had been related to the session difficulty (e.g., athletes avoiding reporting due to the high intensity of a match), this would align more closely with MNAR or MAR. Given the collection environment and lack of bias in the submission patterns, the MCAR assumption was considered reasonable for the purposes of this imputation analysis [37,39].
Random forest models are an appealing option for imputation as the models are able to handle a variety of data types without relying on distributional assumptions [18,40,41]. However, despite their predictive accuracy, random forest models cannot estimate the relationships among imputed values [39]. This suggests that the examination of other models not considered in this particular study may be beneficial in future investigations in order to better identify the relationships between variables [36]. For example, fuzzy clustering, multivariate imputation by chained equations (MICE), or Bayesian approaches may be able to more accurately describe the outcomes for sport datasets as these approaches work on subjectively reported data with an overlap in the input data ranges and limited possible outcomes [36,40,42,43]. Conversely, linear regression models provide a simple, yet viable option for imputation that may be more easily employed than random forest models by practitioners in an applied sport environment where computational resources and time may be limited [44].
The potential to use objective workload measures in team environments is appealing and should be considered in light of the consistency of data collection from ATDs for workload calculations and the great potential for imputing missing subjective data in sRPE collection. Objective measures can also provide a great opportunity to interpret changes in the physical workload connected to discrete factors for which subjective measures may not allow such a determination, such as in the case of rugby where the use of heart rate monitors in competition are not permitted [2]. The SDC model, especially using random forest classification, was shown to be the best model for the imputation of missing sRPE data. This model was shown to provide reasonable predictions of the sRPE-CL and includes components such as contact which have been shown to be related to the sRPE in this cohort [20,45]. The combination of both physical and tactical components within the SDC model, may more broadly represent the athletic experience as it relates to the workload and support the use of this model as a useful strategy for the imputation of missing sRPE values as well as a standalone workload metric [20]. While the SDC model was developed using a women’s rugby sevens population, it may be possible to generalize its applicability across rugby codes and Australian football, where physical contact and decelerations feature heavily [5,10]. Further, the inclusion of a tactical variable, like physical contact, could be replaced with another high-value tactical variable with appropriate investigation. For example, deceleration is a considerable factor in football and so perhaps a variable such as the number of ball touches could be included [16].
The mechanical work was chosen as another load metric for the imputation of the sRPE in this study because it is a purely objective representation of the cumulative athlete kinematic and kinetics collected using ATDs. It has been previously suggested that the mechanical work does not necessarily account for psychological factors relating to competition, leading to different workload values than the sRPE, as demonstrated by Epp-Stobbe et al. (2024) [20]. Therefore, it is understandable that it did not perform as well as the SDC model, which combines both physical and tactical information about the athlete [20]. Further, in cases with few missing values, the limited variability in the sRPE values may not necessarily be reflected in the mechanical work; that is to say, athletes may still demonstrate variable physical outputs, making it difficult to appropriately generalize the mechanical work output to the sRPE. However, this particular strategy may be effective in cases where ATD data is readily available relative to tactical data which may not always be available from film or broadcast footage for particular sports.
It has been demonstrated here and previously that the imputation of the sRPE is difficult and that the true, collected value is vastly superior to the imputed value [14]. This strongly supports the need to develop strategies to minimize missing data and maximize the athlete reporting adherence [46]. In their development and evaluation of a training monitoring system for rugby union athletes, Griffin et al. (2020) found that there were many reasons for data missingness, and perhaps the most common was the athletes’ perceived usefulness of the load measure [46]. The use of objective measures may provide a meaningful strategy to monitor athletes’ physical output without the burden of reporting. GNSS units provide an “invisible monitoring” strategy that enable practitioners to gather information about the physical demands of competition as well as ensure that athletes are appropriately meeting or exceeding these demands in training to ensure a safe and lengthy sporting career [1]. Further, achieving initial and continued compliance is paramount to sustained data collection. Griffin et al. (2020) suggest that developing appropriate educational resources for athletes as well as an effective feedback loop between the coach and/or sport scientist is critical to increase adherence to and athletes buying into the use of training load measures [46,47]. Nevertheless, ensuring a complete dataset in an efficient and reliable manner is key for athlete load management [11]. To that end, it remains important for practitioners to appreciate the value of both subjective and objective reflections of athletes’ load, where the athlete’s subjective perception of the experience holds value in different ways and should be used alongside measures of the athlete’s physical output [7,10,11]. While the results of this study identified imputation strategies that may be applied instead of the popular DTMS method, the strategy applied may depend on the nature of the high-performance sport environment, including the access to appropriate computing hardware and software, time demands, and practitioner knowledge [48,49,50,51].

5. Conclusions

Practically, this investigation suggests that the mechanical work or the SDC model may be reasonable alternatives for the imputation of missing sRPE data, meaning that practitioners are not completely reliant on athlete’s self-reported data to understand elements of an athlete’s performance. Further investigation into the ability of these models derived from objective physical data to appropriately reflect athletic performance as a whole, beyond the physical output, is required. Ultimately, practitioners are encouraged to collect and clean data from ATDs directly wherever possible before applying imputation methods to workload models that include factors that are meaningful and relevant to their sport.

Author Contributions

Conceptualization, A.E.-S., M.K. and M.-C.T.; methodology, A.E.-S., M.K. and M.-C.T.; software, A.E.-S., M.K. and M.-C.T.; validation, A.E.-S.; formal analysis, A.E.-S., M.K. and M.-C.T.; investigation, A.E.-S.; resources, A.E.-S.; data curation, A.E.-S.; writing—original draft preparation, A.E.-S.; writing—review and editing, M.K. and M.-C.T.; visualization, A.E.-S.; supervision, M.K. and M.-C.T.; project administration, M.K.; funding acquisition, A.E.-S., M.K. and M.-C.T. All authors have read and agreed to the published version of the manuscript.

Funding

This work was part of a project funded by Mitacs. The Mitacs Accelerate PhD Fellowship (IT-16129) was awarded to A.E.-S., and the project was supervised by M.K. and M.-C.T.

Institutional Review Board Statement

Ethical approval for the study was obtained from the University of Victoria’s Human Research Ethics Board (19-0546, 20 November 2019).

Informed Consent Statement

Informed consent was obtained from all the subjects involved in the study.

Data Availability Statement

The data presented in this study are available on request from the corresponding author, A.E.-S., due to the sensitive nature of high-performance sport data.

Acknowledgments

The authors would like to extend their gratitude to Callum Morris, along with the players and coaching staff, for their invaluable cooperation throughout this project.

Conflicts of Interest

The authors declare no conflicts of interest. The funders had no role in the design of the study; in the collection, analyses, or interpretation of data; in the writing of the manuscript; or in the decision to publish the results.

References

  1. Gabbett, T.J. The training-injury prevention paradox: Should athletes be training smarter and harder? Br. J. Sports Med. 2016, 50, 273–280. [Google Scholar] [CrossRef] [PubMed]
  2. Foster, C.; Rodriguez-Marroyo, J.A.; De Koning, J.J. Monitoring training loads: The past, the present, and the future. Int. J. Sports Physiol. Perform. 2017, 12, s2-2–s2-8. [Google Scholar] [CrossRef] [PubMed]
  3. World Rugby. Approved Devices. World Rugby, 2025. Available online: https://www.world.rugby/the-game/facilities-equipment/equipment/devices/ (accessed on 13 February 2025).
  4. Cummins, C.; Orr, R.; O’Connor, H.; West, C. Global positioning systems (GPS) and microtechnology sensors in team sports: A systematic review. Sports Med. 2013, 43, 1025–1042. [Google Scholar] [CrossRef]
  5. Clarke, A.C.; Anson, J.M.; Pyne, D.B. Physiologically based GPS speed zones for evaluating running demands in women’s rugby sevens. J. Sport Sci. 2015, 33, 1101–1108. [Google Scholar] [CrossRef]
  6. Clarke, A.C.; Anson, J.M.; Pyne, D.B. Proof of concept of automated collision detection technology in rugby sevens. J. Strength Cond. Res. 2017, 31, 1116–1120. [Google Scholar] [CrossRef]
  7. Haddad, M.; Stylianides, G.; Djaoui, L.; Dellal, A.; Chamari, K. Session-RPE method for training load monitoring: Validity, ecological usefulness, and influencing factors. Front. Neurosci. 2017, 11, 612. [Google Scholar] [CrossRef] [PubMed]
  8. Benson, L.C.; Stilling, C.; Owoeye, O.B.A.; Emery, C.A. Evaluating methods for imputing missing data from longitudinal monitoring of athlete workload. J. Sports Sci. Med. 2021, 20, 188–196. [Google Scholar] [CrossRef]
  9. Griffin, A.; Kenny, I.C.; Comyns, T.M.; Purtill, H.; Tiernan, C.; O’Shaughnessy, E.; Lyons, M. Training load monitoring in team sports: A practical approach to addressing missing data. J. Sports Sci. 2021, 39, 2161–2171. [Google Scholar] [CrossRef]
  10. Eston, R. Use of ratings of perceived exertion in sports. Int. J. Sports Physiol. Perform. 2012, 7, 175–182. [Google Scholar] [CrossRef]
  11. Saw, A.E.; Main, L.C.; Gastin, P.B. Monitoring the athlete training response: Subjective self-reported measures trump commonly used objective measures: A systematic review. Br. J. Sports Med. 2016, 50, 281–291. [Google Scholar] [CrossRef]
  12. Windt, J.; Ardern, C.L.; Gabbett, T.J.; Khan, K.M.; Cook, C.E.; Sporer, B.C.; Zumbo, B.D. Getting the most out of intensive longitudinal data: A methodological review of workload–injury studies. BMJ Open 2018, 8, e022626. [Google Scholar] [CrossRef]
  13. Carey, D.; Ong, K.; Morris, M.; Crow, J.; Crossley, K. Predicting ratings of perceived exertion in Australian football players: Methods for live estimation. Int. J. Comput. Sci. Sport 2016, 15, 64–77. [Google Scholar] [CrossRef]
  14. Epp-Stobbe, A.; Tsai, M.-C.; Klimstra, M. Comparison of imputation methods for missing rate of perceived exertion data in rugby. Mach. Learn. Knowl. Extr. 2022, 4, 827–838. [Google Scholar] [CrossRef]
  15. Delaney, J.A.; Cummins, C.J.; Thornton, H.R.; Duthie, G.M. Importance, reliability, and usefulness of acceleration measures in team sports. J. Strength Cond. Res. 2018, 32, 3485–3493. [Google Scholar] [CrossRef]
  16. Buchheit, M. Programming high-speed running and mechanical work in relation to technical contents and match schedule in professional soccer. Sport Perform. Sci. Rep. 2019, 69, 1–3. [Google Scholar]
  17. Tuft, K.; Kavaliauskas, M. Relationship between internal and external training load in field hockey. Int. J. Strength Cond. 2020, 1, 24. [Google Scholar] [CrossRef]
  18. Epp-Stobbe, A.; Tsai, M.C.; Klimstra, M. Work smarter not harder: Mechanical work as a measure of athlete workload. ISBS Proc. Arch. 2024, 42, 51. Available online: https://commons.nmu.edu/isbs/vol42/iss1/51 (accessed on 13 May 2025).
  19. Bartlett, J.D.; O’Connor, F.; Pitchford, N.; Torres-Ronda, L.; Robertson, S.J. Relationships between internal and external training load in team-sport athletes: Evidence for an individualized approach. Int. J. Sports Physiol. Perform. 2017, 12, 230–234. [Google Scholar] [CrossRef]
  20. Epp-Stobbe, A.; Tsai, M.-C.; Klimstra, M.D. Predicting athlete workload in women’s rugby sevens using GNSS sensor data, contact count and mass. Sensors 2024, 24, 6699. [Google Scholar] [CrossRef]
  21. King, D.; Hume, P.; Clark, T. Video analysis of tackles in professional rugby league matches by player position, tackle height and tackle location. Int. J. Perform. Anal. Sport 2010, 10, 241–254. [Google Scholar] [CrossRef]
  22. Wheeler, W.K.; Wiseman, R.; Lyons, K. Tactical and technical factors associated with effective ball offloading strategies during the tackle in rugby league. Int. J. Perform. Anal. 2011, 11, 392–409. [Google Scholar] [CrossRef]
  23. R Core Team. The R Stats Package. (n.d.). Available online: https://stat.ethz.ch/R-manual/R-devel/library/stats/html/stats-package.html (accessed on 25 August 2022).
  24. Ripley, B.; Venables, B.; Bates, D.M.; Hornik, K.; Gebhardt, A.; Firth, D. Package “MASS”. 2022. Available online: https://cran.r-project.org/web/packages/MASS/MASS.pdf (accessed on 25 August 2022).
  25. Friedman, J.; Hastie, T.; Tibshirani, R.; Narasimhan, B.; Tay, K.; Simon, N.; Qian, J.; Yang, J. Package “glmnet”. 2022. Available online: https://cran.r-project.org/web/packages/glmnet/glmnet.pdf (accessed on 25 August 2022).
  26. Tibshirani, R. Regression shrinkage and selection via the lasso. J. R. Stat. Soc. 1996, 58, 267–288. [Google Scholar] [CrossRef]
  27. Beygelzimer, A.; Kakadet, S.; Langford, J.; Arya, S.; Mount, D.; Li, S. Package “FNN”. 2022. Available online: https://cran.r-project.org/web/packages/FNN/FNN.pdf (accessed on 25 August 2022).
  28. Liaw, A.; Wiener, M. Package “randomForest”. 2022. Available online: https://cran.rproject.org/web/packages/randomForest/randomForest.pdf (accessed on 25 August 2022).
  29. Meyer, D.; Dimitriadou, E.; Hornik, K.; Weingessel, A.; Leisch, F.; Chang, C.C.; Lin, C.C. Package “e1071”. 2022. Available online: https://cran.r-project.org/web/packages/e1071/e1071.pdf (accessed on 25 August 2022).
  30. Hsu, C.; Chang, C.C.; Lin, C.J. A Practical Guide to Support Vector Classification. 2003, pp. 1396–1400. Available online: https://www.csie.ntu.edu.tw/~cjlin/papers/guide/guide.pdf (accessed on 25 August 2022).
  31. Fritsch, S.; Guenther, F.; Wright, M.N.; Suling, M.; Mueller, S.M. Package “neuralnet”. 2019. Available online: https://cran.r-project.org/web/packages/neuralnet/neuralnet.pdf (accessed on 25 August 2022).
  32. Celton, M.; Malpertuy, A.; Lelandais, G.; de Brevern, A.G. Comparative analysis of missing value imputation methods to improve clustering and interpretation of microarray experiments. BMC Genom. 2010, 11, 15. [Google Scholar] [CrossRef]
  33. Lakens, D.; Scheel, A.M.; Isager, P.M. Equivalence testing for psychological research: A tutorial. Adv. Methods Pract. Psychol. Sci. 2018, 1, 259–269. [Google Scholar] [CrossRef]
  34. Lakens, D. Equivalence tests: A practical primer for t tests, correlations, and meta-analyses. Soc. Psychol. Pers. Sci. 2017, 8, 355–362. [Google Scholar] [CrossRef]
  35. Kang, H. The prevention and handling of the missing data. Korean J. Anesthesiol. 2013, 64, 402–406. [Google Scholar] [CrossRef]
  36. Schmitt, P.; Mandel, J.; Guedj, M. A comparison of six methods for missing data imputation. J. Biomet. Biostat. 2015, 6, 1. Available online: https://lgreski.github.io/datasciencedepot/references/a-comparison-of-six-methods-for-missing-data-imputation-2155-6180-1000224.pdf (accessed on 13 May 2025).
  37. Waljee, A.K.; Mukherjee, A.; Singal, A.G.; Zhang, Y.; Warren, J.; Balis, U.; Marrero, J.; Zhu, J.; Higgins, P.D. Comparison of imputation methods for missing laboratory data in medicine. BMJ Open 2013, 3, e002847. [Google Scholar] [CrossRef]
  38. Fuller, C.W.; Taylor, A. Injury Surveillance Studies: 2023/24 Men’s and Women’s Tournaments Final Report. World Rugby, 2024. Available online: https://www.world.rugby/the-game/player-welfare/research/injury-surveillance (accessed on 13 May 2025).
  39. Hong, S.; Lynn, H.S. Accuracy of random-forest-based imputation of missing data in the presence of non-normality, non-linearity, and interaction. BMC Med. Res. Methodol. 2020, 20, 199. [Google Scholar] [CrossRef]
  40. Stavseth, M.R.; Clausen, T.; Røislien, J. How handling missing data may impact conclusions: A comparison of six different imputation methods for categorical questionnaire data. SAGE Open Med. 2019, 7, 2050312118822912. [Google Scholar] [CrossRef]
  41. Kokla, M.; Virtanen, J.; Kolehmainen, M.; Paananen, J.; Hanhineva, K. Random forest-based imputation outperforms other methods for imputing LC-MS metabolomics data: A comparative study. BMC Bioinform. 2019, 20, 492. [Google Scholar] [CrossRef] [PubMed]
  42. Shah, A.D.; Bartlett, J.W.; Carpenter, J.; Nicholas, O.; Hemingway, H. Comparison of random forest and parametric imputation models for imputing missing data using MICE: A CALIBER study. Am. J. Epidemiol. 2014, 179, 764–774. [Google Scholar] [CrossRef] [PubMed]
  43. Rahman, M.G.; Islam, M.Z. Missing value imputation using a fuzzy clustering-based EM approach. Knowl. Inf. Syst. 2016, 46, 389–422. [Google Scholar] [CrossRef]
  44. Waldmann, P.; Mészáros, G.; Gredler, B.; Fürst, C.; Sölkner, J. Evaluation of the lasso and the elastic net in genome-wide association studies. Front. Genet. 2013, 4, 270. [Google Scholar] [CrossRef]
  45. Epp-Stobbe, A.; Tsai, M.; Morris, C.; Klimstra, M. The influence of physical contact on athlete load in international female rugby sevens. J. Strength Cond. Res. 2022, 37, 383–387. [Google Scholar] [CrossRef]
  46. Griffin, A.; Kenny, I.C.; Comyns, T.M.; Lyons, M. The Development and Evaluation of a Training Monitoring System for Amateur Rugby Union. Appl. Sci. 2020, 10, 7816. [Google Scholar] [CrossRef]
  47. Bourdon, P.C.; Cardinale, M.; Murray, A.; Gastin, P.; Kellmann, M.; Varley, M.C.; Gabbett, T.J.; Coutts, A.J.; Burgess, D.J.; Gregson, W.; et al. Monitoring athlete training loads: Consensus statement. Int. J. Sport Physiol. 2017, 12, 161–170. [Google Scholar] [CrossRef]
  48. Yin, M.; Wortman Vaughan, J.; Wallach, H. Understanding the Effect of Accuracy on Trust in Machine Learning Models. In Proceedings of the 2019 CHI Conference on Human Factors in Computing Systems, Glasgow, UK, 4–9 May 2019. [Google Scholar] [CrossRef]
  49. Bartlett, J.D.; Drust, B. A framework for effective knowledge translation and performance delivery of Sport Scientists in professional sport. Eur. J. Sport Sci. 2021, 21, 1579–1587. [Google Scholar] [CrossRef]
  50. Brocherie, F.; Beard, A. All alone we go faster, together we go further: The necessary evolution of professional and elite sporting environment to bridge the gap between research and practice. Front. Sports Act Living 2021, 2, 631147. [Google Scholar] [CrossRef]
  51. Coutts, A.J. Working fast and working slow: The benefits of embedding research in high performance sport. Int. J. Sports Physiol. Perform. 2016, 11, 1–2. [Google Scholar] [CrossRef]
Figure 1. Methodology framework for data collection, imputation, and analysis.
Applsci 15 06520 g001
Figure 2. Raw sRPE values for true scores as well as all imputation strategy–model types.
Applsci 15 06520 g002
Figure 3. Residual plot for linear regression at 20% missingness with SDC model.
Applsci 15 06520 g003
Figure 4. Q-Q plot for linear regression at 20% missingness with SDC model.
Applsci 15 06520 g004
Figure 5. Residual plot for linear regression at 20% missingness with mechanical work model.
Applsci 15 06520 g005
Figure 6. Q-Q plot for linear regression at 20% missingness with mechanical work model.
Applsci 15 06520 g006
Figure 7. Average accuracy by missingness for all imputation strategy–model types; * denotes statistical significance.
Applsci 15 06520 g007
Figure 8. Average accuracy by missingness for all model types and both imputation strategies.
Applsci 15 06520 g008
Table 1. Imputation model accuracy, R2, and RMSE at 20% missingness by strategy.
StrategyModelAccuracyR2RMSE
DTMS 0.00000.03771.80
Mechanical WorkLinear Regression0.18410.08541.78
Random Forest0.18910.15901.71
SDC ModelLinear Regression0.22000.22871.61
Random Forest0.27240.33831.51
Disclaimer/Publisher’s Note: The statements, opinions and data contained in all publications are solely those of the individual author(s) and contributor(s) and not of MDPI and/or the editor(s). MDPI and/or the editor(s) disclaim responsibility for any injury to people or property resulting from any ideas, methods, instructions or products referred to in the content.

