Abstract
Gear condition monitoring is predominantly executed through the utilization of acceleration sensors positioned on the housing. However, recent advancements have identified measuring the instantaneous angular speed as a compelling alternative as it shortens the transmission path and therefore provides high-quality rotational angle information that can be used to increase damage prediction accuracy, particularly under transient operating conditions. Additionally, there are a variety of methodologies for integrating sensors into gears, which underscores the necessity for high-quality condition data. However, it should be noted that a significant amount of effort is required to successfully integrate these sensors into the rotating system. This publication uses a gear wheel sensor that employs the gear itself as a material measure to acquire rotational angle data and to deduce the damage condition. A magnetoresistive sensor is integrated into the gearbox housing radially facing a ferromagnetic gear and measures the rotational angle by the gear teeth. Various artificial tooth flank damages are applied to the pinion. The rotational angle is measured with the gear sensor, and the damage state is classified with a random forest classifier using established evaluations in the time and frequency domains. The tests are conducted under stationary operating conditions at an array of speed and torque levels. Additionally, they are performed under transient operating conditions, employing speed ramps at constant torque. The results of the classification are evaluated by means of classification accuracy and confusion matrices and compared with those obtained via a classic encoder at the pinion shaft and an acceleration sensor at the gearbox housing.
1. Introduction
Failure of machine elements, such as bearings, gears, and shafts, due to different causes is the major root cause for the unexpected downtime of industrial and automotive drive systems, causing considerable economic damage. Hence, engineers strive to reduce unexpected and unnecessary maintenance intervals through novel approaches for (early) failure detection to improve productivity or profitability. Research drives the development of new methods to detect faults as early as possible—preferably before the consecutive breakdown of technical systems—through new measuring and analysis procedures. However, in most cases, the fault diagnosis of machine elements is restricted to conventional vibration analysis in lower-frequency bands, which have a complex transfer path from the damage origin at the gears to the acceleration sensor at the gear housing.
Therefore, condition monitoring facilitating rotational angle measurement has received interest in recent years. Teeth damage at helical gears and a broken tooth at a spur gear can be detected with optical rotation angle sensors [1]. Present publications utilize a wide range of resolutions for the rotational angle sensors, ranging from 60 pulses per revolution [2] to 5000 pulses per revolution [3]. This enables the detection of damage with both systems. A comparative analysis between a high-end and low-end configuration has been conducted [4]. They confirm that both systems can detect damage, but the high-end setup provides a significantly higher signal-to-noise ratio. Additionally, a study has been conducted on the classification of cracks, wear, chipped, and missing teeth under stationary and transient operating conditions on spur gearboxes [5,6]. As an extension to utilizing a single rotational angle sensor, the implementation of two rotational angle sensors facilitates the assessment of transmission error [7,8] for the purpose of quantitative wear measurement. An intensive analysis of rotational angle measurement is provided in a review [9]. Rotational angle measurement provides high-quality information with a short transfer path to the gears, which is of interest for gear condition monitoring.
In addition to measuring the angle of rotation, there are also various approaches to integrating sensors into a gear [10,11]. However, the wireless sensors cannot be supplied directly with energy and must therefore be installed in a manner that maximizes energy efficiency. To this end, the microcontrollers employed must also be optimized, for instance, by decreasing the sampling rate [12]. Moreover, the selection of the sensor position is paramount for achieving an optimal signal-to-noise ratio. Research has demonstrated that higher amplitudes can be measured directly on the gear compared to the housing. This allows for the observation of damage-specific frequencies, particularly at low speeds [13]. Furthermore, the integration of the sensor into a gearwheel can potentially compromise the integrity of the gearwheel itself, which must be taken into account when integrating the sensor [14].
In this paper, a gear sensor is presented and employed that can be retrofitted in many cases and offers a space-efficient alternative to conventional encoders mounted on the rotating equipment, which add rotational inertia and space requirements. Furthermore, it is not directly integrated to the gear and, therefore, does not have such limitations regarding the energy supply and the weakening of the gear. However, it uses the gear as a material measure and thus has a short transfer path.
The aim of this paper is to apply the rotational angle measurement with magnetoresistive (MR) sensors for gear systems [15] to different manifestations of gear damage and to classify these with a machine learning algorithm. The results are compared to a rotational angle sensor at the same shaft as the gear wheel sensor and an acceleration sensor at the gearbox housing. The gear wheel sensor can be retrofitted in many cases and provides a package-efficient alternative to classical encoders applied to the rotating equipment, causing additional rotational inertia and build space requirements. Measurements for a sample transmission show the applicability of the proposed method, expanding the current state of the research. The novelty of the present study lies in its utilization of the gear wheel sensor for the classification of various kinds of artificial damage under stationary and transient operating conditions in comparison with existing measurement methods.
The results of our research indicate that rotational angle measurements, facilitated by a gear wheel sensor, offer a robust and reliable method for identifying and classifying gear faults. This approach not only enhances the accuracy of fault detection but also provides valuable insights into the severity and progression of gear damage. Our findings contribute to the growing body of knowledge on angle-based condition monitoring and highlight the potential for further advancements in this field.
Our methodology is presented in Section 2, which includes the test stand with the sensor setup, with a particular focus on the integration of the MR sensor as a gear wheel sensor. Furthermore, the artificial damages are presented according to the test setup. Finally, the data acquisition procedure, the data evaluation process, and the classification algorithms are explained. The classification accuracy is presented Section 3 using confusion matrices, demonstrating the effectiveness of rotational angle measurements in detecting and classifying artificial gear damages. The results are also discussed in this section. Finally, Section 4 concludes with the implications of our findings for future research, as well as the practical applications of our methodology in gear condition monitoring.
2. Materials and Methods
In this section, the rotational angle measurement device, the gear wheel sensor, and the test stand are presented. Then, the testing procedure with the artificial gear damages, along with the usage of different pinions for the testing series, is explained. Finally, the data evaluation procedure to classify the damages is presented. The presented test stand, the data evaluation procedure, and the results are article-specific versions based on the dissertation of Koch [16]. Therefore, more detailed information can be found in the original dissertation.
2.1. Test Stand and Sensor Integration
The gear wheel sensor utilizes the gear wheel of a gearbox as a material measure. When a passive anisotropic MR sensor is radially positioned towards the gear wheel, the ferromagnetic teeth passing by the sensor generate a sine-like signal [15], with the spacing between two teeth equaling one sine-like wave, creating an angle reference. The working distance between the anisotropic MR sensor and the tooth tip is one quarter of the tooth pitch, which is 1.6 mm. To measure the rotational direction and to increase the measurement accuracy, two passive anisotropic MR sensors are integrated, which have a sine-wave phase-shift of one fourth. Due to the integration space, the spacing between the two sensors equals a teeth spacing of 1.75. The variations in the shape of the gear teeth distort the signal compared to an ideal sine wave, which causes fluctuations of the acquired rotational angle [15]. The sensors are integrated in a one-stage gearbox, shown in Figure 1. As a reference angle sensor, the pole ring sensor is used, consisting of an incremental pole ring integrated to the gear wheel shaft, measuring the same rotational angle as the gear wheel sensor, and an active anisotropic sensor. The gear wheel of the gear wheel sensor has 51 teeth, and the pole ring of the pole ring sensor has 256 poles. An acceleration sensor, as the most used sensor in gear condition monitoring, glued to the outside of the gearbox adapter, serves as an additional reference. The gear wheel and the pinion of the sensory-enhanced gearbox have a standard profile with a module of 2 mm, a normal pressure angle of , and a helix angle of .
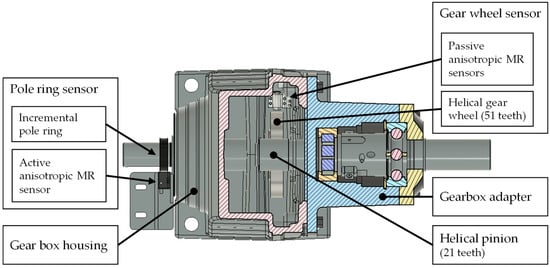
Figure 1.
Sensory-enhanced, one-stage gearbox with integrated sensors, according to [16].
The back-to-back test rig consists of two 30 kW Siemens asynchronous motors (Siemens, Munich, Germany); one is the speed-controlled drive and the other is load-controlled (see Figure 2). The gearboxes are connected with each other via their low-speed shafts. The load gearbox has a transmission ratio of , and the sensory-enhanced gearbox has a transmission ratio of . Therefore, they have different gear mesh frequencies (GMF) and rotational speeds at the high-speed shafts. A temperature sensor measures the oil temperature of the sensory-enhanced gearbox. The data acquisition system, a cDAQ 9178 with NI9205 and NI9215 modules for the analogue voltage signals of the MR sensors, as week as an NI9234 module for the IEPE signals of the acceleration sensor, acquire the signals throughout the tests. This guarantees the time-synchronous sampling of the data. The signals are sampled at 40 kHz. The test data is published and accessible [17].
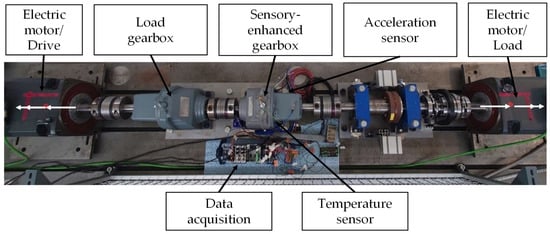
Figure 2.
Gearbox test stand, according to [16].
Based on the test stand, the further test design is developed in the following section. The artificial gear damage is applied to the pinion of the sensory-enhanced gearbox, which meshes with the gear wheel sensor.
2.2. Test Design
Two test series have been carried out. In each of the test series, the same artificial damage is inflicted on two pinions. The artificial damages are milled manually along the meshing region, resulting in severe damage with a large change in gear meshing (see Figure 3). The implementation of geometrically defined damage was rendered infeasible due to the presence of helical gearing. Consequently, manual damage was employed as an alternative. The objective of this test series is to conduct a comparative analysis between the gear wheel sensor with classical encoders and the acceleration sensors. To this end, a range of server damage conditions are introduced. The artificial damages are introduced by dismounting the gearbox adapter, milling the artificial damage, and mounting the gearbox adapter again. To account for the mounting procedures for every damage stage, the mounting procedure is carried out again after all operating conditions are tested; this is referred to as the “repetitions” in the following.
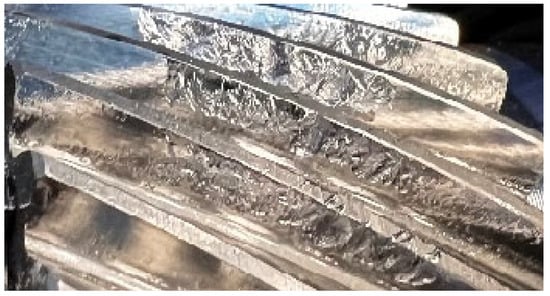
Figure 3.
Artificially milled damage to adjacent teeth flanks, according to [16].
For each damage stage and two repetitions, three different torque and speed conditions are tested. The operating conditions and the artificial damages are described in Table 1. Each test series has two pinions to which the same artificial damages are applied. Each pinion is tested in the new condition and with the same first two artificial damages throughout the test series. The first test series has one additional artificial damage, and the second test series has three additional artificial damages. Therefore, for the first test series, 288 test conditions were executed, and for second test series, 432 test conditions are executed.

Table 1.
Test design with artificial damage types and operating conditions.
The test conditions with the same damage conditions for all four pinions lead to more data points for these damage conditions. Therefore, for the following data evaluation and classification, half of these data points are randomly discarded to acquire the same amount of test data for all test conditions.
2.3. Description of Data Evaluation
The damage detection procedure includes three steps. First, the raw data is processed; the output serves as a basis for a subsequent feature generation that is finally assessed to evaluate the gear condition. Figure 4 depicts this process.
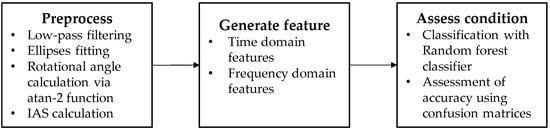
Figure 4.
Data processing procedure.
The initial preprocessing stage entails the implementation of low-pass filtering, which is accomplished through the utilization of a Butterworth filter, characterized by a cut-off frequency of 6 kHz. This procedure is employed to attenuate high-frequency components, thereby ensuring that the subsequent processing stage is not influenced by these extraneous factors. The GMFs with higher orders and surrounding sidebands are damage-specific frequencies that are evaluated in the classification procedure. The first-order frequency is 700 Hz at the maximum speed of 2000 rpm. Therefore, 6 kHz is an appropriate cut-off frequency for the further processing of data. The subsequent preprocessing step entails ellipses fitting, a process that mitigates manufacturing and assembly deviations of the raw signal by compensating for the offset, phase, and amplitude to align with a sine wave [18]. The rotational angle is calculated via the atan2-function, which transforms the sine and cosine raw signals to a rotational angle [19]. The calculated rotational angle is then normalized to the rotational angle corresponding to one rotation of the gear wheel. The instantaneous angular speed (IAS) is calculated based on the rotational angle.
Features are generated in the time and frequency domain as these have proven to be feasible for the condition monitoring of gear damages. The time domain features are calculated by first applying a time synchronous averaging (TSA) to the raw sensor signal and the IAS signal. Then, the statistical features of these two signals are calculated. The statistical features are classical features, i.e., the mean and standard deviation and so on, as well as gear-specific features, such as FM4 and FM0. Frequency features are calculated via an FFT of the raw and IAS signal, and gear-specific frequencies, such as the GMF and surrounding sidebands in the order domain, are extracted [20].
For the classification of the data, a random forest classifier is used. The random forest classifier has been shown to offer high accuracy and robustness by aggregating multiple decision trees. This process reduces the risk of overfitting and improves the classifier’s ability to generalize to unseen data [21]. The TreeBagger function in MATLAB R2023a was employed for classification with the random forest classifier. The classification process involved the generation of 100 trees, with a minimum of five leaves per tree. The hyperparameters were determined through an iterative process. As illustrated in Figure 5, the present publication delineates the various classifications. The seven damage classes are distributed over four pinions, with the first three classes being identical for all pinions. A total of 18 stationary operating conditions and 3 speed ramps were subjected to rigorous testing. Each test point is repeated twice, as previously outlined. The classification is performed with a five-fold cross validation and a split by repetitions.
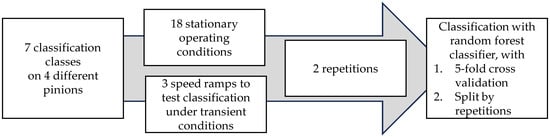
Figure 5.
Overview of test data for classification.
The classification is employed to evaluate the damage detection capabilities using the gear wheel sensor, as well as the transferability potential of the results. The features are calculated for one second of the signal, with an overlap of 90%, in order to increase the amount of data available for training and testing.
The evaluation of classification capabilities is conducted in three stages. Initially, a five-fold cross-validation with an 80% training data and 20% test data split is employed as a reference for the classification process. Subsequently, a split according to the repetitions is implemented. In this manner, the classification algorithm is trained on the first repetition, and the classification accuracy is tested on the second repetition. Third, the transferability of the classification algorithm to different pinions is tested. Consequently, pinons 2 and 3, along with pinons 5 and 6, are grouped collectively due to their shared damage conditions. One of the pinons from each group is utilized to train the classification algorithm, while the other one is employed for testing purposes.
The evaluation of the predictions made by the random forest classifier entails the utilization of prediction accuracy as a metric for assessing the overall correctness of the predictions across all test data. Additionally, a confusion matrix is employed to facilitate a more detailed and nuanced evaluation of the predictions. The confusion matrix is a statistical tool used to analyze the discrepancy between the true class value and the predicted class value of the random forest classifier. The main diagonal indicates the proper classified classes; deviations from this diagonal suggest erroneous classifications. The accuracy is a measure used to describe how often a machine learning algorithm predicts the correct condition. It can be calculated by dividing the number of correct predictions by the total number of predictions, as expressed in the following equation:
This contribution utilizes accuracy to quantify the classification performance of different sensors under varying operating conditions. It functions as a metric for comparing the effectiveness of the gear wheel sensor, pole ring sensor, and acceleration sensor in classifying gear damages. Higher accuracy values indicate a stronger classification capability.
3. Results and Discussion
The objective of this section is to evaluate the capabilities of the gear wheel sensor in classifying different gear damage patterns and to compare its capabilities to those of the pole ring sensor and the acceleration sensor, here used as references. Initially, a classification of the stationary gear wheel sensor data is conducted using a five-fold cross-validation method, where 80% of the data is allocated for training and 20% for testing. A subdivision is performed based on the repetitions such that the first repetition is utilized for training, the second for testing, and vice versa in order to test the prediction capability of the random forest classifier. Subsequently, a subdivision is performed based on the repletion split. Based on these results, a comparison is made between the three sensors. Finally, the prediction accuracy for transient conditions is examined with speed ramps, once again employing five-fold cross-validation.
3.1. Classification of Stationary Conditions
The classification is executed under the influence of artificial damage and the operating conditions, as described in Table 1. The confusion matrix illustrates the accuracy of the damage classification along the primary diagonals, with an increase in damage severity with each damage level. Figure 6 presents the confusion matrices for both the five-fold cross-validation and the repetition split. The five-fold cross-validation demonstrates near-perfect accuracy, reaching 100% in the confusion matrix (see Figure 6a). However, a closer examination reveals deviations, which are also present in the new class. These deviations can be attributed to variations in the raw signals of the gear wheel sensor [15]. In contrast, the repetition split exhibits significantly lower accuracy, with an accuracy of 89% (see Figure 6b). This lower accuracy is also evident in the confusion matrix. This is attributable to the fact that the gearbox adapter is disassembled and reassembled during the various repetitions, resulting in a modified vibration pattern. Nevertheless, the false predictions are concentrated around the main diagonal, suggesting a similarity between the different damage levels as they progressively increase in terms of damage size. It is noteworthy that the New, 1T, and 3T classes each possess data from all four pinions, while the remaining classes are equipped with data from only two pinions. This discrepancy partially explains the significant deviation observed in the 3T-2x120° class.
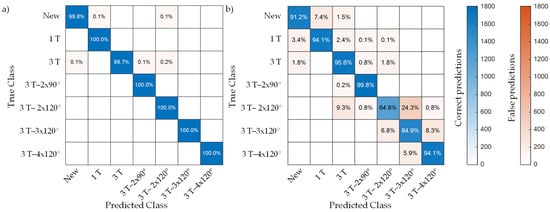
Figure 6.
Confusion matrices for classification results at stationary gear wheel sensor conditions with (a) five-fold cross-validation (accuracy: 100%); and (b) repetition split (accuracy: 89%), according to [16].
Following the classification with the gear wheel sensor, the repetition split classification with the pole ring sensor and the acceleration sensor is compared (see Figure 7). The pole ring sensor demonstrates the highest prediction accuracy at 97%, followed by the acceleration sensor at 92%, and the gear wheel sensor exhibits the lowest at 89%. For the pole ring sensor, false predictions are distributed around the main diagonal, once more reflecting the similarity in the damage levels (see Figure 7b). A significant deviation was identified at class 3T-3x120° for the acceleration sensor, which was classified as new and false at 25%. This strong deviation is not present in the other sensors and demonstrates the acceleration sensor’s susceptibility to incorrect predictions due to its more complex transfer path. This is primarily attributable to the attachment of the accelerometer to the gearbox adapter, which is removed between the different repetitions. Notwithstanding this deviation, the sensor demonstrates a high degree of prediction accuracy. With a more substantial dataset and enhanced classification algorithms, the impact of these errors could be mitigated.
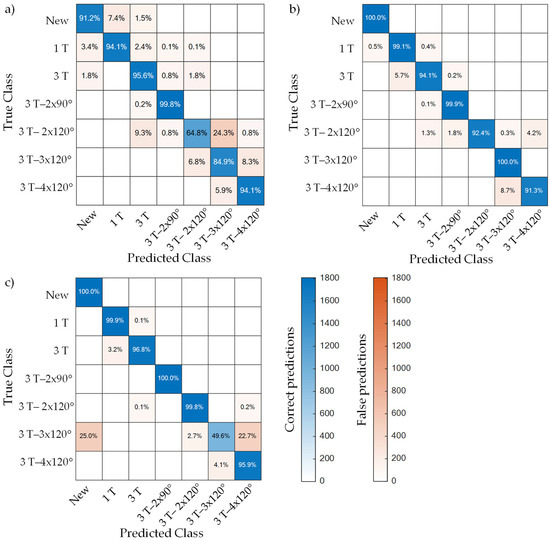
Figure 7.
Confusion matrices for classification results at stationary conditions with repetition split: (a) gear wheel sensor, 89% accuracy; (b) pole ring sensor, 97% accuracy; (c) acceleration sensor, 92% accuracy, according to [16].
These findings indicate that a high degree of classification accuracy can be attained with the gear wheel sensor. Nevertheless, the pole ring sensor yields superior outcomes, which is primarily attributable to tooth-specific fluctuations in the angle signal when measuring with the gear wheel. It is essential to acknowledge that these outcomes necessitate validation through further research with augmented data and supplementary classification algorithms to facilitate a comprehensive evaluation of the gear wheel sensor.
3.2. Classification of Transient Conditions
The prior classification outcomes were executed under stationary operating conditions. However, in practical applications, alterations in speed and torque occur. Specifically, variations in speed complicate the detection of damage due to shifts in the gearbox-specific frequencies, which are predominantly utilized for damage detection purposes. Consequently, the following damage classification was conducted using speed ramps. These ramps extend from ±2000 rpm, ±1300 rpm, and ±300 rpm at the high-speed shaft, with a slope of 150 rpm/s, at a torque of 55 Nm.
The classification employing rotational angle sensors involves the self-transformation of the time-sampled IAS to an equidistant angle-sampled IAS, with the measured rotational angle of the sensors. This process enables the evaluation of damage-specific frequencies in the order–frequency domain with equidistant rotational angle sampling [5,22]. Due to the order–frequency spectrum, the damage-specific orders do not shift depending on the speed, thus allowing for an exact analysis of the damage-specific components. The speed ramp is segmented into intervals of a one-second duration, with an overlap of 50% for the purpose of damage classification. The five-fold cross validation is used for the damage classification.
As illustrated in Figure 8, the confusion matrices reveal that the accuracy of the classification is significantly reduced under transient operating conditions, with all sensors exhibiting an accuracy of less than 70%, in comparison to the accuracy of almost 100% observed under stationary operating conditions. This decline can be attributed to the more intricate nature of the classification problem, compounded by a reduction in data points by more than a fifth. The gear wheel sensor demonstrated the highest level of accuracy within this classification, with a percentage of 69%, as illustrated in Figure 8a. The pole ring sensor exhibited an accuracy of 58% (see Figure 8b), while the acceleration sensor demonstrated an accuracy of 41% (see Figure 8c). These findings underscore the efficacy of the gear wheel sensor in facilitating precise damage predictions. Moreover, the utilization of rotational angle sensors in transient conditions offers a distinct advantage over the use of acceleration sensors as it enables the incorporation of rotational angle information into order-domain frequency analysis. However, it is crucial to acknowledge that enhancing the prediction accuracies remains a significant challenge, particularly for industrial applications. To achieve this, the development of a more extensive database is imperative, along with the investigation of authentic damage cases. A thorough examination of the confusion matrices, depicted in Figure 8, reveals that misclassification predominantly occurs along the main diagonal. This observation serves to reinforce the findings derived from stationary operating conditions, indicating that the classification algorithms are contingent on the extent of damage, or the frequency feature utilized exhibits a correlation with the damage.
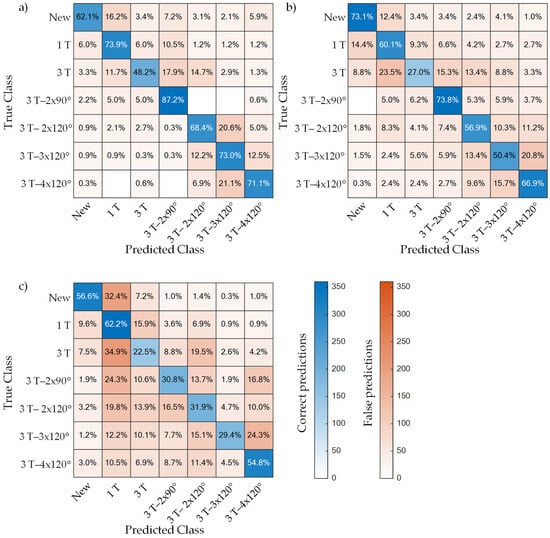
Figure 8.
Classification results at transient conditions with five-fold cross-validation: (a) gear wheel sensor, 69% accuracy; (b) pole ring sensor, 58% accuracy; (c) acceleration sensor, 41% accuracy, according to [16].
4. Conclusions
In this study, a concept for a novel rotational angle sensor, designated as the gear wheel sensor, which utilizes a gear wheel as a material measure, is evaluated in comparison with a conventional angle sensor (the pole ring sensor) and an acceleration sensor for the purpose of damage classification. The gear wheel sensor offers distinct advantages, including its capacity for seamless integration into the gearbox without necessitating alterations to the existing rotating components; additional packaging has been a requirement for many earlier condition monitoring concepts [23]. This feature of a potentially seamless integration renders it a suitable retrofitting solution. The classification results demonstrate the gear wheel sensor’s efficacy in classifying gear damage. However, under stationary operating conditions, the classification performance is inferior to those of the pole ring and acceleration sensors. Conversely, under transient operating conditions, such as speed ramps, the gear wheel sensor demonstrates an ability to achieve superior classification results. In scenarios where speeds are variable, the rotational angle sensors exhibit an advantage over the acceleration sensor. This is due to the rotational angle information, which enables the consideration of gear-specific frequencies. There are methods that extract the rotational angle information with acceleration sensors, but these require significant computational effort and are not reliable across all operating conditions [24]. As previously outlined in other publications, significant tooth-specific fluctuations in the angle measurement are observed with the gear wheel sensor due to the deviations of individual teeth [15]. This reduces the accuracy of the rotational angle measurement and, consequently, affects the classification accuracy. Further investigation into the tooth-specific influence on the acquired data could lead to the identification of methodologies by which to increase measurement accuracy. These methodologies may include calibrating the gear wheel sensor or using the fluctuations to obtain an absolute rotational angle reference. Additionally, the database used for classification is limited in size, which necessitates expansion in future studies to enhance the comparability between the sensors. It is noteworthy that the artificially induced damage exhibited in this study is significantly more pronounced in comparison to the initial pitting observed on a tooth flank during actual operation. Consequently, further research translating these findings into various realistic or actual damage scenarios is necessary.
Author Contributions
Conceptualization, Y.K.; methodology, Y.K.; software, Y.K.; validation, F.M.B.-D. and Y.K.; investigation, Y.K.; resources, F.M.B.-D.; data curation, Y.K.; writing—original draft preparation, Y.K. and F.M.B.-D.; writing—review and editing, E.K. and F.M.B.-D.; visualization, Y.K.; supervision, F.M.B.-D.; project administration, E.K.; funding acquisition, E.K. All authors have read and agreed to the published version of the manuscript.
Funding
This research received no external funding.
Institutional Review Board Statement
Not applicable.
Informed Consent Statement
Not applicable.
Data Availability Statement
The original data presented in the study are openly available in the TUDatalib repository, “Gearbox Condition Monitoring based on Angle Measurement using a Gear as Material Measure—Test data”, at https://tudatalib.ulb.tu-darmstadt.de/handle/tudatalib/4298.
Conflicts of Interest
The authors declare no conflicts of interest.
Abbreviations
The following abbreviations are used in this manuscript:
| GMF | Gear mesh frequency |
| IAS | Instantaneous angular speed |
| MR | Magnetoresistive |
| TSA | Time synchronous averaging |
References
- Li, B.; Zhang, X.; Wu, J. New procedure for gear fault detection and diagnosis using instantaneous angular speed. Mech. Syst. Signal Process. 2017, 85, 415–428. [Google Scholar] [CrossRef]
- Camerini, V.; Coppotelli, G.; Bendisch, S.; Kiehn, D. Impact of pulse time uncertainty on synchronous average: Statistical analysis and relevance to rotating machinery diagnosis. Mech. Syst. Signal Process. 2019, 129, 308–336. [Google Scholar] [CrossRef]
- Liang, K.; Zhao, M.; Lin, J.; Jiao, J.; Ding, C. Toothwise health monitoring of planetary gearbox under time-varying speed condition based on rotating encoder signal. IEEE Trans. Ind. Electron. 2021, 69, 6267–6277. [Google Scholar] [CrossRef]
- Fromberger, M.; Sendlbeck, S.; Rothemund, M.; Götz, J.; Otto, M.; Stahl, K. Comparing Data Sources for Condition Monitoring Suitability. Forsch Ingenieurwes 2019, 83, 521–527. [Google Scholar] [CrossRef]
- Fedala, S.; Rémond, D.; Felkaoui, A.; Selmani, H. Intelligent Gear Fault Diagnosis in Normal and Non-stationary Conditions Based on Instantaneous Angular Speed, Differential Evolution and Multi-class Support Vector Machine. In Proceedings of the Signal Processing Applied to Rotating Machinery Diagnostics, (SIGPROMD’2017), Setif, Algeria, 9–11 April 2017; Felkaoui, A., Ed.; Springer International Publishing AG: Cham, Switzerland, 2019; pp. 16–33, ISBN 978-3-319-96181-1. [Google Scholar]
- Fedala, S.; Rémond, D.; Zegadi, R.; Felkaoui, A. Gear fault diagnosis based on angular measurements and support vector machines in normal and nonstationary conditions. Appl. Cond. Monit. 2016, 4, 291–308. [Google Scholar] [CrossRef]
- Chin, Z.Y.; Borghesani, P.; Mao, Y.; Smith, W.A.; Randall, R.B. Use of transmission error for a quantitative estimation of root-crack severity in gears. Mech. Syst. Signal Process. 2022, 171, 108957. [Google Scholar] [CrossRef]
- Sendlbeck, S.; Fimpel, A.; Siewerin, B.; Otto, M.; Stahl, K. Condition monitoring of slow-speed gear wear using a transmission error-based approach with automated feature selection. Int. J. Progn. Health Manag. 2021, 12. [Google Scholar] [CrossRef]
- Koch, Y.; Sendlbeck, S.; Otto, M.; Stahl, K.; Kirchner, E. A review on the use of angle measurements in gear condition monitoring and fault detection. Mech. Syst. Signal Process. 2025, 225, 112254. [Google Scholar] [CrossRef]
- Peters, J.; Ott, L.; Dörr, M.; Gwosch, T.; Matthiesen, S. Design of sensor integrating gears: Methodical development, integration and verification of an in-Situ MEMS sensor system. Procedia CIRP 2021, 100, 672–677. [Google Scholar] [CrossRef]
- Derbel, F.; Strakosch, F. Integrated Sensor based Smart Diagnostic and Online Monitoring of Industrial Systems. In Proceedings of the 2022 4th International Conference on Applied Automation and Industrial Diagnostics (ICAAID), Hail, Saudi Arabia, 29–31 March 2022; Institute of Electrical and Electronics Engineers (IEEE): Piscataway, NJ, USA, 2022; pp. 1–6, ISBN 978-1-7281-8939-0. [Google Scholar]
- Rupprecht, B.; Vogel-Heuser, B.; Hujo, D.; Vicaria, A.; Knoll, E.; Stahl, K.; Ochs, M.; Brederlow, R. A Microcontroller Operating Strategy for (Micro-)Pitting and Temperature Increase Detection in Sensor-Integrating Gears Evaluated with Pre-recorded Sensor Data. In Proceedings of the 2024 IEEE International Conference on Industrial Engineering and Engineering Management (IEEM), Bangkok, Thailand, 15–18 December 2024; IEEE: Piscataway, NJ, USA, 2024; pp. 1277–1284, ISBN 979-8-3503-8609-7. [Google Scholar]
- Knoll, E.; Rothemund, M.; Otto, M.; Rupprecht, B.; Ochs, M.; Vogel-Heuser, B.; Brederlow, R.; Stahl, K. Evaluation of vibration behavior at different sensing positions on gearboxes. Forsch Ingenieurwes 2024, 88, 29. [Google Scholar] [CrossRef]
- Bonaiti, L.; Knoll, E.; Otto, M.; Gorla, C.; Stahl, K. The Effect of Sensor Integration on the Load Carrying Capacity of Gears. Machines 2022, 10, 888. [Google Scholar] [CrossRef]
- Koch, Y.; Martin, G.; Kirchner, E.; Quirnheim Pais, D.; Slatter, R. Feasibility study of measuring instantaneous angular speed of helical gears with magnetoresistive sensors. Forsch Ingenieurwes 2022, 86, 451–459. [Google Scholar] [CrossRef]
- Koch, Y. Gearbox Condition Monitoring Based On Angle Measurement Using A Gear As Material Measure. Ph.D. Thesis, TU Darmstadt, Darmstadt, Germany, 2024. [Google Scholar]
- Koch, Y.; Schäffner, M.; de Orte, P.; Giebisch, S. Gearbox Condition Monitoring Based on Angle Measurement Using a Gear as Material Measure–Test Data. 2024. Available online: https://tudatalib.ulb.tu-darmstadt.de/submit?workspaceID=2652 (accessed on 27 March 2025).
- Fitzgibbon, A.; Pilu, M.; Fisher, R.B. Direct least square fitting of ellipses. IEEE Trans. Pattern Anal. Mach. Intell. 1999, 21, 476–480. [Google Scholar] [CrossRef]
- de Dinechin, F.; Istoan, M. Hardware Implementations of Fixed-Point Atan2. In Proceedings of the 2015 IEEE 22nd Symposium on Computer Arithmetic (ARITH), Lyon, France, 22–24 June 2015; IEEE: Piscataway, NJ, USA, 2015; pp. 34–41, ISBN 978-1-4799-8664-4. [Google Scholar]
- Koch, Y. Gearbox Condition Monitoring Based on Angle Measurement Using a Gear as Material Measure–Matlab Data. 2024. Available online: https://tudatalib.ulb.tu-darmstadt.de/handle/tudatalib/4240 (accessed on 27 March 2025).
- Breiman, L. Random Forests. Mach. Learn. 2001, 45, 5–32. [Google Scholar] [CrossRef]
- Wang, B.; Ding, C. Transient feature identification from internal encoder signal for fault detection of planetary gearboxes under variable speed conditions. Measurement 2021, 171, 108761. [Google Scholar] [CrossRef]
- Kirchner, E.; Wallmersperger, T.; Gwosch, T.; Menning, J.D.M.; Peters, J.; Breimann, R.; Kraus, B.; Welzbacher, P.; Küchenhof, J.; Krause, D.; et al. A review on sensor-integrating machine elements. Adv. Sens. Res. 2024, 3, 2300113. [Google Scholar] [CrossRef]
- Kliemank, M.L.; Rupprecht, B.; Ahmadzadeh, M.; Brederlow, R.; Stahl, K.; Liebich, R.; Vogel-Heuser, B.; Gühmann, C. Online instantaneous angular speed estimation from vibration on low-power embedded systems evaluated on a gas foil bearing use case. Meas. Sens. 2025, 38, 101600. [Google Scholar] [CrossRef]
Disclaimer/Publisher’s Note: The statements, opinions and data contained in all publications are solely those of the individual author(s) and contributor(s) and not of MDPI and/or the editor(s). MDPI and/or the editor(s) disclaim responsibility for any injury to people or property resulting from any ideas, methods, instructions or products referred to in the content. |
© 2025 by the authors. Licensee MDPI, Basel, Switzerland. This article is an open access article distributed under the terms and conditions of the Creative Commons Attribution (CC BY) license (https://creativecommons.org/licenses/by/4.0/).