Featured Application
This study is relevant for the physicochemical identification of lepidolite in clay soils, with potential applications in prospecting. Additionally, it addresses environmental aspects related to microstructural distribution and explores the potential use of lepidolite as a pigment for colored glazes in the ceramics industry.
Abstract
Lepidolite is one of a small number of minerals that contains a significant amount of lithium. Some areas, like the Apuseni and Metalifer Mountains in Romania, present dark red layers intercalated with reddish-yellow clay soils with interesting aspects. X-ray diffraction (XRD) analysis coupled with polarized light optical microscopy (POM) revealed that this dark red soil contains a large amount of fine microstructured lepidolite (24–35%) mixed with quartz sand and fine traces of kaolinite and muscovite. Scanning electron microscopy (SEM) elemental analysis revealed a typical clay composition with Mn traces (specific to red lepidolite), confirming POM observation. SEM also revealed fine tabular platelets of lepidolite with a maximum size of 1.5 µm surrounding quartz particles (5–50 µm), indicating the presence of numerous nano fractions. Their presence was confirmed by atomic force microscopy (AFM), which showed particle sizes ranging from 40 to 60 nm, closely matching the crystallite size estimated using the Scherrer formula. The finest fraction allows easy separation from the quartz sand through bi-distilled water washing. Quartz particles settle at the bottom of the container, while the finest lepidolite particles are easily separated. Water evaporation ensures their recovery. Thus, the enriched lepidolite powder could be utilized for specific applications in the lithium industry. On the other hand, the large number of the finest particles found in the samples investigated presents the risk of PM1, PM2.5m, and PM10 emission, with impacts on atmospheric environmental safety.
1. Introduction
Lepidolite is a clay mineral belonging to the mica group. Its standard chemical formula is K(Li, Al, Rb)2(Al, Si)4O10(F, OH)2. The crystal structure is composed of intricate sheets constructed from tetrahedral layers containing Si and Al ions, which are coordinated with four oxygen atoms. The tetrahedral layers are stacked together through the middle octahedral layers containing mainly Li and F associated with minor traces of other metals like Mg, Fe, or Mn. This structure, commonly referred to in the literature as TOT, is characteristic of all mica minerals. The complex sheets are bonded to one another through the K+ ions. This crystal plan is highly susceptible to cleavage, ensuring the easy detachment of sheets containing valuable metals like Li and Rb [1,2].
On the other hand, lepidolite is one of the richest minerals in lithium content, which occurs on Earth’s crust along with polylithionite and trilithionite, creating a mineral series with variable amounts of Li. The literature refers to the Li:Al ratio, which is about 2:1 in polylithionite, decreasing to 1.5:1.5 in trilithionite [2,3]. Lepidolite is typically pink or light purple in color, but it can also appear rose red or violet gray due to the presence of trace elements like manganese [4]. Dyachkov and collaborators revealed the rose-red color of the manganese mineral [5], in good agreement with other findings confirming that lepidolite’s red or violet color is caused by the presence of Mn [6,7].
Minerals like lepidolite, polylithionite, and trilithionite are found crystallized within pegmatite bodies along with quartz, spodumene, and feldspar-bearing rocks that are suitable for lithium ore extraction. There are well-established technological procedures regarding ore grinding and separation through flotation [8,9]. The ore enrichment also might imply the finest lepidolite fraction extraction using sodium oleate, trapping the lepidolite fine particles that had been previously activated with Mg2+ ions [10]. The flotation characteristics must be adapted to the ore characteristics to remove sterile minerals such as quartz or iron occurrences [11,12].
The importance of lepidolite ore exceeds its particle distribution in clay soils, a fact less investigated in the literature. The alteration of volcanic rocks facilitates the formation of thick deposits of clay soils merely based on kaolinite and muscovite [13,14]. Lepidolite soils may form similarly through the breakdown of lamellar slabs. There is less data in the literature regarding lepidolite soils, perhaps due to their formerly lower industrial interest. It was noticed in the clay mixture sterile in bauxite, bringing lithium content to the red mud [15], and is now being targeted for advanced lithium recovery [16,17]. It is also renowned as a gemstone for jewelry because of the nice pink-to-deep red-violet nuances of higher-quality stones [18].
Some literature data reveal significant levels of lithium in the karst-related spring waters in the Dobrogea and Banat regions in Romania, categorized as concentrated brine [19]. The literature reports rich lithium brines as an alternative source to lepidolite extraction [20,21]. Ballasa found significant levels of lithium in the waters from the Beius area [22]. It is a strange finding since the metal infiltration into the rivers affected by former mining activities contains mainly Cd, Pb, and Zn [23,24], not lithium. Some random observations of the forest soils around the Beius Basin and Apuseni Mountains reveal interesting soil with a clay texture and a dark red color with a violet appearance. It justifies the assumption that lepidolite might cause such color by its presence in detectable quantities. For instance, manganese oxide is used to produce a red-violet color (e.g., deep ruby red) in glass artwork [25,26] and for ceramic glazes [27]. This color is difficult to obtain in mineral matter such as soils. Therefore, the presence of manganese is expected to influence the color of the clay particles, determining the final shade of the soil.
The experimental setup supposes a complex characterization of the mineral composition of the soil samples, achieved by combining X-ray diffraction (XRD) with mineralogical optical microscopy (MOM). XRD evidences the characteristic peaks for each mineral in the soil samples by their matching with powder diffraction files (PDF) [28]. Mineralogical optical microscopy examines the soil samples under cross-polarized light, with each mineral having a specific color generated by the birefringence behavior. This allows for the monitoring of the size and shape of each mineral particle [29,30]. The microstructural aspects can be visualized by scanning electron microscopy (SEM) at higher magnification, keeping a proper resolution and detail sharpness and bringing a strong correlation with the constituent element’s distribution through EDX spectroscopy [31,32]. Clay soils often contain very small particles, including submicron and nanostructural fractions [33]. Atomic force microscopy (AFM) can visualize such nano-features through advanced topographical probing. We aim to employ all these investigation techniques on the collected soil samples to reveal their mineralogical composition and their distribution. Manganese lepidolite is believed to be the primary factor responsible for the unusual dark red color of the targeted soil. Potential industrial applications of the investigated soil samples might be identified through the current findings, establishing pathways for research continuation.
A secondary objective is to assess the pollutant potential of these soils under conditions of advanced erosion. It is expected to generate significant amounts of particulate matter like PM1 and PM2.5. These are highly hazardous to human health and are known to cause respiratory diseases such as asthma, silicosis, and cancer [34,35,36]. On the other hand, quartz particles are almost omnipresent in forest soils, with particles fitting the PM10 range, which is less harmful than the finest particles [37,38].
2. Materials and Methods
2.1. Samples Collection and Preparation
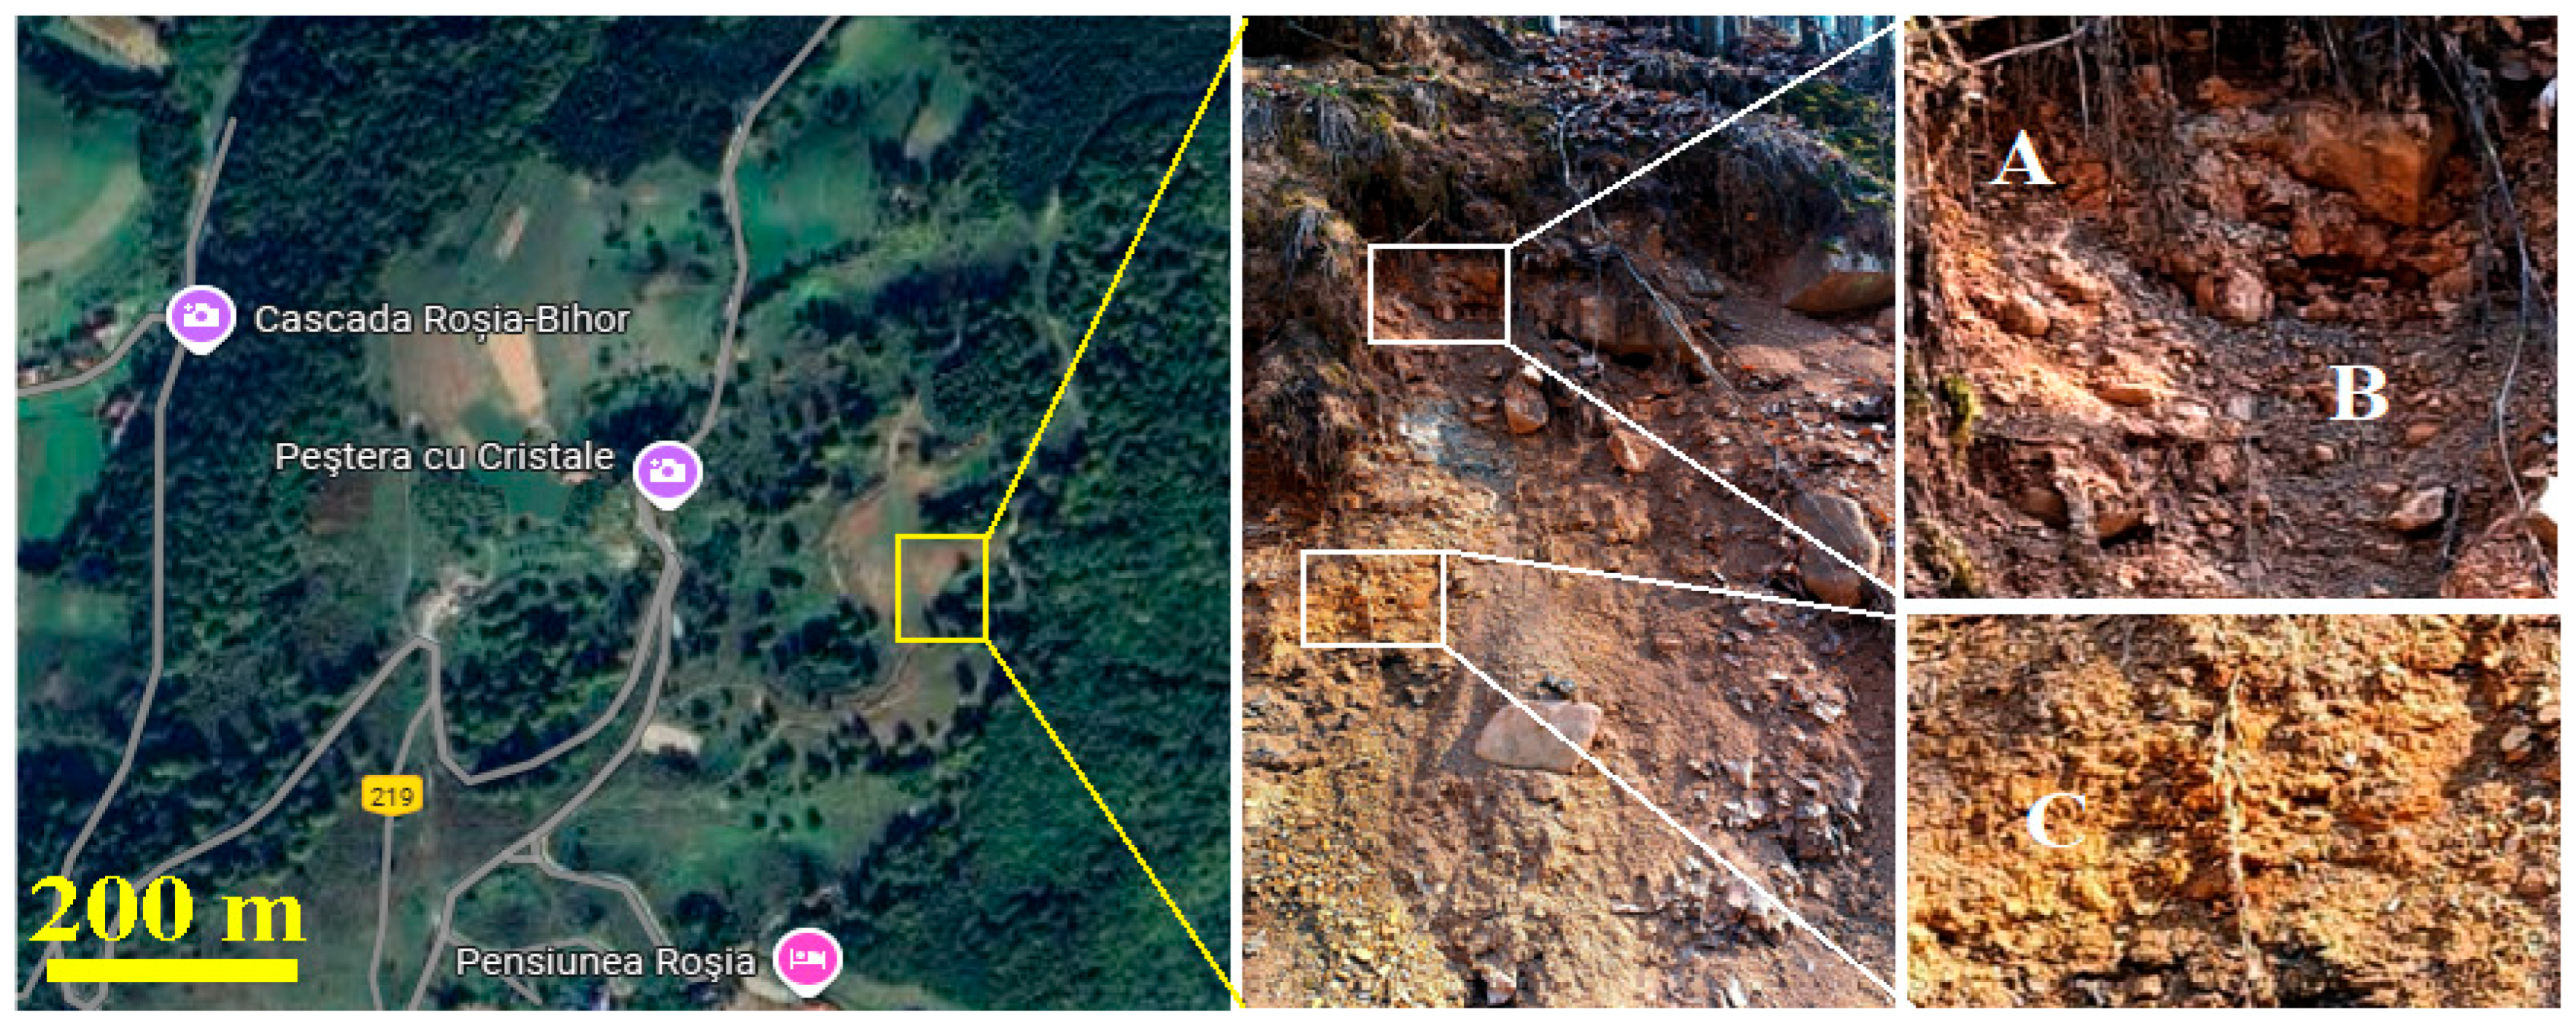
The soil samples were collected from the Apuseni Mountains in the proximity of Rosia Village (Cluj County, Romania) from an open site near the local road, Figure 1. The mountain slope is steep and characterized by stratified clay soils, including red sandy soil (point A), dark red clay soil (point B), and reddish yellow clay soil (point C).
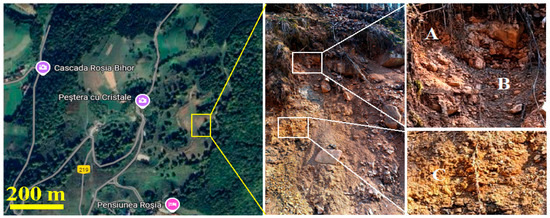
Figure 1.
The collection site position on the Google map (GPS coordinates: 46.81799 N; 22.42674 E) and photograph with samples indicative and their description: (A) Sample A red sandy soil, (B) Sample B dark red clay soil, and (C) Sample C reddish yellow clay soil.
Five soil samples were collected from individual spots within the marked zones A, B, and C. Equal quantities from each collection spot were weighed and mixed into the average representative soil samples named Sample A, Sample B, and Sample C. These average samples were subjected to complex physicochemical investigations.
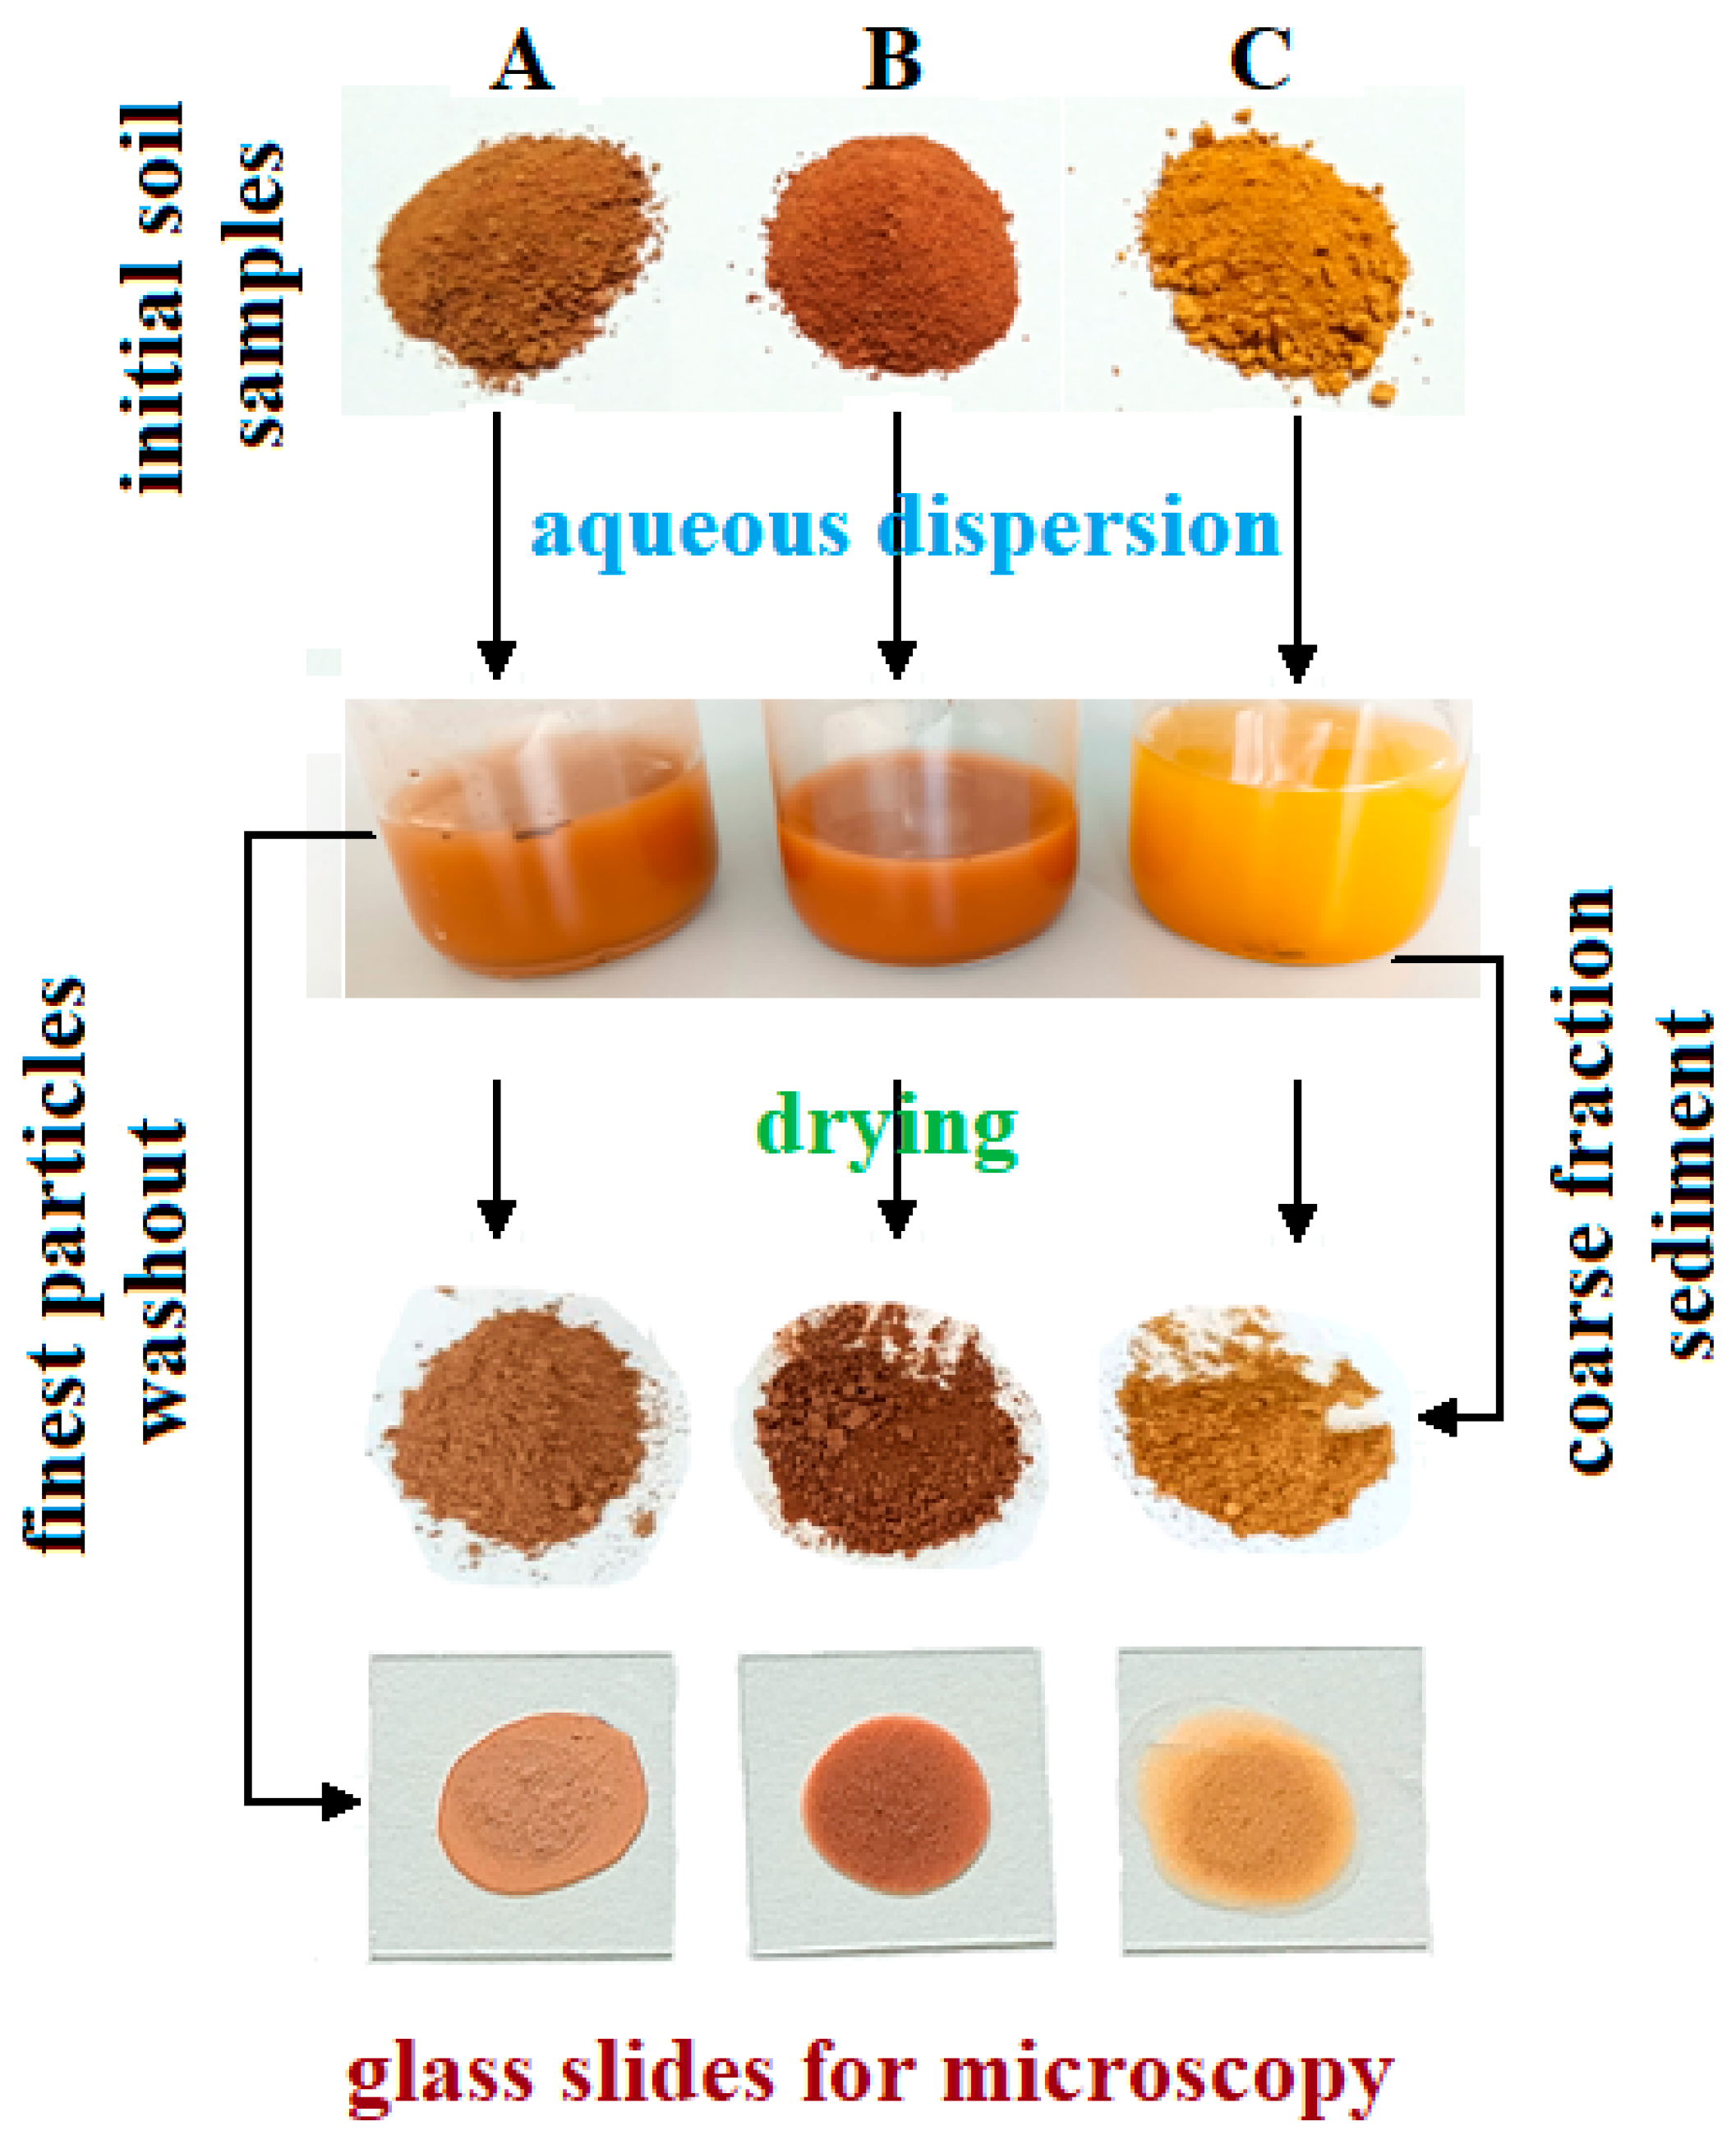
The finest fractions extraction was carried out by dispersion of 10 g of average representative soil sample into 100 mL of bi-distilled water heated at 50 °C for a better disintegration of finest clay particle clusters. This resulted in each sample dispersing with its own characteristic color, Figure 2. The color nuances were determined based on the hue and chroma values using Munsell charts as follows: 2.5YR 5/8 red for Sample A, 10R 4/8 dark red for Sample B, and 5YR 6/8 reddish yellow for Sample C.
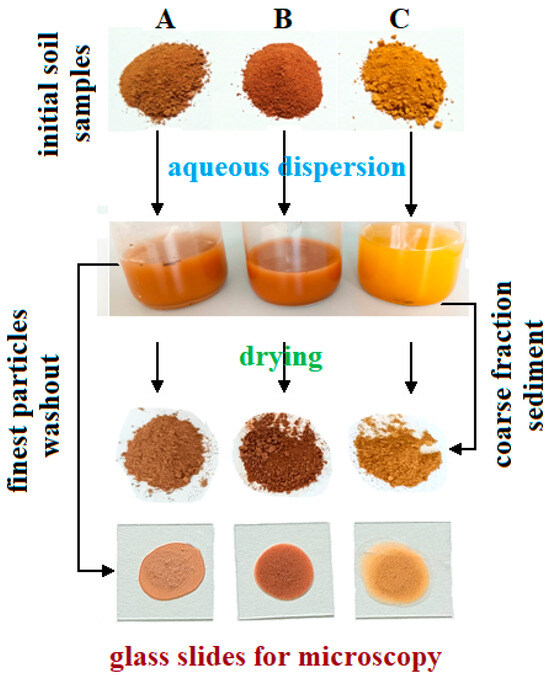
Figure 2.
Sample preparation scheme.
The coarse sand particles settle at the bottom of the vial, while the finer particles remain suspended in the water. The liquid containing fine fractions was removed. A few drops were spread onto glass slides for specific microscopic investigation, and the rest of the liquid was evaporated at 60 °C until complete drying. The resulting crusts were ground in an agate mortar until a fine powder was obtained. These powders were subjected to various investigations.
2.2. Investigation Methods
X-ray diffraction (XRD) was effectuated using a Bragg-Brentano diffractometer Bruker D8 Advance (Bruker Co., Karlsruhe, Germany). The monochromatic radiation was obtained with a copper anti-cathode Cu Kα radiation λ = 1.54056 Å. The patterns were registered in a range of 10–80 ° 2theta at a speed of 1 deg./min. The diffraction peak identification was performed using Match 1.0 software (Crystal Impact Co., Bonn, Germany) using powder diffraction files database PDF 2.0.
Mineralogical optical microscopy (MOM) was conducted using a cross-polarized light method with a Laboval 2 microscope (Carl Zeiss, Obserkochen, Germany). The images were digitally acquired with a Sony camera of 14 MPx (Sony Group Co., Minato, Japan). The mineral particle’s size ranges were determined using Image J software version 1.53k (National Institute of Health, Bethesda, Rockville, MD, USA) by measuring the smaller and larger visible particles of each identified mineral.
Scanning electron microscopy (SEM) was effectuated with a Hitachi SU8230 microscope (Hitachi Company, Tokyo, Japan) operated in high vacuum mode at an acceleration voltage of 30 kV. The elemental investigation was performed with an X-Max 1160 EDX element detector (Oxford Instruments, Oxford, UK), evidencing the element distribution maps and elemental spectra expressed in atomic percent. The samples were metalized with a thin gold layer to ensure their electrical conduction, as required for high-resolution imaging. Gold was excluded from the elemental spectra during the analytical process.
JEOL JSPM 4210 microscope (Jeol Co., Tokyo, Japan) was operated in tapping mode for the atomic force microscopy (AFM) investigation of the samples. Their surface was probed with NSC 15 cantilevers having a resonant frequency of 325 kHz and a force constant of 40 N/m. The obtained images were analyzed with Win SPM 2.0 software (Jeol Co., Tokyo, Japan).
The dispersions of the finest particles obtained after washing separation were subjected to pH measurements using a Hanna HI 9829 multimeter (Hanna Co., Woonsocket, RI, USA). The measurements were conducted three times for accuracy (sample size N = 3), and the mean values were calculated along with their standard deviation. The pH results were statistically analyzed with the ANOVA test followed by the Tukey post hoc test effectuated with Origin software version 2019b (Microcal Company, Northampton, MA, USA) at a significance level of α = 0.05, meaning that p < 0.05 indicates statistical differences and p > 0.05 indicates statistical similarities.
3. Results
3.1. Finest Fraction Washing Separation Experiment and pH Values
Separation of the finest particles was achieved by dispersing 10 g of the initial soil sample in 100 mL of bi-distilled water, followed by agitation for 30 min at 50 °C. Moderate heating of the dispersion aqueous environment ensures the proper detachment of the finest fractions from the coarse mineral particles. The agitated dispersion was left to rest for 10 min at 50 °C to ensure sedimentation of coarse fractions on the vial’s bottom, and the pH value was measured at this temperature, Figure 3a. The aqueous dispersion of the finest fractions was transferred to another vial and allowed to cool naturally to 23 °C, at which point the pH was measured again, Figure 3b. The finest fractions were further extracted from the aqueous dispersion by water vaporization at 60 °C until the powder was completely dried, and the amount recovery was calculated, Figure 3c.

Figure 3.
Washing separation experiment results: (a) pH values during the separation process at 50 °C, (b) pH after fine particles dispersion cooling at 23 °C, and (c) fine fraction recovery.
The washing experiment and pH measurements were carried out in triplicate to support the statistical requirement (sample size N = 3). Statistical analysis of the pH variation at 50 °C identified two distinct groups based on p-values compared to the 0.05 significance level. The first one is represented by acid pH, containing Samples A and C, and the second statistical group is formed by Sample B, which has alkaline characteristics. The pH of the first group shows a slight increase after the dispersion cools, indicating a reduction in the influence of acidic components. Advanced physicochemical analysis is required to identify the unstable soil components that influence pH values. In the alkaline group, Sample B, the pH value remains almost unchanged, indicating a strong chemical stability of the dispersed matter. The further investigation performed in this research aimed to discover the mineral compounds that ensure such stable alkaline pH.
An important feature of the first washing process is the recovery of the finest fractions from the aqueous supernatant, as presented in Table 1. The recovery rate in Figure 3c is given by the mass of the finest particles obtained by drying the supernatant reported to the initial sample mass.

Table 1.
Samples mass variation through the washing separation process.
Sample A has a sandy texture containing large amounts of coarse particles. Thus, the recovered finest fractions are about 5.77 wt.%. It forms a distinct statistical group, clearly evidenced in Figure 3c. The smoother, clay-textured appearance of Samples B and C indicates the likely presence of significant amounts of fine particles. The recovery percentages range from about 18.60 to 20.69 wt.%, indicating that Samples B and C form another distinct statistical group. The increased recovery rate indicates the efficiency of the primary physical washing separation process. The mineral and elemental composition of the separated finest fraction brings important clues about their technological viability and is further investigated.
3.2. Mineral Distribution Assessment
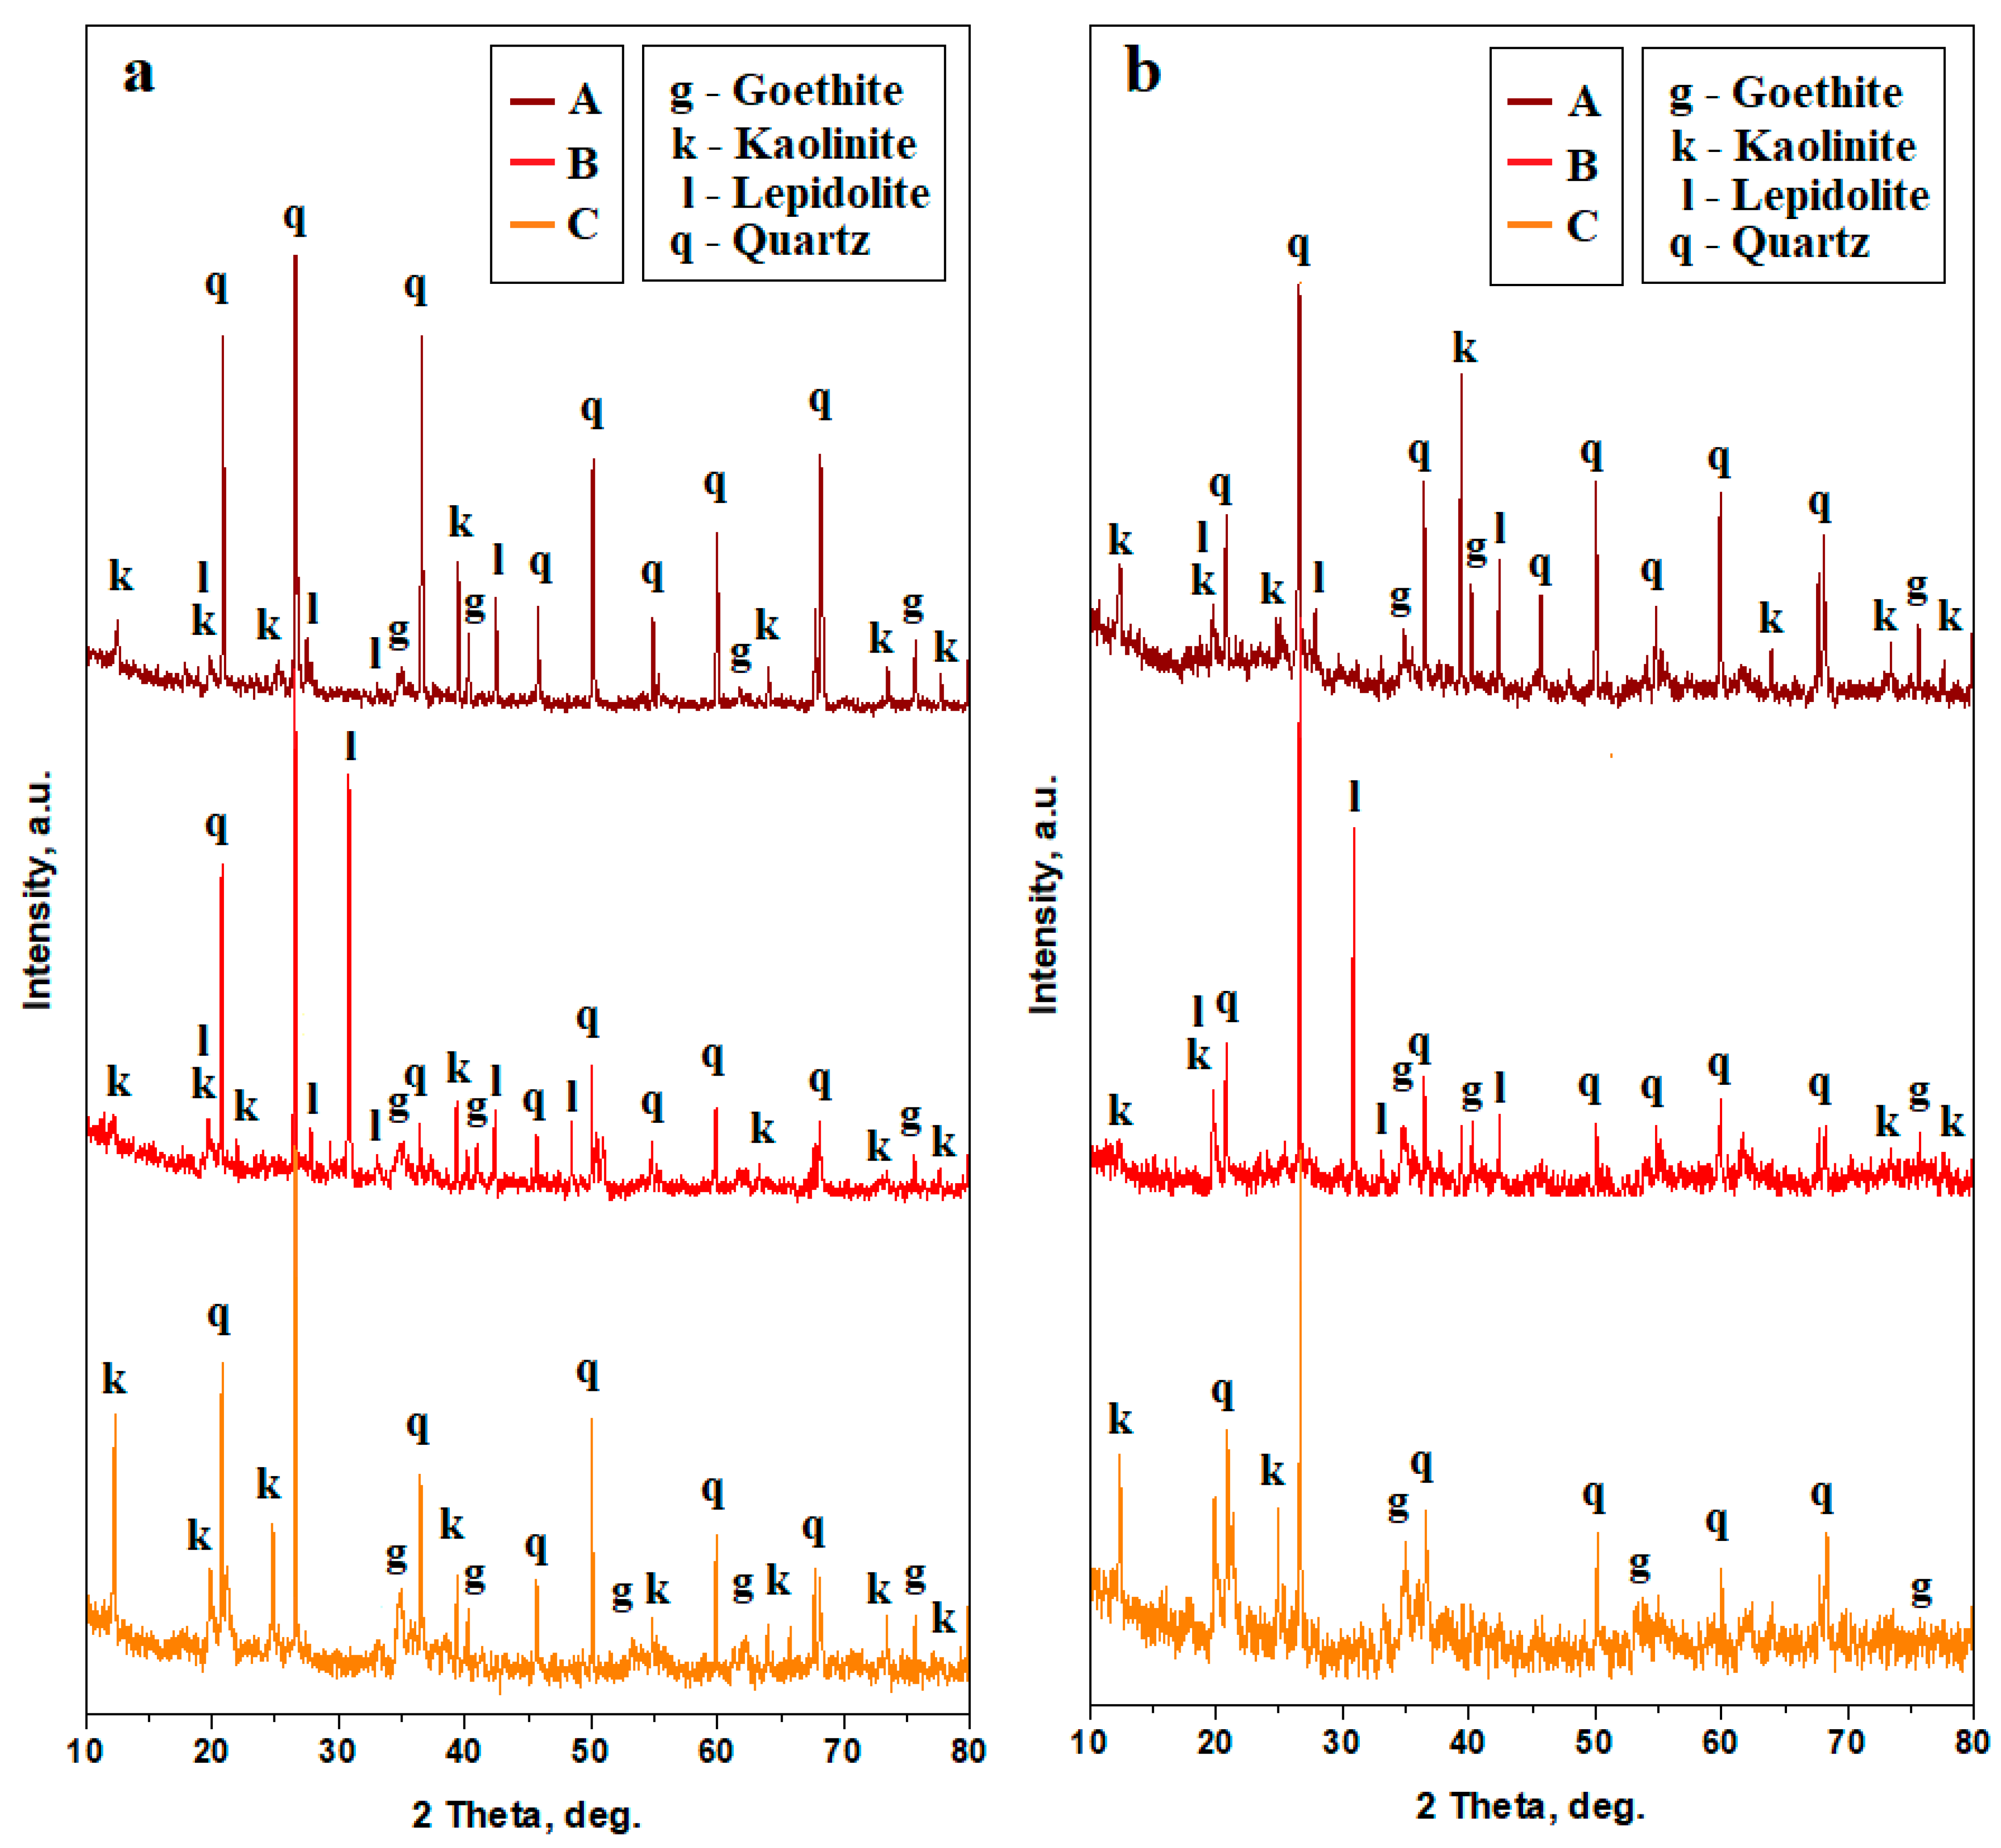
Soil samples have strong crystalline characteristics, evidenced by the diffraction peaks. Their shape is narrow, having strong intensities diffracted by the strong and densely crystallized materials; some other peaks are less intense and broadened because of the nanostructural characteristics of the finest fractions, Figure 4a.
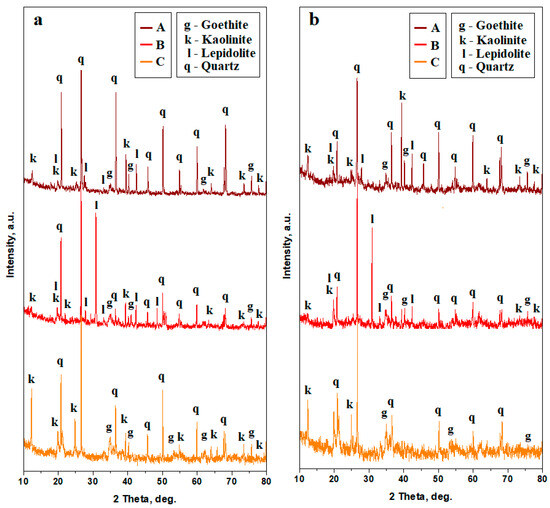
Figure 4.
XRD patterns for the soil samples: (a) bulk and (b) finest fractions collected after washing separation. The peaks’ identification was based on the following PDF files: quartz PDF 89-8936, lepidolite PDF 73-0294, kaolinite PDF 03-0059, and goethite PDF 08-0097.
The upper soil, having a dark red color and sandy texture, is dominated by quartz, which is the most representative mineral in this sample. It features narrow peaks with strong intensities. It is followed by a clay mixture composed of kaolinite and lepidolite. Kaolinite peaks have an intense tip and slightly broadened base, indicating a mixture of nano and small micro particles. On the other hand, the lepidolite peaks are less intense and broadened, indicating their nanostructural consistency. Iron hydroxide, crystallized as goethite, shows a few small peaks, indicating its low concentration in the upper sample. The lower dark red soil (Sample B) has a clayey texture. The relative intensity of the quartz peaks significantly decreases while lepidolite peaks strongly increase compared to the upper layer. Kaolinite peaks are weak and broadened, indicating the presence of a low amount of the finest nanostructured particles. Goethite is present only in weak traces, indicating a small amount of iron hydroxide particles dispersed within the kaolinite. The bottom layer (Sample C) is dominated by a significant presence of quartz, having intense and narrow peaks. It is followed by kaolinite, which also has well-developed peaks with a slightly broadened base, indicating a mixture of micro and nano fractions. Lepidolite disappears completely on this layer, but the intensity of goethite peaks grows significantly, indicating its relative increase regarding the other constituent minerals.
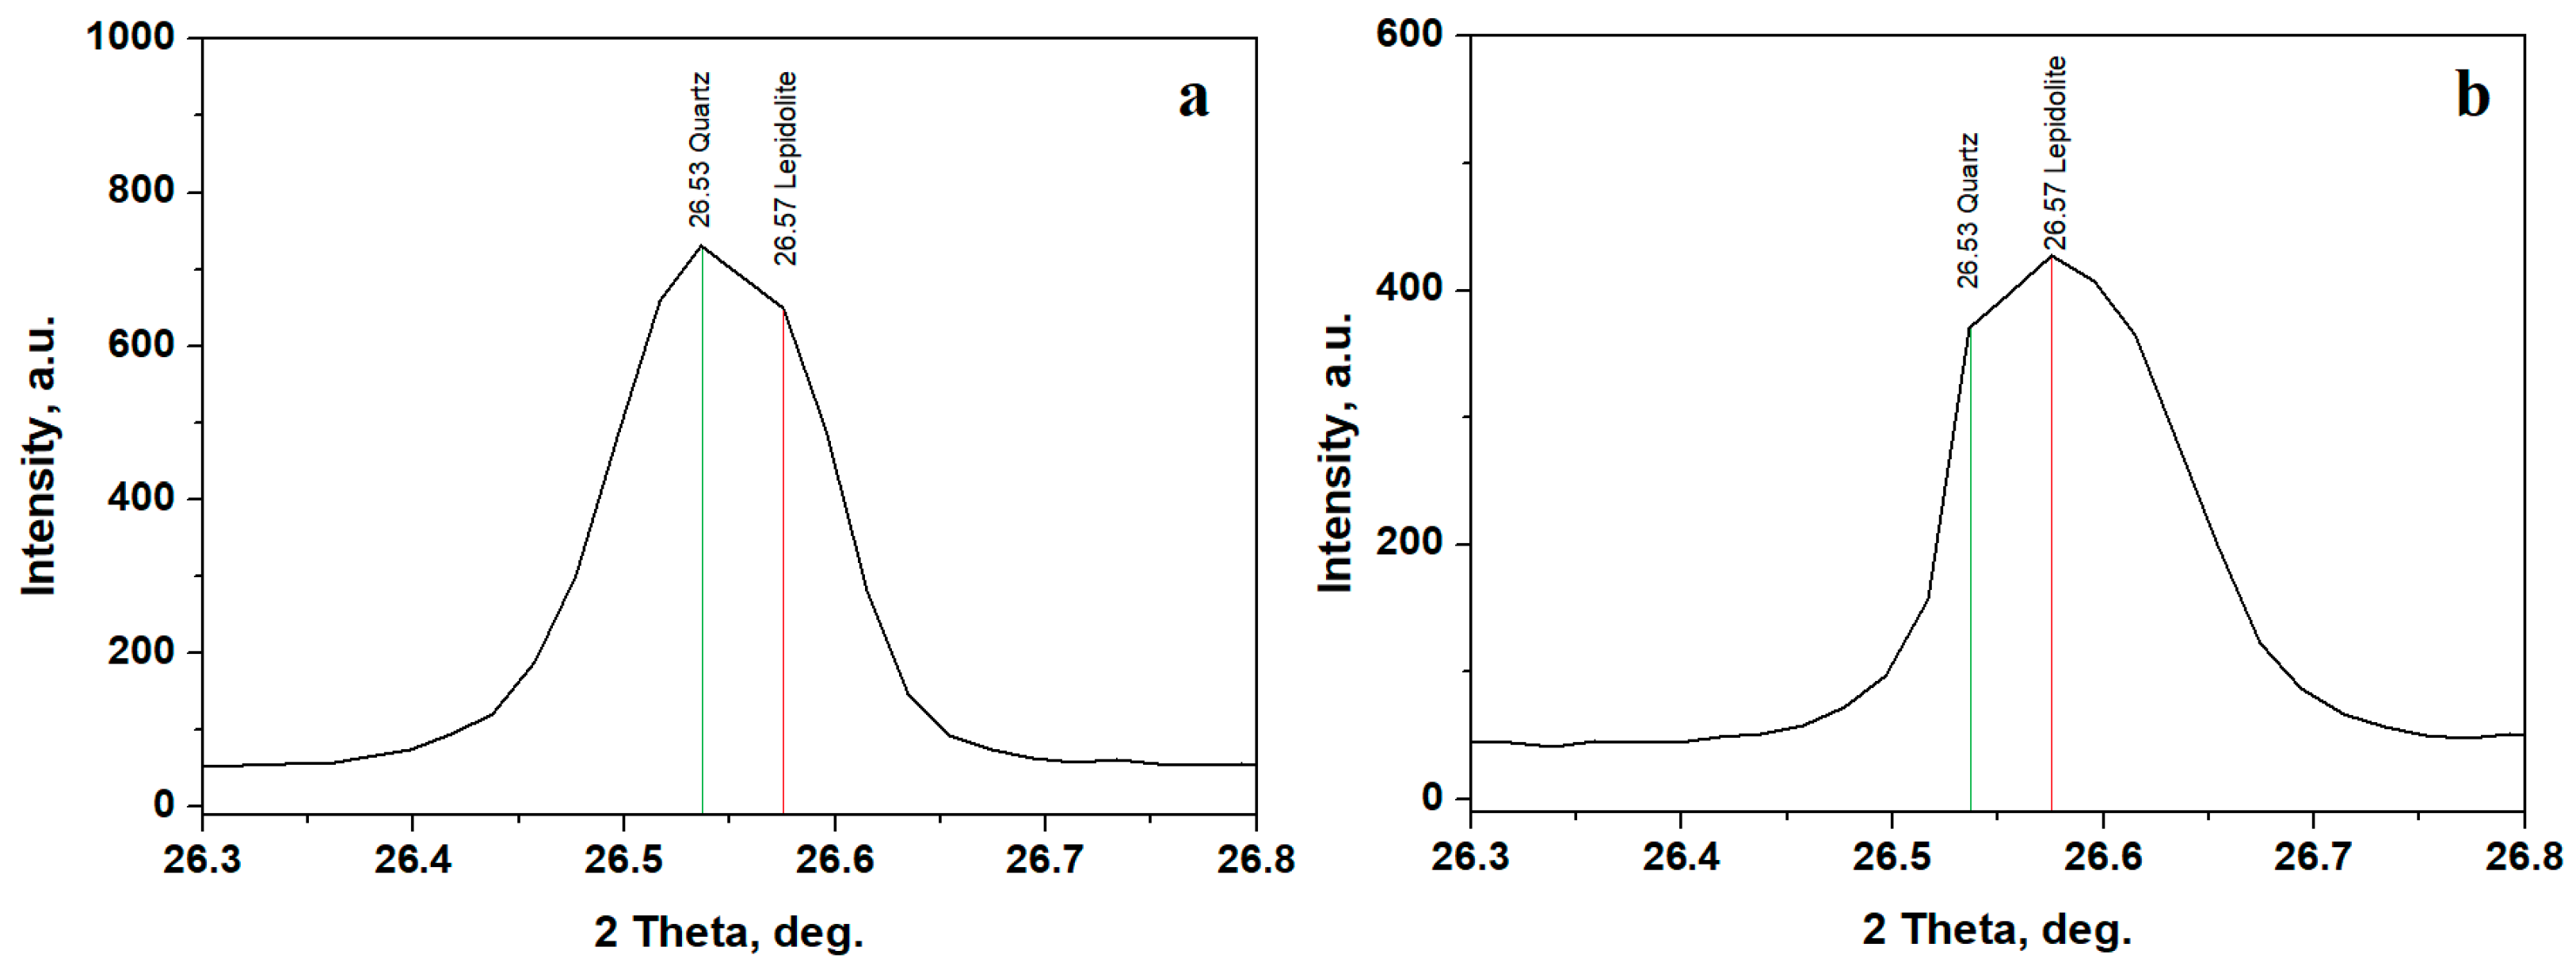
Sample B exhibits an interesting characteristic related to the diffraction peak observed at the position of 26.5°, which commonly fits the most intense peak of the quartz standard PDF 89-8936, but it overlaps with one of the most intense peaks of the manganese lepidolite standard PDF 73-0294. This is more clearly illustrated in Figure 5a, where the quartz position is clearly observed at 26.53° followed by the lepidolite at 26.57°. Quartz still dominates lepidolite in the composition of Sample B.
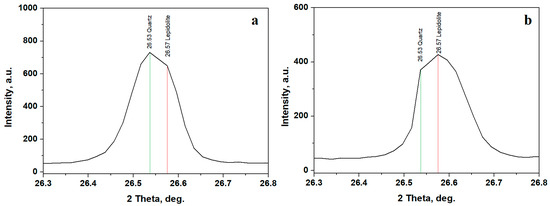
Figure 5.
Detail of quartz/lepidolite overlapped peak in Sample B: (a) initial and (b) after washing separation.
The washing separation process disperses the finest clay particles into ultra-pure water while the coarse fraction settles at the bottom of the recipient. The aqueous dispersion containing the finest fraction is separated and subsequently dried. The XRD patterns resulting from the finest fractions indicate a strong decrease in the quartz peak intensities and a strong increase in the clay minerals peaks, Figure 4b. Lepidolite and kaolinite amounts increase in Sample A, and a very intense increase in the lepidolite amount is observed in Sample B. Sample C reveals a strong decrease in the quartz peaks and a significant increase in the kaolinite peaks. The increased amount of lepidolite in Sample B is further supported by a notable rise in intensity at 26.57°, close to the quartz peak at 26.53°, as shown in Figure 5b.
The amounts of individual minerals can be calculated through X-ray diffraction based on the specific peak intensities and the corundum factor. This method is referred to in the literature as the Relative Intensity Ratio (RIR), as described in our previous studies [38,39]. It was applied to the XRD patterns in Figure 4 for both initial samples and samples resulting from the washing separation process, and the resulting amounts of identified minerals are collected in Table 2.

Table 2.
Mineral composition of the samples investigated.
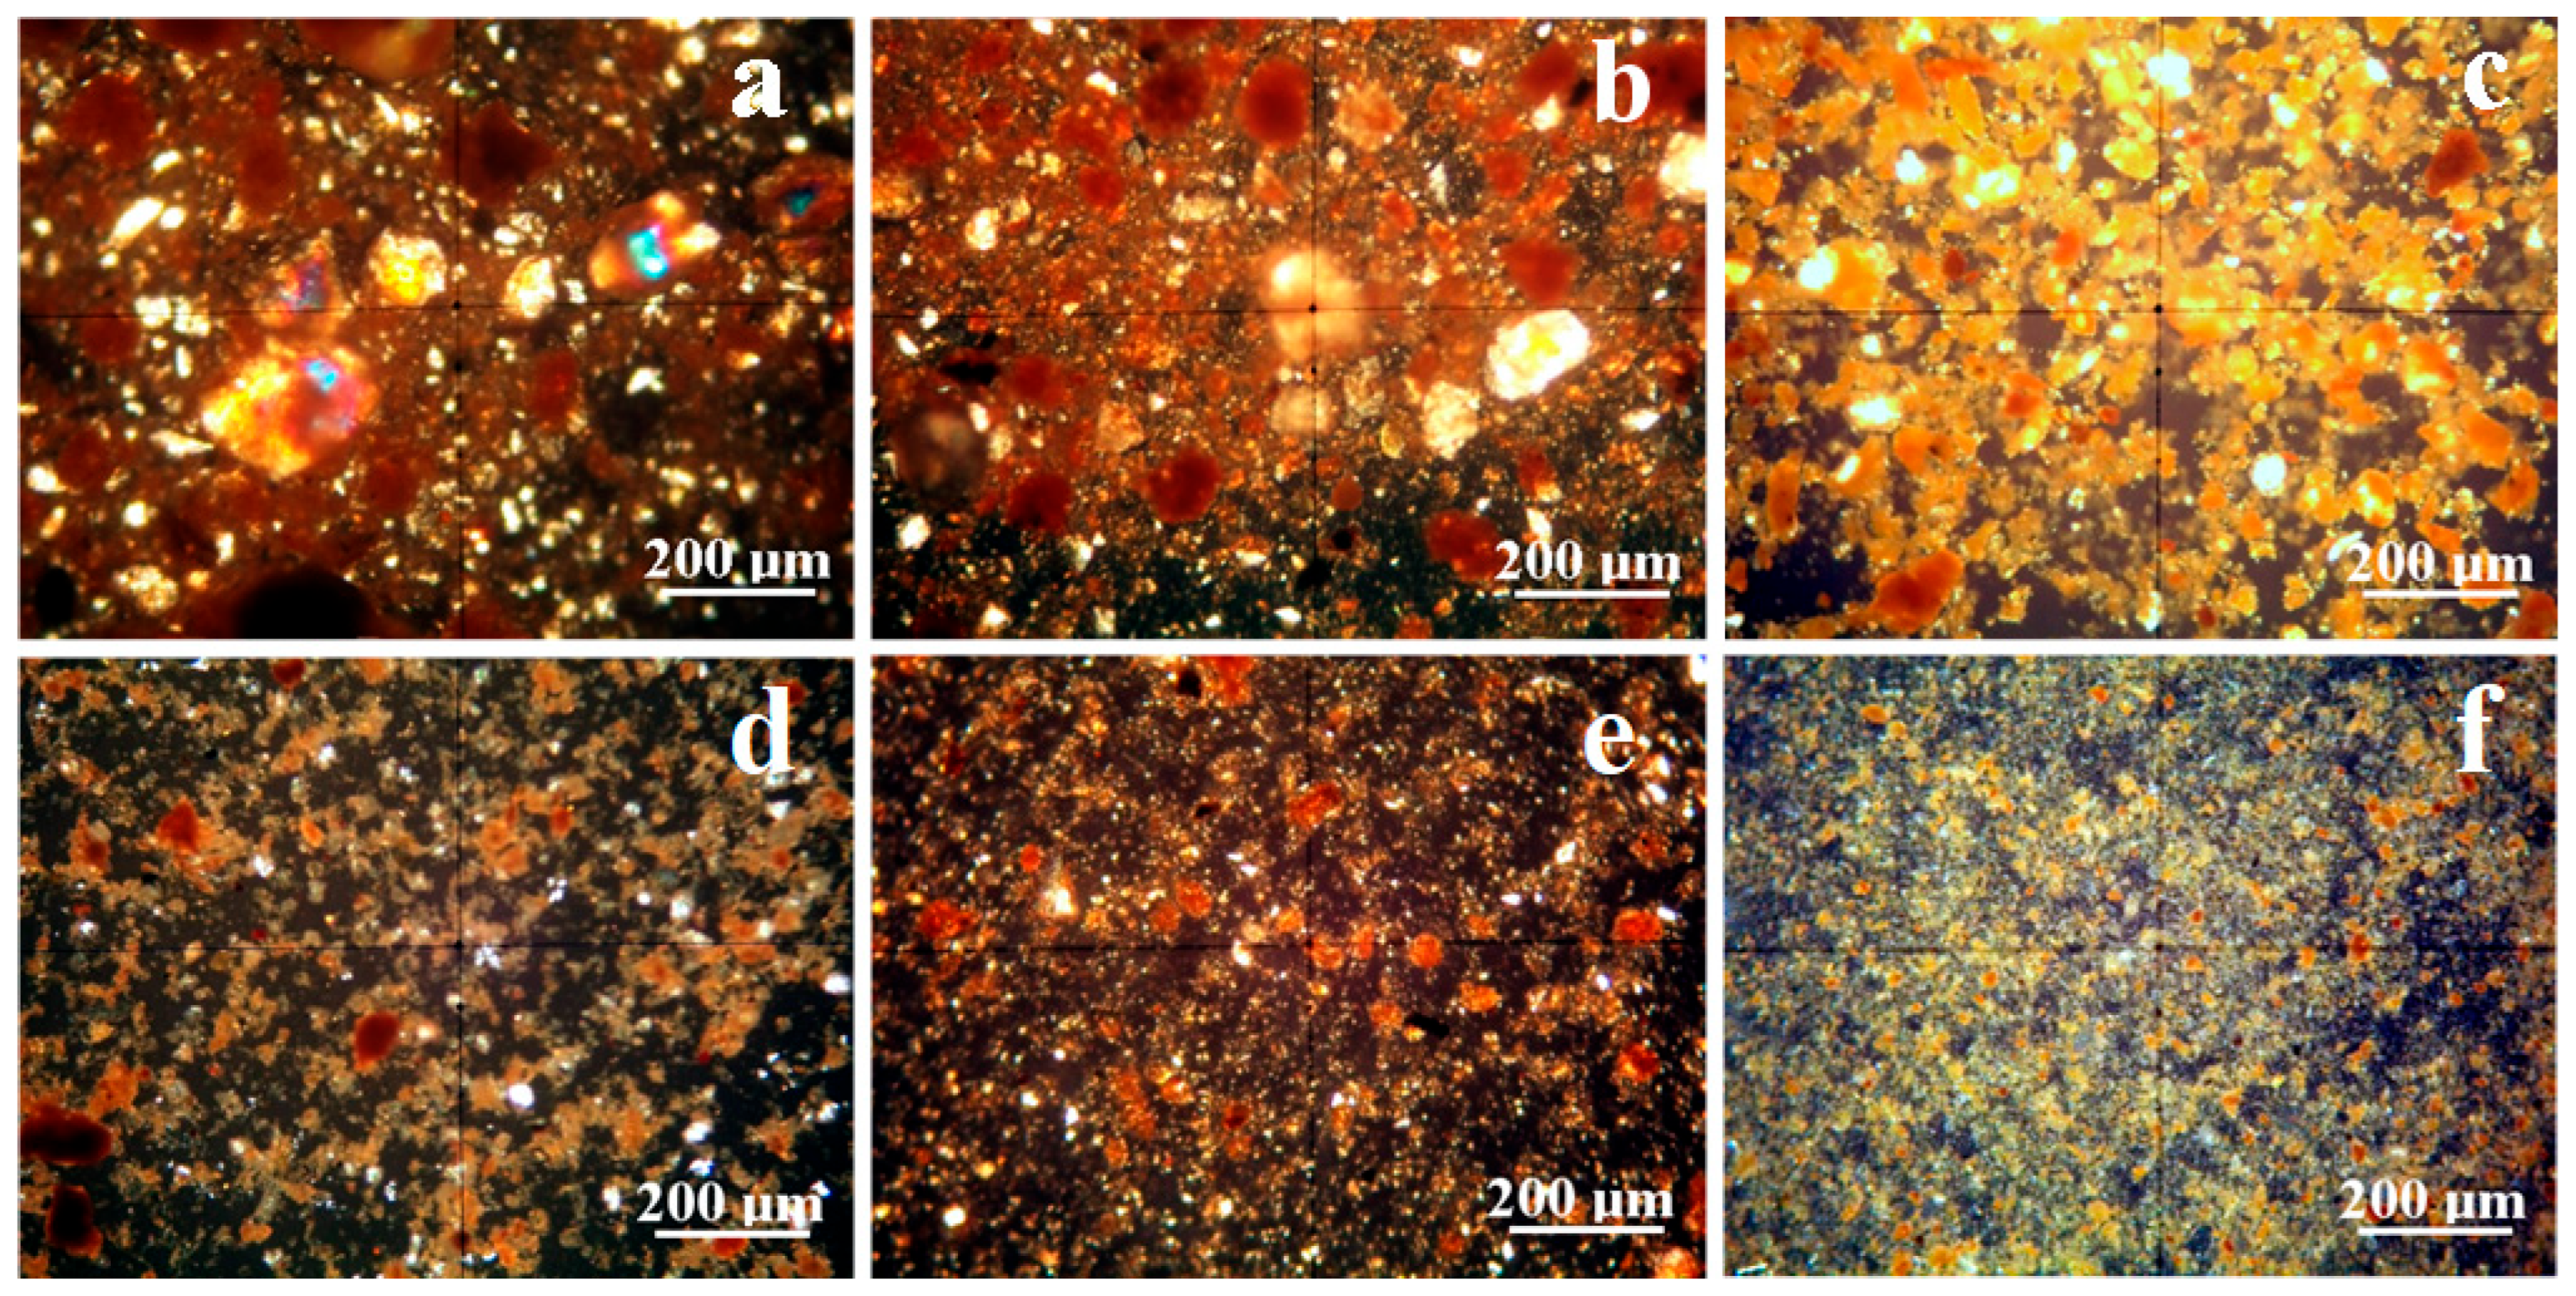
Mineralogical optical microscopy (MOM) examines samples under cross-polarized light. Each mineral affects the oscillation angle of the polarized light beam, producing illumination peaks and color extinction specific to that mineral due to the birefringence phenomenon. Quartz has a green-gray nuance in thin sections and for small particles, but when bigger particles occur, they often feature a rainbow glitter with intense green spots. Larger and well-defined kaolinite particles have a white–pale blue nuance but turn yellow upon the compact massing of the finest particles, and goethite has a predominantly brown nuance with intense red spots in thin sections; all of these aspects were evidenced on etalon samples in our previous studies [39,40]. Lepidolite particles feature pink nuances under cross-polarized light, but manganese occurrence turns it into red-orange nuance [41,42]. The sample observation under cross-polarized light in Figure 5 allows for establishing the size range for each mineral, a fact also featured in Table 2.
Sample A has a sandy texture given by the abundant large quartz particles. These have a boulder-like aspect, Figure 6a; their size ranges from 5 to about 18 µm. Quartz particles are accompanied by some large kaolinite slivers up to 15 µm having a preponderantly white aspect and by a few rounded boulders of goethite ranging from 2 to 25 µm, which appear to have a brown nuance. All these mineral particulate matter are surrounded by small particles of lepidolite of about 1 µm and below, with only a few of them reaching 10 µm. These finest lepidolite particles appear in Figure 4a as a red-orange fog surrounding the other mineral particles. The separation process facilitates the dispersion of the finest particles while the coarser fraction settles to the bottom of the vial. Figure 6d reveals the complete removal of all fractions larger than 10 µm. The remaining finest particles consist mainly of a lepidolite and kaolinite mixture, with traces of quartz particles measuring approximately 5–10 µm. The smaller goethite particles remain mixed up with the finest clay particles.
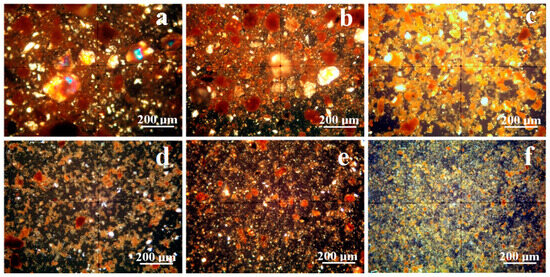
Figure 6.
MOM images of the initial soils: (a) Sample A, (b) Sample B, and (c) Sample C and for the extracted fine fractions: (d) Sample A, (e) Sample B, and (f) Sample C.
Sample B has a clayey texture very abundant in lepidolite and kaolinite fine particles with sizes predominantly about 1 µm (only a few being about 5–10 µm) that tightly surrounds the coarser fractions composed of quartz boulder-like particles and goethite, Figure 6b. During the separation process, the coarser sandy fractions settle at the bottom of the vial while the clay mixture remains suspended. The obtained powder contains only the finest fractions dominated by lepidolite with moderate traces of kaolinite and small quartz particles, Figure 6e. The washing separation process enriches the filtered sample in lepidolite fine particles organized in small microstructural clusters of about 3–15 µm. They have an intense and uniform red-orange color generated by the random disposal of the finest particles of lepidolite, giving a clue about their nanostructural organization (fact in good agreement with the XRD peaks broadening).
Sample C displays a dense kaolinite clay matrix closely enveloping the quartz particles, which have a boulder-like aspect and sizes of about 5–75 µm (smaller than observed in the sandy Sample A). The kaolinite aggregates have a yellow nuance caused by their random orientation of the finest particles, Figure 6c. Some of these aggregates turn brown because of the goethite amount. The brown color intercalation with kaolinite yellow indicates a refined microstructural distribution of the iron hydroxide particles, which features only a few grainy particles up to 15 µm in diameter. The washing separation process successfully removes coarse particles, including quartz and goethite, from the aqueous dispersion. The resulting fine powder is primarily composed of kaolinite stained with goethite, as clearly indicated by the yellow clusters with brown spots shown in Figure 6f.
Both lepidolite and kaolinite form a foggy embedding matrix of the coarser mineral particles, as observed by MOM images in Figure 6, which are well separated through the separation process. It corresponds to the broadened aspect of the lepidolite and kaolinite diffraction peaks in Figure 3b, indicating nanostructural organization. The crystallite size can be calculated using the Scherrer formula [43]. It was applied to the XRD patterns in Figure 3b, and the obtained values are displayed in Table 3.

Table 3.
Crystallite size calculated with the Scherrer formula.
The organization of lepidolite and kaolinite fine particles into small microstructural clusters of approximately 1–2 µm, as observed after the washing separation process, along with the nanoscale size of their crystallites, suggests the potential presence of a significant quantity of clay nanoparticles. This fact requires advanced ultra-structural investigation, which will be properly assessed by atomic force microscopy in subchapter 3.4.
3.3. Microstructural Characterization
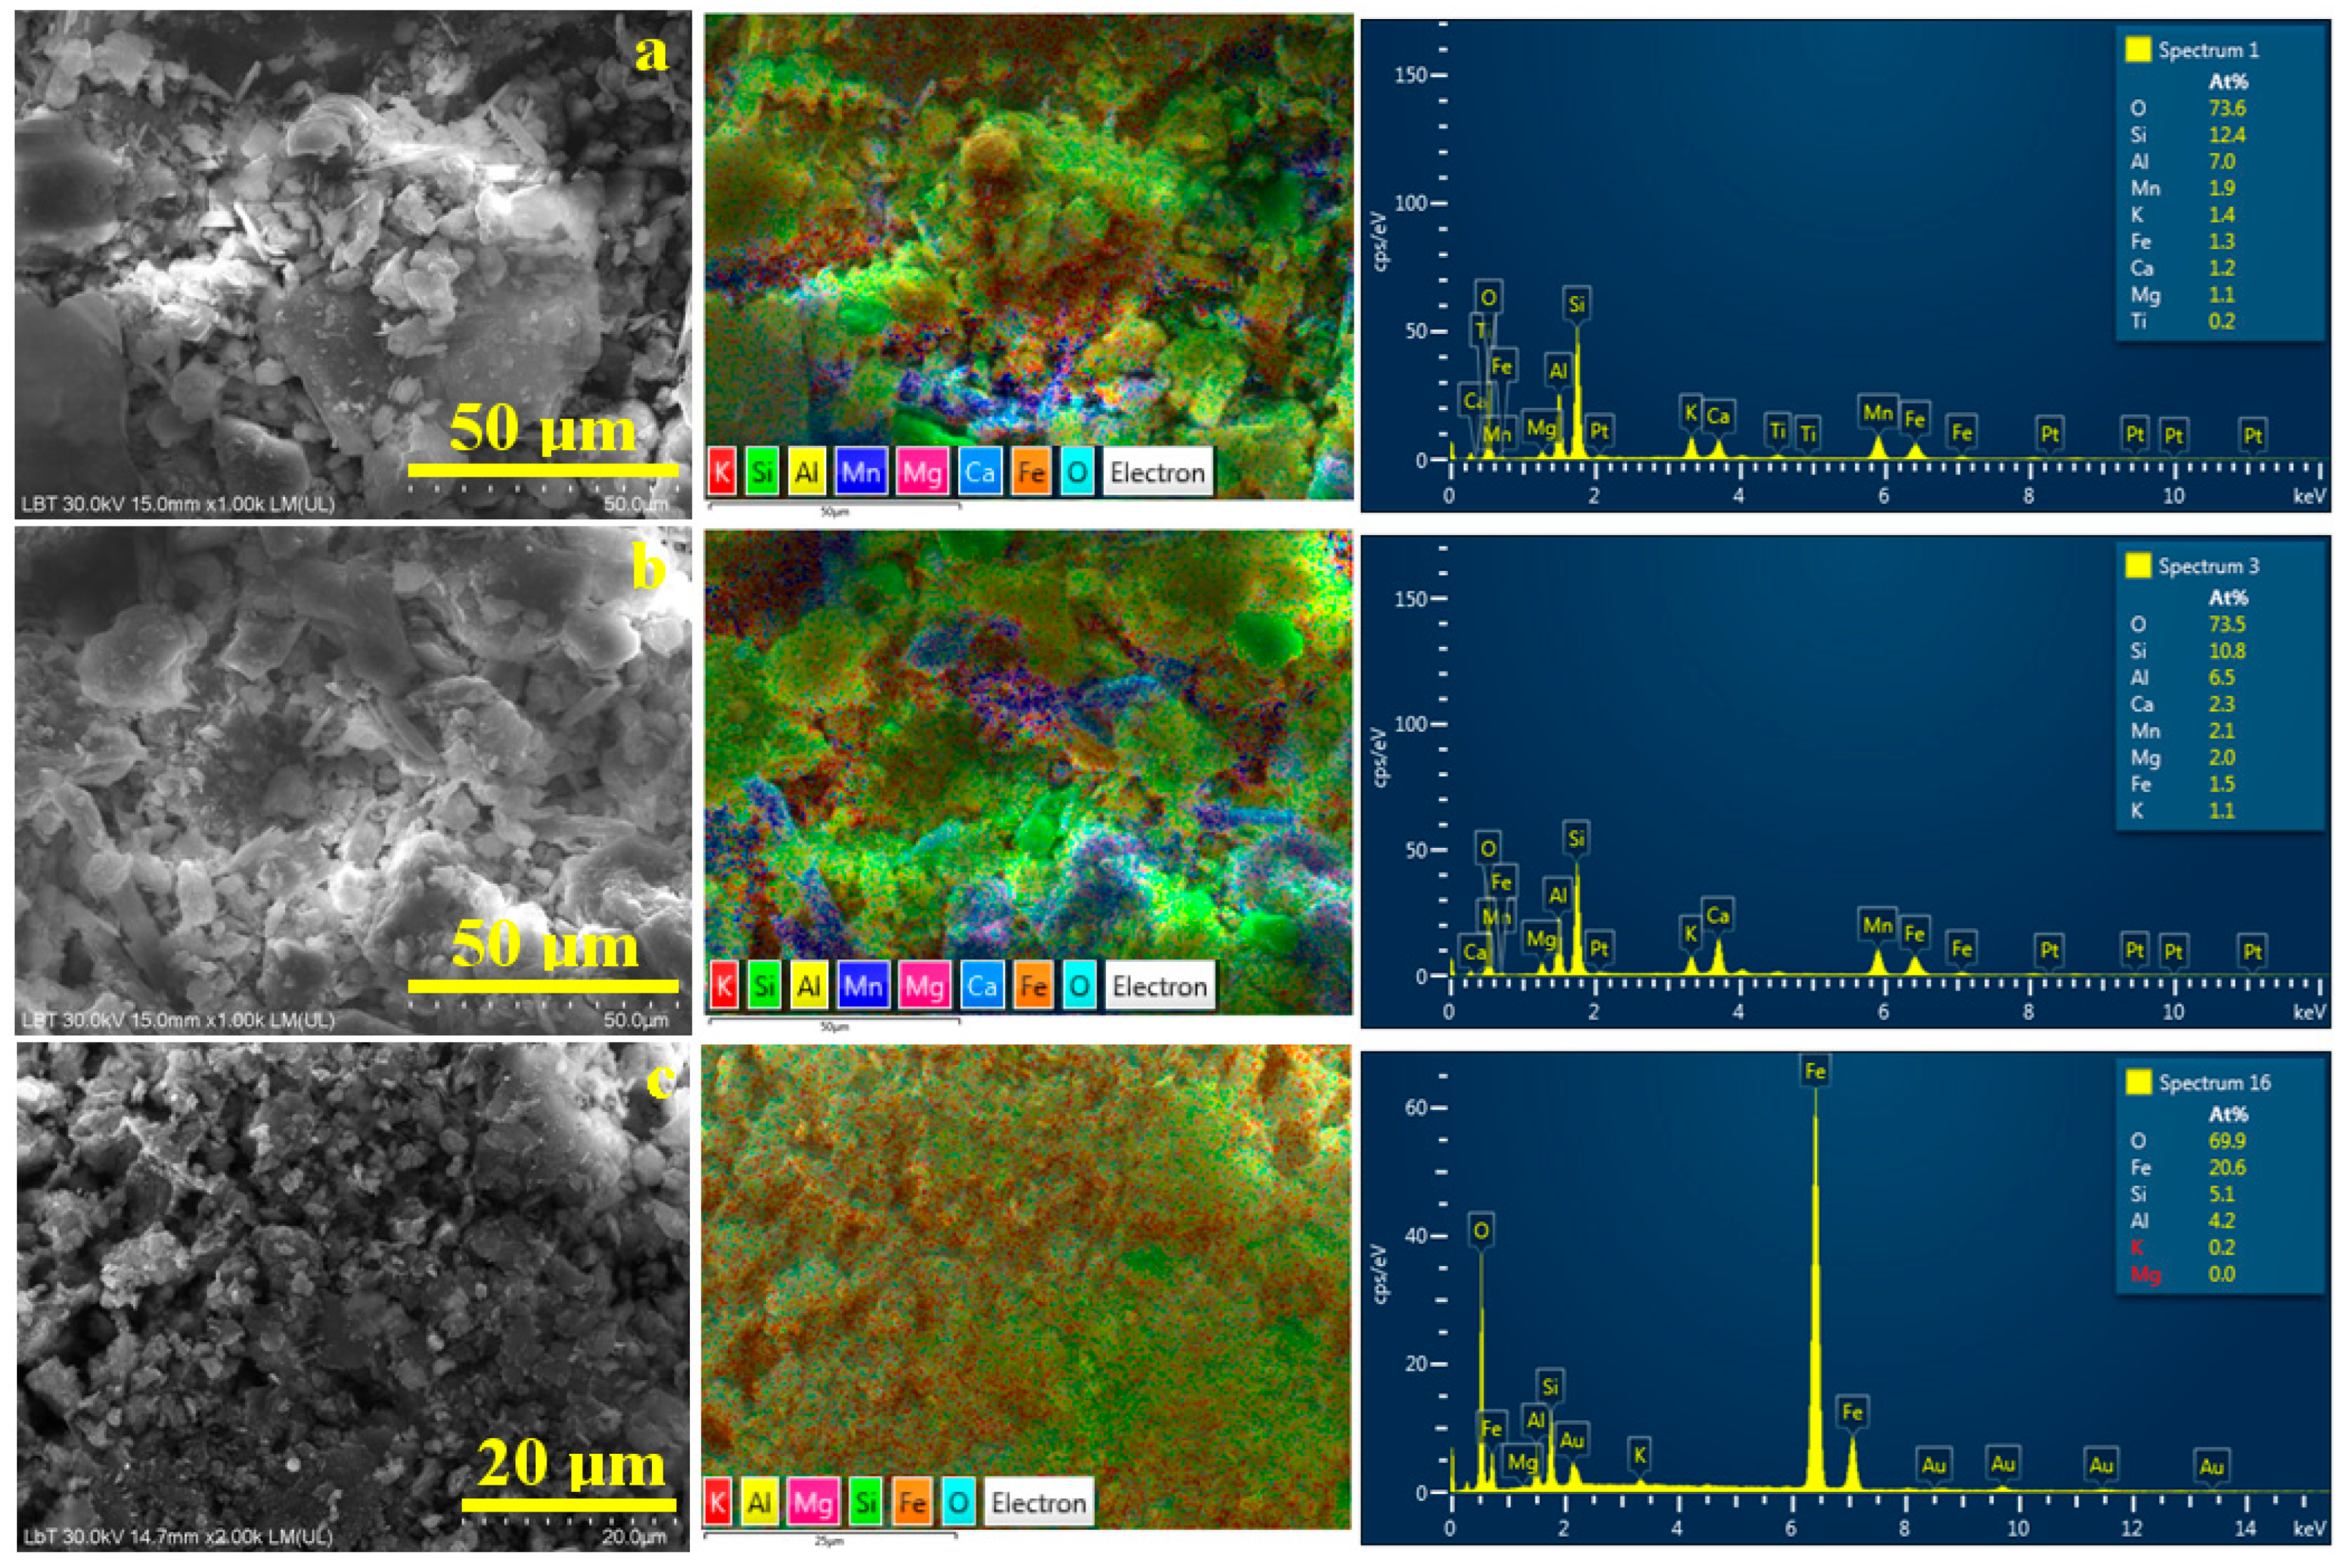
Scanning electron microscopy (SEM) allows an advanced microstructural investigation of the soil samples before and after the washing separation process. It presents the benefit of coupling with the elemental distribution maps that relate the samples’ elemental composition to the mineral particles. Thus, the microstructural aspect of the initial samples, Figure 7, confirms the MOM observations. Quartz particles have boulder-like aspects with irregular margins caused by the blunting induced by prolonged friction with other sandy particles during the geological eras. Clay particles have a tabular–lamellar aspect, but it is difficult to distinguish which are lepidolite and which are kaolinite only by morphological observation. Furthermore, MOM observation reveals that goethite particles appear in both forms as rounded boulder microparticles of about 2–25 μm and fine microdispersion, which is difficult to distinguish among other fine details in Figure 6.
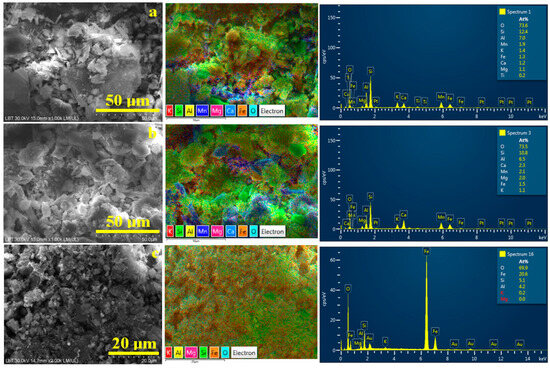
Figure 7.
SEM images of the initial soil: (a) Sample A, (b) Sample B, and (c) Sample C. The corresponding elemental map and EDX spectrum are presented on the right side of each SEM image.
Elemental mapping helps to detect each mineral by its specific composition. Thus, quartz, having the chemical formula SiO2, appears as a bright green color due to the overlapping of the O turquoise label and Si green label. Kaolinite has the chemical formula Al2Si2O5(OH)4, and it became very distinct as pale green due to the overlapping of the O and Si characteristic color with yellow labeled for Al. The difference between kaolinite and lepidolite is caused by the presence of manganese, labeled in deep blue. Iron (orange labeled) makes observing its distribution easier within the sample’s morphology.
The sandy texture of Sample A, Figure 7a, is formed by large quartz particles associated with some bigger kaolinite particles. These coarse components are surrounded by a dense mixture of fine particles, mainly lepidolite and kaolinite. Iron particles are predominantly distributed within the finest fractions.
Sample B is formed predominantly by the finest fractions of lepidolite with traces of kaolinite mixed up with quartz particles, Figure 7b. The blue areas within the elemental map evidence significant clustering of lepidolite particles, sustaining the MOM observations. Goethite particles appear to cluster near larger kaolinite particles, a phenomenon previously observed in ceramic slurries [44]. This arrangement of iron hydroxide particles makes the sample more stable and could be useful for its removal through washing separation.
In Sample C, Figure 7c, the finest kaolinite fractions dominate the microstructure, closely enveloping the quartz particles. Goethite particles are uniformly spread within the kaolinite, making it very difficult to separate them. However, there appear to be some concentrated clusters of goethite, which are prone to sedimentation during the primary washing separation process.
Elemental compositions of the initial soil samples are presented in Table 4. The dominant elements are O, Si, Al, and K, related to quartz and clay particles. These have a significant participation in all initial samples.

Table 4.
Elemental composition of the initial soil samples.
Manganese has a significant presence of 1.9 at.% in Sample A because of lepidolite particles observed in the elemental map in Figure 6a. It increases to about 2.1 at.% in sample B proportionally to the lepidolite particles observed in the elemental map and completely disappears in Sample C, which contains huge amounts of iron compared with A and B. Traces elements of Ca, Mg, and Ti are often found in the forest soils of the Apuseni Mountains [45,46].
One would expect elemental analysis to identify lithium within the lepidolite particles; however, SEM energy-dispersive spectroscopy (EDS) is unable to detect it because of lithium’s small atomic size. Rubidium is the other specific element within the lepidolite formula, which should have been evidenced by the EDS spectra; its energy peak occurs at 1.694 keV, which is very close to the Si peak at 1.739 keV. Since the Si peak is very strong, the detector cannot distinguish the smaller Rb peak, which is confounded with the Si peak base.
Thiery and Farhat investigated lithium ores by SEM-EDX, revealing EDS spectra for pure lepidolite platelets at different acceleration voltages [47]. They revealed the dominant elements as O, Al, Si, and K, which are characteristics of all phyllosilicates. The lepidolite characteristics are spotted by a small energy peak corresponding to F occurring at 0.677 keV and by a stronger Mn peak occurring at 5.894 keV. It is noteworthy that the pure lepidolite ore evidence traces Na and an unassigned energy peak at 3.690 keV that belongs to Ca [47]. These elemental characteristics were obtained at an acceleration of 15 kV, with the Mn peak disappearing at lower acceleration voltages like 5 kV. Thus, the F energy peak is a specific signature for the micas subclass mineral, and Mn represents the lepidolite signature.
Our EDS spectra were obtained at an acceleration voltage of 30 kV, ensuring optimal detection of both light and heavy elements. The lepidolite signature was evidenced in both Samples A and B, but the F energy peak was not detected. This phenomenon is explained by the presence of stronger energy peaks from other elements adjacent to its peak position of 0.677 keV, such as O (0.525 keV) and Fe (0.776 keV). It would be interesting to observe if the F energy can be found on the finest fractions separated by washing.
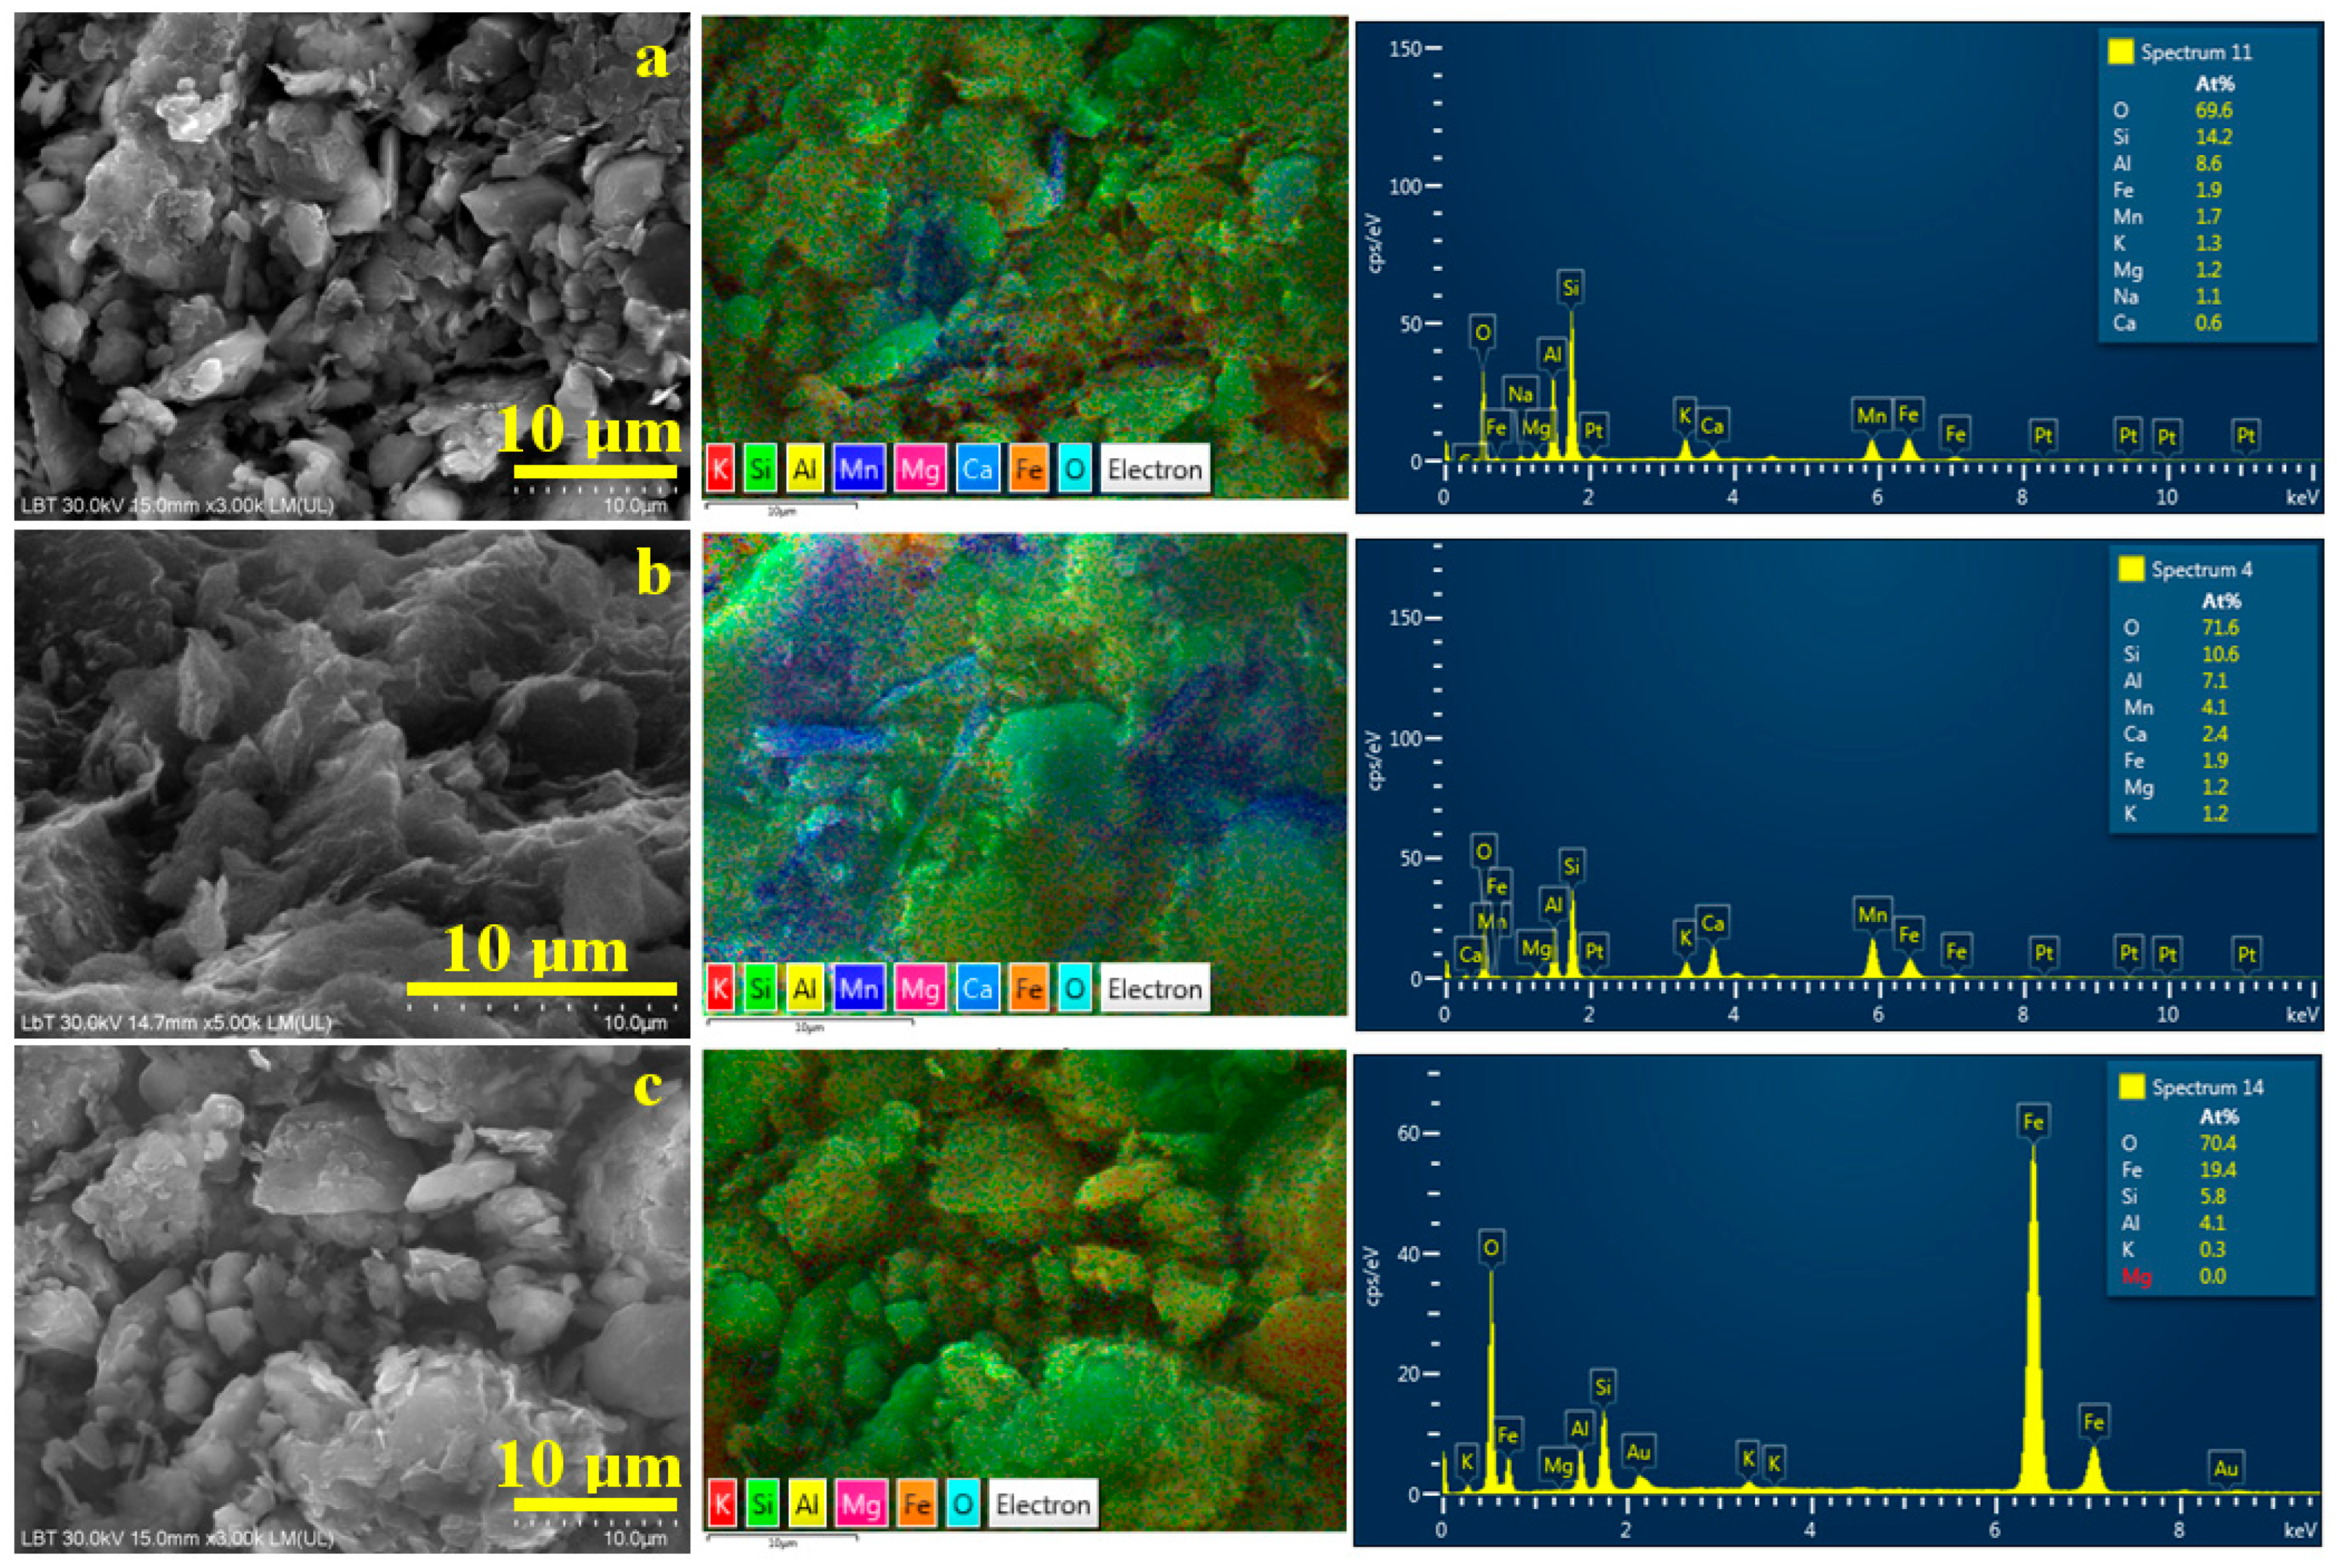
The primary washing separation procedure removes the coarser fractions, mainly quartz, increasing the finest clay particle amount in all investigated samples. Thus, Sample A still evidences a sandy morphology based on a few small quartz particles with a boulder-like aspect and sizes up to 10 μm surrounded by fine lamellar–tabular clay particles, Figure 8a. Some of the clay particles have a planar size up to 5 μm, and their thickness is about 1.5–2 μm, but most of them appear as very fine fractions well distributed within the observed microstructure. The elemental map reveals a concentration of blue areas within the finest particles observed, indicating their segregation regarding quartz particles but still mixed with small kaolinite particles. These specific areas look like nanostructured matter clusters, which require an advanced surface investigation. Iron appears as small, concentrated orange-brown spots predominantly dispersed throughout the kaolinite mass, indicating contamination with fine traces of goethite.
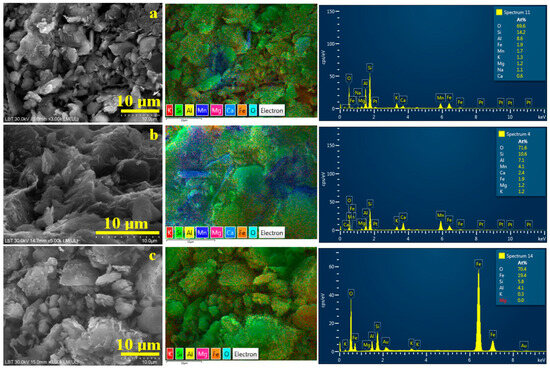
Figure 8.
SEM images of the finest particles collected after washing separation: (a) Sample A, (b) Sample B, and (c) Sample C. The corresponding elemental map and EDX spectrum are presented on the right side of each SEM image.
Quartz particles are less prominent in Sample B, Figure 8b, due to their extensive removal during the primary washing separation; however, a few boulder-like quartz particles, approximately 5 μm in size, are still present and appear bright green on the elemental map. Fine lamellar clay particles dominate the microstructure of Sample B following washing separation. Elemental mapping reveals extensive blue regions indicating the distribution of lepidolite alongside areas of yellow-green coloration corresponding to kaolinite particles. The clay particles’ planar size is situated up to 5 μm (in good agreement with MOM observation), but most of them are very fine, indicating a nanostructural distribution. Iron distribution is related mainly to the random contamination of kaolinite with goethite. The elemental map in Figure 8b shows a distinct, dense orange spot approximately 2.5 μm in diameter in the upper left region, indicating a well-defined goethite particle deposited near the junction of a lepidolite and kaolinite cluster.
Sample C has a very fine texture, which allows easy removal of coarse quartz fractions through the separation process. The resulting powder is primarily composed of very fine kaolinite particles, as shown in Figure 8c, densely surrounding a few coarser quartz and kaolinite particles measuring approximately 5 μm. The elemental map clearly reveals the distribution of fine particles covering quartz boulders. It indicates a nanostructural distribution within the kaolinite mass embedding large amounts of goethite. Iron distribution is finely dispersed within phyllosilicate particles, making them very hard to remove by simple washing.
Table 5 presents the elemental composition of the samples following separation. They are dominated by oxygen and silicon because of the significant presence of phyllosilicate particles and quartz small microstructural remains; overall, O and Si amounts are unchanged as a consequence of the separation process. It is only about elemental redistribution.

Table 5.
Elemental composition of the fine fractions resulted after washing separation.
The distinct mineral signatures reflect the elemental redistribution. Clay amount enrichment is proved by a significant increase in the Al amount in Samples A and B, indicating quartz decrease. It certainly implies an increase in kaolinite, which sustains the MOM observation. The moderate increase in Mn in Sample A and its significant rise in Sample B supports the enrichment of lepidolite. This confirms the MOM observation that Sample B exhibits a significant increase in lepidolite content relative to the other minerals in the composition. Sample C has an almost unchanged silicate elemental composition but reveals a significant decrease in iron content. It sustains a partial elimination of goethite particles through the washing separation along with the coarse quartz particles.
3.4. Ultrastructure Assessement
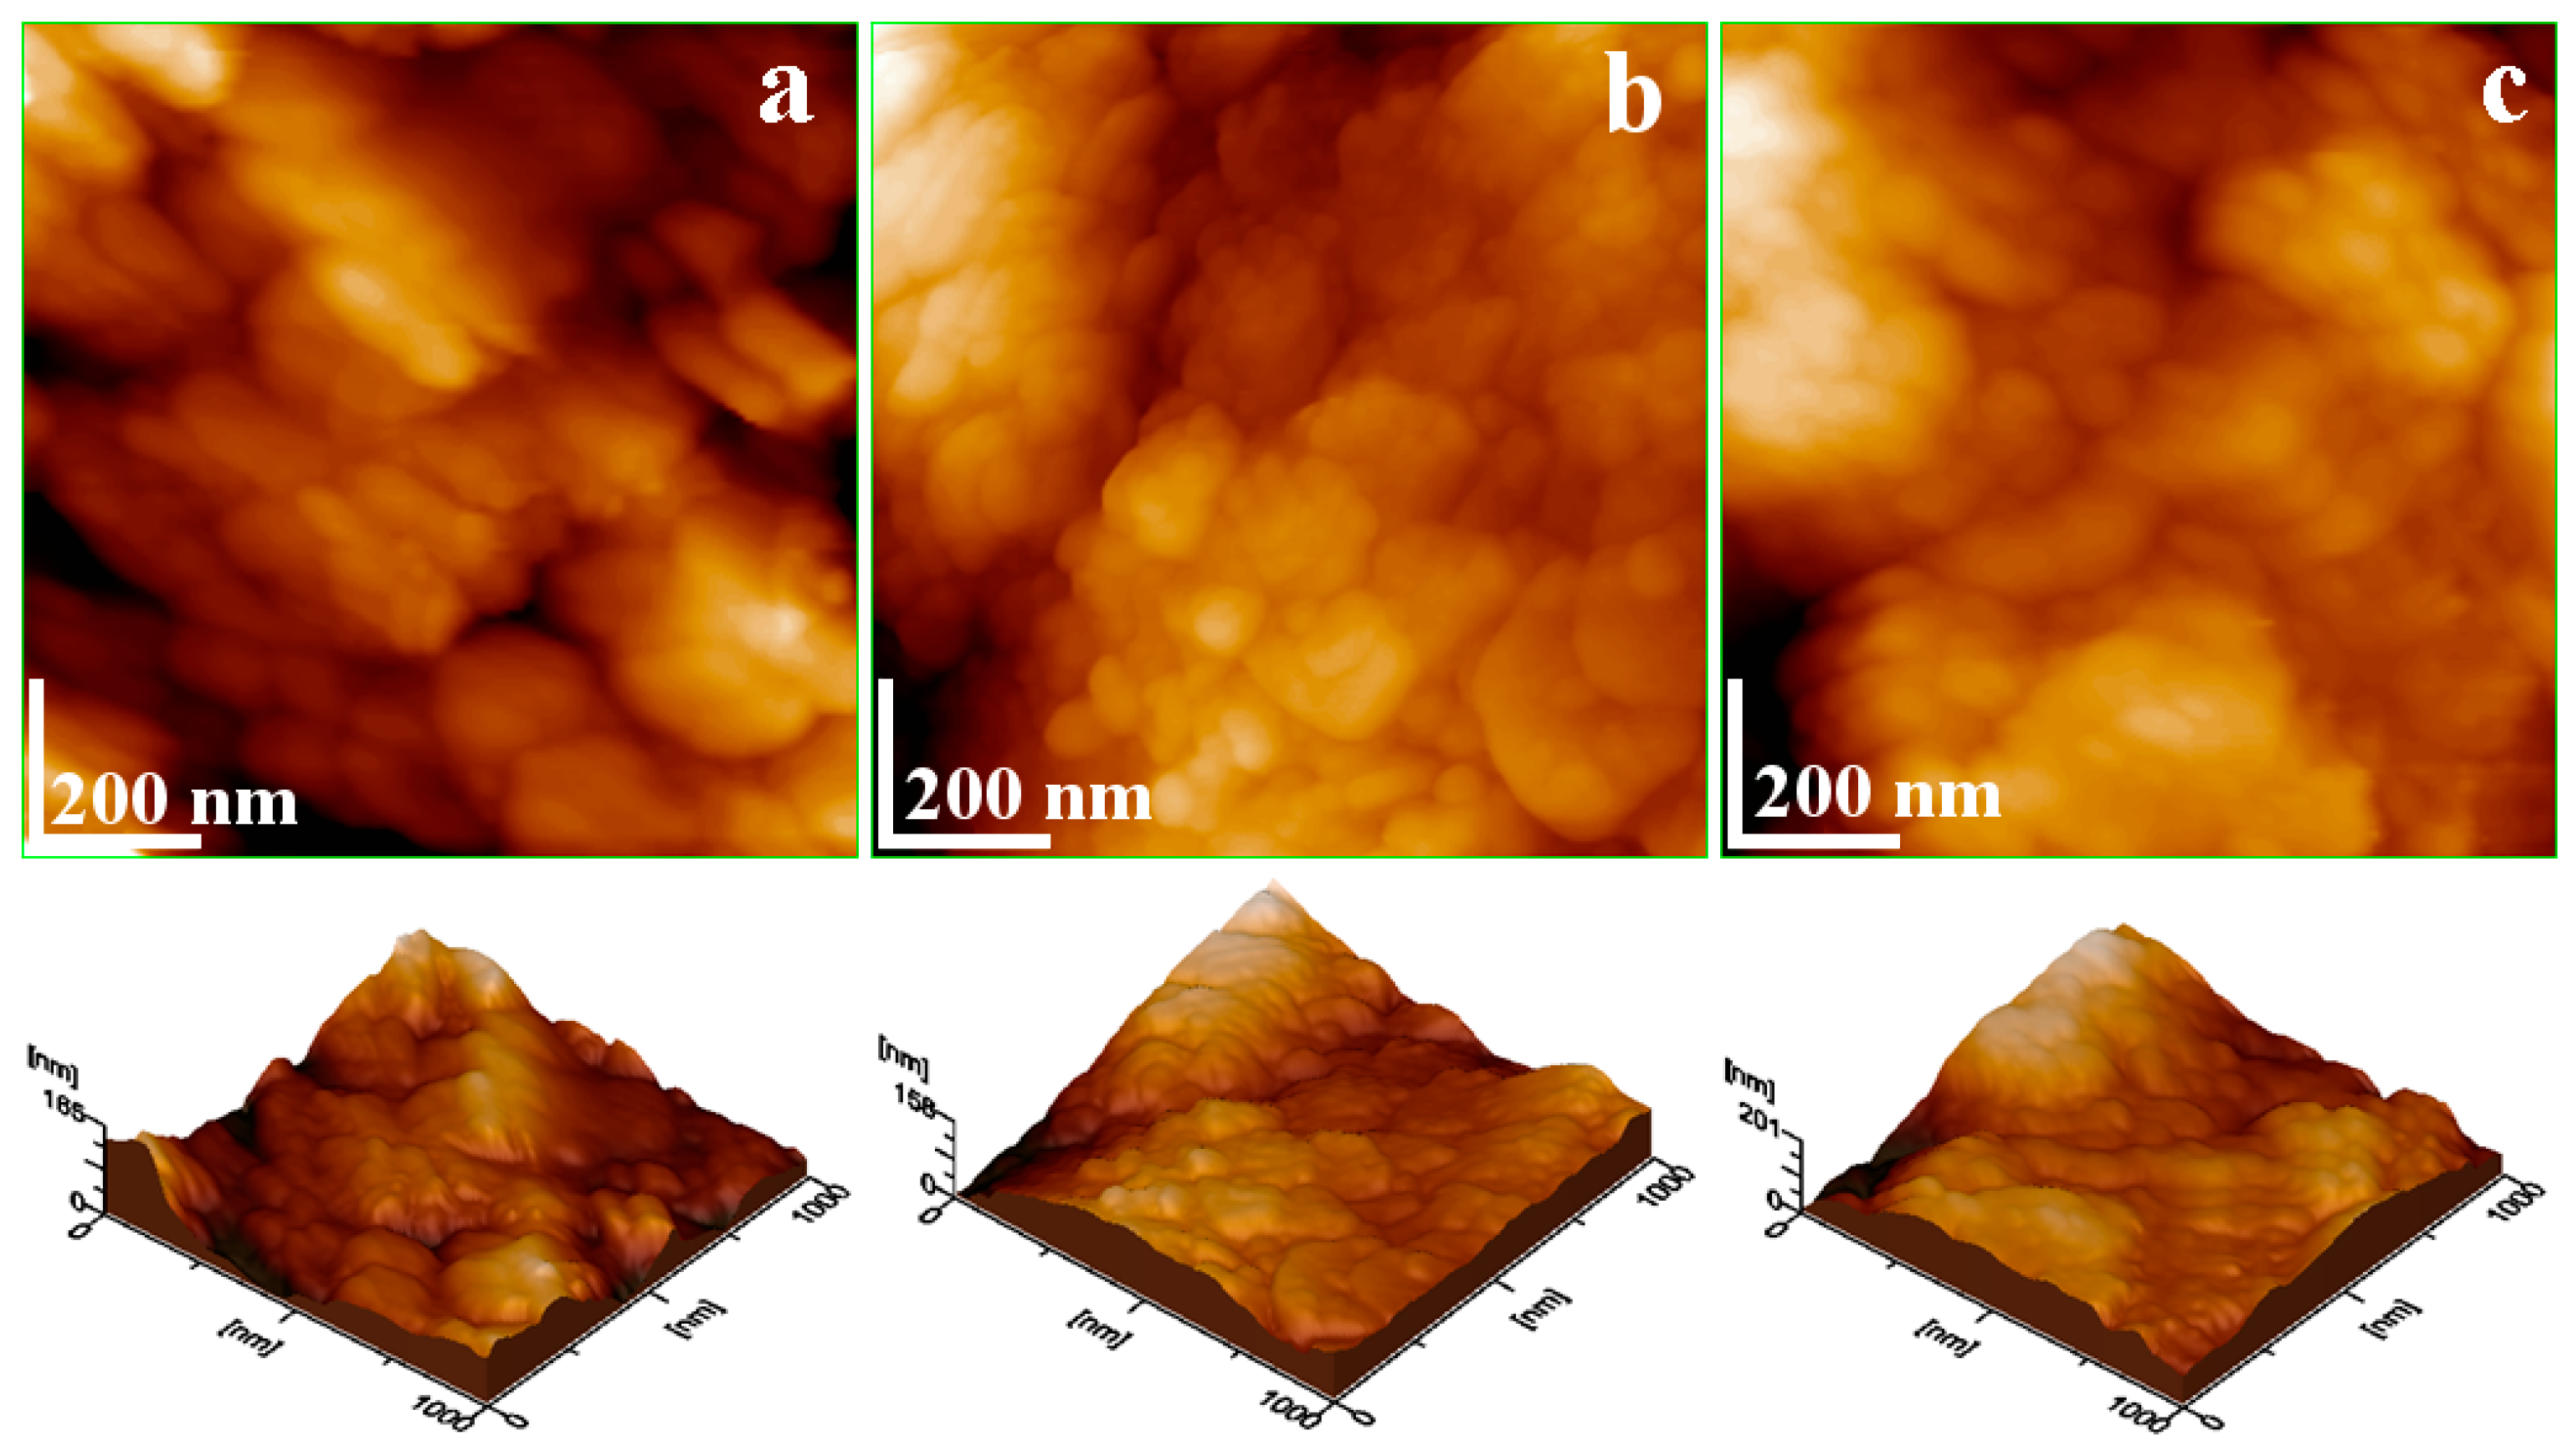
X-ray diffraction results reveal that lepidolite and kaolinite have pronounced nanocrystalline states after separation, which deals with the finest fractions observed by SEM imagining. The samples’ ultrastructure is susceptible to containing nanoparticles. Therefore, the glass slides of the samples used for MOM microscopy were scanned with atomic force microscopy, Figure 9.
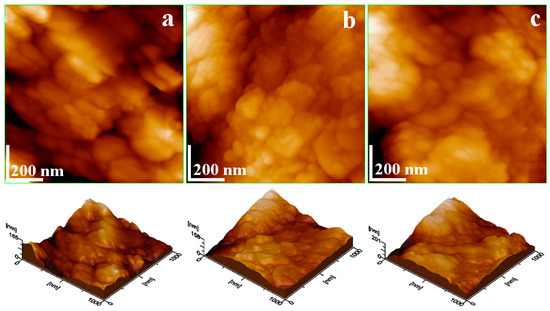
Figure 9.
AFM topographical images of the soil samples after washing separation: (a) Sample A, (b) Sample B, and (c) Sample C. The three-dimensional profile is presented below each topographic image.
Denser regions containing the finest fractions were selected for analysis, while quartz particles were avoided to prevent damage to the cantilever tip. The sandy aspect of Sample A after separation influences the ultrastructure and its subsequent topography, Figure 9a. Two submicron quartz particles are observed, one situated on the left upper corner of the image and the second situated in the lower right corner, which are partly covered with small clay nanoparticles. Slightly elongated lamellar–tabular nanoparticles approximately 60 nm in size were observed intermixed with smaller particles measuring around 45 nm. The correlation with XRD observation indicates that bigger nanoparticles belong to lepidolite and the smaller ones are kaolinite, Table 6.

Table 6.
Nanoparticle size observed by AFM.
After separation, Sample B exhibits a uniform topography characterized by lepidolite nanoparticles of about 60 nm, forming a dense layer that interlocks with finer kaolinite nanoparticles of about 40 nm. The lack of submicron quartz particles indicates the advanced refinement of Sample B through the washing separation dealing with the observed clayey texture.
Sample C, after separation, has a relatively complex ultrastructure affected by the kaolinite nanoparticles of about 40 nm. These have a high coalescence tendency—forming submicron clusters of about 600 nm in diameter formed around some rounded cores of about 200 nm. SEM-EDX analysis indicates that these cores correspond to the goethite (e.g., the finest orange-brown spots observed in the elemental maps). The incorporation of iron hydroxide into the kaolinite nanostructure makes it difficult to remove through simple washing.
4. Discussion
The continuous increase in lithium demand required by the battery industry brings to light minerals like lepidolite. It belongs to the mica family, which includes muscovite, illite, and biotite. They are formed by the geological degradation of volcanic rocks. In general, the presence of these clay minerals in certain soil regions indicates an underlying volcanic origin. The Apuseni Mountains are part of the Western Carpathians in Romania, which were formed by the folding of Earth’s crust plates and not volcanic activity [48]. However, the local soil is clearly influenced by volcanic emissions from the Ciomadul Mare Volcano, located in the Eastern Carpathians of Romania, which is known for widespread volcanic deposits throughout the Transylvanian Basin. For instance, volcanic tuff deposits generated by its eruption are locally known as Dej tuff formations. They are found near Cluj–Napoca in the proximity of the Apuseni Mountains, as well as in Racos (Brasov County, Romania). This volcanic deposit contains many clay minerals such as kaolinite, muscovite, chlorite, and zeolites like clinoptilolite [49,50]. Other studies on forest soils from the Apuseni Mountains reveal the presence of kaolinite and muscovite clays alongside quartz particles [45,46].
The presence of dark red, clay-textured soil interlayered with other clay deposits in the Apuseni Mountains forest, along with significant lithium levels detected in rivers originating from this region, raises the question of whether lepidolite might be present despite Romania not being known for such ore deposits. Usually, red soils are known for their iron oxide content [51,52], but the collected samples have a dark red color resembling perfectly manganese lepidolite and do not correspond to the iron red soils. Figure 1 shows that the upper dark red layer (Sample A) has a sandy texture, followed by a thicker dark red clayey layer (Sample B), with deeper layers composed primarily of yellow clays. We collected yellow clay from the most representative layer in Figure 1 as (Sample C), without suspicions of lepidolite content. Thus, these samples were subjected to a complex microstructural investigation to determine if they contain lepidolite and at what distribution.
In Sample A, XRD analysis combined with mineralogical optical microscopy (MOM) detected 24 wt.% lepidolite, along with coarse fractions of quartz and kaolinite, and 11 wt.% iron hydroxide present as crystallized goethite. The lepidolite amount increases in Sample B at 35 wt.% with less quartz and fine kaolinite particles in addition to a low amount of goethite. Sample C has no lepidolite, but it is dominated by a large amount of kaolinite mixed with 13 wt.% goethite, explaining the yellow color of the layer. Elemental analysis identifies manganese content as a distinctive marker confirming the presence of lepidolite, which aligns well with [47]. SEM morphological observations sustain the MOM observations that both lepidolite and kaolinite have very fine fractions with sizes < 10 μm.
Clay particles are less dense than quartz [53], and the observed quartz particles are coarser than the finest clay particles. This satisfies the fundamental criteria for primary washing separation, where clay particles are mobilized into the aqueous dispersion, while the coarser quartz and goethite fractions settle at the bottom of the container under the influence of gravity. The notably elevated goethite content in Samples A and C results in an acidic pH during dispersion at 50 °C, which slightly increases at 23 °C but remains within the acidic range. The strong pH dependence on the goethite amount is caused by its fine distribution within kaolinite particles, a fact observed by SEM microscopy, especially in Sample C. Sample B has an alkaline pH during the separation process, keeping about the same value at 50 and 23 °C proving a good stability induced by the higher clay amount and less goethite. The separation process proves to be quite effective for Samples B and C, yielding extraction rates of 20.69 wt.% and 18.60 wt.%, respectively, whereas Sample A shows a significantly lower rate of only 5.77 wt.%. This proves that clayey soils have a better separation yield than sandy soils. Unfortunately, Sample C did not contain lepidolite; however, the lepidolite amount increased to 29 wt.% in Sample A and to 57 wt.% in Sample B. Since kaolinite particles are almost the same size as lepidolite and are similar in nature, they are difficult to separate by simple washing. This highlights the significance of the lepidolite-to-kaolinite ratio, which is 0.76 in Sample A and increases to 3.16 in Sample B. In consequence, Sample B has better characteristics for potential further industrial processing. However, Xiao and collaborators reported the successful use of lithium clay slag, including fine kaolinite fractions as pozzolanic matter, to replace part of cement amount in concrete without affecting its mechanical properties [54]. It would be a good approach for further investigations regarding the sandy lepidolite in Sample A.
Atomic force microscopy agrees with the XRD observations that clay fractions have a large number of nanoparticles of about 60 nm for lepidolite and 40 nm for kaolinite. This makes the soil texture very fine and soft and also ensures washing efficiency. The similar sizes of the nanoparticles make it nearly impossible to achieve effective separation between lepidolite and kaolinite. This would require advanced flotation processes, implying collector and frother agents [9,10]. This fact reduces the applicability of Sample A but keeps promising aspects for Sample B. Advanced flotation methods can separate lepidolite particles from the trace minerals if their amount is similar to the one observed in Sample B [55]. Iron oxide removal might be critical for the further utilization of the floated lepidolite in the lithium extraction processes [56,57]; therefore, the lower goethite observed in the separated Sample B is a good point achieved by the present research.
The complex microstructural investigation clearly shows that Sample B might have industrial interest in further processing for lithium extraction, but this depends on the available quantities. As shown in Figure 1, Layer B is relatively thin compared to the underlying yellow ground and does not alone justify the initiation of industrial operations. However, it holds promise for further exploration to locate thicker lepidolite-rich layers similar to that observed in Sample B.
On the other hand, the soil samples investigated have very interesting colors that might be useful in the pottery industry for colored ceramics or natural glazes. Their thermal behavior and consolidation potential should be investigated in further research, particularly for soils such as Samples A and C.
The present research has several limitations partly caused by the sample collection. Samples were taken from the observation site without additional prospection in the area that should be further organized according to the current findings. The finest particle recovery rate strongly depends on the sedimentation process, which can be improved by a proper adjustment of the temperature and sedimentation time. The other limitations depend on the methods used, which were unable to directly measure the lithium and rubidium content within the identified lepidolite. Further research in this direction should include a detailed chemical analysis of the samples to establish the exact available quantity of lithium and rubidium.
The subsidiary scope of the present research is evidencing the environmental implication of this soil’s erosion. The complex microstructural investigation places quartz particles predominantly in the PM 10 category, while lepidolite and kaolinite belong to the PM 2.5 category. The ultra-structural components within lepidolite and kaolinite belong to the more dangerous category of PM1. The relative humidity within the observed soil layers helps retain the finest fractions physically bound to the coarser particles, thereby preserving the stability of the microstructure. However, in the case of prolonged drought, the microstructure becomes excessively dry, which makes the fine particles sensitive to wind erosion [39,58]. The eroded particles are carried by the wind to the road and deposited on cars’ surface, which become spreading vectors bringing these finest particles into the lived areas where they are subjected to the atmospheric re-suspension process [59,60].
PM 10 (such as identified quartz particles) has limited capacity to penetrate the respiratory system, as they are typically trapped in the nasal mucosa. In contrast, ultra-fine fractions of lepidolite and kaolinite (e.g., PM2.5 and PM1) can easily reach the lungs and accumulate beneath the pulmonary alveoli [61]. Once accumulated in the lungs, the lamellar–tabular aspect of lepidolite and kaolinite particles acts as micro knives in the lung tissue, making microscopic lesions that allow penetration of the related pollutant into the blood system. This leads to acute irritation of the respiratory system, which further degenerates into asthma [62], silicosis [63], and lung cancer [64,65]. In consequence, the soil layers investigated can be hazardous if erosion occurs. The upper vegetation layer on the top of the soil section ensures the necessary humidity to prevent excessive drying and soil erosion. Therefore, any intervention involving the exploitation of Sample B should be carried out with caution to prevent erosion of the surrounding soil layers.
5. Conclusions
The obtained results clearly show that the dark red color of the forest soil samples investigated is given by the presence of the manganese lepidolite. It is present in the finest fractions containing large quantities of nanoparticles about 60 nm and microparticles up to 10 μm. Sample A contains 24 wt.% lepidolite in addition to coarse fractions of quartz, kaolinite (including nanoparticles of about 40 nm), and goethite, while Sample B contains an increased amount of lepidolite around 35 wt.% in addition to moderate contents of quartz, kaolinite, and goethite.
The washing separation process increases the lepidolite content in both Sample A and B, but the best results are obtained by Sample B, achieving the finest fraction extraction of 20.69% at a lepidolite content of 57% and a lepidolite/kaolinite ratio of 3.16. In consequence, Sample B can be suitable for further processing for lithium extraction. The yellow ground (Sample C) lacks lepidolite and is primarily composed of fine kaolinite particles combined with a significant amount of goethite.
The recovery rate of the finest particles is highly dependent on the sedimentation process, which can be enhanced through optimal adjustment of temperature and duration—factors that warrant further investigation in future research. Simple washing cannot separate lepidolite from kaolinite fine fractions because of the lack of a specific collector or a frother agent specifically for flotation.
Samples A and C have poor recovery of lepidolite fine fractions and, subsequently, reduced interest for further processing in extractive metallurgy but can be used for the development of ceramic glazes because of their specific colors.
Clay particles have significant fractions able to generate PM1 and PM 2.5, while quartz can generate PM 10 emissions if the soil layer becomes excessively dry and subjected to wind erosion. The suspension of these particles in the atmosphere allows them to adhere to vehicles passing through the area, which then act as vectors, spreading the particles into more densely populated regions. Once dispersed in these areas, the particles can contribute to respiratory issues such as allergies, asthma, silicosis, and even cancer. As such, effective mitigation measures are essential.
Author Contributions
Conceptualization, S.E.A. and I.P.; methodology, S.E.A. and I.P.; software, G.B.; validation, S.E.A. and I.P.; formal analysis, I.P.; investigation, S.E.A., L.B.T., G.B. and I.P.; resources, S.E.A.; data curation, I.P.; writing—original draft preparation, S.E.A. and I.P.; writing—review and editing, I.P.; visualization, L.B.T. and I.P.; supervision, S.E.A. and I.P.; project administration, S.E.A. and I.P. All authors have read and agreed to the published version of the manuscript.
Funding
This research received no external funding.
Institutional Review Board Statement
Not applicable.
Informed Consent Statement
Not applicable.
Data Availability Statement
The original contributions presented in the study are included in the article.
Acknowledgments
The authors gratefully acknowledge the XRD diffractometer maintenance, which was supported by the Ministry of Research, Innovation, and Digitization through Program 1-Development of the National Research and Development System, Subprogram 1.2-Institutional Performance-Funding Projects for Excellence in RDI, Contract No. 37PFE/30.12.2021.
Conflicts of Interest
The authors declare no conflicts of interest.
Abbreviations
The following abbreviations are used in this manuscript:
| AFM | Atomic Force Microscopy |
| EDS | Energy Dispersive Spectroscopy |
| MOM | Mineralogical Optical Microscopy |
| SEM | Scanning Electron Microscopy |
| XRD | X-ray Diffraction |
References
- Haldar, S.K. Introduction to Mineralogy and Petrology. In Minerals and Rocks, 2nd ed.; Haldar, S.K., Ed.; Elsevier: Amsterdam, The Netherlands, 2020; pp. 1–51. [Google Scholar] [CrossRef]
- Wise, M.A. Trace element chemistry of lithium-rich micas from rare-element granitic pegmatites. Mineral. Petrol. 1995, 55, 203–215. [Google Scholar] [CrossRef]
- Alexandre, P.; Salvi, S. Mineral Chemistry of Li-Bearing Minerals at the Giant Tanco Pegmatite. Canada. Minerals 2025, 15, 221. [Google Scholar] [CrossRef]
- David, L. Reading Pegmatites: Part 3—What Lithium Minerals Say. Rocks Miner. 2017, 92, 144–157. [Google Scholar] [CrossRef]
- Dyachkov, B.A.; Bissatova, A.Y.; Mizernaya, M.A.; Khromykh, S.V.; Oitseva, T.A.; Kuzmina, O.N.; Zimanovskaya, N.A.; Aitbayeva, S.S. Mineralogical Tracers of Gold and Rare-Metal Mineralization in Eastern Kazakhstan. Minerals 2021, 11, 253. [Google Scholar] [CrossRef]
- Rodríguez-Lazcano, Y.; Correcher, V.; Garcia-Guinea, J. Thermo- and cathodoluminescence properties of lepidolite. Spectrochim. Acta Part A Mol. Biomol. Spectrosc. 2013, 113, 281–285. [Google Scholar] [CrossRef]
- Zhao, H.; Wang, Y.; Cheng, H. Recent advances in lithium extraction from lithium-bearing clay minerals. Hydrometallurgy 2023, 217, 106025. [Google Scholar] [CrossRef]
- Zhang, X.; Zheng, Y.; Li, J.; Zhu, G.; Li, G.; Cao, Y. Effects of grinding media on the surface roughness and flotation kinetics of lepidolite. Results Surf. Interfaces 2025, 18, 100375. [Google Scholar] [CrossRef]
- Korbel, C.; Demeusy, B.; Kahou, Z.S.; Filippova, I.V.; Dehaine, Q.; Filippov, L.O. Flowsheet development for the selective flotation of lepidolite from the Beauvoir granite from mineralogical insights. Miner. Eng. 2025, 225, 109207. [Google Scholar] [CrossRef]
- Xu, R.; Liu, Y.; Sun, N.; Kang, J.; Sun, W.; Tang, H.; Wang, L. The activation role of Mg2 + in the lepidolite flotation using NaOL. Sep. Purif. Technol. 2024, 351, 128035. [Google Scholar] [CrossRef]
- Zhang, X.; He, G.; Du, C. DFT Study on the Interaction Between Flotation Agents and Lepidolite-1M Surfaces. Minerals 2024, 14, 1168. [Google Scholar] [CrossRef]
- Wang, F.; Liu, L.; Zhang, J.; Cao, Y.; He, J.; Li, G. Selective Inhibition Mechanisms of Fe(III) in the Flotation of Lepidolite. Minerals 2024, 14, 851. [Google Scholar] [CrossRef]
- Babu, S.S.; Purnachandra Rao, V.; Mohan, M.R. Clay Mineralogy and Major and Trace Element Geochemistry of Recent Sediments in Rivers Along the West Coast of India: Implications for Provenance and Chemical Weathering. Minerals 2025, 15, 43. [Google Scholar] [CrossRef]
- Horabik, J.; Jozefaciuk, G. Structure and strength of kaolinite–soil silt aggregates: Measurements and modeling. Geoderma 2021, 382, 114687. [Google Scholar] [CrossRef]
- Gu, H.; Guo, T.; Wen, H.; Luo, C.; Cui, Y.; Du, S.; Wang, N. Leaching efficiency of sulfuric acid on selective lithium leachability from bauxitic claystone. Miner. Eng. 2020, 145, 106076. [Google Scholar] [CrossRef]
- Han, D.; Peng, Z.; Song, E.; Shen, L. Leaching Behavior of Lithium-Bearing Bauxite with High-Temperature Bayer Digestion Process in K2O-Al2O3-H2O System. Metals 2021, 11, 1148. [Google Scholar] [CrossRef]
- Sun, Z.; Tao, Z.; Li, H.; Pittman, A.S.; Zhou, F.; Zhang, G.; Wu, J.; Cheng, H.; Feng, E.; Chen, Z.; et al. Recovery of rare earth elements, gallium and germanium from fly ash and red mud via ultra-fast flash Joule heating. Chem. Eng. Sci. 2025, 315, 121879. [Google Scholar] [CrossRef]
- Gamage, S.J.K.; Rupasinghe, M.S.; Dissanayake, C.B. Application of Rb-Sr ratios to gem exploration in the granulite belt of Sri Lanka. J. Geochem. Explor. 1992, 43, 281–292. [Google Scholar] [CrossRef]
- Török, A.I.; Moldovan, A.; Levei, E.A.; Cadar, O.; Tănăselia, C.; Moldovan, O.T. Assessment of Lithium, Macro- and Microelements in Water, Soil and Plant Samples from Karst Areas in Romania. Materials 2021, 14, 4002. [Google Scholar] [CrossRef]
- Liu, D.; Liu, C.; Wang, C.; Yu, X. Distribution, characteristics, metallogenic processes and prospecting potential of terrestrial brine-type lithium deposits in the world and lithium demand situation. China Geol. 2025, 8, 1–25. [Google Scholar] [CrossRef]
- Deng, Y.; Sun, Y.; Wang, B.; Lin, Y.; Chai, G.; Zhang, Y. A crown-like ether for lithium extraction from brine. Sep. Purif. Technol. 2025, 364, 132591. [Google Scholar] [CrossRef]
- Balassa, C.; Bordeianu, M.; Csicsak, P.; Toth, M.; Nemeth, N. An unusual case of low concentration mineral brines in the geothermal waters from Beius Basin. Multidiszcip. Tudományok 2023, 13, 54–70. [Google Scholar] [CrossRef]
- Dippong, T.; Török, I.; Tănăselia, C.; Resz, M.-A. Impact of water and sediment pollution in Valea Viseu river, Romania. Process Saf. Environ. Prot. 2025, 195, 106796. [Google Scholar] [CrossRef]
- Dippong, T.; Hoaghia, M.-A.; Senila, M. Appraisal of heavy metal pollution in alluvial aquifers. Study case on the protected area of Ronișoara Forest, Romania. Ecol. Indic. 2022, 143, 109347. [Google Scholar] [CrossRef]
- Gonçalves, J.; da Silva, G.; Lima, L.; Morgado, D.; Nalin, M.; Armas, L.E.G.; Valsecchi, C.; Menezes, J.W. Production of Transparent Soda-Lime Glass from Rice Husk Containing Iron and Manganese Impurities. Ceramics 2020, 3, 494–506. [Google Scholar] [CrossRef]
- Hashim, S.P.H.S.; Sidek, H.A.A.; Halimah, M.K.; Matori, K.A.; Yusof, W.M.D.W.; Zaid, M.H.M. The Effect of Remelting on the Physical Properties of Borotellurite Glass Doped with Manganese. Int. J. Mol. Sci. 2013, 14, 1022–1030. [Google Scholar] [CrossRef]
- Colomban, P.; Kırmızı, B.; Zhao, B.; Clais, J.-B.; Yang, Y.; Droguet, V. Non-Invasive On-Site Raman Study of Pigments and Glassy Matrix of 17th–18th Century Painted Enamelled Chinese Metal Wares: Comparison with French Enamelling Technology. Coatings 2020, 10, 471. [Google Scholar] [CrossRef]
- Singh, V.; Agrawal, H.M. Qualitative soil mineral analysis by EDXRF, XRD and AAS probes. Radiat. Phys. Chem. 2012, 81, 1796–1803. [Google Scholar] [CrossRef]
- Bouabid, R.; Nater, E.A.; Bloom, P.R. Characterization of the weathering status of feldspar minerals in sandy soils of Minnesota using SEM and EDX. Geoderma 1995, 66, 137–149. [Google Scholar] [CrossRef]
- Zhang, B.; Lu, Y.; Wang, X.; Zhou, J.; Li, H. Metal nanoparticles in soil: Indicators of concealed mineral deposits. J. Geochem. Explor. 2025, 269, 107633. [Google Scholar] [CrossRef]
- Pszonka, J.; Sala, D. Application of the mineral liberation analysis (MLA) for extraction of grain size and shape measurements in siliciclastic sedimentary rocks. E3S Web Conf. 2018, 66, 02002. [Google Scholar] [CrossRef]
- Pszonka, J.; Godlewski, P.; Fheed, A.; Dwornik, M.; Schulz, B.; Wendorff, M. Identification and quantification of intergranular volume using SEM automated mineralogy. Mar. Pet. Geol. 2024, 162, 106708. [Google Scholar] [CrossRef]
- Yang, J.; Ju, Q.; Chen, S.; Xu, C.; Cao, Y. Spatiotemporal Evolution of Regional Air Pollution Exposure and Health Effects Assessment in Jiangsu Province, China. Atmosphere 2025, 16, 446. [Google Scholar] [CrossRef]
- Ma, Q.; Zou, S.; Hou, D.; An, Q.; Wang, P.; Wu, Y.; Zhang, R.; Huang, J.; Xue, J.; Gu, L. Characteristics and Health Risks of Trace Metals in PM2.5 Before and During the Heating Period over Three Years in Shijiazhuang, China. Toxics 2025, 13, 291. [Google Scholar] [CrossRef]
- Bertuccio, F.R.; Montini, S.; Fusco, M.A.; Di Gennaro, A.; Sciandrone, G.; Agustoni, F.; Galli, G.; Bortolotto, C.; Saddi, J.; Baietto, G.; et al. Malignant Pleural Mesothelioma: From Pathophysiology to Innovative Actionable Targets. Cancers 2025, 17, 1160. [Google Scholar] [CrossRef]
- Adly, H.M.; Saleh, S.A.K. Long-Term Trends in PM10, PM2.5, and Trace Elements in Ambient Air: Environmental and Health Risks from 2020 to 2024. Atmosphere 2025, 16, 415. [Google Scholar] [CrossRef]
- Tang, Q.; Zhang, M.; Yu, L.; Deng, K.; Mao, H.; Hu, J.; Wang, C. Seasonal Dynamics of Microbial Communities in PM2.5 and PM10 from a Pig Barn. Animals 2025, 15, 1116. [Google Scholar] [CrossRef] [PubMed]
- Avram, S.E.; Birle, B.V.; Tudoran, L.B.; Borodi, G.; Petean, I. Investigation of Used Water Sediments from Ceramic Tile Fabrication. Water 2024, 16, 1027. [Google Scholar] [CrossRef]
- Avram, S.E.; Tudoran, L.B.; Borodi, G.; Filip, M.R.; Ciotlaus, I.; Petean, I. Physicochemical Aspects Regarding the Sustainable Conversion of Carwash Slurry as Coverage Admixture for Landfills. Sustainability 2025, 17, 2906. [Google Scholar] [CrossRef]
- Rusca, M.; Rusu, T.; Avram, S.E.; Prodan, D.; Paltinean, G.A.; Filip, M.R.; Ciotlaus, I.; Pascuta, P.; Rusu, T.A.; Petean, I. Physicochemical Assessment of the Road Vehicle Traffic Pollution Impact on the Urban Environment. Atmosphere 2023, 14, 862. [Google Scholar] [CrossRef]
- Deveaud, S.; Millot, R.; Villaros, A. The genesis of LCT-type granitic pegmatites, as illustrated by lithium isotopes in micas. Chem. Geol. 2015, 411, 97–111. [Google Scholar] [CrossRef]
- Filippov, L.O.; Filippova, I.V.; Crumiere, G.; Sousa, R.; Leite, M.M.; Sousa, A.B.; Korbel, C.; Tripathy, S.K. Separation of lepidolite from hard-rock pegmatite ore via dry processing and flotation. Miner. Eng. 2022, 187, 107768. [Google Scholar] [CrossRef]
- Dippong, T.; Deac, I.G.; Petean, I.; Levei, E.A.; Cadar, O. Evolution of morphology, structure and magnetic behavior of CdxZn1−xFe2O4@SiO2 nanocomposites with Cd2+ content and heat treatment. Opt. Mater. 2025, 162, 116936. [Google Scholar] [CrossRef]
- Avram, S.E.; Barbu Tudoran, L.; Cuc, S.; Borodi, G.; Birle, B.V.; Petean, I. Microstructural Investigations Regarding Sustainable Recycling of Ceramic Slurry Collected from Industrial Waste Waters. Sustainability 2024, 16, 1123. [Google Scholar] [CrossRef]
- Harris, C.R.; Pettke, T.; Heinrich, C.A.; Rosu, E.; Woodland, S.; Fry, B. Tethyan mantle metasomatism creates subduction geochemical signatures in non-arc Cu–Au–Te mineralizing magmas, Apuseni Mountains (Romania). Earth Planet. Sci. Lett. 2013, 366, 122–136. [Google Scholar] [CrossRef]
- Vlassa, M.; Filip, M.; Beldean-Galea, S.; Thiébaut, D.; Vial, J.; Petean, I. Investigation of Liquid Oils Obtained by Thermo-Catalytic Degradation of Plastic Wastes in Energy Recovery. Molecules 2025, 30, 1959. [Google Scholar] [CrossRef]
- Thiery, V.; Farhat, H.B. Lithium-bearing minerals under the scanning electron microscope equipped with energy dispersive spectrometry: Challenges, recent advances and prospects. Chem. Geol. 2023, 633, 121573. [Google Scholar] [CrossRef]
- Săvan, G.; Păcurar, I.; Roșca, S.; Megyesi, H.; Fodorean, I.; Bilașco, Ș.; Negrușier, C.; Bara, L.V.; Filipov, F. GIS-Based Agricultural Land Use Favorability Assessment in the Context of Climate Change: A Case Study of the Apuseni Mountains. Appl. Sci. 2024, 14, 8348. [Google Scholar] [CrossRef]
- Leeuw, A.; Filipescu, S.; Maţenco, L.; Krijgsman, W.; Kuiper, K.; Stoica, M. Paleomagnetic and chronostratigraphic constraints on the Middle to Late Miocene evolution of the Transylvanian Basin (Romania): Implications for Central Paratethys stratigraphy and emplacement of the Tisza–Dacia plate. Glob. Planet. Change 2013, 103, 82–98. [Google Scholar] [CrossRef]
- Lukács, R.; Harangi, S.; Guillong, M.; Bachmann, O.; Fodor, L.; Buret, Y.; Dunkl, I.; Sliwinski, J.; Quadt, A.; Peytcheva, I.; et al. Early to Mid-Miocene syn-extensional massive silicic volcanism in the Pannonian Basin (East-Central Europe): Eruption chronology, correlation potential and geodynamic implications. Earth-Sci. Rev. 2018, 179, 1–19. [Google Scholar] [CrossRef]
- Zhao, J.; Chen, S.; Hu, R.; Li, Y. Aggregate stability and size distribution of red soils under different land uses integrally regulated by soil organic matter, and iron and aluminum oxides. Soil Tillage Res. 2017, 167, 73–79. [Google Scholar] [CrossRef]
- Yan, H.; Cen, N.; Zheng, Q.; Lin, J.; Jiang, F.; Huang, Y.; Zhang, Y. Analysis of the Shear Strength of Iron Oxide-Kaolinite Cementing Materials in Granite Red Soil. Minerals 2025, 15, 16. [Google Scholar] [CrossRef]
- Saliba, J.; Al-Shaar, W.; Delage, M. Comparison of Field and Laboratory Tests for Soil Suitability Assessment in Raw Earth Construction. Appl. Sci. 2025, 15, 1932. [Google Scholar] [CrossRef]
- Xiao, K.; Yang, G.; Zhou, W.; Ran, Q.; Yao, X.; Xiao, R.; Zhou, S. Mechanism Study on the Influence of Clay-Type Lithium Slag on the Properties of Cement-Based Materials. Materials 2025, 18, 1788. [Google Scholar] [CrossRef]
- Phan, T.T.; Fulton, L.; Ulkem, J.; Aiken, S.; Blackwell, A.; Walsh, J.; Walker, P.; Rezanezhad, F. Lepidolite extraction solid by-product: Mitigation of thallium leaching and utilization of radiogenic strontium isotopes as a tracer. Environ. Adv. 2021, 3, 100035. [Google Scholar] [CrossRef]
- Jiao, F.; Zhang, Z.; Wei, Q.; Qin, W. Key technologies and development trends for efficient flotation recovery of lepidolite. Green Smart Min. Eng. 2024, 1, 273–288. [Google Scholar] [CrossRef]
- Meshram, P.; Pandey, B.D.; Mankhand, T.R. Extraction of lithium from primary and secondary sources by pre-treatment, leaching and separation: A comprehensive review. Hydrometallurgy 2014, 150, 192–208. [Google Scholar] [CrossRef]
- Avram, S.E.; Filip, M.R.; Barbu Tudoran, L.; Borodi, G.; Petean, I. Investigation of ferrous conglomerate particles found in carwash slurry and their environmental implications. Stud. UBB Chem 2023, 68, 57–70. [Google Scholar] [CrossRef]
- Chang, X.; Sun, L.; Yu, X.; Liu, Z.; Jia, G.; Wang, Y.; Zhu, X. Windbreak efficiency in controlling wind erosion and particulate matter concentrations from farmlands, Agriculture. Ecosyst. Environ. 2021, 308, 107269. [Google Scholar] [CrossRef]
- Ramirez Haberkon, N.B.; Aparicio, V.C.; De Gerónimo, E.; Mendez, M.J. Multiresidues of pesticides in the particulate matter (PM10) emitted by rural soils of the semiarid pampas, Argentina. A potential source of air pollution. Environ. Pollut. 2024, 360, 124617. [Google Scholar] [CrossRef]
- Mcclellan, R.O. Lung cancer in rats from prolonged exposure to high concentrations of carbonaceous particles: Implications for human risk assessment. Part. Sci. Technol. 1996, 14, 89–122. [Google Scholar] [CrossRef]
- Zhou, X.; Sampath, V.; Nadeau, K.C. Effect of air pollution on asthma. Ann. Allergy Asthma Immunol. 2024, 132, 426–432. [Google Scholar] [CrossRef] [PubMed]
- Seaton, A.; Legge, J.S.; Henderson, J.; Kerr, K.M. Accelerated silicosis in Scottish stonemasons. Lancet 1991, 337, 341–344. [Google Scholar] [CrossRef] [PubMed]
- Xu, L.; Ma, W.; Huo, X.; Luo, J.; Li, R.; Zhu, X.; Kong, X.; Zhao, K.; Jin, Y.; Zhang, M.; et al. New insights into the function and mechanisms of piRNA PMLCPIR in promoting PM2.5-induced lung cancer. J. Adv. Res. 2024; in press. [Google Scholar] [CrossRef] [PubMed]
- Xie, Z.; Chen, W.; Wang, W.; Gu, Z.; Shen, Y. Particle-scale study on extracellular penetration of nanoparticles in tumor tissues. Mater. Today Phys. 2024, 44, 101428. [Google Scholar] [CrossRef]
Disclaimer/Publisher’s Note: The statements, opinions and data contained in all publications are solely those of the individual author(s) and contributor(s) and not of MDPI and/or the editor(s). MDPI and/or the editor(s) disclaim responsibility for any injury to people or property resulting from any ideas, methods, instructions or products referred to in the content. |
© 2025 by the authors. Licensee MDPI, Basel, Switzerland. This article is an open access article distributed under the terms and conditions of the Creative Commons Attribution (CC BY) license (https://creativecommons.org/licenses/by/4.0/).

