Abstract
To address the stability control challenges of the “support-surrounding rock” system in fully mechanized top-coal caving faces within steeply dipping coal seams, this study employs an integrated approach combining theoretical analysis and numerical simulations, revealing the three-dimensional boundary morphology of the top-coal limit equilibrium zone and establishing a quantitative framework for boundary delineation. The results show that the boundary spatial morphology of the limit equilibrium zone in the fully mechanized caving stope in steeply dipping coal seams is an “asymmetric arc-shaped ribbon-like curved surface”. Along the inclined direction of the working face, the boundary distribution presents an “asymmetric circular-arc arch”, with the vault located in the middle-upper part of the working face. Along the strike direction of the working face, the distance from the boundary to the longwall face shows a gradually increasing pattern from top to bottom. Upon comparing the results from the numerical simulation, theoretical calculation, and field monitoring, a consistent overall pattern emerges. This consistency validates the rationality of the analytical representation of the boundary of the top-coal limit equilibrium zone. The research findings hold significant importance in predicting the stability of the “support-surrounding rock” system and the top-coal cavability. They can offer a scientific foundation for guiding the stability control practices of the support–surrounding rock within this type of mining stope.
1. Introduction
Most of the steeply dipping thick seams are scarce coal resources, which are mainly distributed in the northwest of China [1]. In the fully mechanized caving process of a steeply dipping coal seam (SDCS), which is affected by the coal seam dip angle effect, the mining-induced stress on the top coal along the inclined direction of the working face has significant zonal characteristics. This makes the top coal also show zonal characteristics during the progressive deterioration process, resulting in inconsistent fragmentation degrees of the top coal above the working face supports, which seriously affects the stability of the “support-surrounding rock” system [2].
Given the distinctive features of the fully mechanized caving technology, a multitude of scholars, with the objectives of optimizing top-coal cavability, enhancing the seam recovery rate and guaranteeing the safe and efficient exploitation of the working face have concentrated on two primary aspects: the top-coal fragmentation mechanism and the top-coal caving law. Subsequently, the authors of [3,4] have conducted a series of specialized research endeavors. The top-coal state evolves from a macroscopic continuous medium to a fractured medium and further to a granular medium, representing a gradual and progressive developmental process [5,6,7,8]. Wu et al. [9,10] revealed the complete process curve of top-coal movement, indicating that horizontal displacement prevails in the area ahead of the longwall face. As the top coal approaches the longwall face, vertical displacement becomes the dominant factor. Wang et al. [11] revealed the development characteristics of the top-coal fracture field. Lang et al. [12] established the progressive damage model of top coal under the evolution path of mining-induced stress in the fully mechanized caving face.
The cavability of the top coal stands as a pivotal factor that determines the success of longwall top-coal caving. Chen et al. [13,14] put forward the proposal to utilize the damage parameter as a comprehensive index of top-coal cavability. Wang et al. [15,16] systematically studied the law of top-coal caving in fully mechanized top-coal caving and established a BBR research system. Le et al. [17] analyzed the shape of the coal–rock interface and the influence of the support and moving support on it. Yang et al. [18] studied the mechanism of top-coal caving by considering the overburden pressure. The shape of the caving body, the coal–rock interface, and the top-coal recovery rate under different overburden pressure values are analyzed. Zhang et al. [19] studied the dynamic evolution of a top-coal crack under the multi-cycle action of the support. The stability of a fully mechanized top-coal caving face can be indirectly judged by the support load [20].
The research on a fully mechanized caving face in SDCS mainly focuses on special problems under specific conditions. Luo et al. [21] systematically studied the influence of top coal on the stability of support under unbalanced load and constraint conditions. Zhang et al. [22] revealed the variation in characteristics within the scope of SDCS; as the dip angle increases, the top-coal recovery rate gradually decreases. Wu et al. [23] revealed the damage deterioration mechanism and the degree of top coal under different external loads along the dip direction of the working face. Wang et al. [24] analyzed and obtained the zonal characteristics of surrounding rock deformation and failure as well as support stability in the fully mechanized caving face with variable dip angles in SDCS.
In summary, experts and scholars have conducted systematic research on the top- coal fragmentation mechanism and caving law. However, there is a scarcity of research on the three-dimensional morphology of the top-coal failure in SDCS in order to ensure the safety of the working face stope, reveal the three-dimensional boundary shape of the top-coal limit equilibrium zone (TLEZ), and further quantify the three-dimensional boundary of the inclined coal seam. Based on the above scientific issues, a systematic study has been carried out. The purpose is to provide feasible opinions for safe and efficient mining in mines.
2. Current Status of Support Instability in the Working Face of SDCS
In the course of mining within the working face of SDCS, the broken roof strata roll or slide downward along the working face gradient. This results in the formation of zones with non-uniform compaction along the dip direction within the gob. The surrounding rock movement and the front abutment pressure distribution along the inclined direction of the working face exhibit distinct asymmetric characteristics. The deformation of the roof and floor intensifies. In the event of improper control measures, large-scale instability of the working face will ensue, culminating in the sliding and toppling of the working face supports. In a fully mechanized top-coal caving face, the deformation of the roof and floor, along with the manifestation of ground pressure, becomes significantly more intense as a result of the increase in mining height. This, in turn, causes a sharp escalation in the likelihood of the working face supports sliding and toppling.
Taking the 1123 fully mechanized caving face of a mine in Gansu as the research background, the average thickness, dip angle, working face length, and advancing distance of the working face are 9.0 m, 35°, 100 m, and 540 m, respectively. The mining/caving ratio of the working face is 1:2; the daily advancing distance is 4.8 m, and the maximum dip angle of the coal seam where the shearer can work is 40 degrees. The details of the rock stratum are shown in Figure 1.
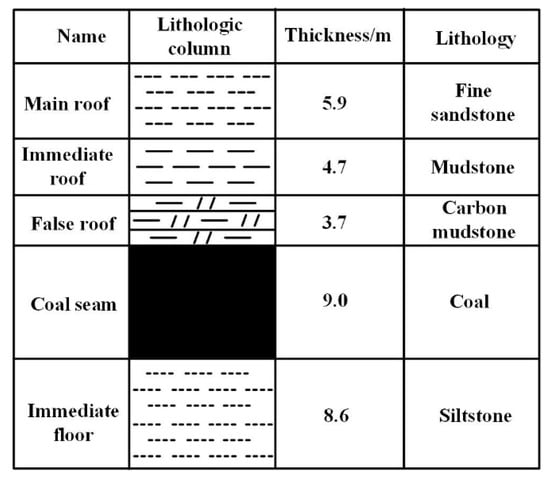
Figure 1.
Histogram of coal measure strata.
During the fully mechanized top-coal caving operation in SDCS, the top coal is under the influence of mining-induced stress. When the strength of the coal seam is low, there is a high likelihood of large-scale leakage or slippage occurring between the supports of the working face. This situation can potentially trigger safety accidents. The broken top coal between the supports leaks, resulting in the inability of the side-shield beams between the supports to make contact, as shown in Figure 2a. This phenomenon compromises the supporting effectiveness of the supports and undermines the assurance of safe production in the working face. The continuous leakage of broken top coal in front of and between the supports in the mining process results in suspension above the top beam of the support. The smooth transfer of the roof load to the support cannot be guaranteed. This gives rise to the toppling or sliding of the support, as shown in Figure 2b, ultimately culminating in the instability of the “support-surrounding rock” system.
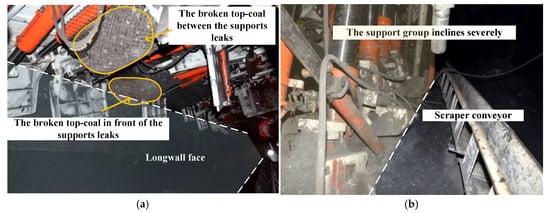
Figure 2.
The instability of the “support-surrounding rock” system. (a) The broken top-coal between the supports leaks. (b) Instability of “support-surrounding rock” system.
The times of top-coal leaks and support resistance during mining were monitored and recorded, respectively. Along the inclined working face, four sequential sections are identified vertically: the lower section, the middle-lower section, the middle-upper section, and the upper section.
Along the inclined direction of the working face, the occurrences of top-coal leakage and the values of support resistance exhibit distinct zonal characteristics. Specifically, top-coal leakage occurs most frequently in the middle-upper part of the working face, where the support resistance is the lowest, as shown in Figure 3. In the lower part, middle-lower part, middle-upper part, and upper part of the working face, the frequencies of top-coal leakage are 5 times, 12 times, 34 times, and 8 times, respectively. Meanwhile, the average working resistances of the supports in the lower part, middle-lower part, middle-upper part, and upper part of the working face are 3579 kN, 3007 kN, 2389 kN, and 2795 kN, respectively.
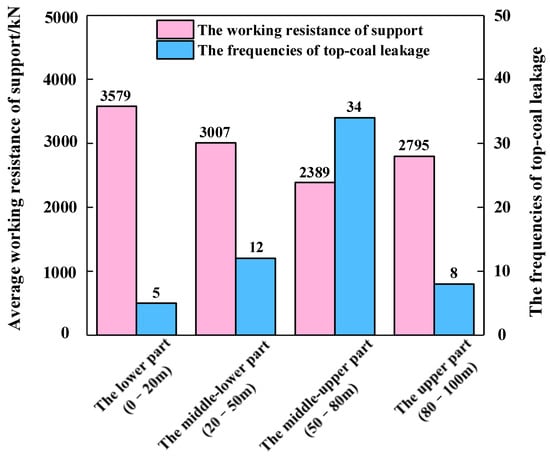
Figure 3.
Distribution of the frequencies of top-coal leakage and working resistance of the support along the inclined direction of the working face.
In the fully mechanized top-coal caving face with SDCS, the severe leakage of top coal and the non-uniform stress distribution within the support resistance present formidable challenges to the control of the “support-surrounding rock” system’s stability. This state of affairs severely impedes the safety exploitation of the working face.
3. Boundary Spatial Morphology of Top-Coal Limit Equilibrium Zone in Fully Mechanized Top-Coal Caving Stope in SDCS
3.1. TLEZ Boundary Definition
In SDCS, the primary rock stress varies at different positions along the inclined direction of the working face. During the fully mechanized top-coal caving mining process, the coal seam is influenced by mining and the uneven filling of gangue in the goaf. As a result, the stress ahead of the working face is redistributed, which forms stress concentrations in front of the working face. As shown in Figure 4, the mining-induced stress at different positions of the working face along the inclined direction exhibits zonal characteristics. This, in turn, causes the progressive deterioration process of the top coal to also display zonal characteristics. As the destruction of the rock mass progresses deeper into the surrounding rock, the stress of the rock mass gradually transitions from a unidirectional compression state back to a triaxial stress state and subsequently returns to an elastic state at a specific location. Along the strike direction of the coal seam, the state of the top coal between the unloading boundary and the elastic boundary is called the limit equilibrium state, and the distance span along the strike is called the limit equilibrium zone of top coal [25,26,27].
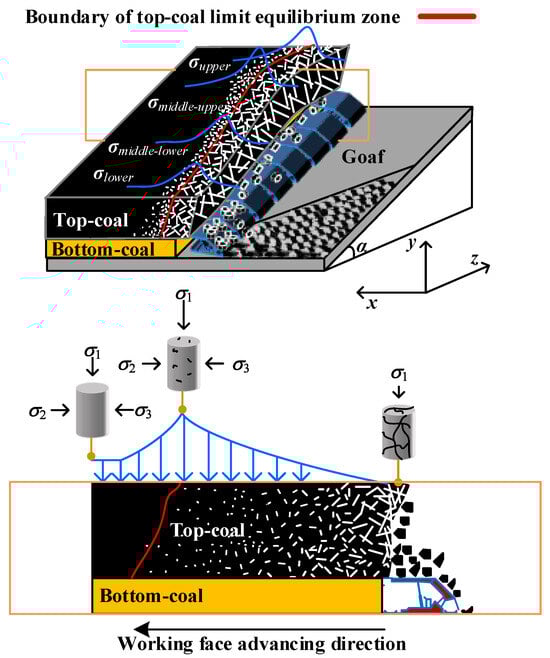
Figure 4.
Stress environment at the boundary of TLEZ in the fully mechanized top-coal caving face in SDCS.
3.2. Establishment of Numerical Model
FLAC3D is selected as the numerical simulation software for this study, as it can simulate the mechanical behavior of geological materials when they reach the strength limit or yield limit, as well as complex mining engineering problems. FLAC3D is an explicit solution based on the finite difference method. It adopts the dynamic relaxation method for time-step iteration without forming the whole stiffness matrix and is suitable for simulating nonlinear, large deformation and material failure problems.
A numerical model was developed based on the 1123 working face, with dimensions of 500 m (length) × 200 m (width) × 560 m (height), as shown in Figure 5. Mesh discretization was determined according to the physical and mechanical properties of different strata, as derived from mine geological data. To account for material heterogeneity, hard rock masses were discretized into 5 m × 5 m × 5 m elements, while the weaker coal seam was assigned a finer resolution of 1 m × 1 m × 3 m to better capture deformation and failure mechanisms. Local mesh refinement was applied to optimize computational efficiency, resulting in a total of 1,711,200 elements.
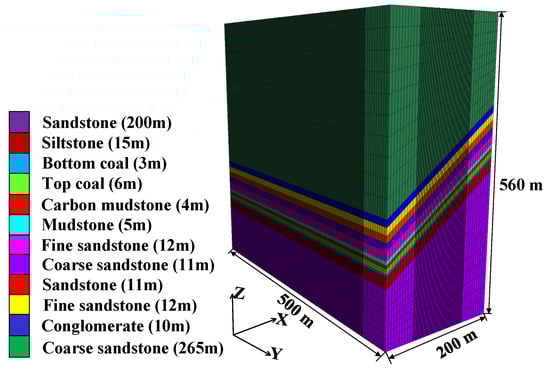
Figure 5.
Three-dimensional numerical model.
The Mohr–Coulomb constitutive model was selected to simulate the mechanical behavior of the rock mass, as it is widely adopted in geotechnical and mining engineering. This criterion effectively characterizes the shear failure of geomaterials (e.g., soil and rock), where plastic yielding occurs upon reaching a critical shear stress threshold, consistent with Coulomb’s friction law. Additionally, the model accounts for both compressive and tensile strength, making it particularly suitable for geotechnical materials, which typically exhibit significantly higher compressive strength than tensile strength.
Boundary conditions included vertical displacement constraints at the model base to restrict downward movement, along with horizontal displacement constraints on all lateral boundaries (front, back, left, and right) to simulate confinement from surrounding rock formations. The average buried depth of the coal seam is 330 m, which is consistent with the buried height of the coal seam in the numerical model, and the gravity acceleration of the model is set at 9.8 m/s2.
3.2.1. Determination of the Filling Range in the Goaf
During fully mechanized top-coal caving with SDCS, which occurs along the dip of the longwall face, the roof above the middle will fall or slip to the lower part of the working face when it collapses. Along the inclined direction, the goaf will display zonal characteristics. From bottom to top, these zones are, respectively, the filling compaction area, the complete filling area, and the partial filling area [1]. The denser the filling degree of the goaf, the stronger the supporting capacity for the overlying strata. Therefore, the range of the compaction area can be indirectly determined by the stress characteristics of the goaf floor.
The physical similarity simulation experiment employed an adjustable-angle testing rig measuring 2150 mm (length) × 200 mm (width) × 1800 mm (height). The material system comprised river sand (serving as the primary aggregate), a gypsum–lime powder composite binder, mica schist laminations (1 mm thickness), and water. During the experimental setup phase, an array of wireless stress sensors was strategically embedded within the coal seam floor stratum. This instrumentation configuration enables real-time monitoring of load distribution characteristics. The wireless stress monitoring system is shown in Figure 6. According to the research objectives, the geometric similarity ratio is set as 1:100. Based on similarity theory, the similarity parameters for density, stress, load, and time are determined to be 1.6, 160, 1.6 × 10⁶, and 10, respectively.
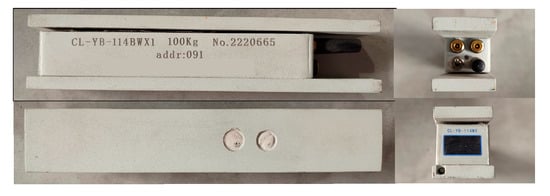
Figure 6.
Wireless stress sensor.
The distribution law of the floor load along the inclined direction of the working face exhibits a trend of decreasing first and then increasing, as shown in Figure 7. Along the dip direction of the working face, the internal stress decreases from 0.9 MPa to 0.5 MPa within the range of 0–70 m and then increases from 0.5 MPa to 0.7 MPa within the range of 70–100 m. Based on the comparison in Figure 8, because the lower part of the working face has a high filling density, the overlying strata are supported by the gangue. As the filling degree of the goaf weakens from the bottom to the top along the inclined direction of the working face, the load on the floor decreases.
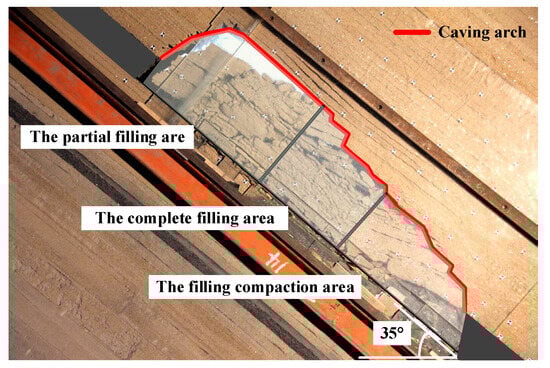
Figure 7.
Filling characteristics after overlying strata collapse.
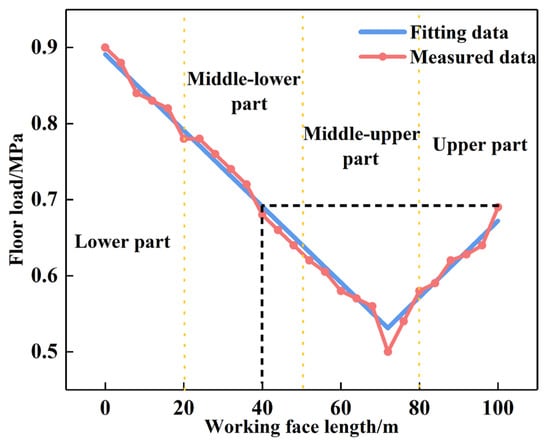
Figure 8.
Distribution law of the floor load in goaf.
The weight of caving gangue in the upper part of the working face is much greater than that in the rest of the working face. Based on the maximum load of the upper floor of the working face, the middle and lower parts of the working face with the same load on the floor are found. This position is located 40 m from the working face, and it is under the action of two kinds of forces transmitted by the deadweight of gangue and overlying strata. This situation indirectly validates the extent of the filling compaction area. It is thus determined that the filling compaction area in the numerical simulation experiment of the goaf is 40 m. Additionally, a double yield model is adopted for goaf filling, and the filling range is shown in Figure 9.
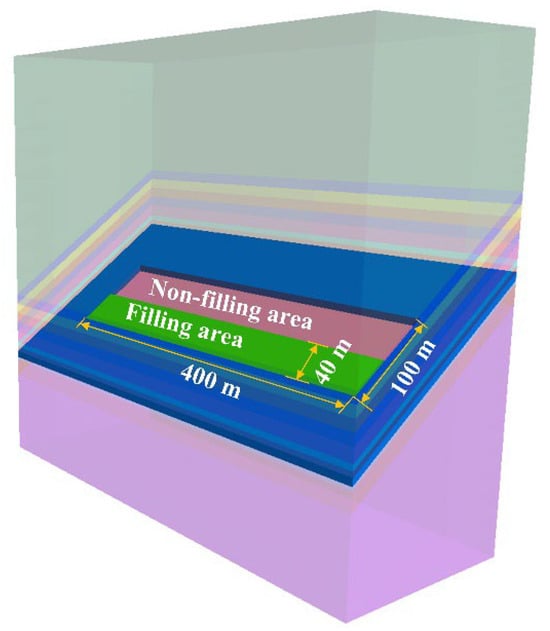
Figure 9.
Filling range of the numerical model.
3.2.2. Numerical Simulation Parameters and Experimental Process
The numerical simulation employs the Mohr–Coulomb constitutive model. For FLAC3D implementation, the failure criterion can be graphically represented in the (σ1, σ3) principal stress plane coordinate system, as shown in Figure 10. The failure envelope segment between points A and B is governed by the Mohr–Coulomb failure criterion, which is defined when fs = 0.
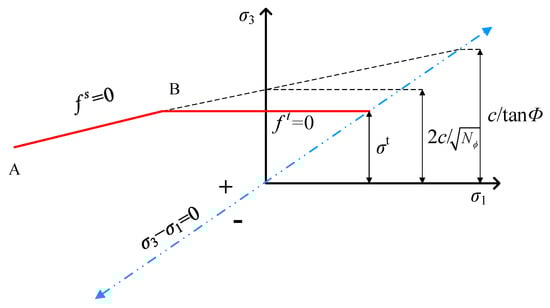
Figure 10.
FLAC3D Mohr–Coulomb failure criterion.
All critical parameters of the coal and rock strata were determined through field sampling and laboratory testing. The specific parameters are presented in Table 1. In FLAC3D numerical simulations, directly applying laboratory-measured rock mechanical parameters (e.g., strength and elastic modulus) may lead to deviations between computational results and actual engineering responses. This discrepancy arises because laboratory parameters typically represent small-scale intact rock properties, whereas FLAC3D models must account for rock mass behavior at the engineering scale. To address this, the GSI-based Hoek–Brown criterion can be employed to convert laboratory-derived intact rock parameters into equivalent rock mass parameters [28,29,30], which are then used as inputs for FLAC3D simulations. The rock mass characteristic parameters are shown in Table 2.

Table 1.
Coal and rock physical and mechanical parameters.
Table 2.
Rock mass characteristic parameters.
The numerical simulation experiment process is as follows:
- (1)
- Roadway Excavation Stage:
The return airway and haulage gateway are excavated separately, with a cross-sectional dimension of 5 m in width and 3 m in height. Each roadway extends 400 m in length, adopting a full-face single-pass excavation method to simulate the initial stress release of the surrounding rock during roadway driving.
- (2)
- Working Face Mining Process:
When the working face advances 10 m, the caving operation is initiated with the caving position dynamically trailing 5 m behind the working face. After each caving operation, the goaf is backfilled, with the filling range extending from the bottom to the top along the working face’s dip direction, covering a 40 m span. A mining cycle consists of 1 m of advancement followed by 1 m of caving. The Fish programming language is employed to dynamically adjust cycle parameters until the completion of the entire mining simulation.
3.3. Evolution Law and Distribution Characteristics of Top-Coal Stress
By arranging the monitoring plane on the upper surface of the coal seam, stresses at each monitoring point are recorded. By extracting the front abutment pressure of the working face under different propulsion distances, the maximum value of the front abutment pressure is identified. To intuitively reveal the variation law of the front abutment pressure peak with the working face advancement, a 3D point cloud diagram (as shown in Figure 11) is plotted. In the diagram, blue dots denote stress values, while red dots indicate the peak positions of the front abutment pressure.
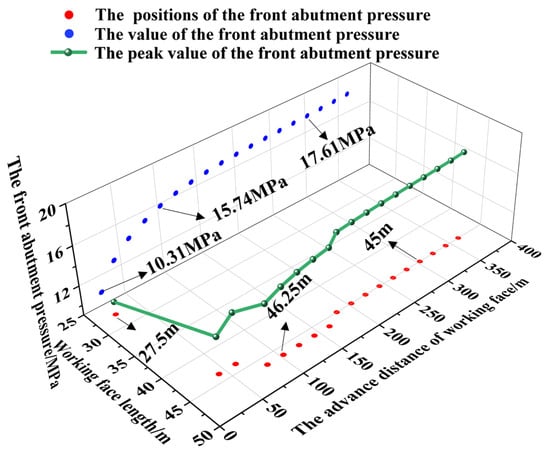
Figure 11.
Evolution process of front abutment pressure peak of top coal.
When the working face advances to 20 m, 40 m, and 180 m, respectively, the peak position of the front abutment pressure is 27 m, 43.75 m, and 45 m, respectively, along the inclined direction of the working face. With the increase in the advancing distance of the working face, the peak position of the front support pressure gradually moves from the lower part of the working face to the middle part and finally remains stable.
When the advancing distance is between 20 and 100 m, the peak value of the front abutment pressure increases at the fastest rate. The value increases from 10.31 MPa to 15.74 MPa, with an average increase of 1.36 MPa in the peak value for every 20 m of advancement. When the advancing distance is between 100 and 300 m, the growth rate slows down. The value increases from 15.74 MPa to 17.61 MPa, with an average increase of 0.19 MPa in the peak value for every 20 m of advancement. After the working face has advanced 300 m, both the peak value and the position remain stable.
When the working face advances to 300 m, the mining-induced stress ahead of the working face stabilizes. Principal stress data at the upper boundary of the top coal ahead of the working face is extracted within a range of 100 m in length and 60 m in width. The distribution law of the maximum and minimum principal stresses in the top coal at the 300 m advancement point is plotted, as illustrated in Figure 12.
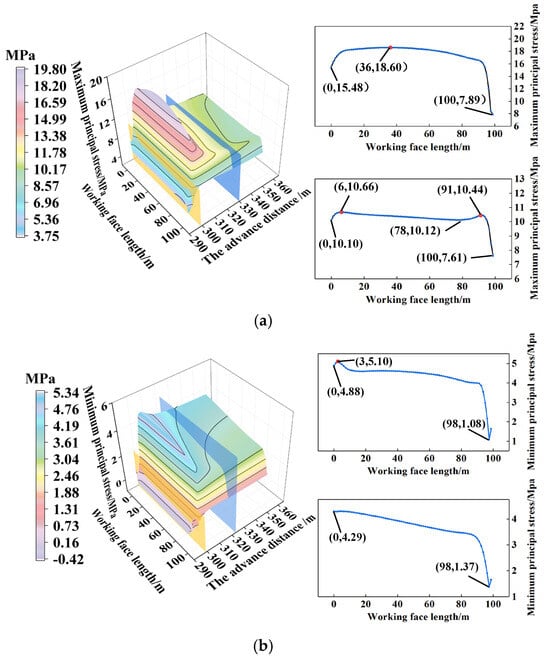
Figure 12.
Distribution law of principal stress in top coal. (a) Distribution law of maximum principal stress in top coal. (b) Distribution law of minor principal stress in top coal.
The principal stress within the top coal along the working face exhibits a distinct distribution pattern characterized by an initial increase, followed by a decrease, and ultimately stabilizing.
The maximum principal stress distribution in the top coal along the inclined direction of the working face can be categorized into two distinct zones: the mining-induced stress influence zone and the stress stabilization zone. The region preceding the blue cross-section represents the mining-induced stress influence zone, where the maximum principal stress initially rises and subsequently declines along the inclined direction. Conversely, the area following the blue cross-section constitutes the stress stabilization zone, wherein the maximum principal stress demonstrates a fluctuating pattern of increase, decrease, increase, and then decrease along the inclined direction.
The minimum principal stress distribution in the top coal along the inclined direction of the working face can be categorized into two distinct zones: the mining-induced stress influence zone and the stress stabilization zone. The region preceding the blue cross-section in the figure corresponds to the mining-induced stress influence zone, where the minimum principal stress initially increases and then decreases along the inclined direction. In contrast, the area following the blue cross-section represents the stress stabilization zone, where the minimum principal stress decreases gradually along the inclined direction.
3.4. Boundary Spatial Morphology of TLEZ
When the fully mechanized top-coal caving face in steeply dipping coal seams advances to a critical distance of 300 m, the mining-induced stresses within the top coal reach a stabilized state, marking equilibrium in the stress distribution beyond this advancement threshold. By substituting the principal stress data monitored on the upper surface of the coal seam into the Mohr–Coulomb failure criterion, the initial failure boundary of the upper surface of the top coal can be determined. As shown in Figure 13, the black contour delineates the limit equilibrium zone boundary of the top-coal upper boundary, representing the theoretical demarcation between the plastic yield and elastic deformation domains derived from analytical modeling.
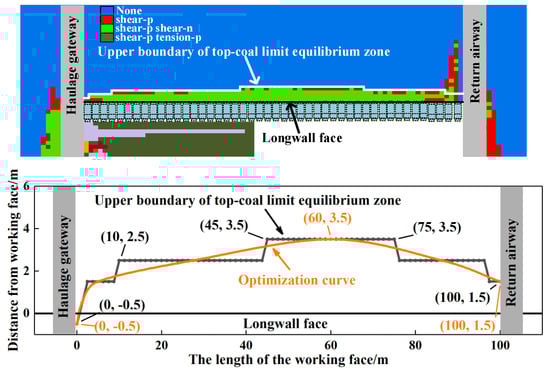
Figure 13.
Upper boundary of the TLEZ.
The limit equilibrium zone boundary presents an “asymmetric” distribution along the inclined direction of the working face, and the peak value is located in the middle-upper part of the working face. When the working face is in the range of 45–75 m, the distance between the boundary and the working face is the farthest, which is 3.5 m, and the positions of 0 m and 100 m are the closest to the working face, which are −0.5 m and 1.5 m, respectively.
As can be observed from Figure 13, the distance between the TLEZ boundary and the working face increases in integral values. This phenomenon arises because when the numerical model is established, the coal seam is divided into 1 × 1 m squares. As a result, the difference in the data positions between the front and the back is 1 m, leading to a step-like boundary along the inclined direction. However, a series of processes in the top coal, from initiation, expansion, development, and penetration to final macroscopic failure, occurs in an orderly and continuous manner. Therefore, the obtained data are optimized and fitted using a smooth curve. This approach enables a more realistic and accurate description of the actual situation. The orange line shown in Figure 13 is obtained. This line is asymmetrical and arc-shaped, retaining the asymmetric characteristics of the previous data and being closer to the actual situation. Subsequent research will conduct an analysis of the optimized data.
The lower boundary of the TLEZ presents an “asymmetric circular-arc arch” along the inclined direction of the working face, as shown in Figure 14. Within the range of 0-66.25 m along the inclined direction of the working face, the distance between the boundary and the working face increases from 1.5 m to 4.5 m. However, within the range of 66.25–100 m along the inclined direction of the working face, the distance between the boundary and the working face decreases from 4.5 m to 3.5 m. The vault is situated in the middle-upper part of the working face, and the top coal is most likely to be damaged at the 66.25 m position of the working face.
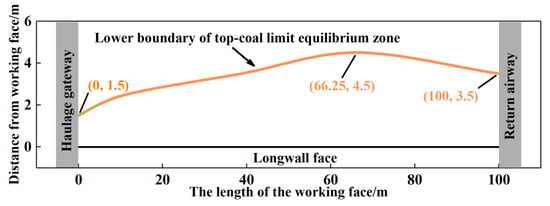
Figure 14.
Lower boundary of the TLEZ.
The maximum and minimum principal stresses in the working face’s return airway are 1.58 MPa and 7.44 MPa, respectively, while those in the haulage gateway are 4.06 MPa and 15.3 MPa, respectively. Notably, the maximum and minimum principal stresses in the haulage gateway are 258% and 206% of those in the return airway, respectively.
By means of the stress state analysis model of the TLEZ boundary and the quantitative characterization of the TLEZ boundary along the strike direction of the working face, the distance relationship between the TLEZ boundary and the trend of the working face is revealed. Along the strike direction of the working face, the distance between the TLEZ boundary and the working face exhibits a linear relationship of increasing from top to bottom [24]. By combining the upper and lower boundaries of the TLEZ with the results of the above references, the spatial morphology of the TLEZ boundary in the fully mechanized top-coal caving face with SDCS is obtained, as shown in Figure 15.
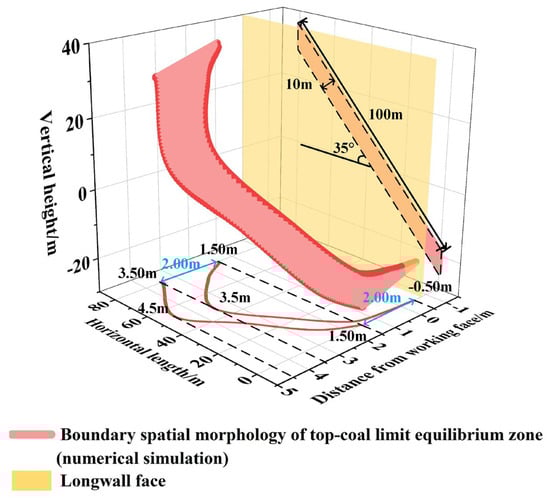
Figure 15.
Boundary spatial morphology of TLEZ.
The boundary spatial morphology of the TLEZ in the fully mechanized top-coal caving face with SDCS takes on an “asymmetric arc-shaped ribbon-like curved surface”. There is obvious asymmetry in the boundary spatial morphology. The middle-upper part of the boundary is the farthest from the longwall face, then comes the upper part and the middle-lower part, and the lower part is the closest to the working face. The boundary spatial morphology of the TLEZ along the inclined direction of the working face exhibits a distribution in the form of an “asymmetric circular-arc arch”. The distance between the boundary spatial morphology of the TLEZ and the working face, along the strike direction of the working face, demonstrates a pattern of gradually increasing from top to bottom.
4. Comparative Analysis of the Boundary Spatial Morphology of the TLEZ
4.1. Analytical Characterization of the Boundary of the TLEZ
In SDCS, the front abutment pressure is the projection of each principal stress in the normal direction of the coal seam plane. Drawing on the analysis of elastic mechanics, the stress state of an arbitrary point within an object can be analogized to a small tetrahedron. In this tetrahedron, the other three surfaces are, respectively, parallel to the three coordinate planes, as shown in Figure 16. As the tetrahedron WABC approaches W infinitely closely, the stress of the tetrahedron evolves into the stress on the inclined plane.
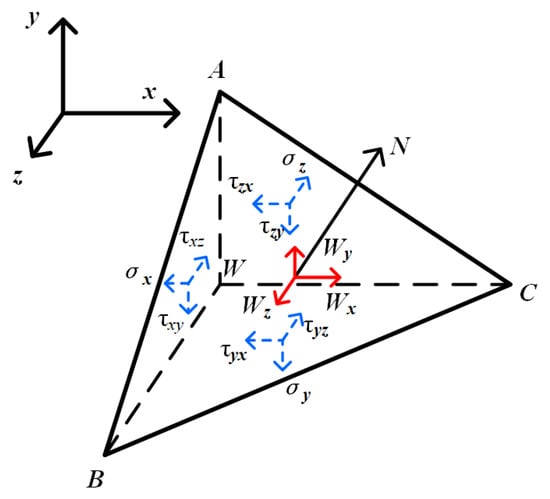
Figure 16.
Stress component of a point in the tetrahedron.
Let the outer normal of triangle ABC be N, and the cosines of the normal direction are
Suppose the volume of the tetrahedron WABC is ΔV, and the area of triangle ABC is ΔS. Then the areas of the other three faces are lΔS, mΔS, nΔS, respectively, which can be obtained according to the tetrahedron equilibrium condition:
Therefore, the normal stress σN on the triangle ABC is
In the fully mechanized top-coal caving stope with SDCS, as shown in Figure 4, the coordinate system is consistent with the three principal stress directions, and the dip angle of the coal seam is α. Assuming that the rock mass is an isotropic elastic body, because the unit body is constrained by the displacement of the adjacent rock mass in the horizontal direction, it is impossible to produce lateral deformation. According to the generalized Hooke’s law, we know that
Therefore, the front abutment pressure σm in front of the working face is
where α is the dip angle of coal seam, σ1 is the maximum principal stress, and A is the pressure measuring coefficient.
According to the relationship shown in Figure 17 in the TLEZ, the limit equilibrium equation established with the resultant force in the horizontal direction as zero is as follows [26]:
where h is the top-coal thickness, f1 is the friction coefficient between the coal seams with an empirical value of 0.2, f2 is the friction coefficient between the coal seams and rock strata with an empirical value of 0.3, σ3 is the minimum principal stress of the top coal, and σm is the front abutment pressure of the top coal.
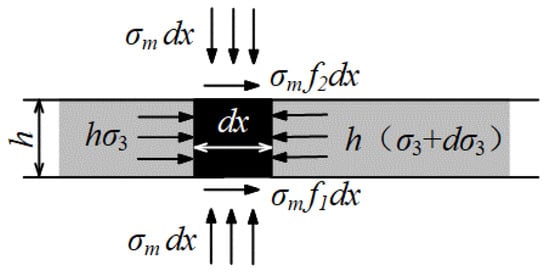
Figure 17.
Stress state of the TLEZ.
When the top coal is in the limit equilibrium state, the coal obeys the Mohr–Coulomb strength criterion, and the following can be obtained:
where φ is the internal friction angle of the coal.
Through the solution of Equations (7) and (9), the following can be obtained:
Substituting x = 0 and σm = N into Equation (10) yields
where N is the supporting capacity of the wall. Substituting Equation (11) into Equation (10) yields the following expression:
The residual supporting capacity of the top coal is equal to the residual strength of its coal sample, with σm = σr = N [31], which can be obtained by substituting it into Equation (12):
Regarding the empirical estimation of the strength of fractured rock masses, the following empirical equation of the Hoek–Brown rock mass empirical strength criterion is representative:
where σ1 is the maximum principal stress, σ3 is the minimum principal stress, σc is the uniaxial compressive strength, and m and s are empirical constants for the rock mass quality. According to reference [32], it is determined that m and s are 0.2 and 0.0001, respectively.
Substituting Equation (14) into Equation (13) yields the following expression:
In SDCS, the buried depth is different at different positions along the inclined direction of the working face, and the stress environment is different. Therefore, the analytical equation is modified according to the inclined direction of the working face. Top coal is destroyed at the peak position of the front abutment pressure, and the peak value of the front abutment pressure is generally kγH:
where k is the stress concentration factor, γ is the bulk density, and H is the buried depth.
Substituting Equation (17) into Equation (14) yields the following expression:
From Equation (16), it is evident that among the relevant influencing factors of the TLEZ boundary, only σ3 is influenced by the burial depth of the coal seam. The impact caused by the change in burial depth can be adjusted via σ3. Moreover, if the length of the working face is L, then
where a is a constant with a value range of (0–1), L is the working face length, and α is the dip angle of the coal seam.
The spacing from the TLEZ boundary to the longwall face is influenced by multiple factors, including the thickness of the seam, the internal friction angle, horizontal stress, the dip angle, and strength.
4.2. Comparative Analysis of the Boundary Spatial Morphology of the TLEZ
By substituting the principal stress data of the top coal into Equation (19), the theoretically calculated boundary of the TLEZ is obtained, as illustrated in Figure 18.
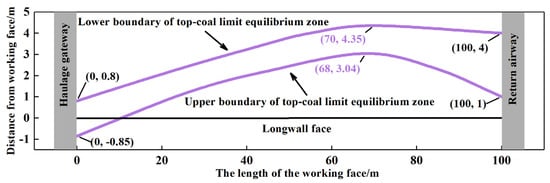
Figure 18.
Upper and lower boundaries of the TLEZ.
The upper boundary of the TLEZ is located 3.04 m away from the longwall face at the 68 m position in the middle-upper part of the longwall face. At the 0 m and 100 m positions of the longwall face, the distances from the upper boundary of the TLEZ to the longwall face are 1 m and −0.85 m, respectively.
The lower boundary of the TLEZ is located 4.35 m away from the longwall face at the 70 m position in the middle-upper part of the longwall face. At the 0 m and 100 m positions of the longwall face, the distances from the upper boundary of the TLEZ to the longwall face are 4 m and 0.80 m, respectively.
Conducting a comparative analysis of the boundary spatial morphology of the TLEZ obtained through theoretical calculation and numerical simulation yields interesting results, as shown in Figure 19.
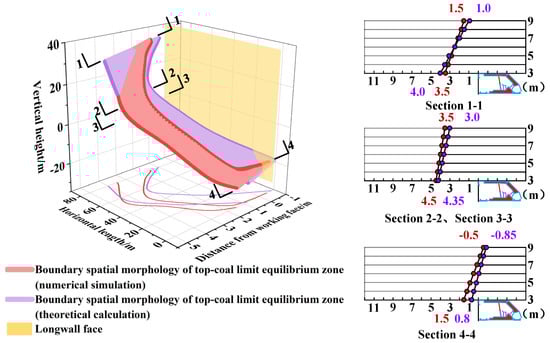
Figure 19.
Comparative analysis of the boundary spatial morphology of the TLEZ.
The boundary spatial morphology of the TLEZ in the fully mechanized top-coal caving face of SDCS, which is obtained by the two methods, is an “asymmetric arc-shaped ribbon-like curved surface”.
Along the strike of the longwall face, the asymmetric vault of the boundary spatial morphology progressively shifts from the bottom to the top towards the middle of the longwall face. Along the strike of the longwall face from bottom to top, the asymmetric vault of the red boundary spatial morphology progressively shifts from 66.25 m to 60.00 m, while the asymmetric vault of the purple boundary spatial morphology progressively shifts from 70.00 m to 68.00 m.
Along the dip of the longwall face from bottom to top, the distance between the boundary spatial morphology and the working face progressively increases first and then decreases, exhibiting pronounced asymmetry along this direction. Based on the distribution characteristics of the boundary spatial morphology and its distance from the longwall face, the boundary form is divided into four zones along the dip of the longwall face: the upper zone (80–100 m), the middle-upper zone (50–80 m), the middle-lower zone (20–50 m), and the lower zone (0–20 m). Among these, the middle-upper zone of the longwall face is the farthest from the longwall face, followed by the upper and middle-lower zones, while the lower zone is the closest to the longwall face.
Along the strike of the longwall face, the spacing between the boundary spatial morphology of the TLEZ and the longwall face shows a trend of gradual increase from top to bottom. As shown on the right side of Figure 18, sections are, respectively, taken along the strike at the 100 m of the longwall face, the 70.00 m position of the purple boundary spatial morphology, the 66.25 m position of the red boundary spatial morphology, and the 0 m position of the longwall face. They are shown in Section 1-1, Section 2-2, Section 3-3, and Section 4-4, respectively. In Section 1-1, the distance ranges from the longwall face to the red boundary and purple boundary are 3.50 m~1.50 m and 4.00 m~1.00 m, respectively. In Sections 2-2 and 3-3, the distance ranges from the longwall face to the red boundary and purple boundary are 4.50 m~3.50 m and 4.35 m~3.00 m, respectively. In Section 4-4, the distance ranges from the longwall face to the red boundary and purple boundary are 1.50 m~ (−0.50 m) and 0.80 m~ (−0.85 m), respectively.
The outcomes of the numerical simulation are in accordance with the results of the theoretical calculation. This further validates the rationality of the analytical characterization of the TLEZ boundary.
5. Discussion
Through various research methods, the boundary spatial morphology of the TLEZ boundary is revealed, and the analytical characterization of the TLEZ boundary is achieved. The mining-induced stress on top coal along the dip of the longwall face has obvious regionalization characteristics that make the top coal also show regionalization characteristics in the process of gradual deterioration, resulting in the “asymmetric distribution” of the TLEZ boundary along the dip. In the fully mechanized top-coal caving face with SDCS, the mining-induced stress acting on the top coal along the dip of the longwall face exhibits distinct zonal characteristics. This causes the top coal to also display zonal characteristics during its gradual deterioration process, thereby leading to the “asymmetric distribution” of the TLEZ boundary along the inclined direction. The boundary spatial morphology of the TLEZ takes on an “asymmetric arc-shaped ribbon-like curved surface”.
This paper reveals, for the first time, the spatial configuration of the TLEZ boundary in a fully mechanized top-coal caving face with a large dip angle. Previous researchers [2] took the damage angle as the breakthrough point to determine the spacing between the TLEZ boundary and the longwall face based on the displacement of the top coal in different sections. By making a comparison with previous studies, this paper quantitatively characterized the top-coal limit equilibrium boundary by analyzing the stress state of the top coal in SDCS and integrating the principal stress data of the top coal.
By comparing the upper boundary of the TLEZ determined through damage characterization, numerical simulation, and theoretical analysis, as shown in Figure 20, the patterns of the three curves are generally consistent, and all exhibit asymmetry. However, there are certain discrepancies in the lower part of the longwall face. At the 0 m position of the longwall face, the distances from the longwall face obtained through damage characterization, numerical simulation, and theoretical analysis are 1.24 m, −0.5 m, and −0.85 m, respectively. Because the gob in the lower part of the longwall face is compactly filled, the displacement characteristics of the top coal in front of the longwall face are weaker than those of the top coal in other areas of the longwall face. This limits the continuation of research on the TLEZ boundary from the perspective of damage. Finally, the rationality and effectiveness of the TLEZ boundary are further verified by combining the frequency distribution law of top-coal leakage in the working face with data measured in the field.
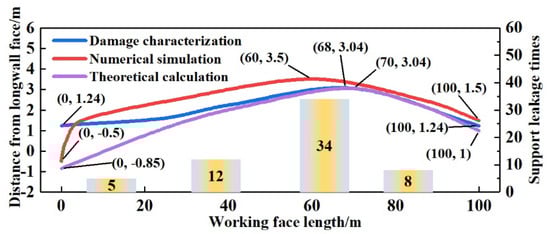
Figure 20.
Comparative analysis of the upper boundary of the TLEZ.
Building upon the previous two-dimensional single boundary, this paper conducts a further study on the three-dimensional spatial morphology of the TLEZ boundary. The determination of the spatial configuration of the boundary enables workers and researchers to have a clearer understanding of the failure process and extent of the top coal. Additionally, it allows for a more scientific judgment regarding the issue of guiding the top-coal caving rate.
The revelation of the boundary spatial morphology of the TLEZ provides a clear direction for the stability control of the “support-surrounding rock” system in SDCS. Moreover, it enables the formulation of a reasonable coal caving scheme based on the distance relationship between the top-coal boundary and the longwall face in different regions. Building on the regional distribution characteristics of support stability under the influence of the boundary spatial morphology of the TLEZ, the following caving principle for the fully mechanized top-coal caving face in SDCS is proposed:
- Coal caving should be conducted from top to bottom along the dip of the longwall face.
- Along the inclined direction of the working face, the amount of coal discharged varies in different areas. Therefore, the principles of “no coal caving in the upper part, less coal caving in the middle-upper part, normal coal caving in the middle-lower part, and maximum coal caving in the lower part” should be followed.
- The output of the working face should be maximized as much as possible while ensuring safety.
- The cutting speed must be maintained within an optimal range to ensure both operational safety and production efficiency. Excessive advancing speed exacerbates top-coal fragmentation, significantly compromising working face safety. Conversely, insufficient advancing speed negatively impacts mine productivity by restricting output capacity.
Based on the boundary spatial morphology of the TLEZ, the reasonable coal caving principle not only guarantees the high output and high efficiency of the working face but also prevents the further deterioration of the stability of the “support-surrounding rock” system, significantly enhancing the safety of the working face.
For mining engineers and underground workers, the delineation of the TLEZ boundary provides a methodology for predicting the TLEZ boundaries in similar working faces. This approach enables tailored guidance for the technological sequences and specific construction processes of fully mechanized top-coal caving faces based on varying boundary positions, thereby maximizing mine output while ensuring workplace safety.
As all findings were derive from numerical simulations, two key limitations should be noted. Regarding geological variability, results may vary substantially between locations because each coal mine has distinct stratigraphic features. Concerning material assumptions, the model’s homogenization of the coal and rock layers fails to capture real-world heterogeneities including faults, fractures, and lithological differences.
6. Conclusions
- Based on the analysis method of elastic mechanics, the correlation between the normal stress of the coal seam and the principal stress of the coal under the influence of the dip angle is presented. By integrating with the stress state model at the TLEZ boundary under macro-scale conditions, the quantitative characterization of the TLEZ boundary in SDCS is achieved.
- The boundary spatial morphology of the TLEZ in a fully mechanized top-coal caving face with SDCS takes on an “asymmetric arc-shaped ribbon-like curved surface”. The middle-upper part of the boundary is the farthest from the longwall face, then comes the upper part and the middle–lower part, and the lower part is the closest to the working face. The boundary spatial morphology of the TLEZ along the inclined direction of the working face exhibits a distribution in the form of an “asymmetric circular-arc arch”. The distance between the boundary spatial morphology of the TLEZ and the working face, along the strike direction of the working face, demonstrates a pattern of gradually increasing from top to bottom.
- Through the comparison between numerical simulation and theoretical calculation, it can be seen that the overall pattern of the boundary spatial morphology of the TLEZ in SDCS is consistent. Moreover, this boundary spatial morphology is further validated by the on-site monitoring results. The findings indicate that the analytical characterization of the TLEZ boundary in the fully mechanized top-coal caving face of SDCS is reasonable and feasible.
- According to the boundary spatial morphology of the TLEZ in the fully mechanized top-coal caving face with SDCS, the top coal exhibits maximum fragmentation intensity in the middle-upper section along the working face inclination, necessitating targeted protective measures. By putting forward a reasonable caving principle, the stability of the “support-surrounding rock” system is ensured.
Author Contributions
D.L.: writing—review and editing, supervision, project administration, and funding acquisition. X.W.: writing—original draft, conceptualization, methodology, software, validation, data curation, and formal analysis. Y.W.: conceptualization, supervision, and project administration. P.X.: investigation, data curation, and supervision. All authors have read and agreed to the published version of the manuscript.
Funding
This research was supported by the Program of National Natural Science Foundation of China (Grant number: 52274137) and the Program of National Natural Science Foundation of China (Grant number: 52474145).
Institutional Review Board Statement
Not applicable.
Informed Consent Statement
Not applicable.
Data Availability Statement
The data that support the findings of this study are available from the corresponding author upon reasonable request.
Conflicts of Interest
The authors declare that they have no conflicts of interest.
References
- Wu, Y.; Lang, D.; Yun, D.; Xie, P.; Wang, H.; Gao, X.; Luo, S.; Zeng, Y.; Lv, W.; Zhang, Y.; et al. Reform and prospects of mining technology for large inclined coal seam in China. Coal Sci. Technol. 2024, 52, 25–51. [Google Scholar]
- Lang, D.; Wu, X.; Wu, Y.; Lin, H.; Luo, S. Boundary distribution of top-coal limit-equilibrium zone in fully mechanized caving in steeply dipping coal seams. Geomat. Nat. Hazards Risk 2021, 12, 2561–2589. [Google Scholar] [CrossRef]
- Song, X.; Zhu, D.; Wang, Z.; Huo, Y.; Liu, Y.; Liu, G.; Cao, J.; Li, H. Advances on longwall fully-mechanized top-coal caving mining technology in China during past 40 years: Theory, equipment and approach. Coal Sci. Technol. 2021, 49, 1–29. [Google Scholar]
- Wang, J. 40 years development and prospect of longwall top-coal caving in China. J. China Coal Soc. 2023, 48, 83–99. [Google Scholar] [CrossRef]
- Wang, J. Analysis of top-coal medium state in top-coal caving face. J. Xi’an Univ. Sci. Technol. 1991, 11, 9–16. [Google Scholar]
- Wu, J.; Zhang, Y. Study on the basic theory of longwall top-coal caving mining. J. China Univ. Min. Technol. 1998, 27, 332–335. [Google Scholar]
- Xie, H.; Zhao, X. Analysis of continuous damage and failure of top-coal. J. China Univ. Min. Technol. 2001, 35, 3–7. [Google Scholar]
- Xie, H.; Zhang, Z.; Gao, F.; Zhang, R.; Gao, M.; Liu, J. Stress-fracture-seepage field behavior of coal under different mining layouts. J. China Coal Soc. 2016, 41, 2405–2417. [Google Scholar]
- Wu, J.; Zhang, Y. Development trend of top-coal crack and its influence on water injection and dust prevention. J. China Coal Soc. 1998, 23, 580–584. [Google Scholar]
- Yan, S.; Wu, J. Measurement of top-coal movement and analysis of damage characteristics in top-coal caving mining. Chin. J. Rock Mech. Eng. 1996, 15, 155–162. [Google Scholar]
- Wang, J.; Wang, Z. Propagating mechanism of top-coal fracture in longwall top-coal caving mining. J. China Coal. Soc. 2018, 43, 2376–2388. [Google Scholar]
- Lang, D.; Wu, Y.; Guo, F.; Xie, P.; Luo, S. Critical position of top-coal medium transformation in fully-mechanized caving face. J. China Min. Saf. Eng. 2019, 36, 879–888. [Google Scholar]
- Chen, Z.; Xie, H.; Lin, Z. Study on falling ability of top-coal during top-coal caving by damage mechanics. Chin. J. Rock Mech. Eng. 2002, 21, 1136–1140. [Google Scholar]
- Chen, Z.; Xie, H. Damage mechanics analysis of abutment pressure distribution in fully mechanized top-coal caving face. Chin. J. Rock Mech. Eng. 2000, 19, 436–439. [Google Scholar]
- Wang, J.; Zhang, J. BBR study of top-coal drawing law in longwall top-coal caving mining. J. China Coal Soc. 2015, 40, 487–493. [Google Scholar]
- Wang, J.; Yang, S.; Li, Y.; Wei, L.; Liu, H. Caving mechanisms of loose top-coal in longwall top-coal caving mining method. Int. J. Rock Mech. Min. Sci. 2014, 71, 160–170. [Google Scholar] [CrossRef]
- Le, T.; Dao, H.; Vu, D. Impact of discrete fracture characteristics on longwall top-coal stability. Acta Montan. Slovaca 2022, 27, 851–863. [Google Scholar]
- Yang, S.; Wei, W.; Yang, L.; Li, A. Theoretical investigation and key caving technology development at the end area of longwall top-coal caving (LTCC) panels. Comput. Part. Mech. 2023, 11, 235–247. [Google Scholar]
- Zhang, J.; Zhang, Y.; Yang, S.; Cheng, D.; Wei, W.; Yang, L. Theoretical and experimental Investigation on top-coal drawing mechanism considering overburden pressures in longwall top-coal caving. Rock Mech. Rock Eng. 2025, 58, 2901–2927. [Google Scholar] [CrossRef]
- Herezy, Ł.; Janik, D.; Skrzypkowski, K. Powered Roof Support-Rock Strata Interactions on the Example of an Automated Coal Plough System. Stud. Geotech. Mech. 2018, 40, 46–55. [Google Scholar] [CrossRef]
- Luo, S.; Tian, C.; Wu, Y.; Lang, D.; Wang, T.; Huangfu, J.; Zhao, H. Migration laws of top-coal failure and stability analysis of support on fully mechanized top-coal caving mining in steeply dipping coal seam. J. China Min. Saf. Eng. 2023, 40, 23–35. [Google Scholar]
- Zhang, J.; Wang, J.; Wei, W. Effect of face dip angle on the drawing mechanism in longwall top-coal caving mining. J. China Univ. Min. Technol. 2018, 47, 805–814. [Google Scholar]
- Wu, Y.; Lang, D.; Xie, P.; Wang, H. Regional fracture of top-coal along the inclined direction of fully-mechanized caving face in soft steep dipping seam. J. China Min. Saf. Eng. 2018, 35, 553–560. [Google Scholar]
- Wang, H.; Wu, Y.; Xie, P.; Cao, P.; Guo, F. Research on strata movement and support stability of fully mechanized sublevel caving workface with variable angle in steeply dipping seam. J. China Univ. Min. Technol. 2017, 46, 507–513. [Google Scholar] [CrossRef]
- Lang, D.; Wu, X.; Wu, Y.; Xie, P.; Yan, Z.; Chen, C. Boundary quantitative characterization of the top-coal limit equilibrium zone in fully mechanized top-coal caving stope along the strike direction of working face. Sci. Rep. 2024, 14, 14461. [Google Scholar] [CrossRef]
- Qian, M.; Xu, J.; Wang, J.; Wu, Y. Mine Pressure and Strata Control; China University of Mining and Technology Press: Xuzhou, China, 2021. [Google Scholar]
- Chai, J.; Han, Z.; Lei, W.; Zhang, D.; Yang, J.; Ma, C.; Han, G.; Weng, M. The application of distributed fiber-optic sensing technology in monitoring the loose zone in the floor of stoping roadway. Rock Mech. Rock Eng. 2025, 58, 723–744. [Google Scholar]
- Darvishi, A.; Ataei, M.; Rafiee, R. Investigating the effect of simultaneous extraction of two longwall panels on a maingate gateroad stability using numerical modeling. Int. J. Rock Mech. Min. Sci. 2020, 126, 104172. [Google Scholar] [CrossRef]
- Mesutoglu, M.; Ozkan, I. Evaluation and comparison of rock bolting versus steel arch support systems in thick coal seam underground galleries: A case study. Min. Met. Explor. 2024, 41, 1719–1737. [Google Scholar] [CrossRef]
- Sakhno, I.; Sakhno, S.; Skrzypkowski, K.; Isaienkov, O.; Zagórski, K.; Zagórska, A. Floor Heave Control in Gob-Side Entry Retaining by Pillarless Coal Mining with Anti-Shear Pile Technology. Appl. Sci. 2024, 14, 4992. [Google Scholar] [CrossRef]
- Xie, H.; Zhou, H.; Liu, J.; Gao, F.; Zhang, R.; Xue, D.; Zhang, Y. Mining-induced mechanical behavior in coal seams under different mining layouts. J. China Coal Soc. 2011, 36, 1067–1074. [Google Scholar]
- Cai, M.; He, M.; Liu, D. Rock Mechanics and Engineering; Science Press: Beijing, China, 2013. [Google Scholar]
Disclaimer/Publisher’s Note: The statements, opinions and data contained in all publications are solely those of the individual author(s) and contributor(s) and not of MDPI and/or the editor(s). MDPI and/or the editor(s) disclaim responsibility for any injury to people or property resulting from any ideas, methods, instructions or products referred to in the content. |
© 2025 by the authors. Licensee MDPI, Basel, Switzerland. This article is an open access article distributed under the terms and conditions of the Creative Commons Attribution (CC BY) license (https://creativecommons.org/licenses/by/4.0/).