1. Introduction
In the first half of 2024, 13 European Union (EU) countries generated more electricity from wind and solar photovoltaics (PV) than from fossil fuels. At the end of the same year, the total installed capacity in variable renewable energy (VRE) was 335 GW in solar PV [
1] and 231 GW in wind energy [
2]. In 2024 alone, the EU-27 installed 65.5 GW of new solar PV and 12.9 GW of new wind power plants. Wind power contributed 17.4% while solar PV contributed 11.1% to the total EU-27 electricity generation in 2024 [
3]. Currently, the EU-27 is generating 47% (1300 TWh) of electricity from renewable energy and only 29% (793 TWh) from fossil fuels. This is a remarkable growth from 2019, when the EU was generating 34% (979 TWh) from renewable energy and 39% (1130 TWh) from fossil fuels [
3]. Power-sector carbon emissions have fallen by 26% over the past five years. Currently, the solar PV sector in the EU-27 is experiencing exceptional growth and is expected to reach 800 GW of installed capacity by 2030 [
1]. The total wind power is projected to reach 351 GW by 2030 [
2].
Since 2010, solar PV has experienced a dramatic decline in manufacturing and installation costs. Today, utility-scale solar PV is the most competitive power plant option, with a global average levelized cost of electricity (LCOE) 50% lower than the cheapest fossil fuel alternative. For newly commissioned utility-scale solar PV projects, the LCOE dropped from 460 US
$/MWh in 2010 to 44 US
$/MWh in 2023—a 90% decline [
4].
Figure 1 compares the total installation costs (TICs) and the LCOE for various renewable energy technologies between 2010 and 2023. Half of the cost reduction of solar PV is attributed to the decreasing price of modules, while improvements in module efficiency, optimized manufacturing and supply chains, and reduced mounting costs have also contributed to the cost decline. Between 2010 and 2023, the average TIC for utility-scale solar PV fell from 5310 to just 758 US
$/kW
p [
4]. In 2023, the global average LCOE for onshore wind was 25% lower than the LCOE of solar PV (33 vs. 44 US
$/MWh). However, onshore wind had a 50% higher TIC (1160 vs. 758 US
$/kW
p). The LCOE gap between onshore wind and solar PV is expected to reverse by 2030 [
5].
In 2024, wind contributed 14.9%, while solar PV only contributed 3.5% to the electricity mix in Croatia [
6,
7]. To put it into context, the per capita electricity generation from wind and sun in Croatia is 676 kWh/cap, only half of the EU-27 average value of 1410 kWh/cap [
8].
The delayed growth of the solar PV sector in Croatia is a consequence of the intricate permitting processes and the underdeveloped power grid. Simplified permitting and faster grid connection procedures could accelerate the deployment of new solar PV installations. At the end of 2022, the total solar PV capacity in Croatia was 220 MW, then it expanded up to 498 MW at the end of 2023 and to 878 MW at the end of 2024 [
9,
10].
By the end of 2024, a total of 25,406 solar PV units were operating in the category of self-consumption, while only 6 solar PV units were utility-scale power plants feeding electricity to the public grid [
11]. The total installed capacity in the self-consumption category was 776.1 MW: 19,022 solar PV units (134.4 MW) were rooftop installations, generating electricity for households and 6384 solar PV units (641.7 MW) were generating electricity in the commercial category [
12]. The total installed capacity of the six utility-scale solar PV power plants was 101.7 MW. Utility-scale solar PV power plants are connected to the transmission grid (110 kV), while self-consumption units are connected to the distribution grid (up to 35 kV). Solar energy oversupply from the self-consumption category is exported to the public grid.
The utility-scale solar PV sector is expected to grow substantially in the next years. Recently, the Croatian Energy Market Operator (HROTE) launched a public bid to allocate 350 MW for utility-scale solar PV projects and another 100 MW of solar PV for small and medium enterprises. The maximum bidding prices are set through the power purchase agreement (PPA) scheme: 67 €/MWh (71.9 US
$/MWh) for utility-scale and of 82 €/MWh (88 US
$/MWh) for commercial PV systems [
13].
Croatia’s wind power capacity is 1.2 GW but with only 47 MW of newly commissioned wind turbines in 2024. The Wind Europe report [
2] foresees 2 GW of onshore wind power while the updated National Energy and Climate Plan (NECP) [
14] sets a more ambitious target of 2.5 GW by 2030 in Croatia. The solar PV capacity is expected to reach 2 GW [
1] and possibly surpass wind capacity by 2030 in Croatia.
Renewable energy sources are becoming crucial for the ongoing transformation in the global energy landscape. However, the increasing share of variable renewable energy introduces intermittency to electricity generation. This creates challenges for grid operators in balancing supply and demand, especially during periods of high solar and wind availability. Additionally, the oversupply of solar and wind generation can lead to grid congestion and curtailment, or the need for energy storage and demand-response solutions.
Climate change mitigation scenarios assume substantial growth rates of solar PV and wind power within the global electricity supply. For the 1.5–2.0 °C climate scenarios, the annual growth in onshore wind should double from the current 0.6% to the projected 1.2% by 2030–2040, while the annual growth in solar PV in total electricity supply should nearly triple from the current 0.4% to 1.1% by 2030–2040 [
15]. Onshore wind and solar PV should be jointly expanded to benefit from their spatiotemporal complementarity and meet electricity demand more effectively than single-source expansion. Coupled wind-solar systems together with dispatchable hydropower production can increase the rates of renewable energy penetration while maintaining grid stability [
16]. Generally, the random fluctuations in wind power production are more violent than the fluctuations in solar PV production. However, wind power does not exhibit the morning ramp up and the evening ramp down effects of solar PV production [
17]. Therefore, the combined generation from solar PV and wind power can mitigate the random fluctuations and ramp effects of separate solar PV and wind power production [
18].
Maintaining grid stability in weather extremes will become increasingly challenging due to more frequent and severe climate events in the future. Additionally, renewable energy sources introduce variability in power supply, requiring advanced grid management and energy storage solutions to ensure grid stability during extreme conditions.
Two recent events highlight the growing importance of grid stabilization in power systems with high shares of VRE generation and during weather extremes. On 21 June 2024, the power grids of Albania, Montenegro, Bosnia, and Herzegovina and partially Croatia suffered a blackout. The blackout was caused by the tripping of power lines, which were overloaded in the middle of a heatwave [
19]. The blackout across Spain and Portugal on 28 April 2025 was triggered by problems in grid synchronization. Prior to the blackout, solar energy was supplying 58% of the demand in Spain, while wind was participating with an additional 11%. However, a sudden surge in wind generation, which was rather low up to that point, may have caused problems in grid synchronization [
20]. In both cases, the power supply was largely restored by the evening of the same day. However, to prevent similar events in the future, improved interconnections between countries and advanced strategies for grid stabilization will become essential [
21].
In Europe, the variability of solar and wind resources can be smoothened with improved grid integration between northern and southern Europe [
22,
23]. Hydro–wind–solar–battery hybrid energy systems are suggested as an effective solution for future extreme hot and dry weather events [
24]. Energy storage systems with clean hydrogen production from surplus solar PV and wind energy are suggested for improving grid stability [
25]. Climate models predict that the frequency of power outages could increase by 5.2–12.5% in 2030 and 7.4–20.3% in 2050 due to the increased frequency and severity of heatwaves [
26]. Heatwave events lead to increased electricity demand and greenhouse gases emissions for the power sector [
27]. Daily electricity consumption can increase by 40% during heatwaves when the minimum nighttime temperature remains above 24 °C [
28]. However, during heatwave days, wind and solar PV generation profiles are complementary and their combined generation can improve grid stability [
29].
Generally, wind power decreases during daytime heatwaves because of reduced wind speeds [
30]. However, wind power plants situated near the coasts may benefit from enhanced sea–land breeze during the night [
31]. The wind power output can be reduced by up to 30.8% during heatwaves in southern European countries [
32]. Solar radiation and solar PV production, on the other hand, increase during daytime heatwaves [
33]. Part of the increased solar PV production may be lost due to the reduction of PV module efficiency caused by elevated ambient temperatures [
34]. The increased use of air-conditioning in the future will amplify the effect of climate change on peak loads [
35,
36].
This study investigates the combined performance of wind and solar PV generation during an extreme heatwave scenario in Croatia, using a high-temporal-resolution (15-minute interval) simulation model. The literature is limited in studies that investigate the combined role of variable renewable energy and dispatchable sources in meeting electricity demand during present and future heatwave events. Furthermore, previous research has generally overlooked the impact of expanding solar PV and wind power on renewable energy oversupply and electricity prices. This study addresses that gap by modelling Croatia’s power system at a 15-minute resolution, simulating the July 2024 heatwave under projected 2030 scenarios with increased penetration of wind and solar PV.
The rest of the article is organized as follows.
Section 2 explains the methodology, including data sources, the modeling approach, and the assumptions for simulating the Croatian power system.
Section 3 presents the analysis of the results and the discussion, first looking into the impact of the July 2024 heatwave and then foreseeing how the power system is expected to perform in 2030, assuming increased wind and solar PV capacities.
Section 3 also examines potential problems such as renewable energy oversupply and electricity prices. Finally,
Section 4 summarizes the main findings and outlines guidelines for future research.
2. Methods
Electricity generation and power load data was retrieved from the European Network of Transmission System Operators for Electricity (ENTSO-E) database [
37], which is also available on the website Energy Charts [
38]. The power load and electricity generation data refers to net values. Net electricity generation is the difference between gross electricity generation and self-consumption. Net electricity is the power traded at the electricity exchange and fed to the public grid. Self-consumption includes the electricity that is consumed at the site of production. In a thermal power plant, this is the electricity necessary to run feedwater pumps, mills, cooling towers, and other auxiliary systems. In residential buildings, this is the electricity consumed directly at the site which does not enter the transmission system. Solar PV electricity generated by industry, commercial enterprises, and private owners, which is used for self-consumption, is not included in the net electricity and thus not shown in the ENTSO-E data [
39].
In Croatia, the total installed solar PV capacity at the end of 2024 was 878 MW [
9,
10]. Out of this total capacity, 776 MW are building-integrated systems generating for self-consumption and feeding surplus to the distribution grid [
11], while 102 MW is the cumulative capacity from six utility-scale solar PV power plants feeding electricity directly to the transmission grid [
12]. Hence, ENTSO-E data reports all utility-scale solar PV generation available to the public grid and the surplus solar electricity from building-integrated systems. On the other hand, all onshore wind power plants are directly connected to the transmission grid, and all are represented in the ENTSO-E data.
Power plants generating from renewable energy sources (wind, solar PV, and hydro) achieve marginal costs near zero and are the first to be brought online. The net residual load is met by dispatchable energy sources (nuclear, reservoir hydro, and fossil thermal). If dispatchable sources cannot meet the entire load, electricity is imported. The net residual load (
Presidual) is the difference between the net public load (
Pload) and net VRE capacity (
PVRE), as follows:
Ideally, the residual load would be perfectly met by dispatchable energy sources, and the exchange would be zero at any moment. In reality, when dispatchable sources are not enough to meet the load demand, electricity must be imported. Oversupply occurs when dispatchable and VRE generation is larger than the load demand. In that case, oversupply electricity is exported or stored. Renewable energy curtailment is used to maintain grid stability and occurs when further energy export or storage is not possible. The net VRE capacity (
PVRE) includes the net generation capacity from solar PV (
PPV) and wind power plants (
Pwind), as follows:
The design of the European electricity market is based on the principle of merit order, which determines the order in which power plants are brought online [
40]. Different energy sources have different short-run marginal costs (
MCi in €/MWh), which have to be paid to produce an additional unit of electricity (MWh). Marginal costs include variable running costs and should not be confused with the LCOE, which includes total unit costs over the power plant lifetime. In each trading period, an
i-th power plant offers electricity at the individual
MCi to cover its production costs, but the final price of electricity will be equal to the most expensive energy source brought online. This price is known as the spot price or system marginal price. Residual power generation is optimized by minimizing total marginal costs among the dispatchable power plants to be brought online, as follows:
The net capacity of the
i-th power plant to be brought online (
Pi) is known. For an
i-th power plant, marginal costs (
MCi) account for fuel costs (
Cfuel,i, €/MWh
th), CO
2 allowances (
CCO2, €/t
CO2), and the variable part of operating and maintenance costs (
CV, €/MWh
th), all divided by the efficiency of the power plant (
ηi) as follows:
The emission intensity of a fuel is denoted with
efuel,i (t
CO2eq/MWh
th). The country-specific emission intensities are 0.368 t
CO2eq/MWh
th for hard coal, 0.312 t
CO2eq/MWh
th for fuel-oil, and 0.232 t
CO2eq/MWh
th for natural gas [
41]. These emission factors include total greenhouse gases emissions (CO
2, CH
4, and N
2O) from production to consumption (mining, transport, distribution, and fuel combustion). The full load efficiency of the
i-th power plant is known. However, when the power plant operates at partial load, the efficiency decreases. Thus, partial load operation increases fuel consumption and carbon emissions per unit of generated electricity. Marginal costs increase as a consequence. Using data from [
42,
43,
44], correlations were built to determine the partial load efficiency (
ηi) of a combined cycle gas turbine (CCGT), open cycle gas turbine (OCGT), and oil- and coal-fired power plants. The partial load efficiency (
ηi) is calculated relatively to the full-load efficiency (
η0), the full-load capacity (
P0), and the partial load (
Pi) capacity, as follows:
The share of renewable energy (
fRES) in the electricity demand is calculated as the ratio between net renewable energy (
ERES) and the net electricity demand (
Edemand) over an observed period of time (
j = 1…
t), as follows:
The net electricity demand (
Edemand =
Pload·
t, in MWh) is the product of the net public load (
Pload, in MW) and the observed period of time (
t, in hours). The share of non-renewable energy (
fnon-RES) includes fossil and nuclear energy and is determined as the remaining share after subtracting the share of renewable energy, as follows:
A sub-category of non-renewable generation is the share of fossil generation (
ffossil), calculated as the ratio between the sum of net energy produced in gas- (
Egas), oil- (
Eoil), and coal-fired (
Ecoal) units and the net electricity demand (
Edemand), as follows:
The share of variable energy (
fVRE) is calculated as the ratio between net variable renewable energy (
EVRE) and total electricity demand (
Edemand), as follows:
The share of import dependency (
fimport) is the ratio between net electricity import and net electricity demand, where the net electricity import is the missing energy demand, calculated as the difference between electricity demand (
Edemand) and total energy generation (
EVRE +
Eresidual), as follows:
The share of renewable energy oversupply (
fOS) is the ratio between VRE energy surplus (Δ
EVRE) and net electricity demand (
Edemand), as follows:
Renewable energy oversupply occurs when total generation exceeds electricity consumption, and the VRE surplus needs to be exported, stored, or curtailed.
The main assumptions of the power system model arise from the following principles of the merit order and the announced near-future projects in the power sector in Croatia:
Power load and electricity generation profiles were modelled on a 15-minute interval basis. Present load and net generation data was retrieved from the Energy Charts website, available also on the ENTSO-E database.
Future power load profiles were built from historical data using scaling factors.
Assuming that the wind sector is mature in Croatia, future wind generation profiles were estimated from historical wind generation data using scaling factors.
Solar data for the exact locations of the announced utility-scale solar PV power plants was unavailable. Therefore, hourly solar data was estimated using the sky diffuse model developed by PVWatts [
45]. Comparison against measurements of solar energy quantities in the major cities [
46] revealed that the PVWatts tool is able to predict within 4% error on the annual scale. Subsequently, the hourly data was reduced to 15-min interval data using spline interpolation.
Solar PV for self-consumption is disregarded because it is not available to the public grid. ENTSO-E reports data for net power loads and net generation, which are measured when entering the public grid, while solar PV for self-consumption is generated and consumed locally. Estimation of energy generation from solar PV self-consumption units is avoided due to uncertainties such as shading factors, installation angles, PV panel type and age, system losses, power purchase schemes.
Real-world uncertainties such as sudden fuel price spikes, regulatory constraints, transmission grid contingencies, power plant outages, and corporate decisions were disregarded.
Hydro run-of-river generation profiles are assumed constant as no major projects are under construction in Croatia and 2024 was hydrologically average.
Electricity generation from hydro reservoir power plants can change in order to accommodate the intermittent production from VRE sources but respect the available hydrological resources in the short and long term.
Nuclear energy and other renewable energy sources (biomass, waste, and geothermal) are assumed unvaried as no major projects will be realized in the near future.
Electricity generation profiles are optimized, aiming to reduce electricity import, which means that between a domestic and a foreign power plant of the same type, the domestic power plant achieves precedence in the merit order.
Generation redispatch and renewable curtailment are disregarded from the model; however, renewable energy oversupply was quantified and its effects discussed.
3. Results and Discussion
3.1. The Merit Order of Power Plants
After the start of the War in Ukraine, Europe has been affected by growing gas and electricity prices. The cost of gas has significantly increased because Russian gas has been replaced with more expensive alternatives, mainly liquefied natural gas (LNG). Although less than 40% of the EU’s electricity is generated by fossil fuels, electricity prices went up, too, following the merit order principle.
Figure 2 depicts the merit order of electricity producers in Croatia, assuming fuel and carbon prices from the last quarter of 2024.
Renewable energy power plants (wind, solar PV, and hydro) achieve marginal costs near zero and are the first to be brought online. Nuclear energy has low marginal costs, second only to renewable energy power plants.
Figure 2 includes the Croatian half (348 MW) of the nuclear power plant in Krško (Slovenia), a co-owned venture by Slovenia and Croatia. Since nuclear power is a baseload energy source with continuous and predictable output, they are price-takers on the energy market. The marginal cost of nuclear energy is around 20 €/MWh
el [
47,
48]. Price-taking is particularly risky in a market with increasing shares of low-cost variable renewable energy. This is the reason why small modular and flexible nuclear reactors (SMR) are currently under development and should gradually replace traditional nuclear power plants.
Fossil-fired power plants are the last to be brought online because of high marginal costs. In Q4/2024, the average cost of hard coal was 16 €/MWh
th [
49], while that of natural gas was 41.5 €/MWh
th [
50]. This is converted into 42 €/MWh
el for hard coal and 83 €/MWh
el for natural gas, assuming average efficiency of 38% for coal-fired units and 50% for CCGT units. Carbon emissions were priced at 68 €/t in Q4/2024 [
51]. The carbon intensities are 0.232 t
CO2/MWh
th for natural gas and 0.368 t
CO2/MWh
th for hard coal [
52]. The costs of carbon emissions for electricity from natural gas and hard coal were 27 and 68 €/MWh
el, respectively. Electricity generation from CCGT and coal fired units achieve comparable marginal costs: 108–115 €/MWh
el and 117 €/MWh
el, respectively. The marginal costs of oil-fired and OCGT units are higher: between 170 and 290 €/MWh
el and around 210 €/MWh
el, respectively.
At the moment, the fossil-fired capacity in Croatia includes 800 MW in CCGT, 200 MW in one coal-fired power plant, 350 MW in oil fired units, and 100 MW in OCGT. Only the four most efficient CCGT units (700 MW) and one coal-fired power plant (200 MW) are operational since they achieve the lowest marginal costs. When renewable energy generation is low, the necessary demand is met by import electricity. The oil-fired and OCGT units, of which the generation is more expensive than import electricity, would operate only in case of emergency.
The intersection between the cost and the demand curves determines the last power plant to enter production according to the merit order principle. This power plant is also called the marginal power plant and does not operate at a profit but only recovers its variable costs. Power plants generating below the marginal cost are inframarginal power plants and the difference between the market price and the marginal costs is the profit which enables them to recover the fixed investment costs. Above the marginal costs, supramarginal power plants remain offline because they would generate electricity at a loss.
3.2. Heatwaves and Power Peaks
In July 2024, Southern Europe was hit by an intense and prolonged heatwave. In Croatia, daytime temperatures exceeded 30 °C and the peak tourist season exacerbated the already high electricity consumption. New record peak loads were set multiple times throughout the month, with an all-time record of 3381 MW occurring on 17 July 2024, at 19:30 h. Historically, peak loads in Croatia were recorded in the winter months [
53]. However, starting with 2015, peak loads became more frequent in the summer months. In the last 10 years (2015–2024), the maximum annual peak load occurred in the summer (July or August) on nine instances.
Figure 3 compares the daily peak load with the average daily temperature during the cooling season in Croatia, for 2015, 2019, and 2024. It can be seen that daily peak loads exhibit increasingly steeper trends over the years. In the short-term, this is a consequence of the increased demand for thermal comfort in the expanding residential and touristic sectors. In the long-term, this effect could be further aggravated by the impact of climate change, especially with longer and hotter summers.
For ambient temperatures between 10 °C and 20 °C, the difference in daily peak loads between 2024 and 2019 is negligible. However, for ambient temperatures below 10 °C, which corresponds to the heating season, daily peak loads are showing an increasing trend towards lower ambient temperatures, similar to what is seen in the cooling season. Future load profiles are obtained multiplying present load patterns with a load increment factor
Fp, which is a function of the average daily temperature, as follows:
The load increment factor Fp in Equation (13) is obtained by dividing the daily peak loads in 2024 with those from 2019, and for the same ambient temperatures. The load pattern obtained using Equations (12) and (13) corresponds to a near future scenario, say in 2030, when the load demand increases in the winter and summer months but remains unvaried in the intermediate seasons. For an average daily temperature of −10 °C or +35 °C, the load increase would be 14% in 2030, relative to 2024. Most certainly, this approach is crude and cannot capture the relationship between future load patterns and all the impacting factors. In addition to daily air temperature, future load patterns could be correlated to other weather variables (solar irradiation, air humidity, and wind speed), the day in the week, the socioeconomic activity, the population growth and urbanization rate, the electrification in the industry and transport, and climate policies and regulations. Nevertheless, the obtained load patterns can be considered as a stress test for the power system in Croatia, which will be exposed to hotter summer and the expanding building sector and will have to adapt to the increasing share of variable renewable energy.
3.3. Load and Electricity Generation in July 2024
Figure 4 shows the observed (historical) net power load and the net electricity generation by energy source in July 2024. The electricity demand is represented by the black curve, which shows significant daily fluctuations, with a smaller morning peak, lower demand during working hours, bigger peak in the evening hours, and lower demand at night. Throughout the week, demand is higher during weekdays (Monday–Friday) but lower during weekends (Saturday–Sunday). In July 2024, the weekend days were 6–7, 13–14, 20–21, and 27–28 July. Croatia experienced the heatwave over a two-week period, from 8–21 July, when the power load increased considerably due to higher electricity consumption for air conditioning and cooling. The maximum peak load and the overall historical record occurred at 19:30 on 17 July 2024, and was equal to 3381 MW.
From
Figure 4, it can be seen that nuclear energy (red band) provides a stable and constant output, acting as baseload energy source. Croatia uses half of the electricity from the jointly owned nuclear power plant at Krško, which has a net capacity of 696 MW. The coal-fired power plant (dark gray band) provides additional base generation and started operating on July 7 after a prolonged overhaul. Hydro run-of-river (dark-blue band) contributes additional baseload but is influenced by water availability. Hydro reservoir (blue band) and combined cycle gas turbine (CCGT) power plants (orange band) offer higher levels of flexibility and are used as baseload and peak generation units.
In the summer months, water availability is reduced, and hydro reservoir units are mostly used to mitigate the peak load in the evening hours, after production from solar PV ceases. The category of hydro reservoir includes production from the largest pumped hydro storage power plant in Croatia (RHE Velebit, +276 MW/−240 MW). Onshore wind (light-blue band) shows an intermittent contribution, dependent on wind availability. During the heatwave of July 8–21, production from onshore wind is reduced relative to the first and last weeks of July 2024. Biomass and other renewables (green and olive bands) contribute with a smaller but steady production profile, approximately 115 MW in total, improving the energy mix diversity. The solar PV category (yellow band) is expected to grow fast in the next years, thanks to simplified permitting procedures and faster grid connections. The gap between power load and electricity generation indicates the import-export electricity balance. At 19:30 h on July 17, a maximum instantaneous electricity import share of 35% was recorded (1185 MW out of 3381 MW). Croatia imported electricity from Slovenia and Hungary, which acted primarily as transit countries, while the necessary electricity was mostly generated in countries with large solar PV capacities further north (e.g., Austria and Germany). Renewable energy sources supplied 39.2% (1324 MW) of the demand. The remaining 872 MW (25.8%) was produced in non-renewable energy sources.
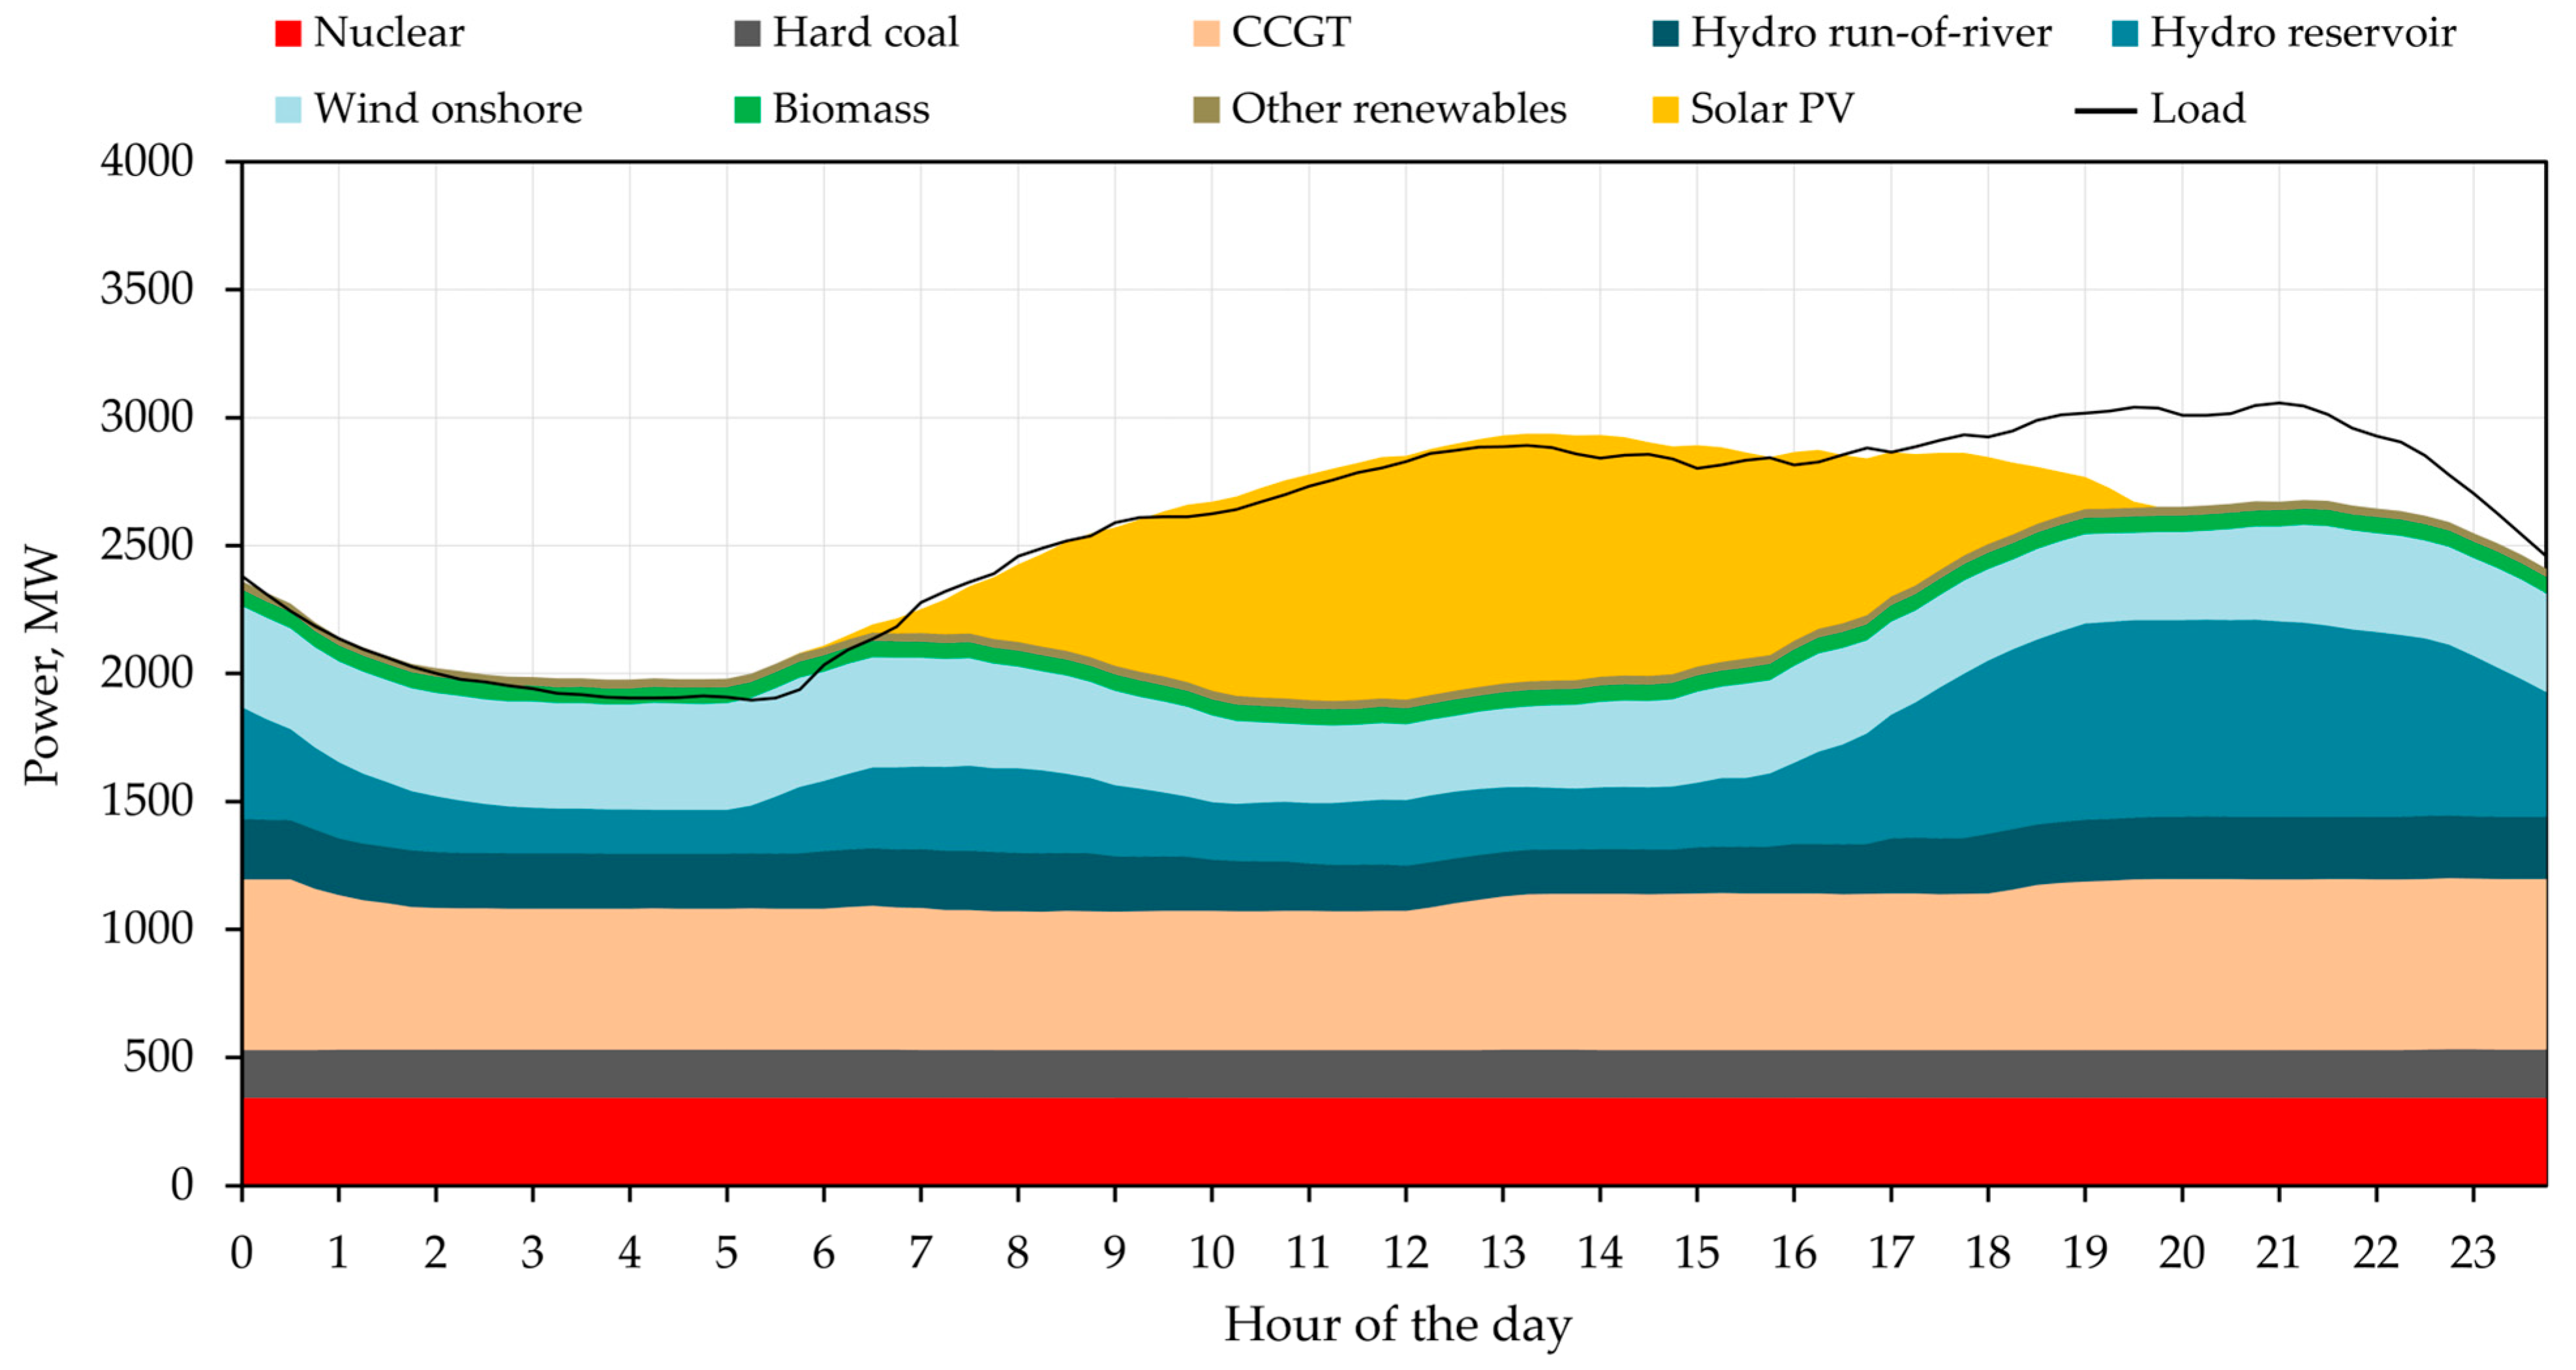
Figure 5 shows the observed hourly load profile and net electricity generation for the average day in July 2024. Domestic net electricity generation was consistently lower than the power load and the necessary demand was met by import electricity. The peak load of the average day in July 2024 occurred in the evening hours, between 19:00 and 21:00 h, with values close to 2900 MW. Net electricity generation from domestic power plants was between 1500 and 2000 MW. However, up to 1000 MW of the power load had to be imported, most of it during daytime and evening hours.
3.4. Load and Electricity Generation in July 2030
Figure 6 is the projected net power load and net electricity generation for July 2030 in Croatia. The onshore wind capacity increases from 1200 MW in 2024 to 1500 MW in 2030 while the solar PV capacity increases from 200 MW in 2024 to 1500 MW in 2030. Following the expansion of the solar PV sector, the foreseen ratio between wind and solar PV capacity is
Pwind/
Psolar = 1.0. The electricity generation from solar PV in
Figure 6 includes only utility-scale solar PV available to the public grid and excludes self-consumption.
The CCGT capacity increases from 550 MW to 700 MW, after the addition of a new unit at the EL-TO Zagreb power plant [
54]. The category of hydro reservoir will be expanded from 1700 MW to 2100 MW after the commissioning of the Senj 2 hydro power plant in 2028 [
55]. The categories of hydro run-of-river, biomass, other renewables, nuclear, and hard coal are assumed unvaried since no new projects or retirements are expected till 2030. The production profiles of dispatchable energy sources are optimized, aiming to minimize import electricity but respecting the renewable energy availability and the technical limitations of the individual power plants. The projected load patterns in
Figure 6 remain similar to the recorded patterns shown in
Figure 4. The maximum projected load in July 2030 is 3660 MW and represents an 8.3% increase over the 3381 MW in July 2024. The total electricity demand increases by 5.9%, from 1806 GWh in July 2024 to 1913 GWh in July 2030, as predicted by Equations (12) and (13).
Figure 7 shows how the expansion in the renewable energy sector could contribute to resolving the energy import dependency in the summer months. Solar PV production profiles fit well with the power load profile, especially in the morning and afternoon hours. However, solar PV production ceases at 19:30, while high demand persists till 23:00.
After 2030, the continued expansion of the solar PV sector will require additional dispatchable capacity, such as pumped hydro storage or battery energy storage systems. Surplus low-cost electricity generated during peak solar hours could be stored in pumped hydro facilities and dispatched later in the evening to meet demand. The analysis of the missing power generation in
Figure 7 indicates that approximately 2 GWh of short-term energy storage, assuming a discharge capacity of 400 MW over 5 h, would be required to cover most of the evening peak demands.
A future expansion of the Slovenian–Croatian jointly owned nuclear power plant at Krško is also being discussed [
56]. Investment costs are around 9000 €/kW, but nuclear energy is considered strategic to reduce the exposure to volatile fossil fuel prices, ensure long-term supply, and promote decarbonization in the power sector [
57].
Table 1 compares the installed capacity and the net electricity generation by energy sources in July 2024 and July 2030. By 2030, the generation from solar PV in the summer months becomes comparable to reservoir hydro and onshore wind. Solar PV increases from 27 GWh to 250 GWh and onshore wind increases from 191 GWh to 277 GWh, while hydro reservoir expands from 249 GWh to 287 GWh. In 2030, the 1500 MW of solar PV will generate 1879 GWh of electricity, while the 1500 MW of onshore wind will generate 3807 GWh. The renewable share of demand (
fRES) increases from 38.8% in July 2024 up to 54.7% in July 2030. On the annual level, electricity generation from renewable energy increases from 53.8% in 2024 up to 66.9% in 2030.
The increase in the renewable share is mostly attributed to the doubling of VRE electricity (fVRE): from 15.6% up to 30.3%. The increase in VRE generation is even more pronounced in the summer months: from 12.1% in July 2024 up to 28.4% in July 2030.
Non-renewable electricity generation (fnon-RES) increases slightly at the annual level, from 34.9% to 36.8%, but significantly more in the summer months, from 34.1% in July 2024 up to 43.7% in July 2030. This is caused by the increase in fossil fuel generation in the summer months when renewable energy availability (wind and hydro) is low. Between July 1 and August 31, and comparing 2024 to 2030, hard coal generation increases by 26% (from 224 GWh to 282 GWh), while CCGT generation increases by 77% (from 524 to 929 GWh). In the rest of the year (1 September–30 June), renewable energy availability is high and fossil fuel generation remains comparable. A slight increase of only 2% (from 2861 to 2921 GWh) between 2024 and 2030 has been estimated. Increasing generation from flexible and dispatchable CCGT will be necessary to accommodate the growing share of intermittent VRE sources in the electricity mix. Between 2024 and 2030, CCGT increases by 27% (from 2878 to 3654 GWh). On the other hand, baseload hard coal generation reduces by 35%, from 731 GWh in 2024 to 478 GWh in 2030.
Overall, the share of fossil fuel generation increases slightly at the annual level, from 19.7% in 2024 to 22.0% in 2030, but more significantly in the summer months, from 20% in July 2024 to 30.4% in July 2030. The net import dependency in July 2024 was 27.1% but it should decrease to only 1.6% by July 2030. The net import dependency of 11.3% in 2024 should change into a net export of 3.7% by 2030.
Although the share of fossil fuel generation increases, the carbon intensity of the power sector will reduce due to the relatively larger increase in renewable energy generation. In 2020, the carbon intensity for the power sector in Croatia was 293 g CO
2eq/kWh
el, while the renewable share was 47.1%. In 2024 the carbon intensity fell to 223 g CO
2eq/kWh
el, while the renewable share increased to 53.8%. By 2030, the carbon intensity for the power sector will further reduce as the renewable share of generation increases to 66.9%. Taking that the carbon emission factors (in g CO
2eq/kWh
el) are equal to 820 for coal, 490 for CCGT, 230 for biomass, 301 for reservoir hydro, 45 for solar PV, 38 for geothermal, 24 for run-of-river hydro, 12 for nuclear, and 11 for wind power [
58], the carbon intensity for the power sector will reduce to 197 g CO
2eq/kWh
e. Croatia’s last operational coal-fired power plant (TE Plomin 2) is scheduled to cease operations by 2035, further reducing the carbon intensity of the power sector.
The main contribution of this analysis lies in quantifying the benefits and challenges of increasing solar PV and wind integration, while also examining how they can be effectively balanced with dispatchable generation. The obtained results are specific to Croatia; however, they are a showcase for other EU countries facing hotter summers.
Extreme heatwaves in South Europe are found to lead to record-high electricity demand while simultaneously reducing wind power generation [
59]. Heatwave-driven power surges have also been recorded in China, the US, and India in the summer of 2024. Surges in electricity demand, driven by increased air conditioning use, were largely met by fossil fuel generation—mainly coal in China and India, and both coal and gas in the United States [
60]. This is exactly what the model forecasts for Croatia in 2030, and potentially for other Southern European countries, as electricity demand and summer temperatures are expected to increase in the coming years. Renewable energy alone will be unable to meet the full electricity demand during heatwaves, making an increase in fossil fuel generation inevitable. Improved resilience measures, such as energy storage, flexible generation, and better climate forecasting, will be essential to reduce the reliance on fossil fuels during heatwaves.
3.5. Renewable Energy Oversupply
The results presented in the previous sections have been obtained assuming a power system with a wind-to-solar capacity ratio of Pwind/Psolar = 1.0 by 2030, where the capacity of onshore wind and solar PV is 1500 MW each. Renewable energy targets for Croatia indicate a wind-to-solar capacity ratio of approximately 1.0 by 2030, with a declining trend thereafter as solar PV capacity is expected to outpace wind power. This capacity roughly matches the overnight baseload demand. In 2030, the baseload is estimated at 1465 MW, a slight increase over the baseload of 1446 MW recorded in 2024. In Croatia, sun and wind energy availability is such that solar PV achieves 1250 full load hours while onshore wind achieves 2500 full load hours on average per year. Thus, the annual electricity generation ratio would be Ewind/Esolar = 2.0 for a capacity ratio of Pwind/Psolar = 1.0.
Generally, power systems can be designed with different wind-to-solar PV ratios. In cooling dominant regions, higher solar PV capacity supplies more electricity in the summer period. In heating-dominant climates, increased wind capacity generates more electricity in the winter months [
61,
62]. The most recent ENTSO-E data for 2024 reveals that the
Ewind/
Esolar ratio is 2.9 in Portugal, 1.6 in Austria, 1.5 in Greece, 1.2 in Spain, and 0.8 in Italy. The corresponding wind-to-solar PV capacity ratios (
Pwind/
Psolar) are 2.0 in Portugal, 0.8 in Austria, 0.6 in Greece, 0.9 in Spain, and 0.3 in Italy. These ratios will continue to decrease in the next years as the installation rate of solar PV exceeds that of wind power.
Renewable energy oversupply occurs when the power generation from renewable sources exceeds demand, leading to the need for export, storage, or curtailment to maintain grid stability. Renewable energy curtailment is the intentional reduction or shutdown of renewable electricity generation, often performed to maintain grid stability (technical curtailment) or to alleviate negative price scenarios (economic curtailment) [
63]. In solar-heavy power systems, oversupply may occur during daytime hours of summer months, while in wind-heavy systems, oversupply may occur during nighttime hours of shoulder months when power demand is low.
Redispatch and curtailment are not directly modeled in the present study; rather, renewable energy oversupply is evaluated. Data about technical and economic constraints which affect redispatch and curtailment are often proprietary and not publicly disclosed by Transmission System Operators.
Figure 8 shows the percentage of renewable energy oversupply as function of the wind-to-solar PV capacity ratio. In a power system with 1500 MW of solar PV and 1500 MW of onshore wind, the renewable energy oversupply is 5.3% at the annual level. Typically, between 50 and 80% of renewable energy oversupply may be curtailed if no energy storage or export options are available [
64,
65], which would return a curtailment rate between 2.7% and 4.2% in Croatia. Renewable oversupply is lowest in the summer (3.3%) and highest in the spring and autumn (7.0%). Renewable energy oversupply becomes particularly pronounced when solar PV capacity exceeds wind capacity (
Pwind/
Psolar < 1.0) and when the wind capacity exceeds the baseload demand (
Pwind > 1500 MW).
Countries with large shares of variable renewable generation face high percentages of renewable curtailment. Renewable curtailment can reach up to 12% in island systems such as Cyprus and Ireland, while it typically remains below 5% across the European continent [
66,
67]. In 2023, Germany curtailed 19 TWh of renewable energy due to grid congestions and redispatch, representing 4% of the total annual electricity generation (482 TWh) [
68]. Spain curtailed about 2% of the annual electricity generation in 2024, mostly in areas where the growth of solar PV outpaced the transmission capacity.
3.6. Electricity Prices
Generally, larger shares of variable renewable energy in the demand (
fVRE) lead to lower electricity prices, especially when coupled with low fossil fuel generation [
68]. This is a direct consequence of the European electricity marked design, which is based on marginal costs and the merit order principle.
Figure 9 and
Figure 10 show the relationship between day-ahead electricity prices in Croatia to the shares of fossil fuel (
ffossil) and variable renewable energy (
fVRE) generation in the EU-27, during 2024.
Electricity prices in Croatia increase with the share of fossil fuel generation but decrease with the share of variable renewable energy generation. In 2024, wind and solar PV generation was very low on several instances, when dark and windless weather conditions engulfed the European continent, causing tight electricity supply. These events are called
Dunkelflaute in the German language and are characterized by large-scale high-pressure weather systems and very dense cloud cover [
69,
70]. Most recently, the
Dunkelflaute event occurred on 5–7 November and 11–12 December 2024.
Generally, the Dunkelflaute event lasts only a few hours; however it is accompanied by tightening electricity supply and distinct spikes in electricity prices. In Croatia, electricity prices exceeded 600 €/MWh for a total of 14 h during the Dunkelflaute. During the heatwave of July 2024, wind and solar PV generation were average in Croatia; however high cooling demand drove electricity prices between 300 and 600 €/MWh for a total of 31 h. High electricity prices are a signal that flexible generators and consumers should be promoted, along with improved interconnections between market areas. Low-carbon dispatchable capacity and long-term storage systems should be developed to effectively manage heatwaves and Dunkelflaute events.
When wind and solar PV generation is high (
fVRE ≥ 50%) and fossil fuel generation is low (
ffossil < 15%), electricity prices are low and can even drop below zero. Negative electricity prices are driven by the rapid expansion of renewable energy, especially solar PV and wind, coupled with limited grid flexibility and insufficient storage capacity. It happens because inflexible generators choose to continue producing at negative prices rather than ramp down and restart at a later hour. Negative electricity prices typically occur in the afternoon hours of summer months when energy demand is low, but solar PV generation is very high, and occasionally at night during winter months due to high wind output. In recent years, the frequency of negative electricity prices has increased, and these periods have also prolonged [
71].
As shown in
Figure 10, electricity prices during nighttime hours (22:01–7:00) are more stable than daytime prices. Furthermore, nighttime prices are better correlated to the share of fossil fuel generation. Generally, the supply side matches better the demand side, overnight, and baseload power plants operate without excessive oscillations from VRE supply. Electricity prices range between 0 and 200 €/MWh for most of the time, but electricity prices below 50 €/MWh occur exclusively when the share of VRE is
fVRE ≥ 20%.
4. Conclusions
This study focuses on the consequences of the July 2024 heatwave on the Croatia’s power system and replays the conditions to determine how the future expansion in renewable energy could mitigate the problem in July 2030. The findings reveal a critical vulnerability in the present state: during peak demand events, such as the July 2024 heatwave, Croatia imports up to 35% of the electricity demand, contributing to price surges exceeding 300 €/MWh. The analysis foresees that by 2030, expansions in solar PV, wind, and hydro could reduce electricity imports from 27.1% to 1.6% in the summer. With favorable renewable energy availability, Croatia has the potential to become a net electricity exporter on an annual basis.
The projected increase in solar PV capacity, from 200 MW to 1500 MW, and of onshore wind, from 1200 MW to 1500 MW, will increase the share of VRE generation from 15.6% in 2024 to 30.3% in 2030. Import energy dependency will be reduced; however flexible dispatchable generation will become critical, particularly CCGT, for compensating renewable energy intermittency. The simulation results indicate that the overall fossil fuel generation will increase only slightly on an annual basis, from 19.7% in 2024 to 22.0% in 2030. CCGT generation will increase by 27%, while hard coal generation will reduce by 35%, over the same period. However, fossil fuel generation is projected to increase by 62% during the summer months, particularly in July and August, to compensate for the low availability of renewable energy and to meet the elevated demand for cooling energy.
Beyond 2030, further reductions of non-renewable generation will be possible with higher penetration of renewable energy, particularly onshore wind and solar PV. This approach will inevitably lead to increasing renewable energy oversupply. The present analysis assumes a wind-to-solar PV capacity ratio of 1.0. In the Croatian power system with balanced wind and solar PV capacity, 1500 MW each, the renewable energy oversupply ranges between 3.3% in the summer and 7.0% in spring and autumn, with a year-round average of 5.3%. Renewable energy oversupply increases steeply when solar PV capacity exceeds wind capacity (Pwind/Psolar < 1.0) and when their individual capacities exceed the baseload demand in Croatia (~1500 MW). This underscores the importance of investing in energy storage systems which would manage peak loads and renewable oversupply. Approximately 2 GWh of short-term energy storage (400 MW of discharge capacity over 5 h duration) could manage evening peak demands during summer heatwaves.
Future research should aim to improve the power system model by addressing the limitations listed in
Section 2. The limitations include, but are not limited to, real-world uncertainties such as power plant outages, transmission grid contingencies, fuel price fluctuations, generation redispatch, and renewable energy curtailment. The model could be expanded to neighboring countries, and possibly to the entire EU-27 to generate better predictions of the future performance of Croatia’s power system.
Energy storage systems, such as pumped hydro, batteries, and green hydrogen, could be integrated into the model to enable a more accurate assessment of future power systems with high shares of VRE generation. Future research could also include climate models and machine learning tools to improve the forecast accuracy of future power loads.


