1. Introduction
Blasting is the most efficient and commonly used method for mineral resource extraction, especially in open-pit mining [
1]. The rock fragmentation size after blasting is a key indicator for evaluating blasting performance and provides a basis for designing blasting schemes [
2,
3]. The distribution of rock fragment size after blasting significantly affects subsequent mineral processing [
4]. Optimizing the blasting design to reduce the energy consumption in the subsequent crushing and grinding stage is an important topic in the blasting field, making accurate identification of post-blast rock size increasingly critical [
5,
6]. Traditional methods for identifying rock fragment size include manual sieving, laser scanning, and image recognition based on computer vision [
7,
8]. Manual sieving is labor-intensive and inefficient, while laser scanning effectively addresses these issues but is relatively costly [
9]. Compared to laser scanning, image recognition technology offers lower accuracy but significantly reduced costs [
10]. With the rapid development of computer vision and deep learning algorithms, image-based recognition techniques have been widely adopted in rock fragmentation studies, improving the accuracy limitations of traditional methods [
11]. Current blast fragmentation recognition mainly focuses on achieving mask segmentation of rocks and obtaining their actual sizes [
12].
Karimpouli et al. [
13] encoded images using CNN and enhanced the segmentation of digital rock images with a convolutional autoencoder algorithm. Experimental results showed that compared with traditional multi-threshold segmentation, the segmentation results obtained by this method were more accurate and reliable. To compare the performance of different CNN models in rock segmentation, Varfolomeev et al. [
14] studied the application of three popular CNN architectures in the segmentation of 3D micro-tomography images of various rock samples and found that the trained models exhibited high generalization capabilities. Liu et al. [
15] proposed an image segmentation method, UR, based on deep learning U-Net and Res Unet networks. A comparison with existing image segmentation methods demonstrated the efficiency and accuracy of the newly proposed UR method. Zhang et al. [
16] proposed a complex ore image segmentation algorithm based on template transformation and reconstruction, demonstrating the accuracy of the proposed algorithm in segmenting complex images. The above study achieved accurate segmentation of rock fragment masks. These segmentation models typically rely on high-quality data and require high computational costs. However, in scenarios such as ore transportation, which require object recognition, localization, and rapid response, the single forward propagation and lightweight architecture of YOLOv8 are better suited to the mining environment. Therefore, YOLOv8 was selected as the primary model for mask segmentation in this study.
Rock particle size is typically measured either manually or with the aid of reference objects. Manual measurement is inefficient and labor-intensive. Although reference-assisted methods improve efficiency and reduce costs, they sacrifice accuracy and therefore fail to fundamentally resolve the issue. Camera vision measurement utilizes machine vision principles to capture object dimensions, offering a solution to traditional recognition problems [
17]. The current mainstream camera-based visual measurement methods are divided into monocular and binocular vision. Monocular vision requires the use of a reference object to obtain the actual size of rock fragments and demands that the camera and target remain relatively stationary. Currently, most fragmentation recognition methods use monocular cameras to capture multiple images of blast piles with reference objects for analysis. This approach cannot achieve intelligent fragmentation recognition [
18,
19]. Therefore, this study adopts binocular vision to calculate post-blast rock particle size. This method calculates disparity from different viewpoints to directly obtain depth information, which is then used to determine fragment sizes. The application of binocular measurement technology can effectively advance the process of intelligent fragmentation recognition.
In summary, this study employs YOLOv8 and binocular vision technology for blasting fragment size recognition, establishing a recognition method based on YOLOv8 and binocular vision, which is applied to the Husab Uranium Mine in Namibia. YOLOv8 is used for accurate rock detection and mask segmentation, and a series of machine learning algorithms are integrated to achieve high-precision size recognition, followed by computing actual rock dimensions using binocular vision. This method not only improves the automation of blasting fragment recognition but also maintains high recognition accuracy under complex environmental conditions, supporting blasting evaluation and production optimization. Compared to existing methods, this study integrates binocular vision with YOLOV8 for high-precision fragment distribution recognition during haul truck transportation, offering a new path toward intelligent and automated blasting in mining.
2. Materials and Methods
2.1. Samples and Equipment
Blasting is a highly efficient technique employed in open-pit mining and underground tunnel construction [
20,
21]. The purpose of blasting is to break intact rock into smaller fragments to facilitate resource extraction and engineering construction [
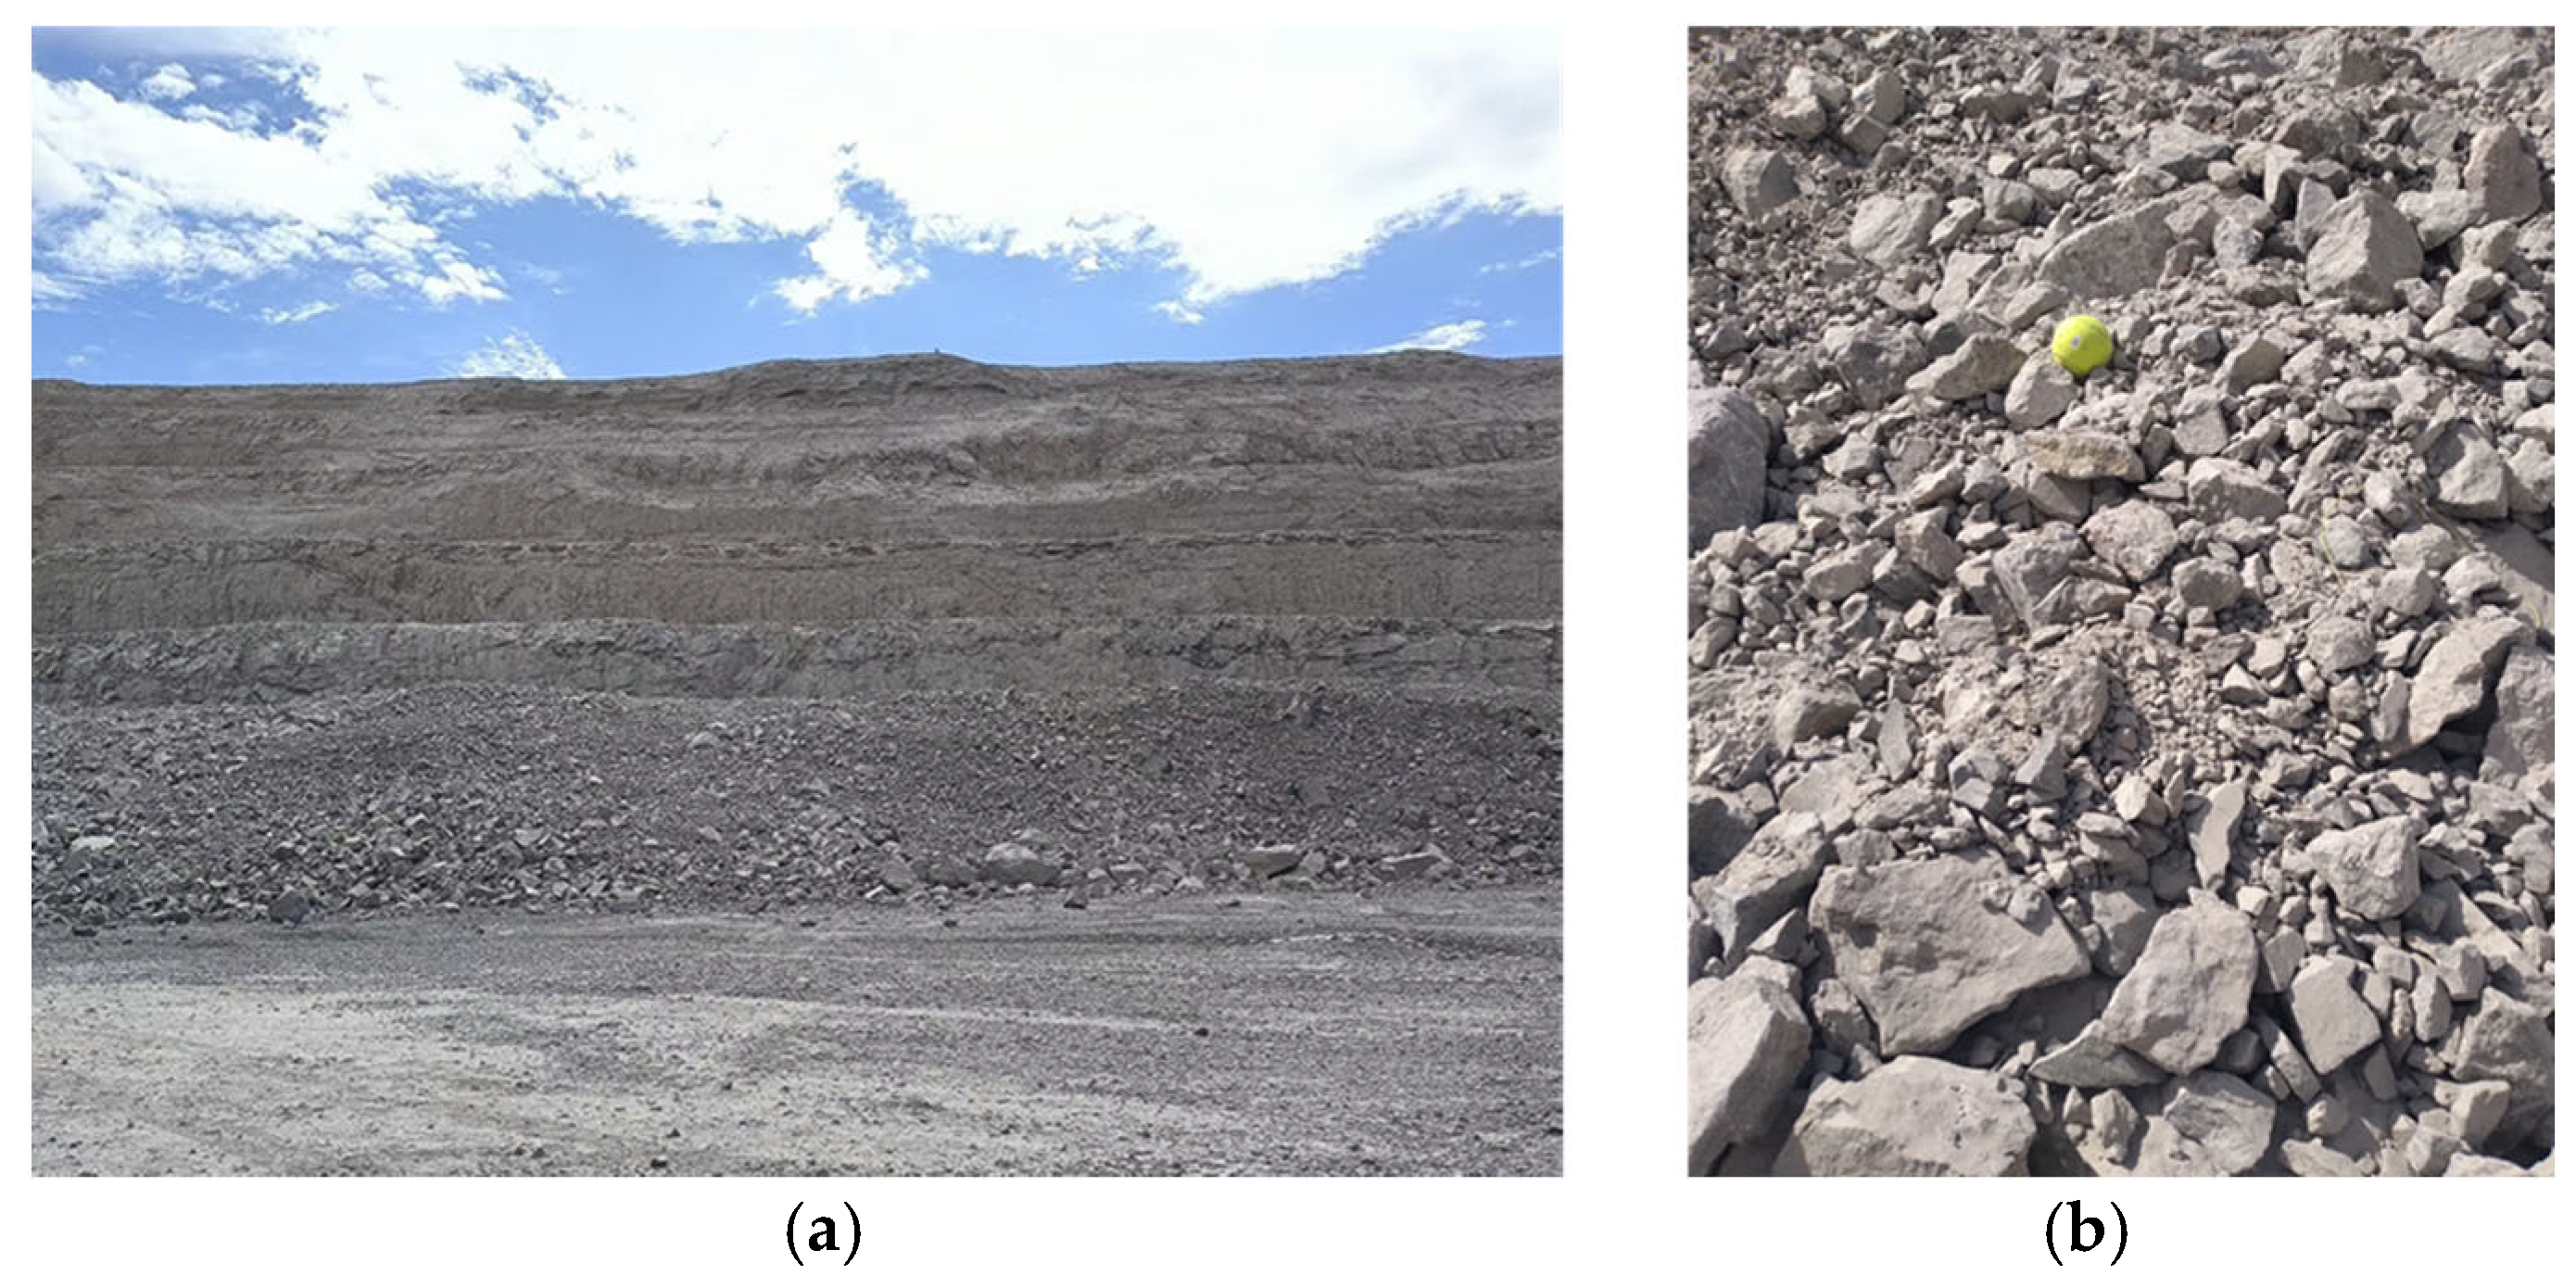
22]. If the fragmentation size after blasting does not meet the requirements, secondary breakage is needed, which affects ore transportation efficiency, increases engineering costs, and reduces production efficiency. Blast fragmentation refers to the volume and size of rock fragments after the blasting operation. Blast fragmentation is a key indicator for evaluating blasting effectiveness, reflecting the degree of rock breakage during the operation. Rock fragments are considered to meet blasting requirements when their size ranges from 0 to 0.5 m. If the fragment size reaches 1.0–1.2 m, it is classified as large rock, and fragments exceeding 1.2 m require secondary breakage. Rapid assessment of blast fragmentation is crucial for optimizing blasting design, evaluating blasting performance, and reducing construction costs.
Figure 1 shows an on-site photograph taken during blasting at the Husab open-pit uranium mine in Namibia.
Existing rock blast fragmentation evaluation techniques are mainly divided into traditional measurement methods and image analysis techniques. In traditional methods, the sieving method and the large-block measurement method are two typical objective measurement approaches. However, their application suffers from low operational efficiency, long cycles, limited sample coverage, high resource consumption, and cost pressure. The sieving method requires transporting blasted rock fragments to a fixed location for mechanical grading, involving extensive material handling and classification operations, making rapid detection in large-scale projects difficult and time-consuming. Although the large-block measurement method conducts a preliminary assessment by manually counting large rock fragments on the surface, it has a limited sample collection range and relies on subjective judgment, making the overall efficiency susceptible to human factors. Traditionally, manual methods involve outlining rock fragments in blast photos by hand and calculating the number of grid squares used to determine fragment sizes. Nowadays, computer-aided methods using image recognition to calculate fragment sizes save significant time and provide valuable and efficient data support for engineering projects. Computer vision-based methods overcome the drawbacks of traditional measurement techniques and have become a research hotspot in intelligent blasting and smart mining production in recent years.
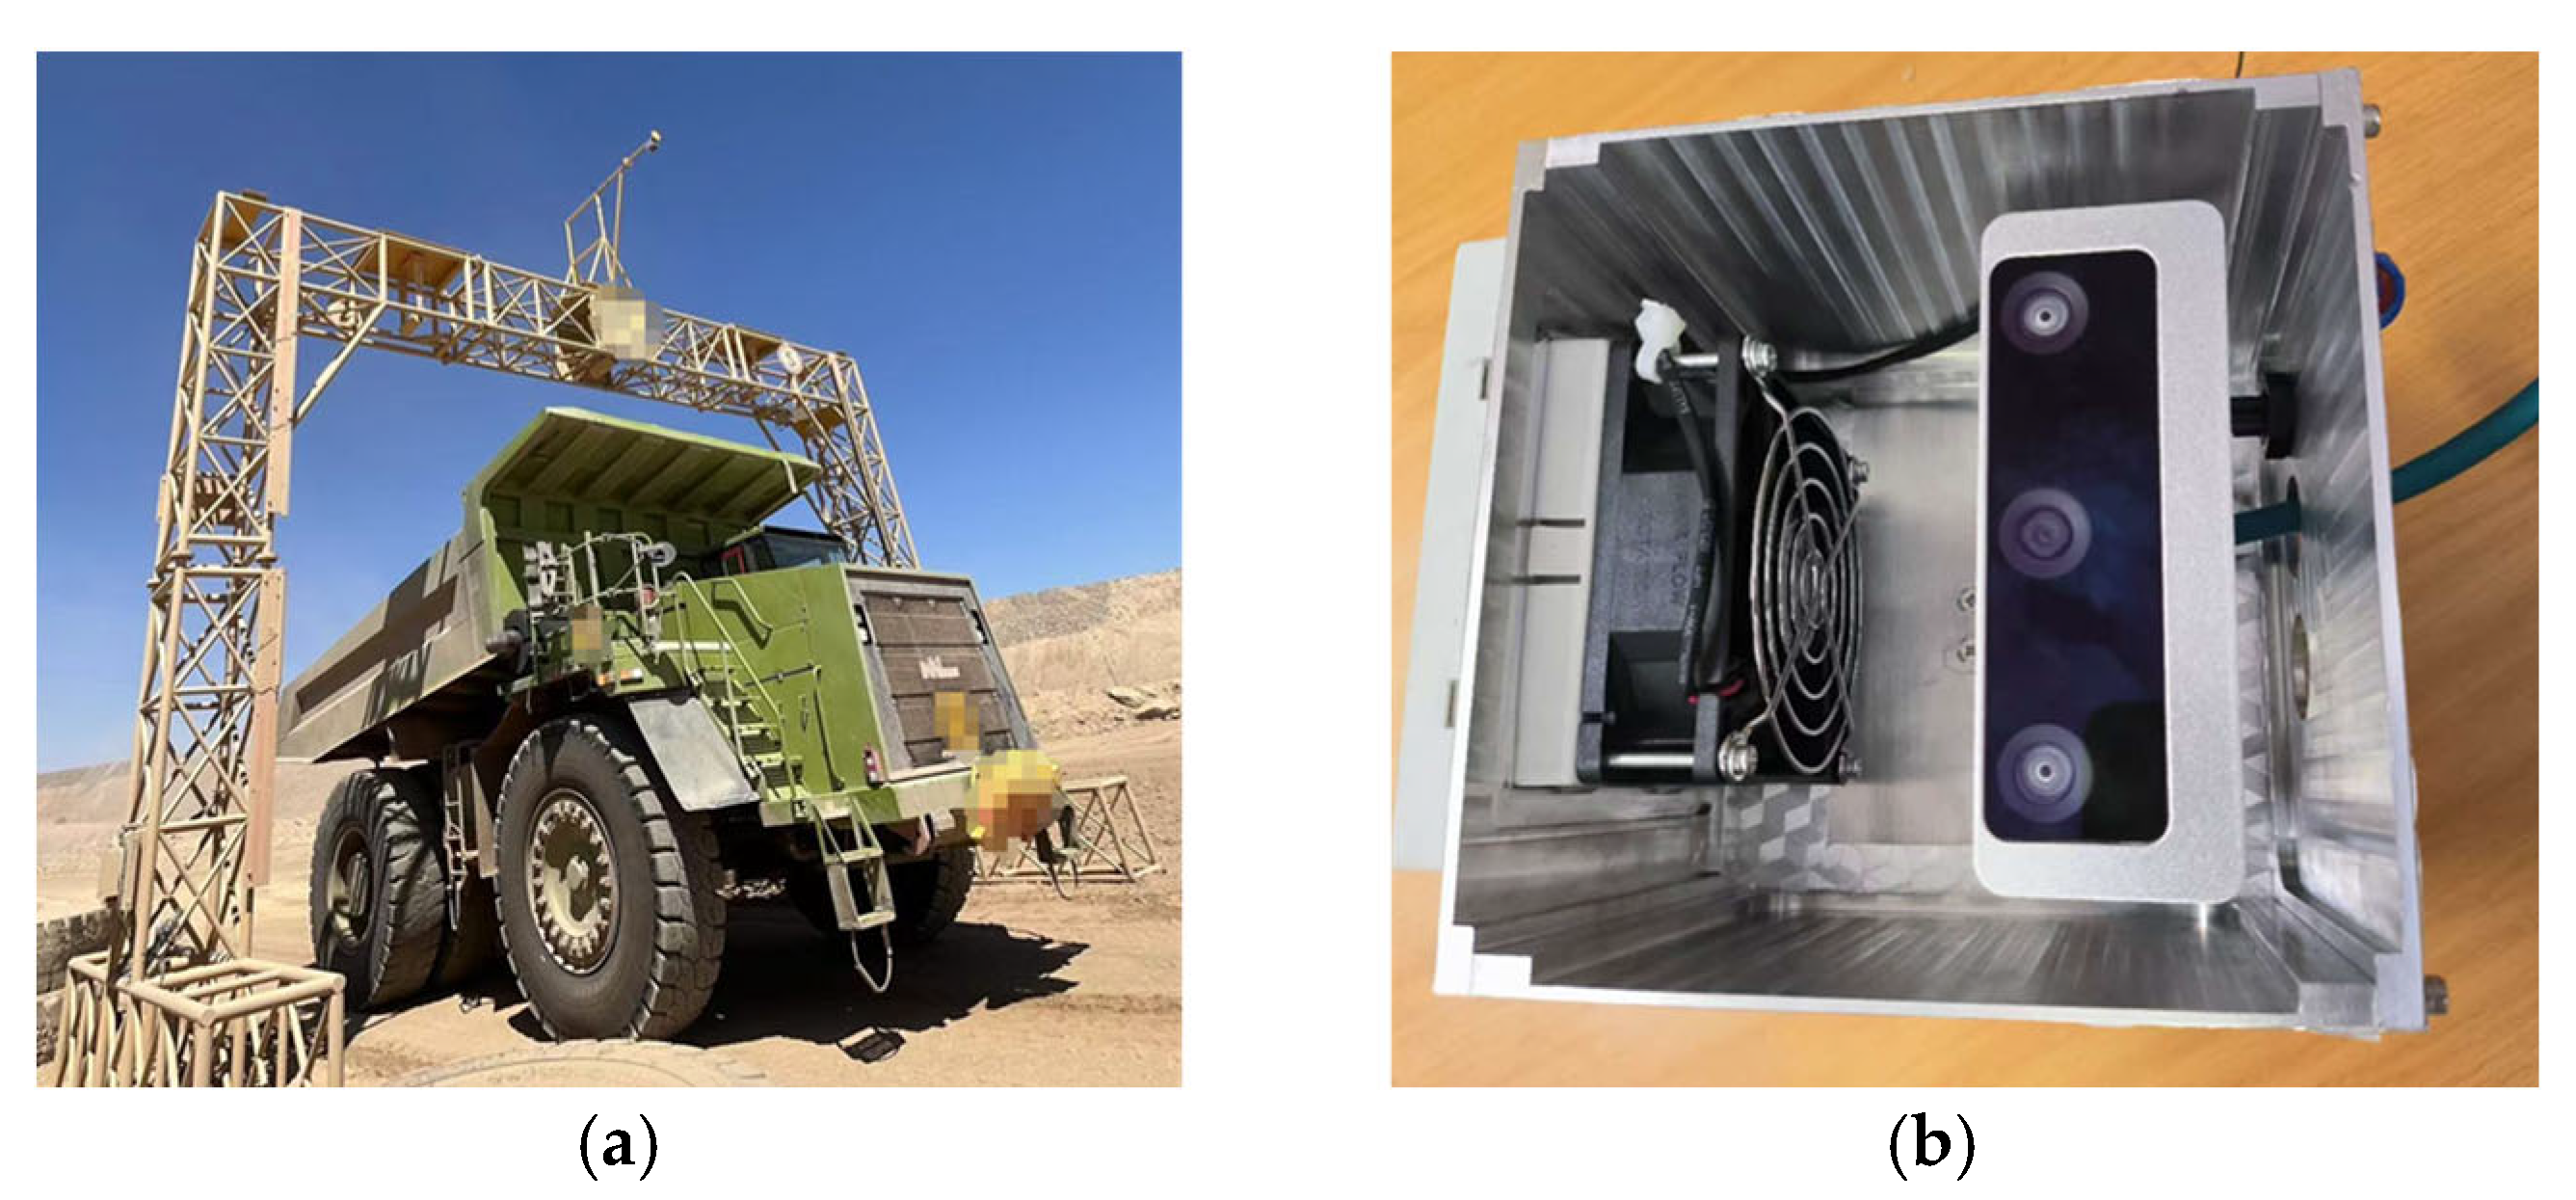
This study proposes using digital photography technology to extract rock fragmentation images for accurate size identification and analysis. The primary equipment used includes the OAK-D-W-PoE binocular camera and an industrial computer. The OAK-D-W-PoE binocular camera is a smart network IP camera with depth vision, primarily responsible for capturing images. The OAK-D-W-PoE features three onboard cameras (one 4 K/30 fps color camera and two black-and-white binocular cameras) and an inertial measurement unit (IMU), with an IP65 industrial-grade waterproof rating, suitable for indoor and outdoor use. Additionally, it features a PoE interface (802.3af power over Ethernet and Gigabit Ethernet). The camera’s specifications are shown in
Table 1.
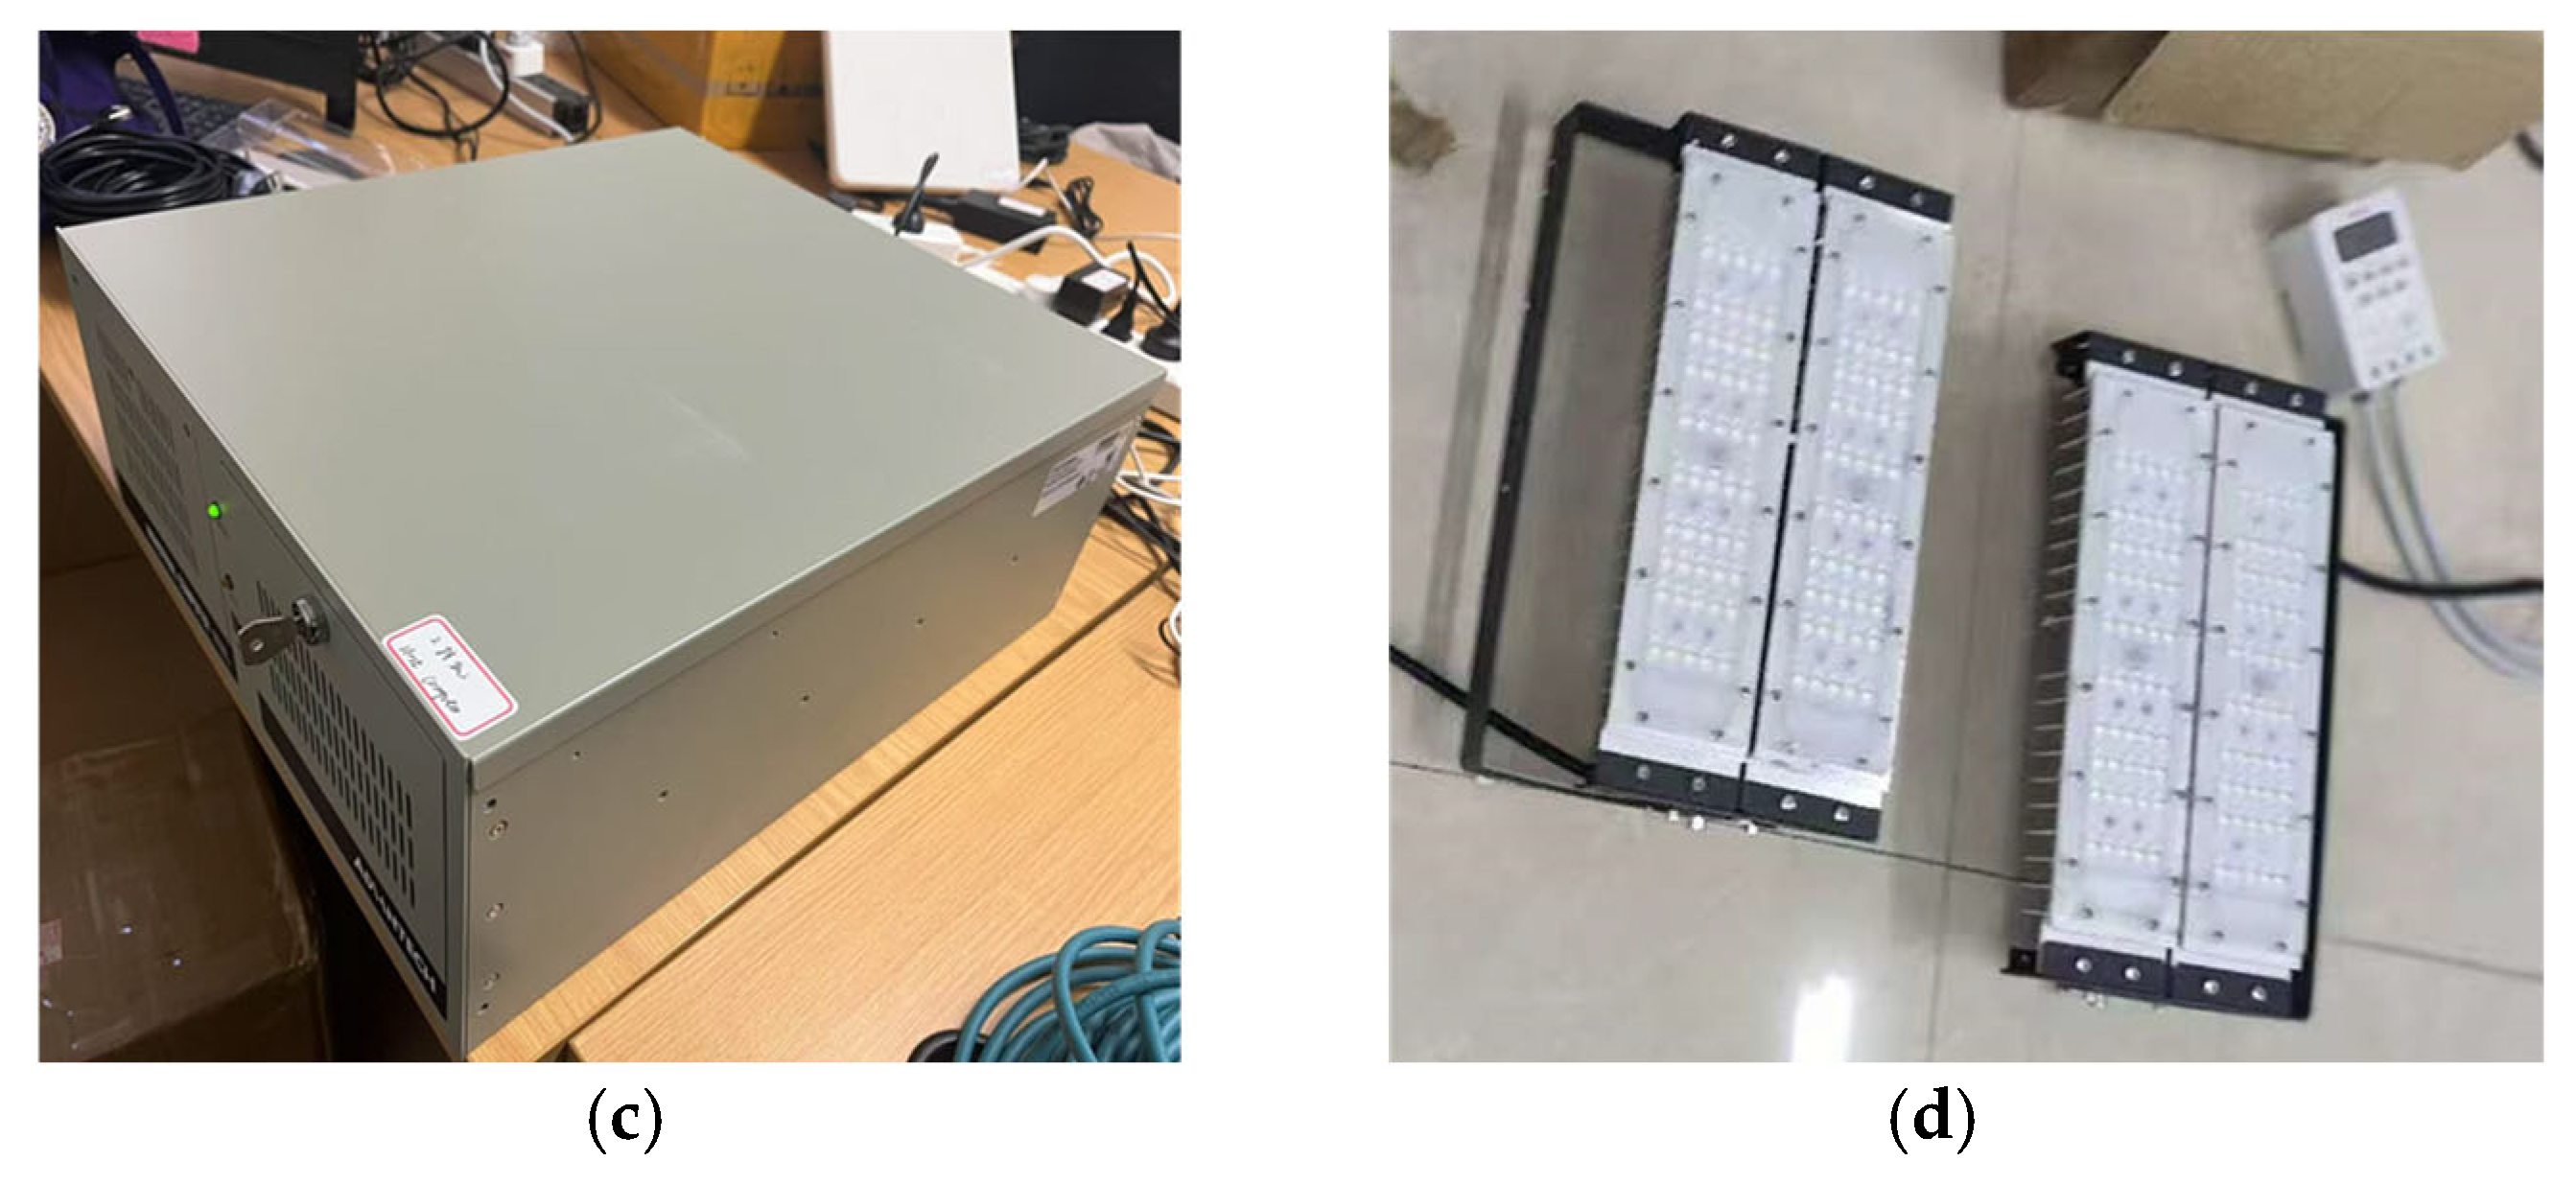
The industrial computer is responsible for recognizing and processing images captured on-site, enabling intelligent analysis of post-blast rock fragmentation. The industrial computer is equipped with a powerful CPU and GPU module and features shockproof, dustproof, and waterproof designs, making it suitable for prolonged operation in harsh environments such as mines and open-pit sites. It supports all-weather operation, ensuring the blast fragmentation recognition system can process and analyze data in real time continuously. When capturing each image, the binocular camera is fixed on a gantry scanning station, and the necessary equipment for fragmentation analysis is shown in
Figure 2. The camera lens is parallel to the horizontal plane, utilizing automatic zoom and exposure, with depth variation triggering image capture. When an ore transport truck passes through the gantry scanning station, the camera’s central depth variation triggers continuous image capture, as shown in
Figure 3.
2.2. Binocular Vision Measurement
To obtain the actual fragmentation size of rocks in the image, it is first necessary to acquire the depth information of all pixels in the image. A monocular camera cannot provide depth information, whereas a binocular camera can capture depth data. A binocular camera analyzes image pairs captured by the left and right cameras to determine the disparity between corresponding points of the same object in both image planes [
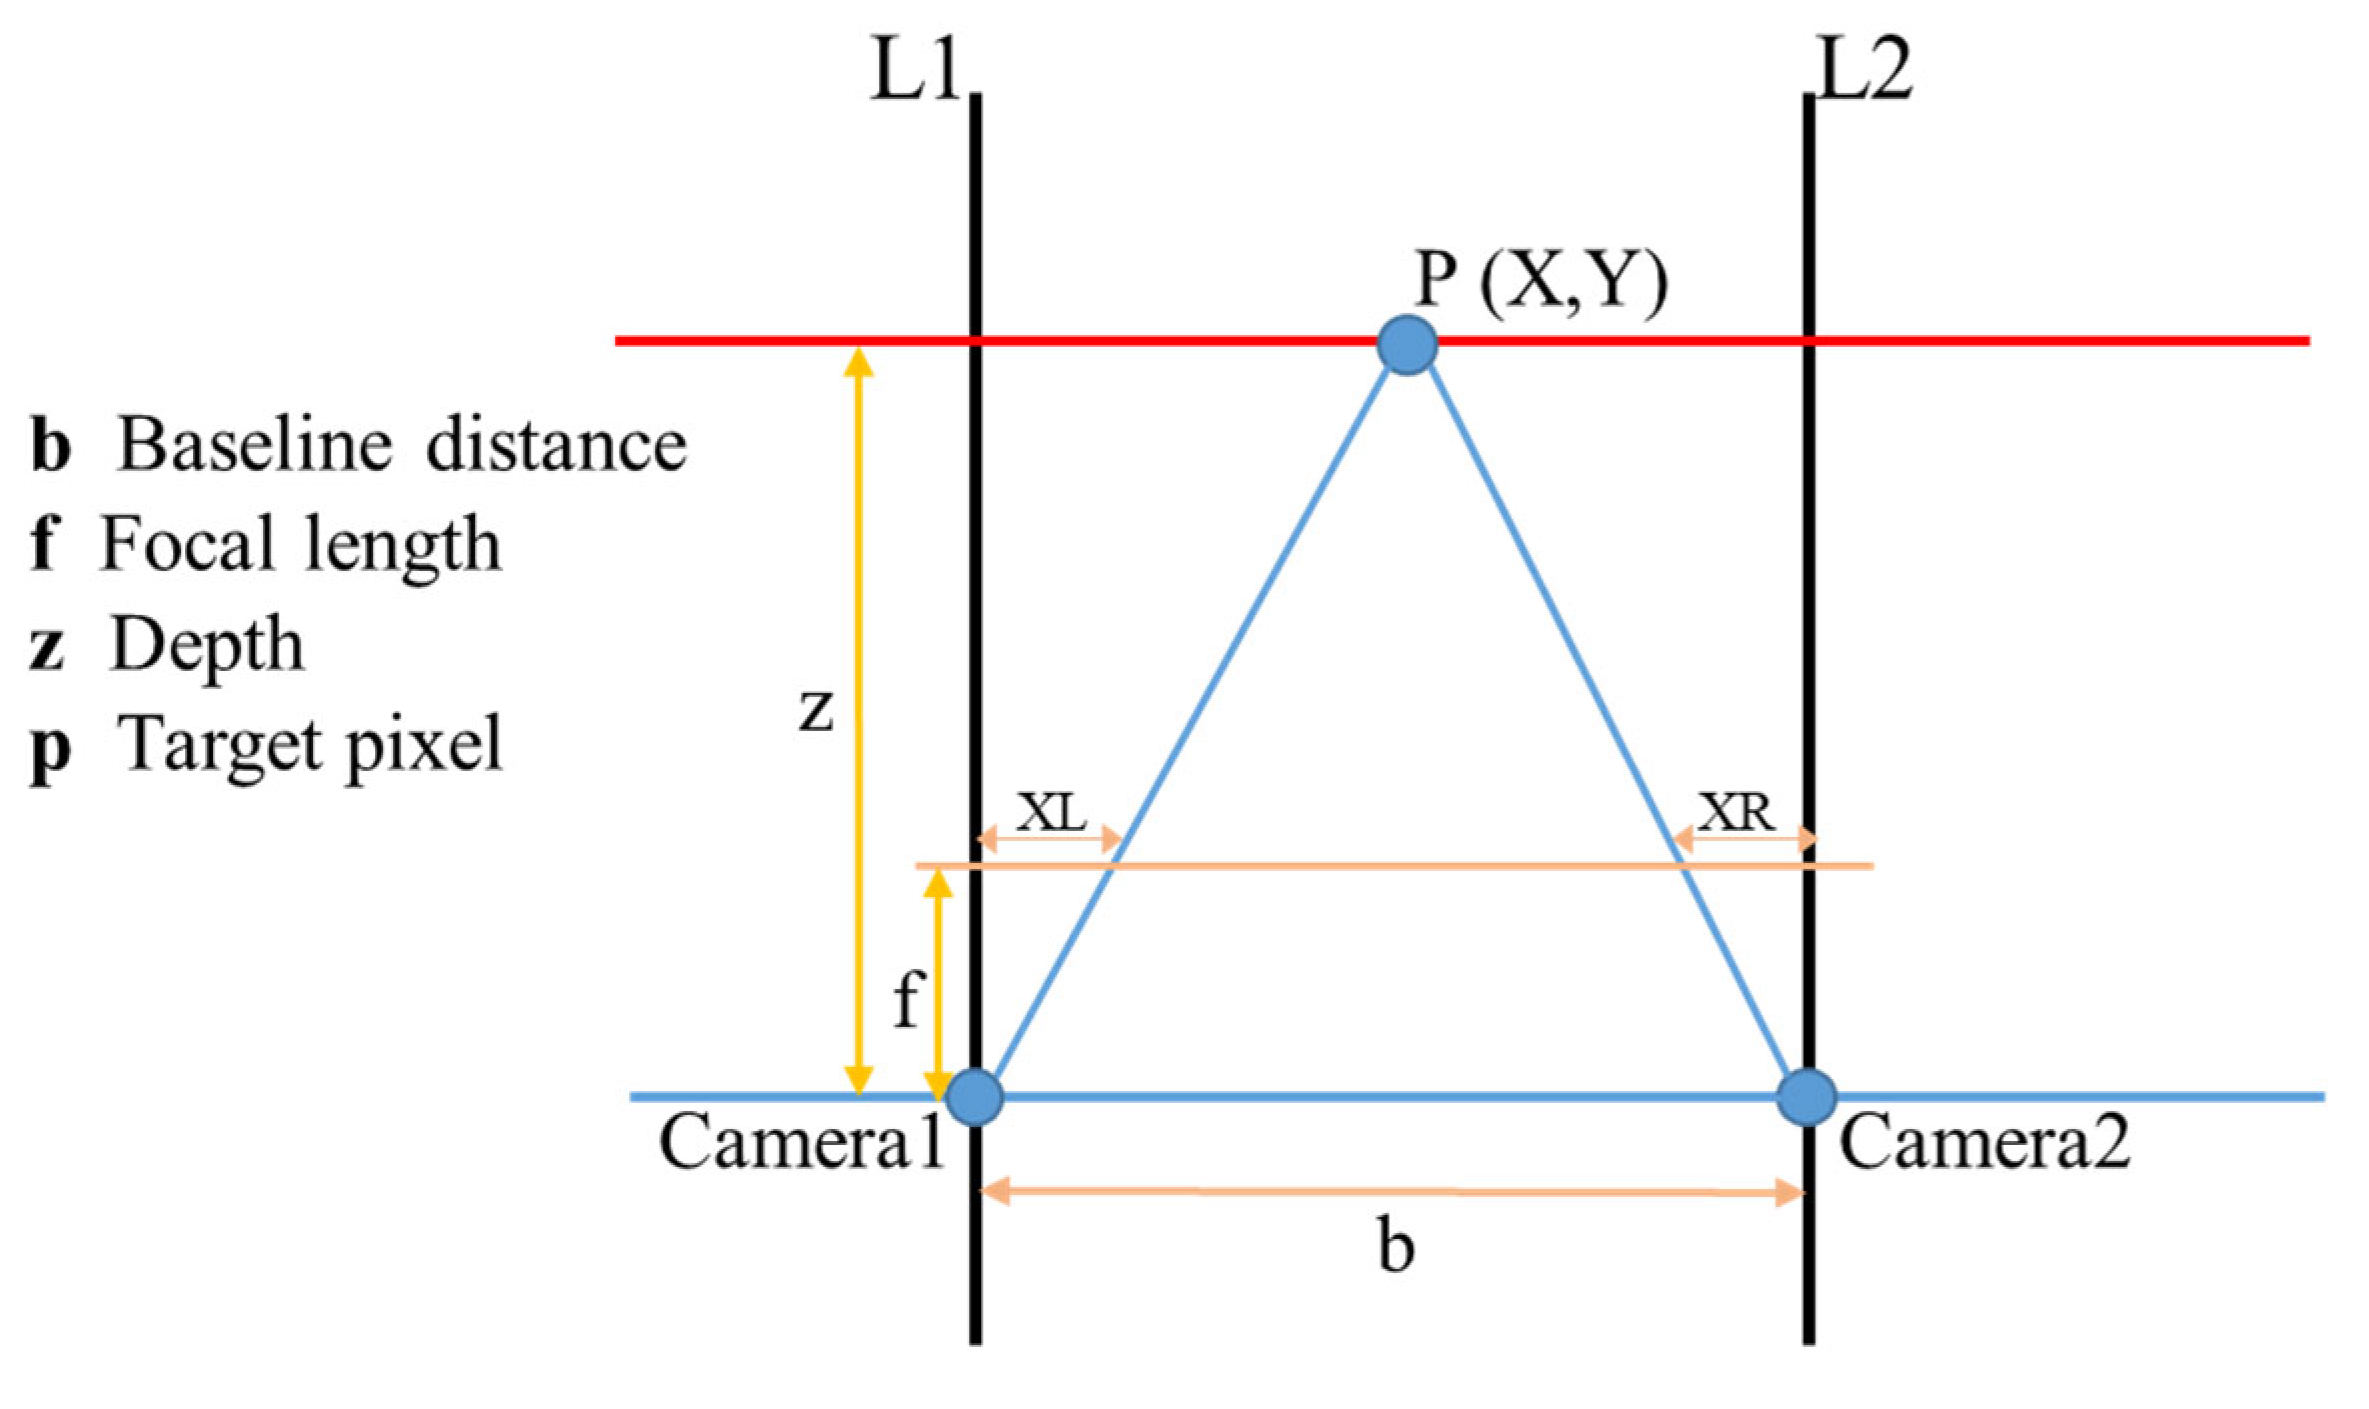
23]. Then, using the baseline distance between the two cameras and the intrinsic parameter matrix, it converts the disparity into depth information. The model for obtaining depth information using a binocular camera is shown in
Figure 4. In this study, the binocular camera was calibrated to minimize calibration errors between the two lenses during use. After acquiring the depth information, the actual 3D coordinates of each pixel need to be determined based on the depth data.
Camera1 and Camera2 represent the center points of the left and right lenses of the binocular camera, and f is the focal length of both lenses. Starting from C1 and C2, vector lines perpendicular to the horizontal plane are drawn pointing towards the captured image, serving as reference lines (parallel lines) for the OAK-D-Pro-W-Poe optical axis direction. If the two black lines shown in
Figure 4 represent the left and right imaging planes of the binocular camera (with equal length along the
x-axis), the imaging point formed by P represents the actual spatial positions of the pixel points, which in the left and right imaging planes of the binocular camera are P1 and P2, respectively. If the distance between Camera1 and Camera2 is b, then the left boundary of the binocular camera’s left and right imaging planes is the
x-axis origin. The right direction is defined as the positive
x-axis, with P1 and P2 having x coordinates
XL and
XR on the left and right imaging planes, respectively. The disparity is
XL −
XR. Therefore, based on these considerations, to obtain the depth
Z of the pixel point obtained by the binocular camera (i.e., the distance between the pixel point P and the plane formed by Camera1 and Camera2), a geometric distribution is formed between the triangle formed by P, P1, and P2 and the triangle formed by P, Camera1, and Camera2. The Formula (1) is then derived based on the principle of similar triangles.
The calculation formula for the 3D coordinates is obtained from Equation (1) as follows:
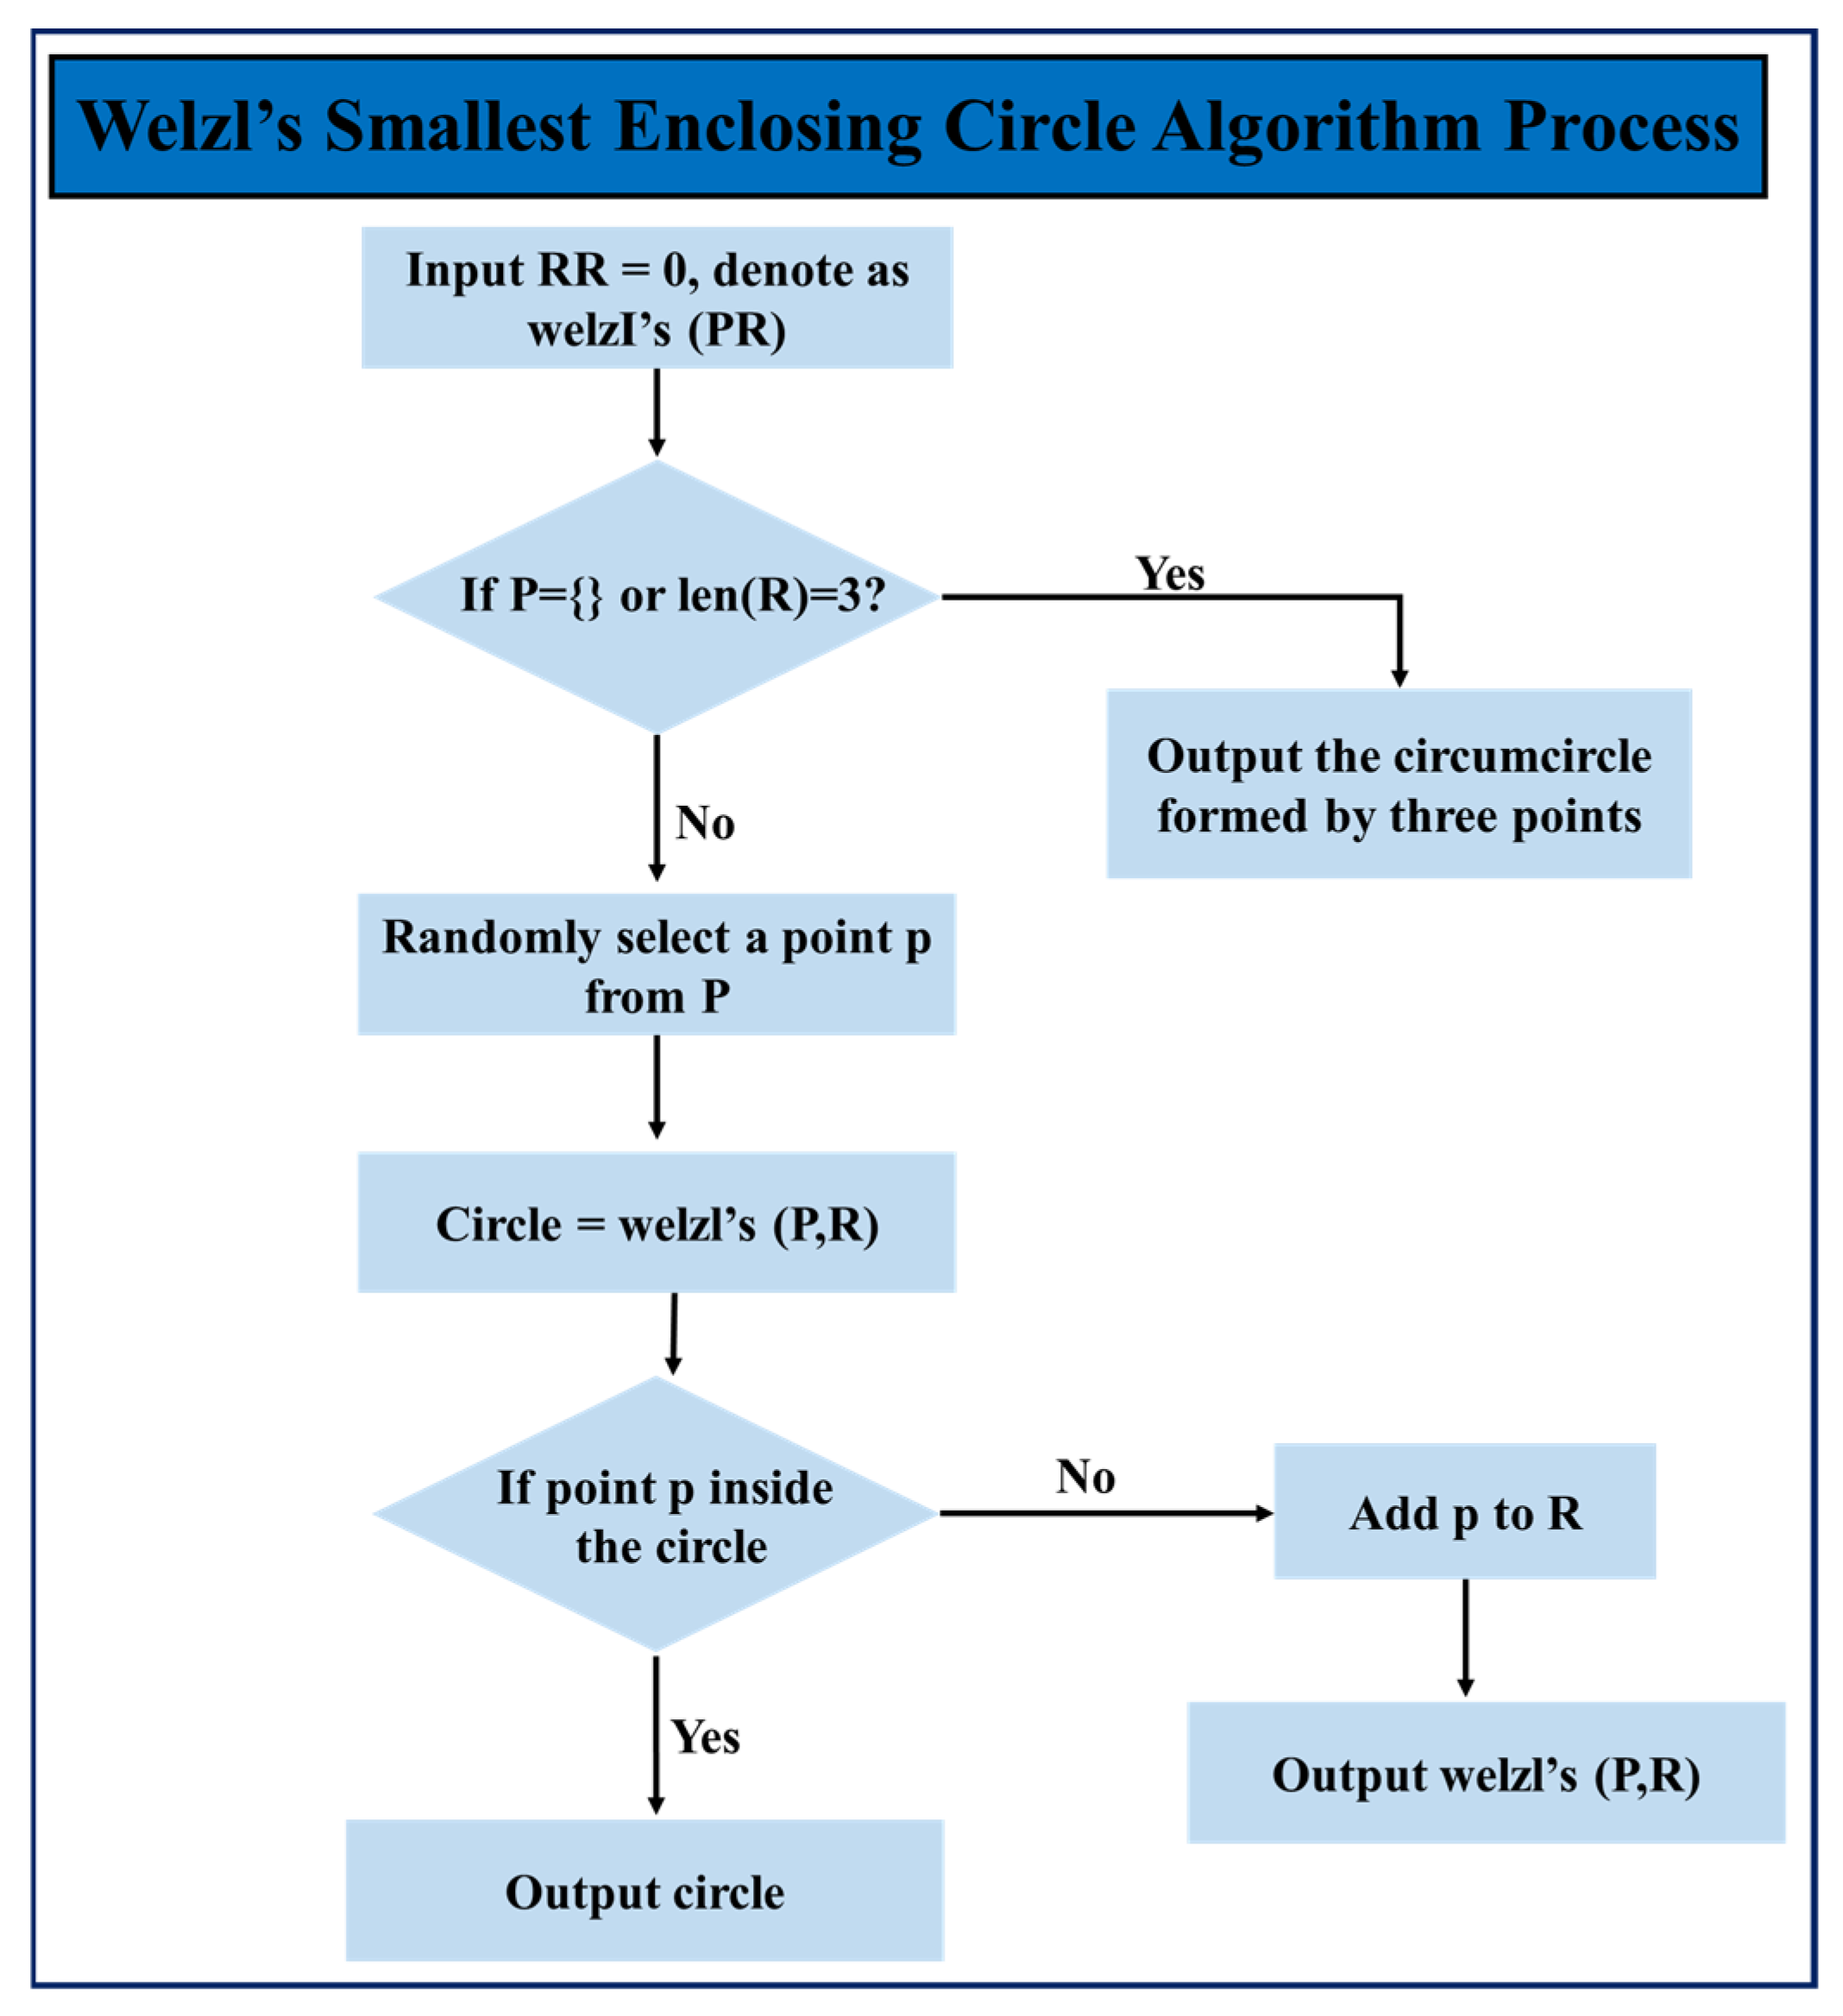
Based on the depth information and 3D coordinates of each pixel in the image, the actual particle size of all rock fragments in the image can be calculated. The actual particle size of the fragments is represented by the diameter of the minimum bounding circle that can completely enclose the rock fragments. For each stone mask identified by the model, the diameter of its minimum bounding circle is calculated. The calculation method uses Welzl’s algorithm. The basic idea of the algorithm is to recursively select points to construct the bounding circle and minimize the radius of the circle while ensuring that all points are enclosed within the circle [
24]. The process is shown in
Figure 5. Let P be the set of all contour points and R be the set of points currently contained within the circle, with an initial set R = {}. The goal of recursion is to find the smallest circle in P that contains all points, and these points must include those in R. A unique minimum circle can be determined when the size of R is 0, 1, 2, or 3. Therefore, the stopping condition for recursion is P = {} and R = 3. The recursive process involves extracting a point p from P and checking if p is inside R. If p is inside the circle R, proceed to check the next point p. If p is not inside the circle R, add p to R. This forms a new, smaller problem (P’, R’), and the above process is repeated until the final minimum bounding circle is obtained.
2.3. YOLOv8 Instance Segmentation Model
In engineering practice, it has been found that fragmentation recognition is significantly affected by factors such as differences in rock mass size, stacking coverage, complex surface texture features, and the similarity in grayscale between the background and target. Even with the use of traditional threshold-based segmentation algorithms for high-resolution blast images, issues such as blurred boundary recognition and region adhesion still exist, leading to accuracy defects. Therefore, exploring intelligent image analysis methods that balance computation speed and segmentation accuracy to achieve dual optimization of processing efficiency and precision is of significant engineering value for enhancing dynamic monitoring of blast fragmentation and optimizing blast process decisions.
This study uses the YOLOv8 instance segmentation model for rock fragment segmentation. YOLO (You Only Look Once) is a real-time object detection algorithm initially proposed by Joseph Redmon et al. [
25]. The algorithm has high detection speed and accuracy, making it suitable for various computer vision applications [
26]. Unlike traditional region-based vision techniques, this method transforms the object detection task into an “end-to-end” regression problem. Its key feature is that it performs object detection and classification in a single forward pass, producing bounding boxes and confidence scores for all targets, achieving high detection efficiency. YOLO, as one of the mainstream networks for single-stage real-time object detection tasks, has continually improved in instance segmentation performance through updates from YOLOv1 to YOLOv8.
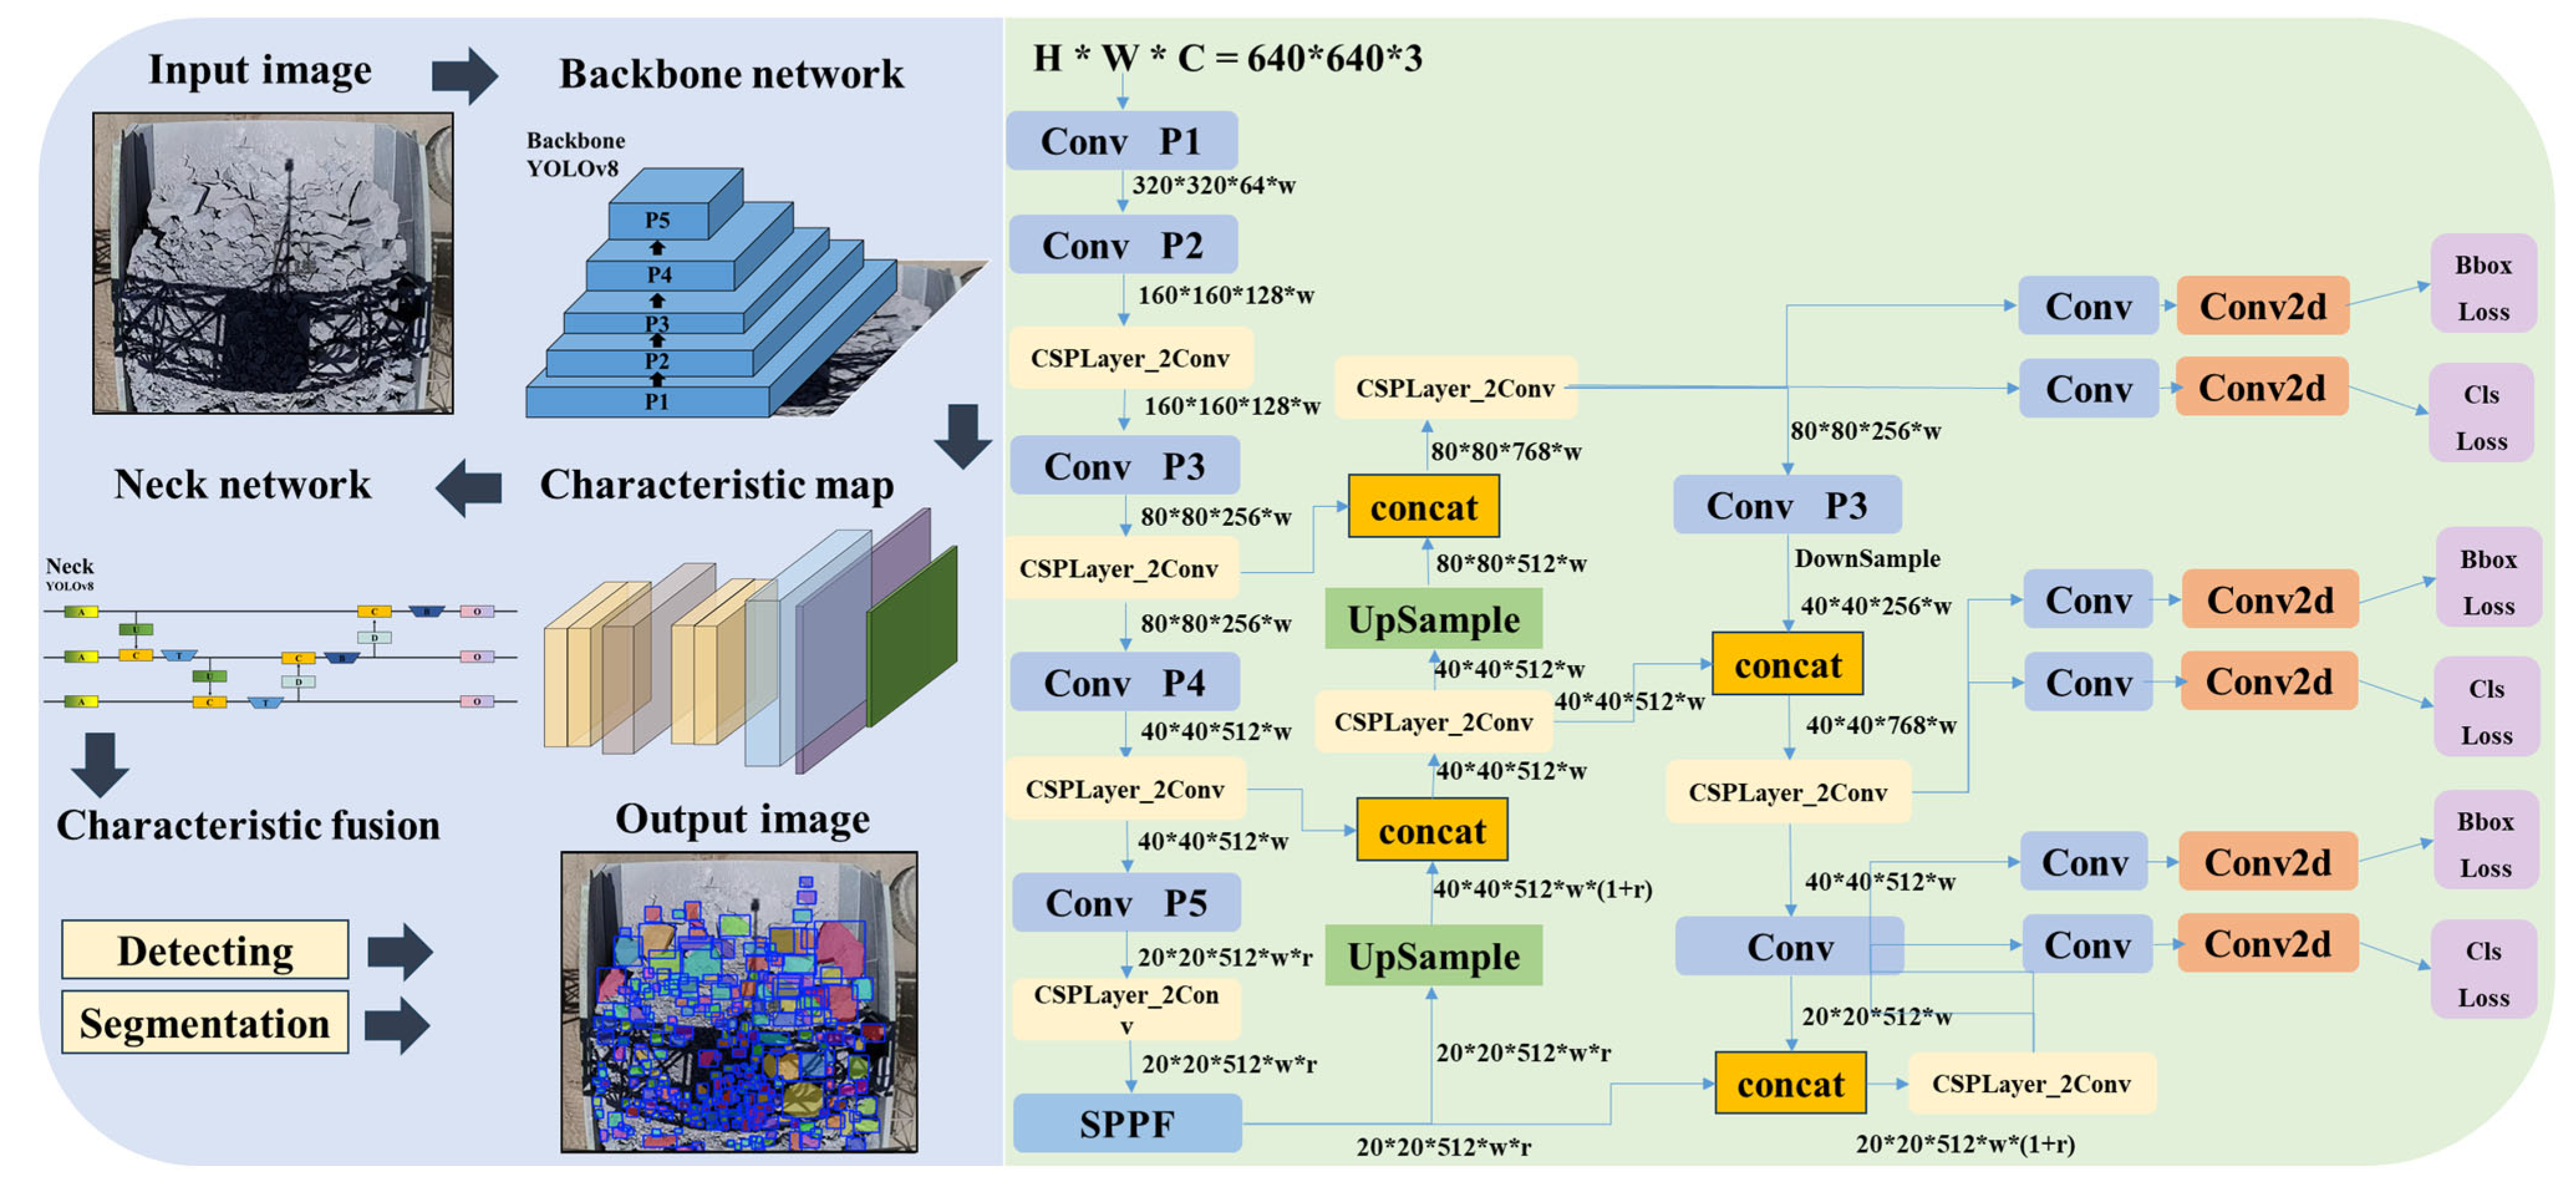
As shown in
Figure 6, the YOLOv8 model is divided into versions such as n, s, m, and x based on different depth and exploration coefficients. Its main structure consists of the input, feature extraction backbone, feature fusion neck network, and head network. The input stage involves reassembling rock images, mosaic data augmentation, grayscale filling, and anchor point calculation to enhance the model’s robustness to different rock images. The feature extraction backbone introduces the gradient-rich C2f module, replacing the previous C3 module. Compared with the C3 module, the C2f module implements multi-branch cross-layer connections, allowing the network to learn more features, but it is more complex in structure and has a larger number of parameters. The neck network still uses SPPCSPC, CBS, Ups, and E-ELAN modules, enhancing the feature fusion capability of the network through upsampling and downsampling. It is responsible for feature fusion of extracted rock fragment foreground target information. This enhances the receptive field while ensuring the model’s detection performance and convergence speed. The head network is replaced with the mainstream decoupled head structure, which separates the classification and detection heads, each responsible for returning the classification and bounding boxes of detected objects in rock fragment images. This improves the model’s accuracy in bounding box prediction, enabling object prediction of rock fragments in images.
2.4. Dynamic Recognition Model for Rock Fragment Size
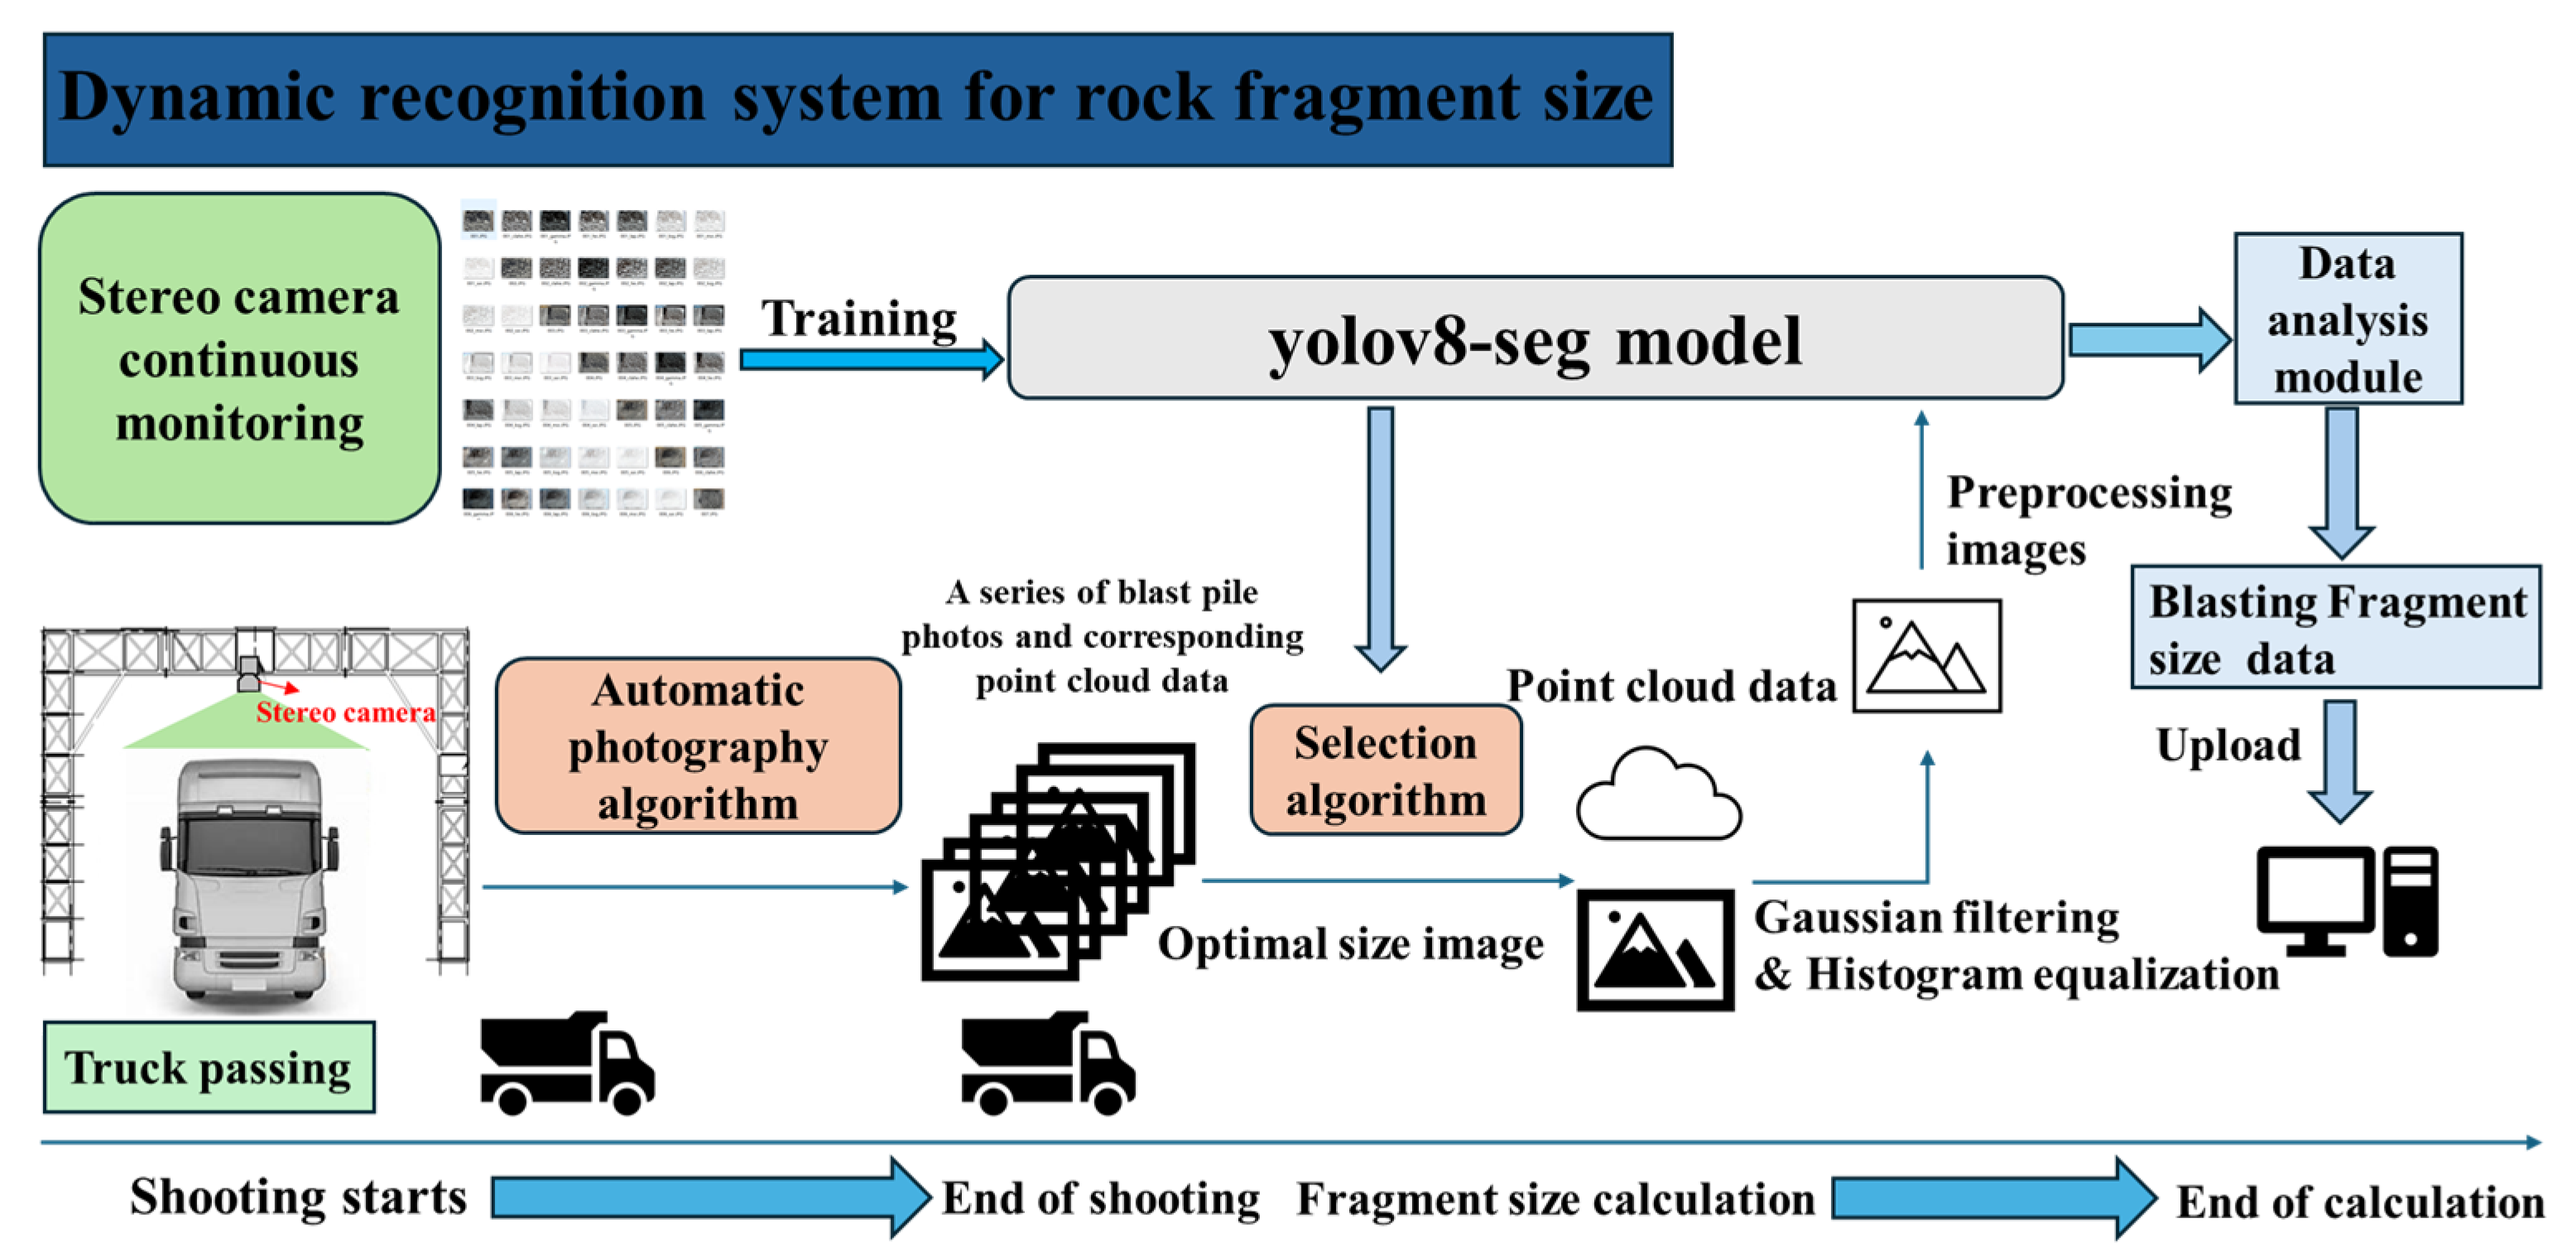
The above YOLOv8 instance segmentation model, binocular vision measurement, and Welzl’s algorithm can be used to accurately identify the size of rock fragments. The specific implementation process is shown in
Figure 7. The binocular camera captures the rock fragment image, and after image preprocessing and Gaussian filtering denoising, the YOLOv8 instance segmentation model is used for instance segmentation. The image captured by the left camera is chosen as the reference. The segmentation obtains all rock masks, and the depth values of all pixels in the image are traversed. The image captured by the left camera is chosen as the reference. The segmentation obtains all rock masks, and the depth values of all pixels in the image are traversed. The depth map and the RGB color image captured by the binocular camera are then aligned at the pixel level. Each pixel in the RGB image can calculate its corresponding 3D coordinates using the depth map information. All rock masks are sequentially extracted, and depth anomalies in the rock masks are removed. The points within the mask are paired to calculate the pixel length and actual length. After calculating the actual length-to-pixel scale, each scale is stored in an array. Then, for each rock, Welzl’s algorithm is used to calculate the minimum enclosing circle pixel size as the rock’s pixel length. This allows the actual length to be obtained based on the actual length-to-pixel scale.
As the mining truck passes the scanning station, the binocular camera dynamically collects a sequence of blast fragmentation images via an automated photography algorithm. Appropriate images are selected to extract point cloud data, which are then used as the source input for the YOLOv8-seg model. Gaussian filtering and histogram equalization are then applied. The preprocessed images are then fed into the YOLOv8-seg model for further analysis. The blasting fragmentation distribution is derived via the data analysis module and ultimately uploaded to the terminal system. A dynamic blast fragmentation recognition system is established by integrating various algorithms with binocular vision, enabling real-time acquisition of rock size distribution during truck haulage. This contributes to enhancing the level of automation in mining operations.
2.4.1. Image Acquisition
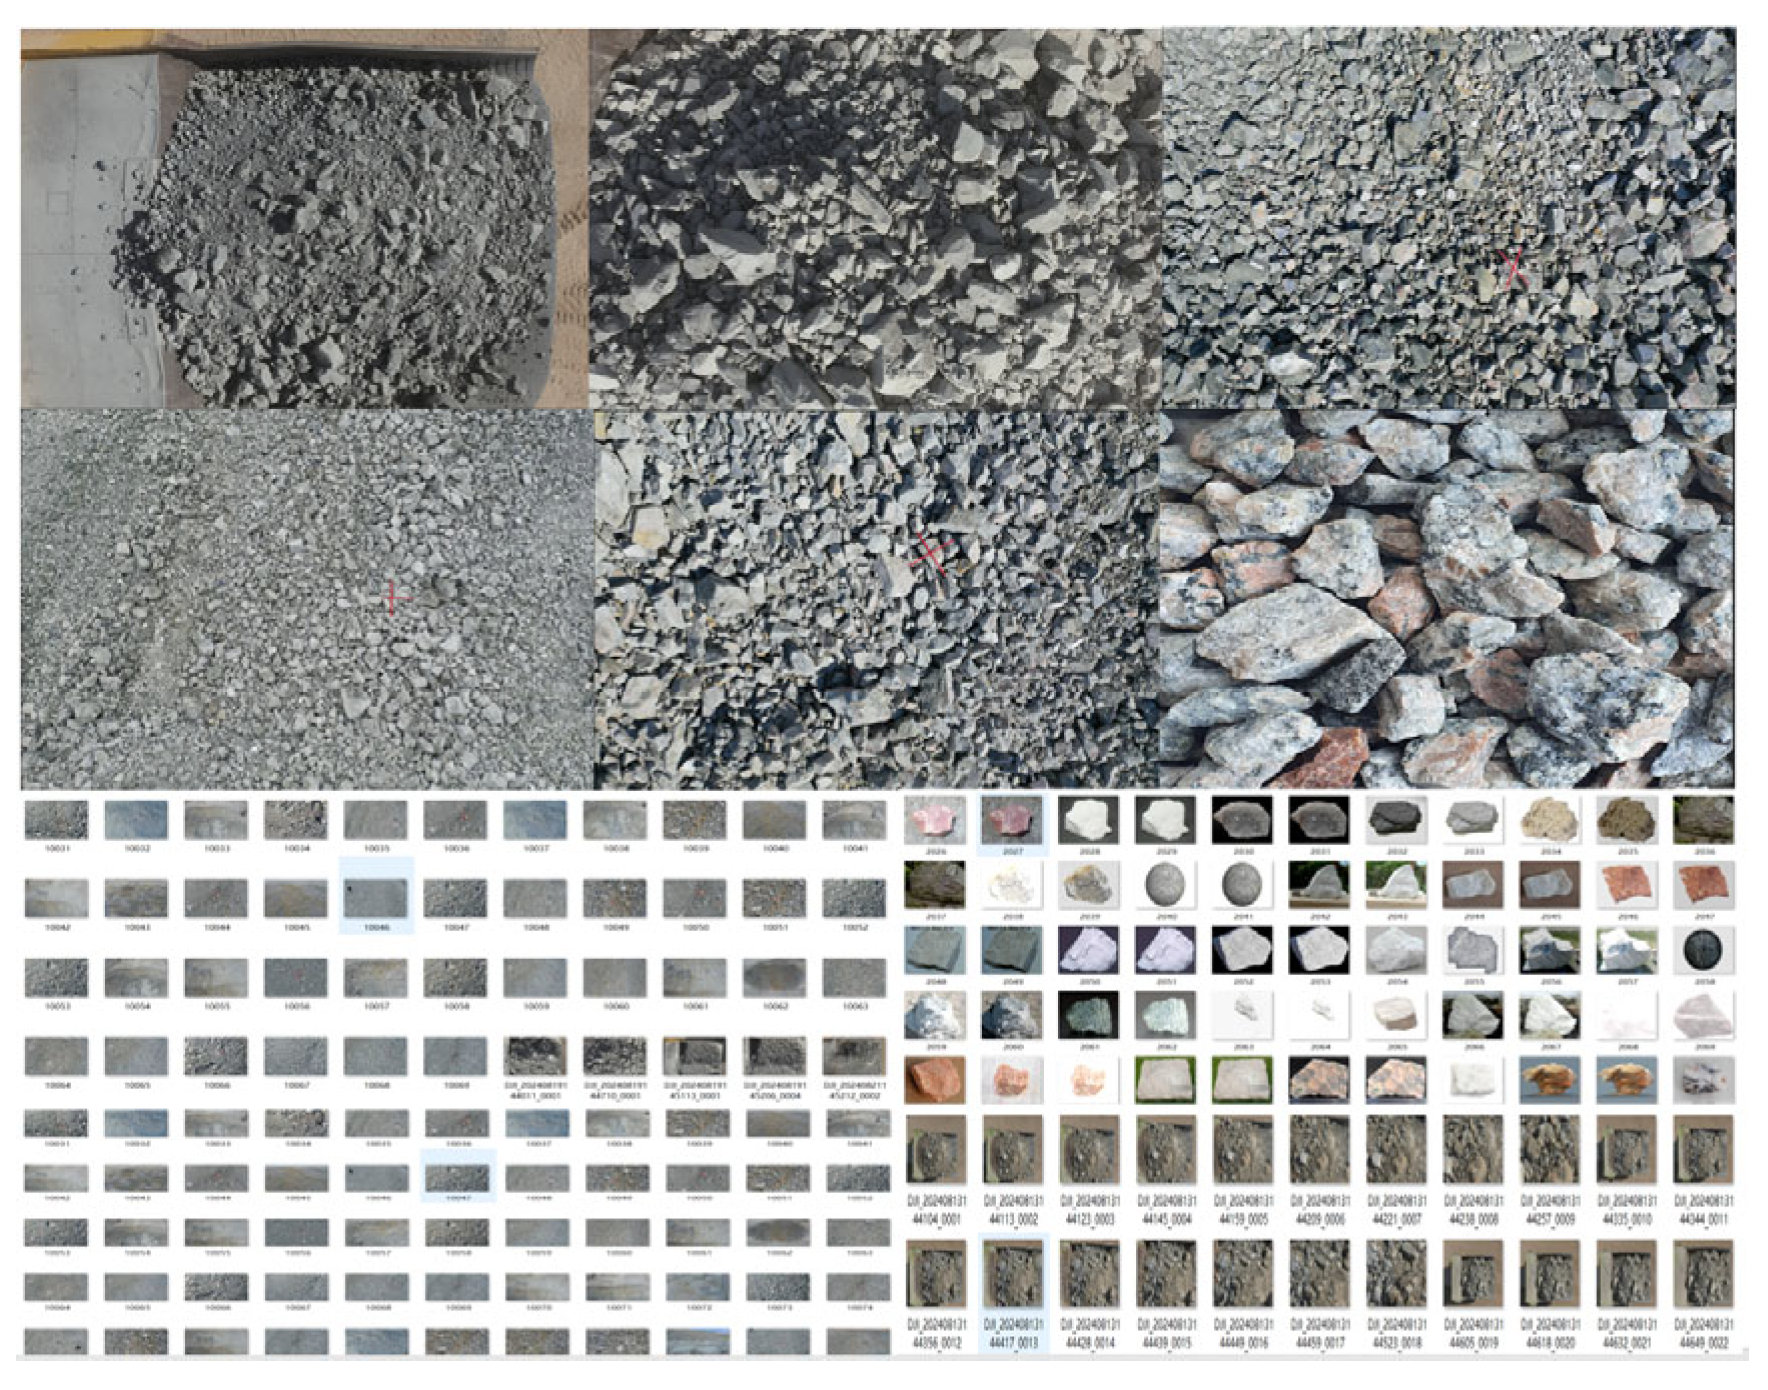
The images used in this study primarily come from uranium ore fragments at the Husab Uranium Mine in Namibia, blast pile images from various domestic mines, and publicly available rock datasets sourced from the internet. In the Husab Uranium Mine in Namibia, images of the blasted uranium ore passing through the gate scanning station were captured using the OAK-D-Pro-W-POE binocular camera. The camera captured a total of 1536 images under various weather conditions and lighting environments in actual working conditions. Some of the acquired images are shown in
Figure 8.
2.4.2. Preprocessing Images
Image preprocessing is a key step in blasting fragmentation recognition, aiming to convert raw images into standardized data suitable for algorithmic processing, thereby improving recognition accuracy and robustness. Without preprocessing, noise, distortion, or uneven lighting in the image may cause the algorithm to misidentify edges, thus reducing recognition accuracy. Therefore, high-quality preprocessing is a prerequisite for practical application. This study adopts Gaussian filtering combined with histogram equalization to preprocess images.
Gaussian filtering uses a two-dimensional Gaussian function to smooth the image, suppress high-frequency noise, preserve edge structures, and reduce over-segmentation caused by small gaps between fragments. The mathematical formulation is given by [
27]
Here, σ represents the standard deviation, which determines the degree of smoothing in the filtering process. Increasing the kernel size and the σ value enhances the smoothing effect.
Histogram equalization enhances image contrast by redistributing pixel gray values, improving detail in dark or bright areas and mitigating the effects of uneven lighting at the site. Its cumulative distribution function is defined as [
28]
Here, represents the number of pixels at grayscale level i, N is the total number of pixels, and L is the number of grayscale levels. The original grayscale value k is mapped to a new value as T(k) = round((L − 1) ⋅ CDF (k)).
The combined use of these two methods significantly improves image quality, providing a reliable foundation for subsequent fragment segmentation and size recognition.
Figure 9 and
Figure 10 show the image results before and after preprocessing.
2.4.3. Image Caption
Image annotation is a process of converting image information into textual information, also known as image labeling or image captioning. An image can only be used for model training after being annotated. Traditional labeling methods include manual annotation and semi-automated annotation. Manual annotation requires using polygonal boxes to manually mark each rock in the image, but the annotation process of the dataset poses certain challenges. Due to the large number of gravel pieces in the image, traditional manual point-by-point annotation is not only time-consuming and labor-intensive but also inefficient, greatly limiting the progress of the annotation work. Semi-automated annotation requires optimizing the annotation method, using a combination of anchor point labeling and semantic segmentation model-assisted annotation. Anchor point labeling mainly marks rough areas through key points, reducing the tedious steps of point-by-point drawing, but it still requires manual operation.
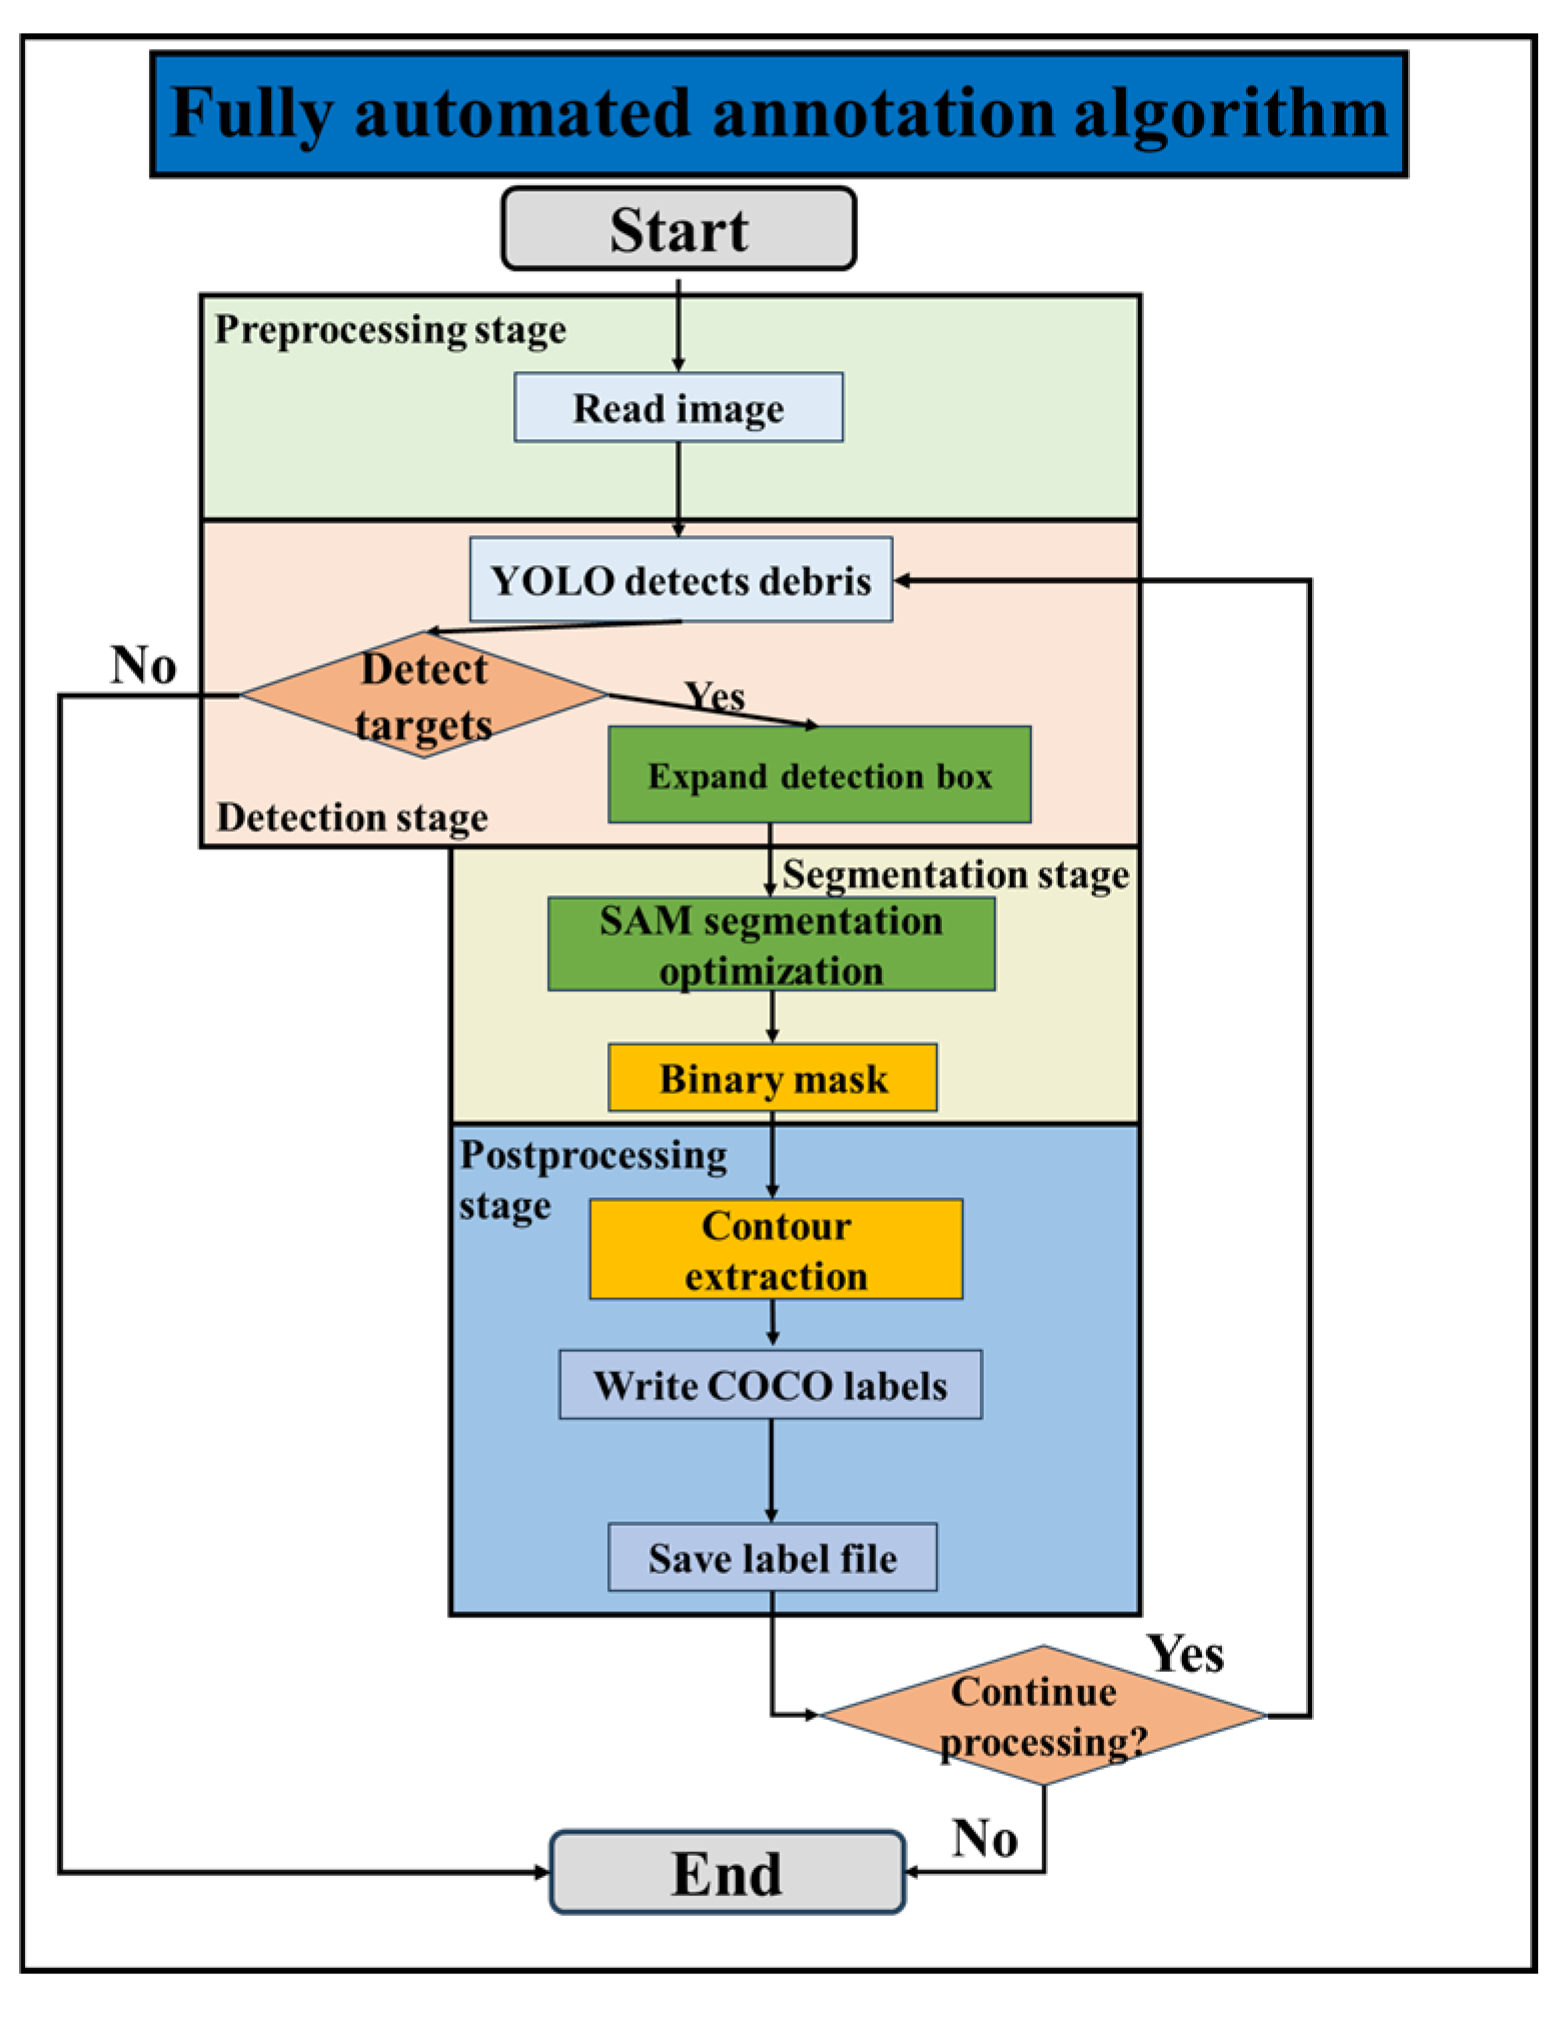
To solve this problem, this study optimizes the annotation method. A fully automated labeling algorithm is adopted, which reads the image from the preprocessing stage to the detection, segmentation, and post-processing stages to form the fully automated labeling algorithm. The algorithm flowchart is shown in
Figure 11. This fully automated annotation algorithm greatly improves labeling efficiency while ensuring labeling accuracy. It significantly reduces the manual workload and improves the efficiency and accuracy of dataset labeling. The labeling effect is shown in
Figure 12.
2.4.4. Data Augmentation
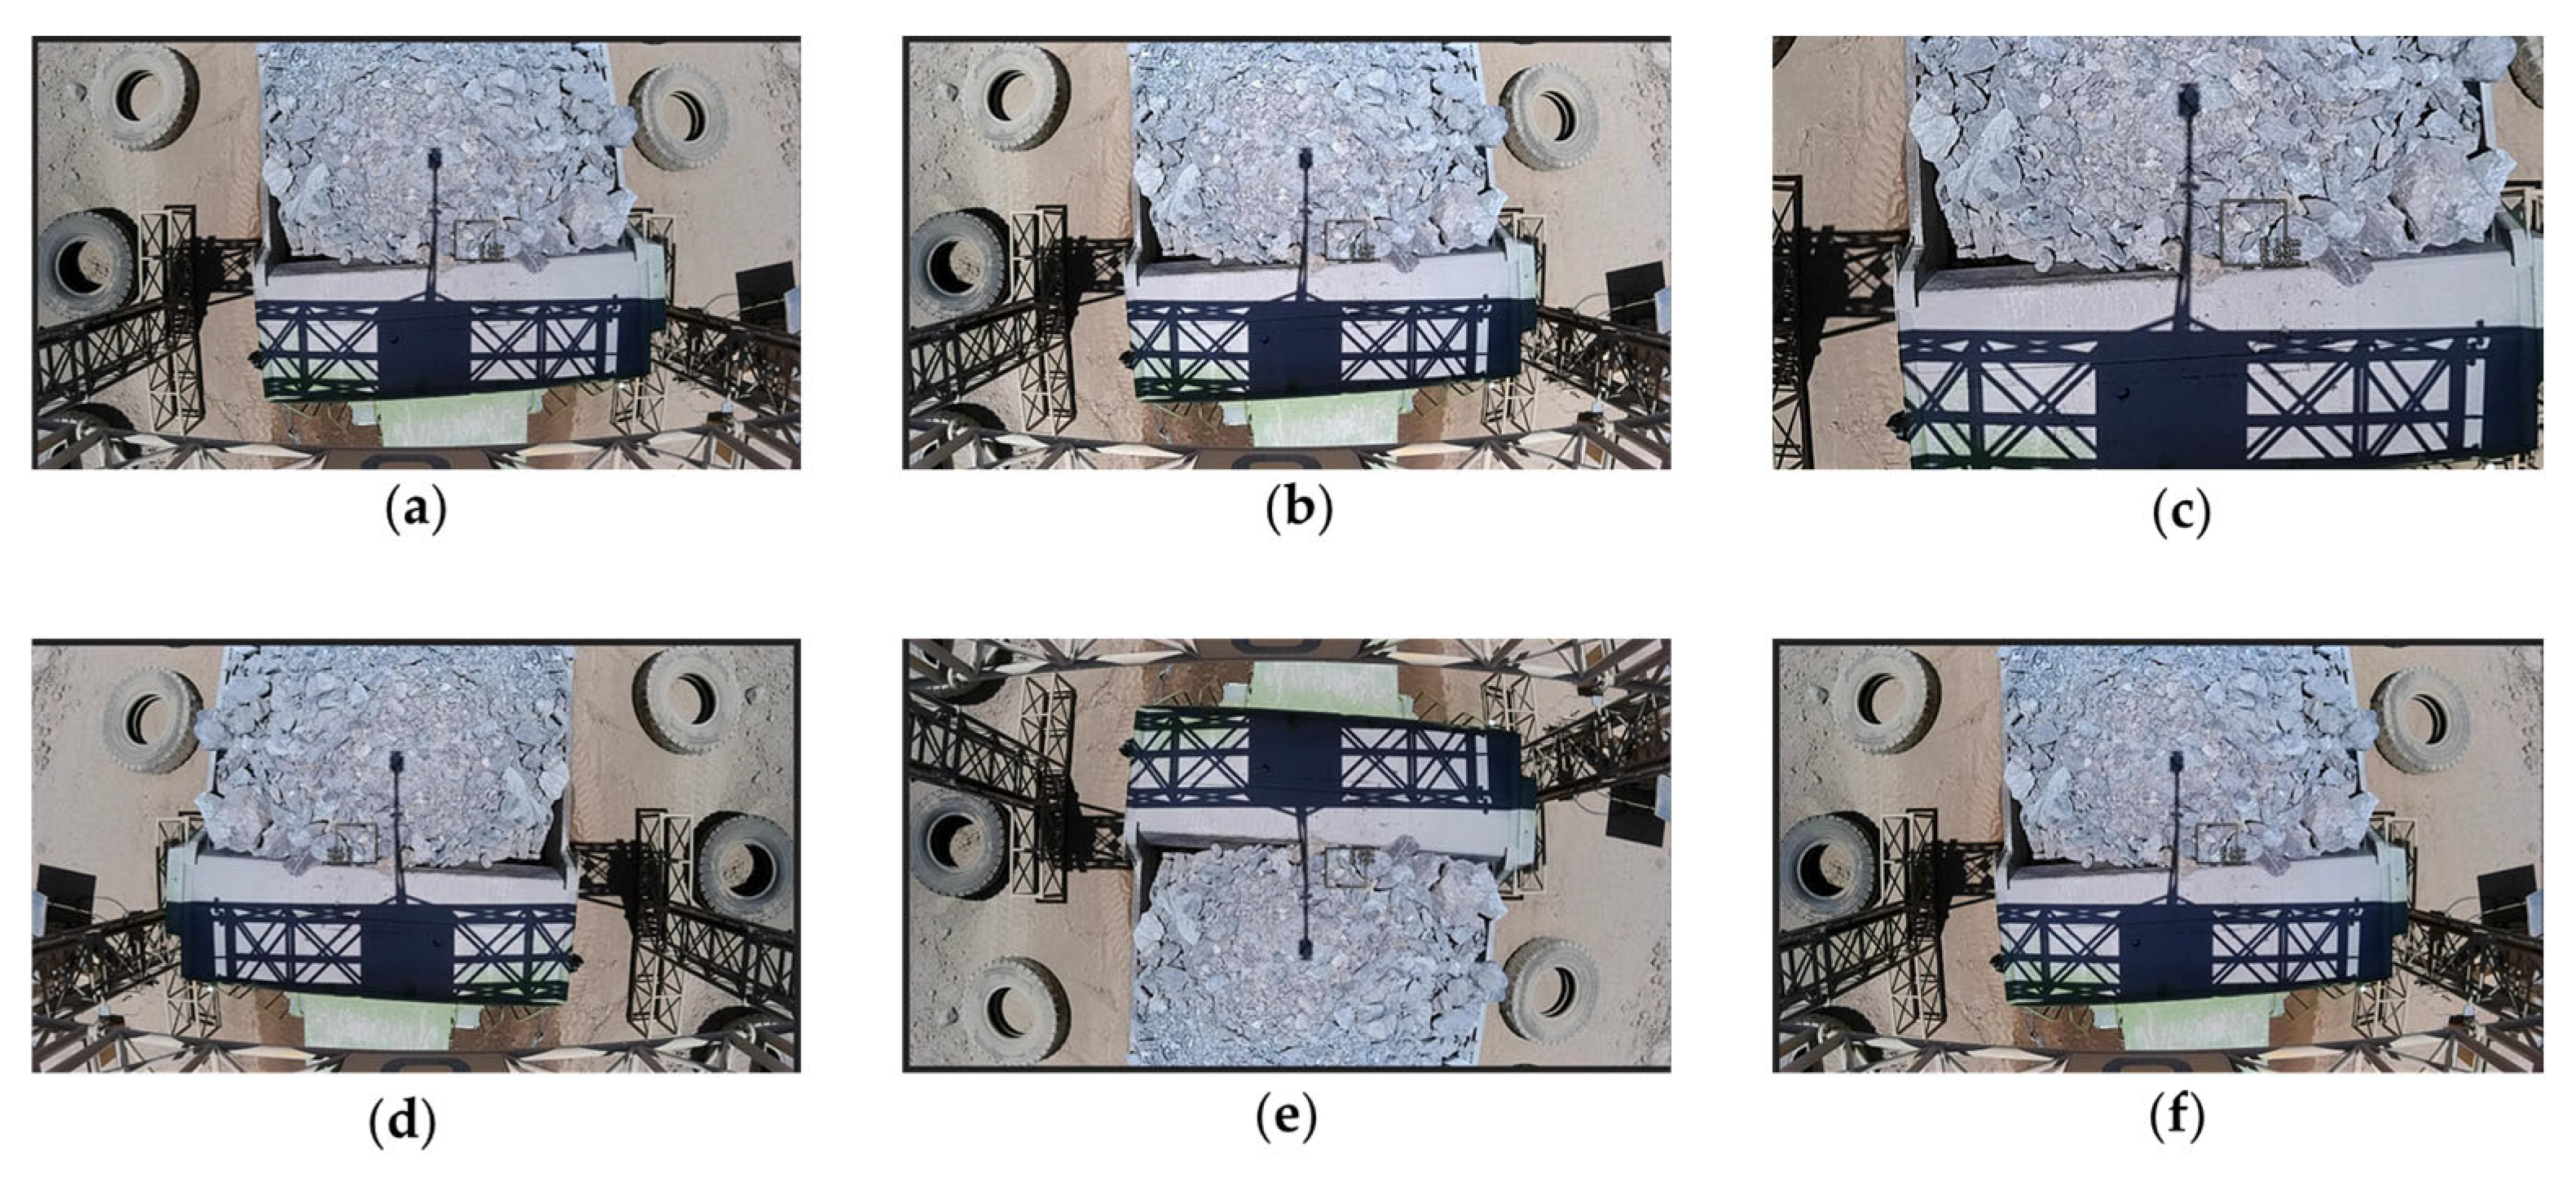
Data augmentation is a technique in machine learning and deep learning that increases the diversity and quantity of data by transforming the training dataset. This method enhances the robustness and accuracy of the training model for different rock images. In this study, random center cropping, horizontal flipping, vertical flipping, saturation changes, and brightness changes were applied to augment the 1536 training images. The images were augmented from 1536 to 7680 images. The dataset was randomly split into training (5376 images), validation (1536 images), and test (768 images) sets in a 7:2:1 ratio for training and validation of the YOLOv8 instance segmentation model. Some of the images after data augmentation are shown in
Figure 13.
2.4.5. Model Training
In this study, images were collected under different weather and lighting conditions from the actual working conditions at the Husab Uranium Mine in Namibia. Combined with mining blast pile images and an open-source rock dataset, and through data augmentation, a diversified training dataset was constructed. This dataset includes various scenes and complex backgrounds of mine rubble, ensuring that the algorithm can handle diverse rock fragmentation recognition needs in real-world environments. The algorithm used the YOLOv8x-seg.pt pre-trained model during training, which is a powerful instance segmentation model trained on a large-scale public dataset. The model was trained using rich feature data, accumulating recognition capabilities for various objects. Through transfer learning, a model suitable for rock fragmentation size recognition was further trained on the basis of this pre-trained model. The parameters of the model are shown in
Table 2. The model can quickly extract and recognize the boundaries and details of rubble, efficiently detecting rubble targets in images and generating independent masks for each fragment, thus enabling fine instance segmentation and providing technical support for intelligent recognition of blast fragmentation in subsequent steps.
3. Results
In the evaluation of algorithm models, a confusion matrix is generally used to measure the classification performance of a classification model. The rows of the confusion matrix represent the actual categories labeled manually, while the columns represent the categories of data predicted by the model. In a binary classification task, the confusion matrix typically consists of four elements: True Positive (TP), False Positive (FP), True Negative (TN), and False Negative (FN). TP is the number of targets where the model’s prediction matches the actual result. FP is the number of instances in which the model incorrectly identifies a non-target as a target. TN is the number of instances in which the model correctly identifies a non-target as a non-target. FN is the number of instances in which the model incorrectly identifies a target as a non-target.
Using the four elements described above, evaluation metrics such as Accuracy, Precision, Recall, and F1 Score can be calculated to assess the model training results. Precision refers to the proportion of True Positives in the predicted TRUE class by the model. Recall refers to the proportion of target class samples successfully predicted by the model out of all target class samples. Accuracy refers to the proportion of target class samples correctly predicted by the model in all data. However, in object detection, the number of positive and negative class samples may be imbalanced, so some evaluation indicators are not suitable as a decisive evaluation metric in some cases. This study uses Mean Average Precision for evaluation, which is widely used to evaluate the effectiveness of block recognition. Mean Average Precision (mAP), is typically calculated by determining the Precision for all classes at different confidence thresholds and then averaging these Precision values, resulting in the mAP. After training the YOLOv8 model for 1000 epochs, the confusion matrix shown in
Figure 14 is obtained. The mAP derived from the normalized
TP and
FP is 0.84.
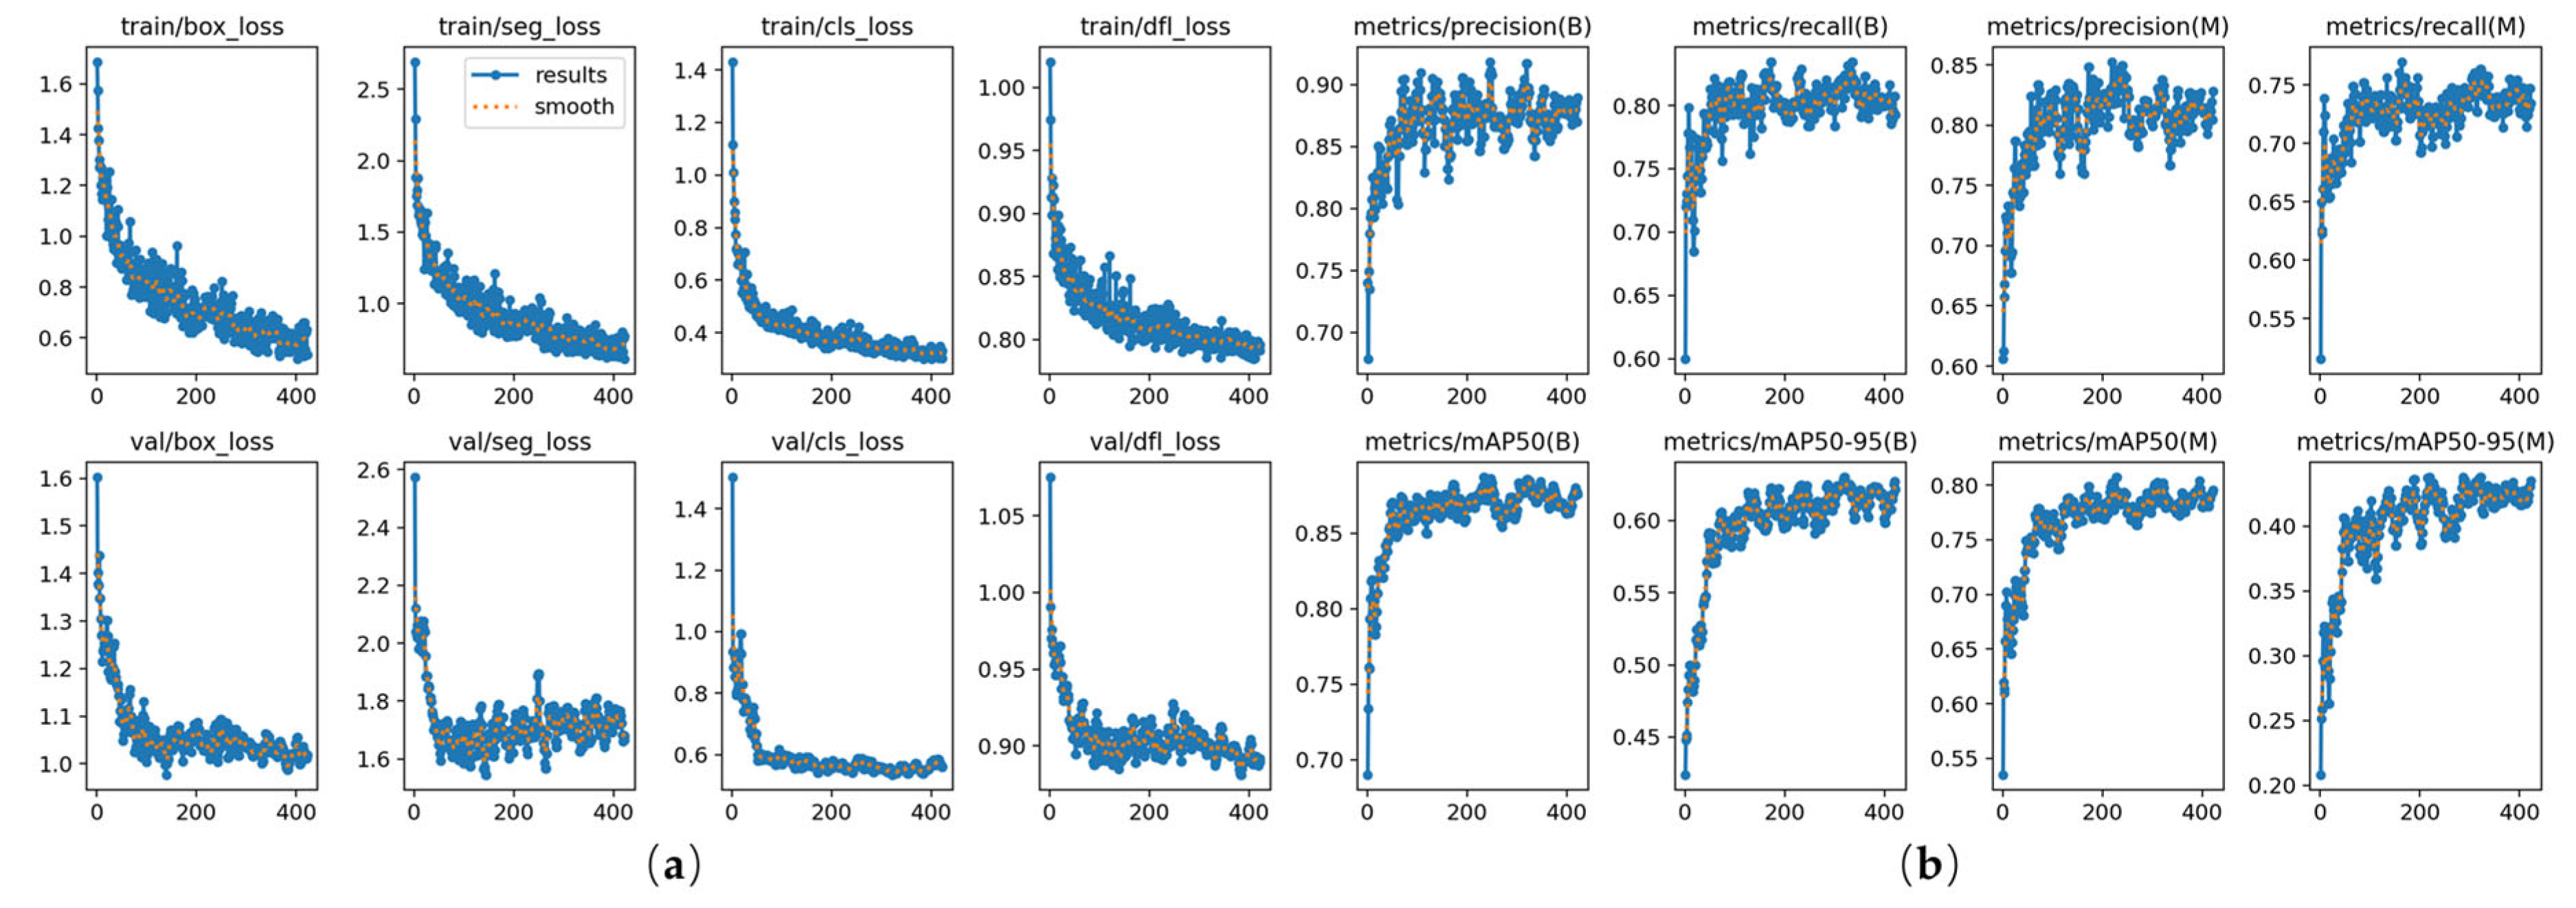
The optimization process of the model training is shown in
Figure 15.
Figure 15a shows the loss function curves of the model on the training and validation sets, where the terms represent bounding box prediction loss, segmentation mask loss, classification loss, and distribution aggregation loss, respectively. The trend of the results (blue curve) shows that as the number of training epochs increases, the loss function on both the training and validation sets gradually decreases. This indicates that the model performs well on the training set and its generalization ability on the validation set improves, without obvious signs of overfitting.
Figure 15b shows the evaluation metric curves of the model during the training process. Where (B) represents the bounding box, (M) represents the segmentation mask, Precision, and Recall, and mAP50 represents Precision, Recall, and Mean Average Precision, respectively. From
Figure 15b, it can be observed that the Precision, Recall, and mAP50 metrics gradually increase and stabilize, reflecting the continuous optimization of the model’s prediction performance, reaching a high level.
4. Discussion
4.1. Comparison of Fragmentation Recognition Results
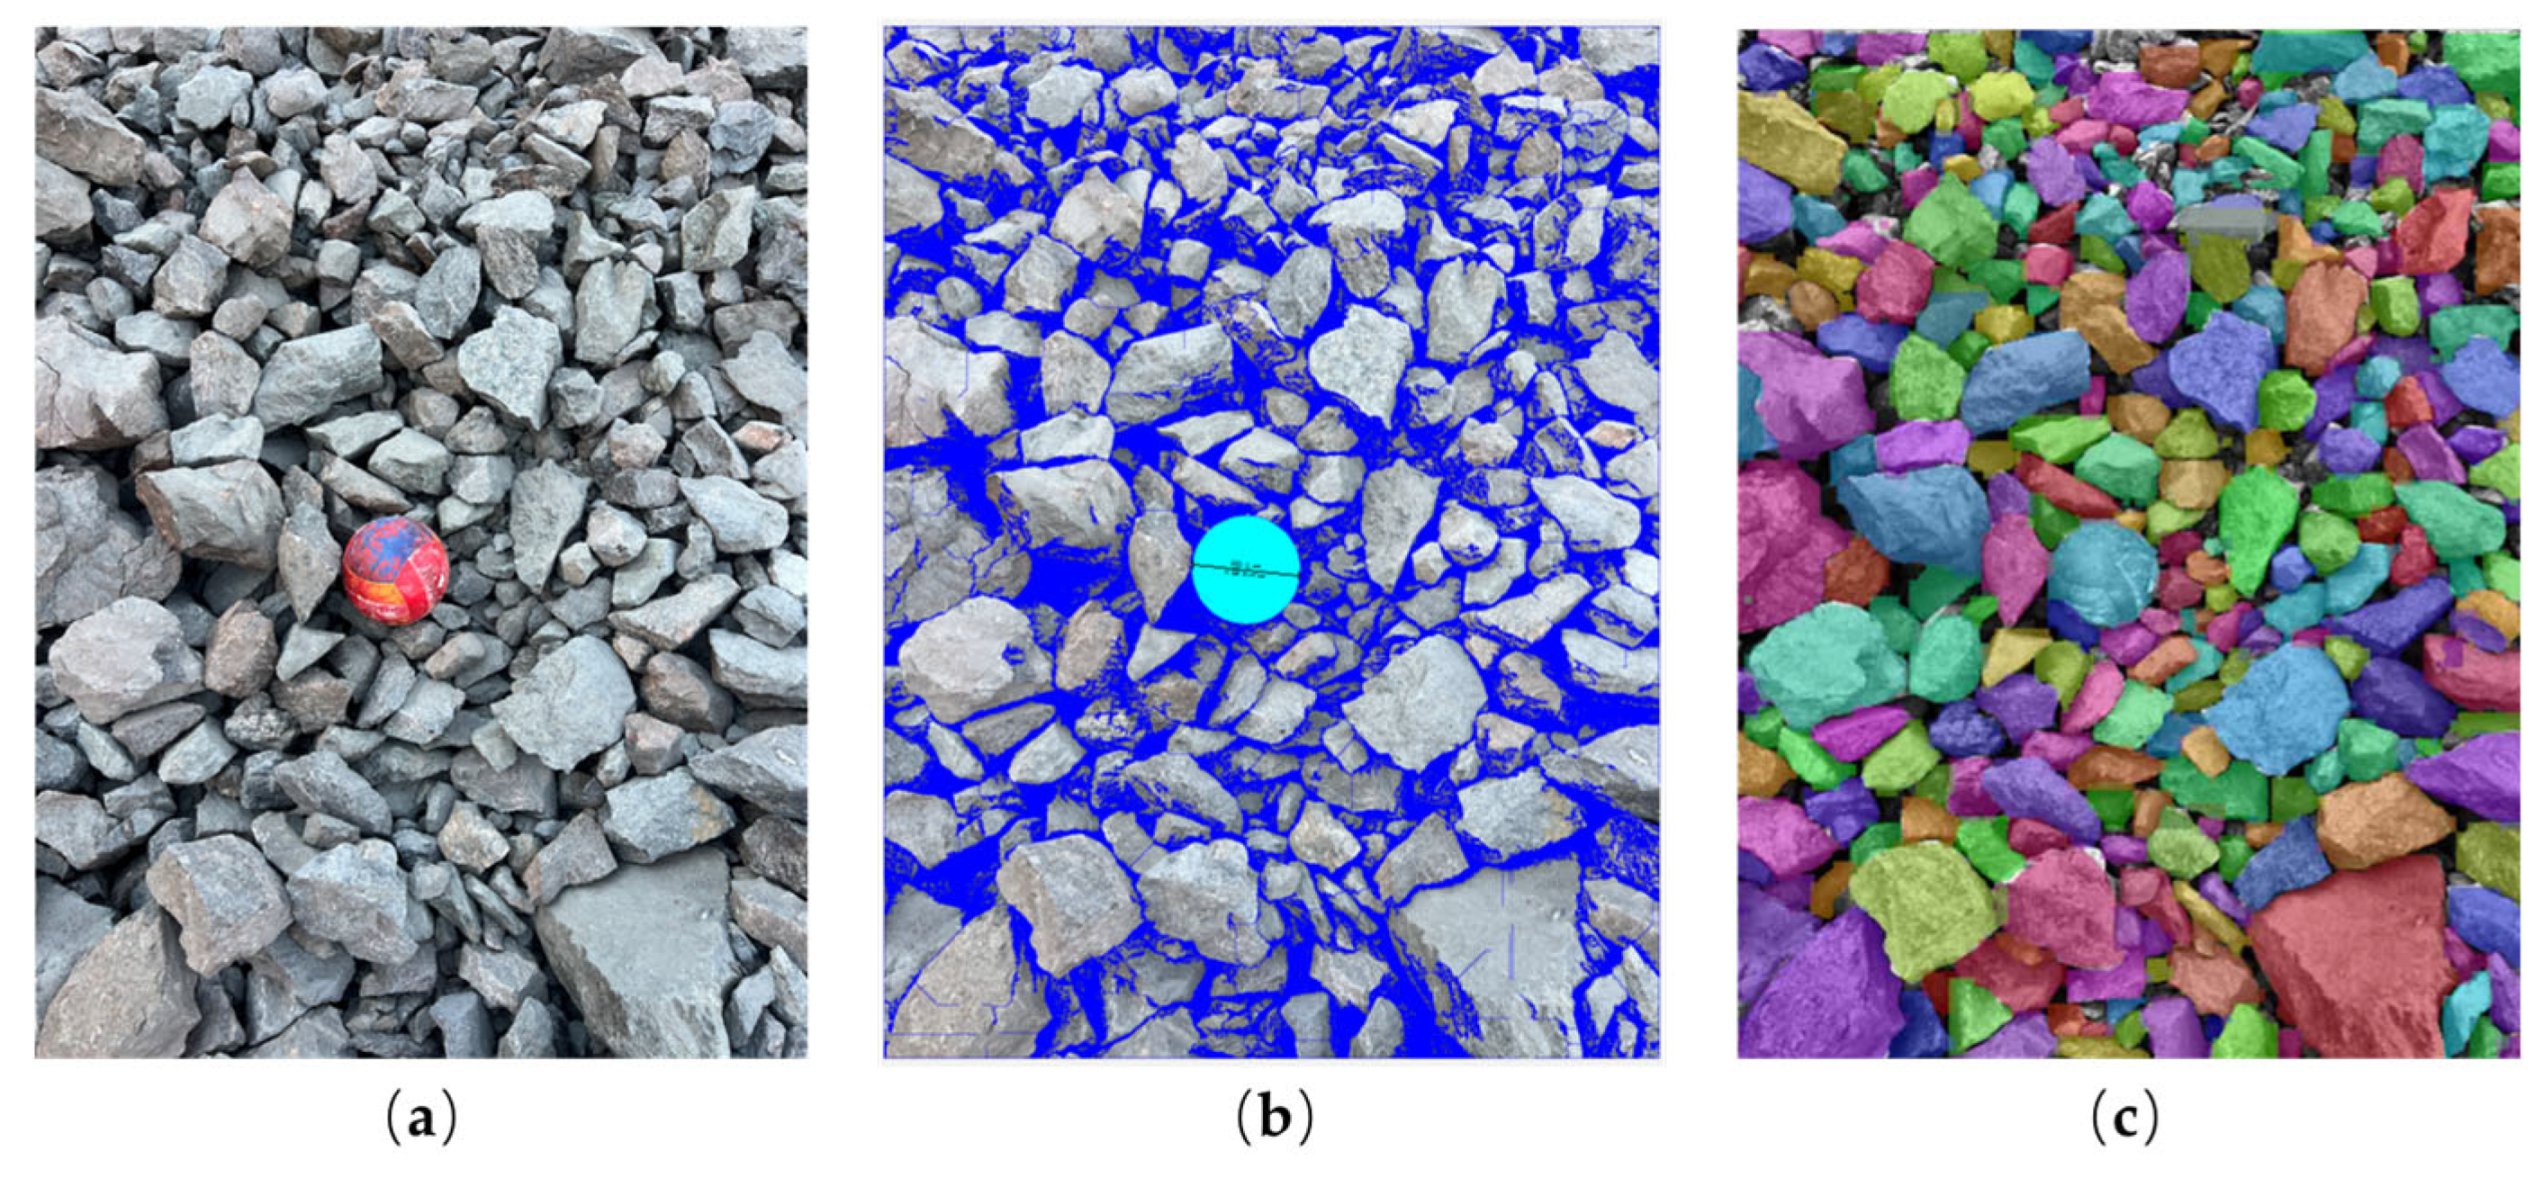
As shown in
Figure 16, by performing mask segmentation on the same set of rock fragment images using both commercial software and the proposed model, the proposed model accurately identifies rock fragment boundaries in the original images and achieves high-coverage segmentation. Leveraging an advanced image segmentation algorithm, the system covers nearly all rock particles, exhibiting a low miss rate and clear edge detection, thereby enhancing analytical completeness and accuracy. In contrast to the grayscale-based edge detection used in commercial software, the proposed model uses colored masks to partition different rock fragments, with each fragment labeled in a unique color. This makes the output more visually intuitive and aids rapid assessment of fragment size and spatial distribution.
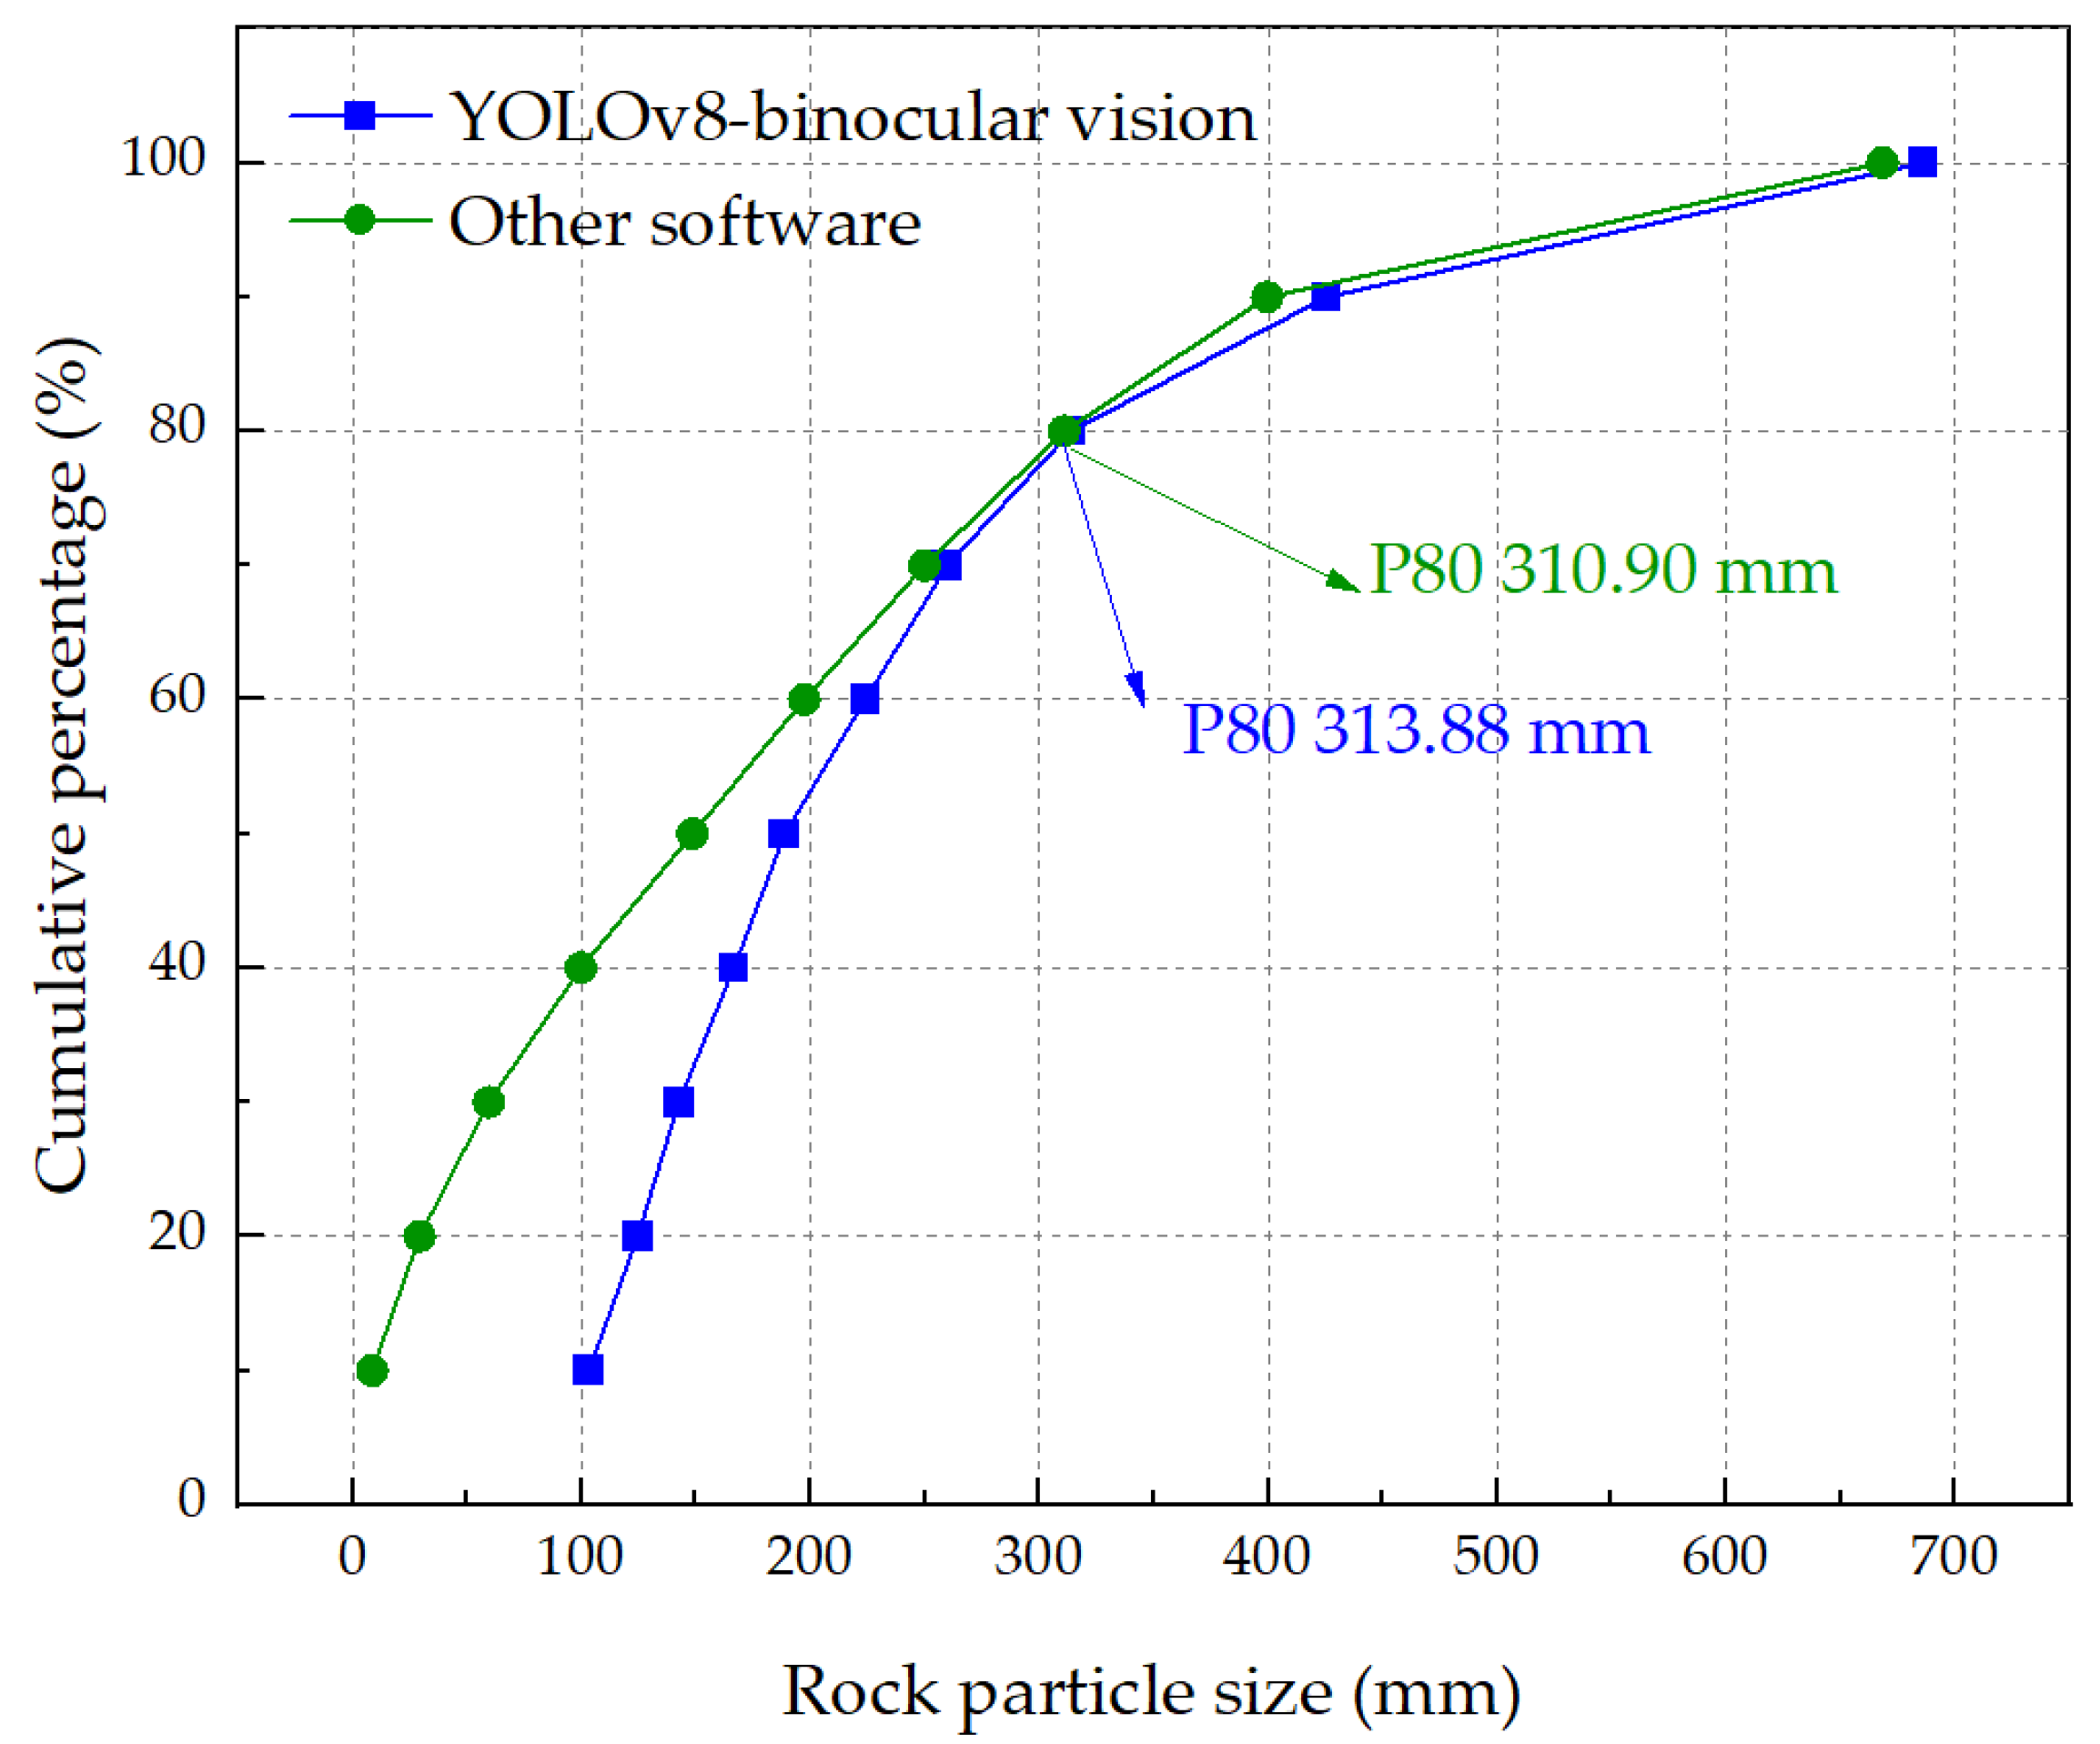
Cumulative fragmentation size is a key metric in blasting fragmentation recognition and blast performance evaluation, as it intuitively reflects the overall characteristics of fragment size distribution. To validate the accuracy and stability of the proposed model, images from the same source were processed using both the proposed model and commercial software, and their respective cumulative fragmentation curves were extracted for comparative analysis. The comparison results are shown in
Figure 17. The two cumulative curves exhibit similar trends and a high degree of overall fit, indicating strong consistency in particle size recognition between the two methods. The difference in P80 values was reduced to only 3 mm, demonstrating that the proposed model possesses stable and reliable recognition and size prediction capabilities. It is noteworthy that the starting points of the two cumulative size distribution curves show some differences. This difference mainly results from the variation in recognition methods: the commercial software manually delineates fine particles (fines) in the image, while the model proposed in this study uses a fully automated algorithm without manual intervention. This has little impact on the overall particle size analysis and does not affect the model’s high accuracy in real-world applications. In summary, the model proposed in this paper achieves recognition accuracy comparable to the mature commercial software, while also performing well in terms of automation and multi-image processing consistency, providing a useful tool for evaluating blasting performance in mining.
4.2. Region of Interest Recognition Algorithm
In field trials, the model performs well in identifying large rock sizes in trucks transporting ore, meeting the practical needs of the project in most cases. However, in engineering sites, the wide lateral field of view of the equipment can lead to misidentifications of irrelevant objects, such as tires and roadside rocks, thus reducing the scanning accuracy.
To solve the issue of misidentifications caused by the wide lateral field of view of the equipment, this study employs a targeted ROI (Region of Interest) recognition algorithm, which limits the area of interest during the scanning process, thereby reducing the impact of misidentifications and improving the accuracy of detection and analysis. The ROI recognition algorithm is a core technology in image processing and computer vision, widely used in fields such as medical imaging, video surveillance, and autonomous driving, capable of extracting relevant parts from images or video streams for specific tasks [
29,
30,
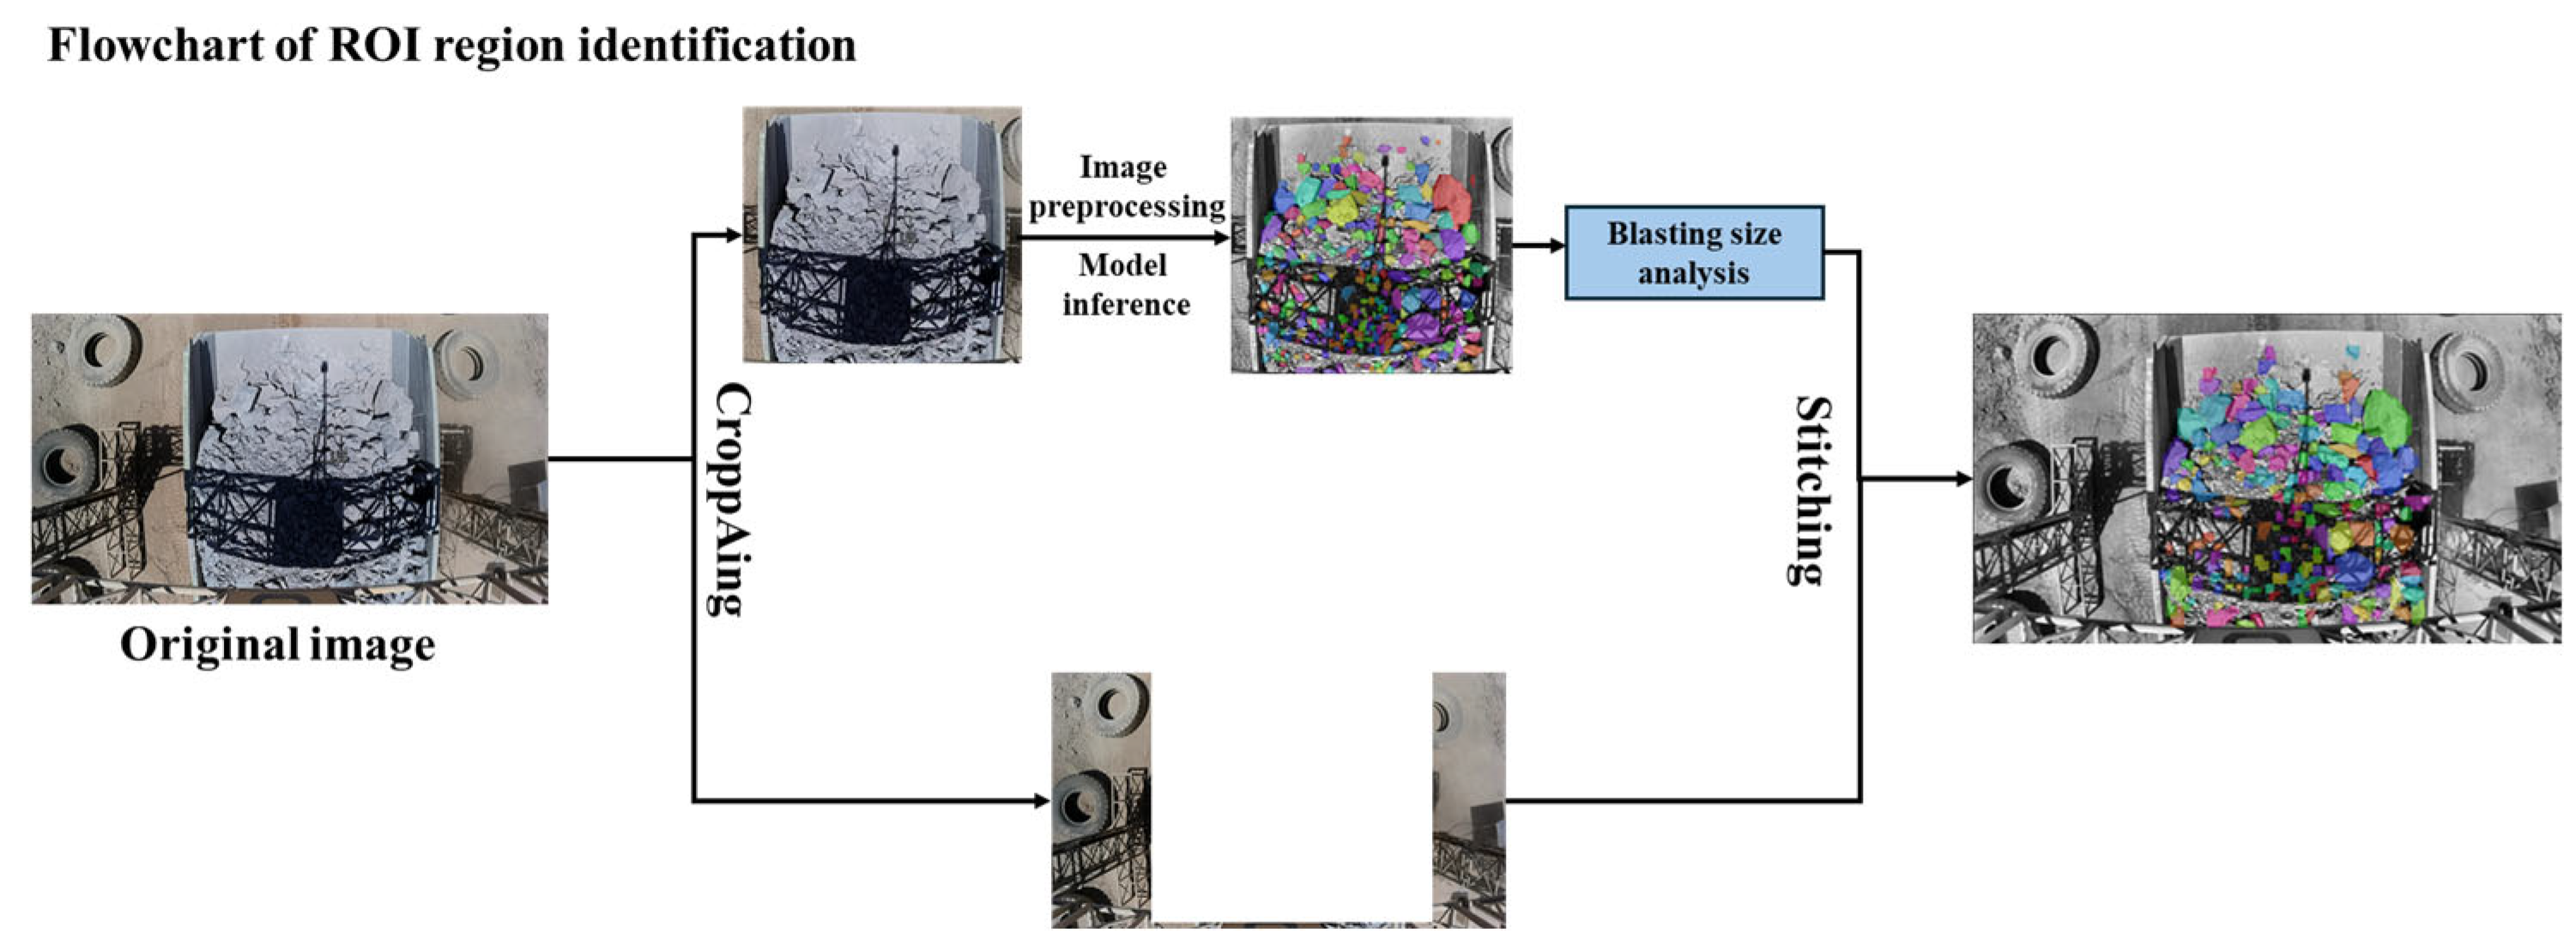
31]. The basic idea is to analyze the content of the image to identify one or more areas of interest. This includes steps such as image preprocessing, feature extraction, region segmentation, and region filtering. Through these steps, the algorithm can identify target objects or areas from the image, followed by further analysis or processing. The ROI recognition algorithm in this study involves cropping out the truck carrying ore in the image, preprocessing it, and then performing recognition, while excluding the rest of the image from inputting to the YOLOv8 instance segmentation model. After recognizing the truck part, it is then reassembled with the unrecognized portion, as shown in
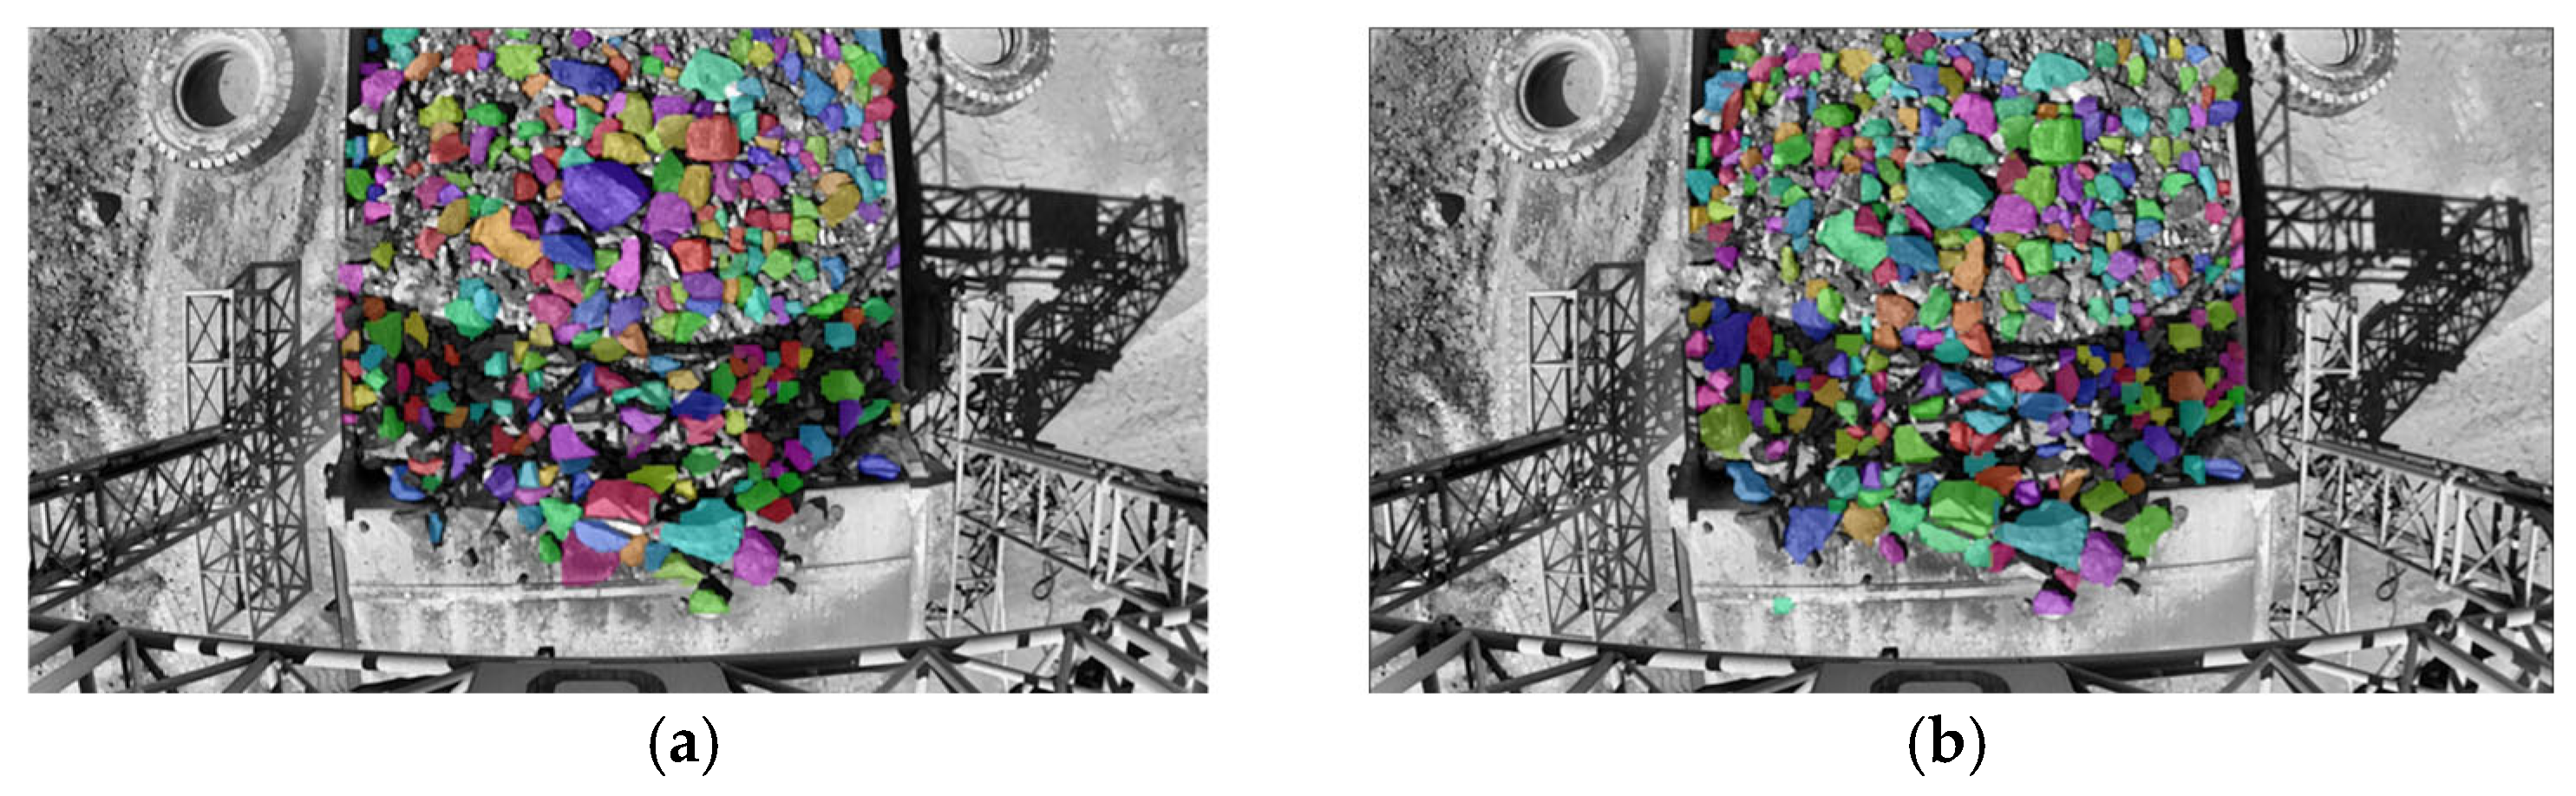
Figure 18. After incorporating the ROI recognition algorithm, the model’s recognition performance is shown in
Figure 19.
4.3. Shadow Condition Data Augmentation
In strong lighting environments at construction sites, the scanner frame casts shadows that obstruct the truck blasting pile area, interfering with data collection and recognition, leading to poor recognition performance in shadowed areas and misidentifying multiple rocks as a single rock. To address the issue of misidentification of rocks caused by the scanner frame casting shadows over the blasting pile area, image enhancement training was performed.
The working site is exposed to strong lighting and intense shadows, leading to poor recognition performance of the model in such conditions. To address this issue, targeted image enhancement was applied to the training dataset. The images were processed with methods such as histogram equalization, Laplacian operator enhancement, LoG (Laplacian of Gaussian) object enhancement, gamma transformation, CLAHE enhancement, and single- and multi-scale Retinex enhancement, which enriched the training dataset with a variety of lighting variations, as shown in
Figure 20. We assigned different brightness levels to the same image, and the model was trained on this dataset, resulting in a model with strong anti-interference capability. The comparison of performance between the old and new models is presented in
Figure 21. By comparing the recognition results under two shadow conditions, it can be observed that the processed model achieves more accurate fragmentation recognition under shadows.
4.4. Application Value
The fully automatic blasting fragmentation recognition technology developed in this study not only demonstrates excellent accuracy and system stability, but also shows broad application value in actual production, significantly improving the intelligence level of mining operations. The system brings direct and tangible improvements and benefits to a wide range of users. For mining engineers and technicians, the system provides real-time, accurate particle size data, enabling a scientific evaluation of blasting performance and the optimization of key parameters such as charge amount, hole spacing, and row spacing. This, in turn, enhances the rationality and effectiveness of blast design. Meanwhile, the system’s fully automatic analysis eliminates subjective errors from manual sketching and visual estimation, strengthening objectivity and data support for technical decisions. For on-site managers and dispatchers, the system can provide real-time feedback on rock size information for each truckload. This helps dynamically adjust crusher loads, prevent blockages or idle running caused by uneven particle sizes, and improve equipment utilization and operational coordination efficiency. In addition, for safety and environmental personnel, the system can automatically detect and warn about the frequency of oversized boulders, effectively reducing risks associated with transportation and crusher operations. By precisely controlling particle size distribution, it also minimizes the need for secondary crushing and reduces energy consumption, thereby lowering environmental impacts such as dust and noise. In summary, the system offers significant improvements in technical, economic, and environmental aspects, making it a key tool in the intelligent transformation of mining.
5. Conclusions
Rapid recognition technology for dynamic blasting fragmentation is an important research topic for evaluating blasting effectiveness and improving construction efficiency. This study proposes a dynamic blasting fragmentation rapid recognition model and independently develops software for its application in engineering sites. The model dynamically captures the size distribution of surface ores loaded onto mining trucks using a binocular camera and then achieves rapid dynamic recognition of blasting fragmentation through a series of integrated algorithms based on the YOLOv8 core algorithm.
This study proposes a blasting fragmentation recognition model integrating the YOLOv8 instance segmentation model, binocular vision-based automatic capture technology, fully automated annotation techniques, data augmentation, ROI extraction, and shadow data enhancement methods to improve the accuracy and robustness of dynamic evaluation of mine blasting effects and actual rock sizes. The training dataset for the model consists of 1536 diverse images from the Husab Uranium Mine in Namibia and domestic mines. The YOLOv8 instance segmentation model is responsible for detecting and classifying crushed rocks. Through data augmentation techniques, the dataset size was expanded to 7680 samples during training, enhancing the model’s robustness. To accurately compute rock particle size, the Welzl’s algorithm was used to determine the circumcircle diameter of the rocks. By integrating the depth maps obtained through binocular vision-based automatic capture with the original images, the scale ratio between pixel size and actual size was calculated. Using this scale ratio, the actual particle size of each rock fragment was accurately extracted from the depth map, and both the depth map and actual fragment sizes were successfully obtained. Considering engineering site conditions, ROI extraction and shadow data enhancement techniques were introduced to enable the model to focus on the blasting fragmentation area, reducing background interference and improving recognition accuracy. The shadow data enhancement technique effectively simulates various lighting and shadow conditions in the mining environment, further improving the model’s robustness under complex lighting conditions. This provides effective support for mine blasting evaluation and production process optimization. Finally, software and a system were independently developed based on this integrated model and successfully applied at the Husab Uranium Mine in Namibia, achieving excellent fragmentation recognition results.
In summary, the proposed model was successfully implemented at the Husab Mine, and its recognition performance was verified as superior through comparative analysis with mature commercial software. The successful application of this technology provides a new technical pathway for the development of intelligent and automated mining. Future research will focus on further improving the accuracy of fragmentation recognition. This will be achieved by optimizing the YOLOv8 model, integrating advanced sensors, and developing custom auxiliary algorithms to enable ultra-high-precision recognition in complex environments. These efforts will promote the development of smart mines and contribute to the realization of fully automated mining operations.
Author Contributions
Conceptualization, Y.L., M.T. and Z.X.; methodology, Y.L.; validation, Y.X.; formal analysis, Z.X.; resources, Y.X. and L.H.; data curation, G.X.; writing—original draft preparation, Y.L.; writing—review and editing, M.T.; visualization, Z.X.; project administration, Y.L.; funding acquisition, Y.L. All authors have read and agreed to the published version of the manuscript.
Funding
The research presented in this paper was funded by the National Natural Science Foundation of China (Grant Nos. 12072376).
Institutional Review Board Statement
Not applicable.
Informed Consent Statement
Not applicable.
Data Availability Statement
The raw data supporting the conclusions of this article will be made available by the authors on request.
Conflicts of Interest
Authors Yulong Liu and Lei Huang were employed by the company CGNPC Uranium Resources Co., Ltd. The remaining authors declare that the research was conducted in the absence of any commercial or financial relationships that could be construed as a potential conflict of interest.
Abbreviations
The following abbreviations are used in this manuscript:
| YOLO | You Only Look Once |
| CNN | Convolutional Neural Network |
| CDF | Cumulative Distribution Function |
| TP | Ture Positive |
| FP | False Positive |
| TN | True Negative |
| FN | False Negative |
| mAP | Mean Average Precision |
| ROI | Region of Interest |
| LoG | Laplacian of Gaussian |
| HFOV | Horizontal Field of View |
| VFOV | Vertical Field of View |
| DFOV | Display Field of View |
| IMU | Inertial Measurement Unit |
| PoE | Power over Ethernet |
| MSR | Multi-Scale Retinex |
| SSR | Single Scale Retinex |
References
- Aydan, Ö.; Genis, M.; Bilgin, A.H. Effect of blasting on the bench stability at the Demirbilek open-pit mine. Environ. Geotech. 2014, 1, 240–248. [Google Scholar] [CrossRef]
- Li, R.; Zhu, P.; Li, S.; Ding, C.; Lu, W.; Liu, Y. Fractal behavior of size distribution and specific surface area of blasting fragments. Appl. Sci. 2023, 13, 11832. [Google Scholar] [CrossRef]
- Kılıç, A.M. Influence of rock mass properties on blasting efficiency. Sci. Res. Essays 2009, 4, 1213–1224. [Google Scholar]
- Zhang, Z.; Sanchidrián, J.A.; Ouchterlony, F.; Luukkanen, S. Reduction of fragment size from mining to mineral processing: A review. Rock Mech. Rock Eng. 2023, 56, 747–778. [Google Scholar] [CrossRef]
- Khademian, A.; Bagherpour, R. Environmentally sustainable mining through proper selection of explosives in blasting operation. Environ. Earth Sci. 2017, 76, 166. [Google Scholar] [CrossRef]
- Li, M.; Chen, M.; Lu, W.; Zhao, F.; Yan, P.; Liu, J. RDT-FragNet: A DCN-Transformer network for intelligent rock fragment recognition and particle size distribution acquisition. Comput. Geotech. 2025, 177, 106809. [Google Scholar] [CrossRef]
- McKinnon, C.; Marshall, J.A. Automatic identification of large fragments in a pile of broken rock using a time-of-flight camera. IEEE Trans. Autom. Sci. Eng. 2014, 11, 935–942. [Google Scholar] [CrossRef]
- Rossi, A.M.; Hirmas, D.R.; Graham, R.C.; Sternberg, P.D. Bulk density determination by automated three-dimensional laser scanning. Soil Sci. Soc. Am. J. 2008, 72, 1591–1593. [Google Scholar] [CrossRef]
- Wang, Y.; Tu, W.; Li, H. Fragmentation calculation method for blast muck piles in open-pit copper mines based on three-dimensional laser point cloud data. Int. J. Appl. Earth Obs. Geoinf. 2021, 100, 102338. [Google Scholar] [CrossRef]
- Huang, M.; Liu, Y.; Yang, Y. Edge detection of ore and rock on the surface of explosion pile based on improved Canny operator. Alex. Eng. J. 2022, 61, 10769–10777. [Google Scholar] [CrossRef]
- He, P.; Xu, Y.; Jiang, F.; Wang, G.; Xiao, Z.; Zheng, C. A rapid evaluation method of blasting effect based on optimized image segmentation algorithm and application in engineering. Sci. Rep. 2024, 14, 4783. [Google Scholar] [CrossRef] [PubMed]
- Jin, C.; Wang, K.; Han, T.; Lu, Y.; Liu, A.; Liu, D. Segmentation of ore and waste rocks in borehole images using the multi-module densely connected U-net. Comput. Geosci. 2022, 159, 105018. [Google Scholar] [CrossRef]
- Karimpouli, S.; Tahmasebi, P. Segmentation of digital rock images using deep convolutional autoencoder networks. Comput. Geosci. 2019, 126, 142–150. [Google Scholar] [CrossRef]
- Varfolomeev, I.; Yakimchuk, I.; Safonov, I. An application of deep neural networks for segmentation of microtomographic images of rock samples. Computers 2019, 8, 72. [Google Scholar] [CrossRef]
- Liu, X.; Zhang, Y.; Jing, H.; Wang, L.; Zhao, S. Ore image segmentation method using U-Net and Res_Unet convolutional networks. RSC Adv. 2020, 10, 9396–9406. [Google Scholar] [CrossRef]
- Zhang, G.; Liu, G.; Zhu, H. Segmentation algorithm of complex ore images based on templates transformation and reconstruction. Int. J. Miner. Metall. Mater. 2011, 18, 385–389. [Google Scholar] [CrossRef]
- Wang, C.; Reza, M.A.; Vats, V.; Ju, Y.; Thakudesai, N.; Wang, Y.; Crandall, D.J.; Jung, S.; Seo, J. Deep learning-based 3D reconstruction from multiple images: A survey. Neurocomputing 2024, 597, 128018. [Google Scholar] [CrossRef]
- Lang, J.; Mao, J.; Liang, R. Non-horizontal target measurement method based on monocular vision. Syst. Sci. Control Eng. 2022, 10, 443–458. [Google Scholar] [CrossRef]
- Chen, C.; Lan, G.; Chen, C.; Huang, Y. Stereo imaging using hardwired self-organizing object segmentation. Sensors 2020, 20, 5833. [Google Scholar] [CrossRef]
- Mishra, A.K.; Nigam, Y.; Singh, D.R. Controlled blasting in a limestone mine using electronic detonators: A case study. J. Geol. Soc. India 2017, 89, 87–90. [Google Scholar] [CrossRef]
- Zhou, J.; Shu, P.; Zhang, B.; Deng, B.; Wu, Y. A finite element analysis of tunnel lining demolition by blasting for subway tunnel expansion. Appl. Sci. 2022, 12, 9564. [Google Scholar] [CrossRef]
- Taji, M.; Ataei, M.; Goshtasbi, K.; Osanloo, M. ODM: A new approach for open pit mine blasting evaluation. J. Vib. Control 2013, 19, 1738–1752. [Google Scholar] [CrossRef]
- Wan, D.; Zhou, J. Stereo vision using two PTZ cameras. Comput. Vis. Image Understand. 2008, 112, 184–194. [Google Scholar] [CrossRef]
- Nielsen, F.; Nock, R. On the smallest enclosing information disk. Inf. Process. Lett. 2008, 105, 93–97. [Google Scholar] [CrossRef]
- Redmon, J.; Divvala, S.; Girshick, R.; Farhadi, A. You Only Look Once: Unified, Real-Time Object Detection. Comput. Vis. Pattern Recognit. IEEE 2016, 779–788. [Google Scholar] [CrossRef]
- Yi, H.; Liu, B.; Zhao, B.; Liu, E. Small object detection algorithm based on improved YOLOv8 for remote sensing. IEEE J. Sel. Top. Appl. Earth Obs. Remote Sens. 2023, 17, 1734–1747. [Google Scholar] [CrossRef]
- Boussayoud, A.; Saba, N.; Boulaaras, S. Generating functions of generalized Gaussian polynomials. Filomat 2024, 38, 8187–8209. [Google Scholar] [CrossRef]
- Suh, Y.; Kim, H.; Kim, M. Histogram equalization utilizing window-based smoothed CDF estimation for feature compensation. IEICE Trans. Inf. Syst. 2008, 91, 2199–2202. [Google Scholar] [CrossRef]
- Shinoda, K.; Kobayashi, N.; Katoh, A.; Komagata, H.; Ishikawa, M.; Murakami, Y.; Yamaguchi, M.; Abe, T.; Hashiguchi, A.; Sakamoto, M. An efficient wavelet-based ROI coding for multiple regions. IEICE Trans. Fundam. Electron. Commun. Comput. Sci. 2015, 98, 1006–1020. [Google Scholar] [CrossRef]
- Xia, D.; Ge, Y.; Tang, H.; Zhang, B.; Shen, P. SDZM: Software for determining shear damage zones of rock joints. Comput. Geosci. 2022, 159, 105021. [Google Scholar] [CrossRef]
- Pang, Y.; Li, X.; Yan, J.; Du, S. Exploration of image-based unsupervised learning algorithms for intelligent rock classification. Geoenergy Sci. Eng. 2025, 247, 213707. [Google Scholar] [CrossRef]
Figure 1.
On-site blast fragmentation data: (a) blasting site; (b) fragmentation distribution.
Figure 1.
On-site blast fragmentation data: (a) blasting site; (b) fragmentation distribution.
Figure 2.
Fragmentation identification equipment: (a) gantry frame; (b) binocular camera; (c) industrial computer; (d) spotlight.
Figure 2.
Fragmentation identification equipment: (a) gantry frame; (b) binocular camera; (c) industrial computer; (d) spotlight.
Figure 3.
On-site captured fragmentation distribution image.
Figure 3.
On-site captured fragmentation distribution image.
Figure 4.
Binocular camera imaging model.
Figure 4.
Binocular camera imaging model.
Figure 5.
Welzl’s smallest enclosing circle algorithm process.
Figure 5.
Welzl’s smallest enclosing circle algorithm process.
Figure 6.
YOLOv8 model structure.
Figure 6.
YOLOv8 model structure.
Figure 7.
Dynamic block size recognition model process.
Figure 7.
Dynamic block size recognition model process.
Figure 8.
Some of the collected images.
Figure 8.
Some of the collected images.
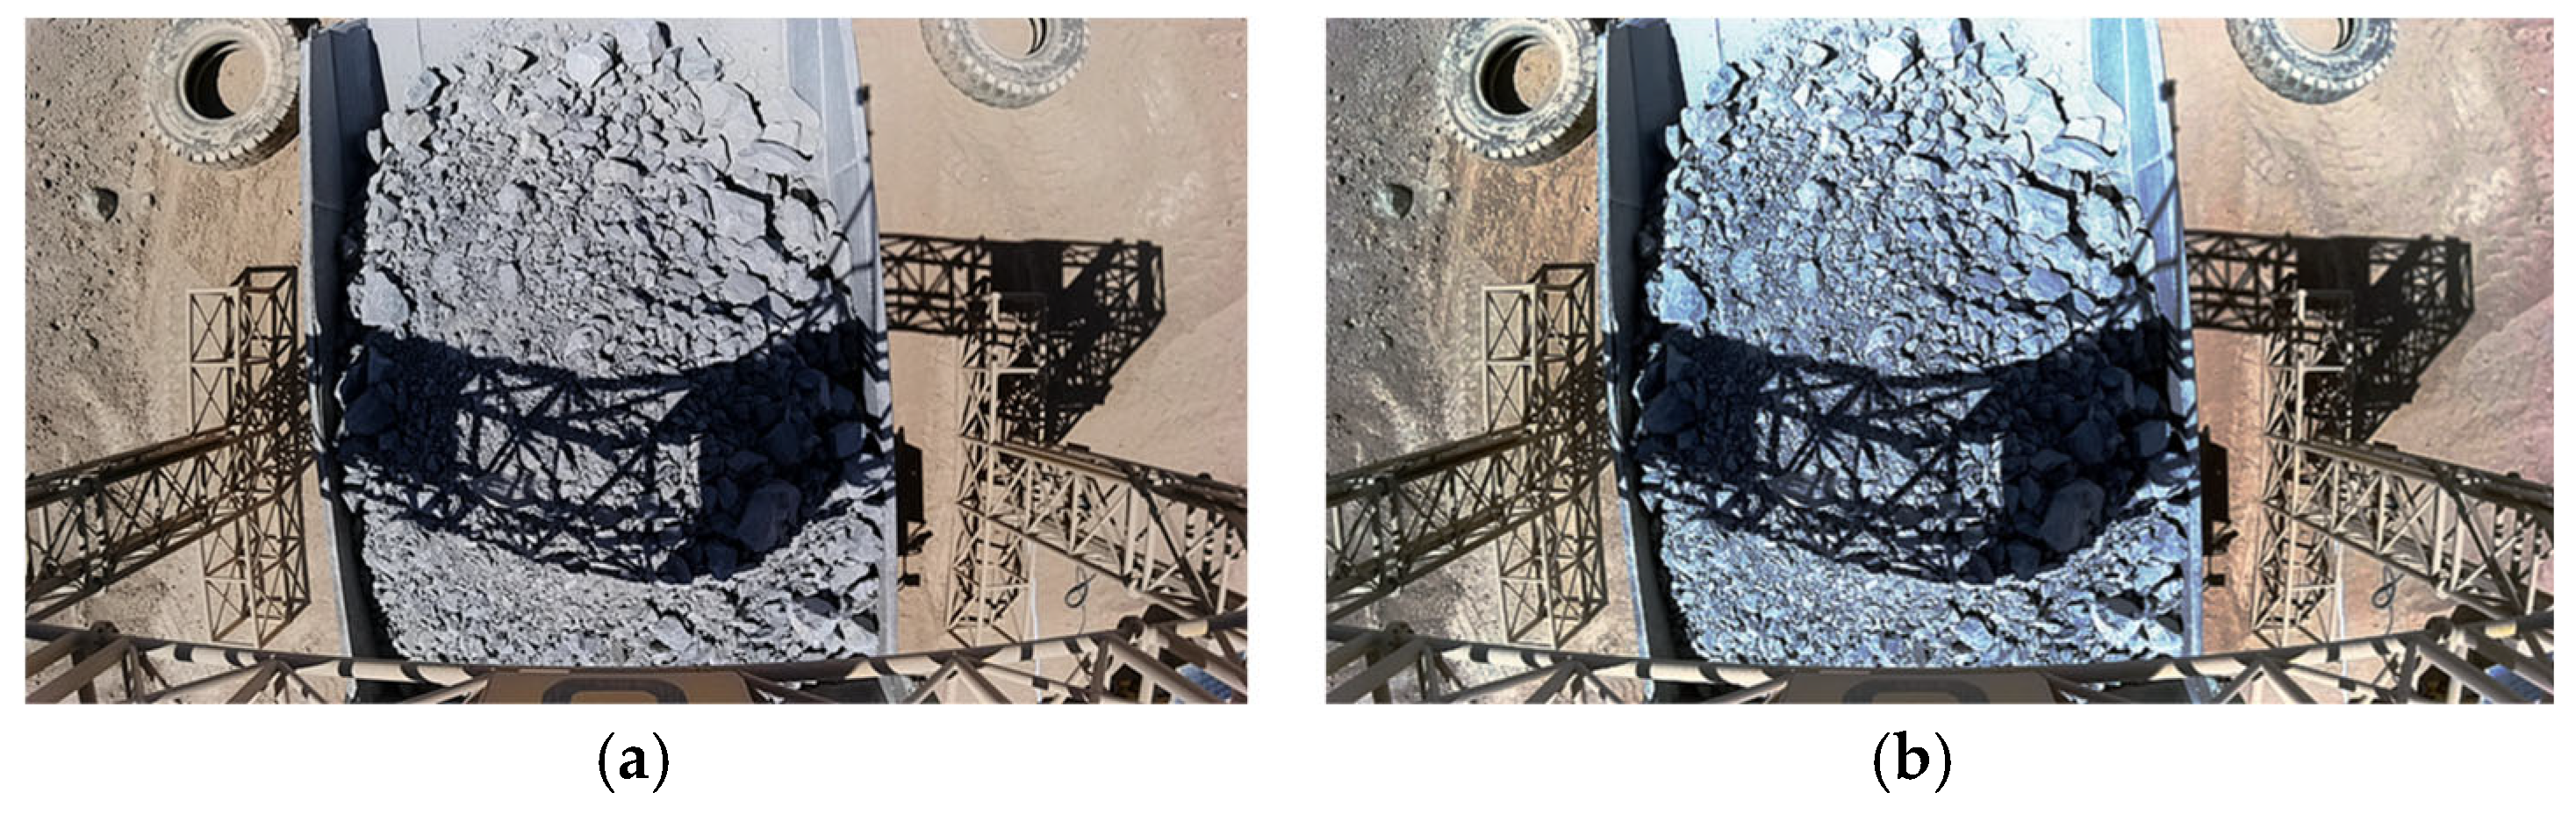
Figure 9.
Comparison of images before and after filtering processing: (a) before processing; (b) after processing.
Figure 9.
Comparison of images before and after filtering processing: (a) before processing; (b) after processing.
Figure 10.
Comparison of images before and after histogram equalization processing: (a) before processing; (b) after processing.
Figure 10.
Comparison of images before and after histogram equalization processing: (a) before processing; (b) after processing.
Figure 11.
Fully automated annotation algorithm.
Figure 11.
Fully automated annotation algorithm.
Figure 12.
Labeling results: (a) before annotation; (b) after annotation; (c) partial annotation collection.
Figure 12.
Labeling results: (a) before annotation; (b) after annotation; (c) partial annotation collection.
Figure 13.
Data augmentation: (a) original image; (b) brightness adjustment; (c) center cropping; (d) vertical flip; (e) horizontal flip; (f) saturation adjustment.
Figure 13.
Data augmentation: (a) original image; (b) brightness adjustment; (c) center cropping; (d) vertical flip; (e) horizontal flip; (f) saturation adjustment.
Figure 14.
Normalized confusion matrix.
Figure 14.
Normalized confusion matrix.
Figure 15.
Model training and optimization process: (a) loss function curves; (b) evaluation metric curves.
Figure 15.
Model training and optimization process: (a) loss function curves; (b) evaluation metric curves.
Figure 16.
Comparison of fragmentation recognition results: (a) original image; (b) commercial software; (c) proposed model.
Figure 16.
Comparison of fragmentation recognition results: (a) original image; (b) commercial software; (c) proposed model.
Figure 17.
Comparison of cumulative fragmentation curves.
Figure 17.
Comparison of cumulative fragmentation curves.
Figure 18.
Flowchart of ROI region identification.
Figure 18.
Flowchart of ROI region identification.
Figure 19.
Comparison of recognition effects before and after ROI optimization: (a) before optimization; (b) after optimization.
Figure 19.
Comparison of recognition effects before and after ROI optimization: (a) before optimization; (b) after optimization.
Figure 20.
Shadow-specific data augmentation: (a) original image; (b) clash enhancement; (c) gamma transformation; (d) histogram equalization; (e) Laplacian enhancement; (f) LoG (Laplacian of Gaussian) object enhancement; (g) Msr; (h) Ssr.
Figure 20.
Shadow-specific data augmentation: (a) original image; (b) clash enhancement; (c) gamma transformation; (d) histogram equalization; (e) Laplacian enhancement; (f) LoG (Laplacian of Gaussian) object enhancement; (g) Msr; (h) Ssr.
Figure 21.
Shadow-specific data augmentation—comparison of recognition performance before and after shadow-specific data augmentation: (a) before optimization; (b) after optimization.
Figure 21.
Shadow-specific data augmentation—comparison of recognition performance before and after shadow-specific data augmentation: (a) before optimization; (b) after optimization.
Table 1.
OAK-D-W-PoE binocular camera parameters.
Table 1.
OAK-D-W-PoE binocular camera parameters.
| Parameter | RGB Camera | Binocular Camera |
|---|
| Image sensor | IMX378 | OV9282 |
| DFOV/HFOV/VFOV | 120°D/95°H/70°V | 150°D/128°H/80°V (RGBDAfter alignment 106°D/97°H/70°V) |
| Resolution | 12 MP (4032 × 3040) | 1 MP (1280 × 800) |
| Maximum frame rate | 60 FPS | 120 FPS |
| Focal length | 4.81 | 2.35 |
| Aperture (F.NO) | 2.0 | 2.2 |
| Focusing range | FF:60 cm–∞ | AF:19.6 cm–∞ |
| Lens size | 1/2.3 | 1/4 |
| Distortion | <1.0% | <1.5% |
| Pixel size | 1.55 μm × 1.55 μm | 3 μm × 3 μm |
| Shutter | Rolling shutter | Global shutter |
Table 2.
Model hyperparameter settings.
Table 2.
Model hyperparameter settings.
| Type | Configuration |
|---|
| Image size | 640*640*3 |
| Epochs | 1000 |
| Optimizer | SGD |
| Number of works | 16 |
| Learning rate | 0.01 |
| Patience | 50 |
| Disclaimer/Publisher’s Note: The statements, opinions and data contained in all publications are solely those of the individual author(s) and contributor(s) and not of MDPI and/or the editor(s). MDPI and/or the editor(s) disclaim responsibility for any injury to people or property resulting from any ideas, methods, instructions or products referred to in the content. |
© 2025 by the authors. Licensee MDPI, Basel, Switzerland. This article is an open access article distributed under the terms and conditions of the Creative Commons Attribution (CC BY) license (https://creativecommons.org/licenses/by/4.0/).


