1. Introduction
In modern manufacturing, robotic arms play a crucial role in adaptive production systems. However, due to their structural compliance, these robotic arms often experience significant chatter vibrations, which can adversely affect machining stability and precision. Addressing this issue is essential to ensure high productivity and accuracy in automated machining environments. Force-controlled end-effectors have been shown to mitigate these vibrations and improve machining performance [
1]. Additionally, recent studies have proposed novel disturbance compensation methods, integrating reaction force observers and extremum-seeking algorithms to enhance machining robustness and precision [
2].
Machining efficiency and stability are critical for achieving high productivity and precision. One of the key challenges in machining processes is the mitigation of chatter, an unstable vibration phenomenon that adversely affects surface finish, tool life, and dimensional accuracy. To address this issue, researchers have extensively investigated chatter suppression methods, including process damping, spindle speed optimization, and adaptive control techniques [
3]. Among these, optimizing the feed rate has gained significant attention due to its direct impact on cutting forces, stability, and machining efficiency.
Cutting force modeling is essential for understanding the dynamic behavior of machining systems and ensuring process stability. Analytical approaches such as the mechanistic model proposed by Budak [
4] have effectively estimated cutting forces by accounting for tool geometry and material interaction. Campomanes and Altintas [
5] further extended this by introducing a time-domain simulation method that enhances force prediction accuracy under low radial immersion conditions, which are common in dynamic milling. Although these models are physically interpretable, they may still face limitations when applied to complex robotic environments. To address this, Vaishnav et al. [
6] proposed a machine learning-based instantaneous force model using a neural network trained on experimental data, which demonstrated high accuracy in end milling tasks. This trend highlights the complementary roles of physics-based and data-driven methods in developing robust force models for chatter prediction and machining optimization.
Once a validated cutting force model is established, it becomes possible to analyze the influence of feed rate variations on chatter intensity under different axial and radial depths of the cut. Previous studies have demonstrated that optimizing feed rate can significantly improve machining stability by shifting the system away from unstable operating regions [
7]. Kiswanto et al. further emphasized the importance of spindle speed, feed rate, and machining time on surface roughness and burr formation in micro-milling operations [
8]. In addition, the work by J. Li et al. explored the application of mechanistic cutting force models specifically for robotic deburring, highlighting the interplay between robot compliance and process dynamics [
9].
Nevertheless, determining the optimal feed rate for a given machining condition remains a complex task due to the nonlinear interactions between cutting parameters and process stability. Recent research has emphasized the need for integrated data-driven and physics-informed approaches. For instance, K. Guo et al. proposed an active contact force actuator design for chatter suppression in robotic milling, demonstrating improved machining stability through active force control [
10]. Similarly, X.-B. Qin et al. introduced a continuous feed rate scheduling strategy synchronized with spindle speed variations, effectively reducing chatter while enhancing productivity [
11]. These advancements underscore the growing role of intelligent control and adaptive scheduling in machining optimization.
Moreover, the study by I. Oleaga et al. presented a machine learning-based approach for chatter prediction in heavy-duty milling operations, validating the potential of predictive analytics to anticipate instability before defects occur [
12]. Such frameworks, which integrate empirical modeling, machine learning, and sensor feedback, form a promising foundation for enhancing machining autonomy, robustness, and real-time adaptability in robotic manufacturing systems.
Traditional regression models often struggle to accurately capture these nonlinear dependencies, making it difficult to develop reliable predictive models for machining optimization. To address this challenge, machine learning techniques have been extensively explored for predictive modeling in machining. Various algorithms, including support vector machines (SVM), regression models, and ensemble learning approaches, have been employed to model and optimize machining parameters effectively [
13]. Among these, gradient boosting algorithms have demonstrated superior performance in machining parameter optimization due to their ability to handle complex, nonlinear relationships. XGBoost (Extreme Gradient Boosting), introduced by Chen and Guestrin [
14], has been widely recognized for its effectiveness in capturing intricate nonlinear dependencies in regression problems. Unlike traditional regression models, XGBoost leverages an ensemble of decision trees, improving predictive accuracy through iterative learning and regularization. Its ability to handle nonlinearities makes it particularly well-suited for machining optimization, where process dynamics are influenced by multiple interacting parameters.
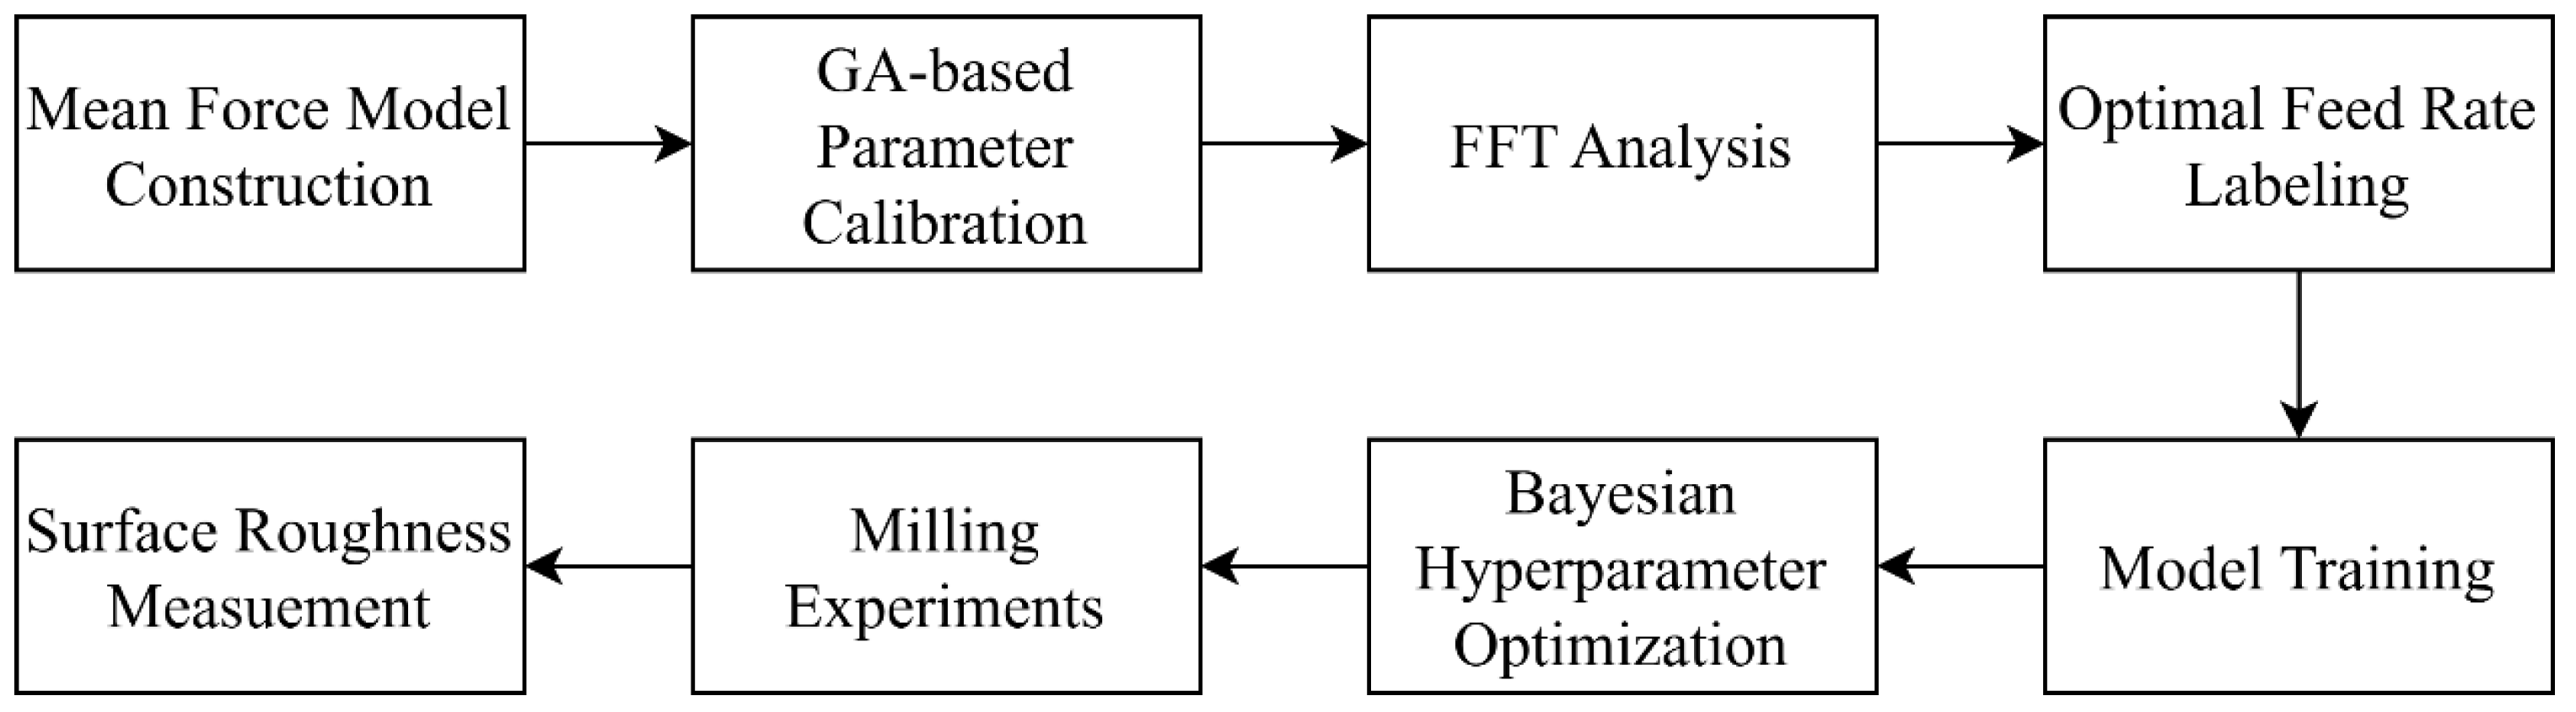
In this study, XGBoost is employed to predict the optimal feed rate under varying machining conditions by integrating cutting force dynamics with data-driven modeling. This approach allows for real-time feed rate optimization, minimizing chatter risks while enhancing machining efficiency. Compared to conventional empirical methods, XGBoost offers superior generalization to unseen machining conditions, reducing the reliance on extensive experimental trials. The primary objective of this study is to develop an XGBoost-based approach for feed rate optimization in machining. The methodology involves constructing a GA-calibrated cutting force model, analyzing the impact of feed rate on chatter intensity, and training an XGBRegressor model to predict optimal feed rates for given machining conditions. By integrating cutting dynamics with machine learning, this research aims to enhance machining efficiency and stability while reducing the need for time-consuming experimental validations. By generating physics-informed labels through a GA-calibrated force model, our GA–XGBoost framework enhances prediction accuracy while reducing experimental overhead—an advantage over typical hybrid ML methods that rely on empirical chatter classification. An overview of the proposed workflow is illustrated in
Figure 1, providing a visual summary of the complete methodology adopted in this study.
2. Force Modeling for Machining Stability Analysis
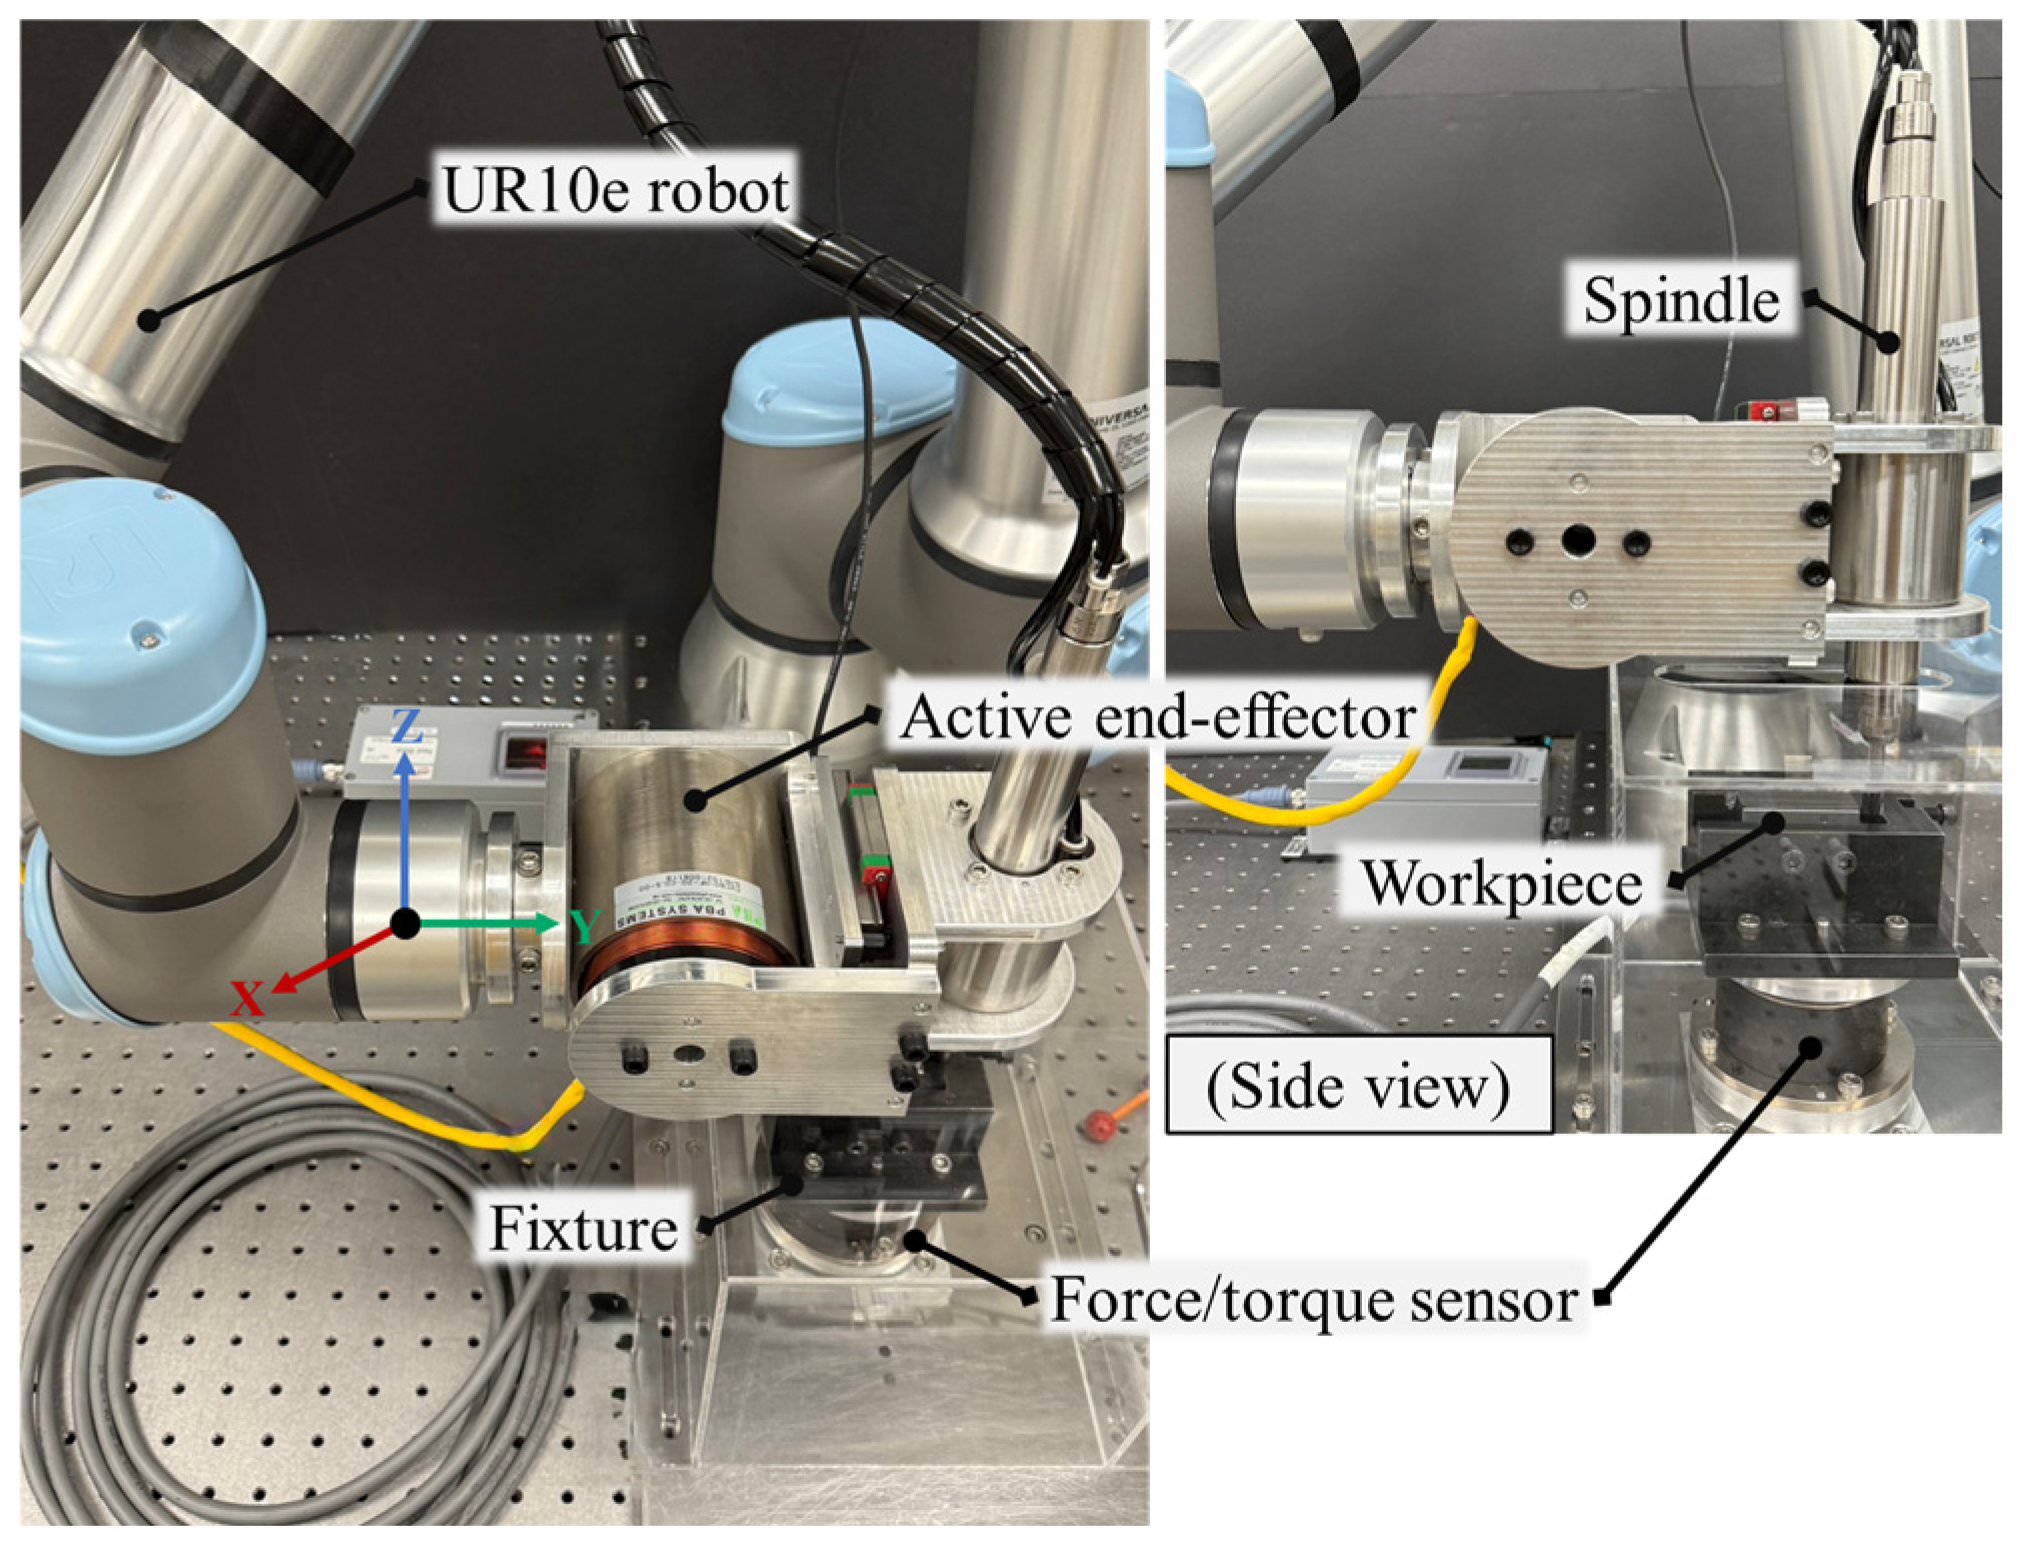
The experimental setup for the cutting force modeling process is illustrated in
Figure 2. In this study, a voice-coil-motor-driven active end-effector is mounted on the flange of the UR10e manipulator, enabling precise control of the cutting spindle’s position along the
x-axis via the SERVOTRONIX CDHD2 servo drive. Three sets of experiments are conducted at feed rates of 120 mm/min, 180 mm/min, and 240 mm/min, with force data captured using an ATI-9105 force/torque sensor, which is installed beneath the fixture holding the workpiece. All experiments were carried out using a climb milling strategy, where the cutter rotates in the same direction as the feed motion.
To model the instantaneous milling force of the measured system, Kienzle’s exponential model is employed [
15], which is expressed as
where
,
, and
are the instantaneous milling forces in the tangential, normal, and axial directions, respectively. Here,
represents the axial depth of cut,
is the instantaneous chip thickness, and
,
, and
are the empirical parameters corresponding to each force direction. The exponent
is a common empirical parameter shared across all three force components.
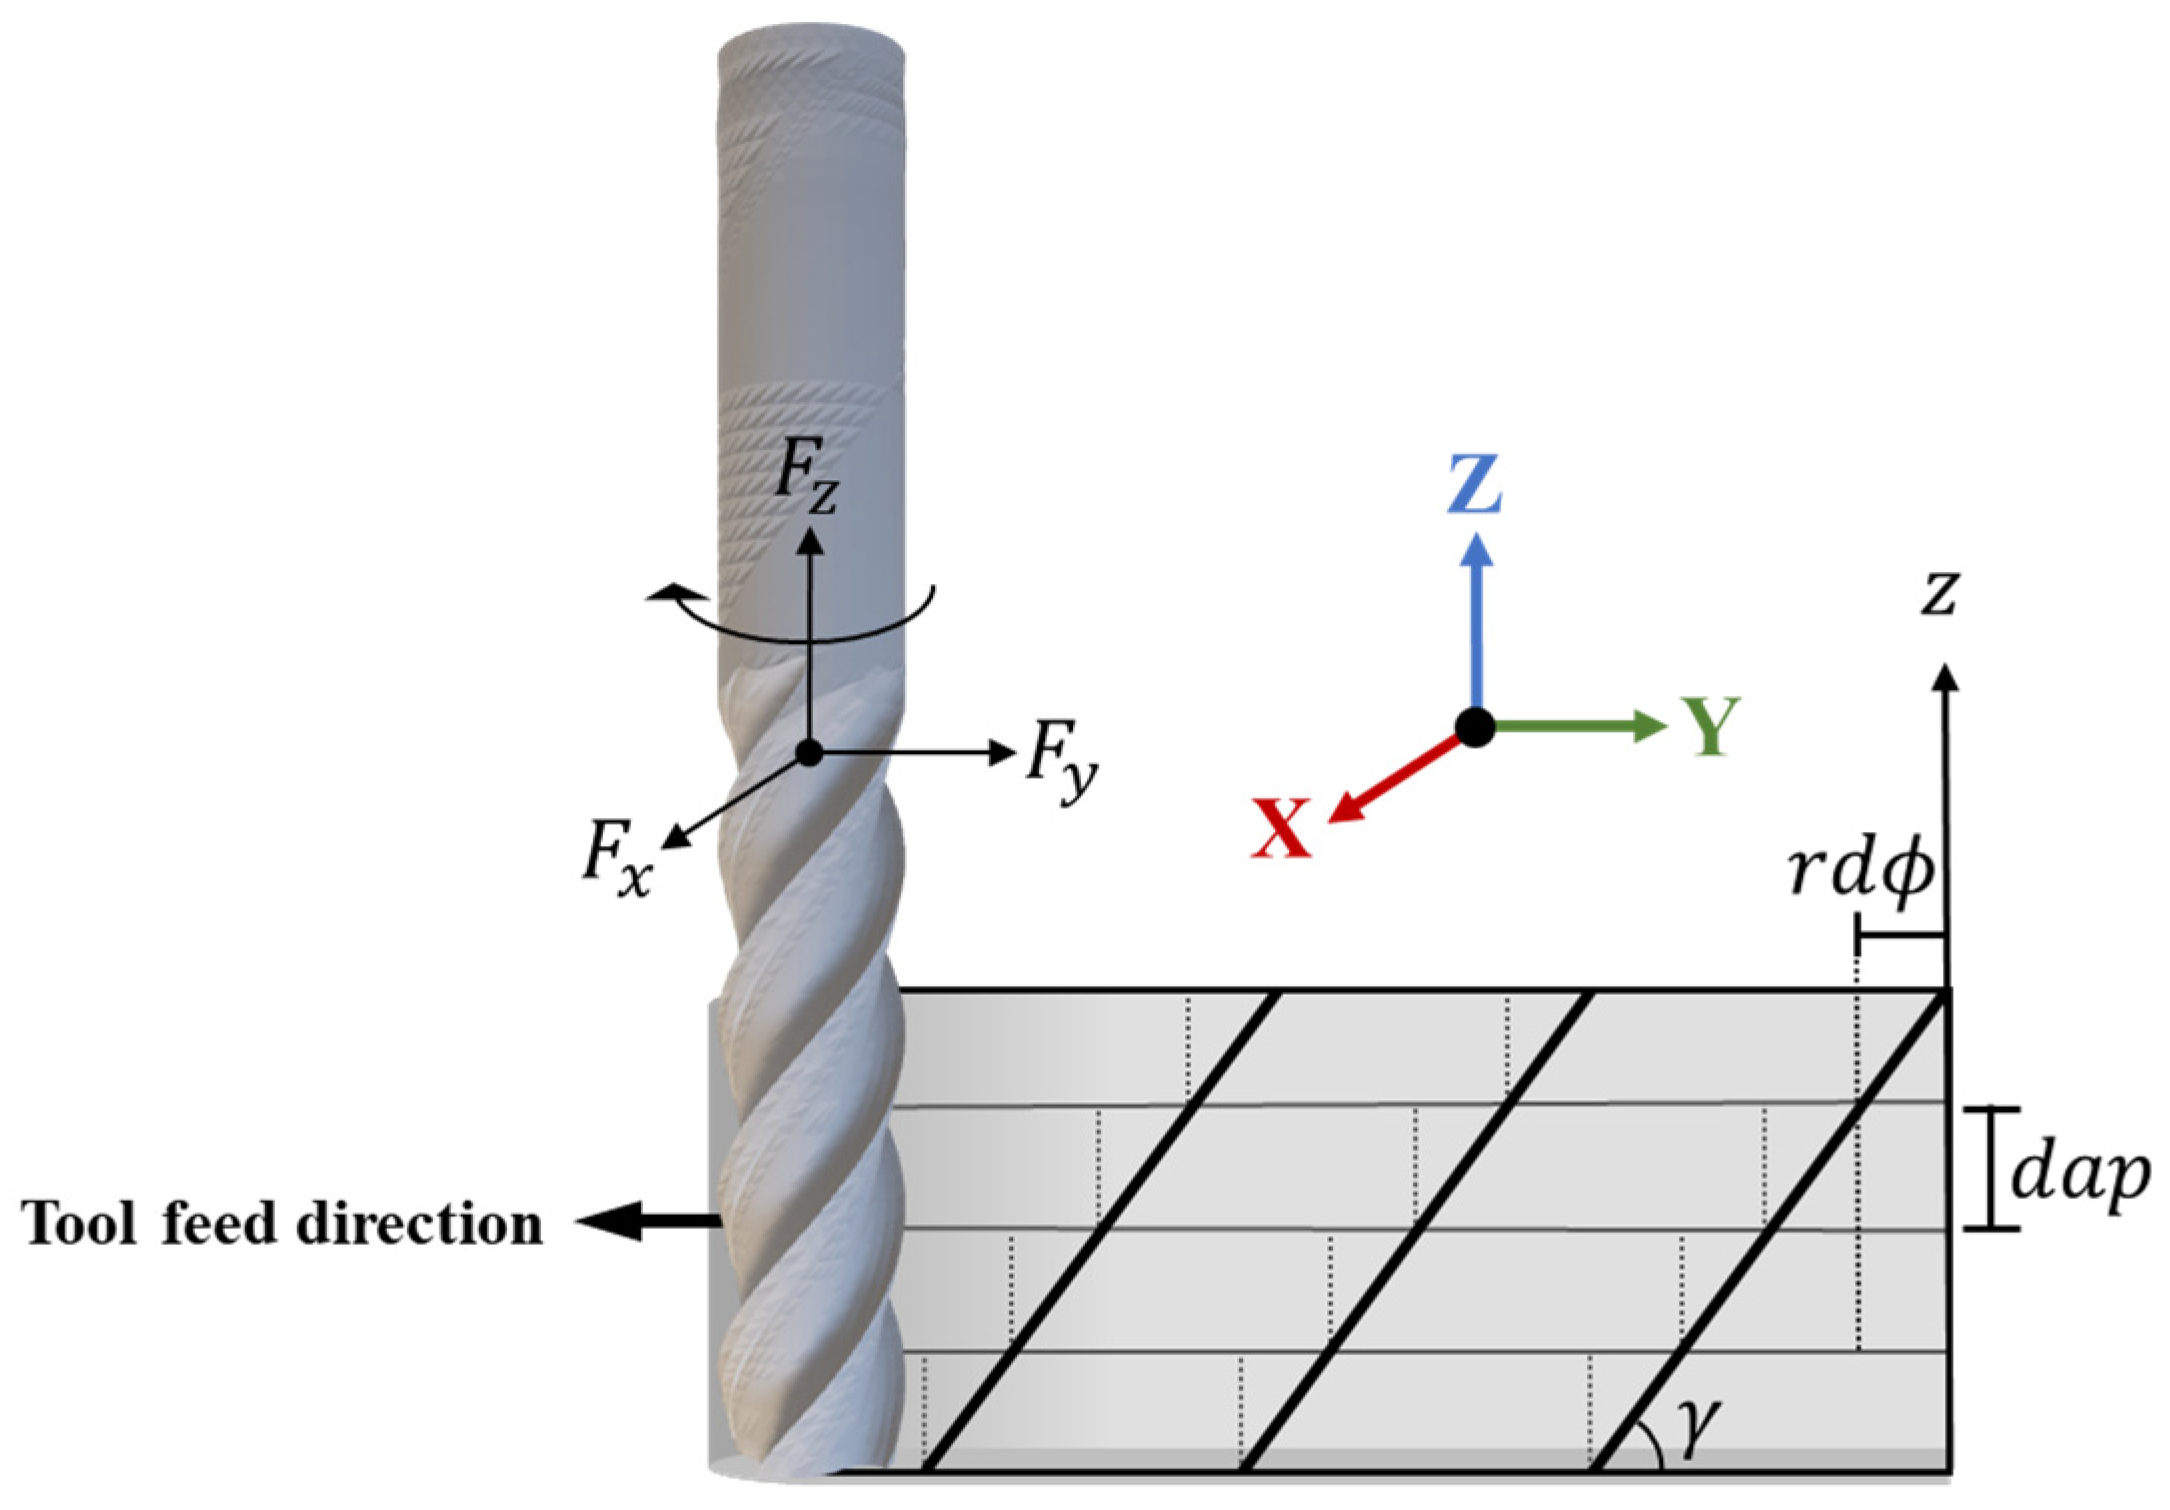
The helix angle of the milling cutter can be approximated using a multiple straight-tooth model, as illustrated in
Figure 3, in which the helical flutes are unrolled and represented as inclined straight lines to enable simplified analytical treatment. Across the axial direction, the cutter is discretized into multiple thin slices, each with a thickness of
. Consequently, the milling force acting on each slice can be expressed as follows:
in which
is the angular increment,
denotes the helix angle. The instantaneous chip thickness is given by
where
represents the tooth index of the endmill,
is the slice index,
is the feed per tooth in m/tooth,
is the linear feed rate in m/s,
is the spindle speed in rpm,
is the number of teeth per revolution. The terms
and
correspond to the previous and current surface vibrations due to regenerative chatter. Finally, the immersion angle for each slice is given by
The instantaneous milling force is then determined by summing the contributions from (2), (3), and (4), expressed as:
where
if
or
. Here,
and
denote the entry and exit angles, respectively, under down-milling conditions, where
represents the radial depth of cut.
To determine the empirical parameters of the exponential model, a genetic algorithm (GA) is employed to optimize the fit between the measured force data and the instantaneous milling force computed using (7). The objective function utilized in the optimization process is expressed as:
where
represents the model parameters being optimized,
is the measured cutting force at the sample index
along force component
(
),
is the predicted cutting force computed using the current model parameters and
is the total number of data samples. This function minimizes the sum of squared errors (SSE) between the measured and predicted forces, ensuring an optimal parameter fit for accurate cutting force modeling. The detailed GA settings are provided in
Table 1. A population size of 100 was selected based on the recommendation by O. Roeva et al., who demonstrated that relatively small population sizes can maintain optimization performance while reducing computational cost in continuous domains [
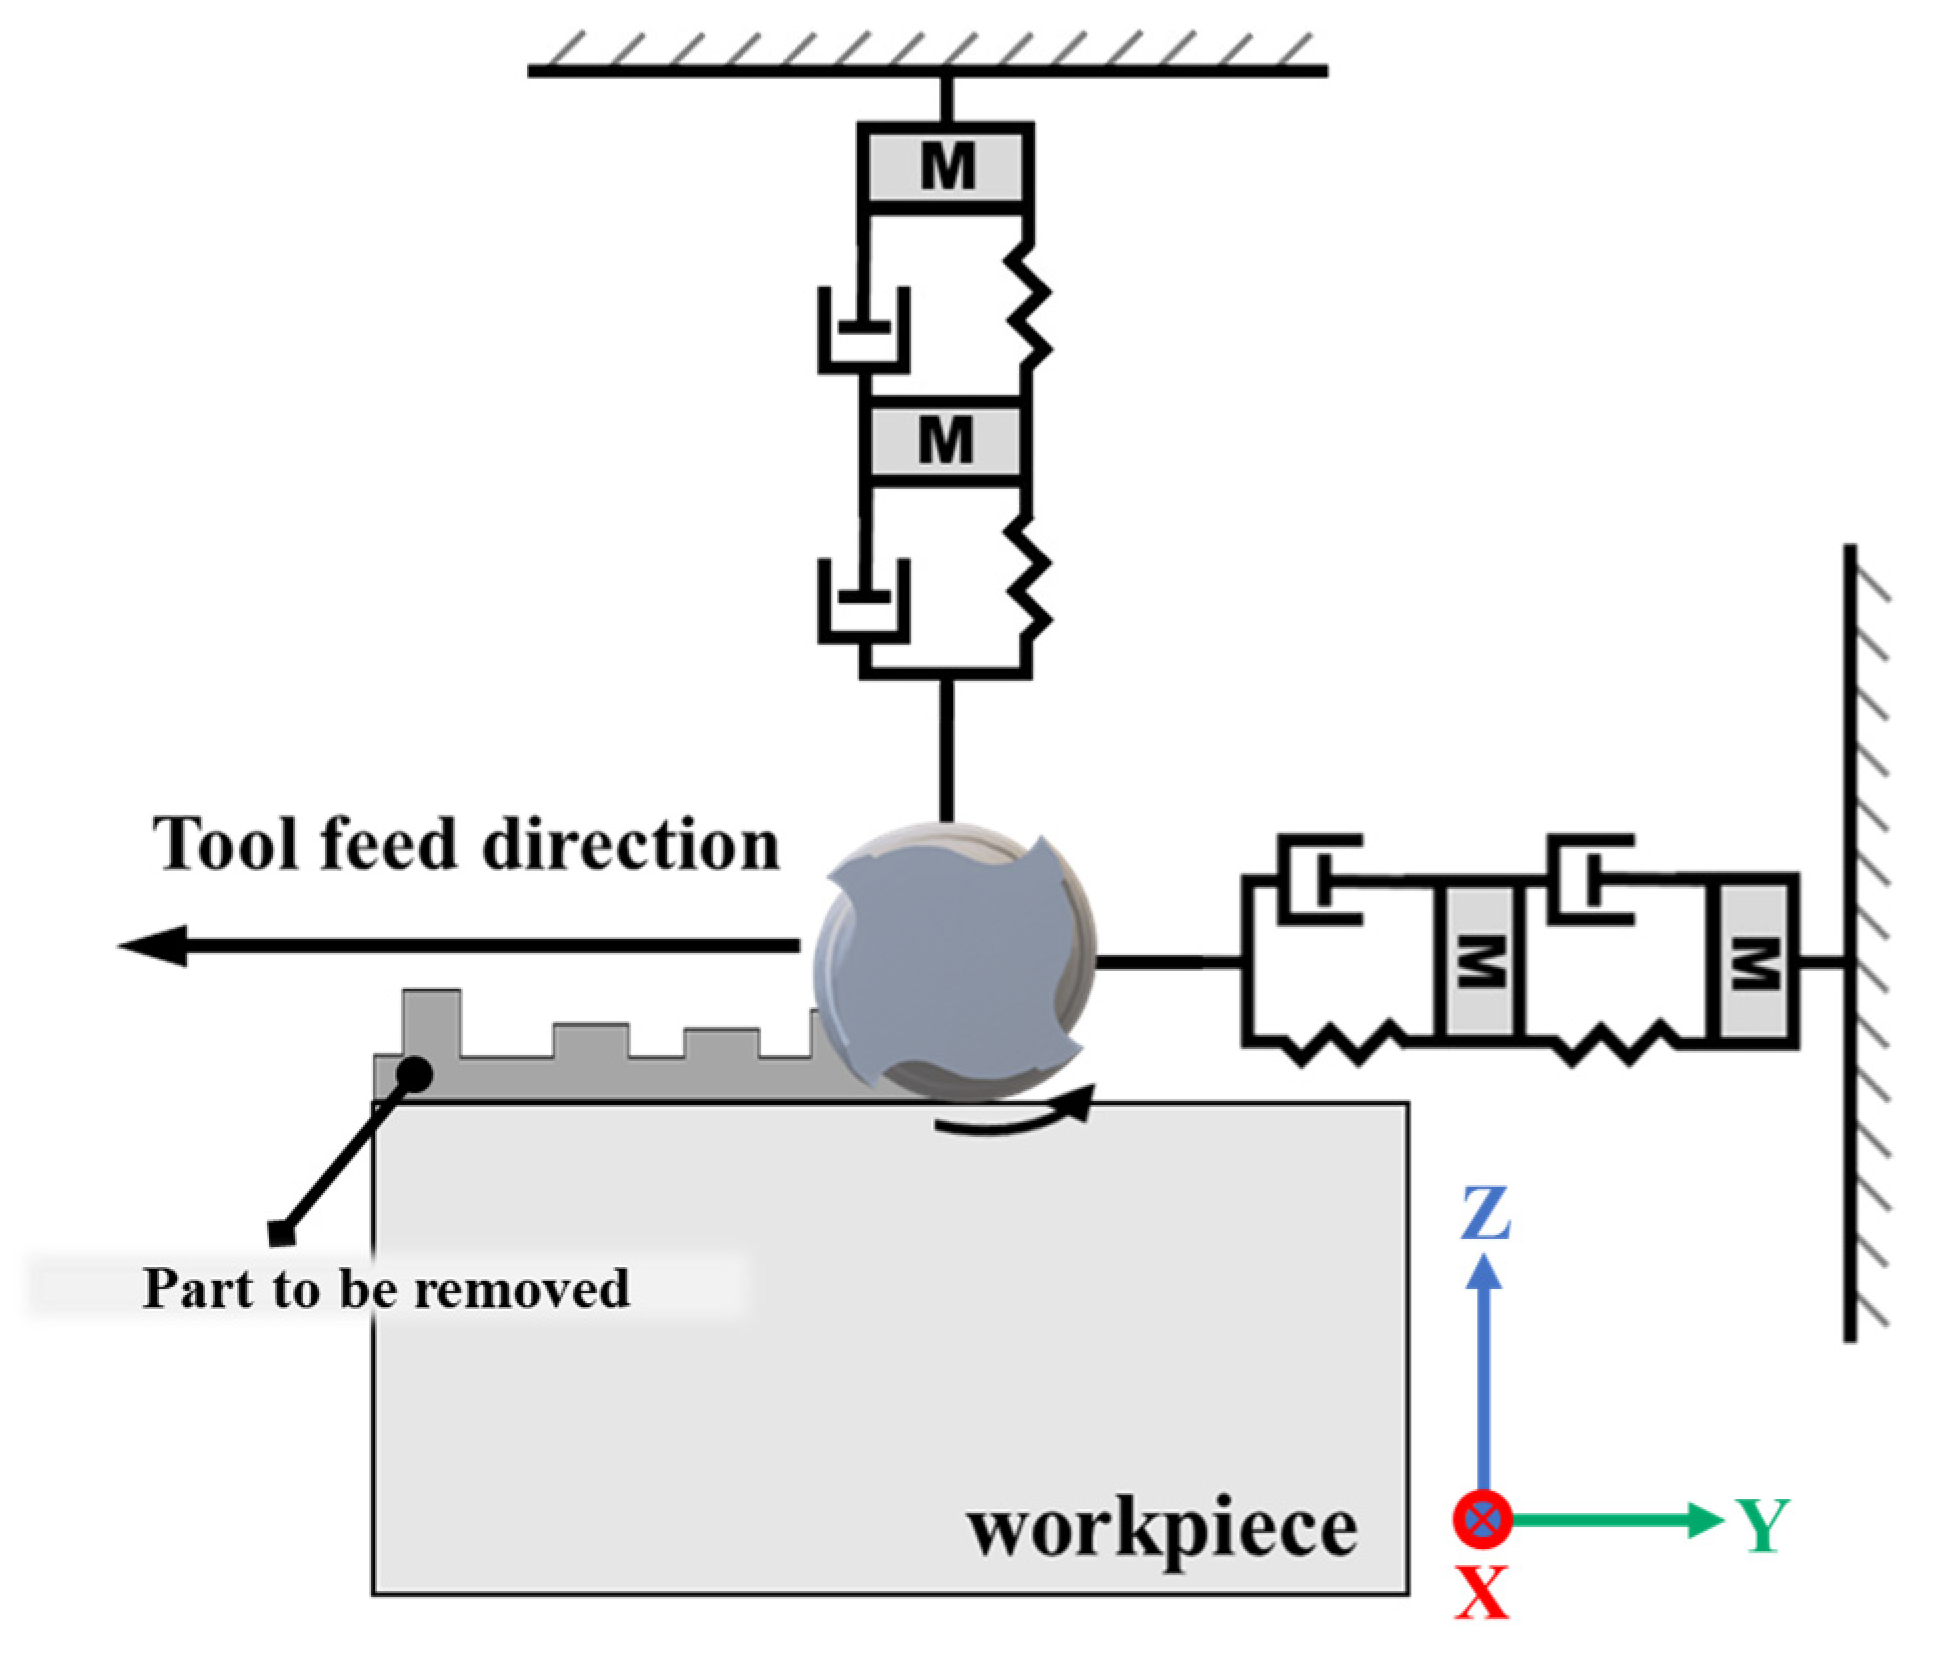
16]. In our application, increasing the population size beyond 100 did not yield any meaningful reduction in the sum of squared errors (SSE), yet significantly increased computation time. In this approach, surface vibrations are modeled using a two-degree-of-freedom spring-damper-mass system, as illustrated in
Figure 4, which computes the displacement of the tooltip caused by the vibration modes of the robotic system.
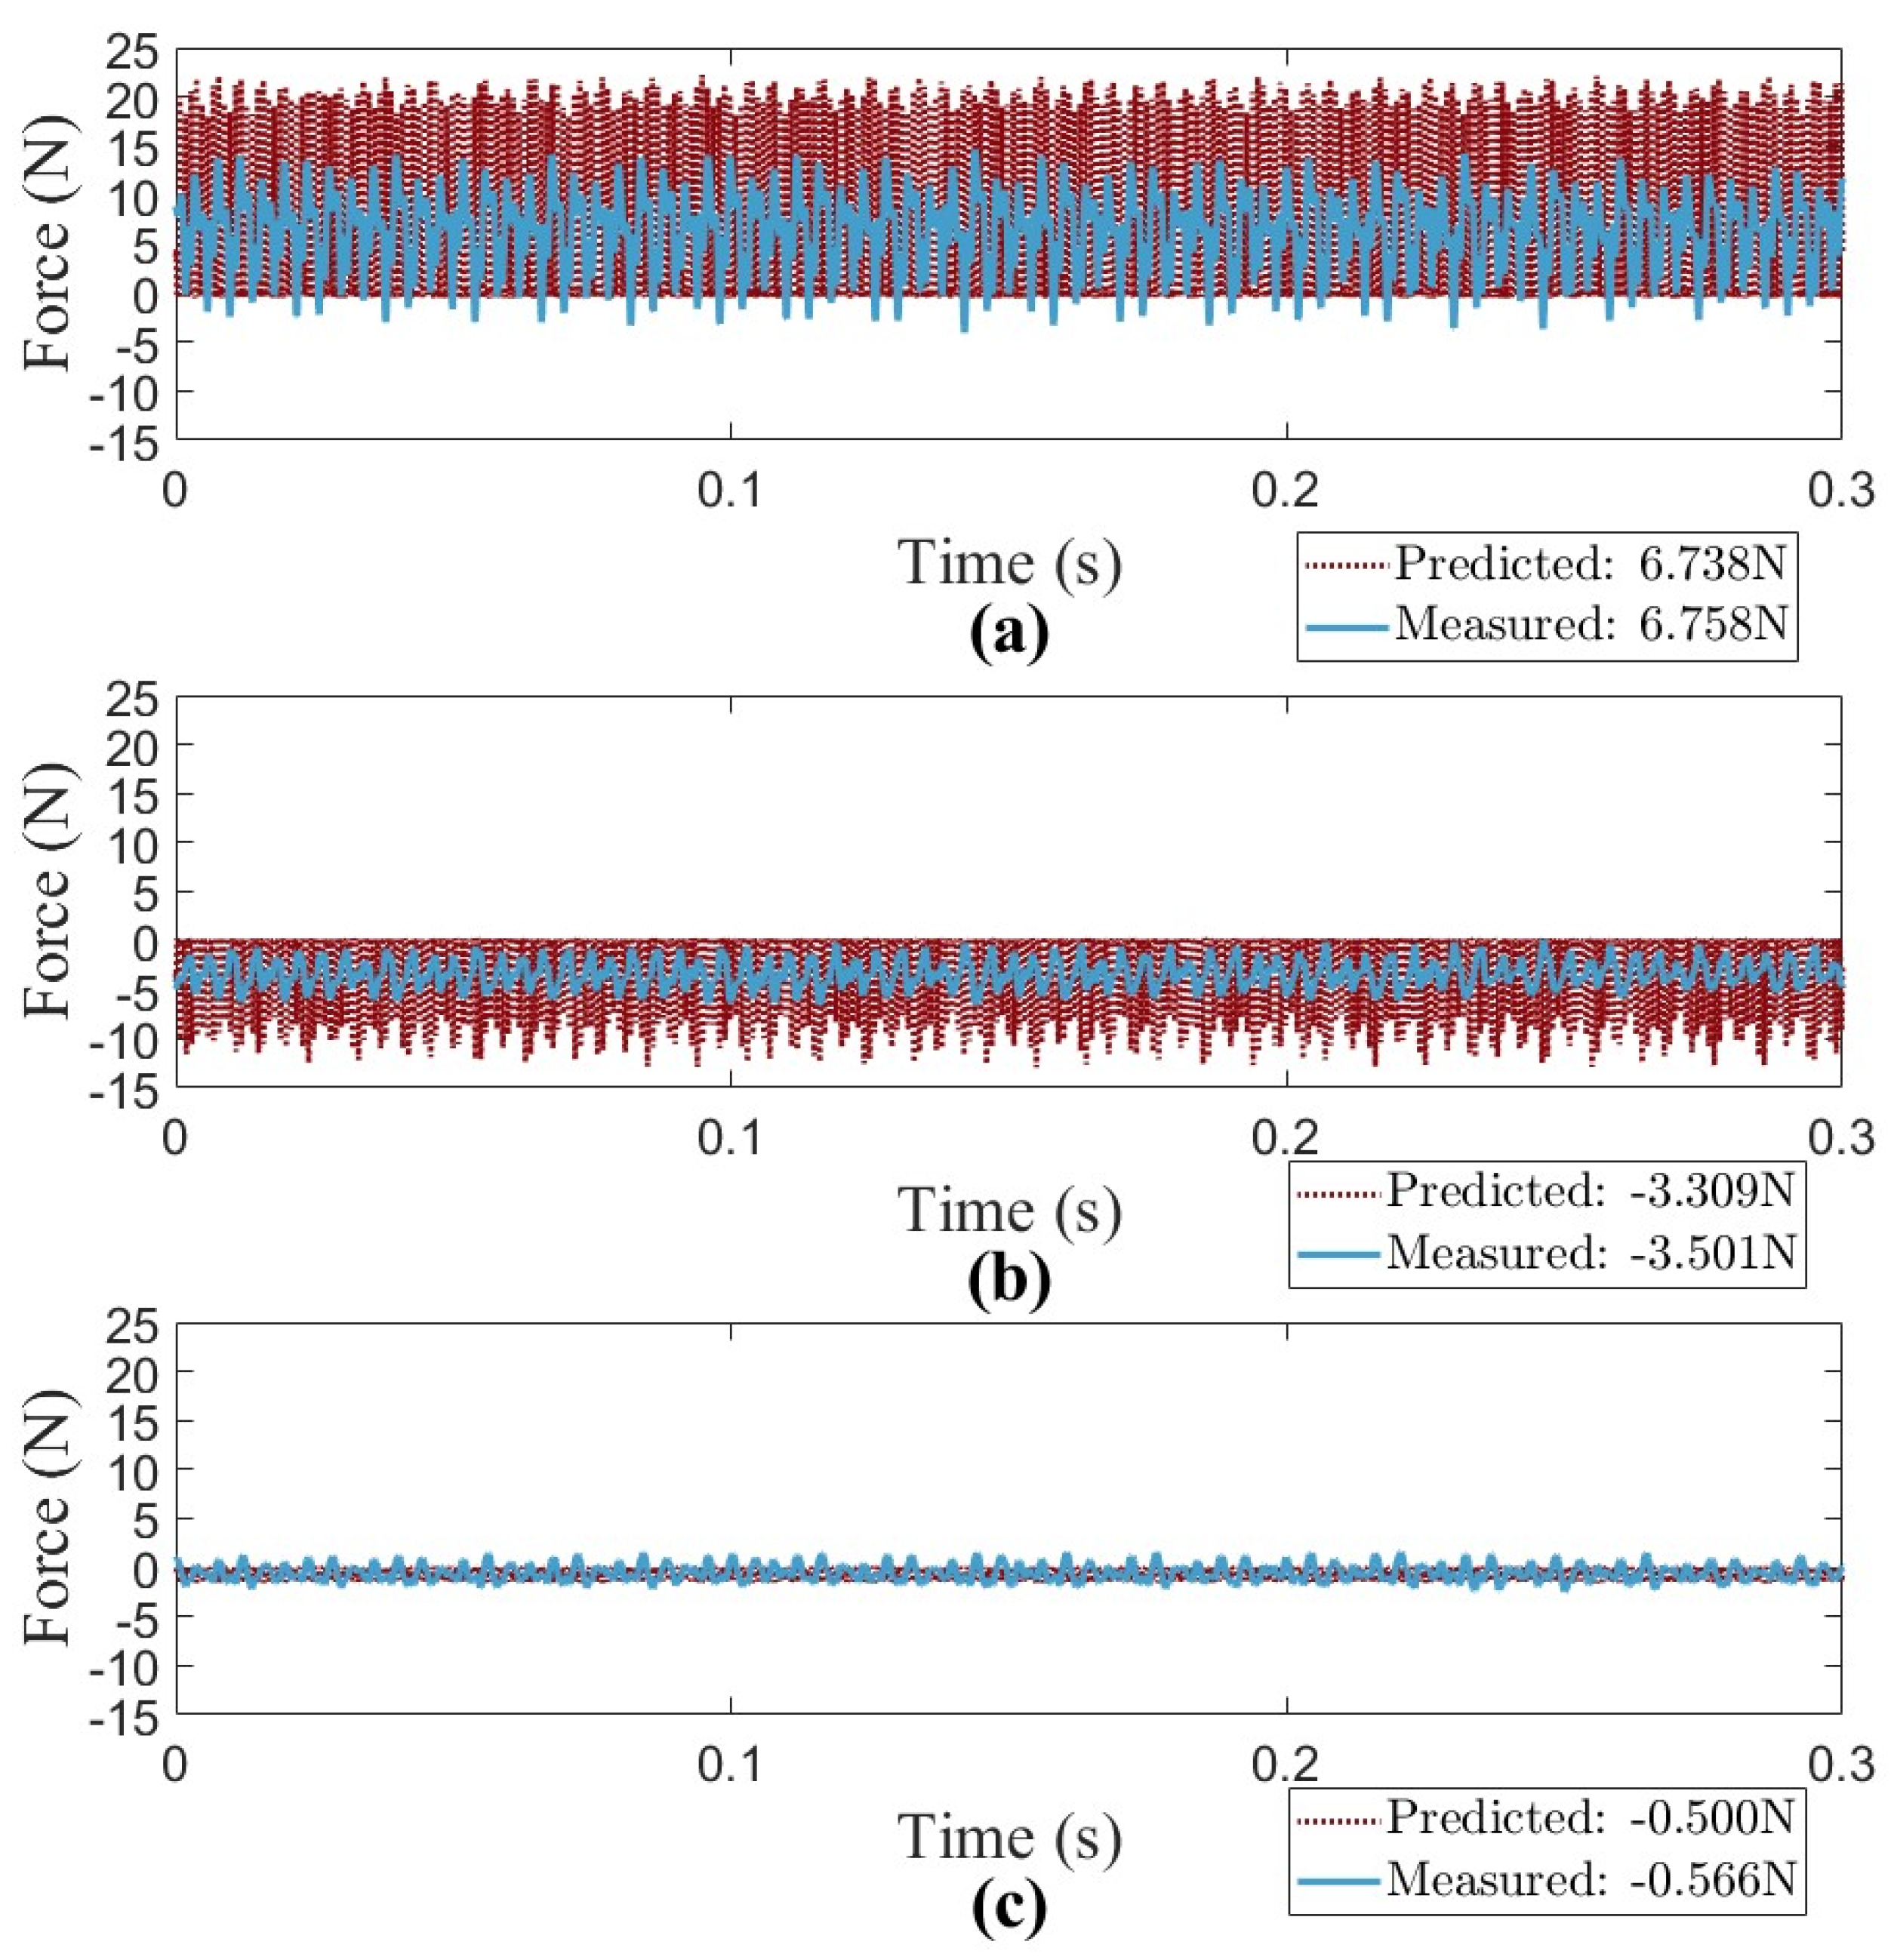
The fitted results are presented in
Figure 5 and
Figure 6, where the identified parameters are
,
,
, and
. Additionally, the dominant vibration modes of the robotic milling system are observed at approximately 250 Hz and 750 Hz, with a tooth passing frequency of 1000 Hz (i.e.,
rpm and
). The stiffness and damping ratios for the two vibration modes are summarized in
Table 2. As shown in
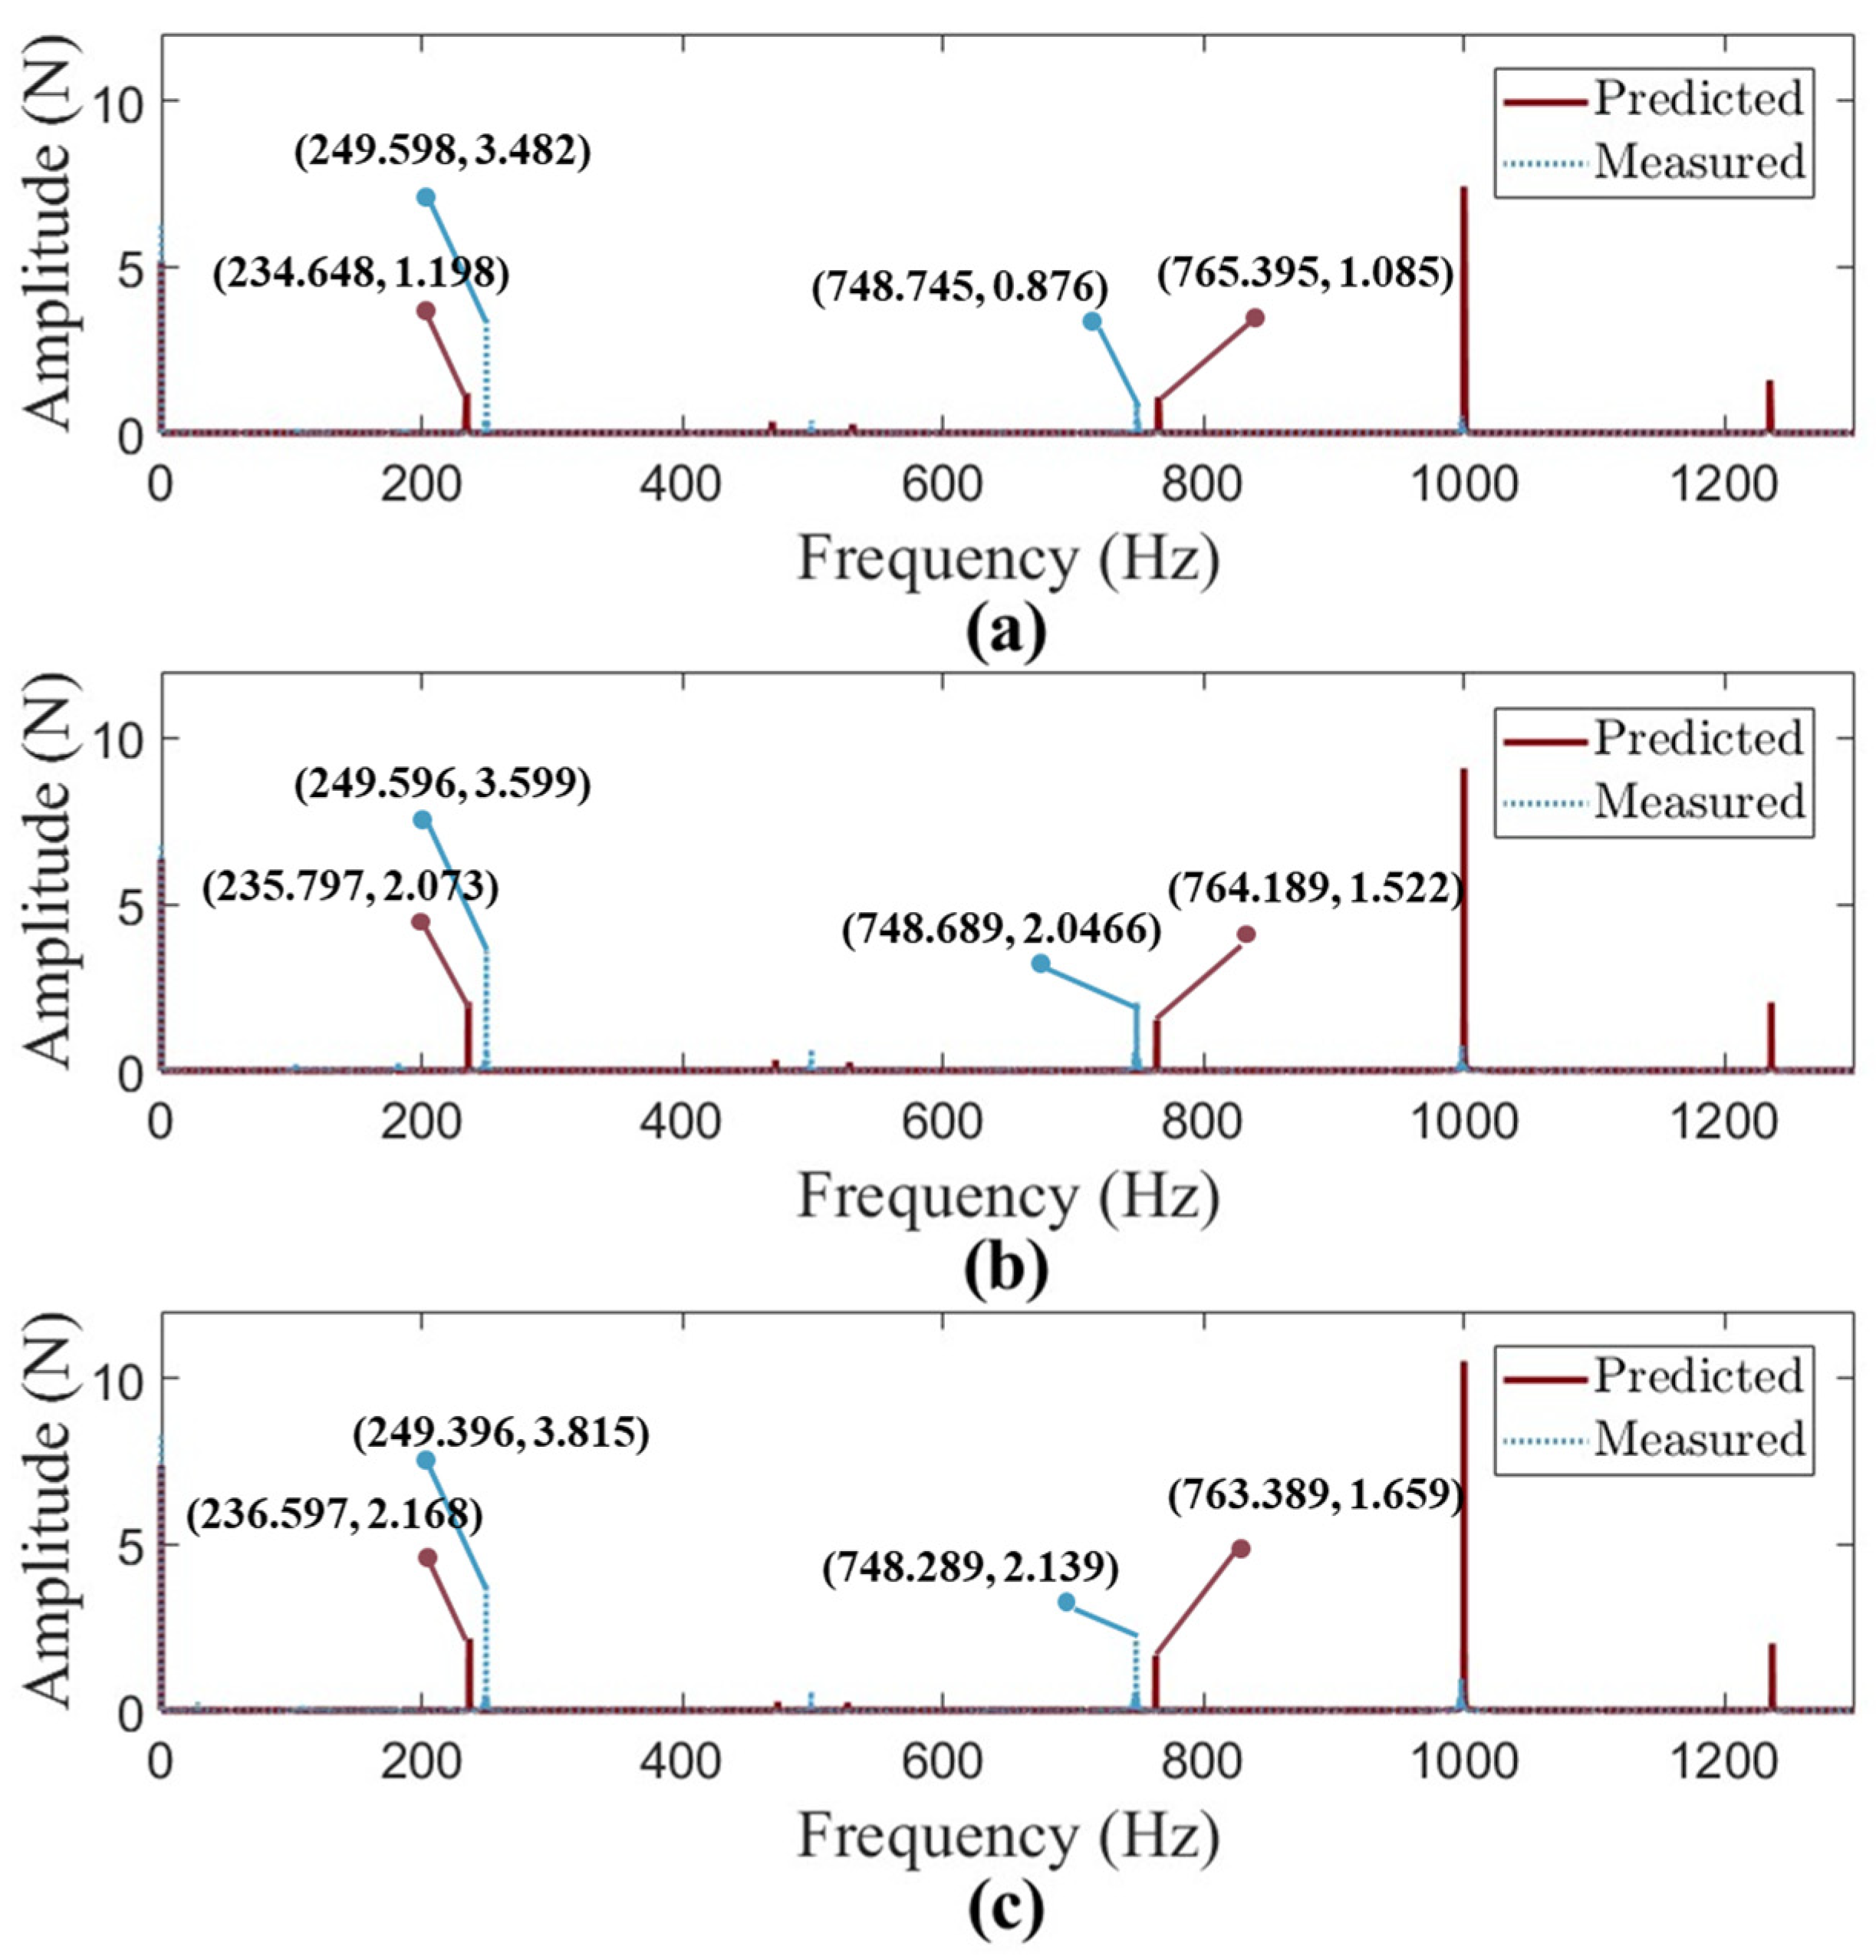
Figure 5, the mean force values are accurately predicted, demonstrating the model’s reliability. Furthermore, the frequency responses in
Figure 6 indicate that the proposed model effectively captures the system dynamics, making it suitable for machine learning-based data acquisition. It is important to note that the measured amplitude at the tooth-passing frequency is affected by the force/torque sensor’s built-in post filter (cutoff frequency around 1200 Hz), which results in a lower measured amplitude compared to the predicted forces.
3. Machine Learning Based Feed Rate Prediction
In this chapter, we leverage this model to generate a comprehensive dataset of cutting force values under varying machining conditions. This dataset, constructed using a data-driven approach, serves as the foundation for frequency analysis using Fast Fourier Transform (FFT) and the subsequent development of a machine learning model to predict the optimal feed rate that minimizes chatter and enhances machining stability.
3.1. Data Generation and Frequency Analysis
Using the cutting force model developed in
Section 2, this study generates theoretical cutting force data by employing a data-driven methodology. The dataset is constructed by systematically varying machining parameters, including axial depth of cut (1.5 mm to 2.0 mm, with an increment of 0.05 mm), radial depth of cut (0.5 mm to 1.5 mm, with an increment of 0.05 mm), and feed rate (120 mm/min to 240 mm/min, with an increment of 6 mm/min). By systematically adjusting these parameters, a dataset representing a wide range of machining conditions is constructed. This extensive dataset is essential for training a neural network model capable of predicting optimal feed rates under different machining conditions.
For each combination of machining parameters, cutting force predictions are computed. However, not all generated data is directly used for neural network training. Only the data corresponding to stable machining conditions, identified through FFT-based magnitude minimization, is chosen for training the neural network.
To determine the optimal feed rate for stable machining, the generated cutting force data undergoes Fast Fourier Transform (FFT) analysis. The FFT conversion allows for the identification of dominant frequency components in the cutting force signals. According to the principles of machining chatter, chatter vibrations occur at multiples of the spindle speed frequency. By analyzing the magnitude of these frequency components, the feed rate corresponding to the lowest vibration magnitude is selected as the optimal feed rate for each machining condition. In an ideal machining process without chatter, the primary frequency component in the FFT spectrum should concentrate on the tooth passing frequency:
where
is the number of cutter teeth and
is the spindle speed frequency. This frequency represents the periodic force fluctuations caused by the tool engaging with the workpiece. The spindle speed frequency,
represents the number of spindle rotations per second and is calculated as:
where
is the spindle speed in revolutions per minute (RPM). This fundamental frequency serves as a reference for identifying chatter frequencies and their harmonics in the FFT spectrum.
However, when chatter occurs, additional frequency components appear at integer multiples of the spindle speed:
These additional peaks indicate unstable cutting conditions and are indicative of chatter-induced vibrations.
To identify the optimal feed rate, the FFT spectrum is analyzed by evaluating the combined magnitude of frequency components at the first, second, and third harmonics of the spindle speed. Specifically, the total magnitude within a
range around each harmonic frequency
(where
) is computed as:
where
represents the magnitude of the frequency component at frequency
. The
bandwidth was selected to accommodate two key factors: (1) potential frequency shifts between simulated and measured dominant vibration modes due to modeling simplifications, and (2) spectral leakage effects commonly observed in FFT analysis. This margin ensures that harmonics with slightly shifted peaks are still captured, preserving robustness in chatter evaluation.
For each set of machining parameters, the FFT spectrum is examined, and the feed rate that minimizes is identified as the optimal feed rate, as it corresponds to the most stable cutting condition with the least chatter influence. The process iterates through all machining conditions, storing the optimal feed rate associated with each axial and radial depth of cut.
3.2. Data Preparation and Feature Engineering
To determine the optimal feed rate that minimizes machining instability, this study employs XGBoost regression, a powerful machine learning algorithm designed for handling nonlinear relationships. The model predicts the optimal feed rate based on specific machining conditions, enabling efficient and automated feed rate selection.
Following frequency analysis, only data corresponding to stable machining conditions—where chatter vibrations are minimized—are selected for model training. This ensures that the regression model is trained exclusively on machining conditions that yield optimal feed rates for chatter suppression.
The dataset used for training is derived from theoretical cutting force model simulations, systematically varying machining parameters across a range of conditions. The dataset consists of a total of 232 data points, each containing key machining parameters and their corresponding optimal feed rate values. The input features include axial depth of cut () and radial depth of cut ().
To enhance the model’s ability to capture nonlinear relationships between machining parameters and feed rate, feature engineering is performed: Quadratic terms () are introduced to account for second-order interactions that influence machining stability and chatter behavior.
To assess the influence of each input feature on prediction performance, we employed gain-based feature importance from the trained XGBoost regression model. In gradient boosting trees, the gain is defined as the reduction in the loss function achieved by splitting a node on a particular feature. The gain is computed as:
where
and
represent the accumulated first- and second-order gradients of the loss function at the left (L) and right (R) branches, respectively, and
,
are regularization terms. The cumulative gain over all splits involving a given feature provides a supervised and interpretable importance score that reflects the feature’s contribution to the model’s predictive performance.
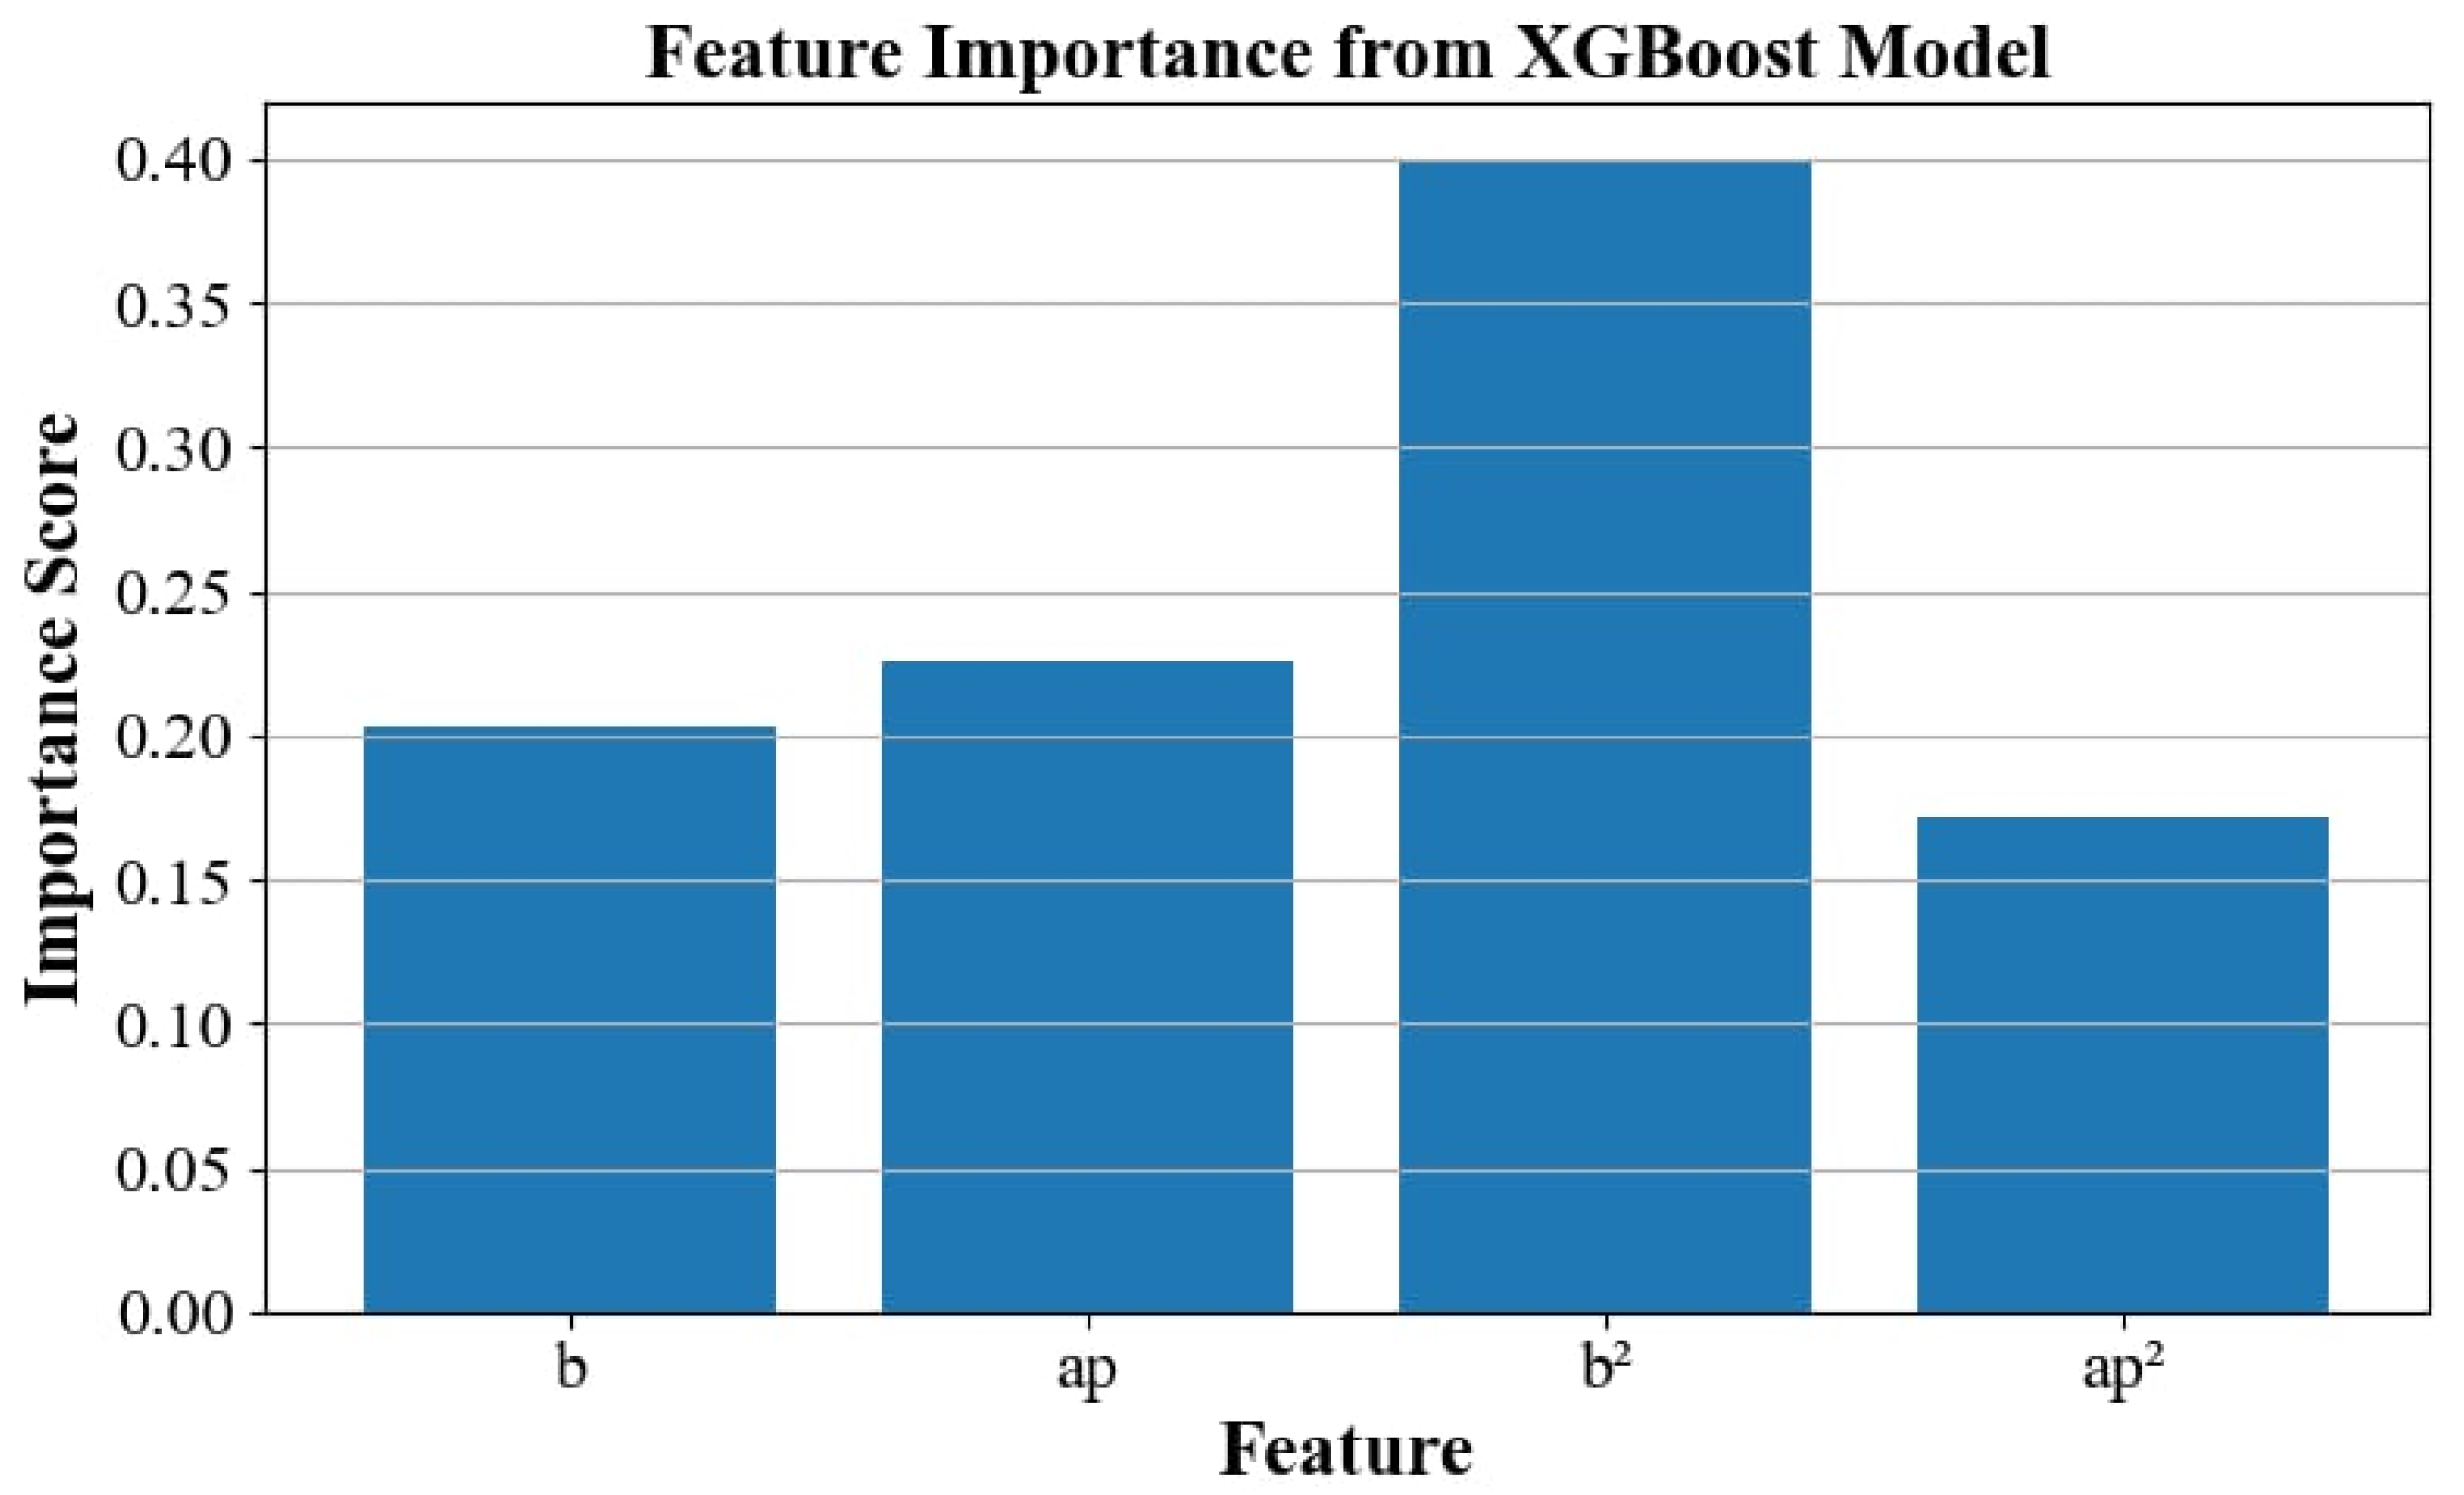
As shown in
Figure 7, the squared radial depth term (
) contributes the most to the model, indicating a strong nonlinear relationship between radial engagement and chatter response. This is followed by the original axial depth (
), radial depth (
), and finally the squared axial depth (
). These results validate the inclusion of both linear and nonlinear terms in the feature set and demonstrate the XGBoost model’s ability to leverage these patterns for improved prediction accuracy.
Once feature engineering is complete, the dataset is split into training (80%) and test (20%) subsets, ensuring the model’s ability to generalize across different machining conditions. This structured dataset enables the XGBoost regression model to accurately predict optimal feed rates under varying cutting conditions.
3.3. Bayesian Optimization for Hyperparameter Tuning
To enhance the predictive accuracy of the XGBoost model, Bayesian optimization is employed for hyperparameter tuning. Unlike traditional grid search or random search methods, Bayesian optimization utilizes a probabilistic model to efficiently explore the hyperparameter space and identify the best combination with fewer iterations [
17].
The optimization process focuses on maximizing the model’s coefficient of determination (
score):
where
represents the actual (ground truth) values,
represents the predicted values, and
is the means of the actual values. The numerator is the Residual Sum of Squares (RSS), quantifying the error between actual and predicted values, while the denominator is the Total Sum of Squares (TSS), reflecting overall variance in the data. A higher
indicates better model performance and prediction accuracy.
Bayesian optimization is a sequential model-based optimization (SMBO) technique that efficiently optimizes expensive-to-evaluate functions. Unlike brute-force approaches, it builds a probabilistic surrogate model of the objective function and selects new sample points based on an acquisition function, balancing exploration (searching new areas) and exploitation (refining known good areas). Mathematically, the black-box function
, where
represents hyperparameters, is modeled using a Gaussian Process (GP):
where
is the mean function, representing the excepted value of
and
is the covariance function, defining the relationship between points
and
.
The next sample point is determined using an acquisition function
, which quantifies the utility of sampling at
. In this study, we employed the Upper Confidence Bound (UCB) strategy, which balances exploration and exploitation by considering both the predicted mean and uncertainty from the surrogate model. The UCB is defined as:
where
is the predicted mean from the Gaussian Process,
is the standard deviation (uncertainty) and
is a trade-off factor that controls the balance between exploration and exploitation.
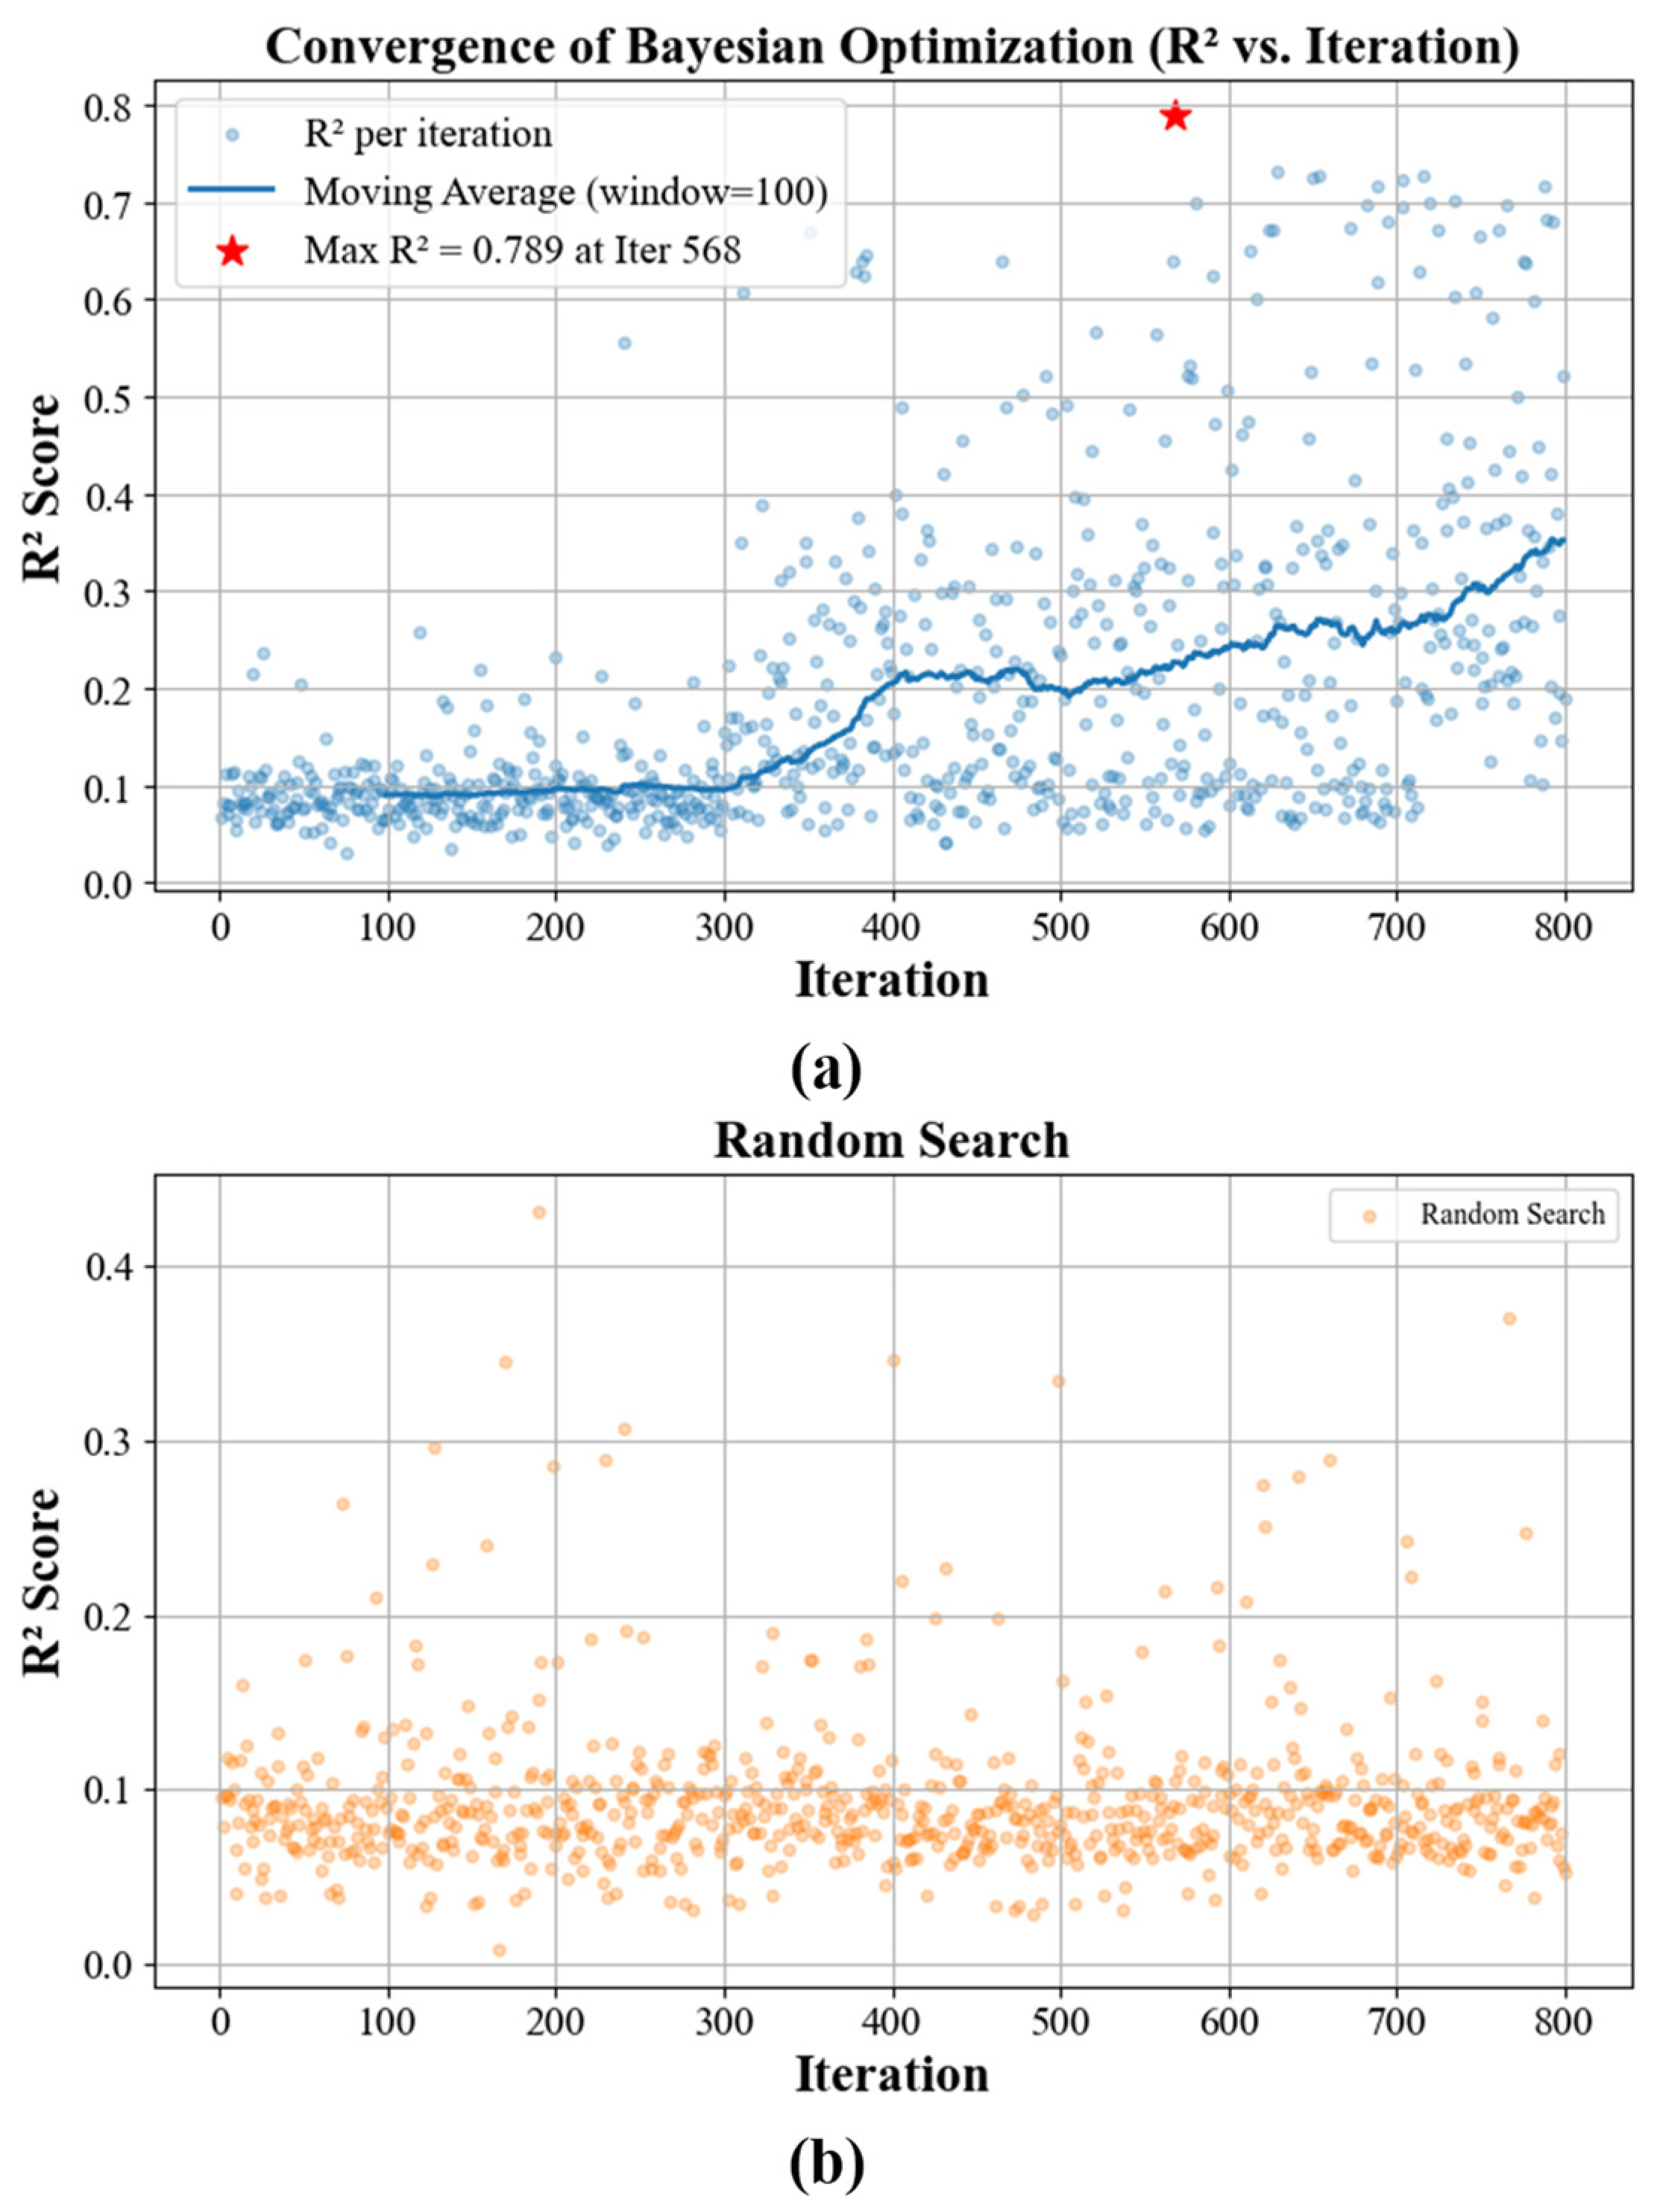
By iteratively updating the GP model and selecting new points via the acquisition function, Bayesian optimization efficiently finds the best hyperparameters with minimal function evaluations. Bayesian optimization exhibits a progressive increase in R
2 scores over iterations, as shown in
Figure 8a. This improvement trend is clearly highlighted by a moving average curve with a window size of 100. The optimization process reaches a peak R
2 score of 0.7887 at iteration 568, demonstrating successful convergence toward high-performing hyperparameter configurations.
In contrast,
Figure 8b presents the convergence behavior of Random Search under the same evaluation budget (800 iterations). The R
2 scores in this case remain largely concentrated around 0.1, with no apparent upward trend or convergence pattern, indicating the inefficiency of random sampling in navigating the hyperparameter space. These results confirm the superior efficiency and effectiveness of Bayesian optimization in identifying optimal model parameters with fewer evaluations.
To achieve optimal predictive performance, Bayesian optimization fine-tunes the following key hyperparameters in XGBoost:
The Bayesian optimization process begins with an exploration phase, where 300 random trials are conducted to sample a diverse range of hyperparameter combinations. This is followed by 500 additional iterations, where an acquisition function intelligently selects the most promising configurations based on previous evaluations. Ultimately, the process identifies the optimal set of hyperparameters that maximizes the R2 score, ensuring the best predictive performance for feed rate estimation while maintaining computational efficiency.
3.4. Model Training and Evaluation
After identifying the optimal hyperparameters through Bayesian optimization, the XGBoost regression model is trained on the refined dataset to predict the optimal feed rate , minimizing machining instability. The model’s performance is evaluated using the score, Root Mean Squared Error (RMSE), and Mean Absolute Error (MAE) to assess how well the predicted values align with the actual values in the test dataset.
The trained model achieved an
score of 0.7887, an RMSE of 0.2689, and an MAE of 0.2134, indicating strong predictive accuracy. These results confirm that the model effectively captures the nonlinear relationships between machining parameters and optimal feed rates. The scatter plot in
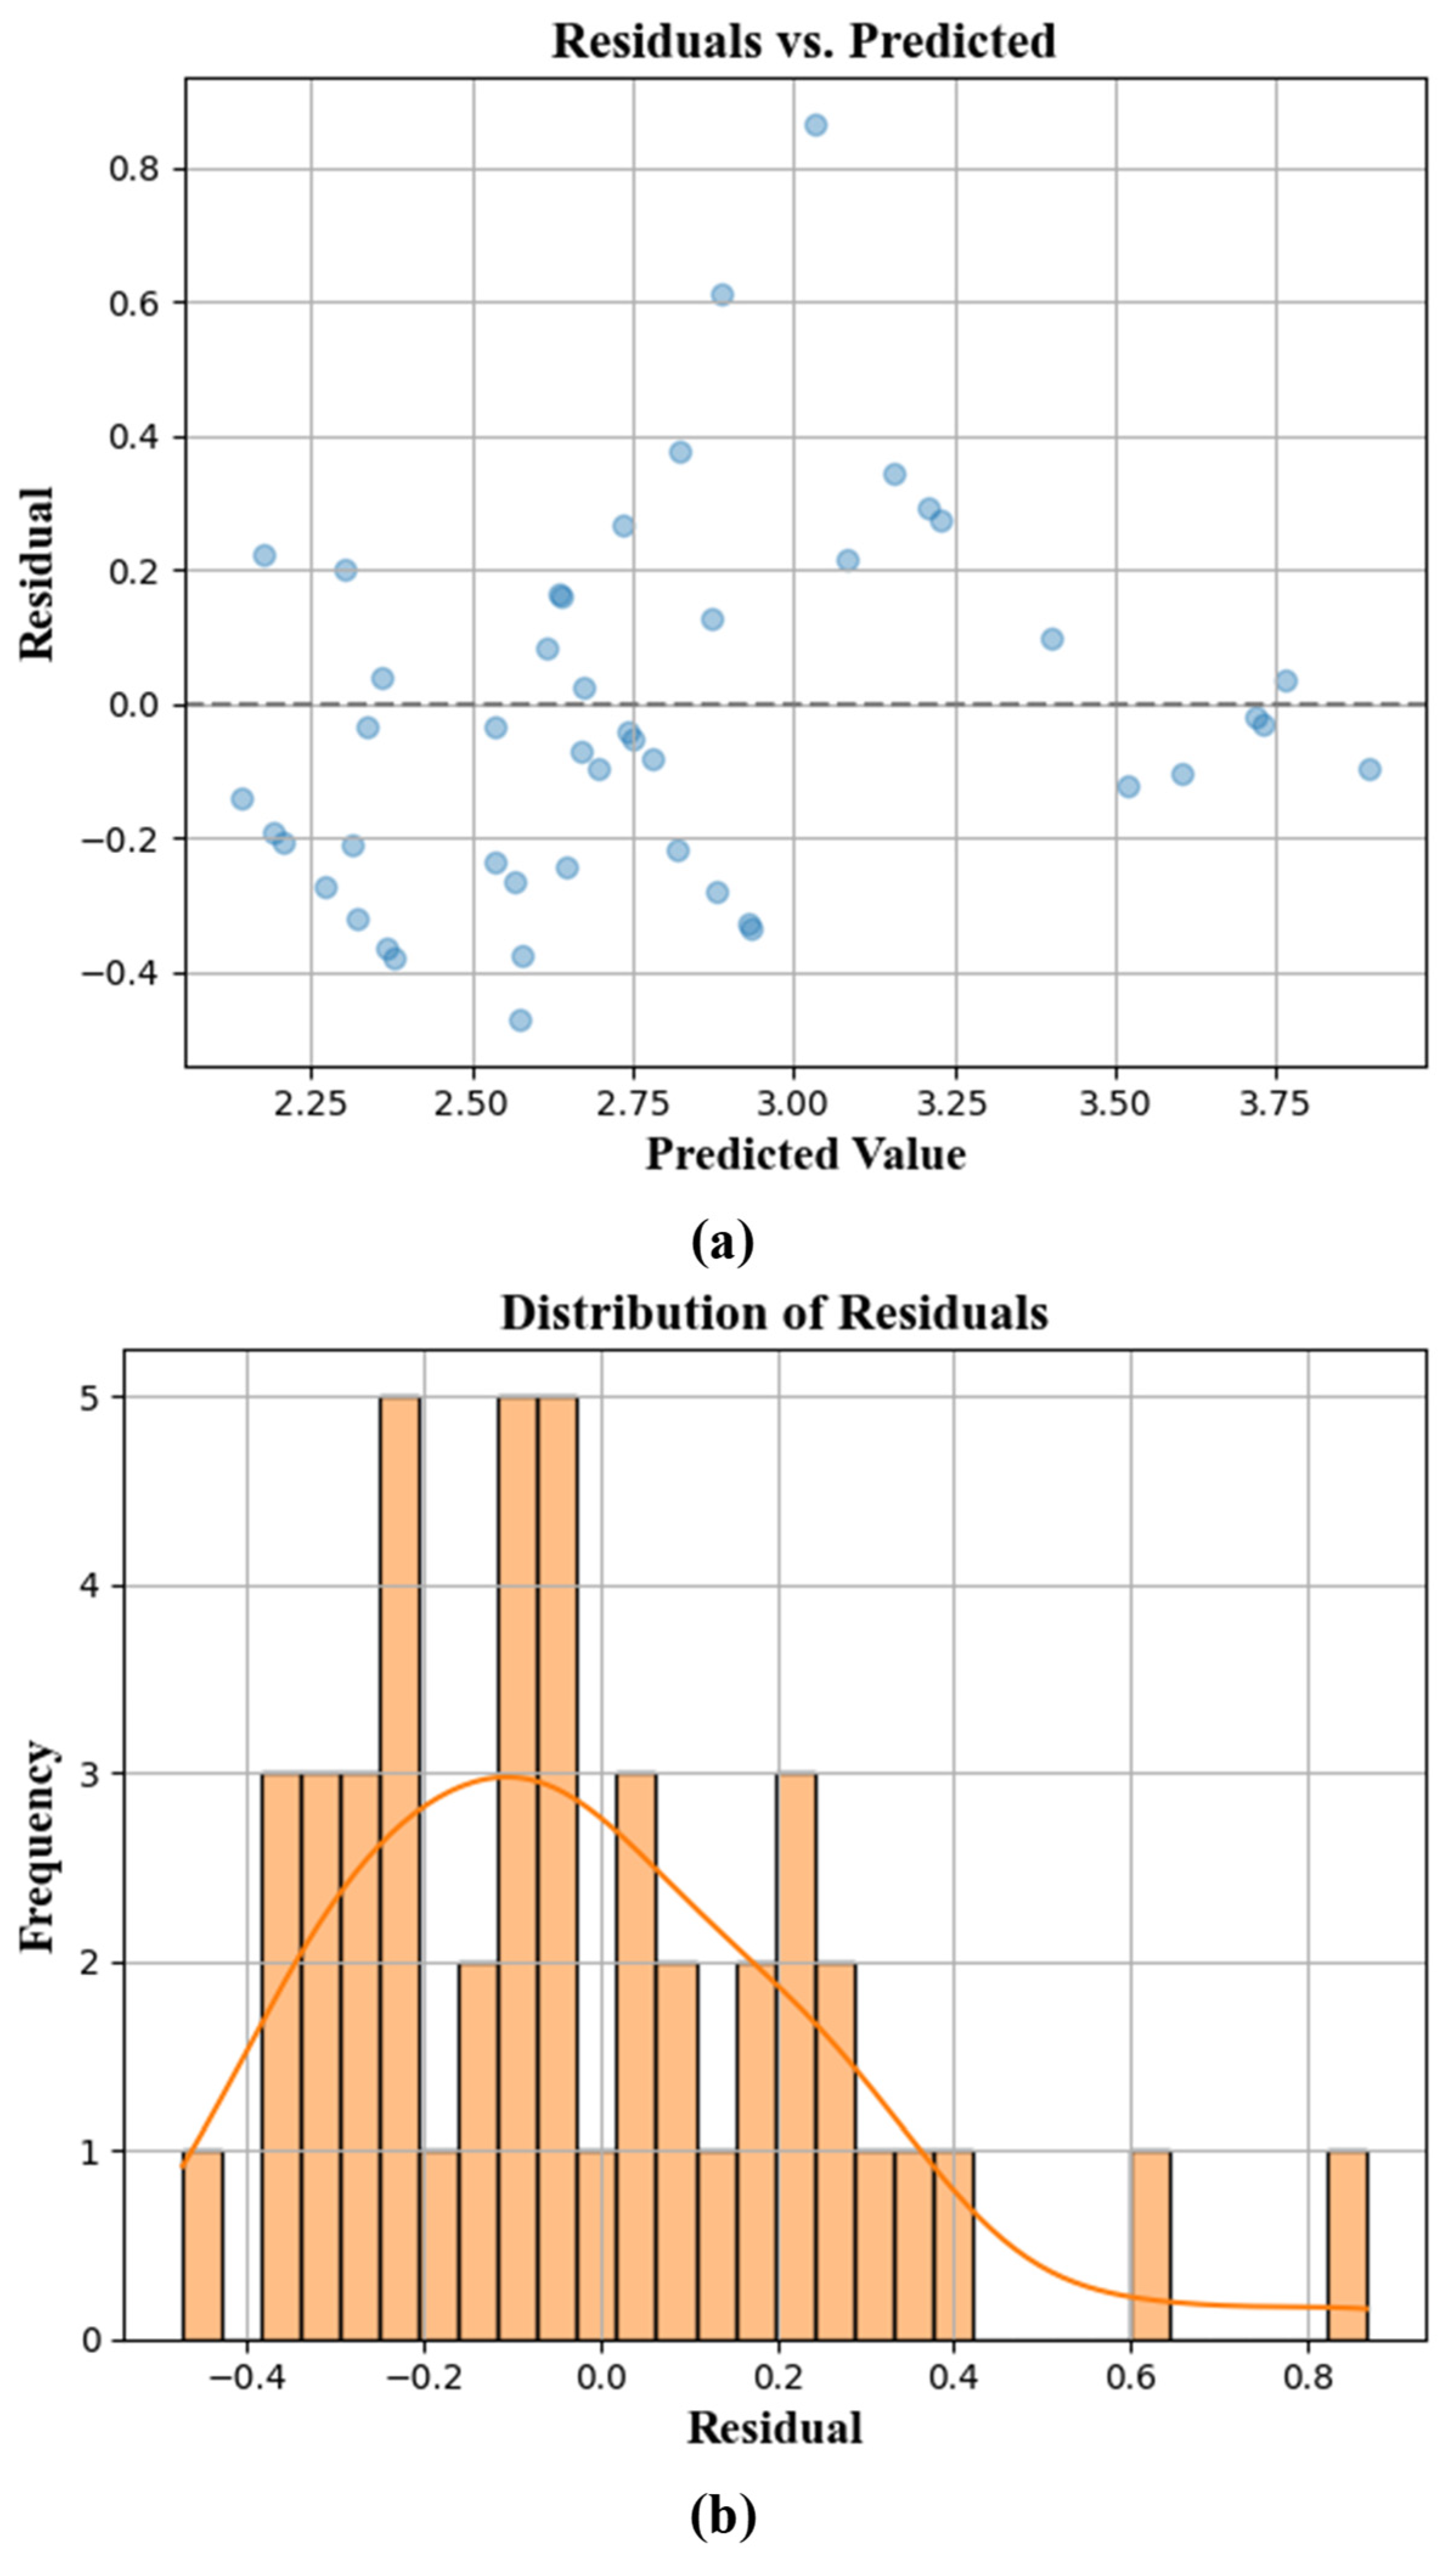
Figure 9 illustrates the close alignment between predicted and actual feed rates, further validating the model’s generalization ability. To examine the predictive behavior in more detail, residual analysis was performed using the test dataset. Two supplementary plots are provided,
Figure 10a shows the residuals versus predicted values, which allows visual inspection of bias or heteroscedasticity in the model’s predictions.
Figure 10b displays the histogram of residuals, depicting the distribution of prediction errors.
As seen in
Figure 10a, the residuals are approximately centered around zero across the full prediction range, without exhibiting a funnel shape or directional skew, indicating no strong evidence of heteroscedasticity.
Figure 10b further shows a nearly symmetric distribution of residuals, with a slight skew toward over-prediction but no significant outliers. These observations suggest that the model’s predictions are reasonably unbiased and stable across the evaluated input domain.
4. Experimental Validation of Predicted Feed Rate
To verify the effectiveness of the proposed machine learning-based feed rate prediction model in practical robotic machining applications, validation experiments were conducted using a UR10e robotic arm equipped with a voice-coil-motor-driven active end-effector and an ATI-9105 force/torque sensor. Surface roughness parameters were measured using a SURFCOM TOUCH 35 contact-type profilometer, with the evaluation conducted in accordance with the ISO 21920:2021 standard [
18]. The purpose of the experiment was to determine whether the feed rates predicted by the model could effectively reduce chatter-induced surface irregularities in a real-world setup.
The workpiece used in this experiment was a rectangular block of S45C carbon steel with dimensions of 50 mm × 20 mm × 13.5 mm. The machining tests were carried out using a fixed axial depth of cut of 1.8 mm and a radial depth of cut of 0.9 mm.
Figure 11 illustrates the machining setup, highlighting the relative orientations of the axial, radial, and feed directions on the surface of the workpiece during the cutting process. Under these controlled conditions, four feed rates were evaluated:
120.0 mm/min (baseline low feed)
156 mm/min (moderate empirical setting)
162 mm/min (predicted optimal by XGBoost model)
180 mm/min (higher conventional setting)
Surface integrity was evaluated using two standard metrics:
Pt (maximum peak-to-valley height), which is sensitive to sudden tool deflections and chatter marks.
Ra (arithmetic average roughness), commonly used to characterize surface finish.
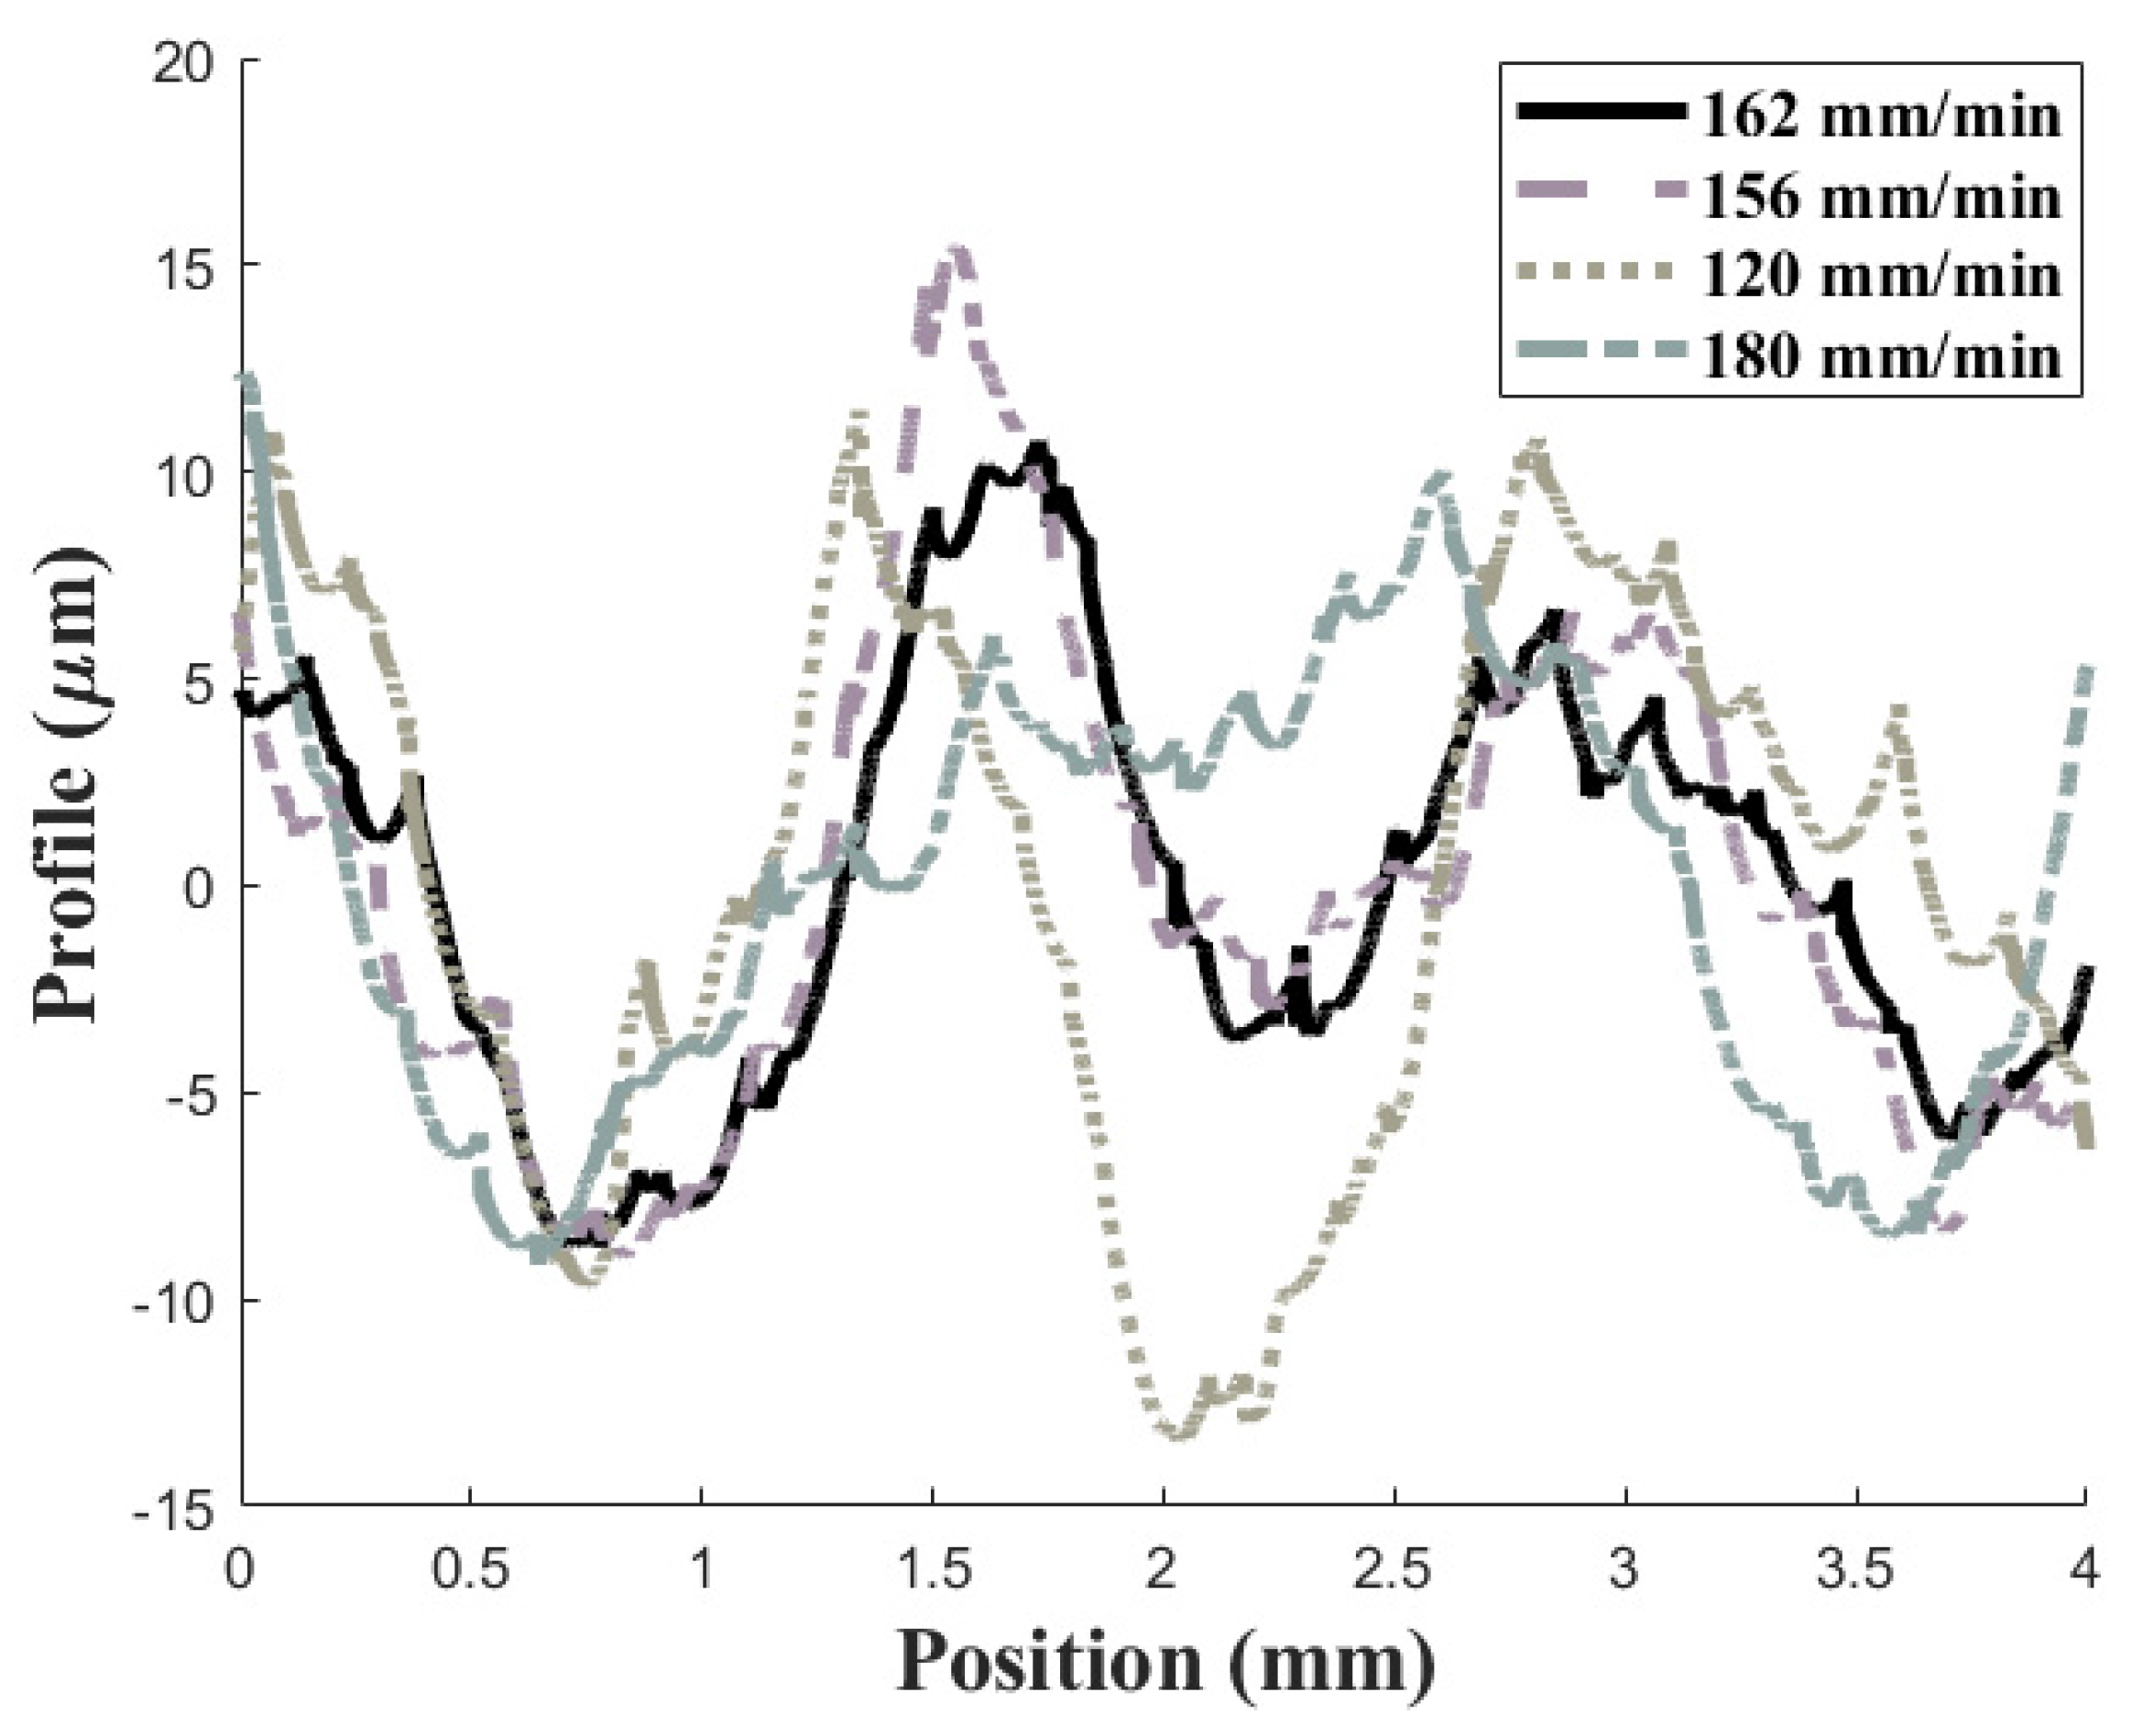
Figure 12 presents the surface profiles measured using a contact-type surface profilometer for each tested feed rate. These profiles reveal topographical variations across a 4 mm span of the machined surface. Notably, the profile corresponding to the predicted optimal feed rate of 162 mm/min exhibits the most consistent trajectory, with relatively gentle peak-to-valley transitions and minimal chatter-induced irregularities. In contrast, the 120 mm/min condition shows pronounced undulations, while the 180 mm/min condition exhibits sharper peaks, indicating increased dynamic instability.
The numerical results are summarized in
Table 3, which compares the Pt and Ra values obtained at each feed rate. The 162 mm/min feed rate yielded the lowest Pt value of 19.493 µm, indicating superior dynamic stability. In comparison, feed rates of 120 mm/min, 156 mm/min, and 180 mm/min produced Pt values of 24.858 µm, 22.723 µm, and 21.649 µm, respectively, corresponding to reductions of:
↓ 21.6% compared to 120 mm/min
↓ 19.9% compared to 156 mm/min
↓ 9.9% compared to 180 mm/min
While the Ra value corresponding to the predicted feed rate of 162 mm/min (0.94 µm) was slightly higher than that of 180 mm/min, both values remained well below the 1 µm threshold, which is commonly considered acceptable for high-quality surface finishes. As such, the small difference in Ra is not deemed critical in assessing machining performance. In contrast, Pt, which captures peak-to-valley deviations and is more sensitive to chatter-induced defects, was significantly lower at 162 mm/min. Therefore, Pt is adopted as the primary indicator of surface quality in this study, and the 162 mm/min feed rate is validated as achieving an optimal balance between surface consistency and dynamic stability.
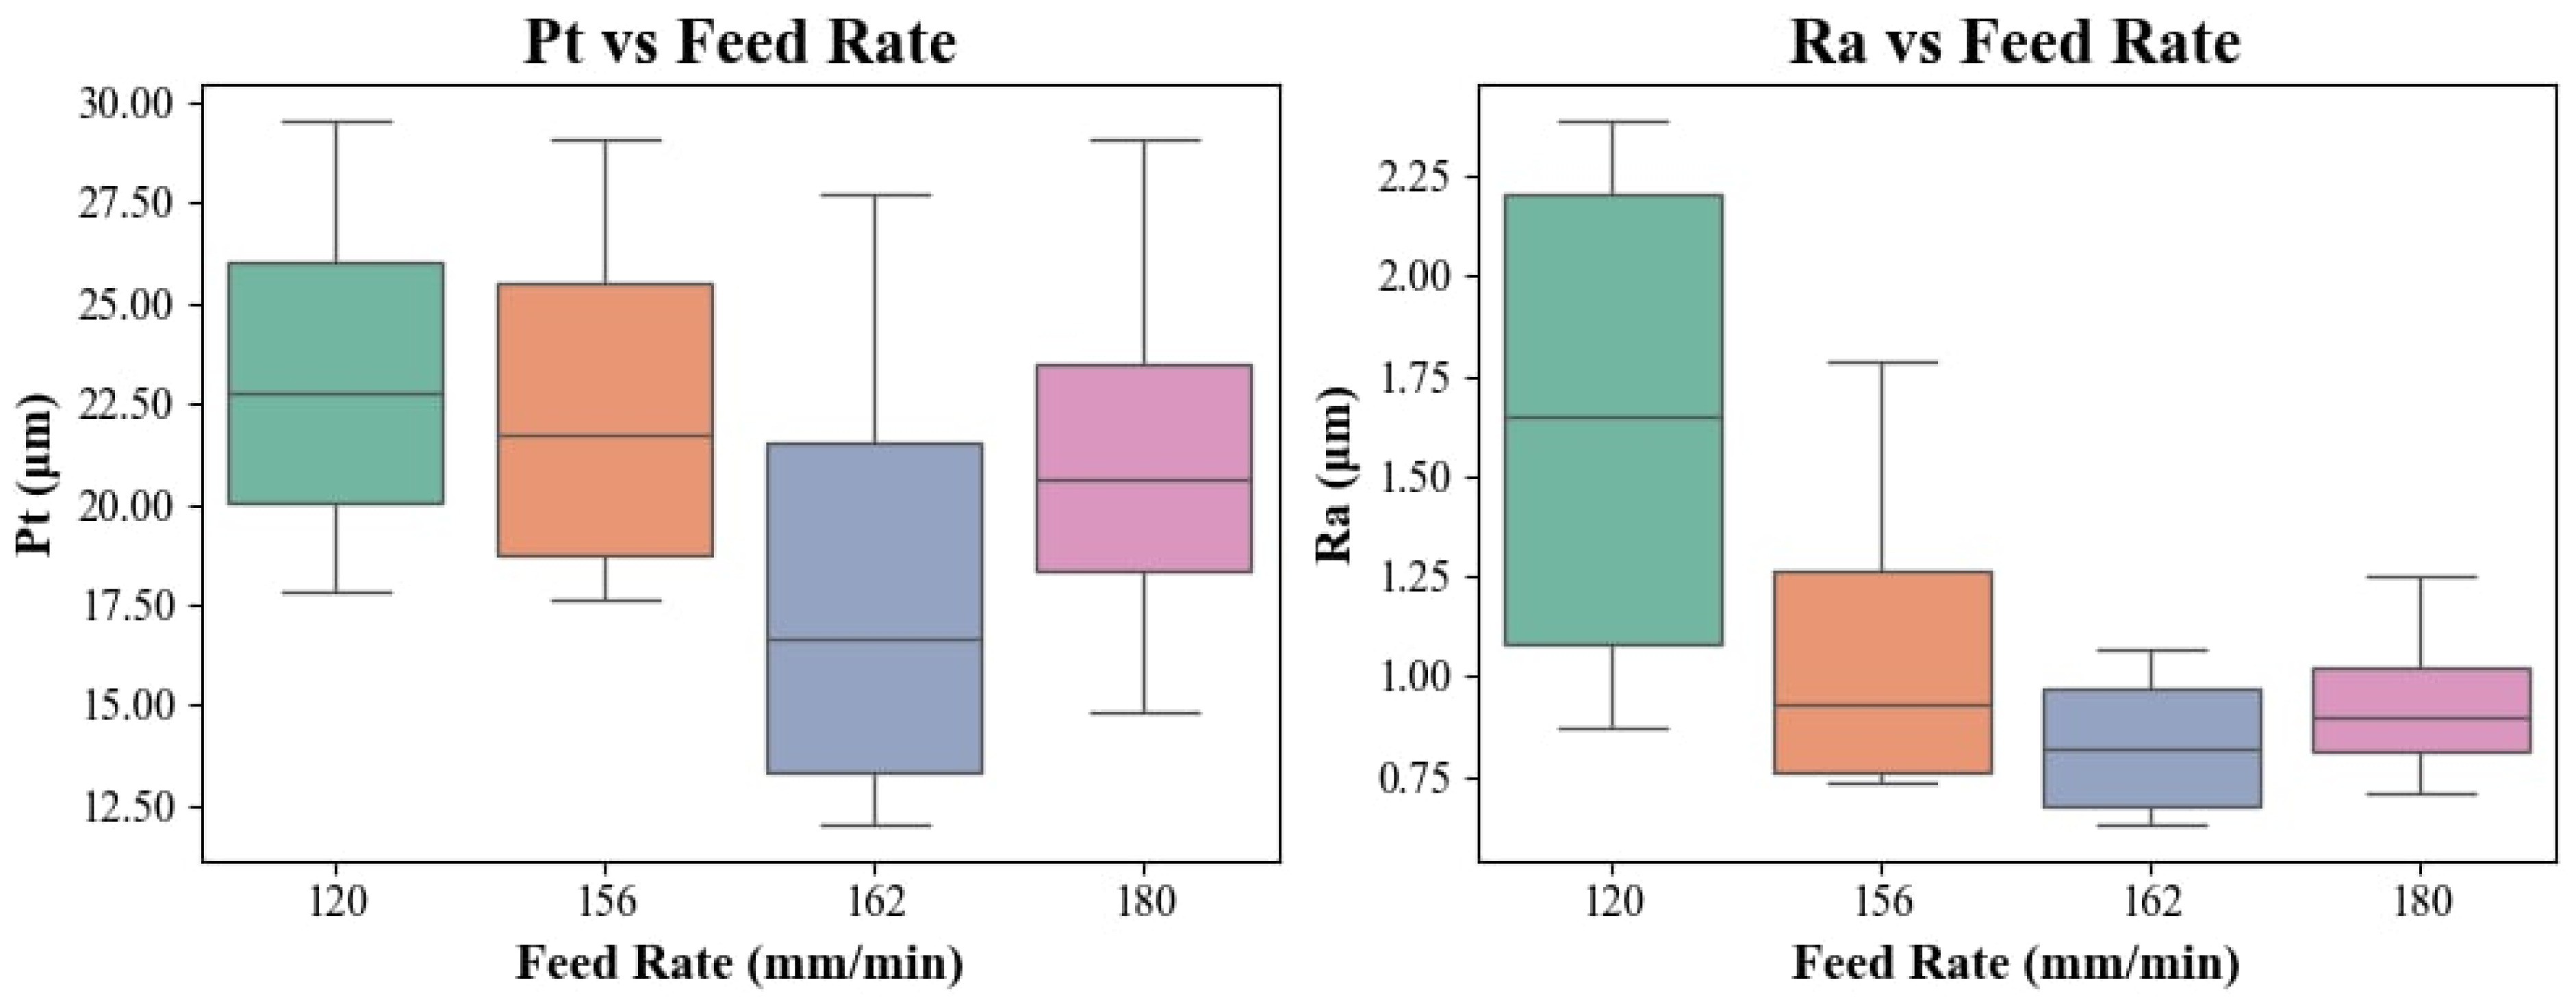
To further validate the robustness of the observed surface improvements, each feed rate condition was repeated four times, and the resulting surface roughness metrics were statistically analyzed. As illustrated in
Figure 13, the boxplots capture the distribution and variability of Pt and Ra values across these repeated trials. Notably, the 162 mm/min condition, predicted by our XGBoost model, yielded the narrowest interquartile range in both metrics, indicating high consistency and reduced variability in surface finish. These trends align with the 95% confidence intervals summarized in
Table 4, further supporting the statistical significance and repeatability of the improvements achieved by the predicted optimal feed rate.
These findings demonstrate that the predicted feed rate not only improves quantitative surface metrics such as Pt but also visually suppresses chatter effects, as confirmed by the smoother, more uniform surface textures observed in the profilometer data.
The successful validation of the predicted feed rate highlights the practical value of combining genetic algorithm-calibrated cutting force modeling with XGBoost regression. By learning the nonlinear relationships between process parameters and chatter-prone regions, the model provides data-driven, actionable recommendations that reduce the need for trial-and-error tuning in robotic machining systems.
Furthermore, the results confirm that machine learning models trained on theoretically simulated data can achieve high fidelity when applied to real experimental settings. This method is beneficial in robotic machining, as it saves time and resources by avoiding extensive empirical data collection. The integration of simulation-based data generation, vibration analysis, and supervised learning thus provides a robust framework for intelligent, adaptive manufacturing.
5. Conclusions
This study presents a machine-learning-based methodology for feed rate optimization in machining, integrating GA-calibrated cutting force modeling with vibration analysis. By leveraging a theoretical cutting force dataset and employing FFT-based frequency analysis, relatively stable machining conditions are identified, enabling the determination of optimal feed rates. The proposed XGBoost regression model, trained using these optimal feed rates, effectively captures the nonlinear relationships between machining parameters and chatter suppression. Bayesian optimization further enhances model performance by fine-tuning hyperparameters, resulting in an R2 score of 0.7887. The findings demonstrate that this approach provides a reliable, data-driven solution for feed rate determination, eliminating the need for exhaustive experimental trials. The trained model can provide practical machining parameter recommendations, offering guidance on optimal feed rates to minimize chatter and improve process stability. This methodology was experimentally validated using a UR10e robotic arm setup, where the predicted feed rate achieved the lowest Pt value and exhibited the smoothest surface profile, confirming the model’s practical effectiveness. Future research can enhance this framework by incorporating additional machining parameters, real-time sensor data, and adaptive control strategies to improve predictive robustness and generalization capabilities.


_Chang.jpg)


