1. Introduction
Most online course recommendations primarily use traditional machine learning methods and deep learning methods to model sequential data, neglecting the complex associations among course entities. These models lack explicit representations of the relationships between learning courses. A good personalized recommendation model needs to fully explore the high-level latent relationships between learner nodes, particularly relationships, such as course category connections, co-learning connections, and similarity connections. Secondly, most of these models usually capture users’ long-term preferences but ignore their recent learning preferences, thus producing negative recommendations using these models. This chapter discusses an attention-based hypergraph neural network framework for personalized online learning recommendations. This recommendation algorithm fully uncovers high-order latent relationships among learners, courses, and instructors, such as co-learning relationships among learners, course category relationships, and learners’ similar preference relationships.
Personalized learning is an inevitable trend in the information era [
1]. Tailoring education to individual students’ needs, while paying attention to their personal differences, is an important research topic in online course recommendations. Personalized recommendations on MOOC platforms intelligently match courses through user behavior analysis. For instance, when User A completes an introduction to Python course with high scores, the system recommends “Practical Data Analysis” based on learning paths of similar learners. If the user maintains consistent engagement during fixed evening hours (8–10 PM), live-streamed courses are prioritized. When repeated viewing of “machine learning” content is detected, the Fundamentals of “Artificial Intelligence” course is automatically highlighted on the homepage. This dynamic personalization enhances user engagement and improves course completion rates. Xia et al. [
2] addressed critical limitations in existing implicit feedback algorithms, including unreasonable positive–negative sample division, neglect of user operation frequency, and inaccurate user preference modeling, proposing an Implicit Feedback and Weighted User Preference-based recommendation algorithm (IFW-LFM). Shen et al. [
3] developed a forgetting function-enhanced Mean Bayesian Personalized Ranking (MBPR) algorithm, integrating the Ebbinghaus forgetting curve with conventional BPR methodology to achieve personalized recommendations. Du et al. [
4] leveraged both low- and high-order user features through a Deep Factorization Machine architecture, combining information extraction units with cross-network structures to construct a hybrid recommendation model for deep behavioral preference mining. For sequential recommendation systems challenged by noise interference and imprecise signal representation, Wen et al. [
5] proposed the DeepEMA model, employing exponential moving averaging for noise reduction and trend extraction, coupled with a multi-module framework to capture diverse signals, demonstrating effectiveness across four benchmark datasets. Wang [
6] incorporated Mel filters into long-/short-term user preference modeling, accounting for emotional attention while analyzing temporal sequences, subsequently developing a music recommendation algorithm validated against random forest and generalized predictive control baselines. Song [
7] achieved precise knowledge demand pattern recognition by synthesizing multidimensional data including user preference features, historical borrowing behaviors, and digital access logs, enabling intelligent matching of personalized knowledge resources. This data-driven service paradigm significantly enhanced collection utilization efficiency while optimizing service experience through differentiated demand fulfillment. Tong et al. [
8] employed virtual simulation technology to extract characteristic patterns from learning resources, establishing personalized features via data function modeling with concurrent anomaly detection to minimize bias, ultimately constructing data association nodes for intelligent resource recommendation in virtual training environments Deng et al. [
9] implemented natural language processing techniques for multidimensional feature extraction from course descriptions, instructor qualifications, and institutional profiles. By analyzing historical course selection records and associated features to build user preference models, their XGBoost-based framework generated personalized course recommendations through feature vector matching, achieving accuracy improvements via systematic feature engineering and machine learning integration.
Deep learning’s architecture simulates the hierarchical structure of the human brain, effective for content information or feature extraction. Thus, deep learning models have unique advantages in feature extraction, enabling more accurate representation of external data. The field of deep learning in personalized recommendations is flourishing [
10]. Leveraging neural networks’ powerful learning capabilities can better capture students’ complex learning patterns and knowledge states, effectively handling large-scale learning data [
11,
12]. However, traditional machine learning methods and deep learning methods model sequential data in isolation, ignoring the complex associations among entities. With the growing need to address complex relationships and structural issues, researchers have focused on graph data structures, which have proven more effective in capturing relationships between entities [
13].
In this context, Graph Neural Networks (GNNs, See
Appendix A) have been introduced into personalized recommendations. GNNs are a class of deep learning models specifically designed to handle graph-structured data. They can not only effectively capture relationships between entities but also learn global information from the entire graph. GNNs are advantageous tools for modeling multiple entities and their relationships in recommendation systems, serving as a form of graph embedding (Graph Embedding) technology that maps learners, courses, and knowledge concepts into a unified vector space. By computing vector similarities or predicting edge properties, GNNs transform recommendation problems into classical graph tasks, thereby providing new enhanced functionalities for intelligent services in recommendations [
14,
15,
16].
Combining attention mechanisms allows the model to focus on the most relevant nodes or edges during message propagation. Attention mechanisms [
17,
18] enable the model to focus on the most relevant parts of the input data, thereby improving the performance and effectiveness of the recommendation model. By incorporating this mechanism that considers the different importance of nodes, the model’s ability to learn representations is enhanced. Unlike traditional GNNs, attention mechanisms can dynamically learn weights based on the similarity between nodes or edges. This dynamically adaptive attention mechanism can serve as a resource allocation scheme and is a primary approach to addressing information overload issues. In scenarios with limited computational resources, more important information can be processed with finite computational resources.
For online course recommendations, although a significant amount of research has been conducted, existing studies still suffer from several issues. Current research primarily employs machine learning and deep learning methods to model online courses while neglecting sequential relationships between courses. Few studies utilize multi-modal heterogeneous data to deeply investigate personalized course recommendations through hypergraphs and attention mechanisms. There is limited exploration of common learning behaviors and similar learning interactions among different learners, with insufficient research on personalized recommendations from the perspective of global relational graphs. Traditional course recommendation models assign equal weights to each learner and recommended item, and their node embedding methods overlook the varying importance of nodes by connecting and projecting all nodes into the same space. In reality, different nodes may have distinct significance, for instance, beginners and advanced learners likely prioritize different course content (e.g., programming novices versus algorithm engineers may exhibit significant differences in their demand weights for Python courses).
To address these challenges, this study makes the following contributions:
We propose a heterogeneous hypergraph and attention mechanism-based online course recommendation algorithm (HHAOCR). By constructing a heterogeneous hypergraph with entities including students, courses, and instructors, our model globally explores sequential relationships, co-learning relationships, and similarity relationships among courses. Compared to traditional recommendation models, this framework more comprehensively captures inter-entity connections, thereby enhancing recommendation accuracy.
To tackle the difficulty in discovering high-order connectivity and nonlinear relationships within multi-modal heterogeneous data in online learning scenarios, we designed five heterogeneous hypergraphs using hypergraph convolution operators. Each vertex aggregates information through its associated hyperedges, enabling the model to more accurately capture high-order relationships among students, instructors, and courses.
We propose a fusion method integrating heterogeneous hypergraphs with attention mechanisms. By combining attention mechanisms with hypergraph convolution operators, we develop a dynamically adaptive attention mechanism. This includes a coefficient matrix calculation method between hyperedges and vertices, as well as an attention score computation method between hyperedges, to identify the most relevant nodes or edges in the graph. This mechanism allows dynamic weight adjustment during feature extraction, enabling the model to focus precisely on critical information and relationships, thereby significantly improving the personalization and precision of recommendations.
The rest of this paper is organized as follows:
Section 2 presents the fundamental preliminaries and preparatory work.
Section 3 provides the formal definition and comprehensive description of our proposed algorithm.
Section 4 details the experimental datasets and methodological procedures; then, analyzes and discusses the experimental results.
Section 5 concludes the study with key findings. Finally,
Section 6 critically examines the limitations of this work and outlines potential directions for future research.
3. Proposed Method
3.1. Model Construction Based on Hypergraphs and Attention Mechanisms
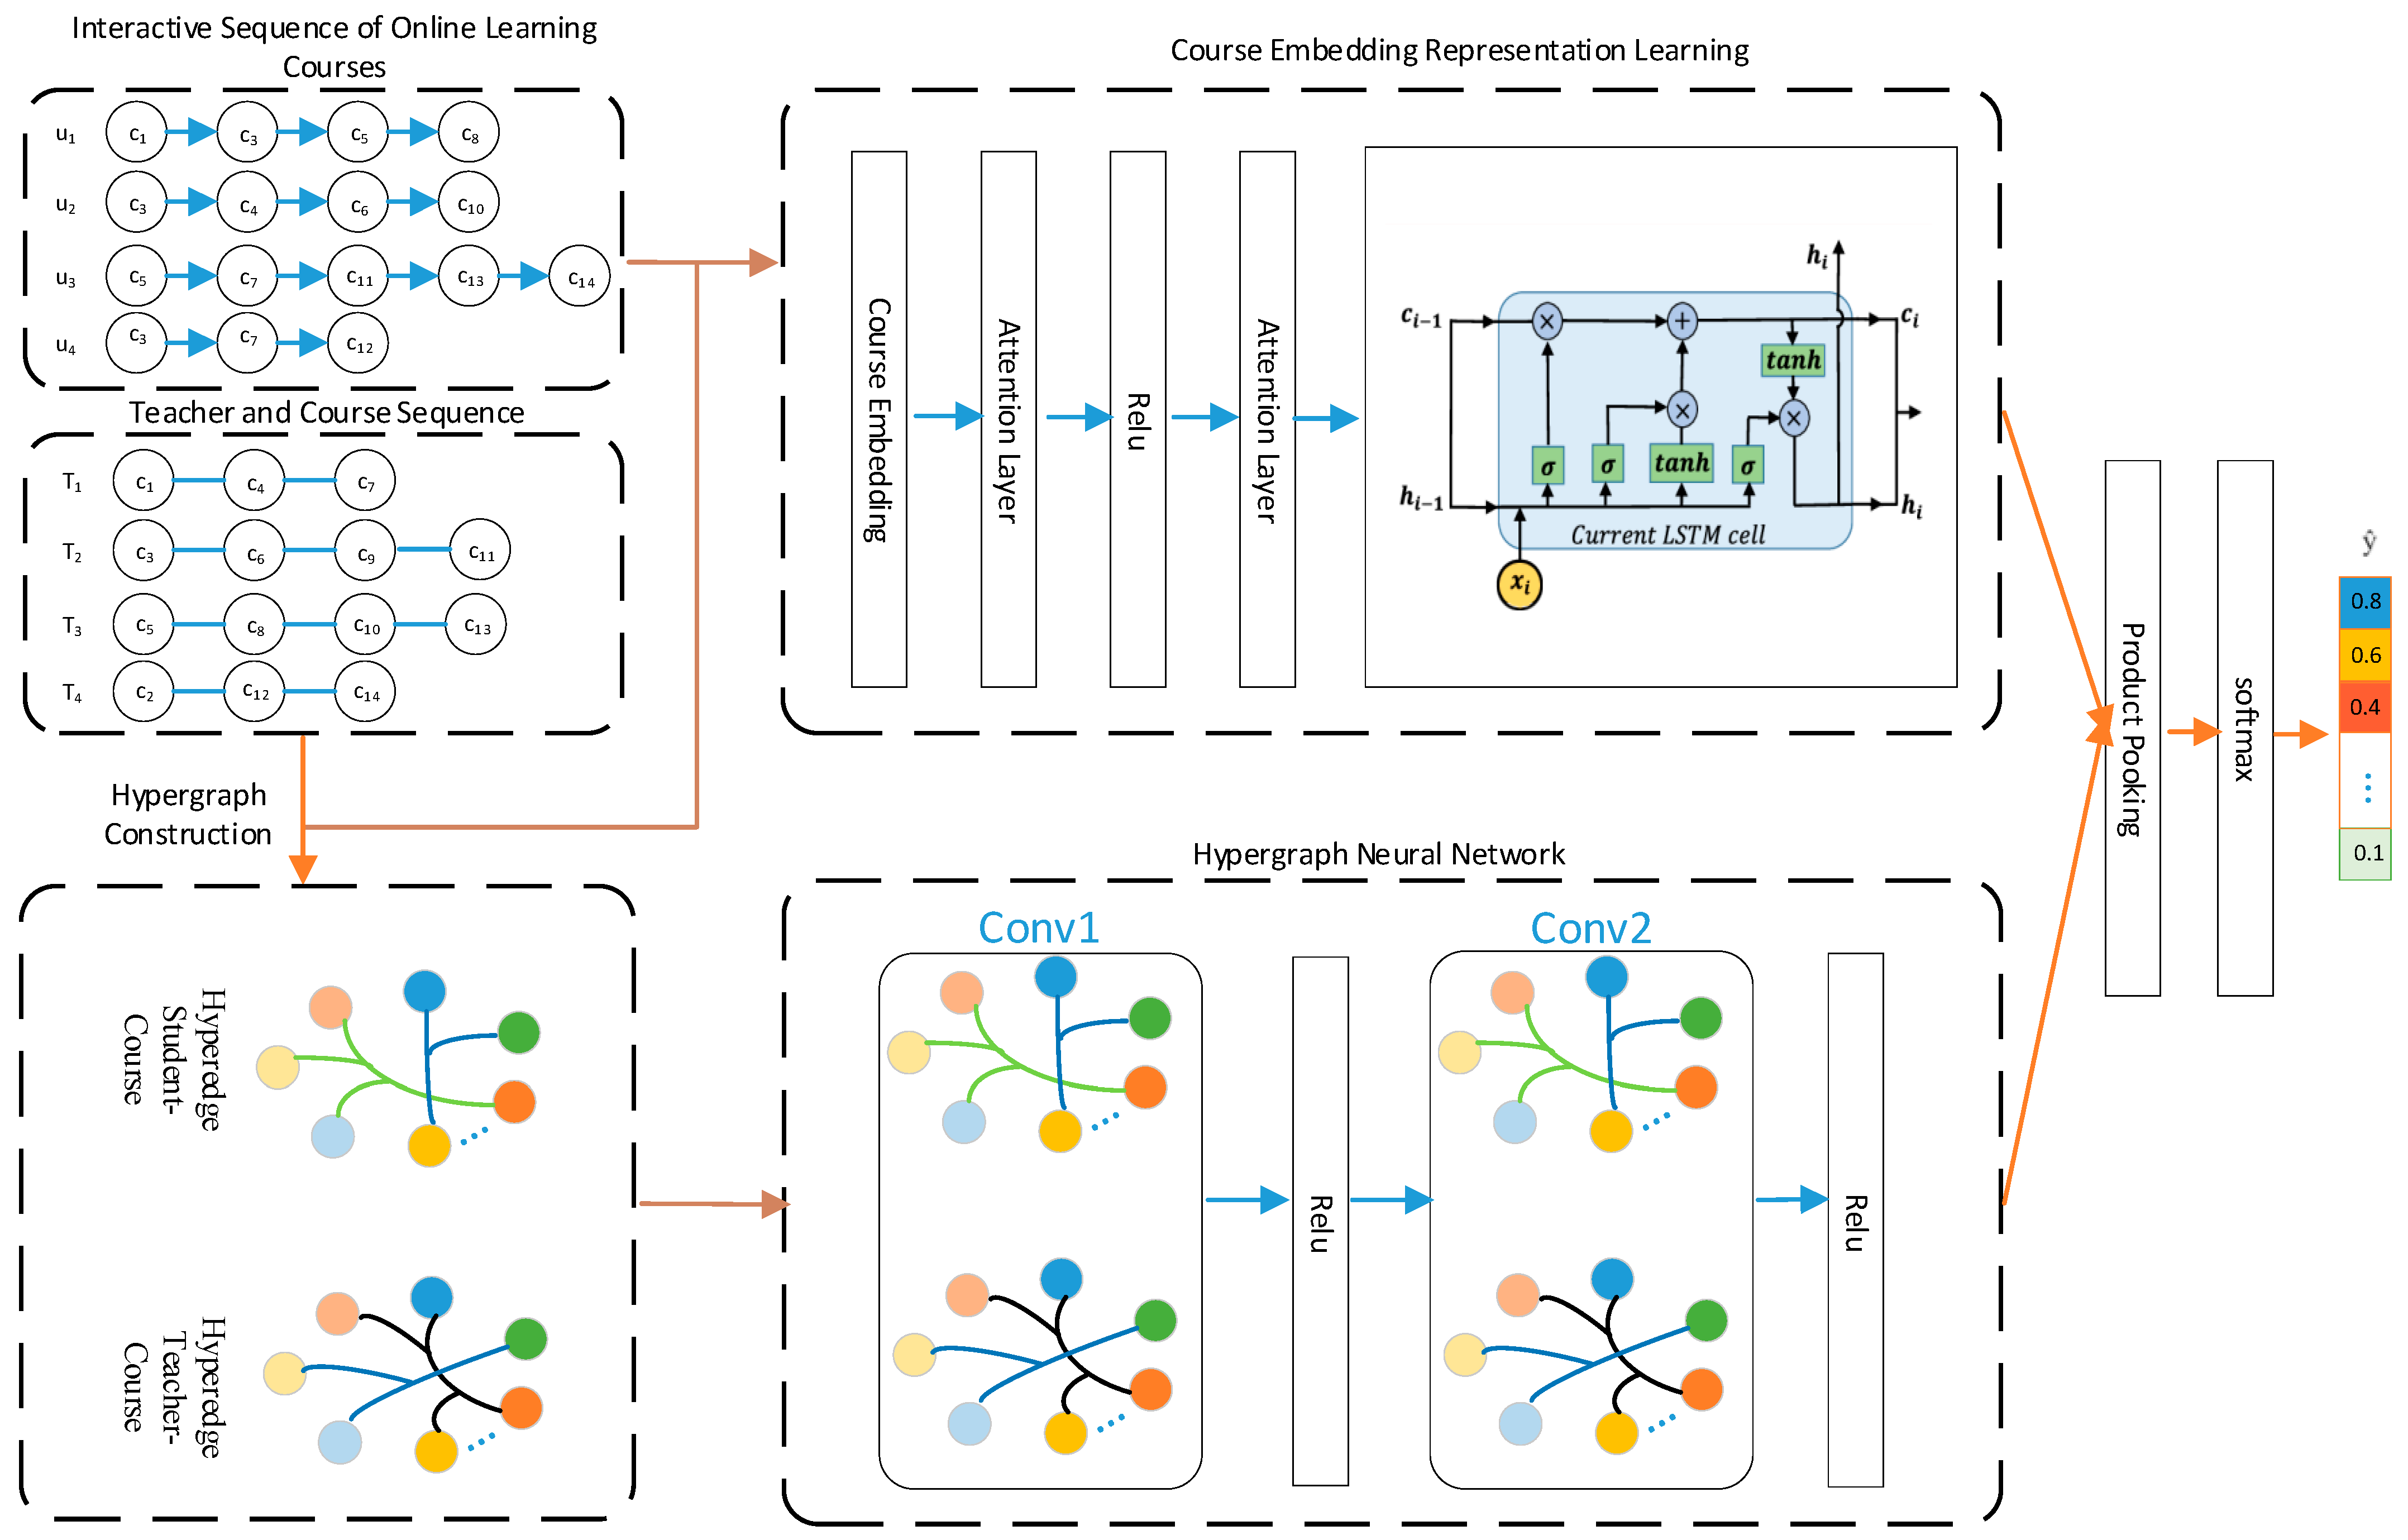
A Heterogeneous Hypergraph and Attention-based Online Course Recommendation (HHAOCR) algorithm was proposed. The model architecture is shown in
Figure 1. The model first learns course embedding representations from the interaction sequences of online learning courses. These embeddings are then fed into an attention layer, which helps the model to focus on important nodes, and subsequently into an LSTM neural network. Simultaneously, the interaction sequences of online learning courses are combined with teacher and course sequences to construct a hypergraph. The features are learned through a hypergraph neural network, which helps the model to capture the higher-order relationships between learners, courses, and instructors, and is then fused with the course embedding vectors. Finally, the model achieves online course recommendations.
3.2. Definition of Hypergraph
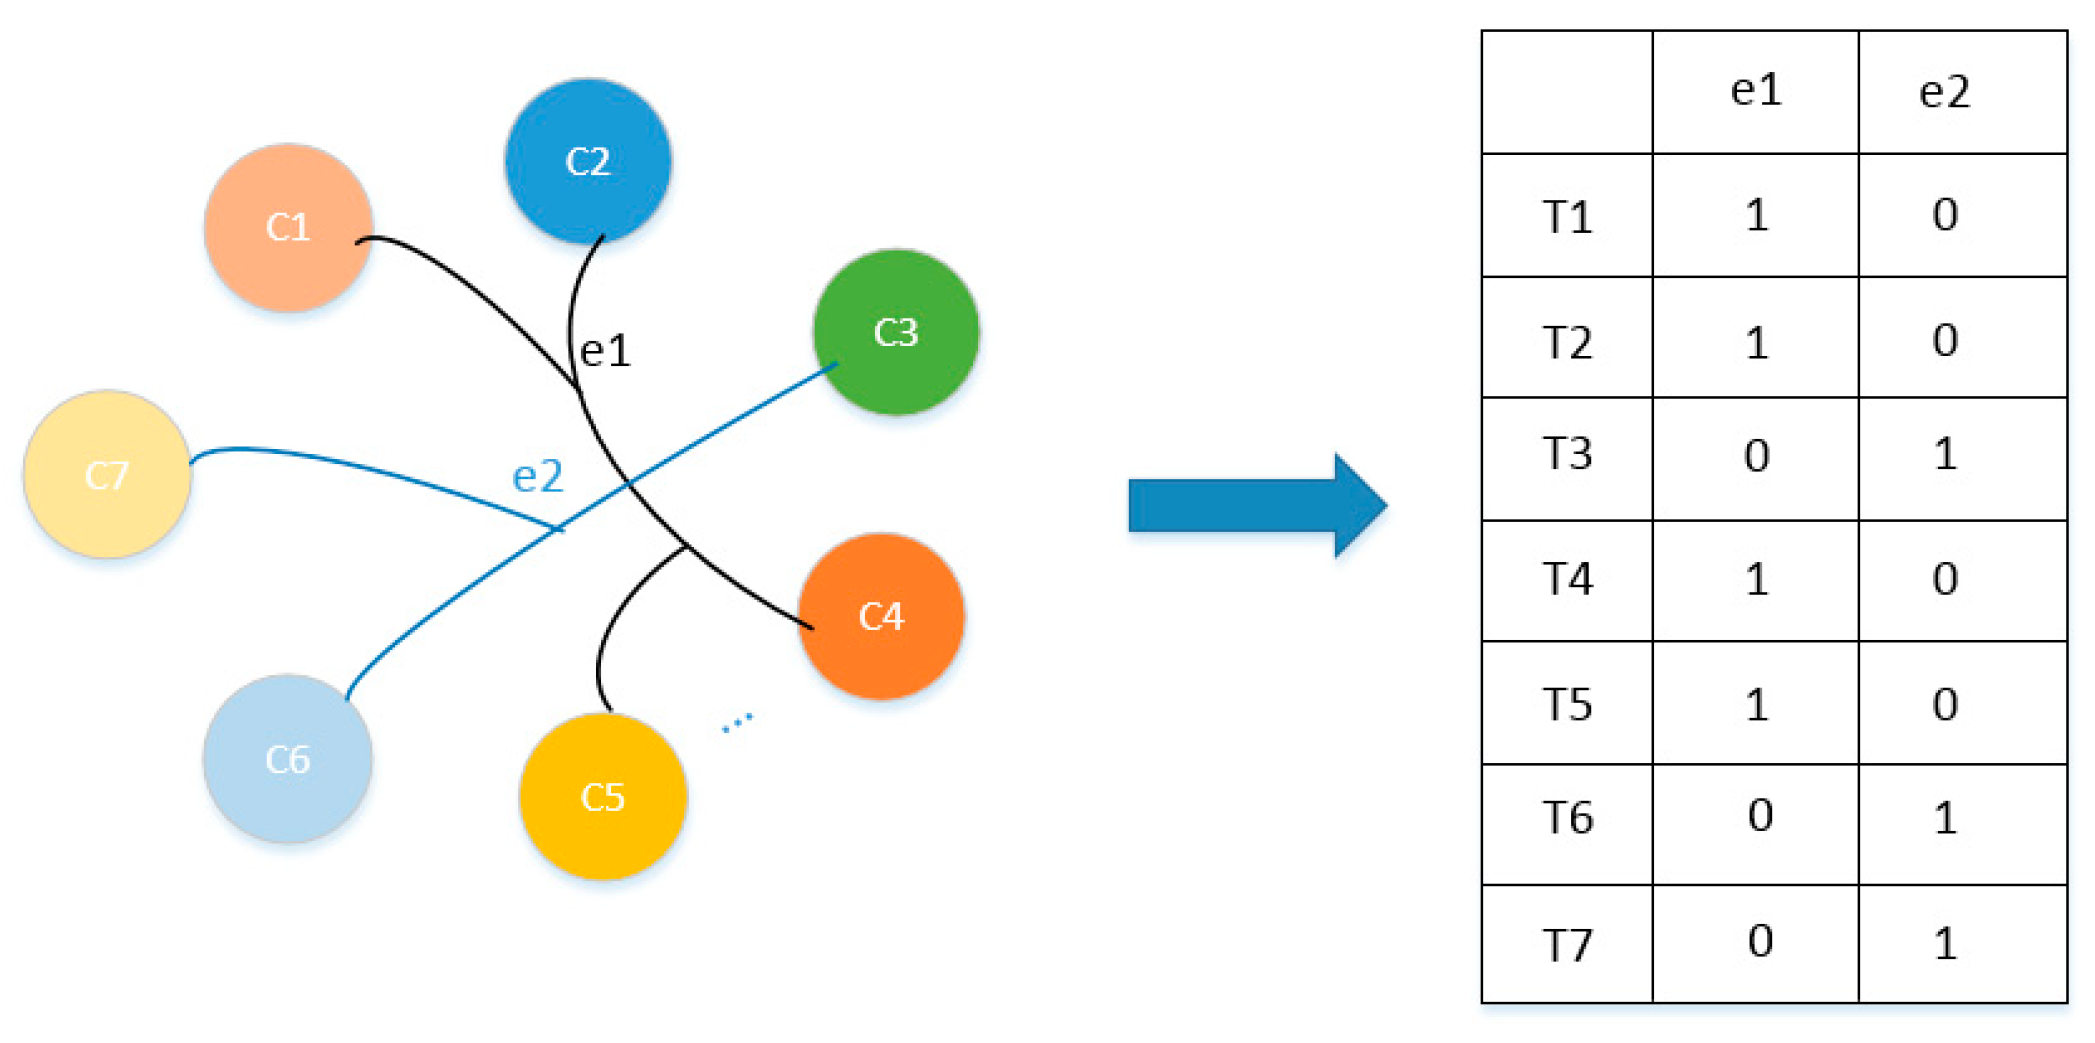
A hypergraph can be defined as H = {V, E}, where the vertex set is V = {v1, v2, v3, …, vn} and the edge set is E = {e1, e2, e3, …, ek}. For any hypergraph, e ∈
E,
represents subgraphs of the hypergraph H. Unlike graphs, hyperedges are nonempty subsets of vertices, and they can connect multiple vertices. The incidence matrix
is defined, where n represents the number of vertices and k represents the number of hyperedges. The hypergraph can be represented by an incidence matrix H of size
, as shown in
Figure 2. The definition is as follows:
The vertex classification problem on a hypergraph can be described using the following regularization framework [
30]:
Here,
is a regularization term on the hypergraph,
represents the supervised empirical loss, and
is a classification function. The
regularization term is defined as follows:
3.3. Hypergraph Convolution Operator
First, the degree of a hypergraph vertex is defined as
, which represents the number of hyperedges passing through the vertex. The degree of a vertex is defined as follows:
In Equation (4), represents the weight of the edge connected to vertex i, indicating the weight of the edge in the degree of the vertex. represents whether the i-th vertex is connected to the edge; if connected , otherwise .
The degree of a vertex’s edge represents how many vertices a hyperedge connects to, and it is defined as follows:
The diagonal matrices and are, respectively, the degree matrices of vertices and hyperedges in the hypergraph.
In the hypergraph, convolutional network operators are used to estimate the probabilities of transitions between vertices. The embedding representation of each vertex can be transmitted throughout the entire hypergraph. This hypergraph convolutional network operator is defined as follows:
In Equation (6), represents the vertex features input at layer l, represents the vertex features input at layer l + 1, P represents the trainable weight matrix between layers l and l + 1, represents an activation function, N represents the degree matrix of vertices in the hypergraph, and S represents the degree matrix of hyperedges in the hypergraph. H is an incidence matrix with vertices as rows and hyperedges as columns in the hypergraph. Conversely, if a message-passing path from vertices to hyperedges is specified, vertices are considered as columns and hyperedges as rows. The specific operational steps are as follows:
Hyperedge Feature Construction: Construct the feature representation of hyperedges by aggregating the features of vertices connected to each hyperedge.
Vertex Feature Classification and Aggregation: Classify and aggregate the features of all hyperedges related to a specific vertex to generate an enhanced vertex feature representation.
Model Training and Nonlinear Activation: Train the model using a nonlinear activation function to capture higher-order dependencies and complex structural features in the hypergraph.
In summary, this hypergraph convolutional network operator effectively captures higher-order correlations in the hypergraph, thereby significantly enhancing the model’s expressive power and generalization performance.
3.4. Heterogeneous Hypergraph and Attention Fusion
3.4.1. Construction of Heterogeneous Hypergraphs
To more accurately capture the higher-order relationships between students, instructors, and courses, five types of heterogeneous hypergraphs are constructed, respectively: ① A hypergraph with students as hyperedges and courses as vertices, with the incidence matrix defined as ; ② A hypergraph with courses as hyperedges and students as vertices, with the incidence matrix defined as ; ③ A hypergraph with instructors as hyperedges and students as vertices, with the incidence matrix defined as ; ④ A hypergraph where courses with similar selections are hyperedges and students are vertices, with the incidence matrix defined as ; and ⑤ A hypergraph with instructors as hyperedges and courses as vertices, with the incidence matrix defined as .
These five types of hypergraphs include student nodes, instructor nodes, course nodes, and hyperedges, which further describe higher-order relationships between different types of nodes through hyperedges. First Hypergraph: The subgraph of students and courses represents the collection of course sequences for students’ online learning. This can identify connections between students and uncover relationships among them. Second Hypergraph: The subgraph of courses and students represents the collection of students enrolled in a specific online course. This subgraph can identify students’ online course learning behaviors, thereby recognizing similarities in their course selections. Third Hypergraph: The subgraph of online instructors and students reveals which students chose courses taught by a particular instructor. It represents the collection of students enrolled in a specific instructor’s online courses and indirectly reflects the popularity of the instructor’s courses and students’ preferences for instructors. Fourth Hypergraph: The subgraph of similar course selections and students explores the similarity in courses taken by students directly connected (e.g., through edges) and those not directly connected (not connected by edges) to a particular student. Fifth Hypergraph: The subgraph of instructors and courses represents the collection of courses offered by online instructors.
Traditionally, definitions often use hyperedges. To reduce the complexity of the algorithm, we define , where k, j and l represent the number of students, courses, and instructors, respectively. c and n represent the number of students who are directly connected and chose similar courses and the number of students who are not directly connected but chose similar courses, respectively.
Based on the definition of the hypergraph convolution operator given in Formulas (4)–(6)
Section 3.3, the convolution formulas for these five hypergraphs are defined as the following Formulas (7)–(11).
First, for the hypergraph with students as hyperedges and courses as vertices, the hypergraph convolution formula is defined as:
Second, for the hypergraph with courses as hyperedges and students as vertices, the hypergraph convolution formula is defined as:
Third, for the hypergraph with teachers as hyperedges and students as vertices, the hypergraph convolution formula is defined as:
Fourth, for the hypergraph with courses that have similar elective patterns as hyperedges and students as vertices, the hypergraph convolution formula is defined as:
Fifth, for the hypergraph with teachers as hyperedges and courses as vertices, the hypergraph convolution formula is defined as:
In the matrix multiplications described in Equations (7)–(11) above, the embedding fusion representation learning from hypergraph vertices to hyperedges is achieved, capturing high-order features of online students’ courses and preferences. Multiple users and multiple courses are processed using hypergraph convolution calculations, and the results are concatenated for further operations.
In the convolution operations of the five heterogeneous hypergraphs described above, each vertex aggregates information through its associated hyperedges. However, the relationships between different hyperedges and vertices possess varying degrees of importance. To further enhance the model’s capability to capture the significance of different relationships and nodes, an attention mechanism is introduced into the model.
3.4.2. Calculation of Attention Weights
In heterogeneous hypergraphs, each vertex is connected to multiple hyperedges, and each hyperedge, in turn, connects multiple vertices. To capture the differences in importance between different hyperedges and vertices, attention mechanisms based on hyperedge aggregation and vertex aggregation are designed, respectively. The embedding matrices of the five different types of sub-hypergraphs and hyperedges mentioned above will be input into the attention network.
In the algorithm framework, the attention mechanism based on hyperedge aggregation aggregates the embeddings of all hyperedges connected to a particular vertex. The weight matrix P trained in Equation (6) is used to transform the features of vertices and hyperedges. The coefficient matrix between hyperedges and vertices can be calculated using the following formula:
In the above Equation (2), the terms “” and “” represent the connection feature vectors between the “hyperedge and vertex” nodes. is the weight matrix for linear transformation, is the set of all vertices connected to the hyperedge, is the feature vector of hyperedge , and the feature vector of the hyperedge is , which is the weighted sum of the feature vectors of the nodes connected to the hyperedge.
The attention mechanism based on vertex aggregation is similar to the above hyperedge-based attention aggregation mechanism, as they share the same coefficient matrix. The feature representations of hyperedges and vertices in the other four types of hypergraphs are obtained using the same method.
To reveal the similarity in the course lists that online learners focus on, i.e., the similarity between hyperedges with courses as vertices, if the courses that two online learners focus on have a high degree of similarity, then the list of courses they both focus on is relatively long, indicating a high-attention score between them. Otherwise, the attention score would be low. The attention scores between hyperedges are calculated using Equations (13) and (14), as follows:
Equation (13) calculates the cosine similarity between hyperedge
and hyperedge
. The numerator is the dot product of vector
and vector
, and
and
represent the L2 norms of vectors
and
, respectively. The formula for calculating the attention coefficients between hyperedges is shown in Equation (14), and the calculation method is as follows:
In Equation (14), and represent the number of vertices in hyperedge i and hyperedge j, respectively. Since two hyperedges may have different numbers of vertices, the calculation process uses the maximum number of vertices between the two to determine the attention coefficient. If there is no common list of learning courses between the two, the attention coefficient is 0, otherwise, the attention coefficient is high.
3.5. Model Optimization
Finally, by utilizing the embedding representations of users and courses, the preference of users for online courses is predicted, as represented below:
To optimize the model parameters, the pairwise BPR (Bayesian Personalized Ranking) loss function, which is commonly used in recommendation systems [
31], is adopted. The selection of courses in the interactions between students and online courses reflects students’ learning preferences. Specifically, each observed course and an unobserved course form a pair of items.
BPR aims to optimize the ranking of these pairs, with the objective function being:
In Equation (16) , and represent the positive and negative instances, represents the activation function, represents the set of parameters, and controls the L2 regularization strength to prevent overfitting. To optimize the objective function, the Adam optimizer is used to train the model. During training, random sampling of u is performed, and all items in the sequence are treated as “positive” instances, while the next item in the sequence is treated as a “negative” instance, to form triplets. The objective function is used to iteratively train and update the model parameters.
4. Experiments
4.1. Datasets
MOOCCube is a large-scale dataset for MOOC (Massive Open Online Course) research, and all datasets are sourced from real-world online classrooms. It includes 199,199 online learners, 1736 online instructors, and more than 700 courses. In the experiments, the training, validation, and testing data consist of the historical online learning data of 18,890 learners and the teaching data of 1250 online instructors. We allocated 60% of the total data for training, 20% for the validation datasets, and the remaining 20% for the testing datasets.
4.2. Parameter Settings
In the experiments, the top-k recommended courses are selected as the final evaluation results, with k = {5, 10, 15}. The learning rate = {0.001, 0.005, 0.01, 0.05, 0.1}, the embedding dimensions for student users and courses D = {32, 64, 128, 256, 512}, and the batch size Batch-Size = {32, 64, 128, 256}. The model was trained on an NVIDIA GeForce RTX 3090 GPU (Nvidia, Santa Clara, CA, USA) and built using the TensorFlow 2.0 framework. Optuna 2.0.0 was used to search for the optimal hyper parameters, and the best results were achieved with an embedding dimension D of 128, a batch size of 256, and a learning rate of 0.01. The optimal regularization coefficient λ was found to be 0.01 through experimentation.
4.3. Evaluation Metrics
To objectively evaluate the performance of various algorithms, the performance 2.metrics used include NDCG (Normalized Discounted Cumulative Gain), Recall, and F1-SCORE. The higher the values of these metrics, the better the model’s performance. They are defined as shown in Equations (17)–(19).
The NDCG formula is as follows:
In Equation (17), DCG (Discounted Cumulative Gain) represents the unnormalized cumulative gain, and IDCG (Ideal DCG) represents the maximum possible DCG value under the ideal ranking. The in the Equation represents the relevance score of the item at the i-th position in the recommendation list, and the represents the relevance score of the item at the i-th position in the ideal ranking.
The Recall formula is as follows:
F1-SCORE formula is as follows:
In Equation (20), TP, TN, FN, and FP represent true positives, true negatives, false negatives, and false positives, respectively, in the recommendation results.
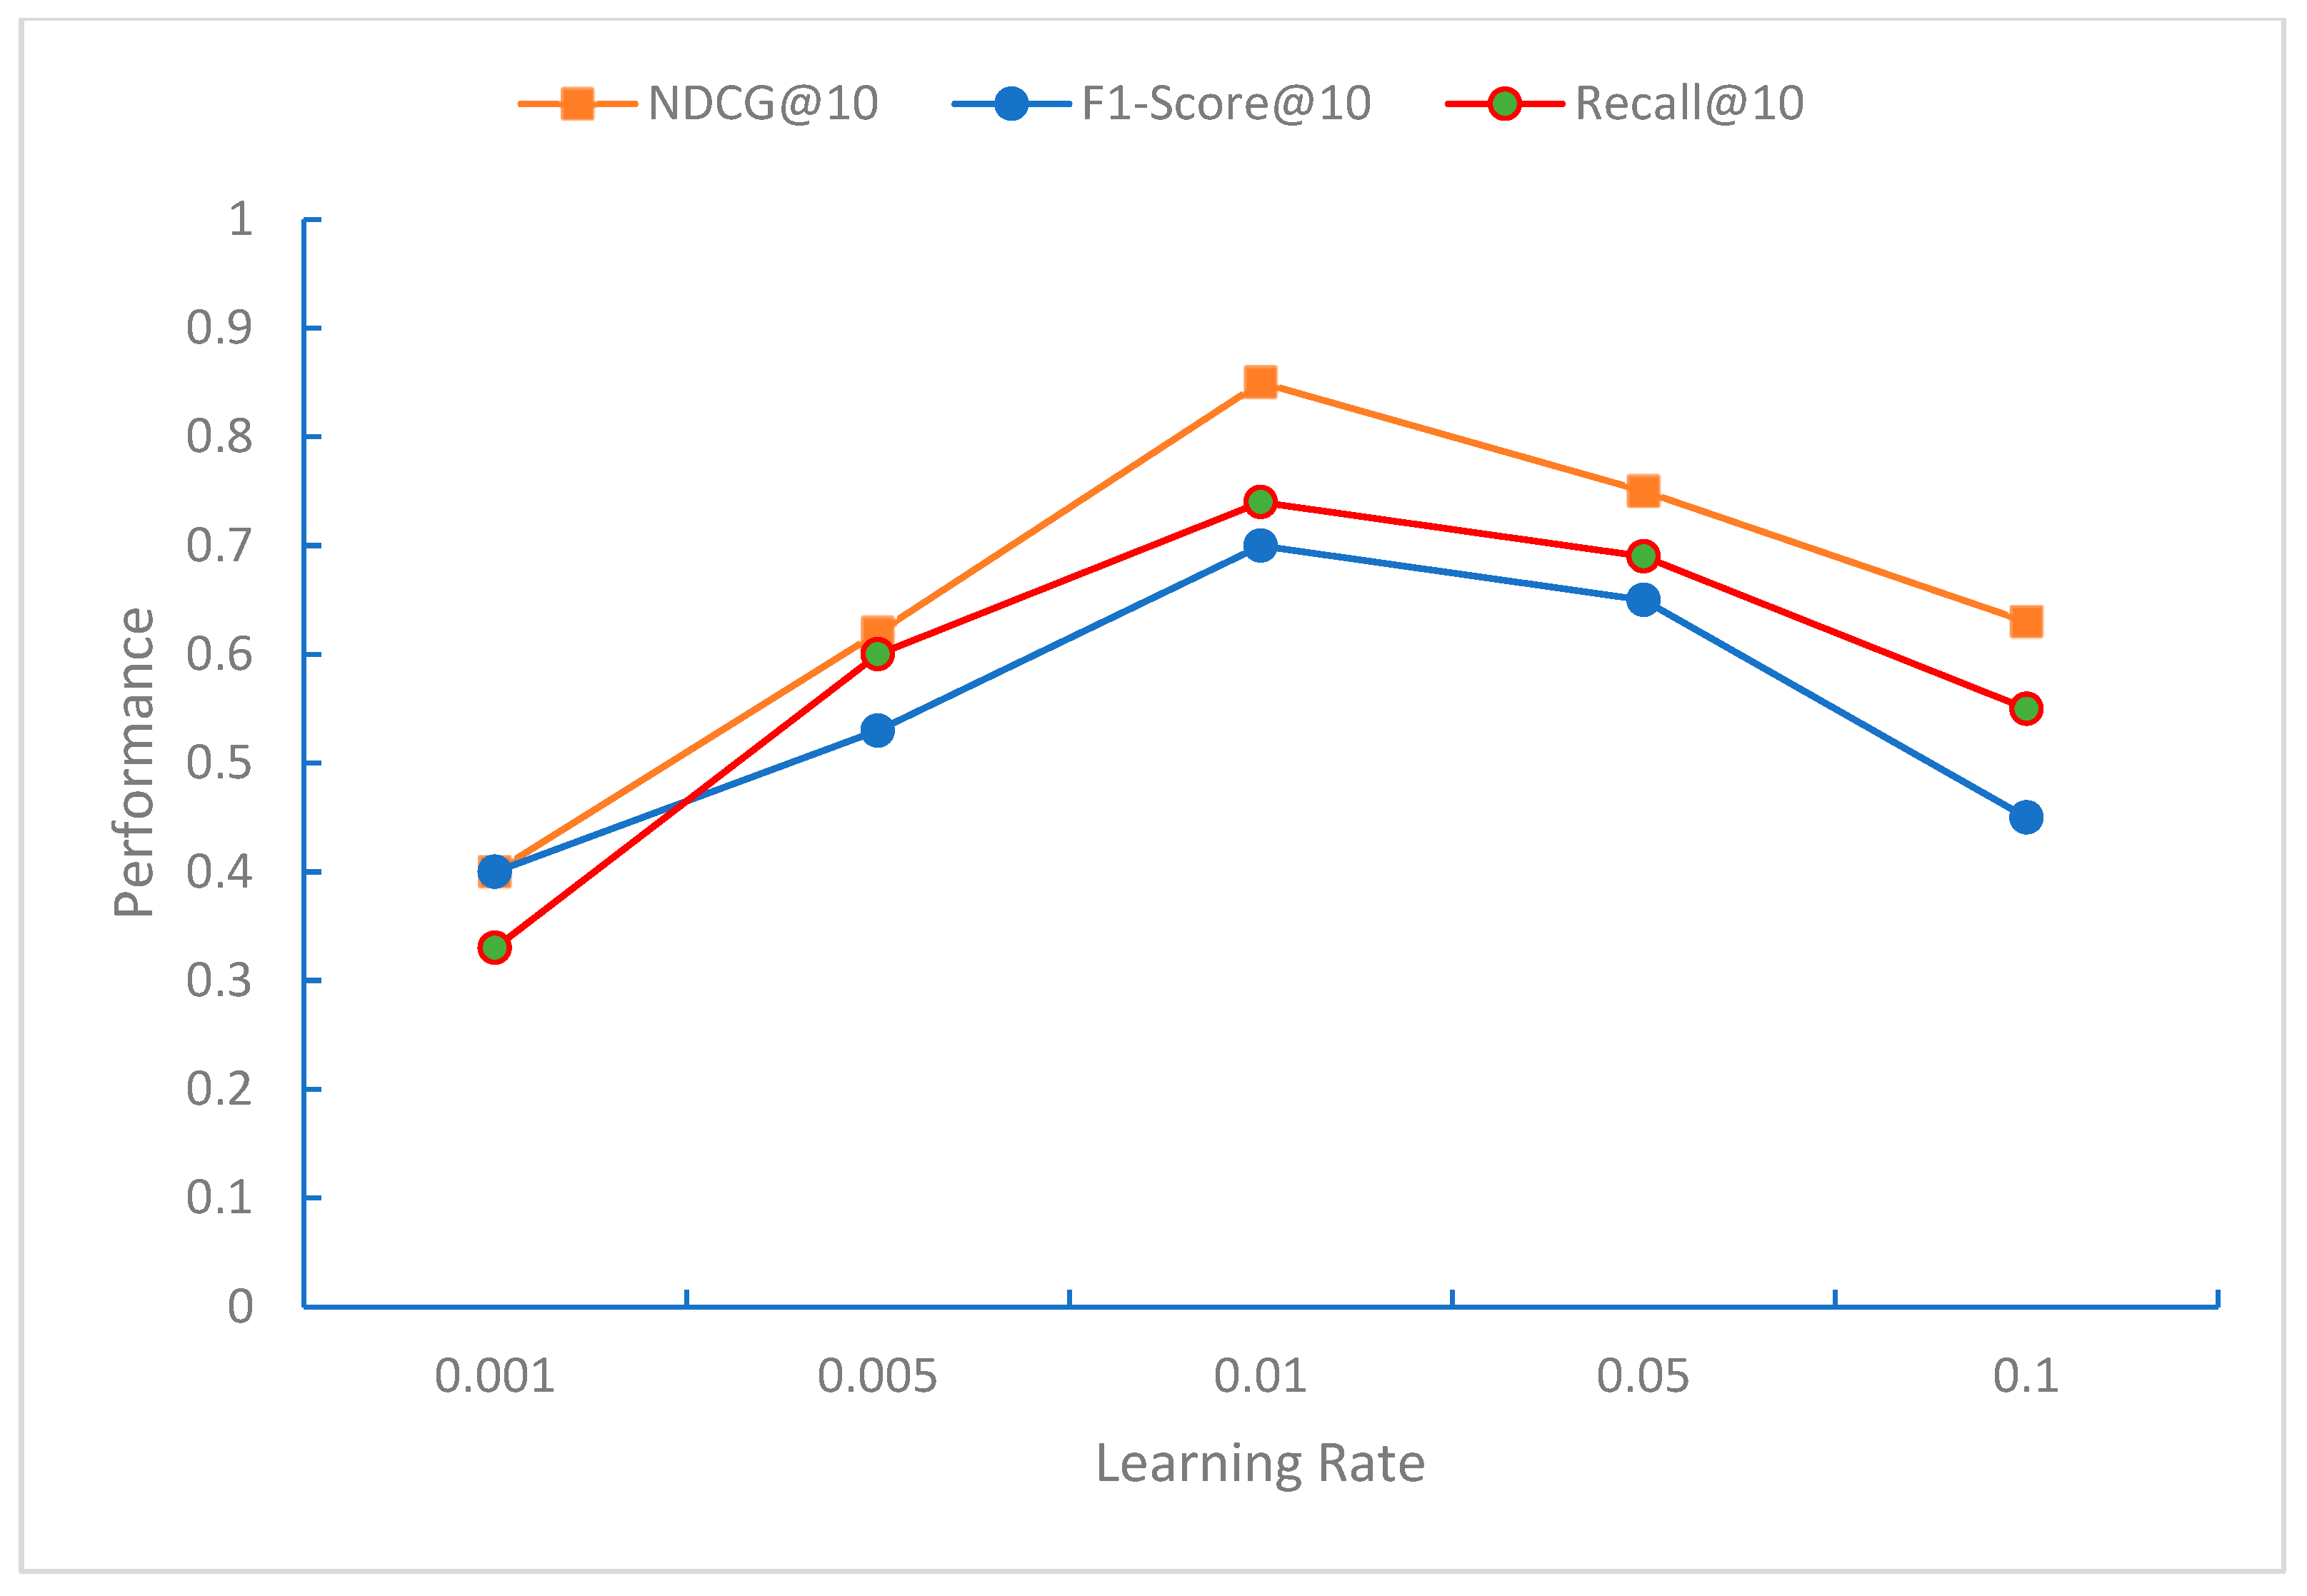
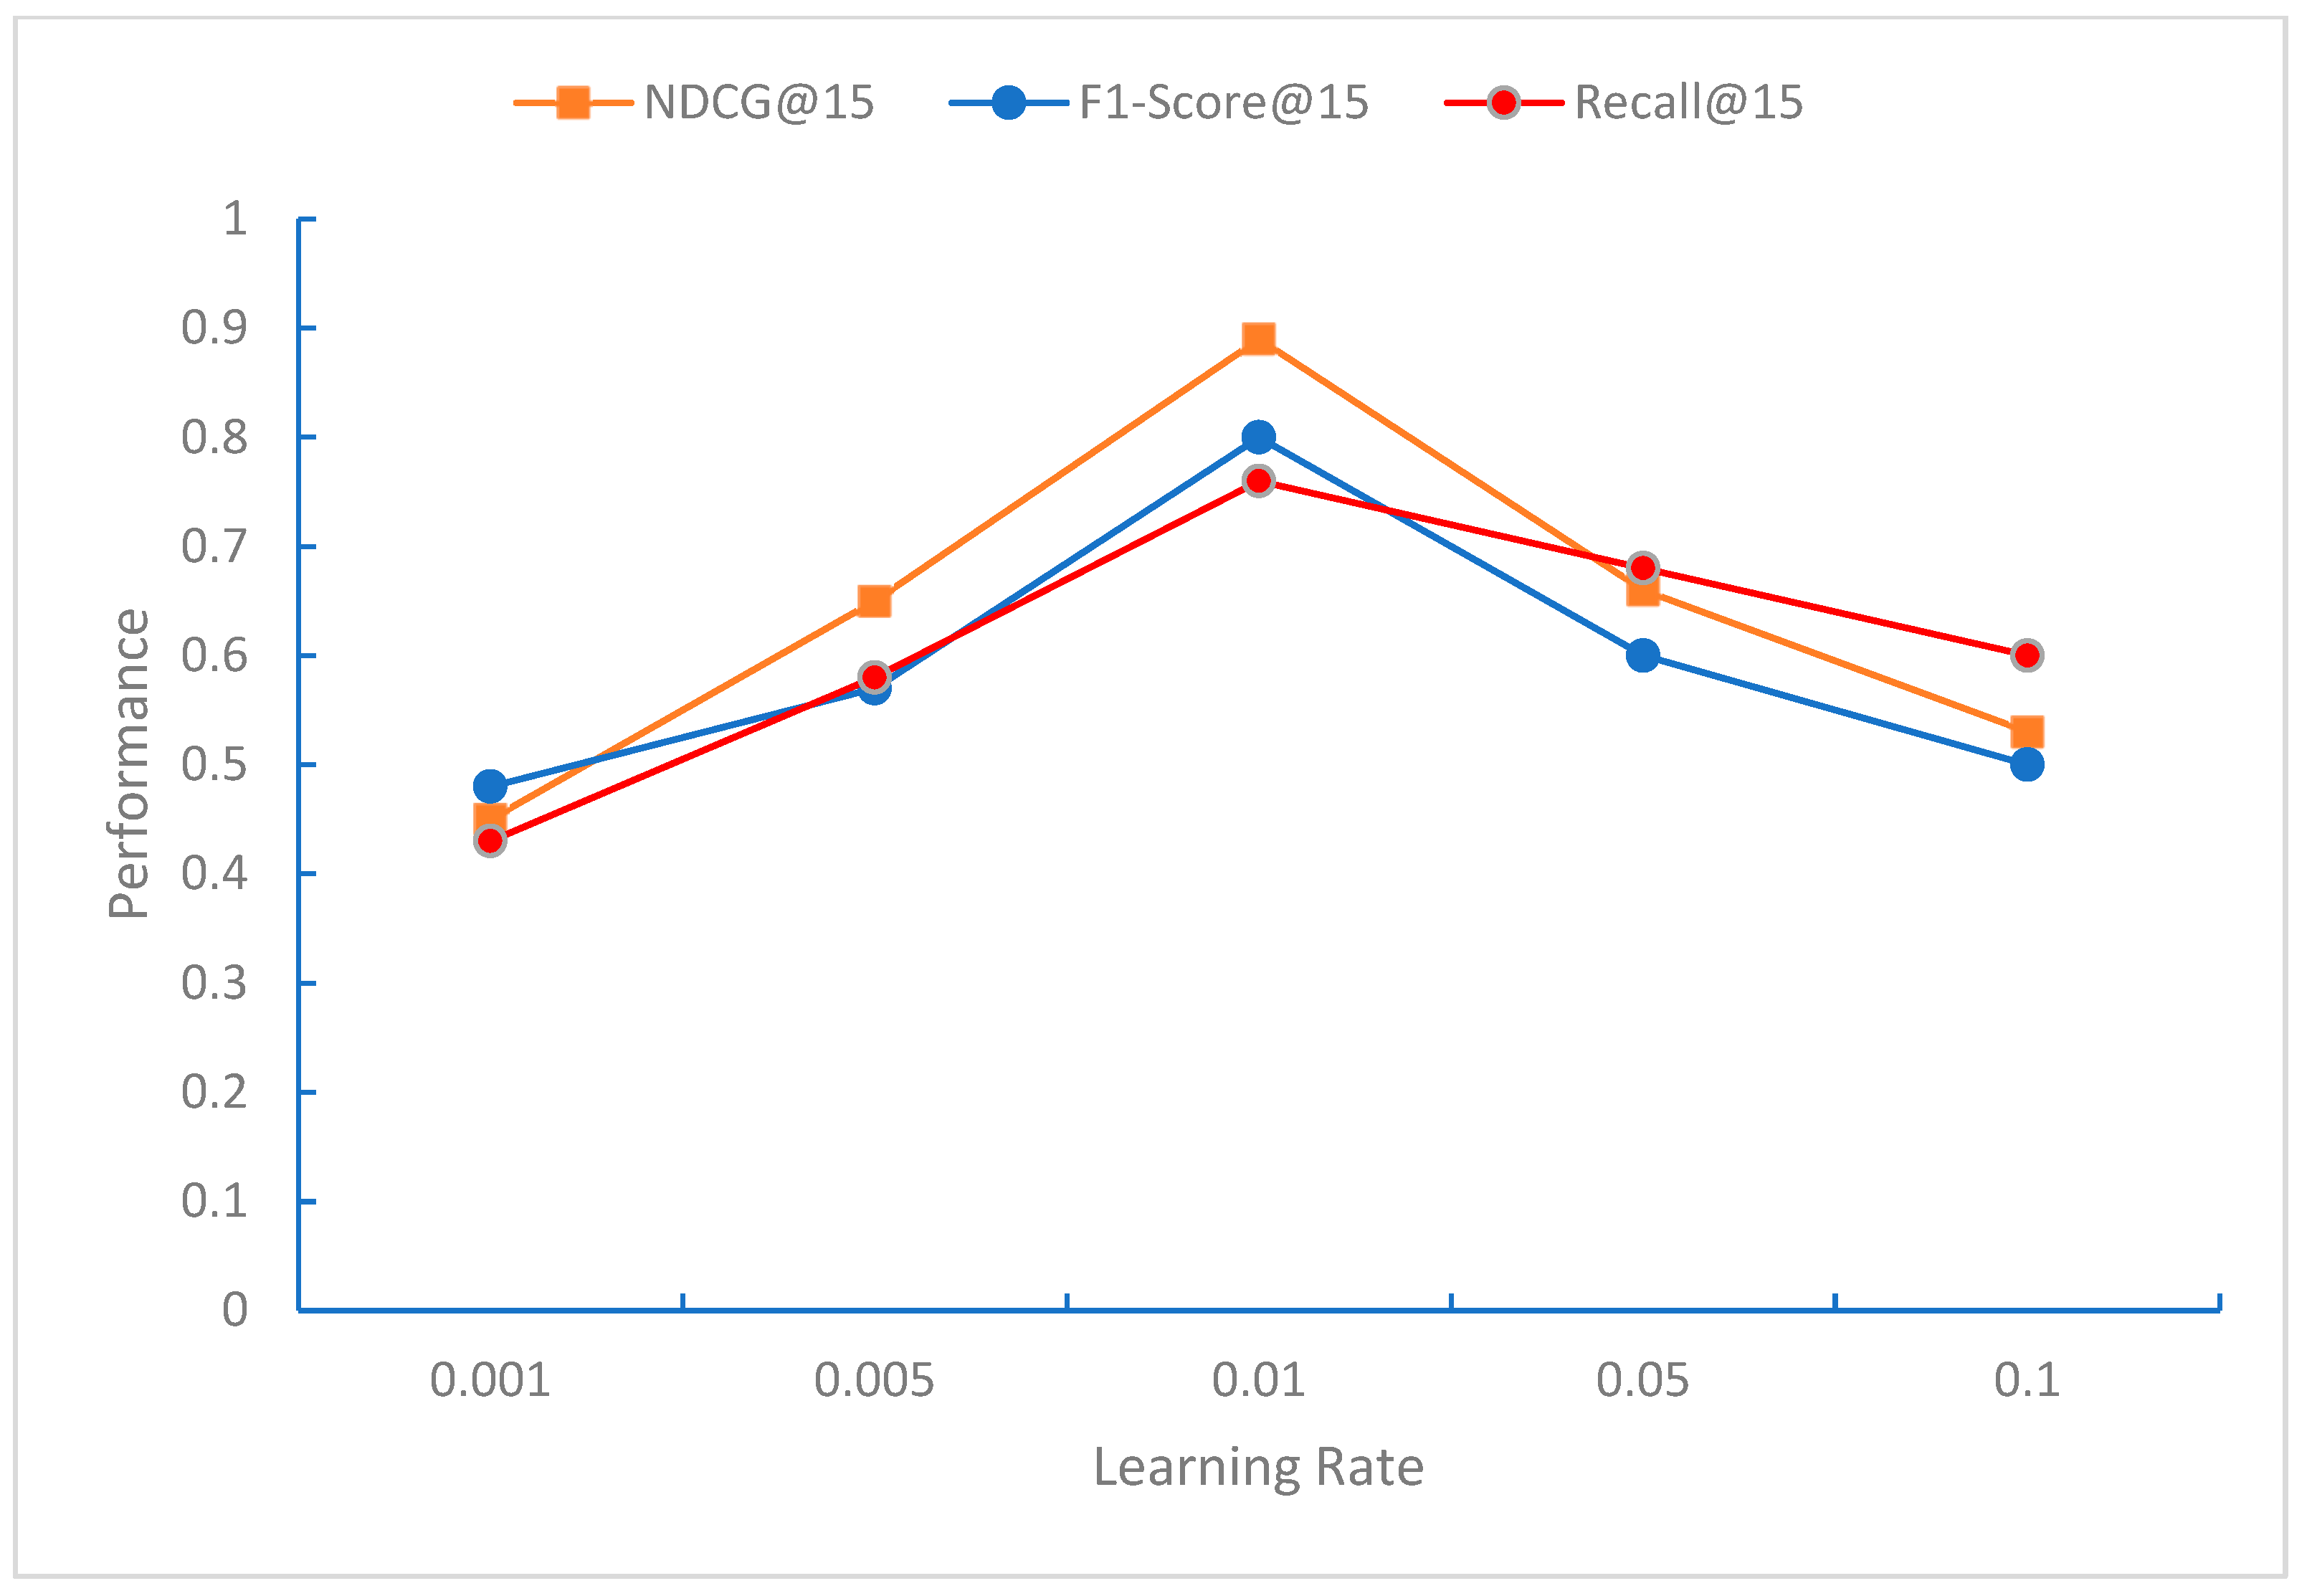
From
Figure 3,
Figure 4 and
Figure 5, it can be observed that the impact of the learning rate on NDCG, F1-Score, and Recall shows a trend of first increasing and then decreasing, with the learning rate of around 0.01 yielding the best results. The NDCG, F1-Score, and Recall metrics gradually improve as the length of the recommendation list increases, indicating that with a longer recommendation list, more relevant courses can be recommended.
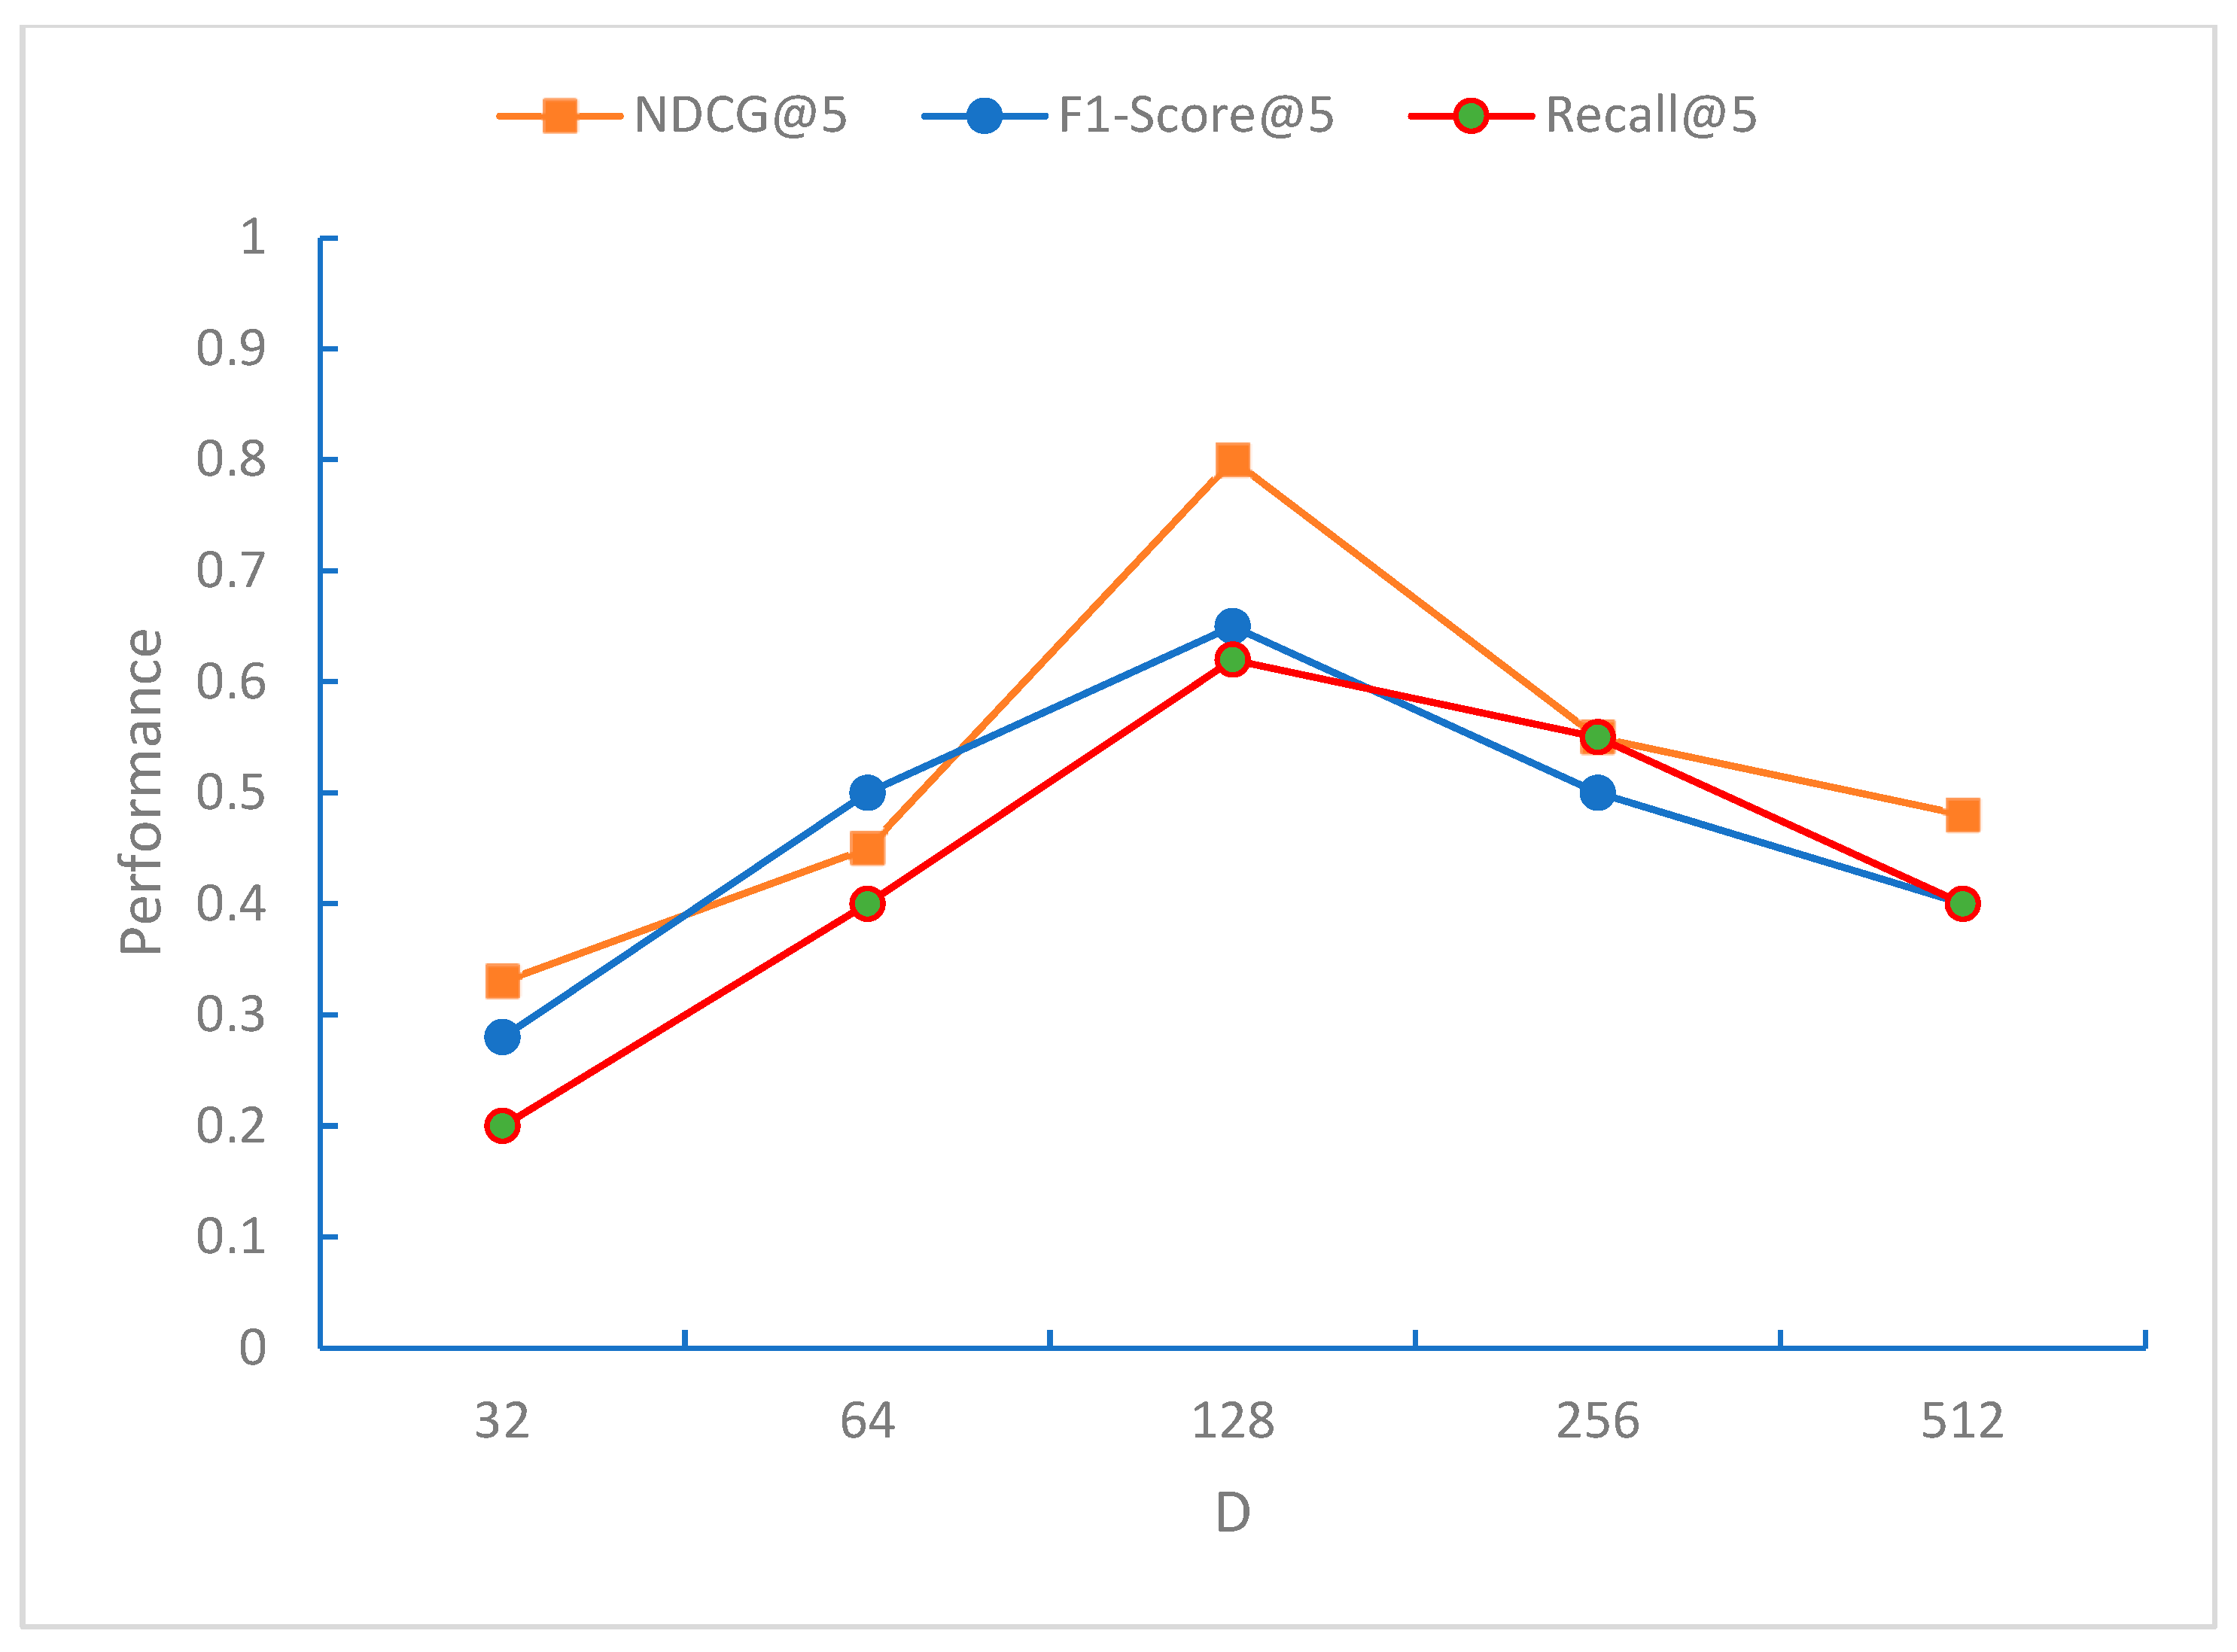
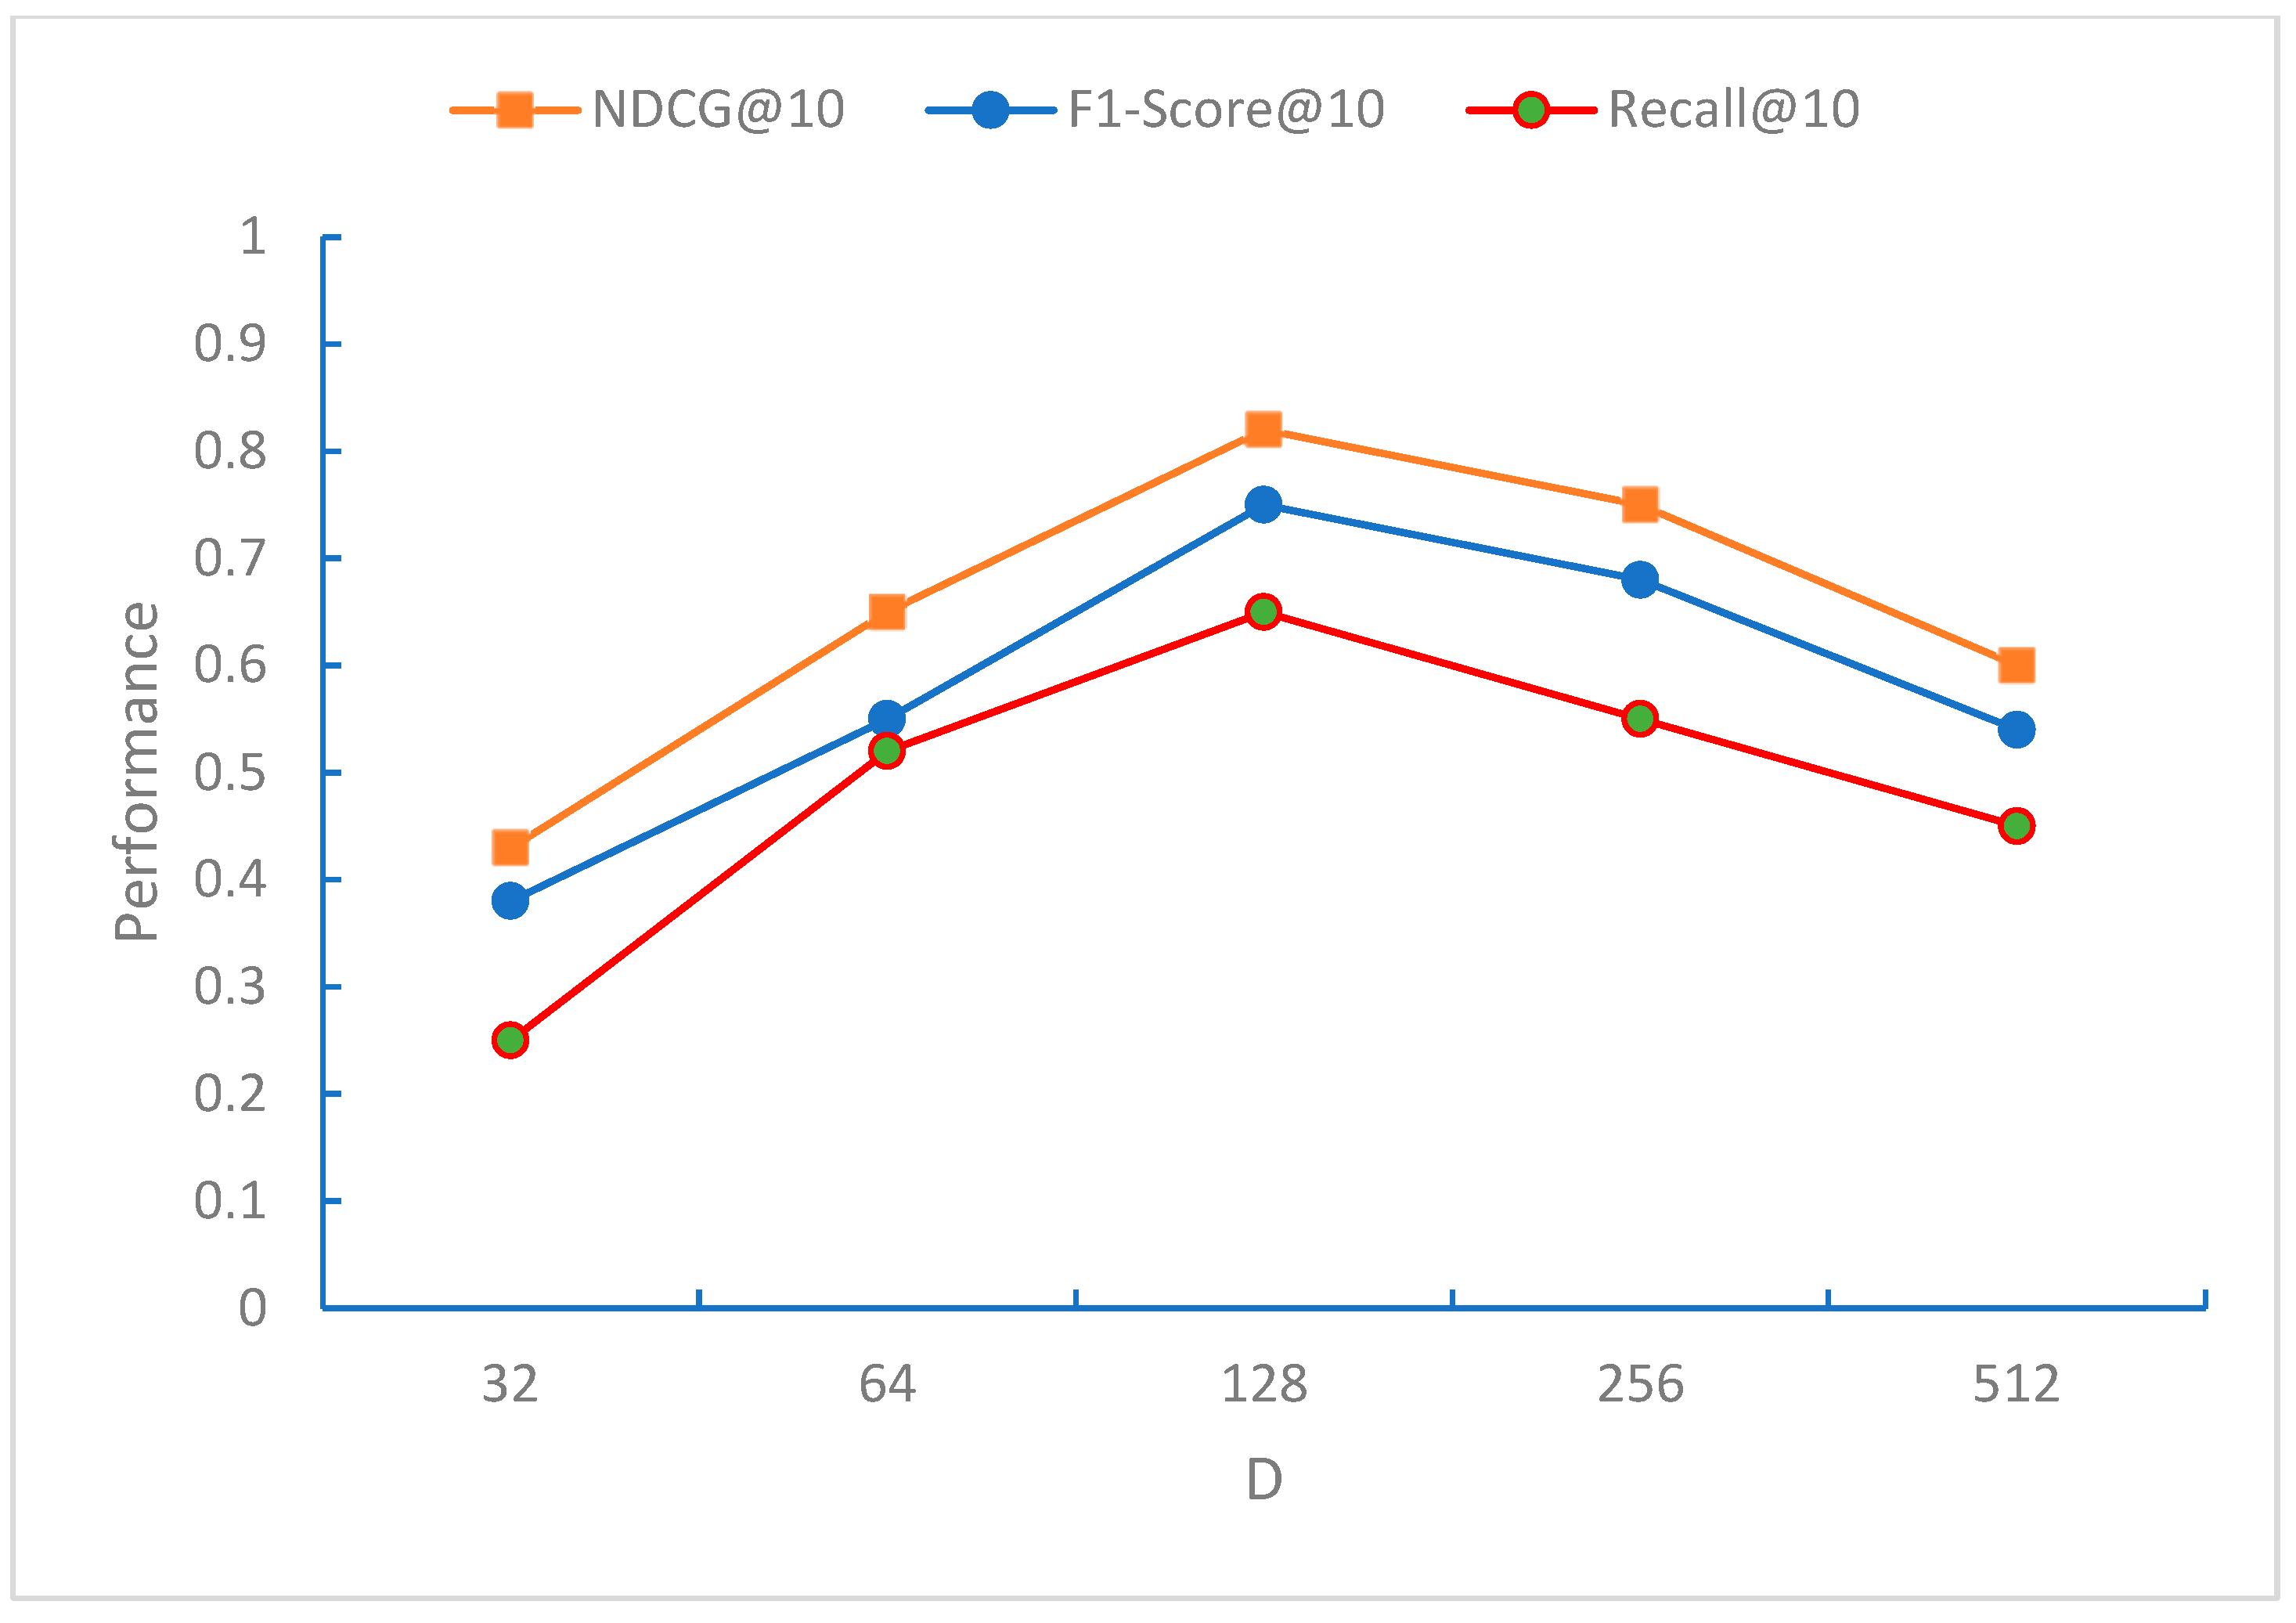
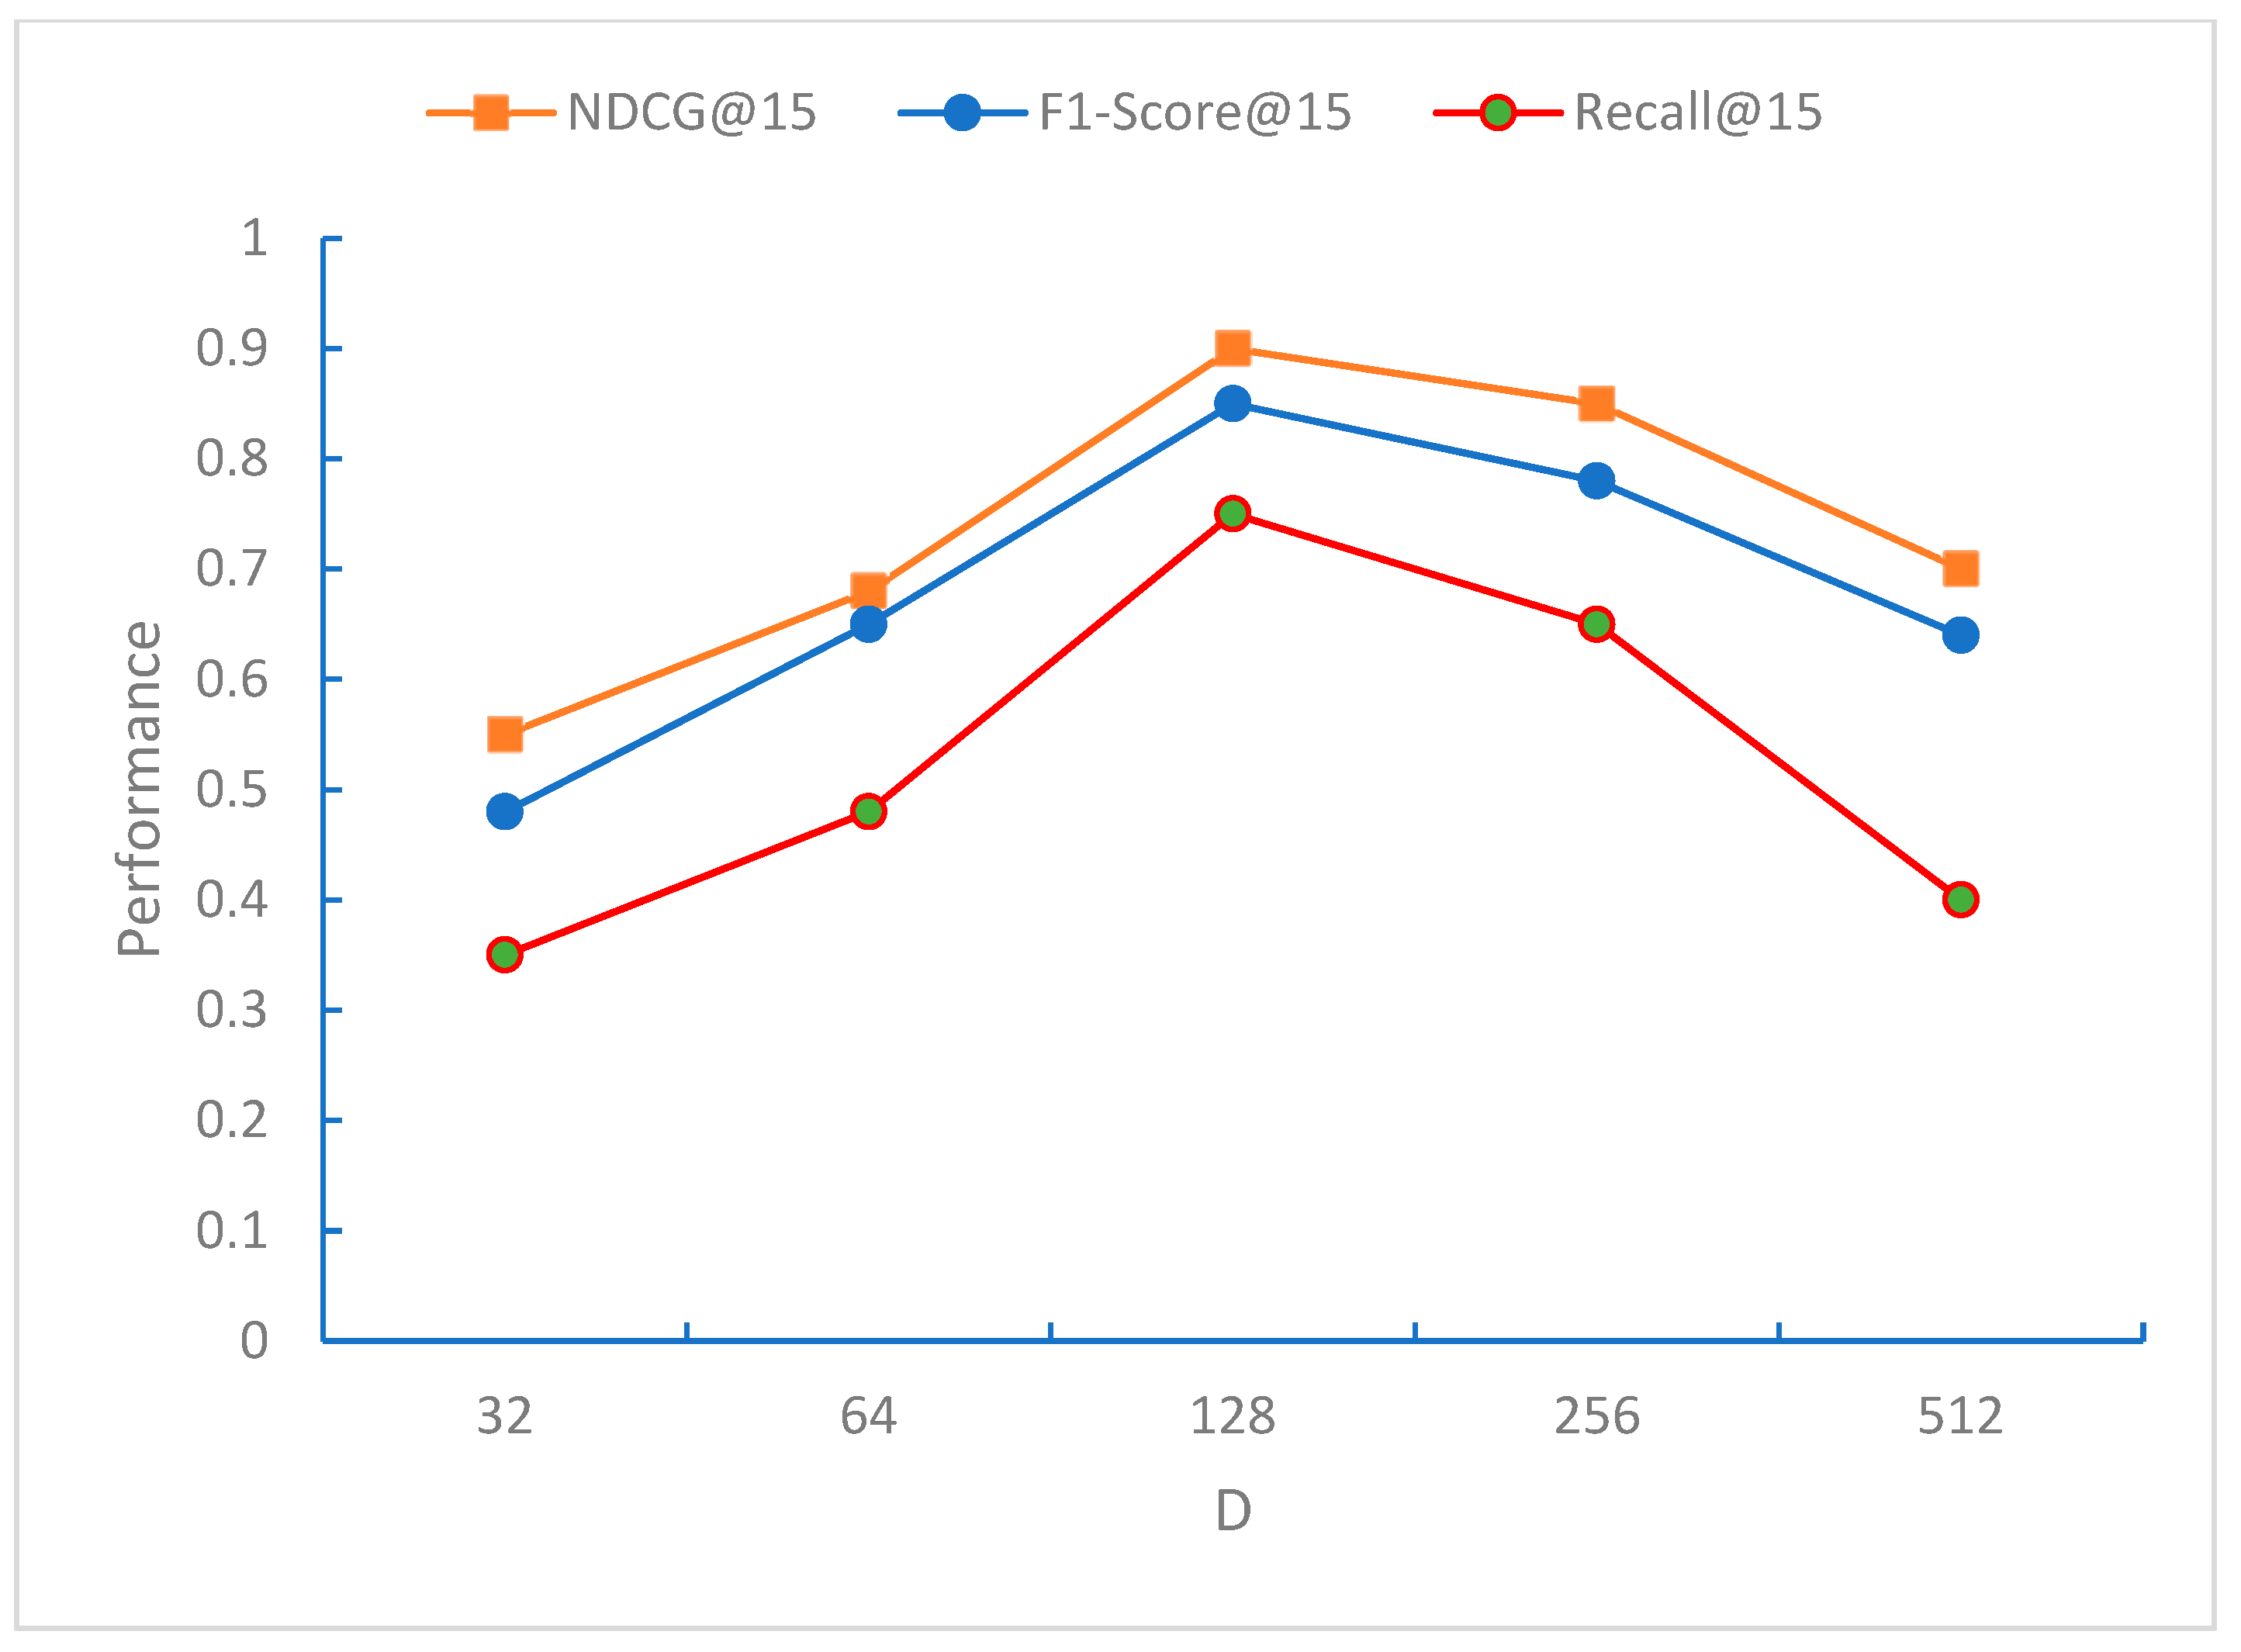
From
Figure 6,
Figure 7 and
Figure 8, it can be observed that the NDCG, F1-Score, and Recall metrics exhibit the best performance for the recommendation sequence when the embedding dimension D is 128. This may be because, at this dimension, the model can effectively capture the characteristics of the data. As D increases further, all three metrics, NDCG, F1-Score, and Recall, begin to decline, indicating that the model starts to overfit when the embedding dimension D exceeds 128 dimensions.
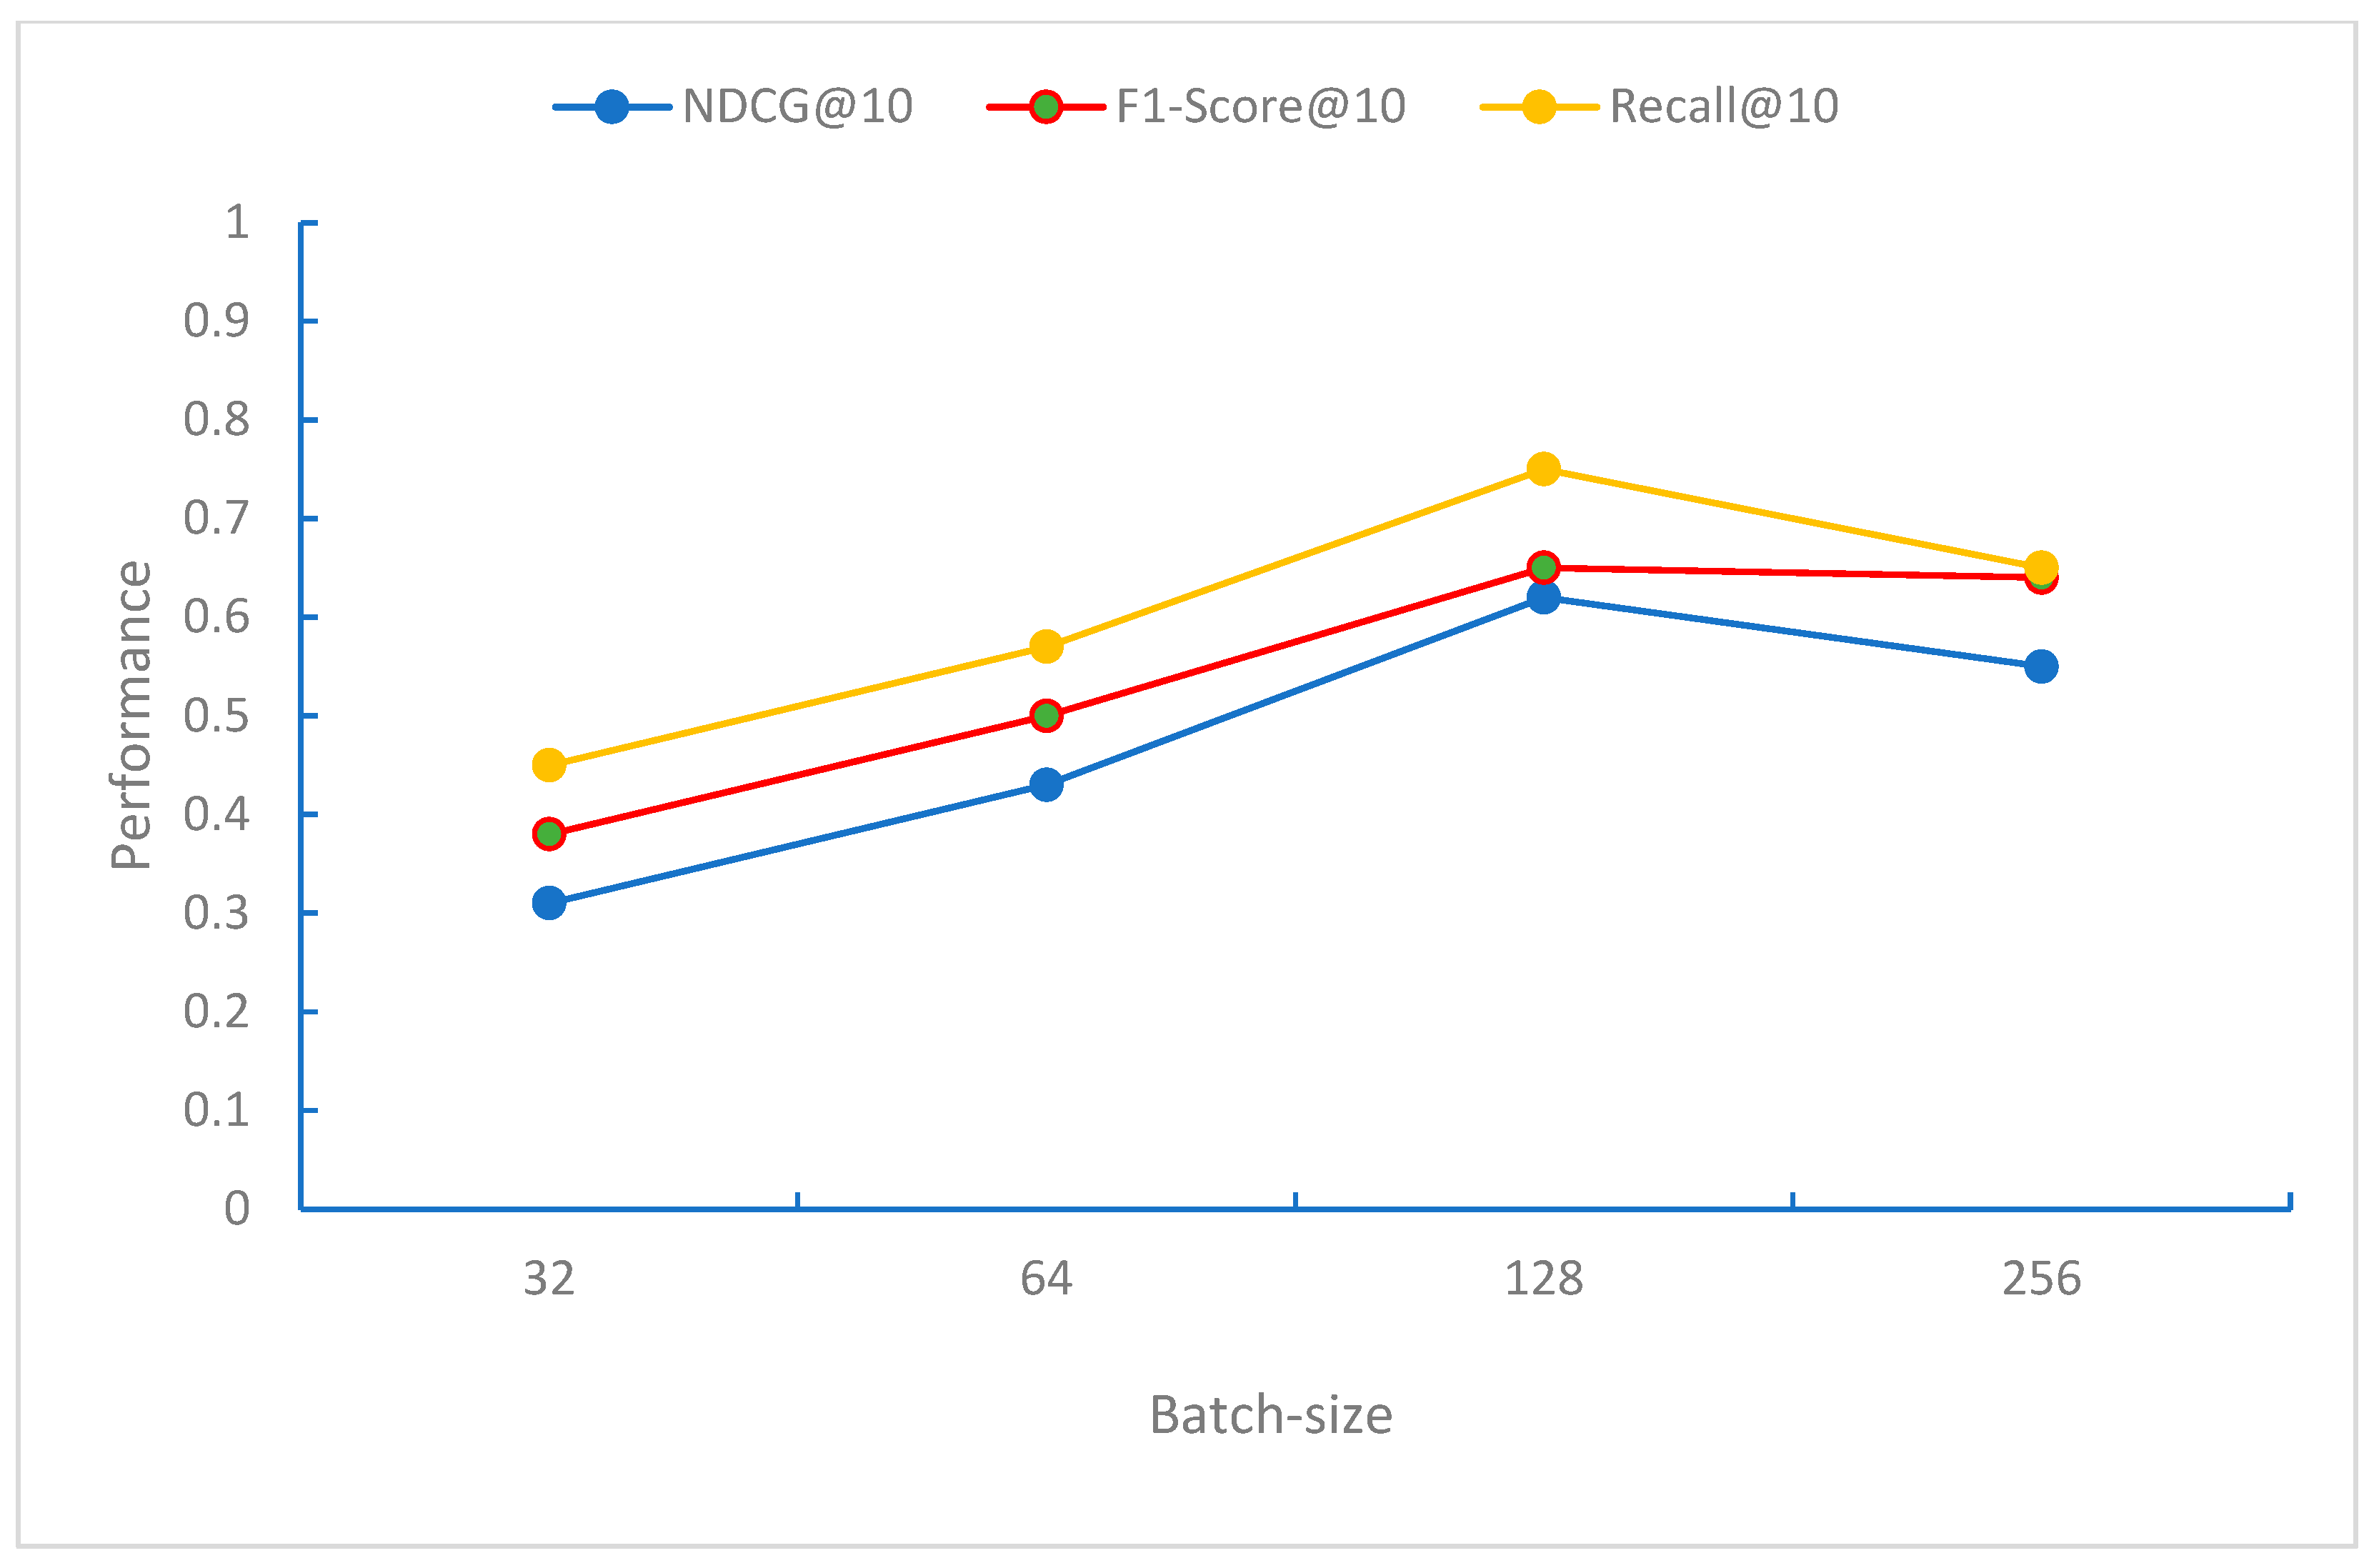
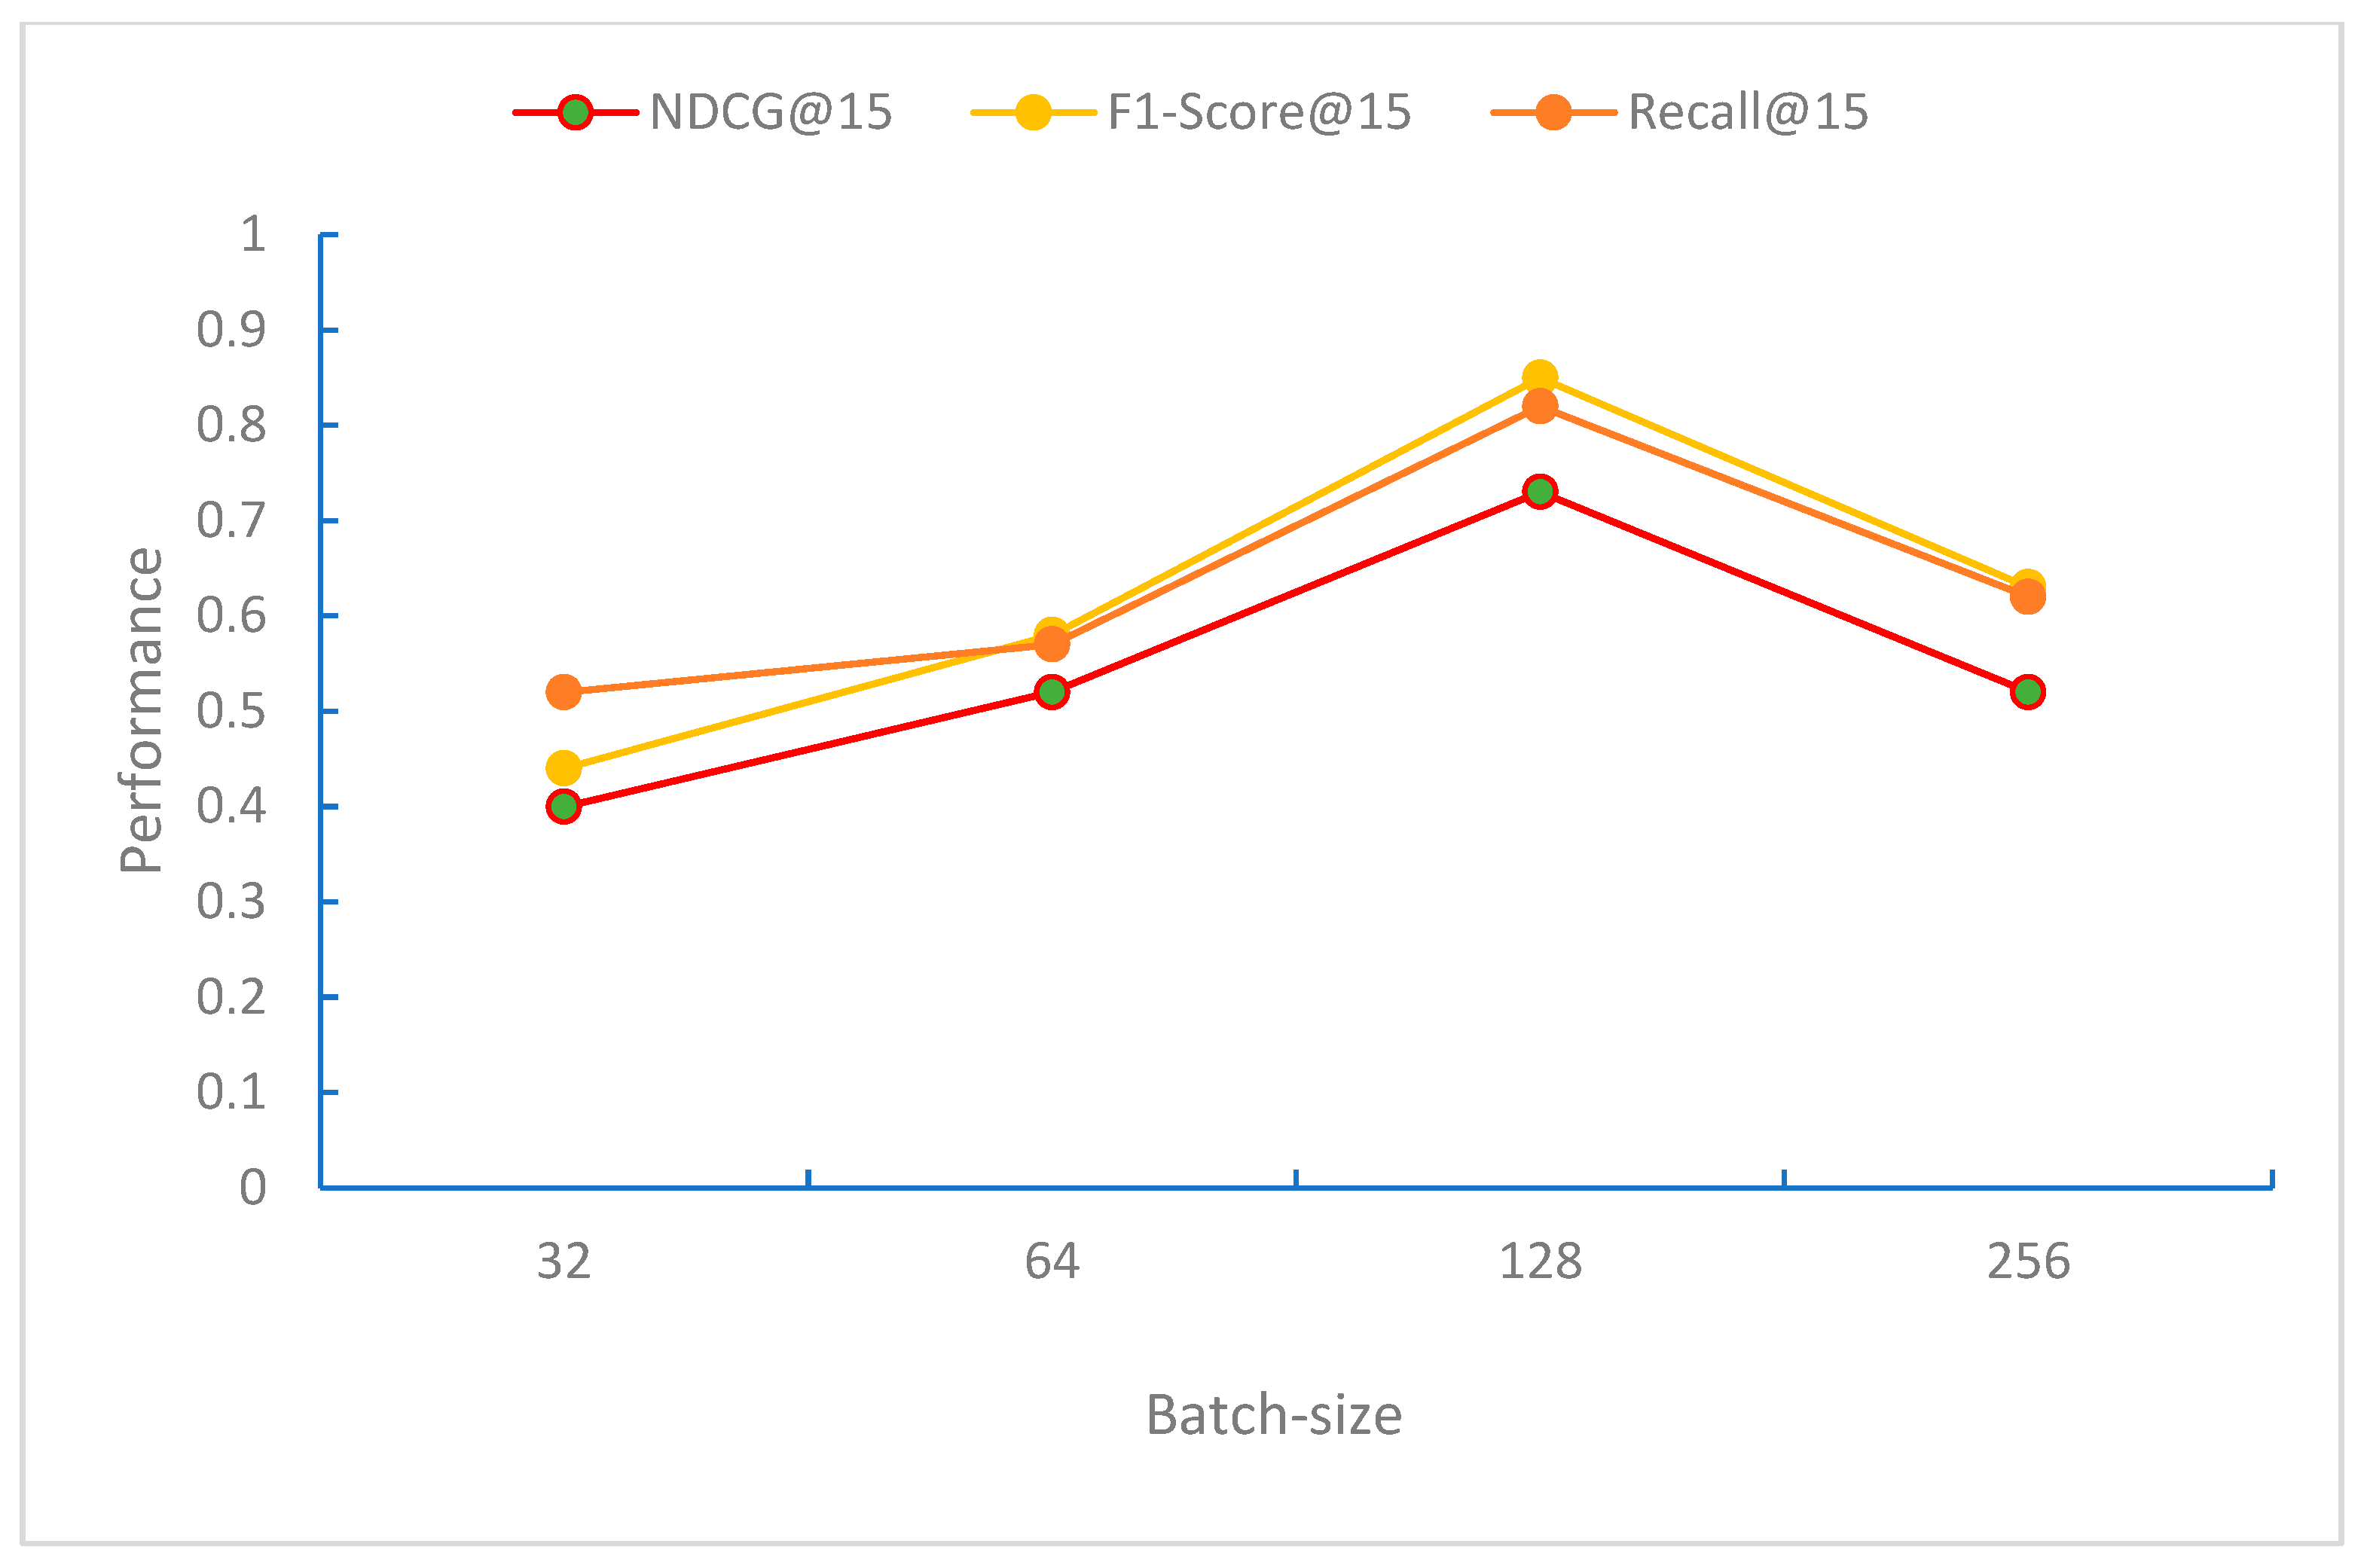
From
Figure 9,
Figure 10 and
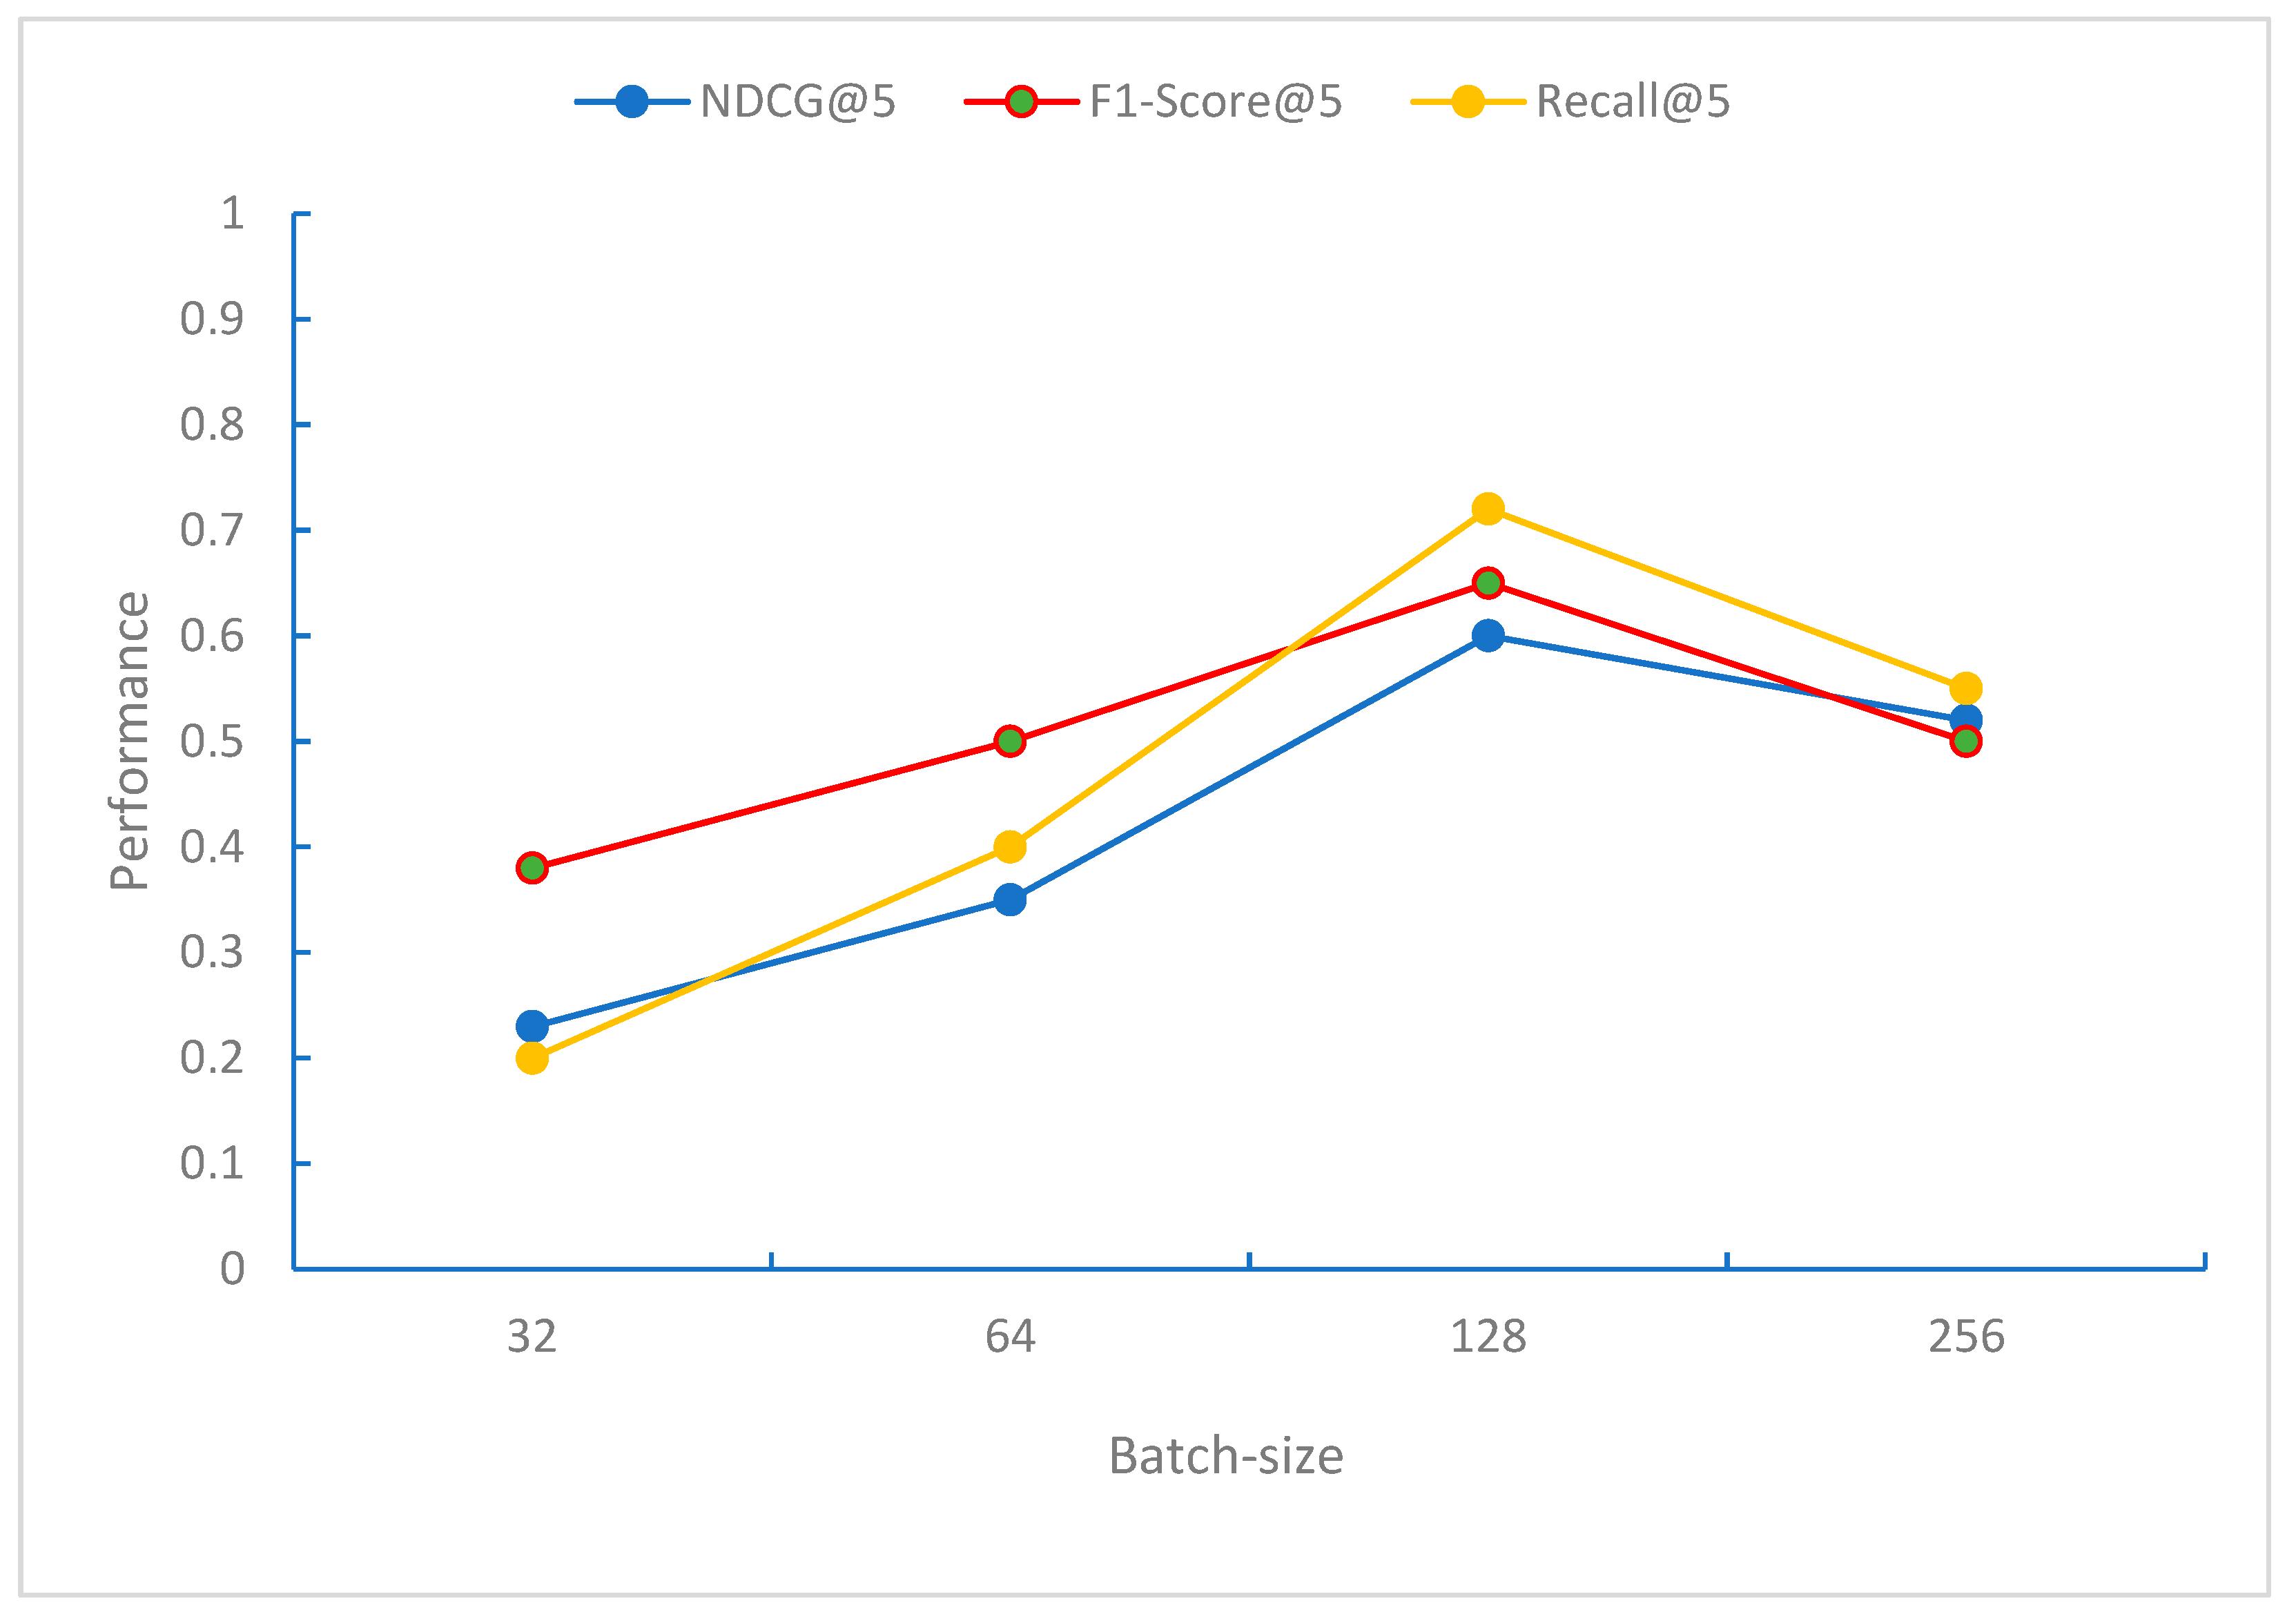
Figure 11, it can be observed that when the Batch-size is 128, the model performs best in terms of the NDCG, F1-Score, and Recall evaluation metrics. When the Batch-size exceeds 128, the performance of these metrics begins to decline. This may be because, at this Batch-size, the model can effectively perform gradient updates and convergence.
4.4. Comparative Methods
We selected feature-based methods and deep learning-based methods to conduct comparative experiments with our proposed method. The methods involved in the comparative experiments are as follows:
POP [
32]: Utilizes a neural network architecture with multilayer perceptrons to model latent features of user-item interaction functions. It is a neural network-based collaborative filtering recommendation method.
BPR [
33]: A Bayesian optimization approach for recommendation tasks, providing a general learning algorithm to optimize models with respect to BPR-Opt. The algorithm is based on stochastic gradient descent and bootstrap sampling for model optimization.
GRU4Rec [
34]: Implements session-based recommendation tasks using a recurrent neural network architecture based on GRUs.
BERT4Rec [
31]: A classic pre-training method for achieving bidirectional transformer-based recommendation models.
Light-GCN [
35]: This method learns student and course embeddings by conducting student-course interaction graphs and uses the weighted sum of embeddings learned from all layers as the final embeddings.
TP-GNN [
36]: A graph neural network-based MOOC course recommendation method that captures high-level semantic relationships between courses through graph convolutional networks.
IRS-GCNet [
37]: Proposes a university course intelligent recommendation system based on graph convolutional networks. The system utilizes graph convolutional networks to obtain representations of students’ English skills and employs an adjacency contrastive learning strategy to reduce errors caused by information loss during message passing between neighboring nodes in graph learning.
4.5. Experimental Results and Analysis
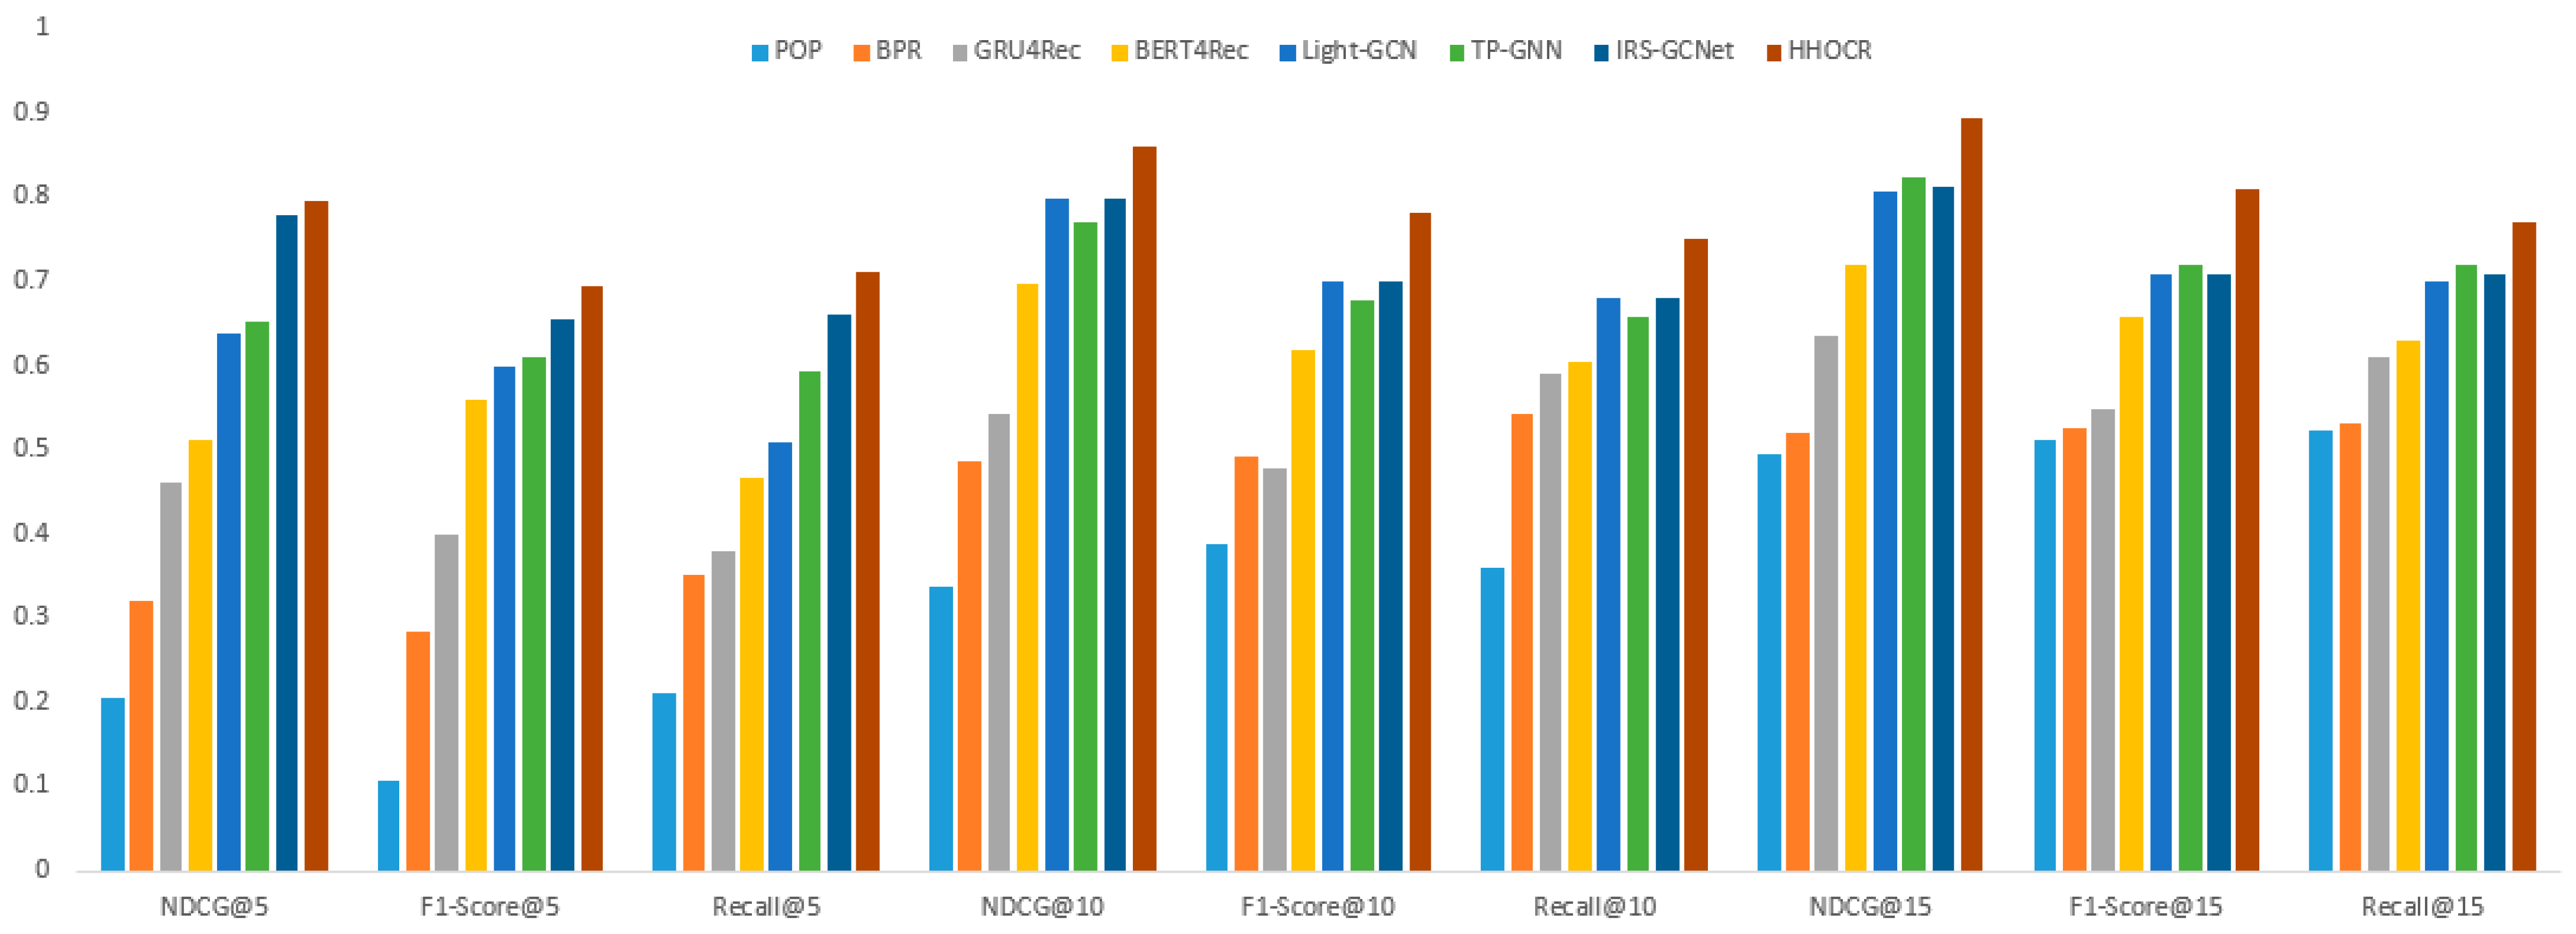
We evaluated the above seven algorithms using the NDCG, F1-Score, and Recall metrics, assessing the recommendation capabilities of the top 5, top 10, and top 15 recommendations for each algorithm. To ensure fair comparative experiments, each algorithm used the parameter settings from the original articles and employed the Bayesian hyper parameter optimization library Optuna to find the optimal hyper parameters. The experimental results are shown in
Table 1,
Table 2 and
Table 3 and
Figure 12. The last three columns of
Table 1,
Table 2 and
Table 3 correspond to the differences in the three metrics between each algorithm and the proposed HHOCR.
From the comparative experimental results in
Table 1,
Table 2 and
Table 3 and
Figure 12, it can be observed that among the seven algorithms, including feature-based methods (POP, BPR) and deep learning-based methods (GRU4Rec, BERT4Rec, Light-GCN, TP-GNN, IRS-GCNet), the proposed heterogeneous hypergraph, and attention-based online course recommendation algorithm (HHOCR) was compared and analyzed. The following conclusions were drawn:
In the case of recommending the top 5 items, the HHOCR algorithm demonstrated the best performance, with NDCG@5 reaching 0.7965, F1-Score@5 at 0.6945, and Recall@5 at 0.7102. Compared to the second-ranked IRS-GCNet, HHOCR improved these three metrics by 0.0173, 0.0408, and 0.0510, respectively. Compared to other algorithms, HHOCR also significantly outperformed POP, BPR, GRU4Rec, BERT4Rec, and Light-GCN. This indicates that HHOCR has a clear advantage in accuracy and recall for the top 5 recommendations.
In the case of recommending the top 10 items, the HHOCR algorithm still performed exceptionally well, with NDCG@10 reaching 0.8593, F1-Score@10 at 0.7813, and Recall@10 at 0.7514. Compared to the second-ranked IRS-GCNet, HHOCR improved by 0.0613, 0.0824, and 0.0724, respectively. Compared to other algorithms, HHOCR’s NDCG@10 and F1-Score@10 were 0.5233 and 0.3939 higher than POP’s, and 0.3736 and 0.2906 higher than BPR’s, and 0.3179 and 0.3024 higher than GRU4Rec’s. This further validates HHOCR’s superior performance in recommending the top 10 items.
In the case of recommending the top 15 items, the HHOCR algorithm continued to perform excellently, with NDCG@15 reaching 0.8938, F1-Score@15 at 0.8092, and Recall@15 at 0.7698. Compared to the second-ranked TP-GNN, HHOCR improved by 0.0699, 0.0907, and 0.0509, respectively. Compared to other algorithms, HHOCR’s NDCG@15 and F1-Score@15 were 0.4001 and 0.2966 higher than POP’s, 0.3749 and 0.2828 higher than BPR’s, and 0.2595 and 0.2609 higher than GRU4Rec’s. This indicates that HHOCR still has a significant advantage in recommending the top 15 items.
Although POP, BPR, GRU4Rec, BERT4Rec, Light-GCN, TP-GNN, and IRS-GCNet performed well in certain metrics, they had limitations in capturing complex relationships and dynamic features. The HHOCR algorithm, by constructing a heterogeneous hypergraph, is able to capture many-to-many relationships among users, courses, and teachers, not only considering users’ historical behaviors but also the semantic relationships between courses and users’ preferences. This makes HHOCR significantly superior in recommendation accuracy and recall compared to other algorithms. Additionally, the use of attention mechanisms allows HHOCR to dynamically focus on important features and relationships, thereby improving the personalization and precision of recommendations. Especially in recommending the top 5 and top 10 items, the role of hypergraphs and attention mechanisms is more pronounced, leading to significant improvements in NDCG, F1-Score, and Recall for long-sequence recommendations.
5. Conclusions
In this study, we proposed a heterogeneous hypergraph and attention mechanism-based online course recommendation algorithm (HHOCR) and compared it with several existing recommendation algorithms (POP, BPR, GRU4Rec, BERT4Rec, Light-GCN, TP-GNN, IRS-GCNet) through comprehensive experiments. The experimental results demonstrate that HHOCR outperforms other algorithms in recommending the top 5, top 10, and top 15 items.
Specifically, in the case of recommending the top 5 items, HHOCR achieved an NDCG@5 of 0.7965, F1-Score@5 of 0.6945, and Recall@5 of 0.7102; in recommending the top 10 items, NDCG@10 was 0.8593, F1-Score@10 was 0.7813, and Recall@10 was 0.7514; in recommending the top 15 items, NDCG@15 was 0.8938, F1-Score@15 was 0.8092, and Recall@15 was 0.7698. Notably, HHOCR’s performance in the NDCG metric stood out.
The superior performance of HHOCR is primarily attributed to its unique heterogeneous hypergraph structure and attention mechanism. The heterogeneous hypergraph is capable of capturing complex higher-order relationships between users and courses, while the attention mechanism dynamically focuses on important features and relationships, thereby enhancing the personalization and precision of recommendations. Additionally, by utilizing the Bayesian hyper parameter optimization library Optuna, we were able to find an optimal set of hyper parameter configurations, further boosting the model’s performance.
In summary, the HHOCR algorithm demonstrates significant advantages in online course recommendation, achieving optimal recommendation results across multiple evaluation metrics. This provides new insights for future online education and personalized course recommendation systems.


