1. Introduction
Beef quality grading is a crucial process that directly affects pricing and significantly influences consumer choices [
1]. Higher-grade beef commands a substantially higher price compared to lower-grade products [
2]. In South Korea, beef carcasses are graded based on five criteria: intramuscular fat (IMF), meat color, fat color, texture, and maturity. The carcasses are categorized into five grades: 1++, 1+, 1, 2, and 3 [
2]. The current standard grading method relies on visual inspection by trained experts [
3].
However, such manual assessments are inherently subjective and often lack consistency among evaluators, posing limitations in terms of efficiency and reliability in large-scale industrial environments [
4]. To overcome these challenges, image-based analysis techniques and deep learning approaches have been actively explored to automate the grading process [
5]. Early automated systems relied on complex preprocessing steps such as illumination correction, background removal, and region-of-interest (ROI) extraction to achieve acceptable accuracy, but these multi-step pipelines are inefficient for practical deployment.
To reduce preprocessing burdens, several studies have proposed segmentation-based methods to automatically extract ROI regions and improve classification accuracy [
3]. However, the two-stage structure that separates segmentation and classification increases model complexity and is less efficient in terms of end-to-end learning.
Recently, one-stage classification models that directly predict grades from entire images without segmentation have gained attention [
6]. However, conventional CNN-based one-stage models tend to focus on local features, which limits their performance when global visual patterns—such as marbling distribution in IMF—are critical. Intramuscular fat is known to be highly influential and closely correlated with other grading criteria [
7,
8,
9].
To address these limitations, this study proposes a one-stage beef carcass grading model based on EfficientViT, a lightweight hybrid architecture that combines Vision Transformers and CNNs. EfficientViT is designed to simultaneously capture local patterns via convolutional layers and global contextual features via self-attention, while maintaining a compact and fast-inference design suitable for real-time deployment [
10].
The main contributions of this study are as follows:
We propose a high-accuracy one-stage grading model based on EfficientViT that eliminates the need for a complex two-stage pipeline;
We demonstrate the importance of leveraging global features through performance comparisons with CNN-based models (VGG16, ResNeXt50, DenseNet121);
We enhance model explainability through visual analysis using Grad-CAM [
11] and attention maps [
12];
We validate the model’s suitability for real-time industrial applications with low inference latency and compact parameter size.
This paper details the architecture of the proposed EfficientViT-based one-stage model and evaluates its superiority through quantitative and qualitative comparisons with existing methods. In particular, we conduct an in-depth analysis of the model’s performance in predicting the highest grade (1++) and its robustness to variations in loin area proportion within images.
To summarize, this study aims to develop a lightweight and accurate one-stage beef carcass grading model using EfficientViT, a vision transformer architecture capable of capturing both local and global features. We compare its performance with conventional CNN-based classifiers and two-stage segmentation–classification pipelines. The rest of this paper is organized as follows:
Section 2 reviews related works;
Section 3 describes the dataset, models, and experimental settings;
Section 4 presents experimental results and analysis;
Section 5 discusses the findings and limitations; and
Section 6 concludes the study.
2. Related Works
Various image-based and deep learning-based approaches have recently been proposed to automate beef carcass grading. Early studies utilized hyperspectral imaging (HSI) to predict marbling and intramuscular fat (IMF). Velásquez et al. [
13] employed decision tree classifiers using HSI data to predict marbling scores, while Naganathan et al. [
14] utilized three-dimensional principal component analysis (PCA) and local binary pattern (LBP) features to estimate tenderness. However, HSI-based approaches are limited in practical use due to high equipment costs and computational complexity.
As a result, RGB image-based classification has gained popularity. Pinto et al. [
15] combined LBP features and Random Forest classifiers to predict marbling grades from loin cross-section images, and Pranata et al. [
16] quantitatively analyzed marbling areas using thresholding and morphological operations. Stewart et al. [
17] demonstrated that LBP features and Partial Least Squares regression could predict MSA marbling scores and IMF percentages. Stewart et al. [
18] also proposed a vision-based system capable of estimating Eye Muscle Area, IMF%, MSA, and AUS-MEAT marbling scores with high accuracy (
ranging from 0.70 to 0.83), showing the potential of image-based methods in industrial meat quality assessment.
Several segmentation-based approaches have also been proposed. Talacha et al. [
19] applied pixel-wise classification using AlexNet to segment the longissimus muscle region, while Gonçalves et al. [
20] evaluated multiple CNN architectures (SegNet, UNet, DeepLab, etc.) for carcass area extraction. Lee et al. [
3] proposed MSENet, a multi-task network that performs both segmentation and marbling score regression simultaneously. Wakholi et al. [
6] used DeepLabV3+ and a custom CNN to detect anatomical keypoints and then applied multivariate regression to estimate longissimus muscle parameters (LMP).
However, these approaches are based on two-stage pipelines that separate segmentation and classification, increasing training and inference complexity. Unlike previous studies that adopt a two-stage pipeline to enhance regional interpretability or enable multi-task learning (e.g., ROI segmentation followed by quality estimation), our one-stage approach aims to improve deployment efficiency by eliminating intermediate processing. As shown in our experiments (
Section 4.1), the proposed model achieves higher classification accuracy and significantly faster inference speed. This highlights that, while two-stage methods offer modular benefits, they may not be optimal for real-time grading systems that prioritize speed and simplicity over anatomical localization.
To address this issue, recent studies have focused on one-stage end-to-end models that omit segmentation. Prakash et al. [
21] performed part classification using CNNs on RGB images taken from boning lines. Pannier et al. [
22] used conveyor-mounted camera systems to predict IMF% with an
of 0.87. Negretti et al. [
23] proposed a smartphone-based VIA application to classify SEUROP grades quantitatively.
The EfficientViT model used in this study is a lightweight vision transformer architecture that achieves both high accuracy and fast inference. Cai et al. [
24] reported up to 13× fewer computations and more than 6× faster inference compared to SegFormer by leveraging Multi-Scale Linear Attention. Liu et al. [
10] further improved performance with Cascaded Group Attention and a Sandwich Layout, achieving 2.6× faster inference speeds while maintaining accuracy comparable to EfficientNet.
3. Materials and Methods
3.1. Materials
3.1.1. Dataset
The dataset provided by AI Hub [
25] consists of 77,899 RGB images labeled with five beef quality grades: 1++, 1+, 1, 2, and 3. The dataset includes corresponding segmentation masks and was used without modification in this study. The original images have a resolution of 1080 × 1920 pixels and were resized to 512 × 512 pixels. The dataset was randomly split into training, validation, and test sets with a ratio of 7:1:1, resulting in 60,571 training images, 8664 validation images, and 8664 test images.
Table 1 shows the number of images per grade in each subset.
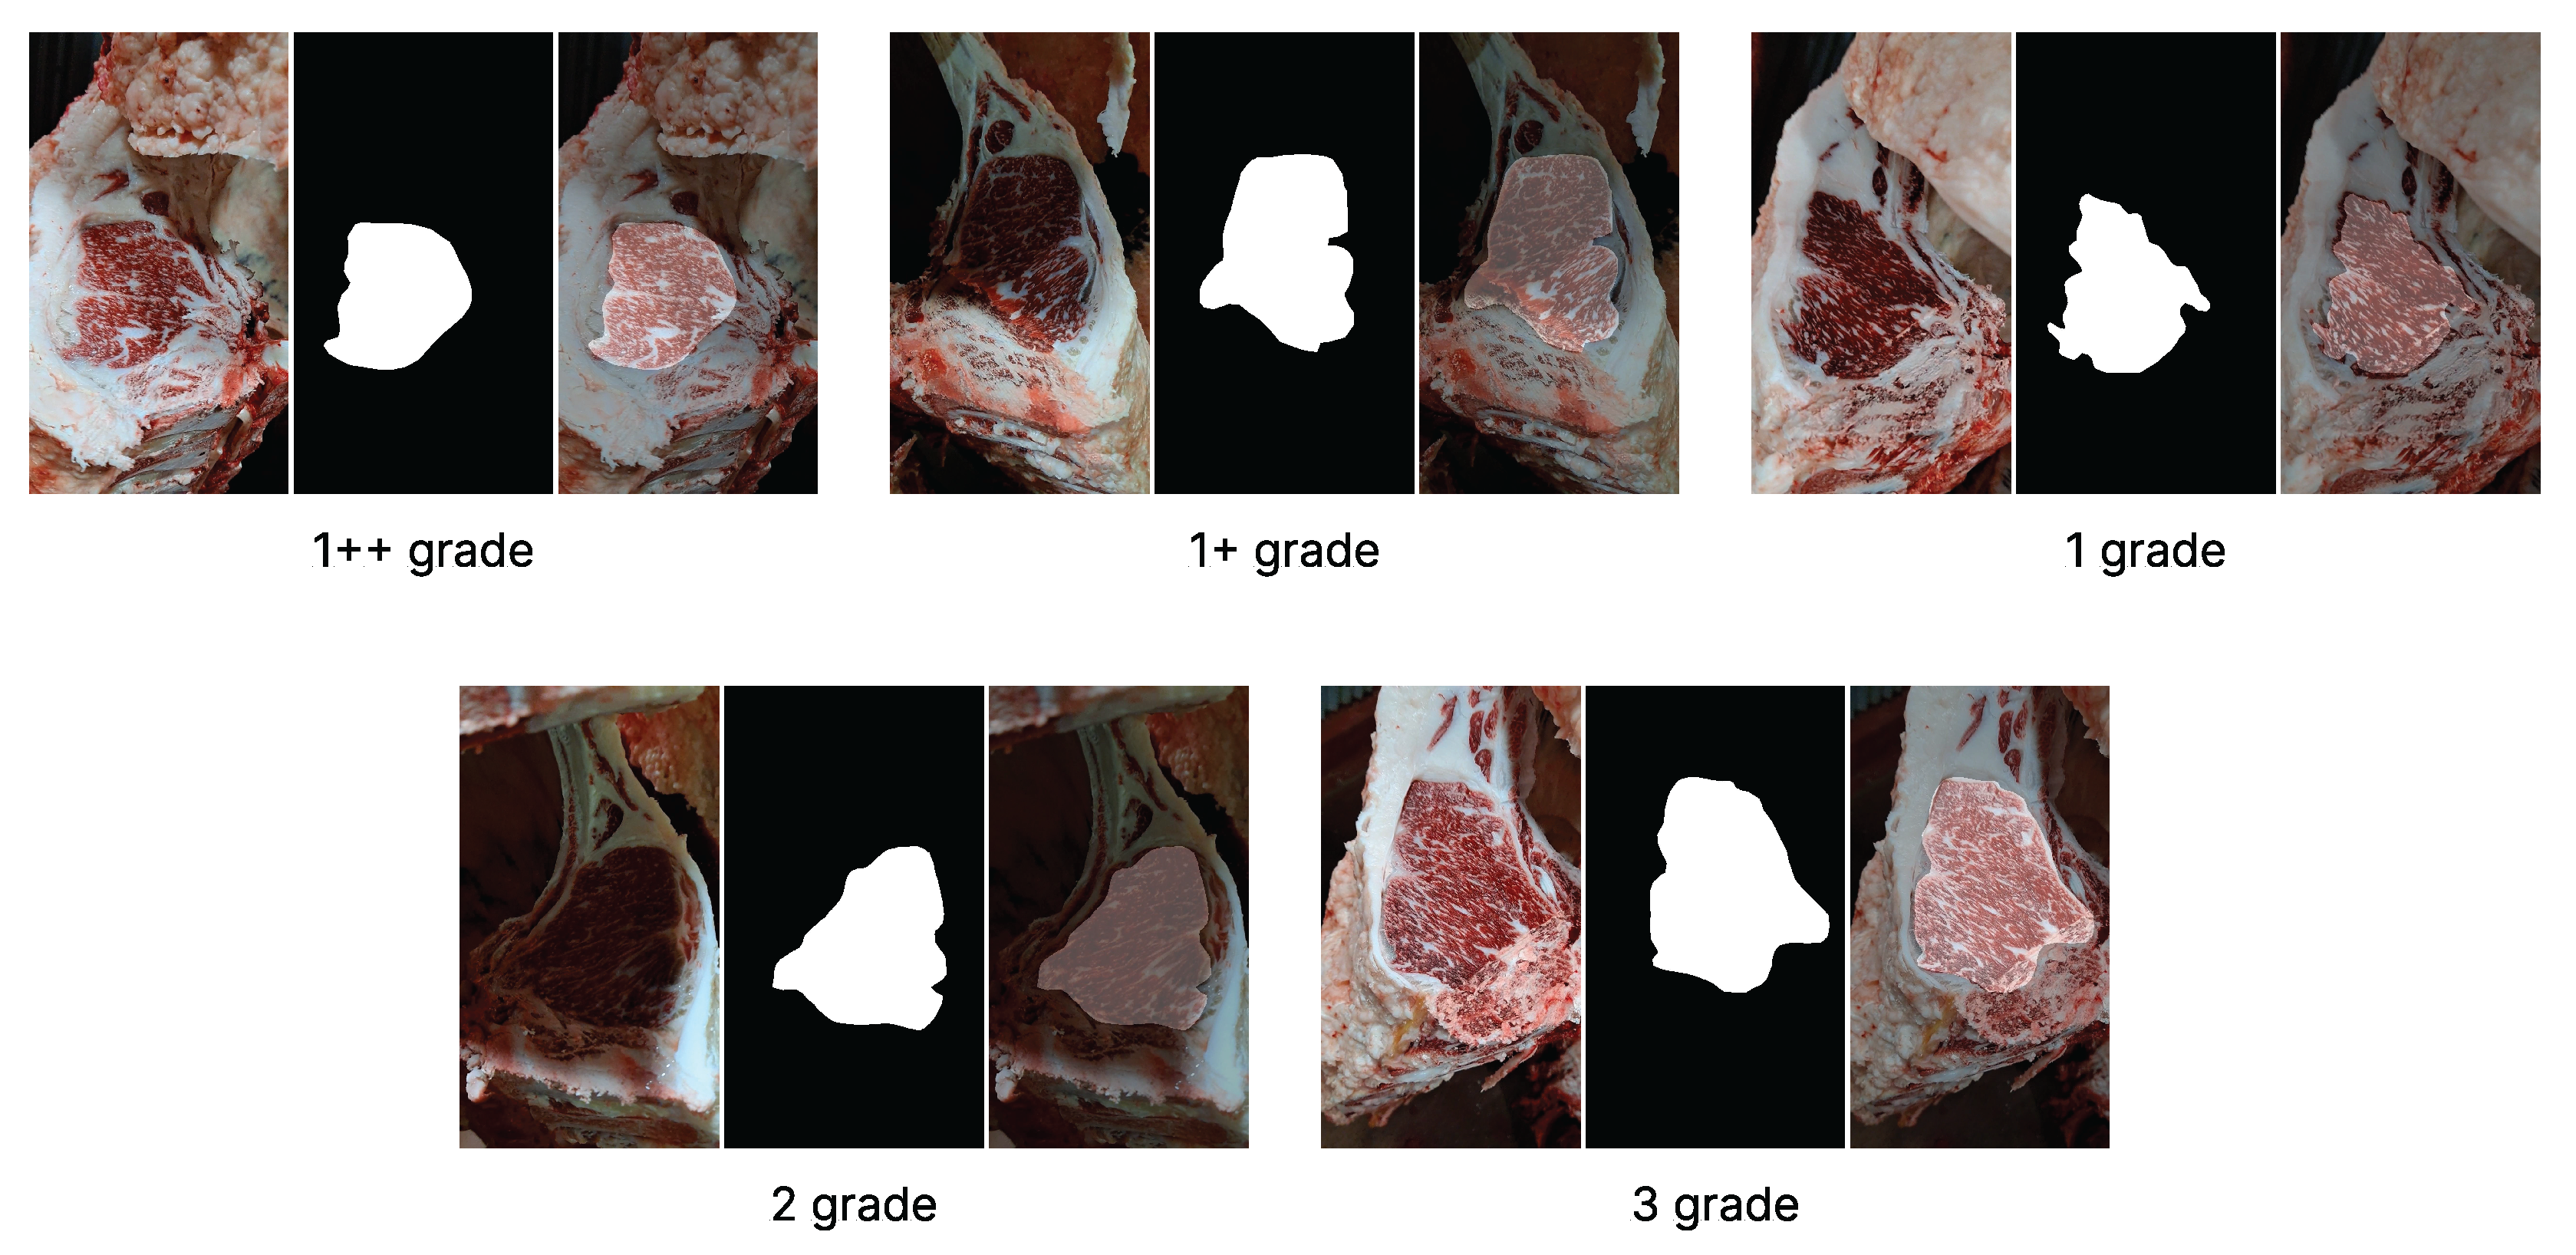
In addition to the images, segmentation masks are provided to isolate the lean meat region by removing non-meat areas. These pre-labeled masks served as ground truth annotations for training the segmentation networks used in the two-stage pipeline. The segmentation masks were provided together with the images by AI Hub. According to the dataset description, the masks were constructed using a combination of automatic and manual labeling techniques based on OpenCV, focusing on removing the outer fat surrounding the beef cross-sectional area. These pre-generated masks were used directly for training the segmentation models in the two-stage pipeline. To better illustrate the dataset composition,
Figure 1 shows representative examples of RGB images and corresponding segmentation masks for each of the five quality grades (1++, 1+, 1, 2, and 3). These masks isolate the lean meat area used for training 2-stage models.
The two-stage classification models were trained using the images with segmentation masks applied, whereas the one-stage models were trained directly on the original unmasked images.
To evaluate performance under different proportions of lean meat, we used the segmentation masks to calculate the cross-sectional area of meat in each image. Based on this ratio, the dataset was divided into two groups: images with over 20% loin area (405 samples) and those with under 10% loin area (2346 samples).
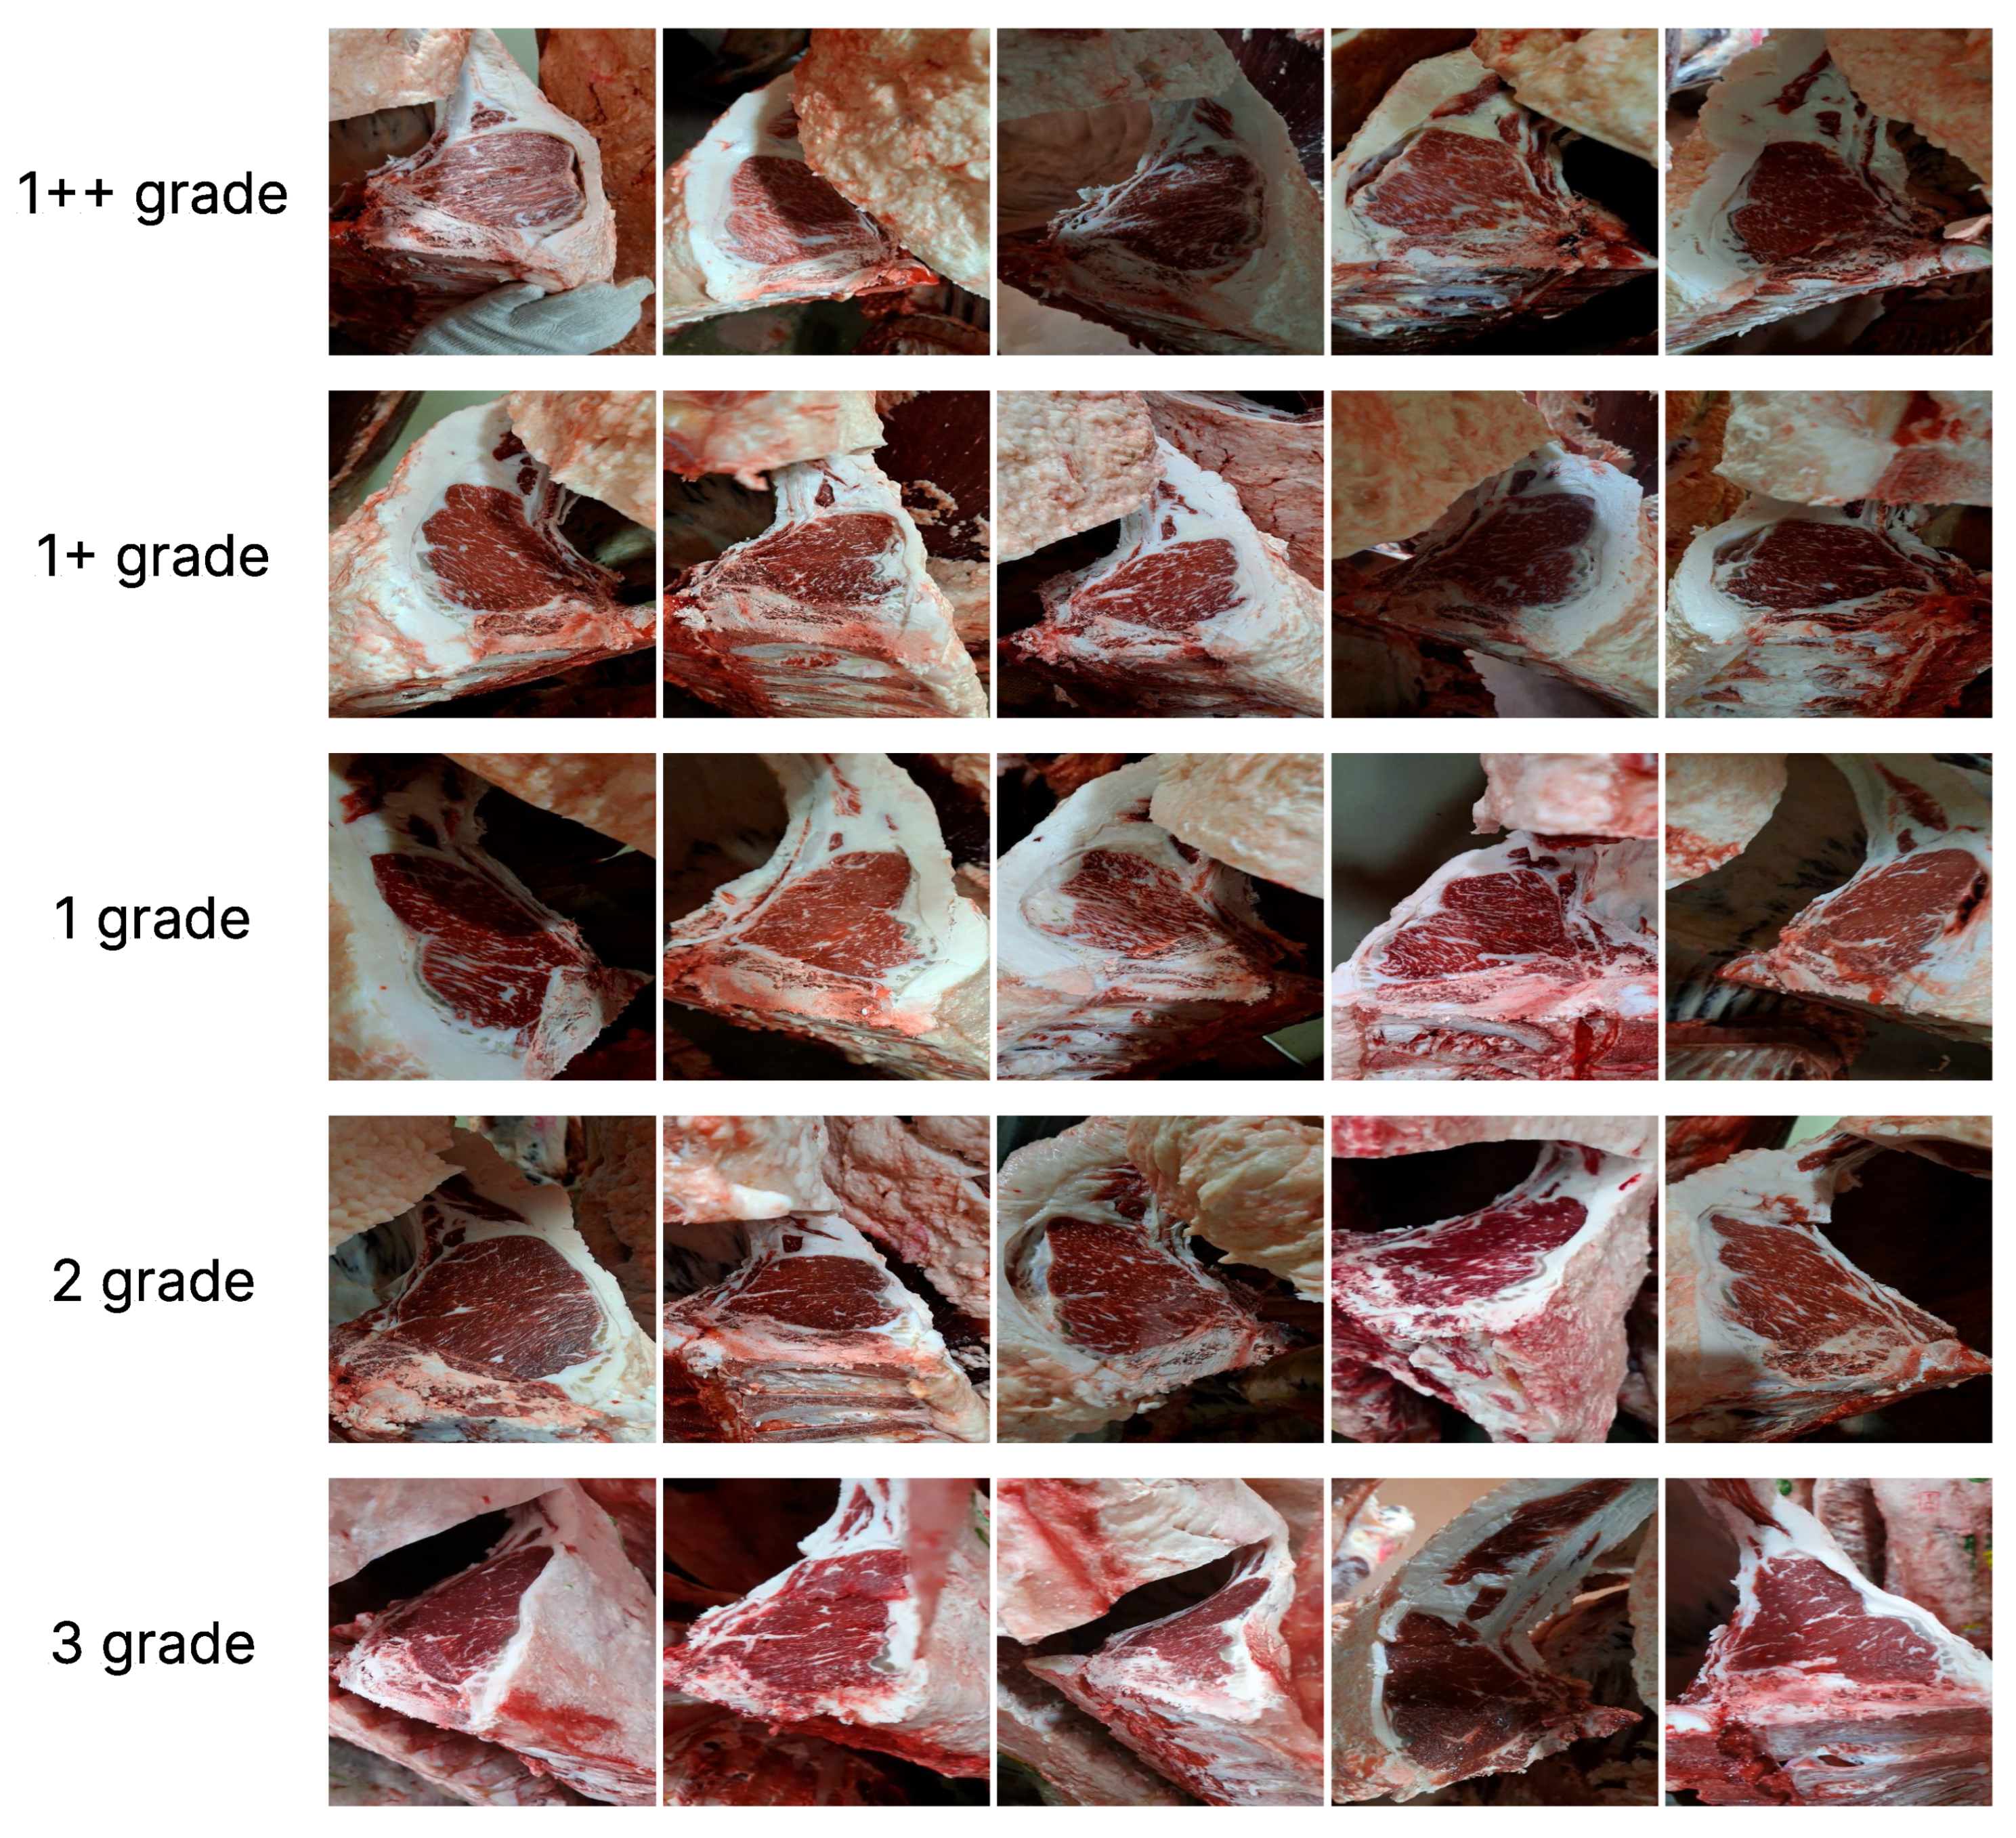
Figure 2 shows representative examples from the dataset, including beef cross-sectional images, labeled with different quality grades. The images exhibit varying degrees of intramuscular fat distribution, which is the key visual cue for determining beef quality.
3.1.2. Implementation Details
All experiments were conducted on a system equipped with an AMD Ryzen 7 7800X3D processor (8 cores, 16 threads), 32 GiB of RAM, and an NVIDIA GeForce RTX 4070 Ti SUPER GPU. The operating system used was Ubuntu 22.04.5 LTS (64-bit). All hyperparameters listed in
Table 2 were optimized individually for each model through validation-based tuning. For classification models (EfficientViT, VGG-16, ResNeXt-50, DenseNet-121), we applied early stopping with a patience of 20 epochs to ensure convergence while avoiding overfitting. For segmentation models used in the 2-stage pipeline, a more aggressive early stopping with a patience of 10 epochs was employed due to the faster saturation of IoU-based validation metrics. These strategies ensured stable and efficient training across all architectures.
3.2. Methods
3.2.1. Two-Stage Model Configuration
In the 2-stage approach, segmentation and classification networks were trained independently. In the first stage, six segmentation models were employed: U-Net, Attention U-Net, SegNet, DeepLabV3+, EfficientPS, and MobileNetV2.
U-Net operates based on an encoder–decoder architecture with skip connections, which effectively preserve high-resolution features [
26]. Attention U-Net builds upon U-Net by incorporating attention mechanisms to emphasize relevant regions [
27]. SegNet is a lightweight encoder–decoder model that utilizes pooling indices during the decoding process to improve memory efficiency [
28]. DeepLabV3+ enhances boundary recognition performance through Atrous Spatial Pyramid Pooling (ASPP), which captures multi-scale features in parallel [
29]. EfficientPS is designed for panoptic segmentation and is optimized to handle complex foreground and background information simultaneously [
30]. Lastly, MobileNetV2 is a lightweight model based on depthwise separable convolutions, well-suited for mobile and embedded systems [
31].
In the experiments, each segmentation model was used to extract the region of interest (ROI) from beef cross-sectional images. The models produced binary masks to isolate the ROI, and these masks were saved as separate files to be used as input for the second stage.
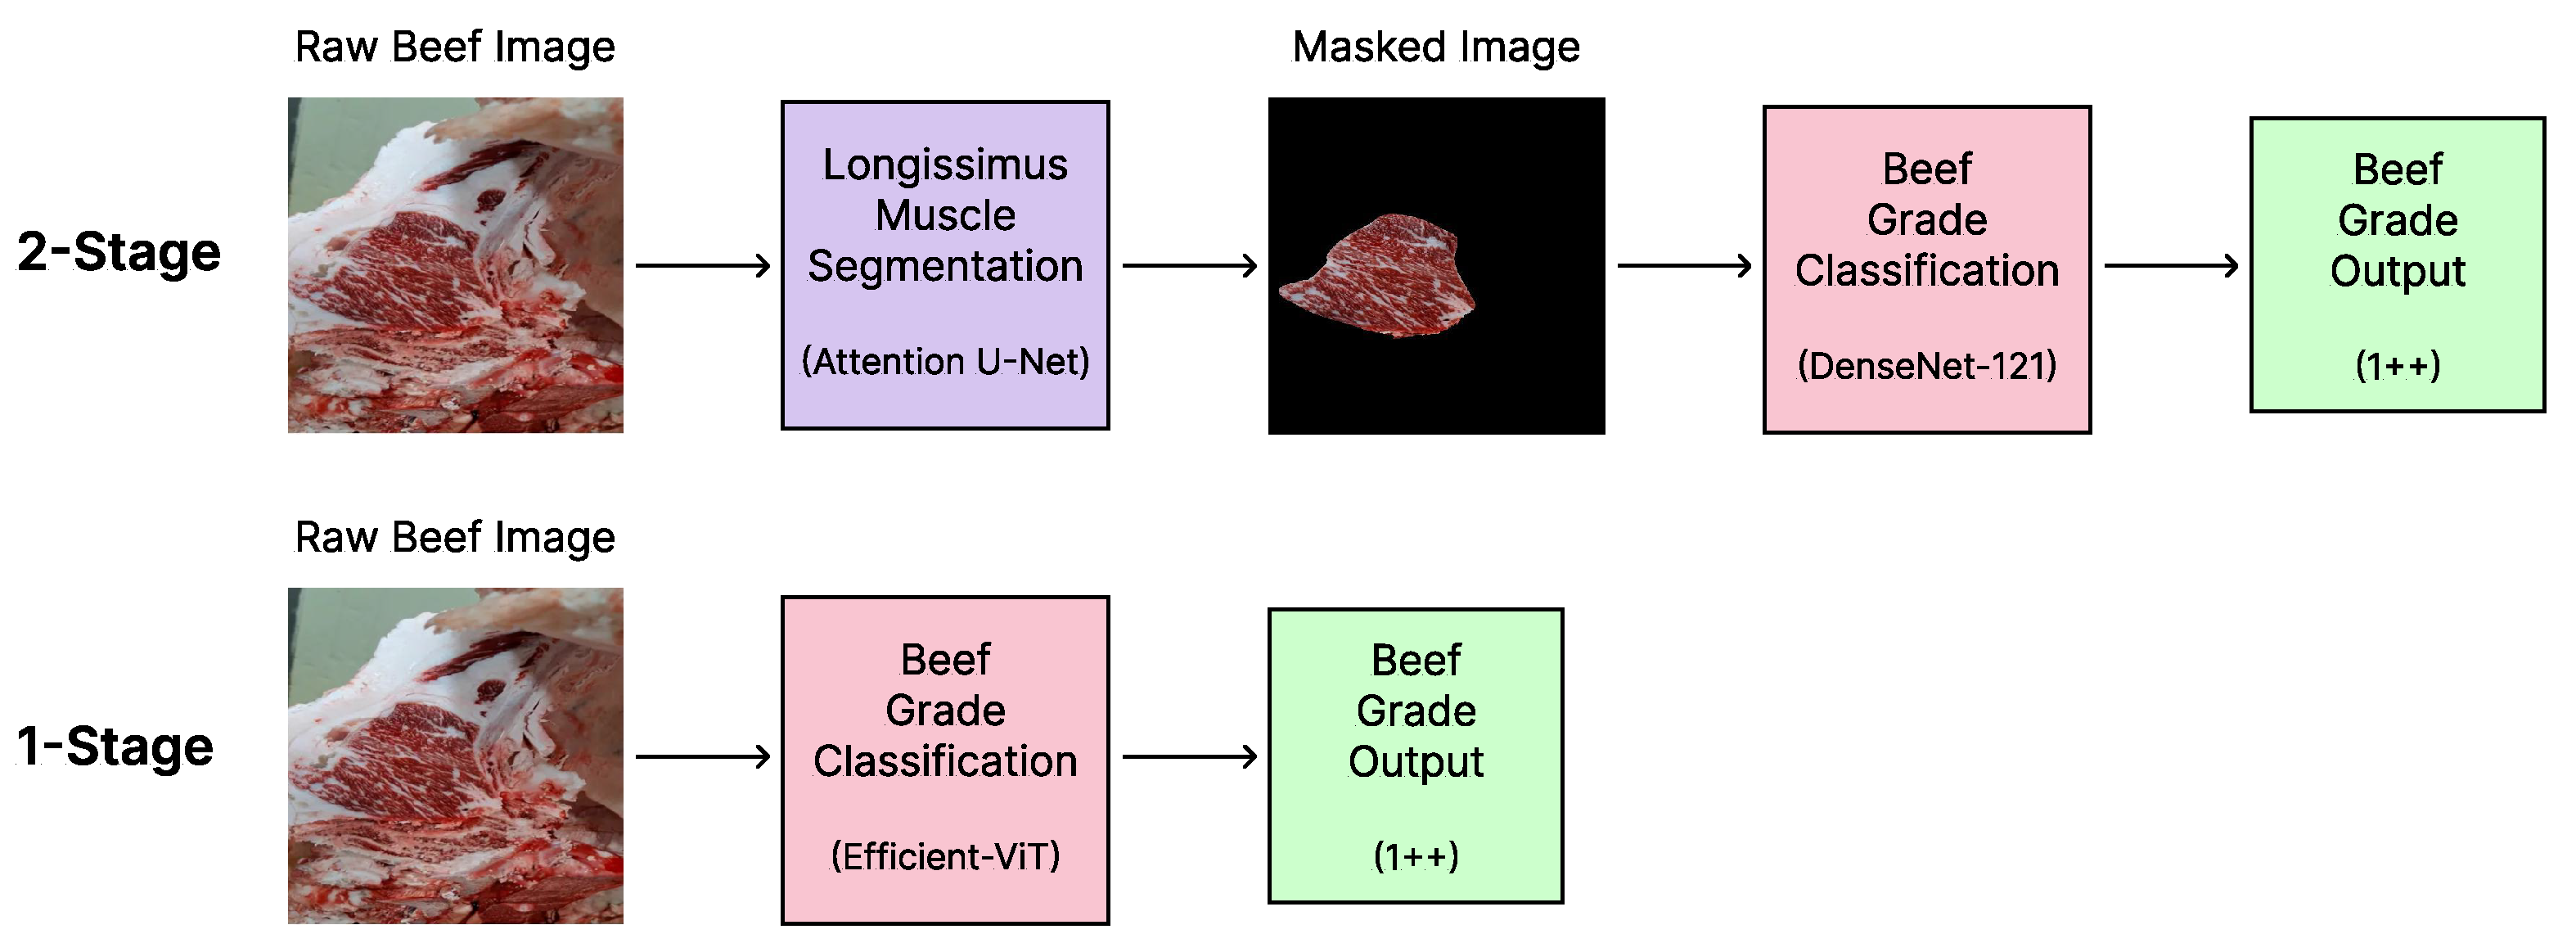
As illustrated in
Figure 3, the 2-stage model first segments the longissimus muscle region before classification, whereas the 1-stage approach directly predicts the beef grade from the original image. This structural difference significantly affects pipeline complexity and inference speed.
In the classification stage, three CNN-based architectures—ResNeXt-50, DenseNet-121, and VGG-16—were used to predict beef quality grades based on the segmented images. ResNeXt-50 consists of 16 bottleneck blocks and leverages grouped convolutions to improve parameter efficiency while maintaining strong feature extraction [
32]. DenseNet-121 comprises four dense blocks and three transition layers, using densely connected layers that reuse features across the network to enhance learning efficiency [
33]. The feature maps are downsampled to a resolution of 16 × 16. VGG-16 is a classic and straightforward CNN composed of 13 convolutional layers and 3 fully connected layers. The input image, initially at 512 × 512 resolution, is reduced to 16 × 16 through five stages of max pooling [
34].
All segmentation and classification models were trained independently under identical data splitting and preprocessing conditions. Input image size was unified to 512 × 512 pixels for both stages.
For inference, the total runtime of the 2-stage model was measured by summing the inference times of both the segmentation and classification networks. Image saving/loading times were excluded to ensure a fair comparison.
A total of 18 combinations were evaluated by pairing the six segmentation models with the three classification models.
3.2.2. Proposed 1-Stage EfficientViT Model
Unlike the 2-stage approach, the 1-stage method directly inputs raw images into a classification model to predict beef quality grades, without any segmentation preprocessing.
In this study, we implemented 4 classification models in the 1-stage structure: EfficientViT, ResNeXt-50, DenseNet-121, and VGG-16.
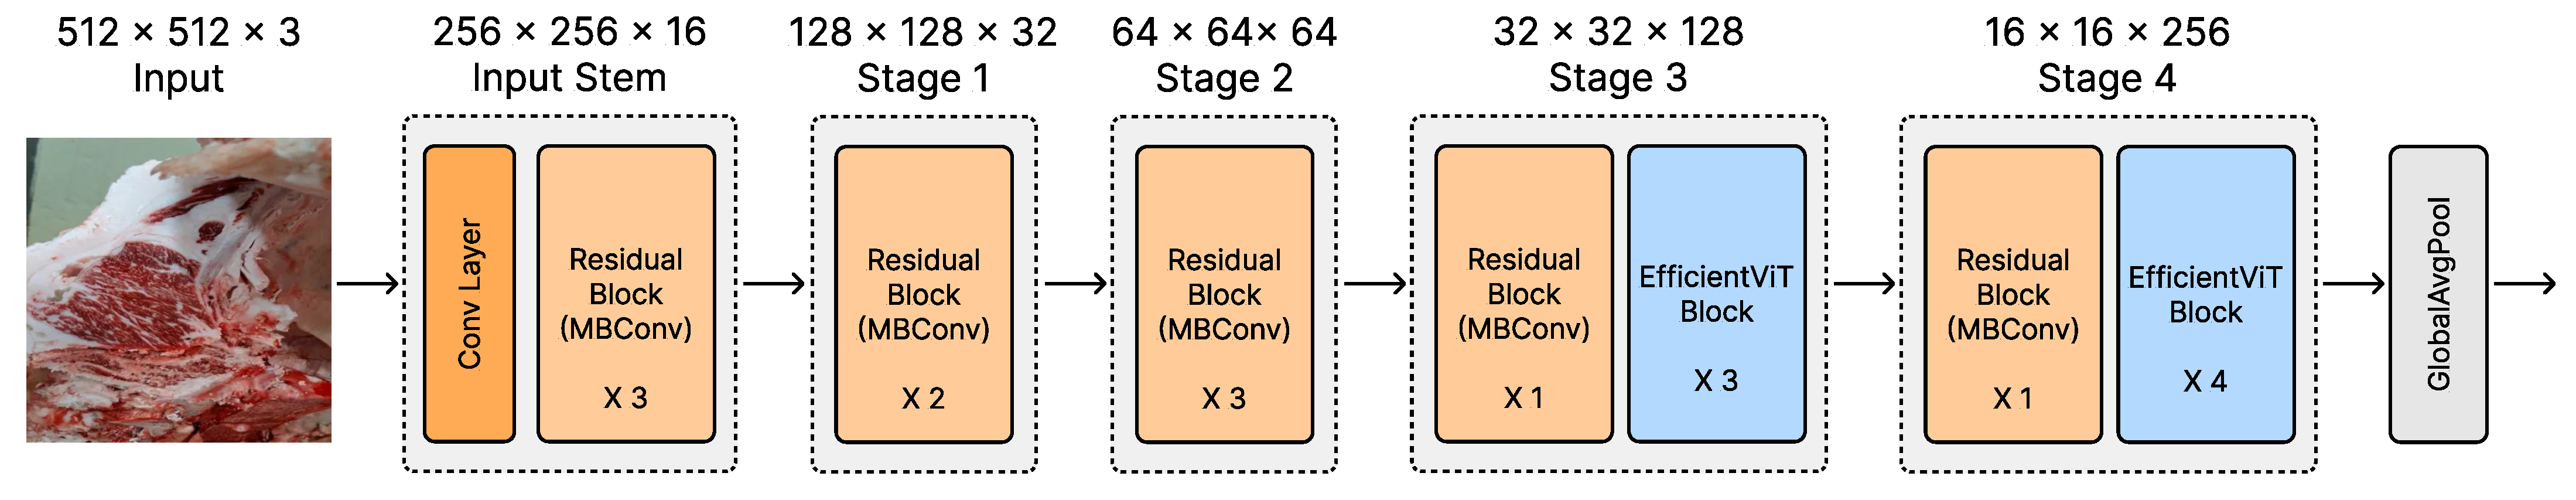
EfficientViT is a lightweight architecture that captures global contextual information while maintaining low computational complexity. It combines convolutional layers for local feature extraction with a multi-scale linear attention mechanism for global feature representation (
Figure 4). As a result, EfficientViT achieves high classification accuracy with fast inference speed.
ResNeXt-50, DenseNet-121, and VGG-16 were also implemented in the same 1-stage fashion, and their performance was evaluated under the same dataset and training conditions as EfficientViT.
3.2.3. Explainability Techniques
To interpret the model’s decision-making process, Grad-CAM (Gradient-weighted Class Activation Mapping) was applied to CNN-based models such as VGG-16, while attention map visualization was used for EfficientViT. These techniques help identify which regions of the input images the models focused on when making predictions.
Grad-CAM calculates class-specific gradients with respect to the last convolutional feature maps and uses them as weights to highlight important areas. The method is formally expressed as shown in Equation (
1):
where
is the
k-th activation map from the last convolutional layer and
is the average gradient for class
c over the feature map:
Here, denotes the score for class c and Z is the normalization factor over spatial dimensions .
EfficientViT adopts a lightweight linear attention structure instead of traditional multi-head attention. Attention maps are computed based on the inner product between queries (
Q) and keys (
K), as defined in Equation (
3):
where
are the query and key vectors at positions
j and
i, respectively, and
is a small constant for numerical stability. During inference, the resulting attention scores were normalized to the range [0, 1] for visualization purposes.
4. Results
To validate the performance of the proposed EfficientViT-based one-stage beef carcass grading model, we conducted three major experiments. First, we compared the overall performance of conventional two-stage models with that of one-stage models to assess the efficiency and accuracy of omitting the segmentation step. Second, we quantitatively compared EfficientViT with conventional CNN-based classifiers (VGG-16, ResNeXt-50, DenseNet-121) within a one-stage framework to analyze the structural advantages of EfficientViT. Lastly, we investigated how the ratio of muscle cross-section in images affected classification accuracy, evaluating whether EfficientViT’s ability to capture global features remains robust under varying input conditions.
All experiments were evaluated using multiple metrics, including accuracy, F1 score, precision, recall, inference speed, and parameter size. This allowed for a comprehensive assessment of both performance and practical deployability.
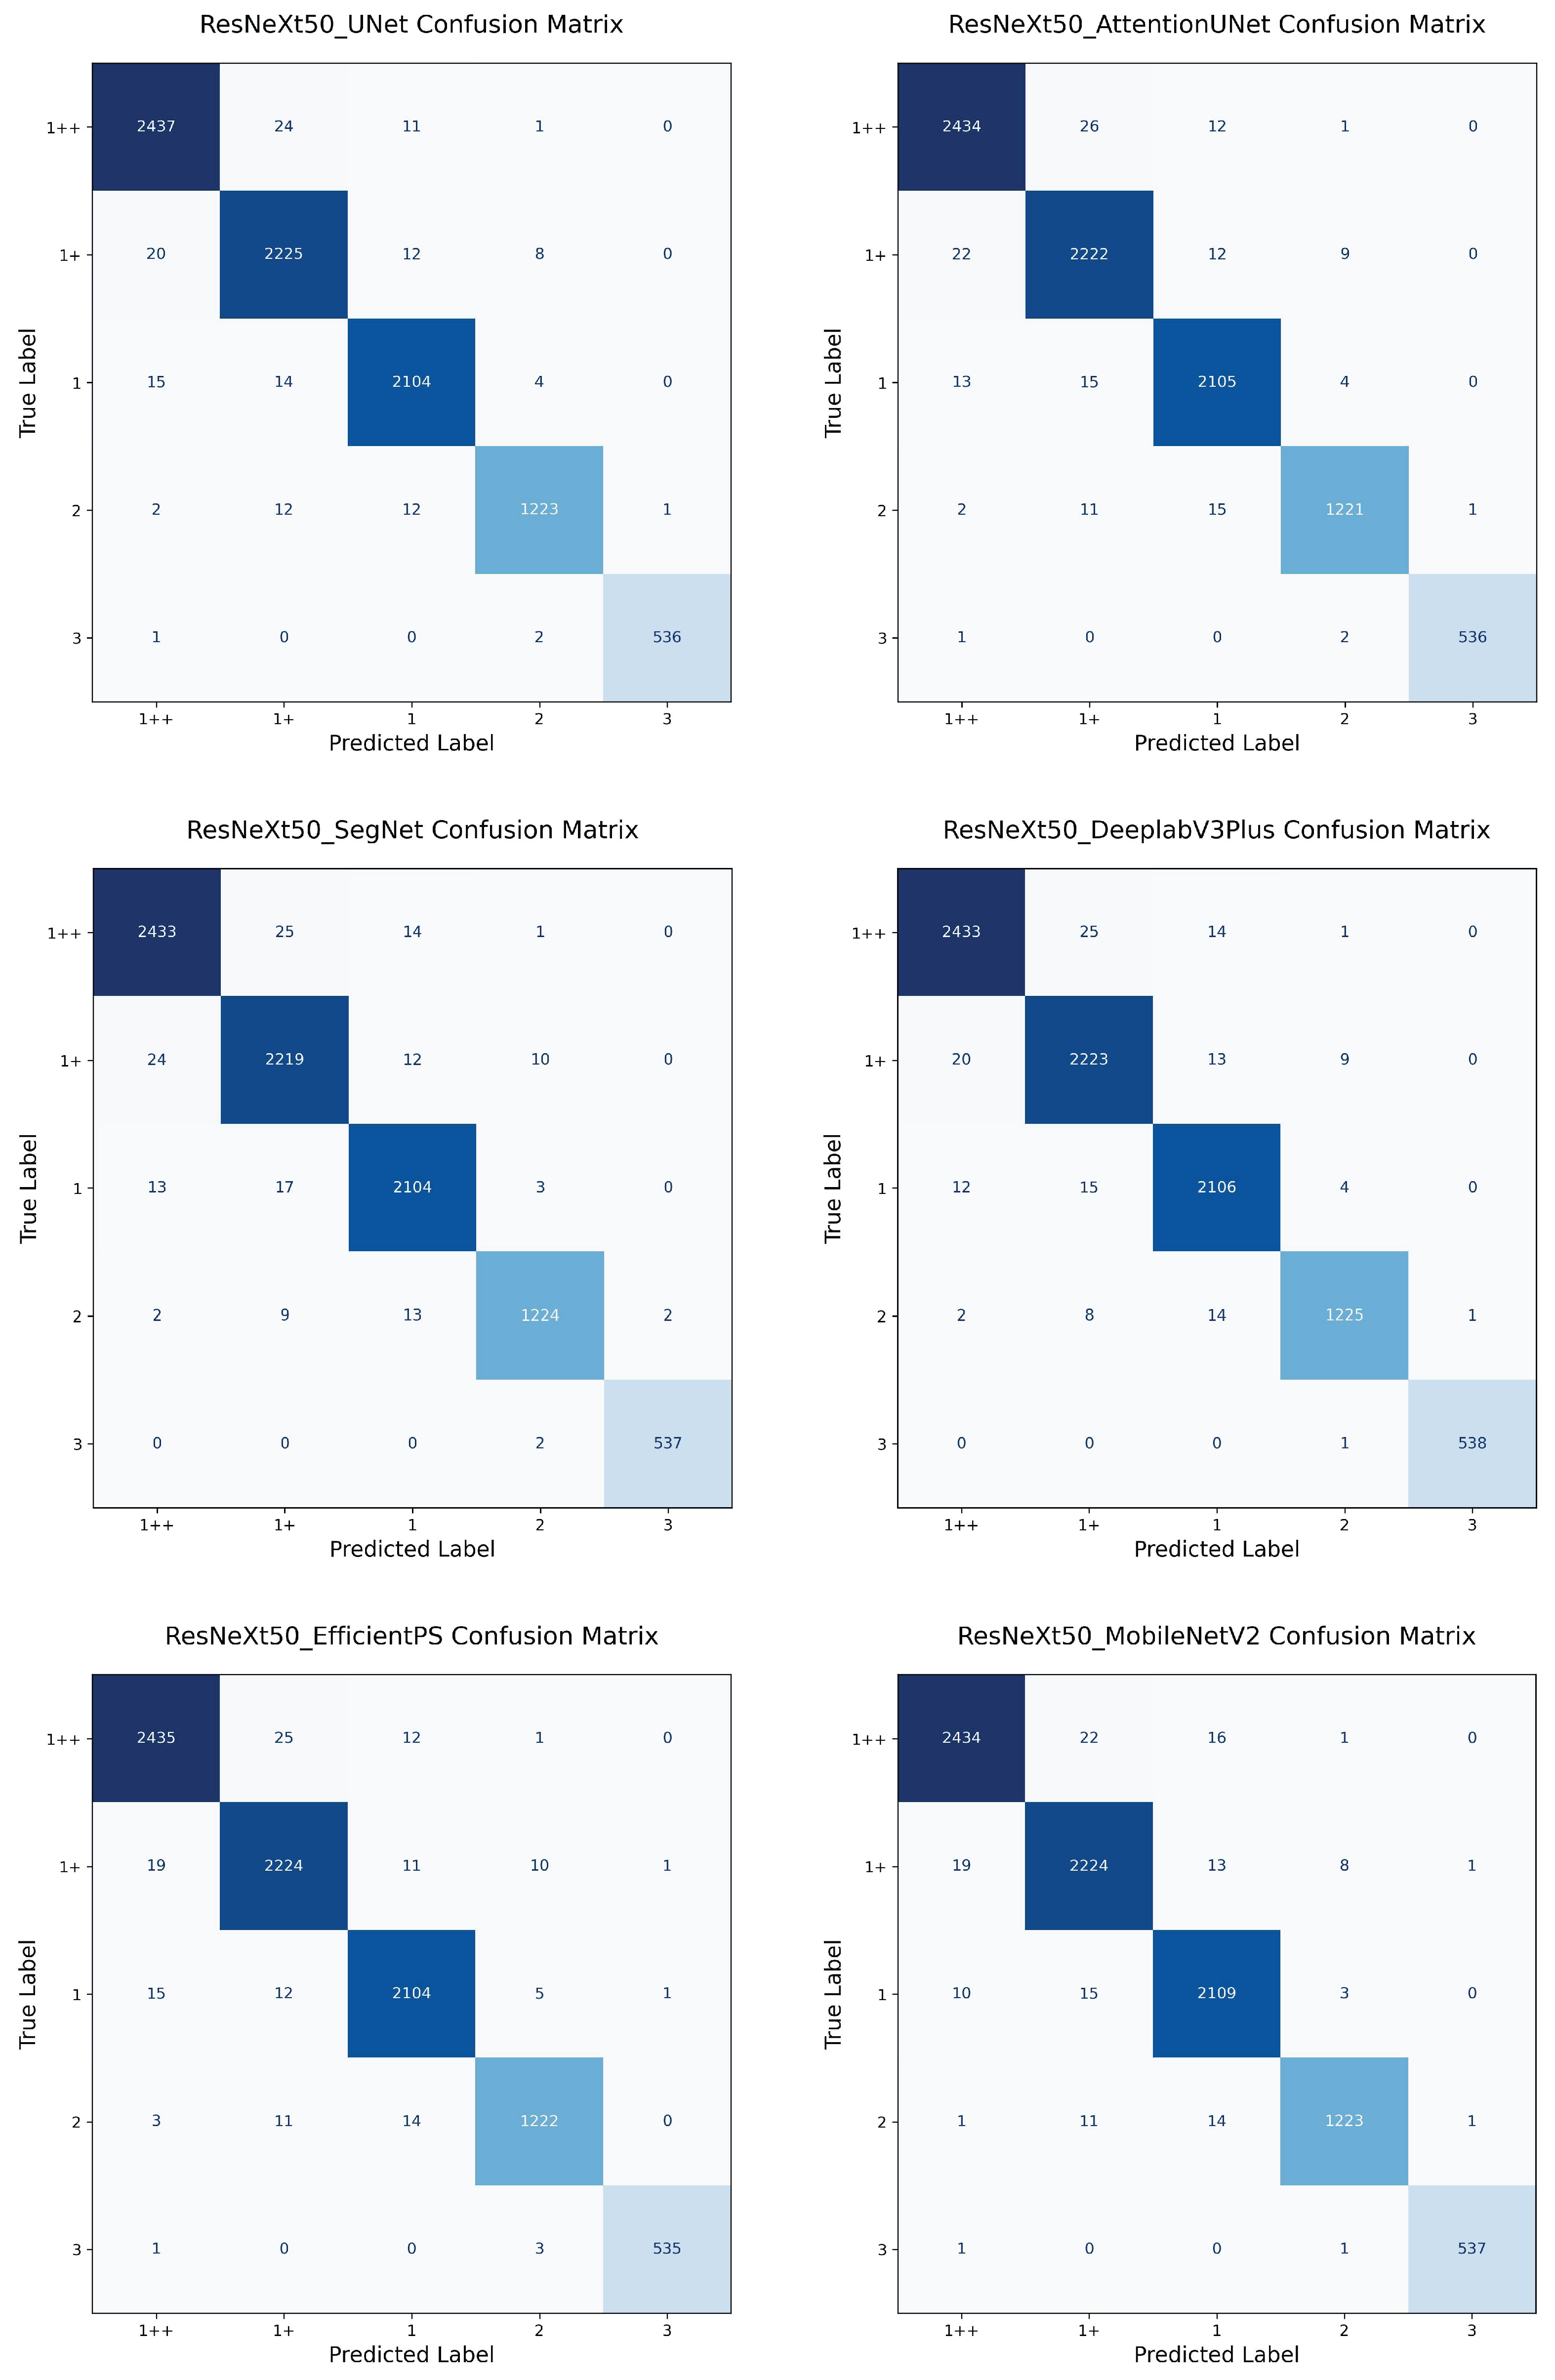
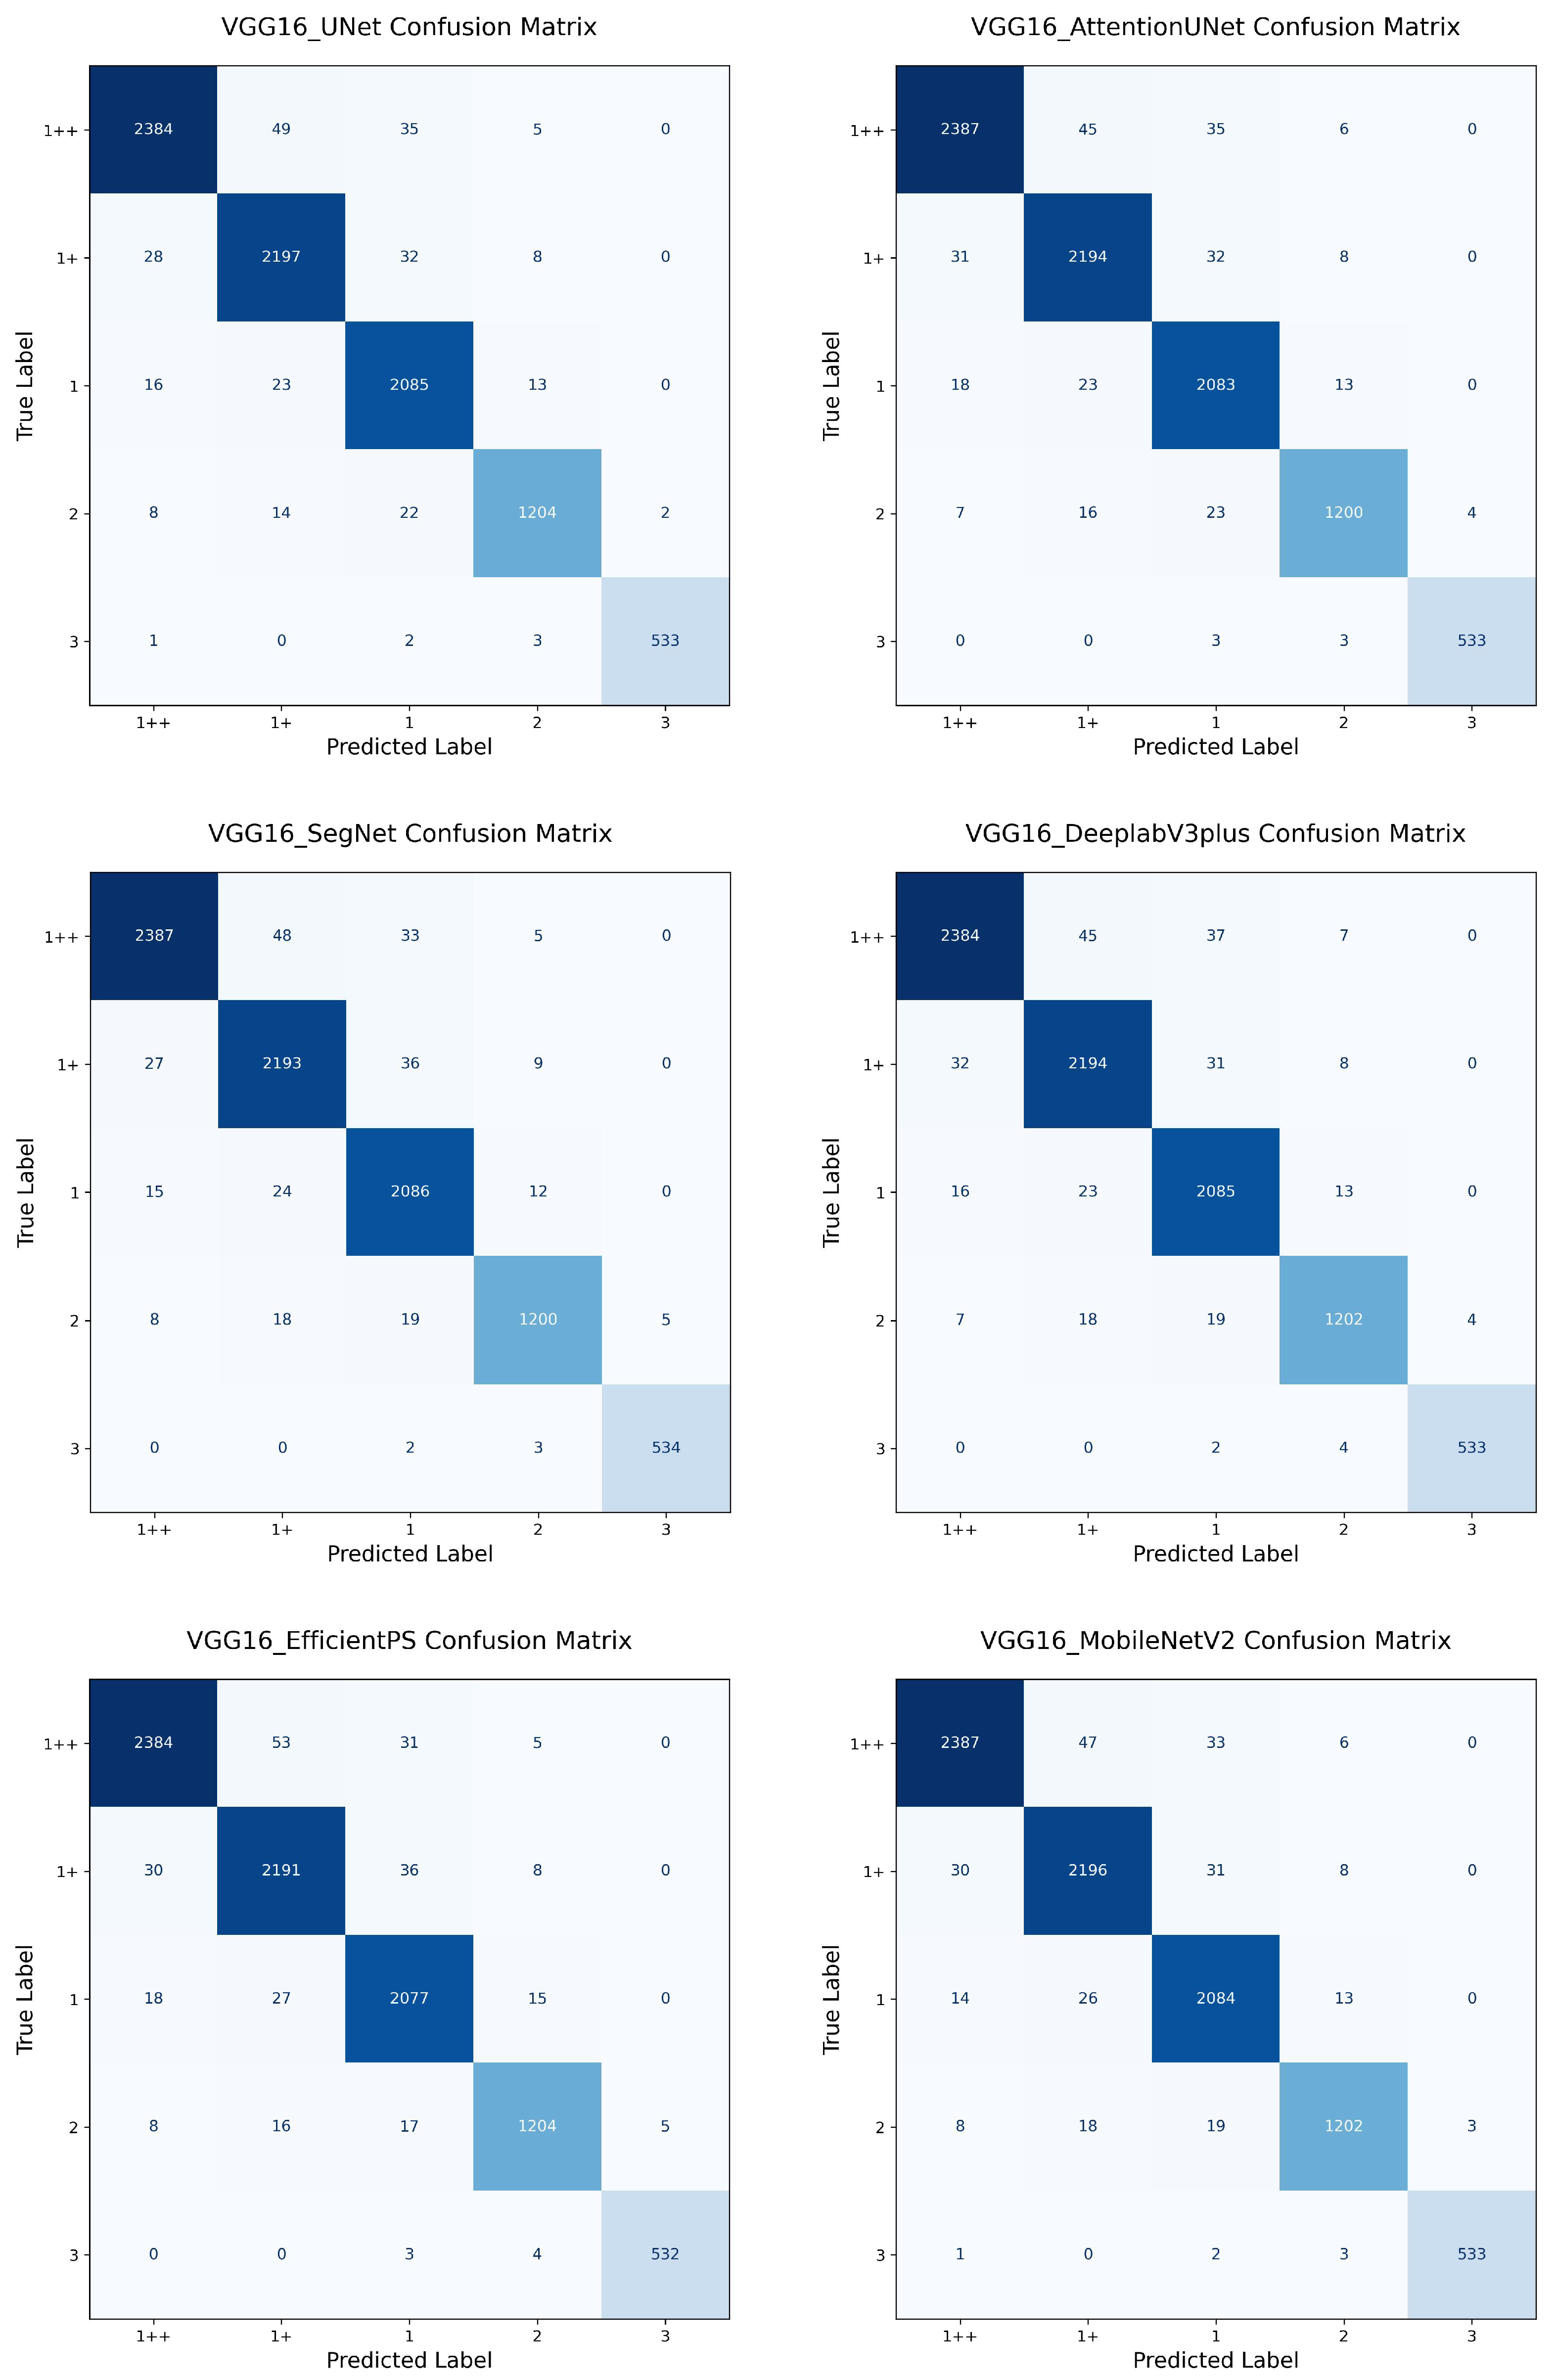
4.1. One-Stage vs. Two-Stage
In this experiment, we compared the performance of the proposed one-stage EfficientViT model with conventional two-stage approaches. The two-stage architecture involves sequential execution of a segmentation network followed by a classification network, where the classification is performed on the segmentation output image. We experimented with 18 combinations formed by pairing 6 segmentation models (U-Net, Attention U-Net, SegNet, DeepLabV3+, EfficientPS, MobileNetV2) with 3 classifiers (ResNeXt-50, DenseNet-121, VGG-16).
In contrast, the one-stage approach omits segmentation entirely and performs classification using the original input images. This setting includes EfficientViT and three CNN models (ResNeXt-50, DenseNet-121, VGG-16), all trained and tested under the same conditions.
All models were trained and evaluated using the same dataset, preprocessing pipeline, input resolution (512 × 512), and hardware environment. Inference speed was measured as the average per-image latency (ms) using a batch size of 1. The results are summarized in
Table 3.
Among the two-stage models, the MobileNetV2 + ResNeXt-50 combination achieved the best performance with an accuracy of 98.42% and an F1 score of 0.9860. However, its inference speed and model size were significantly higher than those of the one-stage ResNeXt-50 model, which achieved comparable accuracy (98.30%) at only 3.26 ms and 91.96 MB. Likewise, the one-stage DenseNet-121 (Accuracy: 98.12%; F1 score: 0.9828, Speed: 5.86 ms, Size: 28.87 MB) and VGG-16 (Accuracy: 97.99%; F1 score: 0.9825) models also outperformed their two-stage counterparts across all metrics.
The proposed EfficientViT model achieved the highest overall performance among all models, with 98.46% accuracy and a 0.9867 F1 score. It also demonstrated fast inference (3.92 ms) and compact model size (36.41 MB), making it a highly efficient choice for real-time applications.
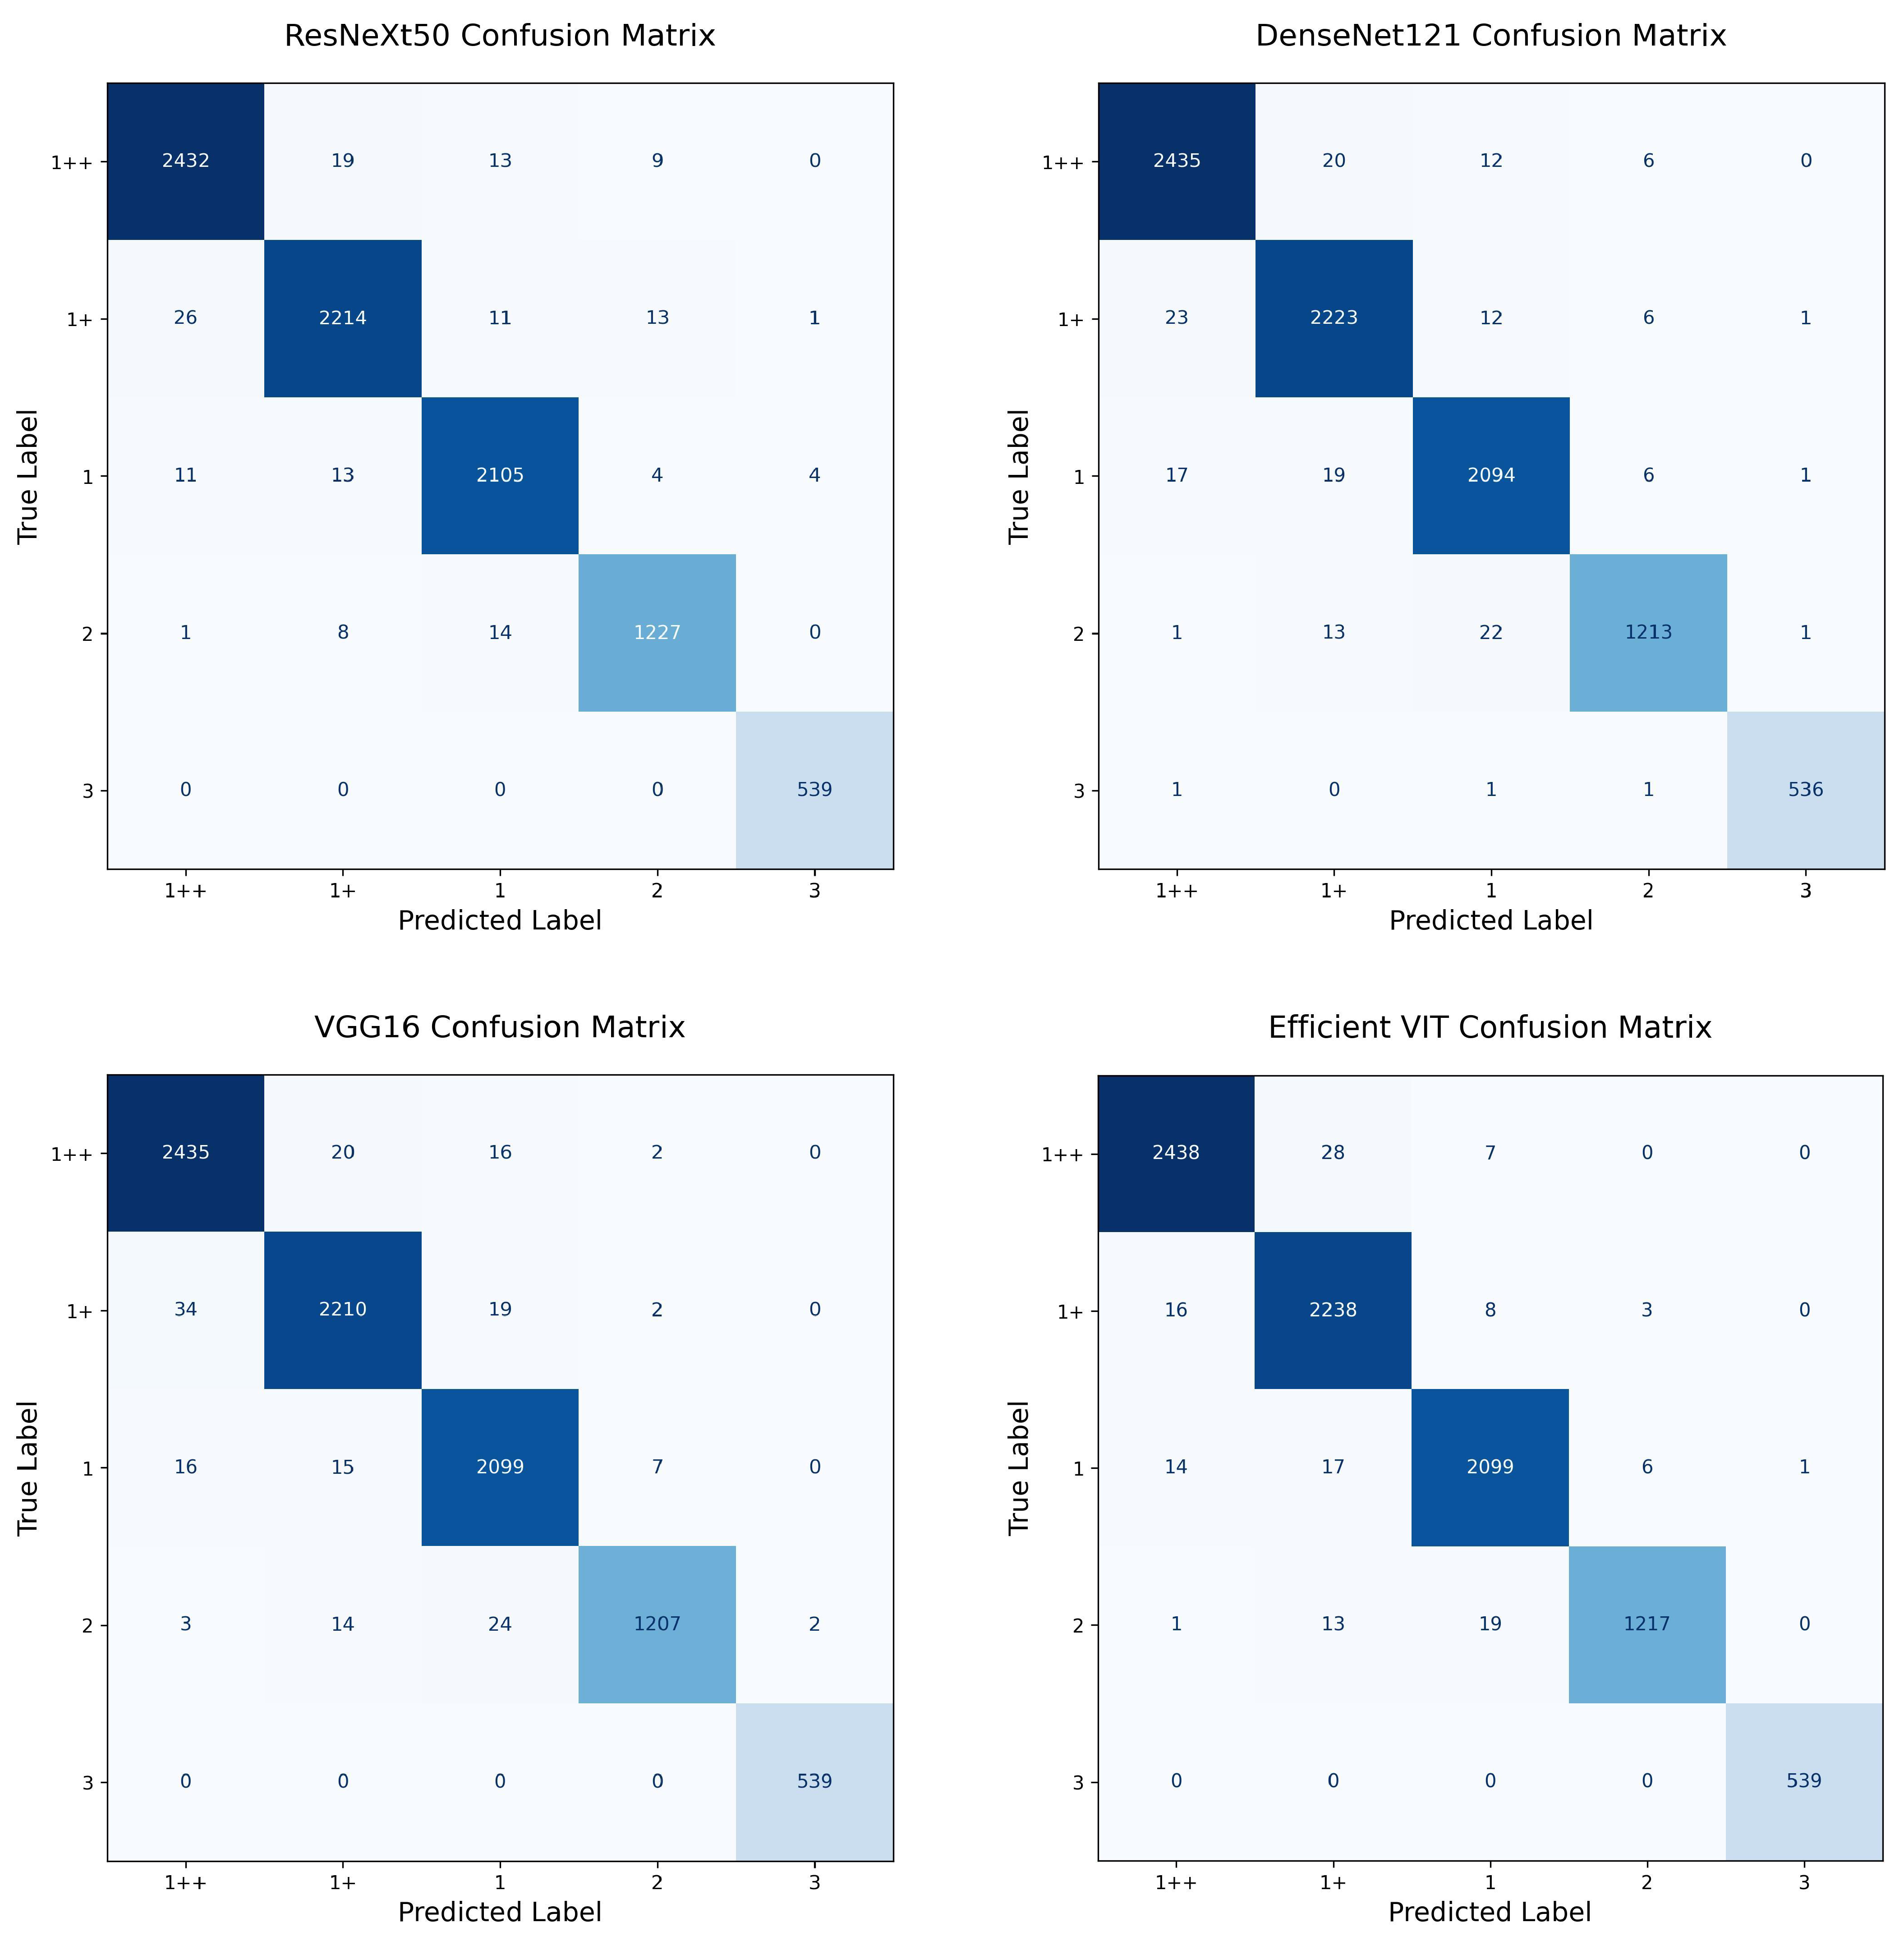
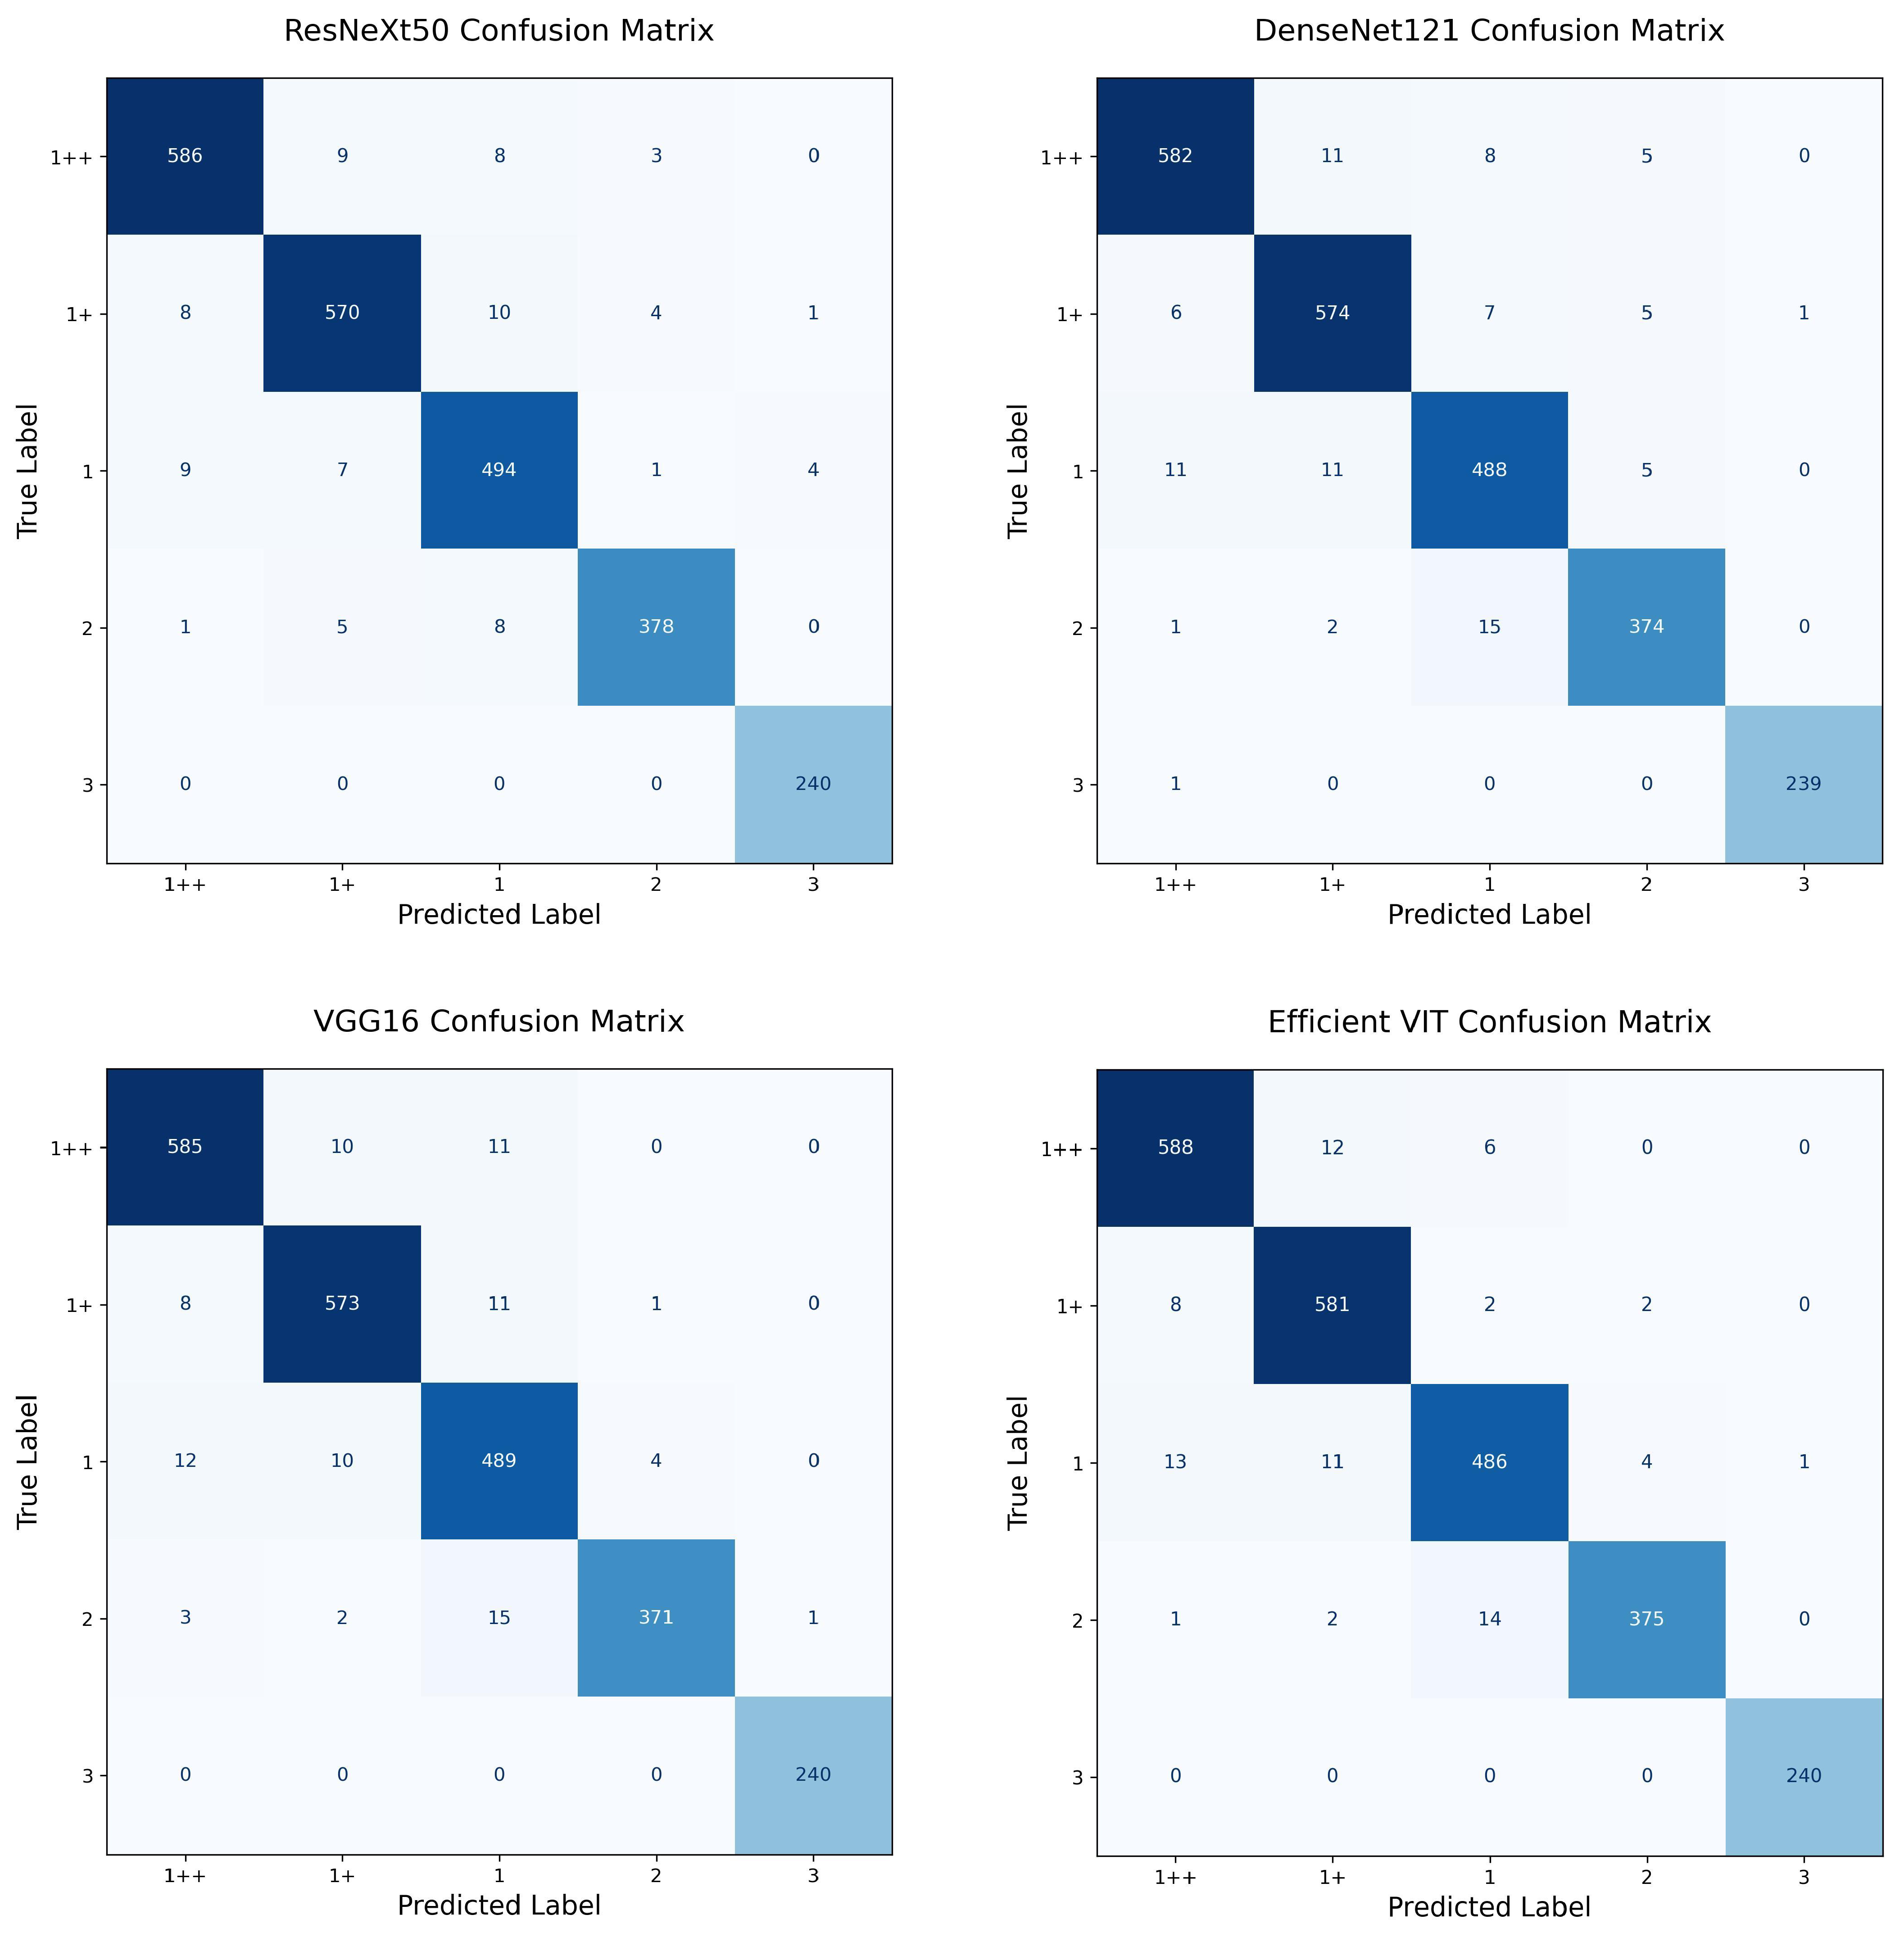
4.2. EfficientViT vs. CNN
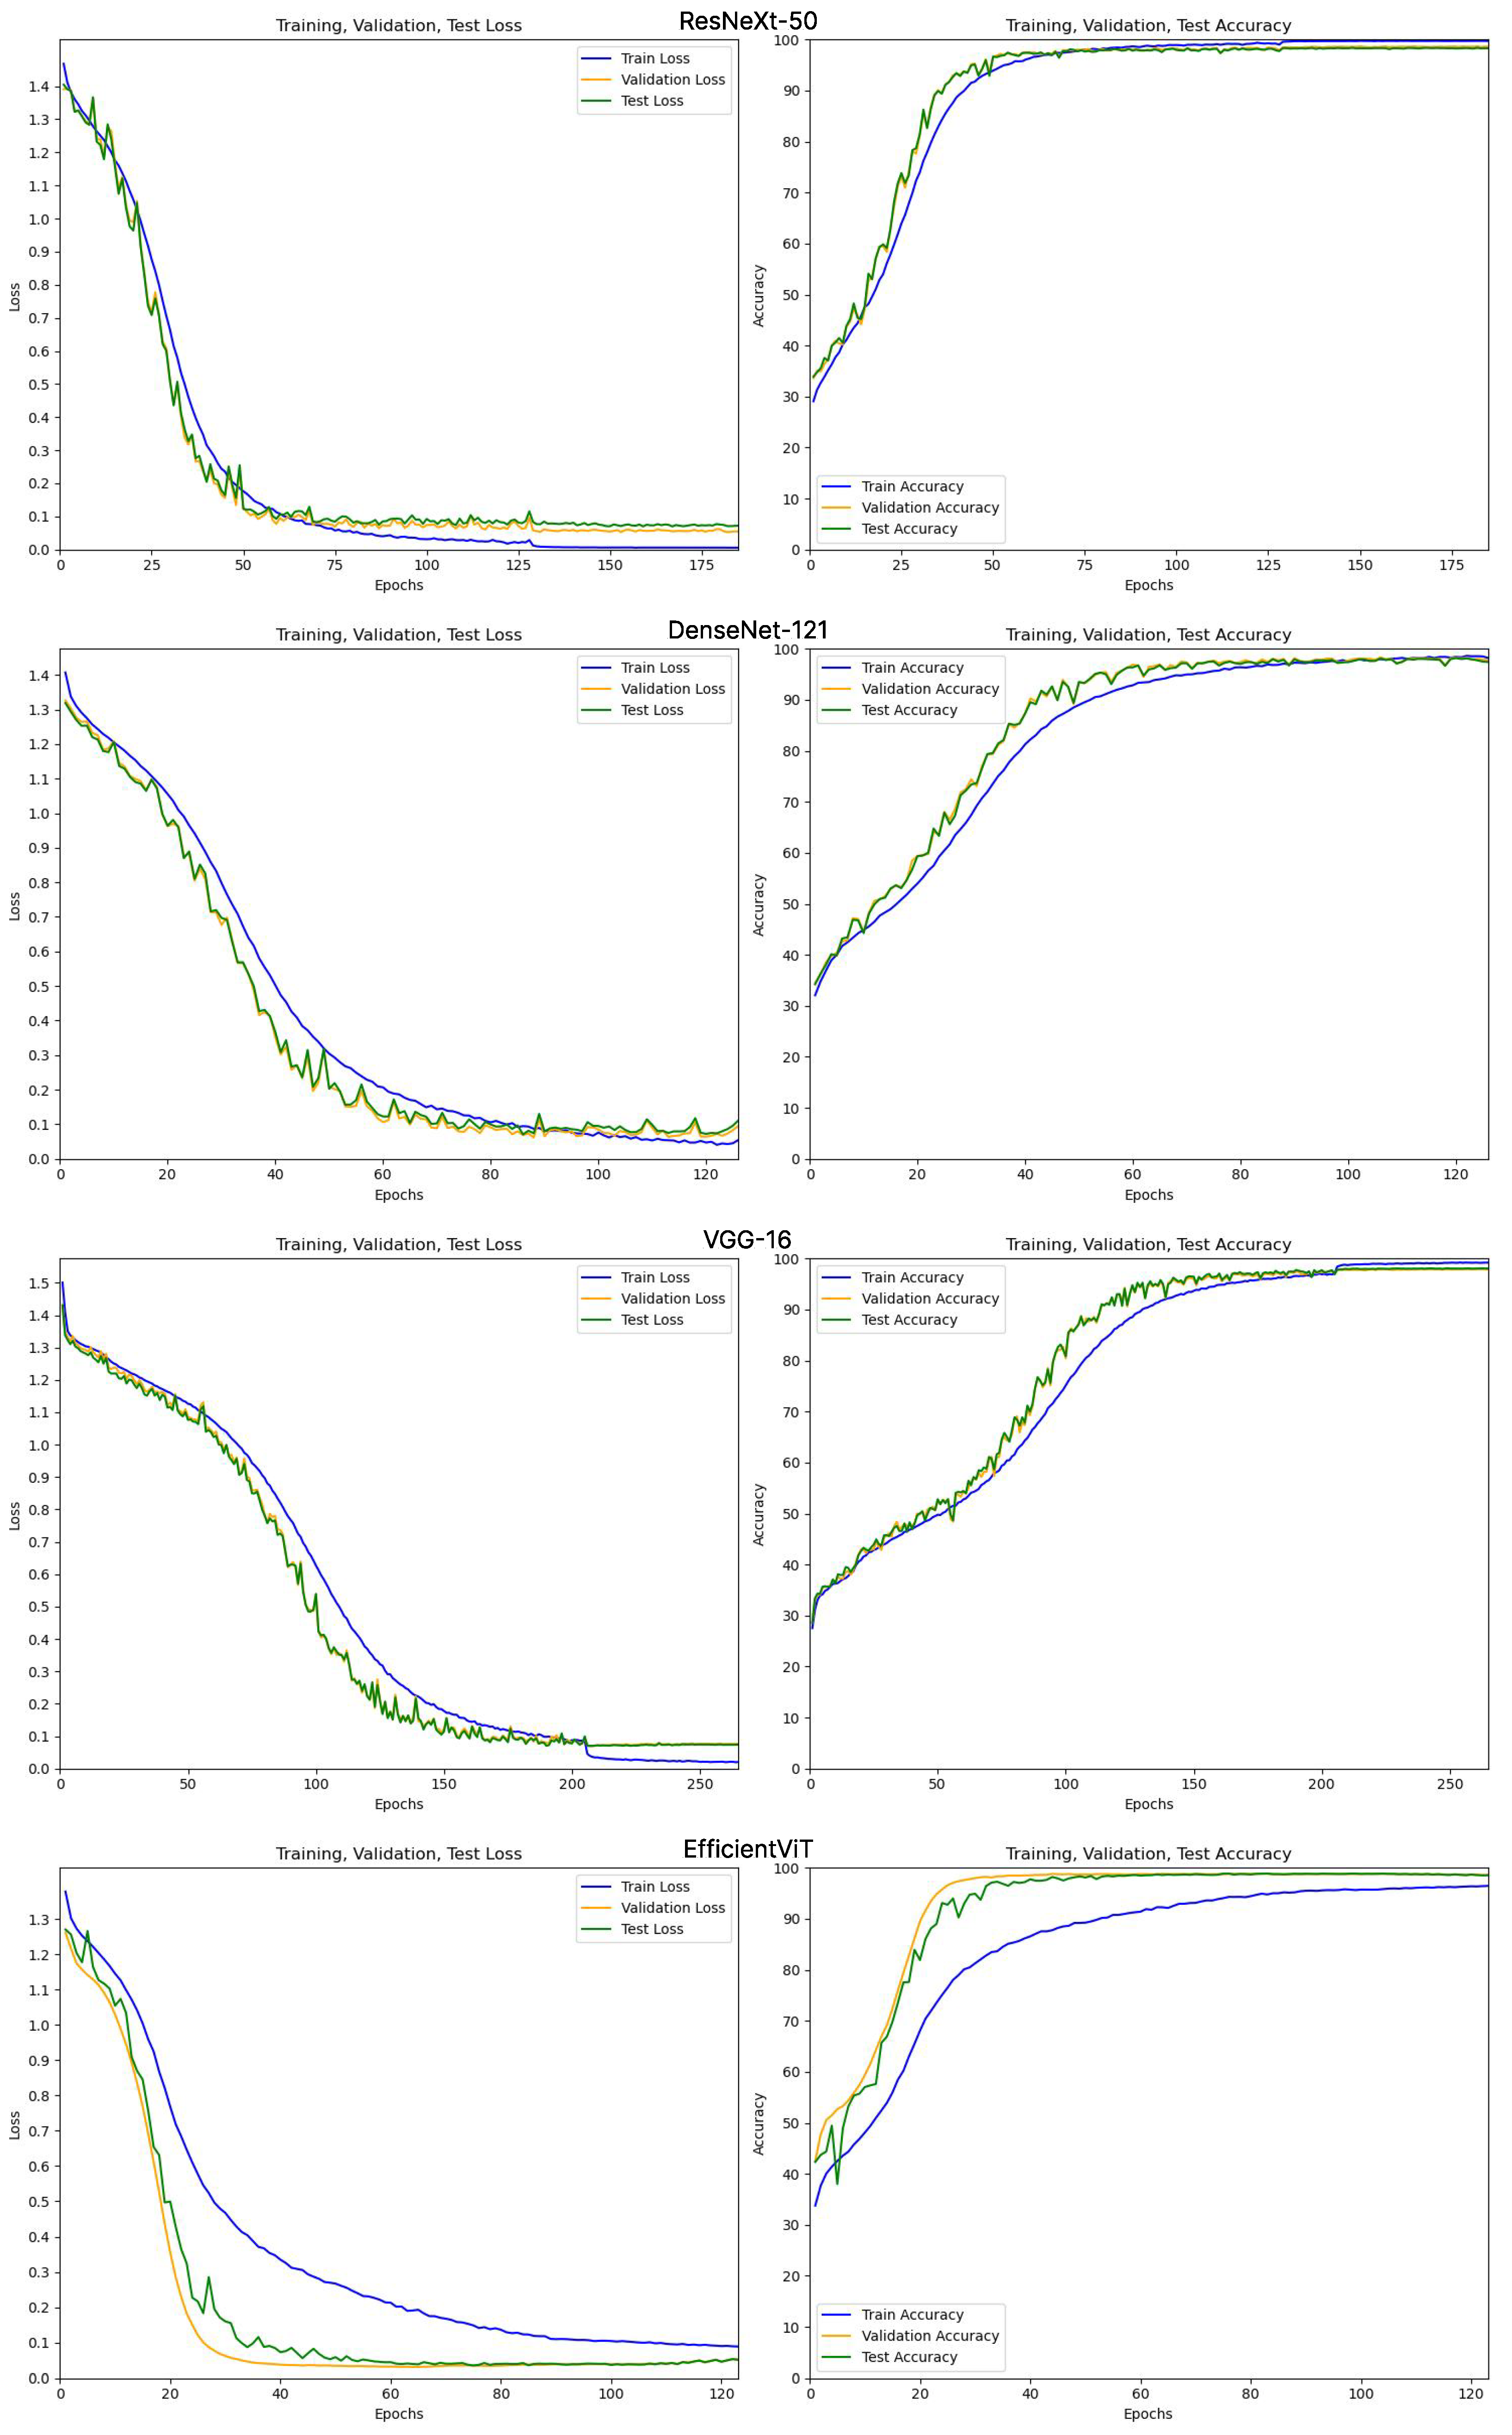
In this experiment, we compared the performance of EfficientViT with conventional CNN-based models (VGG-16, ResNeXt-50, DenseNet-121) under the one-stage classification framework. Evaluation metrics included accuracy, F1 score, precision, and recall. The training convergence behavior of the one-stage models is visualized in
Appendix C Figure A7, confirming consistent optimization across training, validation, and test sets. The results are summarized in
Table 4.
As shown in
Table 4, EfficientViT achieved the highest performance across all evaluation metrics, with an accuracy of 98.46% and an F1 score of 0.9867. It also recorded the best precision (0.9874) and recall (0.9859), outperforming all CNN-based baselines. While ResNeXt-50 achieved comparable performance (accuracy 98.30%; F1 score 0.9847), DenseNet-121 and VGG-16 showed slightly lower performance. Overall, EfficientViT demonstrated superior accuracy and robustness compared to traditional convolutional models.
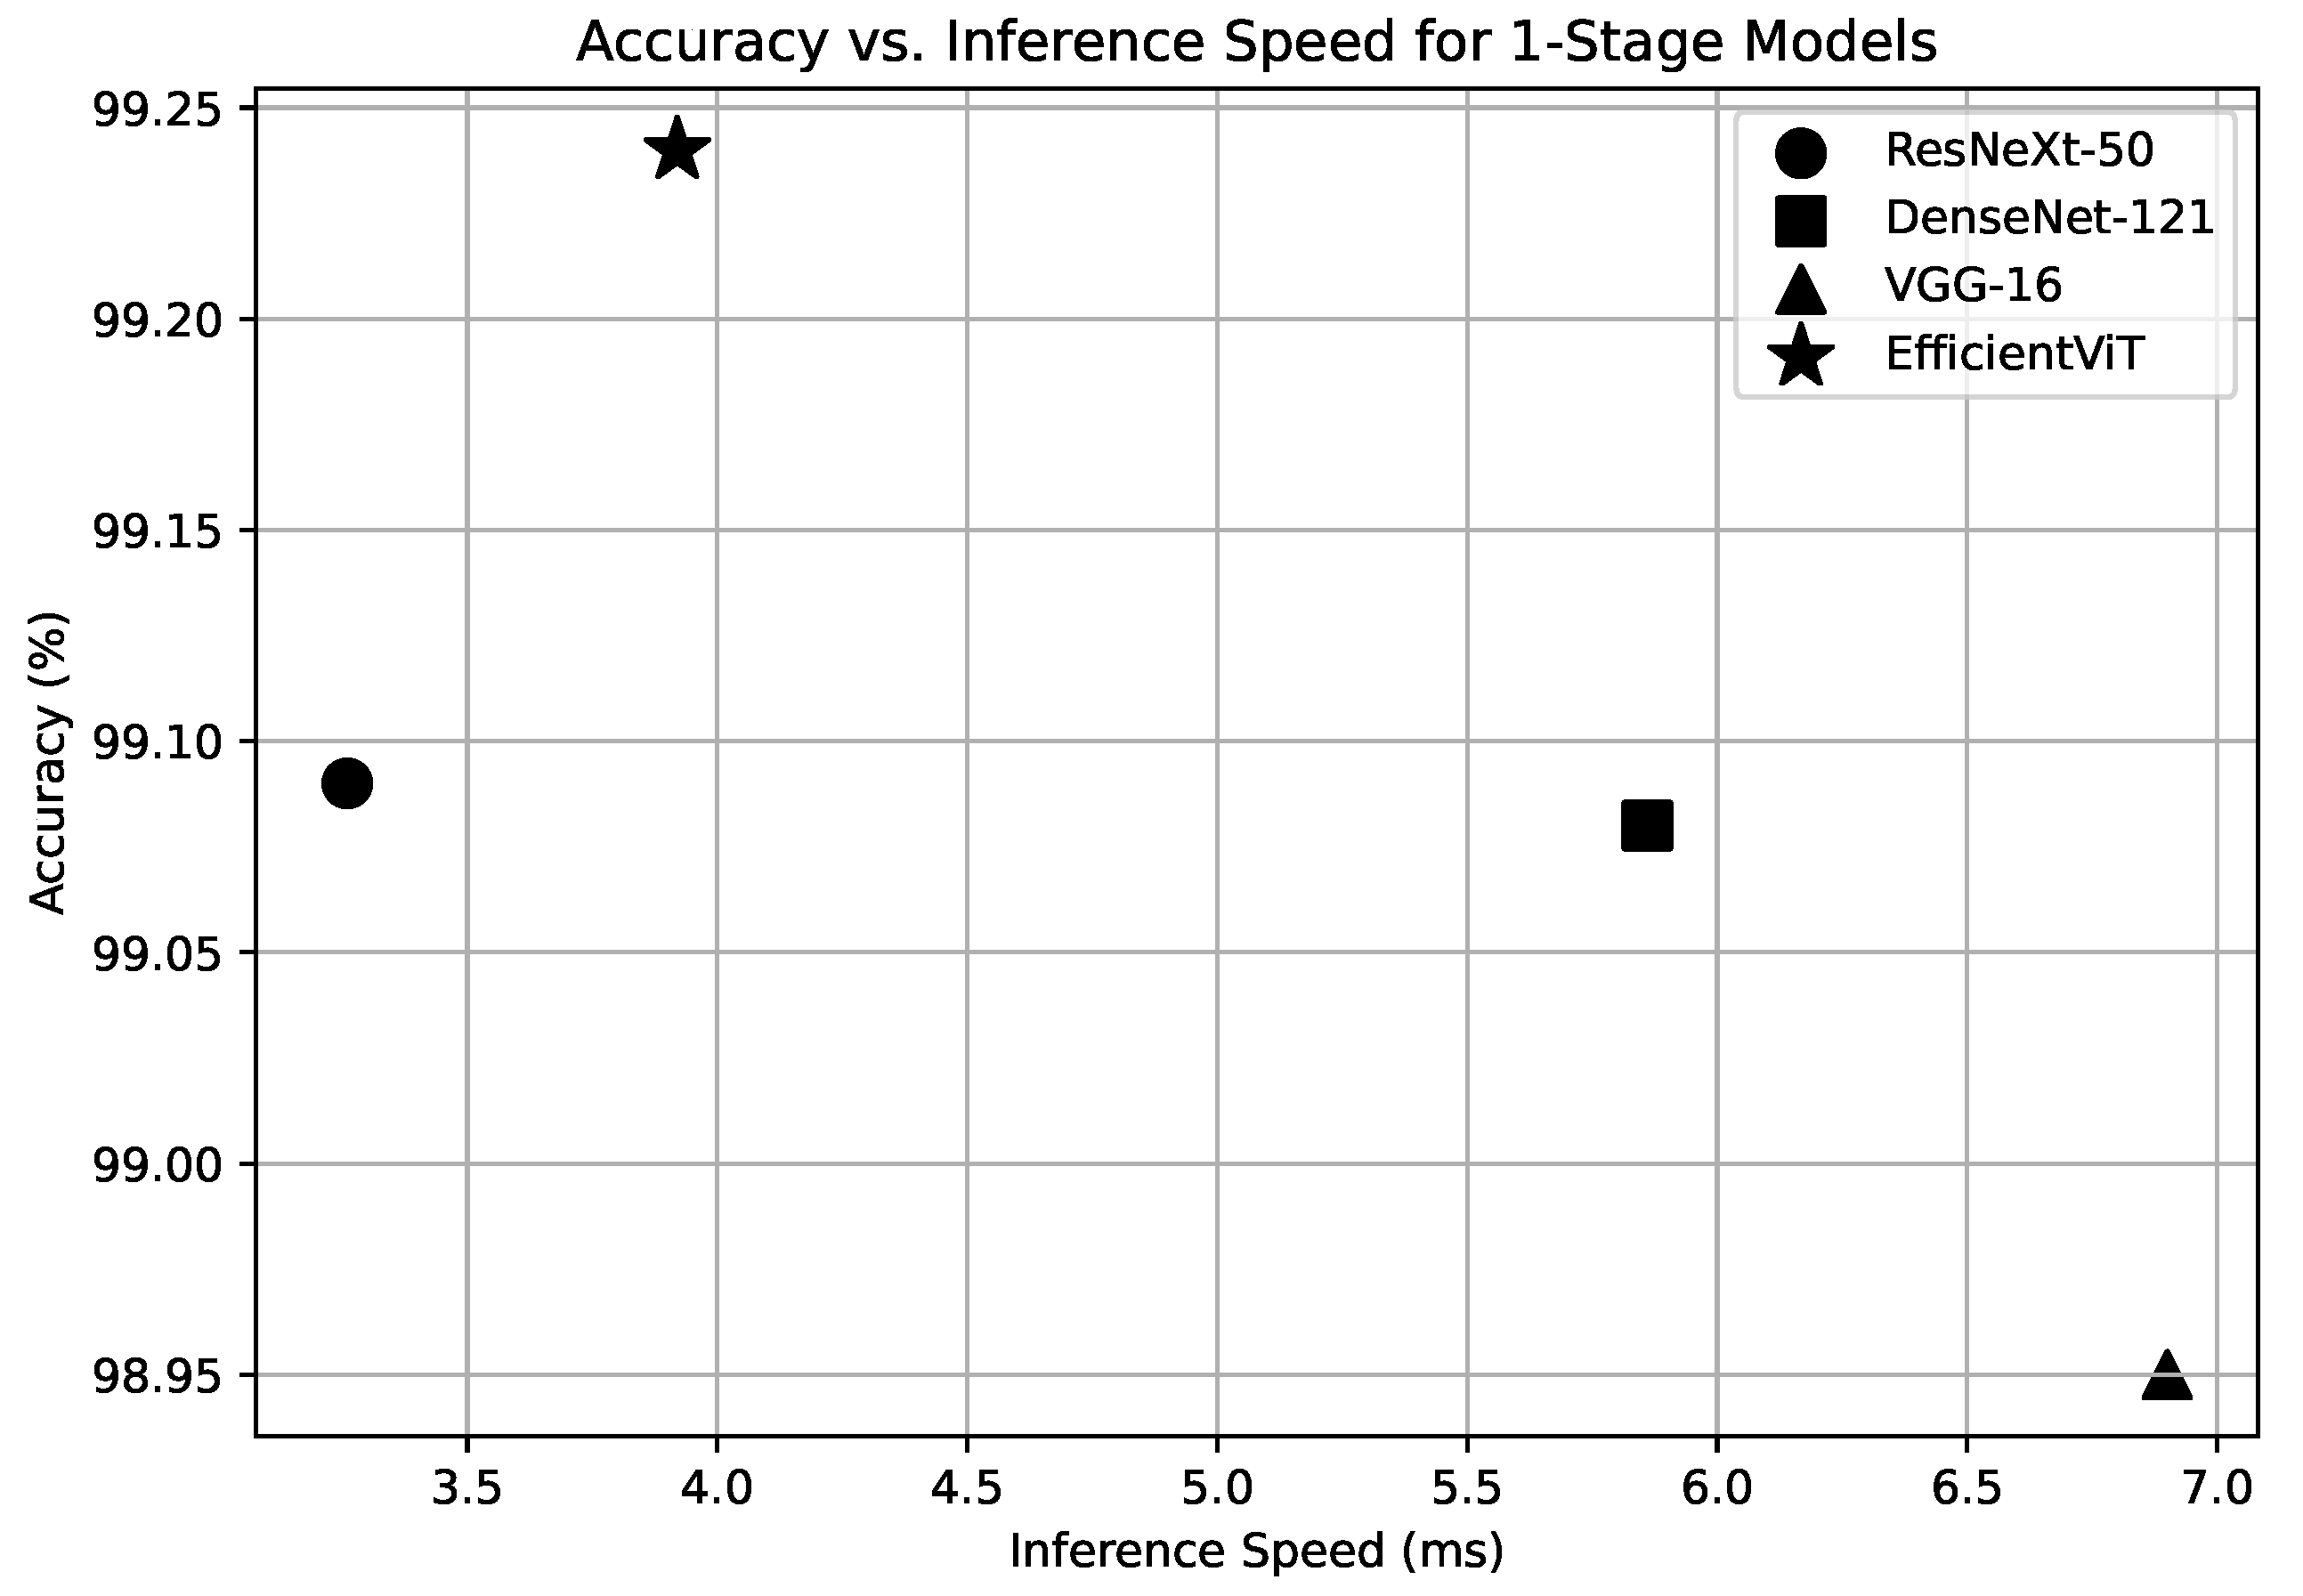
Figure 5 illustrates the trade-off between inference speed and accuracy for all one-stage models. As shown in the scatter plot, EfficientViT achieves the highest accuracy among the evaluated models while maintaining low inference latency, demonstrating a favorable balance between performance and efficiency.
4.3. CNN vs. 1++ Grade: EfficientViT
This experiment focused on evaluating model performance specifically for the 1++ grade, which represents the highest quality beef carcasses. We compared EfficientViT against CNN-based classifiers under the one-stage framework using the same evaluation metrics. The results are summarized in
Table 5.
EfficientViT outperformed all CNN models in 1++ grade classification, achieving the highest accuracy (99.24%), F1 score (0.9866), precision (0.9874), and recall (0.9858). Although the CNN models also demonstrated high accuracy (above 99%), EfficientViT achieved a more balanced trade-off between precision and recall, highlighting its strength in capturing the nuanced visual cues necessary for distinguishing high-grade marbling patterns.
Grad-CAM and Attention Map Visualization
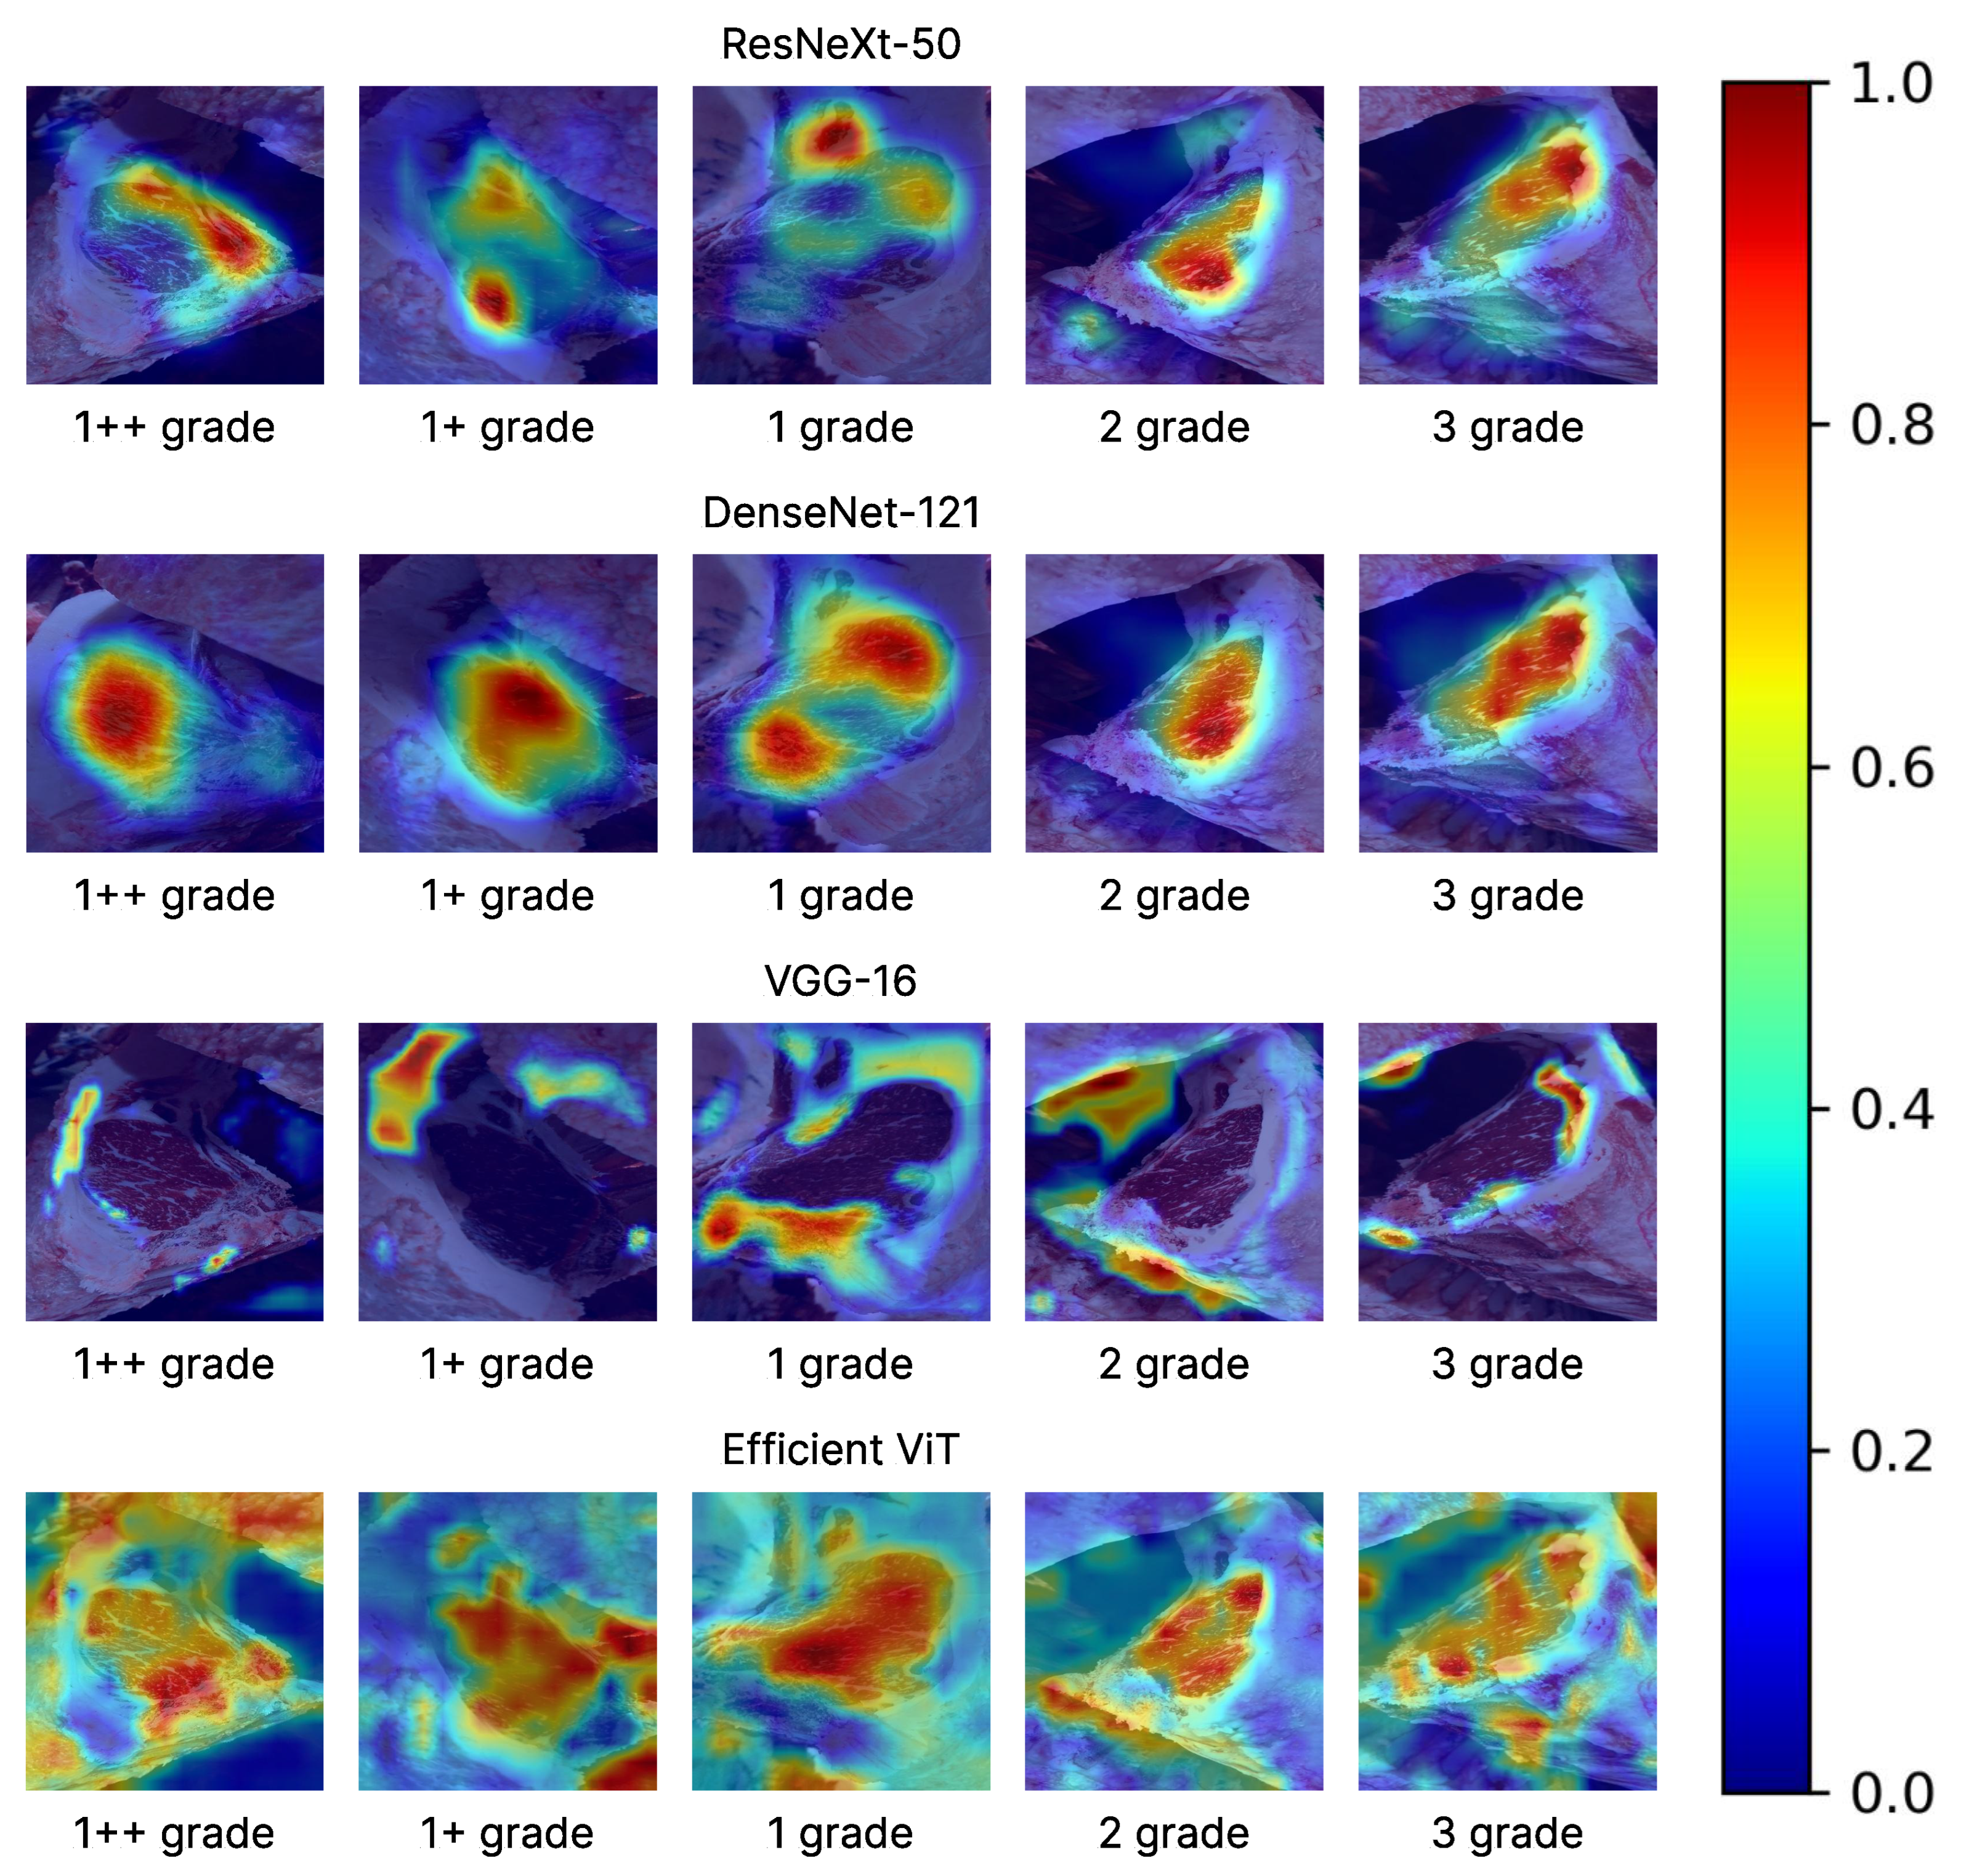
To investigate the differences in decision-making mechanisms across models, we visualized the prediction basis of CNN models (ResNeXt-50, DenseNet-121, VGG-16) using Grad-CAM, and compared them with the attention maps produced by EfficientViT.
Figure 6 illustrates which image regions were most emphasized by each model. All visualizations were normalized to the [0, 1] range and rendered using a Jet color map.
As shown in
Figure 6, EfficientViT tended to attend to spatially distributed regions across the image, capturing global patterns more comprehensively. In contrast, CNN-based models typically focused on limited local areas. This indicates that EfficientViT is better suited for assessing high-grade beef, such as 1++, where holistic marbling distribution plays a critical role in quality determination.
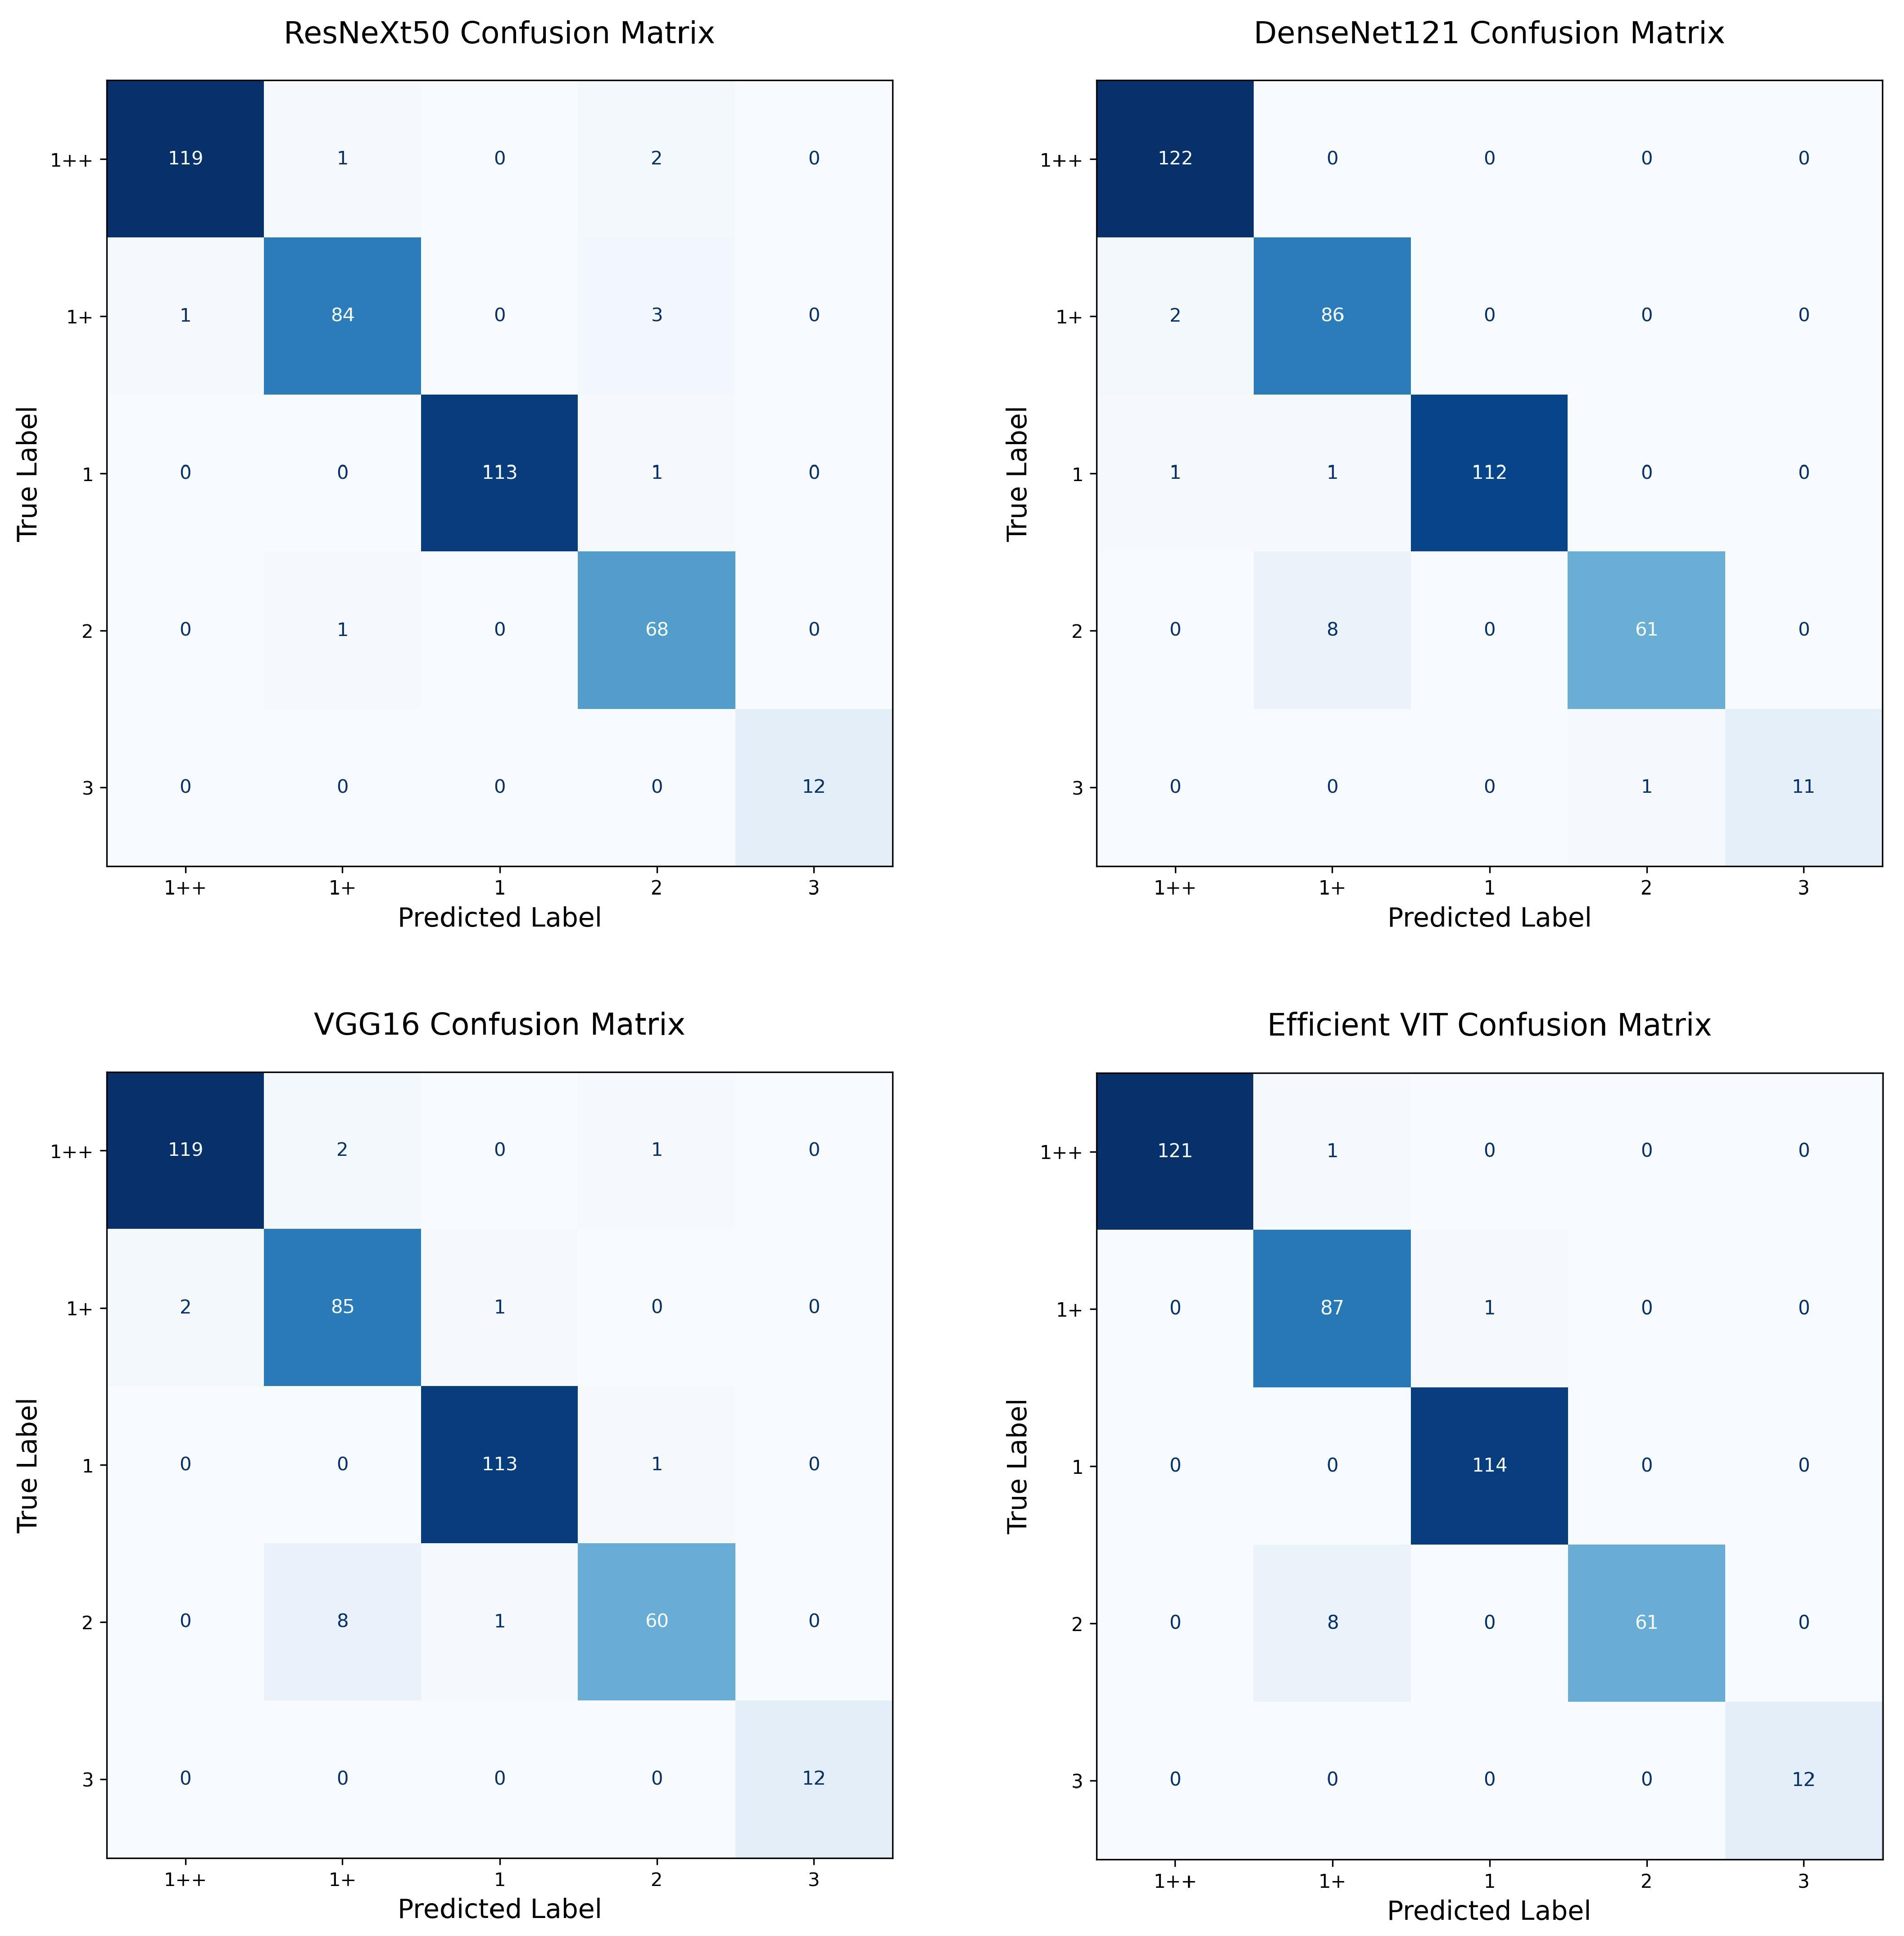
4.4. Performance Comparison Based on Loin Area Ratio: EfficientViT vs. CNN
This experiment was designed to investigate whether the model performance varies depending on the relative proportion of the loin cross-sectional area within an image. Given the architectural advantage of EfficientViT in capturing global contextual information, we hypothesized that it may exhibit superior performance when the visible loin area is limited.
To test this, we divided the test images into two subsets based on the proportion of loin area relative to the total image size: (1) images where the loin area exceeds 20% of the image (“over 20%”) and (2) images where the loin area is below 10% (“under 10%”). We then evaluated the 1++ grade prediction performance of EfficientViT and three CNN models (VGG-16, ResNeXt-50, DenseNet-121) for each subset. The confusion matrices for both subsets are provided in
Appendix B Figure A5 and
Figure A6 for visual comparison.
4.4.1. Over 20% Loin Area
As shown in
Table 6, EfficientViT achieved the best overall performance on the “over 20%” subset, with an accuracy of 99.75%, an F1 score of 0.9959, and perfect precision (1.0000). Although DenseNet-121 achieved the highest recall (1.0000), EfficientViT outperformed it in both precision and F1 score, indicating more balanced and reliable prediction capability.
4.4.2. Under 10% Loin Area
As shown in
Table 7, ResNeXt-50 achieved the highest accuracy (98.38%) and F1 score (0.9686), with a slightly higher precision than other models. However, EfficientViT achieved the highest recall (0.9703), suggesting a stronger ability to detect 1++ grade cases, even when the visible loin area is limited. The accuracy difference between EfficientViT and ResNeXt-50 was marginal (only 0.09%).
5. Discussion
This study investigated the structural advantages of the proposed EfficientViT-based one-stage model for beef carcass grading, comparing its performance against conventional CNNs and two-stage approaches through extensive experiments.
EfficientViT combines convolutional layers with a multi-scale linear attention mechanism, forming a hybrid architecture capable of effectively capturing both local texture features and global visual patterns. Notably, it achieved the highest F1 score and precision in predicting the highest-quality grade (1++), indicating that the attention mechanism is particularly beneficial for identifying distributed marbling patterns, which are critical for this class.
In experiments stratified by loin cross-section ratio, EfficientViT consistently maintained high recall, not only in the over 20% group with abundant meat area but also in the under 10% group, where visual information was limited. This suggests that the model’s attention structure enables it to integrate sparse yet meaningful features from across the entire image, demonstrating robust performance, regardless of ROI size.
Moreover, visualization results using Grad-CAM and attention maps highlighted a clear difference in spatial focus: CNN-based models tended to concentrate on specific local regions, while EfficientViT displayed a more evenly distributed attention pattern across the image.
To further quantify the spatial extent of model attention, we measured the proportion of each image that received high activation (defined as scores ≥ 0.5 in Grad-CAM or attention map).
Table 8 presents descriptive statistics for this high-activation area across all one-stage models.
EfficientViT exhibited the largest activated region, with a mean value of 49.78% and an interquartile range (IQR) spanning 39.42% to 59.91%. In contrast, the CNN-based models showed significantly narrower activation ranges: DenseNet-121 averaged 13.79%, ResNeXt-50 10.14%, and VGG-16 only 3.35%. This result suggests that EfficientViT tends to consider broader global contexts when making predictions, which aligns with its multi-scale attention architecture.
Interestingly, the ranking of average activation area—EfficientViT > DenseNet-121 > ResNeXt-50 > VGG-16—matches the models’ classification performance on the subset of samples with over 20% loin area (see
Section 4.3). This supports the hypothesis that broader attention coverage is positively associated with robustness to spatial variation in beef cross-section images. These findings reveal fundamental differences in feature learning strategies and emphasize the importance of considering model architecture when explainability and spatial reasoning are required.
While the two-stage models benefited from explicit ROI segmentation, reducing irrelevant information and improving classification accuracy, they were computationally intensive and exhibited longer inference times. In contrast, EfficientViT achieved comparable or better performance without the need for segmentation, and its fast inference speed further supports its suitability for real-time deployment in production environments. Furthermore, the elimination of segmentation dependency offers significant operational advantages. In real-world settings such as slaughterhouses, obtaining accurate segmentation masks in real time can be challenging due to inconsistent lighting, background noise, and varying carcass positions. By directly operating on raw RGB images, the proposed one-stage model avoids the need for costly and error-prone preprocessing, reducing system complexity and potential failure points. This design choice enhances the model’s robustness and deployability, particularly in scenarios where high-throughput and low-latency processing are essential.
Although the performance gap between EfficientViT and other CNN models may appear numerically marginal (e.g., differences in F1 score of less than 0.02), the consistency of its superiority across different scenarios—including varying loin cross-section ratios—demonstrates its robustness and practical reliability. In industrial contexts, where premium grades such as 1++ are sold at the highest market prices, even a small improvement in classification accuracy can lead to meaningful economic benefits and enhance operational decisions. Therefore, these “slightly better performances” translate into substantial value when deployed in high-stakes production environments.
Nonetheless, this study is based on a curated dataset from AI Hub, and further validation is needed to assess generalizability under more variable industrial conditions such as differing lighting, background clutter, or carcass positioning. Additionally, while the attention mechanism offers improved global reasoning, its internal decision-making process still poses challenges in terms of interpretability. Future work should explore explainable AI techniques tailored to transformer-based models.
Further directions include comparisons with other vision transformers, incorporating data augmentation strategies, and extending the framework to other domains such as different meat species or medical imaging. The balance of efficiency and expressiveness achieved by EfficientViT makes it a strong candidate for edge computing and mobile applications in practical scenarios.
6. Conclusions
In this study, we proposed an efficient and lightweight one-stage beef carcass grading model based on EfficientViT. The proposed model achieves high classification accuracy directly from raw RGB images, without the need for a separate segmentation step. Comparative experiments with two-stage models and CNN-based one-stage models demonstrated that the EfficientViT model outperformed others across multiple metrics, including classification accuracy, inference speed, and parameter size.
The EfficientViT architecture combines convolutional layers, which are effective at capturing local features, with a multi-scale linear attention mechanism capable of modeling global context. This hybrid design proved particularly effective for predicting the highest beef quality grade (1++), where spatially distributed patterns such as marbling are critical. Notably, EfficientViT maintained strong predictive performance even when the visible loin region was minimal, demonstrating robustness across variable imaging conditions.
These results suggest that EfficientViT is not only accurate but also highly practical for real-world applications, particularly in resource-constrained environments or industrial settings where real-time processing is required. Furthermore, visualization results based on Grad-CAM and attention maps confirmed that EfficientViT effectively utilizes global contextual cues, making it well-suited for complex visual grading tasks.
Future work may explore architectural variations of EfficientViT, investigate domain generalization capabilities, and evaluate optimization strategies for deployment on edge devices. Additionally, research into improved explainability—such as advanced visualization techniques and integration with explainable AI (XAI) frameworks—will be valuable for enhancing model transparency and trust in practical applications.


