Communication

Evaluating the Capture Efficiency of Microchannel Plates Through Photoelectron Detection

1
Shenzhen International Graduate School, Tsinghua University, Shenzhen 518055, China
2
Key Laboratory of China Building Materials Industry for Special Photoelectric Materials, China Building Materials Academy, Beijing 100024, China
3
Institute of Special Glass Fiber and Optoelectronic Functional Materials, China Building Materials Academy, Beijing 100024, China
*
Author to whom correspondence should be addressed.
These authors contributed equally to this work.
Appl. Sci. 2025, 15(11), 6301; https://doi.org/10.3390/app15116301
Submission received: 8 April 2025 / Revised: 22 May 2025 / Accepted: 2 June 2025 / Published: 4 June 2025
(This article belongs to the Special Issue Validation and Measurement in Analytical Chemistry: Practical Aspects)

Abstract

:
Capture efficiency (CE) is a critical performance parameter for microchannel plates (MCPs), yet its accurate measurement remains challenging. In this study, we propose an innovative method for evaluating the CE of newly fabricated MCPs based on the detection of a photoelectron beam generated by UV light irradiation of a zinc plate. When incident photoelectrons are detected by the MCPs, they produce a series of disordered pulse signals. We demonstrate that the average pulse interval (denoted as Ts) correlates with the number of electrons entering the microchannels, enabling the assessment of CE differences among various MCPs under identical experimental conditions. Additionally, by partially blocking the incident surface to modulate the active area of the MCP, we established a relationship between Ts and active area, providing a means to roughly quantify CE. This method offers a straightforward alternative for assessing MCP performance, with reduced platform requirements and operational complexity.

1. Introduction

A microchannel plate (MCP) is a common detector for essential micro-particles such as electrons, ions, and even neutrons [1,2,3]. It is composed of millions of ultrathin conductive glass capillaries that typically range from 4 µm to 25 µm in diameter and 0.20 mm to 1.0 mm in length and are tightly assembled in a thin plate. When a high voltage is applied to the MCP in a vacuum [4], each capillary becomes a continuous dynode electron multiplier. Electrons or ions entering the channels strike the capillary walls to form secondary electrons and initiate an electron avalanche. Finally, an anode collects the multiplied electrons emitted from the channels to generate an electrical signal. MCPs have shown some attractive features, including fast response, high gain, and high spatial resolution, so they are widely used in photodetectors and mass spectrometers [5,6,7,8].
Although the MCP has a large capture area, it cannot detect incident electrons/ions that do not enter the channels. Capture efficiency (CE) is a critical parameter for evaluating the performance of MCP. It refers to the ratio of electrons/ions detected by the MCP to the total number of incident electrons/ions [9]. Obviously, increasing CE can improve incident ion capture and detection sensitivity. In advanced applications such as mass spectrometry analysis, low-light imaging, or high-energy particle detection, improvements in CE can substantially enhance sensitivity and signal quality. For the MCP production industry, establishing accurate protocols for CE measurements is essential for assessing MCP structures and optimizing materials and surface treatments. Factors influencing CE include the structure of the MCP, the geometry of the capillary channels, and the incident angle. It is easy to deduce that the open-area ratio (OAR) of an MCP determines the upper limit of its CE [10,11,12]. Previous studies have demonstrated a direct correlation between the CE and OAR of an MCP [13]. Therefore, efforts have been made to exceed the OAR limit by geometry modification [14]. A practical solution is to manufacture tapered MCPs with expanded channel entrances while leaving the inner capillary walls unchanged [15,16,17]. In this scenario, implementing rapid CE evaluation for the fabricated tapered MCP will facilitate timely parameter adjustments during production and support the iterative refinement of manufacturing protocols. On the other hand, for users, understanding the CE parameters of MCPs may aid in optimizing the design of the experimental setup and provide deeper insights for result interpretation [6].
Theoretically, to obtain the CE of MCP, one needs to measure the total incident ion numbers and the number of detected ions separately. The former can be easily measured by a Faraday cup, while the latter is difficult to obtain by directly detecting the ion current output by the MCP. This is because such a signal is not only related to the number of ions entering the channels but also affected by other factors, including the multiplication factor of the microchannel and the state of the incident ions (e.g., mass to charge, kinetic energy, incident angle) [18,19], most of which are difficult to quantify. Another practical obstacle is that the ion currents output by the Faraday cup and the MCP are generally not within comparable orders of magnitude. As an alternative and more practical solution, the number of ions reaching MCP is usually measured in the counting mode. In such a mode, to prevent signal saturation [20], the total number of incident ions needs to be reduced, which can be achieved by slit interception or pulsed laser-induced photoelectron emission [21]. This strategy has been a recognized method for assessing the efficiency of MCP, but its application is somewhat limited due to its stringent hardware requirements and relatively low measurement throughput.
Recently, we have focused on fabricating MCPs with varying OARs and channel geometries. Alongside process optimization, the development of simple and rapid performance evaluation methods is also essential. To assess the CE of these MCPs, we proposed a new approach based on the detection efficiency of a photoelectron beam. While ionizing low-energy materials with high-energy ultraviolet light is a common method for generating free electrons [22,23,24], this approach offers limited control over beam energy and density. In our study, we employ the photoelectric effect by irradiating a zinc plate with UV light to produce a stable photoelectron beam. This configuration allows control of electron energy through applied electric fields. Then, it was detected using the tested MCP to produce a series of pulse signals, which correspond to the electrons that are “captured” into the channels. By comparing the pulse counts collected by different MCPs, the difference in CE between them can be obtained. Since this method has low hardware requirements and is easy to operate, it may be an alternative strategy for roughly evaluating the CE of MCPs.

2. Materials and Methods

The MCPs (25 mm in diameter) tested in this study were recently manufactured by China Building Materials via a refined hydrogen reduction process: glass rods and tubes were melted and drawn into single fibers, assembled into rod-tube assemblies with precisely aligned fibers, and then formed into composite filaments through secondary sorting and polishing. Chemical etching selectively removed the glass core to create hollow microchannels, followed by hydrogen reduction at elevated temperatures to eliminate impurities and enhance conductivity. A critical precision polishing step after slicing optimized channel wall verticality and surface flatness. Finally, metal electrodes were deposited to complete the MCPs with high-open-area ratio and uniform channel. Three types of MCPs with varying channel geometries were fabricated and tested, including a circular MCP, a tapered circular MCP, and a hexagonal MCP. In particular, hexagonal MCP features a novel end-face structure comprising hexagonal conical holes with inner cylindrical extensions in a hexagonal close-packing arrangement, replacing the conventional circular packing array. Such geometry may reduce the edge discharge risks associated with expanded apertures.
We built a simple setup to assess the CE of MCPs. As shown in Figure 1, it mainly consists of a UV lamp (Heraeus, Model: PKS 106, Hanau, Germany), a zinc plate (50 mm × 30 mm), and an MCP detector. The centerline of the zinc plate and UV light was set at an angle of about 60°, and the incident surface of the MCP was positioned parallel to the zinc plate, with a gap of approximately 20 mm. In the experiments, photons (10.6 eV) emitted by the UV lamp irradiated the zinc plate, causing the emission of photoelectrons. Voltages of approximately −800 V and −100 V were applied to the incident and output sides of the MCP, respectively. Moreover, a voltage of around −1200 V was applied to the zinc plate to form a potential difference between the MCP and the zinc plate (marked as VM-Z), which could promote the emission of photoelectrons and guide them to the MCP. The entire system is housed in a vacuum chamber with a pressure of 1 × 10⁻⁵ mbar.

3. Results

3.1. Fabrication of MCPs with Different OARs

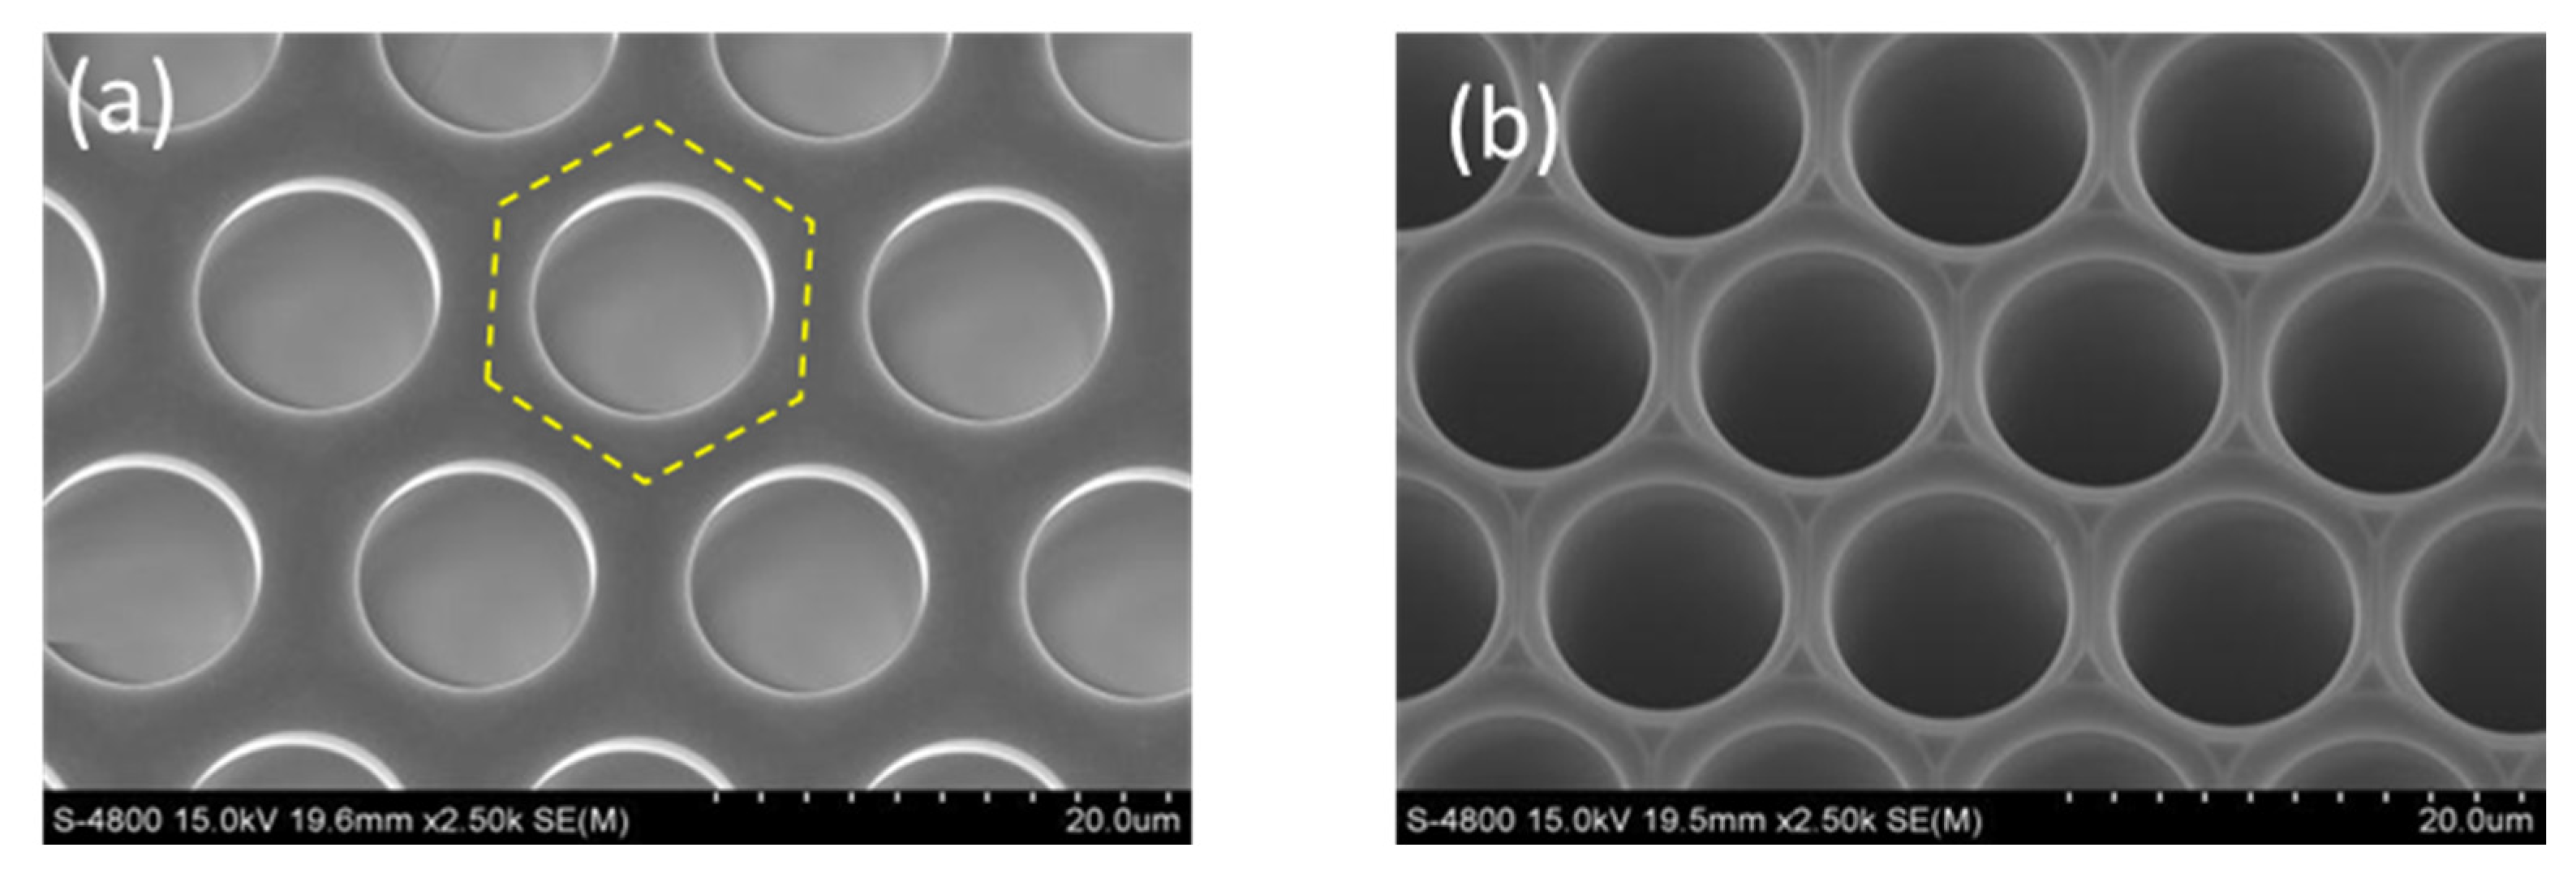
In this study, three types of MCPs with varying OARs and channel geometries were fabricated and tested: a circular MCP, a tapered circular MCP, and a hexagonal MCP, with OARs of 65.6%, 67.2%, and 49.8%, respectively. Among these, the circular MCP represents a conventional structure, while the other two types were used to address specific challenges: the tapered circular MCP is designed to increase the OAR, and the hexagonal MCP is designed to mitigate potential edge discharge risks in circular apertures. As shown in Figure 2, these two special MCPs show different surface morphologies and channel geometries. In addition to the differences in appearance, we also want to further evaluate their detection performance.

3.2. Validation of the Generation and Detection of Photoelectrons

We first verified the feasibility of generating photoelectron beams using the current platform. The energy of the electron excited by the photoelectric effect is determined by the difference between the energy of the photon and the work function of the metal plate. Therefore, the voltage applied to the metal surface will not affect the initial energy and quantity of photoelectron but only affect the motion state of photoelectron after emission and the size of photocurrent. As shown in Figure 3, when the UV lamp was turned off, the MCP had no output signal with varying VM-Z (from −100 V to 500 V). In comparison, turning on the UV lamp directly resulted in a slight rise in the MCP background signal, which was probably caused by some UV photons being reflected into the MCP channels. In addition, the signal intensity was increased with increasing VM-Z, implying that the signal was generated by the MCP detecting the incident photoelectrons. That is, a higher VM-Z is believed to enhance the kinetic energy of photoelectrons, leading to an increased MCP response.

3.3. Data Processing

We developed a special data processing method to evaluate the count of detected electrons, which is related to the number of pulses in the signal output by the MCP. First, we established an appropriate threshold to convert the raw signals into binary format. We chose the average peak-to-peak value of the signal as the threshold reference to ensure the detection of low pulse signals while effectively excluding weak noise interference. Peaks exceeding the threshold are identified as valid pulses, while those below are considered background noise. After this conversion, the original analog signals turn into a sequence of discrete pulses. Next, we performed a statistical analysis of the intervals between adjacent pulses, as shown in Figure 4. The experimental results demonstrate that the pulse intervals exhibit an approximately exponential distribution. This behavior may be attributed to the independent operation of each microchannel in the MCP, which aligns with the independence assumption of the Poisson process, in which the probability of detecting k electrons within a unit time t is given by
P ( k ) = ( λ k ) k e λ t k !
when k = 0, it indicates that no electrons arrive within time t, and the probability is
P ( 0 ) = e λ t
Thus, the probability that at least one electron arrives within time t is
f ( Δ t t ) = 1 e λ t
Taking the derivative with respect to t, we obtain the probability density function (PDF) of the pulse interval:
P ( Δ t )   =   λ e λ Δ t
Additionally, the stochastic nature of the electron multiplication process within the channels further reinforces the characteristics of the exponential distribution. Specifically, the random arrival of electrons and their subsequent amplification in the channels result in pulse intervals that follow an exponential distribution, as predicted by Poisson statistics.
Then, the average value of the pulse intervals (Ts) was used to represent the average time required for an electron to enter the MCP channels, which was defined as
T s = 1 N i = 1 N t i
where ∆ti represents the i-th pulse interval, and N is the total number of pulse intervals. In practice, as ∆ti is exponentially distributed when the sampling time is long enough, a fitting curve can be acquired:
f ( Δ t ;   λ ) = λ e λ t
where λ is the reciprocal of Ts. Subsequently, the value of Ts can be determined using this equation.

3.4. Factors Affecting the Pulse Intervals

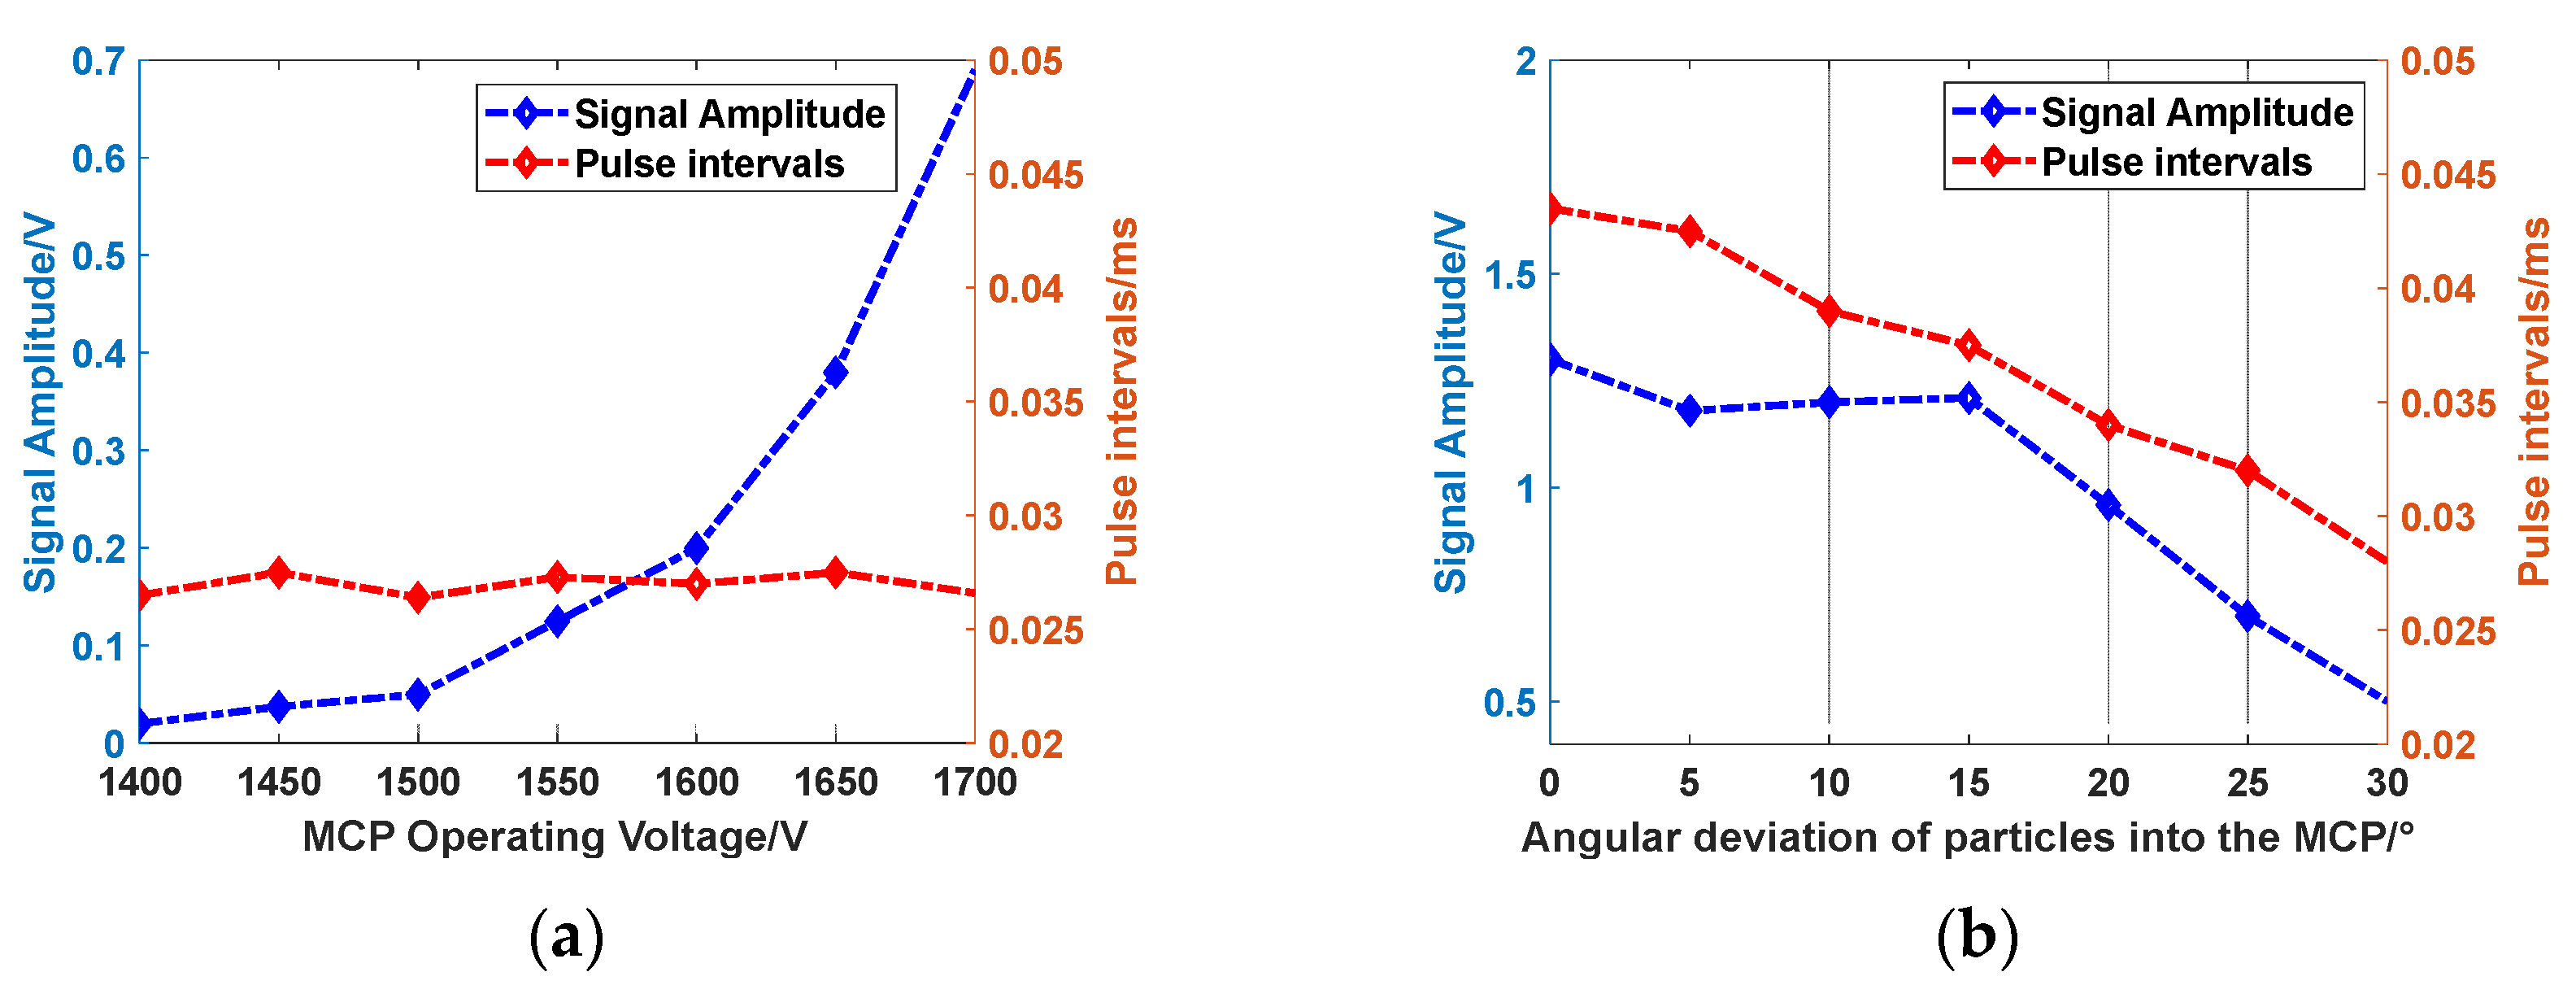
Experiments were then performed to investigate the factors affecting the calculated Ts. In this study, the operating voltage of the MCP and the incident angle of the photoelectrons toward the MCP were changed, and the ion current and average pulse intervals under these conditions were acquired. As shown in Figure 5a, elevating the operating voltage of the MCP boosts the channel gain, consequently increasing the amplitude of the output signal. In contrast, the state of the incident electrons, such as their kinetic energy or number, remains unaffected, and thus, the pulse intervals remain relatively stable. In Figure 5b, by increasing the incidence angle of the electrons, both the signal intensity and the pulse intervals decrease accordingly, which is caused by a reduction in the number of electrons entering the MCP channels. These results align with our expectations and, to a certain extent, validate the feasibility of the proposed approach.

3.5. Testing of Different MCPs

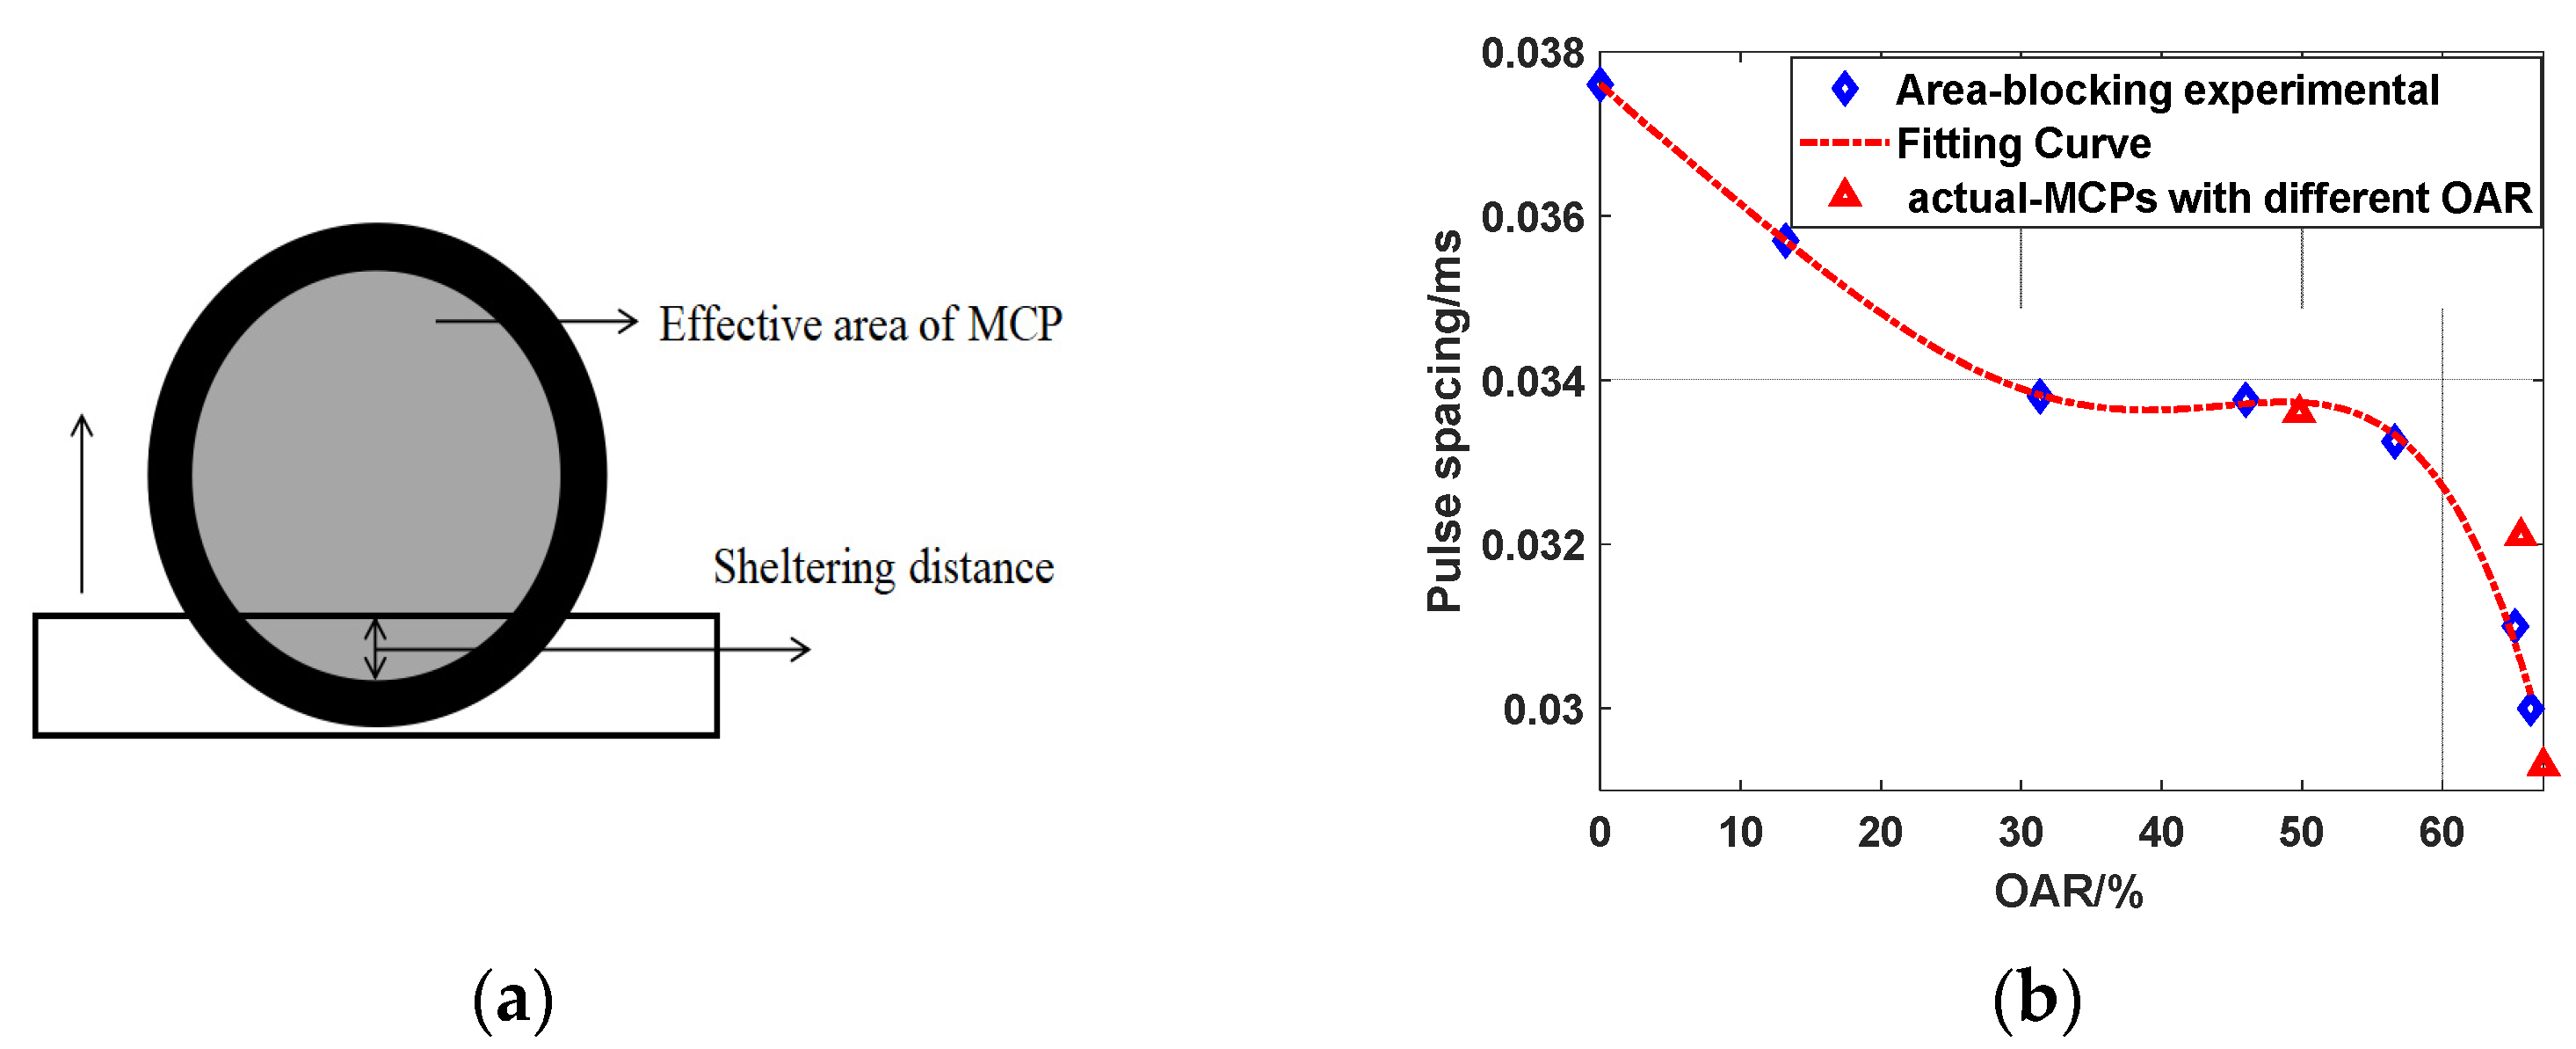
Following the initial assessment, the proposed method was ultimately applied to evaluate the performance of different MCPs. Notably, in addition to testing three actual MCP products, an area-blocking strategy was employed to create a series of “simulated” MCPs with a broader range of OARs. Specifically, a rectangular blocking plate was used to partially cover the incident surface of the MCP, thereby reducing its active area, as illustrated in Figure 6a. The tapered circular MCP was selected for this experiment to generate a series of OARs ranging from 0% to 67.2%. However, since OARs below 40% are generally not practically significant, the analysis focused on data from larger OARs. Figure 6b presents the relationship curve between the measured pulse intervals and the “simulated” OARs, revealing a nonlinear correlation. Unfortunately, the underlying mechanisms responsible for this nonlinearity remain unclear. One potential factor is the non-uniform distribution of energy and density among the incident photoelectrons. That is, the UV lamp’s non-uniform intensity may create an uneven electron beam. Additionally, edge effects of the electric field may introduce deviations in both the energy and trajectory of the electrons. These factors result in non-uniform energy and density distributions of incident electrons collected by the MCP. Nevertheless, it is worth noting that pulse intervals measured from different types of MCPs under the same experimental conditions align closely with this curve. The pulse interval of the photoelectron signal collected by the MCP with a larger OAR is shorter, demonstrating its higher CE. These findings suggest that the method proposed in this study is feasible for evaluating the CE of MCPs and further highlights the superior performance of MCPs with larger OARs.

4. Conclusions

In this study, we developed and tested a novel approach for evaluating the CE of some recently fabricated MCPs. By generating a stable photoelectron beam through UV light irradiation on a zinc plate and detecting the resulting electrons with MCPs, we obtained pulse signals corresponding to the electrons captured by the microchannels. Through statistical analysis of the intervals between adjacent pulses, we established that the average pulse interval serves as an indicator of CE, as it is determined by the number of electrons entering the MCP channels. Subsequent experiments with MCPs featuring different OARs confirmed a correlation between Ts and CE. Since structures with higher OARs capture more electrons, the tapered circular MCP demonstrated superior performance compared to the hexagonal MCP under identical conditions. This approach may provide a feasible alternative for assessing the performance of MCPs. Of course, further research is needed to fully elucidate the underlying mechanisms and refine the methodology.

Author Contributions

M.W.: data curation (equal); formal analysis (lead); investigation (equal); methodology (equal); writing—original draft (lead). L.Y.: data curation (equal); investigation (equal); methodology (equal). S.L.: data curation (equal); investigation (equal). X.Z.: resources (supporting). H.C.: funding acquisition (equal); resources (supporting). Q.Y.: conceptualization (lead); funding acquisition (equal); supervision (lead); writing—review and editing (lead). All authors have read and agreed to the published version of the manuscript.

Funding

This study was financially supported by the National Key R&D Program of China (Grant No. 2022YFF0709300).

Institutional Review Board Statement

Not applicable.

Informed Consent Statement

Not applicable.

Data Availability Statement

The data presented in this study are available on request from the corresponding author. The data are not publicly available due to privacy restriction.

Conflicts of Interest

The authors declare no conflicts of interest.

Abbreviations

The following abbreviations are used in this manuscript:
MCPMicrochannel plates
CECapture efficiency
OAROpen area ratio
UVUltraviolet light

References

  1. Ladislas Wiza, J. Microchannel plate detectors. Nucl. Instrum. Methods 1979, 162, 587–601. [Google Scholar] [CrossRef]
  2. Zhang, X.; Ouyang, X.; Zhang, J.; Weng, X.; Tan, X.; He, J.; Zhang, X.; Wei, K. The study of neutron sensitivity of the MCP based on recoil proton detection. AIP Adv. 2020, 10, 085310. [Google Scholar] [CrossRef]
  3. Gershman, D.J.; Avanov, L.A.; Chornay, D.J.; Rager, A.C.; Pollock, C.J.; Grubbs, G.; Mackler, D.A.; Tucker, C.J.; Paschalidis, N.P. Extending the dynamic range of microchannel plate detectors using charge-integration-based counting. Rev. Sci. Instrum. 2018, 89, 073301. [Google Scholar] [CrossRef] [PubMed]
  4. Yao, Z.; Pang, Y.; Yuan, Y.; Hu, W.; Bu, R.; Fan, H. Numerical simulation of outgassing characteristics of microchannel plate glass. AIP Adv. 2021, 11, 075015. [Google Scholar] [CrossRef]
  5. Funsten, H.O.; Harper, R.W.; Dors, E.E.; Janzen, P.A.; Larsen, B.A.; MacDonald, E.A.; Poston, D.I.; Ritzau, S.M.; Skoug, R.M.; Zurbuchen, T.H. Comparative Response of Microchannel Plate and Channel Electron Multiplier Detectors to Penetrating Radiation in Space. IEEE Trans. Nucl. Sci. 2015, 62, 2283–2293. [Google Scholar] [CrossRef]
  6. Ge, Z. Overview of High-Performance Timing and Position-Sensitive MCP Detectors Utilizing Secondary Electron Emission for Mass Measurements of Exotic Nuclei at Nuclear Physics Facilities. Sensors 2024, 24, 7261. [Google Scholar] [CrossRef]
  7. Barnes, J.H.; Hieftje, G.M. Recent advances in detector-array technology for mass spectrometry. Int. J. Mass Spectrom. 2004, 238, 33–46. [Google Scholar] [CrossRef]
  8. Jiang, Z.; Ni, Q. Design and Performance of Photon Imaging Detector Based on Cross-Strip Anode with Charge Induction. Appl. Sci. 2022, 12, 8471. [Google Scholar] [CrossRef]
  9. Fehre, K.; Trojanowskaja, D.; Gatzke, J.; Kunitski, M.; Trinter, F.; Zeller, S.; Schmidt, L.P.H.; Stohner, J.; Berger, R.; Czasch, A.; et al. Absolute ion detection efficiencies of microchannel plates and funnel microchannel plates for multi-coincidence detection. Rev. Sci. Instrum. 2018, 89, 045112. [Google Scholar] [CrossRef]
  10. Matoba, S.; Takahashi, R.; Io, C.; Koizumi, T.; Shiromaru, H. Absolute Detection Efficiency of a High-Sensitivity Microchannel Plate with Tapered Pores. Jpn. J. Appl. Phys. 2011, 50, 112201. [Google Scholar] [CrossRef]
  11. Deconihout, B.; Gerard, P.; Bouet, M.; Bostel, A. Improvement of the detection efficiency of channel plate electron multiplier for atom probe application. Appl. Surf. Sci. 1996, 94–95, 422–427. [Google Scholar] [CrossRef]
  12. Deconihout, B.; Vurpillot, F.; Bouet, M.; Renaud, L. Improved ion detection efficiency of microchannel plate detectors. Rev. Sci. Instrum. 2002, 73, 1734–1740. [Google Scholar] [CrossRef]
  13. Fraser, G.W. The ion detection efficiency of microchannel plates (MCPs). Int. J. Mass Spectrom. 2002, 215, 13–30. [Google Scholar] [CrossRef]
  14. Krauss, S.; Böhm, M.; Gumbert, K.; Lehmann, A.; Miehling, D.; Belias, A.; Dzhygadlo, R.; Gerhardt, A.; Lehmann, D.; Peters, K.; et al. Performance of the most recent Microchannel-Plate PMTs for the PANDA DIRC detectors at FAIR. Nucl. Instrum. Methods Phys. Res. Sect. A 2023, 1057, 168659. [Google Scholar] [CrossRef]
  15. Frey, S.; Antognini, L.; Beygi, M.; Ballif, C.; Wyrsch, N. New Developments in Amorphous Silicon-Based Microchannel Plates. IEEE Trans. Nucl. Sci. 2023, 70, 2226–2233. [Google Scholar] [CrossRef]
  16. Ashkhotov, O.G.; Ashkhotova, I.B.; Magkoev, T.T. Formation of an Inlet Funnel in the Channels of Microchannel Plates. Glass Ceram. 2024, 81, 306–308. [Google Scholar] [CrossRef]
  17. Huang, J.; Gong, Y.; Zeng, J.; Li, T.; Wang, Y.; Yang, Q.; Yue, R.; Wu, P.; Chu, Z.; Li, X. Study on the input electrode depth of the funnel microchannel plate. Proc. SPIE 2023, 12617, 126170D. [Google Scholar]
  18. Gao, R.S.; Gibner, P.S.; Newman, J.H.; Smith, K.A.; Stebbings, R.F. Absolute and angular efficiencies of a microchannel-plate position-sensitive detector. Rev. Sci. Instrum. 1984, 55, 1756–1759. [Google Scholar] [CrossRef]
  19. Blase, R.C.; Benke, R.R.; Pickens, K. Review of Measured Photon Detection Efficiencies of Microchannel Plates. IEEE Trans. Nucl. Sci. 2018, 65, 2839–2851. [Google Scholar] [CrossRef]
  20. Meng, S.; Yi, Q.; Zhou, L.; Yan, X.; Yang, J.; Ye, F.; Yang, R.; Jiang, S.; Ning, J.; Huang, Z.; et al. Restoration of saturated outputs from microchannel plate photomultiplier tubes in sub-microsecond single-pulse-current mode. Rev. Sci. Instrum. 2023, 94, 113101. [Google Scholar] [CrossRef]
  21. Tetsuo, K.; Yuta, C. Absolute detection efficiencies of an ion-counting system with a channel-electron multiplier. J. Phys. Conf. Ser. 2009, 163, 012114. [Google Scholar] [CrossRef]
  22. Laksman, J.; Dietrich, F.; Maltezopoulos, T.; Liu, J.; Ferreira de Lima, D.E.; Gerasimova, N.; Karpics, I.; Kujala, N.; Schmidt, P.; Karabekyan, S.; et al. Operation of Photo Electron Spectrometers for Non-Invasive Photon Diagnostics at the European X-ray Free Electron Laser. Appl. Sci. 2024, 14, 10152. [Google Scholar] [CrossRef]
  23. Liu, F.; Sidhik, S.; Hoffbauer, M.A.; Lewis, S.; Neukirch, A.J.; Pavlenko, V.; Tsai, H.; Nie, W.; Even, J.; Tretiak, S.; et al. Highly efficient photoelectric effect in halide perovskites for regenerative electron sources. Nat. Commun. 2021, 12, 673. [Google Scholar] [CrossRef]
  24. De Ninno, G.; Wätzel, J.; Ribič, P.R.; Allaria, E.; Coreno, M.; Danailov, M.B.; David, C.; Demidovich, A.; Di Fraia, M.; Giannessi, L.; et al. Photoelectric effect with a twist. Nat. Photonics 2020, 14, 554–558. [Google Scholar] [CrossRef]
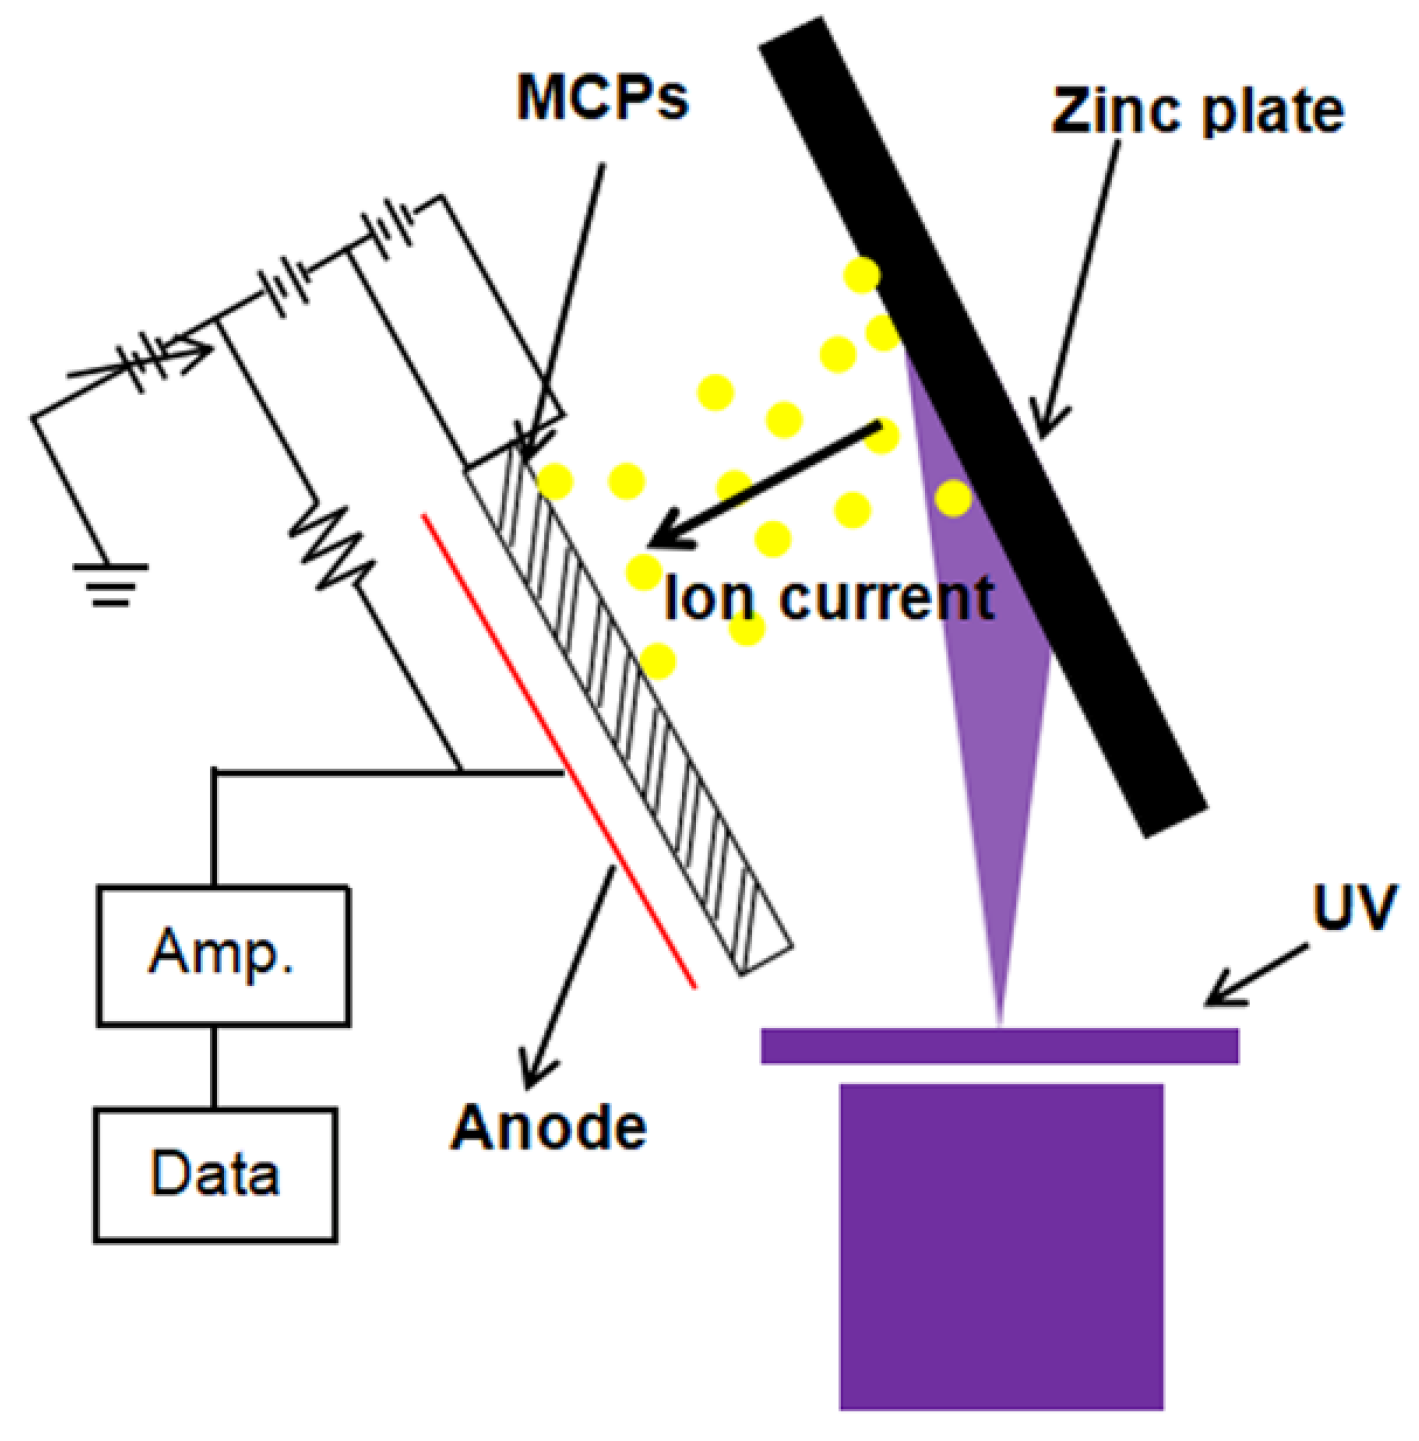
Figure 1. Schematic diagram of the platform used to measure the capture efficiency of MCPs.
Applsci 15 06301 g001
Figure 2. Scanning electron microscopy (SEM) images of (a) hexagonal MCP and (b) circular tapered MCP.
Applsci 15 06301 g002
Figure 3. Variance of the MCP signal with VM-Z obtained with and without UV irradiation.
Applsci 15 06301 g003
Figure 4. The data processing sequence diagram for obtaining the average pulse interval of MCPs. (a) A typical output signal of MCP; (b) the pulse signal obtained after binarization; (c) statistical diagram of the average pulse interval of the MCP microchannel plate.
Applsci 15 06301 g004
Figure 5. Influence of (a) operating voltage and (b) incident angle on the average signal intensity and pulse interval output by the MCP.
Applsci 15 06301 g005
Figure 6. (a) Schematic setup of the area-blocking experiment, (b) the graph depicts the relationship between measured pulse intervals and the OARs. Blue data points represent results derived from the area-blocking experiments, while red data points correspond to the actual measurements of MCPs with different open area ratios.
Applsci 15 06301 g006
Disclaimer/Publisher’s Note: The statements, opinions and data contained in all publications are solely those of the individual author(s) and contributor(s) and not of MDPI and/or the editor(s). MDPI and/or the editor(s) disclaim responsibility for any injury to people or property resulting from any ideas, methods, instructions or products referred to in the content.