1. Introduction and Related Work
Nowadays, it is essential to highlight that pedestrians are among the most Vulnerable Road Users (VRUs), and they represent one of the groups most severely affected by traffic incidents on European Union roads. According to the European Road Safety Observatory, pedestrians accounted for approximately 20% of all road fatalities in 2022, which means that one in five fatal accidents involved a pedestrian [
1]. Although there was a reported decline in road fatalities in 2023 and 2024 [
2], progress is still insufficient to achieve a truly safe environment for all road users. This data underscores the critical need for advancements in pedestrian behavior prediction (also referred to as crossing action prediction) and road safety measures to protect this vulnerable group and reduce accidents on the road. In light of this, many research communities have developed machine learning (ML) models and methods to make more robust prediction systems and to face the related challenges.
For a long time, most of these models and methods have been addressed through a diverse range of algorithms that can be considered
‘black boxes’ because they lacked the ability to explain the reasoning behind their predictions. Among these approaches, various models have been employed, including those based on Recurrent Neural Networks (RNNs), Convolutional Neural Networks (ConvNets), Long Short-Term Memorys (LSTMs), and more recently, Transformer-based architectures. We can highlight methods such as SingleRNN that focuses on leveraging contextual features and employing an encoder–decoder architecture powered by RNNs [
3]. Then, in [
4], the authors use a graph-based model and 2D human pose estimation to predict whether a pedestrian is going to cross the street. The method of CapFormer [
5] uses a self-attention alternative based on Transformer architecture. This method focuses primarily on bounding boxes, pose estimation, and AV speed. Additionally, a 3D Convolutional model (C3D) is employed, along with cropped regions of pedestrian bounding boxes from RGB video sequences, to facilitate spatiotemporal feature learning [
6]. Another study [
7] proposes an Stacked Fusion Gated Recurrent Unit (SF-GRU) approach composed of a five-layer stacked recurrent neural network that incrementally fuses multimodal features regarding pedestrian appearance, surrounding context, 2D body joint coordinates, bounding boxes over time, and ego-vehicle speed. Finally, we highlight the study by [
8], where the authors propose a Convolutional LSTM (ConvLSTM) network to capture spatiotemporal dependencies. This architecture extends the traditional LSTM by incorporating convolutional operations in both the input to state and state to state transitions. For pedestrian behavior prediction, the model takes as input a stack of images, processes them using a CNN to extract spatial features, and then feeds these features into the ConvLSTM to model temporal dynamics.
Furthermore, it is worth mentioning the benchmark developed by York University, which extensively assessed the performance of various ML approaches in the pedestrian behavior task. This benchmark not only standardized the evaluation criteria for the task but also introduced a model that combines the power of RNNs and 3D convolutions [
9].
Despite the growing number of models and research efforts dedicated to pedestrian behavior prediction, only a limited subset explicitly addresses explainability or is designed with interpretability as a core focus. It is important to emphasize that understanding why a machine learning model makes a specific prediction remains both a significant challenge and a critical requirement, particularly in safety critical domains where interpretability builds trust and supports informed decision-making.
Recent studies have begun to address this gap. For example, ref. [
10] highlights that Transformer-based architectures offer advantages in interpretability due to their attention mechanisms, which inherently reveal which parts of the input the model focuses on during prediction. Similarly, ref. [
11] introduces a dynamic Bayesian network that models the influence of interactions and social signals. This approach combines visual information with probabilistic inference techniques to provide transparent explanations, particularly by quantifying the relative importance of individual characteristics in shaping the predicted likelihood of pedestrian actions.
It is also worth noting that there is no universally accepted definition of interpretability and explainability within the machine learning community, and these terms are often used interchangeably [
12]. However, some authors such as [
13] emphasize the distinction between these concepts by framing them as questions: interpretability raises the question of
‘How does the model work?’ while explainability attempts to answer
‘What additional insights can the model provide?’ [
12]. Additionally, the term interpretability is often associated with the degree to which a human can comprehend the rationale behind a decision, while explanation refers to the response to a why question [
14]. In this paper, we use both terms complementarily to explain why the model predicts specific pedestrian behavior.
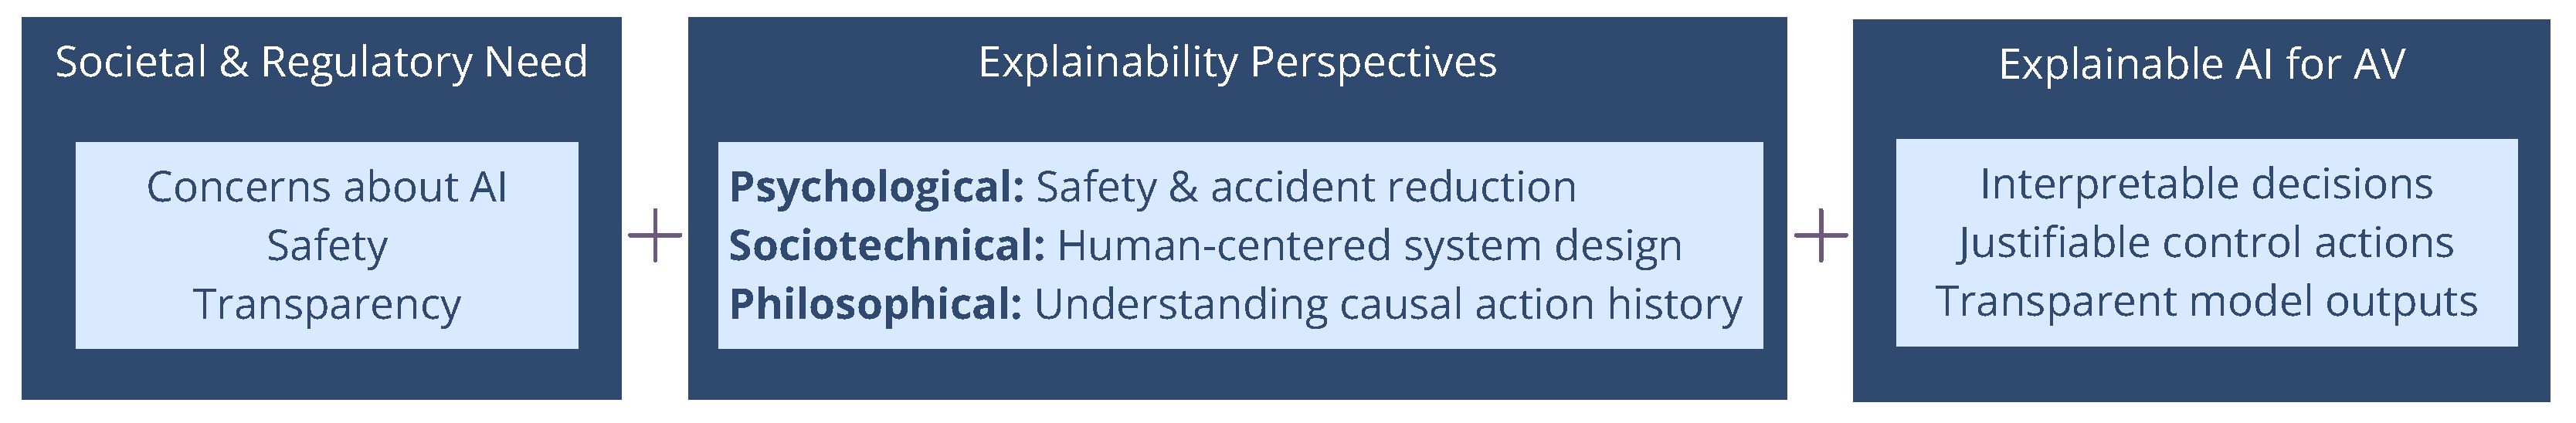
The explainability task, in the context of autonomous driving, has gained prominence due to the imperative need to clarify every decision made by the autonomous vehicles (AVs). This need arises from various disciplinary perspectives and opinions, centering on the issues and growing concerns caused by artificial intelligence (AI) systems, generating the necessity to establish regulations and standards that ensure control over their data and predictions made by the AV. The need for explainability is summarized in
Figure 1, which highlights the primary concerns related to societal and regulatory demands, the expectations from explainable AI, and various perspectives on explainability [
15].
On the other hand, it is crucial to acknowledge that the success of machine learning projects is significantly influenced by the quality and relevance of the datasets used for model, training, and testing. In fact, a well-chosen dataset has the potential to enhance the accuracy and efficiency of the model, whereas an inaccurate selection can yield unfavorable results. Furthermore, the characteristics of the datasets play a crucial role in shaping the behavior of a model. It is essential to consider that a model’s performance in real-world scenarios may be compromised if its deployment context significantly differs from the training and evaluation datasets [
16]. Moreover, it is important to highlight that a well-chosen dataset can play a key role in facilitating the extraction of explainable features from pedestrian behavior datasets. For instance, there are studies that aim to comprehensively document the creation and utilization of datasets through the development of datasheets. These datasheets provide valuable information regarding the motivation behind dataset creation, composition details, collection processes, preprocessing techniques, distribution methods, besides data usage and maintenance guidelines [
16]. Similarly, research efforts are being dedicated to various aspects of datasets, such as tracking and controlling dataset versions [
17] and exploring data provenance [
18]. It is important to highlight that there are some data selection methods which focus on choosing the most informative training examples for machine learning tasks across a specific dataset [
19]. Nevertheless, it is worth noting that the topic of dataset selection approaches is relatively under-discussed within the ML research community.
Regarding the pedestrian behavior datasets, there are numerous datasets which include pedestrian annotations. A dataset like Targeted Action Priors Network (TITAN) [
20] concentrates on a range of pedestrian actions, including motion, communicative, and contextual actions but does not explicitly incorporate the crossing action in their dataset approach. Conversely, datasets such as Stanford-TRI Intent Prediction (STIP) [
21], JAAD [
22], and PIE [
23] explicitly include crossing actions within their dataset approach. The crossing action labels are crucial to this study, as they enable the identification of pedestrian behavior in specific road situations. These labels are used as the ground truth in this work.
JAAD Dataset: The JAAD dataset is a richly annotated collection consisting of 348 short video clips. It features a diverse range of road users across various driving environments, including different locations, traffic scenarios, and weather conditions. The dataset’s annotations are categorized into spatial, behavioral, contextual, and pedestrian-specific information. Approximately 72% of the pedestrians in the dataset actively engage in street crossing, while the remaining 28% do not.
PIE Dataset: The creators of JAAD released a new dataset called PIE, which contains over 300K labeled video frames recorded in Toronto in clear weather. In addition to the similar type of annotations found in JAAD, PIE stands out by incorporating ego-vehicle information derived from On-board diagnostics (OBD) sensors. Distinguished from the JAAD dataset which primarily focuses on pedestrians intending to cross, the PIE dataset provides annotations for all pedestrians in close proximity to the road, irrespective of whether they attempt to cross in front of the ego vehicle or not. Furthermore, in contrast to the annotated pedestrian action in the JAAD dataset, the PIE dataset also exhibits an imbalance where a larger proportion of pedestrians are observed not crossing the street. Specifically, approximately 39.2% of pedestrians actively cross the street, whereas the remaining 60.8% do not engage in street crossing.
Building on the provided context and emphasizing the importance of both explainability and dataset selection into the autonomous driving context, this work proposes a novel neuro-symbolic approach that integrates symbolic reasoning with neural perception to enhance transparency and interpretability. We aim to develop an explainable pedestrian behavior predictor and evaluate the data selection process through a series of experiments conducted on this predictor. The proposed method employed multiple explainable features extracted from the JAAD and PIE datasets which were used for mining fuzzy rules. Subsequently, these rules were used to define a fuzzy inference system that provides the pedestrian behavior prediction. This approach is particularly novel, as it not only focuses on accurate prediction but also establishes a baseline for explainability.
The rest of the paper proceeds as follows: Details about the proposed pipeline for the Neuro-symbolic approach are introduced in
Section 2.
Section 3 describes the implementation, and the experimental setup is presented in
Section 4. The results and discussions are presented in
Section 5. The guidelines and recommendations regarding feature selection, dataset selection, and explainable prediction are introduced in
Section 6. Finally,
Section 7 presents the conclusions and future work.
2. Proposed Method
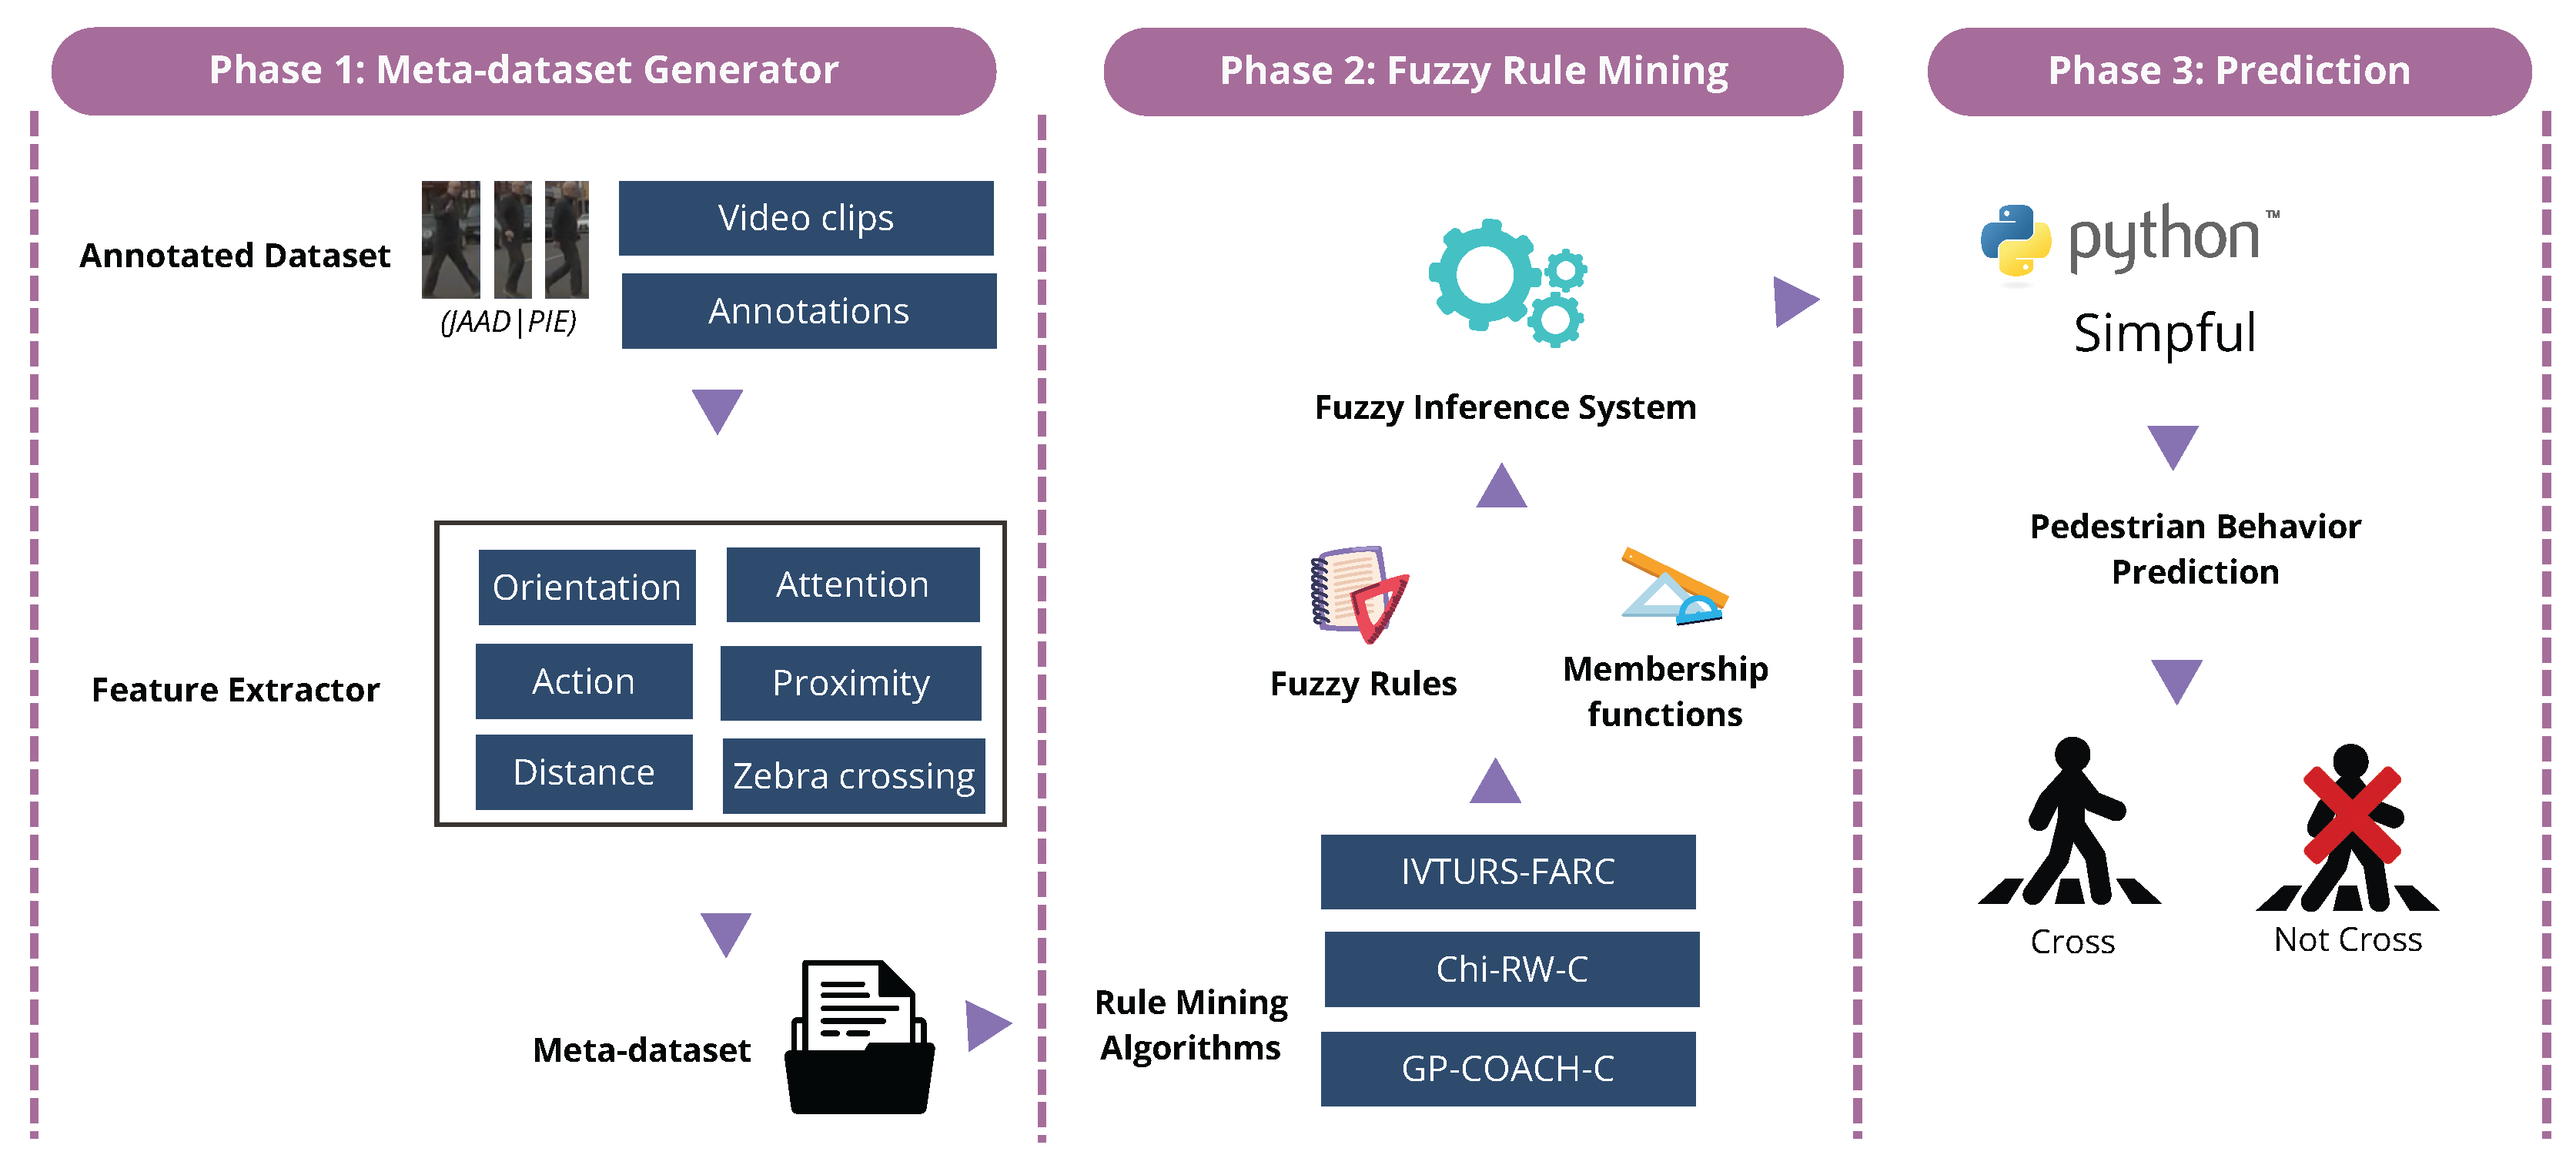
In this work, we propose a neuro-symbolic model predictor which is based on fuzzy logic and deep learning for feature extraction and requires a pipeline of three main steps: (1) meta-dataset generator, (2) fuzzy rule mining, and (3) crossing prediction. As can be observed in
Figure 2, the pipeline starts with the annotated meta-dataset and ends with the pedestrian behavior prediction (whether the pedestrian will cross the road or not) including the probability of the crossing behavior.
The following section outlines the conceptualization and definition of the three phases.
2.1. Phase 1: Meta-Dataset Generator
The first phase involves the potential of feature extraction which begins with the pedestrian action dataset (JAAD and PIE) consisting of videos, images and annotations, then a feature extractor component is employed to extract features using deep learning and neural networks, creating a meta-dataset that contains the extracted features for each pedestrian. It is important to highlight that the meta-dataset maintains a balance between the number of pedestrians who cross the street and those who do not. This balanced representation ensures that the extracted fuzzy rules are equally informed by both scenarios.
As mentioned previously, our approach focuses on providing insights into the explainability of the pedestrian behavior predictor, with an emphasis on considering the overall processing pipeline. In particular, we aim to ensure that the pedestrian-related inputs are inherently explainable. To support this goal, we identified a set of features that offer meaningful contextual information and contribute to a comprehensive representation of road user behavior.
The selection of these features was guided by a contextual analysis of various road scenarios, interpreted from both the driver’s and the pedestrian’s perspectives. This analysis allowed us to capture the key elements that influence pedestrian behavior and driver decision-making, ensuring that the model is grounded in real-world dynamics. By incorporating features that reflect how road users perceive and respond to their environment, we enhance the interpretability and relevance of the predictive model in practical applications.
Therefore in this study, we carefully choose six features to serve as inputs for the pedestrian behavior predictor. Among these features, five are derived through the implementation of neural networks, while one feature is obtained directly from the pedestrian crossing datasets. The following list outlines the selected features:
Body Orientation. This describes the pedestrian posture through an angle from 0° to 360°.
Attention. This describes the attention of the pedestrian, indicating whether the pedestrian is looking at the ego vehicle.
Action. This describes the motion state of the pedestrian, classifying between the following actions: stand, walk, wave, run, or undefined (used when the pedestrian action is not clear).
Proximity to the road. This describes if the pedestrian is near the road. This feature is classified into three levels according to the pedestrian closeness to the road: near, medium distance, or far.
Zebra Crossing. This represents the presence of a zebra crossing in the scene.
Distance to ego vehicle. This represents the estimated distance between the pedestrian and the ego vehicle.
2.2. Phase 2: Fuzzy Rule Mining
During this phase, the meta-dataset was utilized to extract fuzzy rules and membership functions using fuzzy rule learning algorithms. Several algorithms were evaluated, including Chi-RW-C [
24], GP-COACH-C [
25], and IVTURS-FARC [
26]. Among these, IVTURS-FARC was selected due to its superior performance and promising preliminary results in generating fuzzy rules from the meta-dataset.
IVTURS-FARC is a linguistic fuzzy rule-based classification algorithm that employs interval-valued restricted equivalence functions to enhance rule relevance during the inference process. Its fuzzy rule learning process is based on the FARC-HD algorithm [
27]. The extracted fuzzy rules take the following form as outlined in ref. [
26]:
where
represents the label of the
jth rule,
is an nn-dimensional pattern vector corresponding to pedestrian features in this study,
denotes an antecedent fuzzy set representing a linguistic term,
is the class label, and
is the rule weight [
28].
During the fuzzy rule mining process, membership functions were generated to define the shape and characteristics of the fuzzy sets. Then, the fuzzy inference system was established using Takagi–Sugeno (TS) fuzzy inference model [
29], which enables the representation of nonlinear systems through a set of fuzzy rules and zero-order output values, where the consequent parts are linear state equations.
To provide a clearer understanding of the fuzzy inference procedure, the behavior prediction output
is defined according to
2.3. Phase 3: Prediction
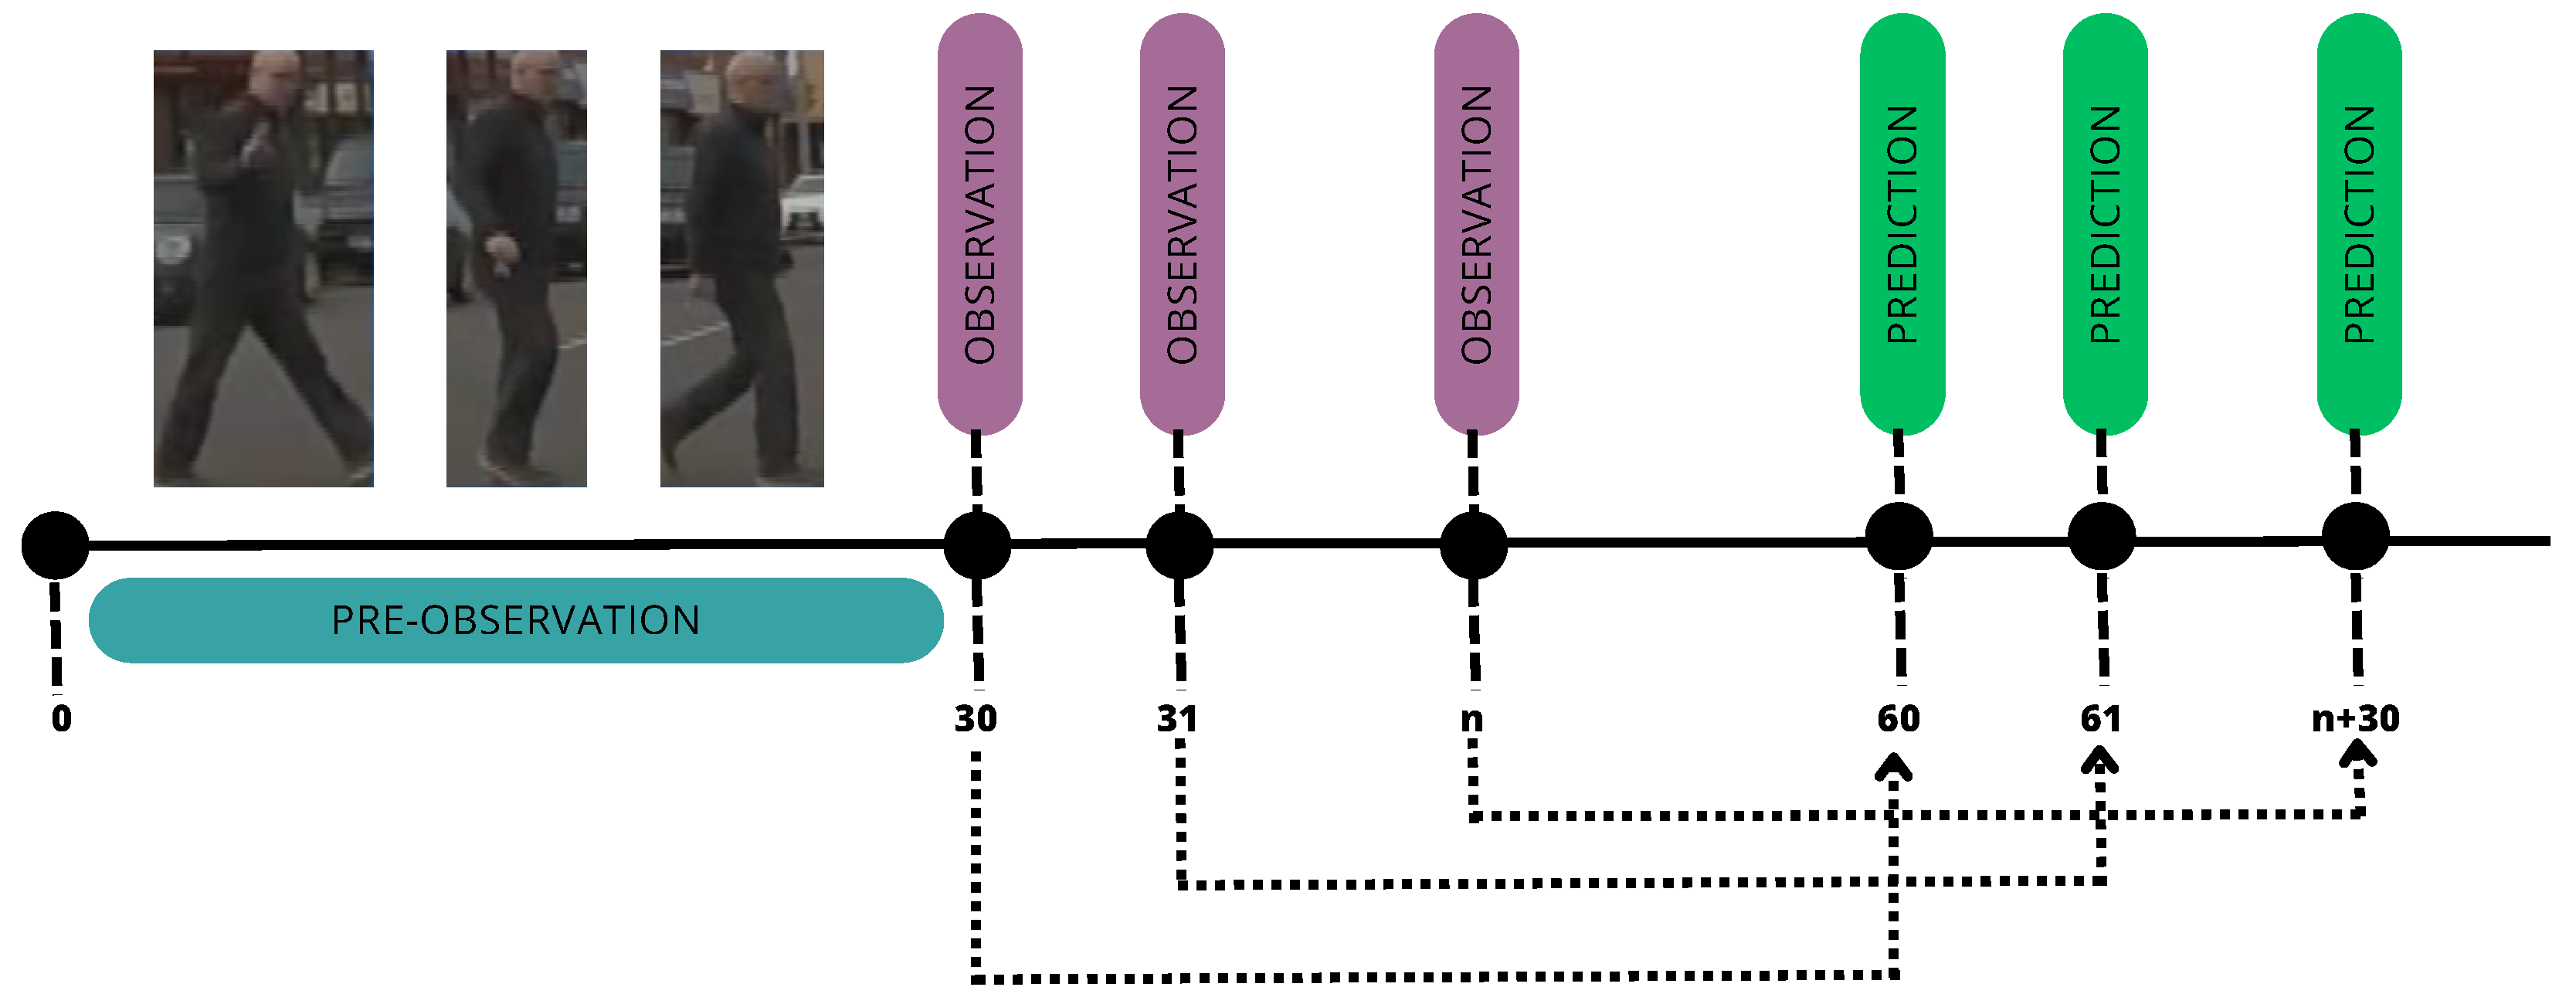
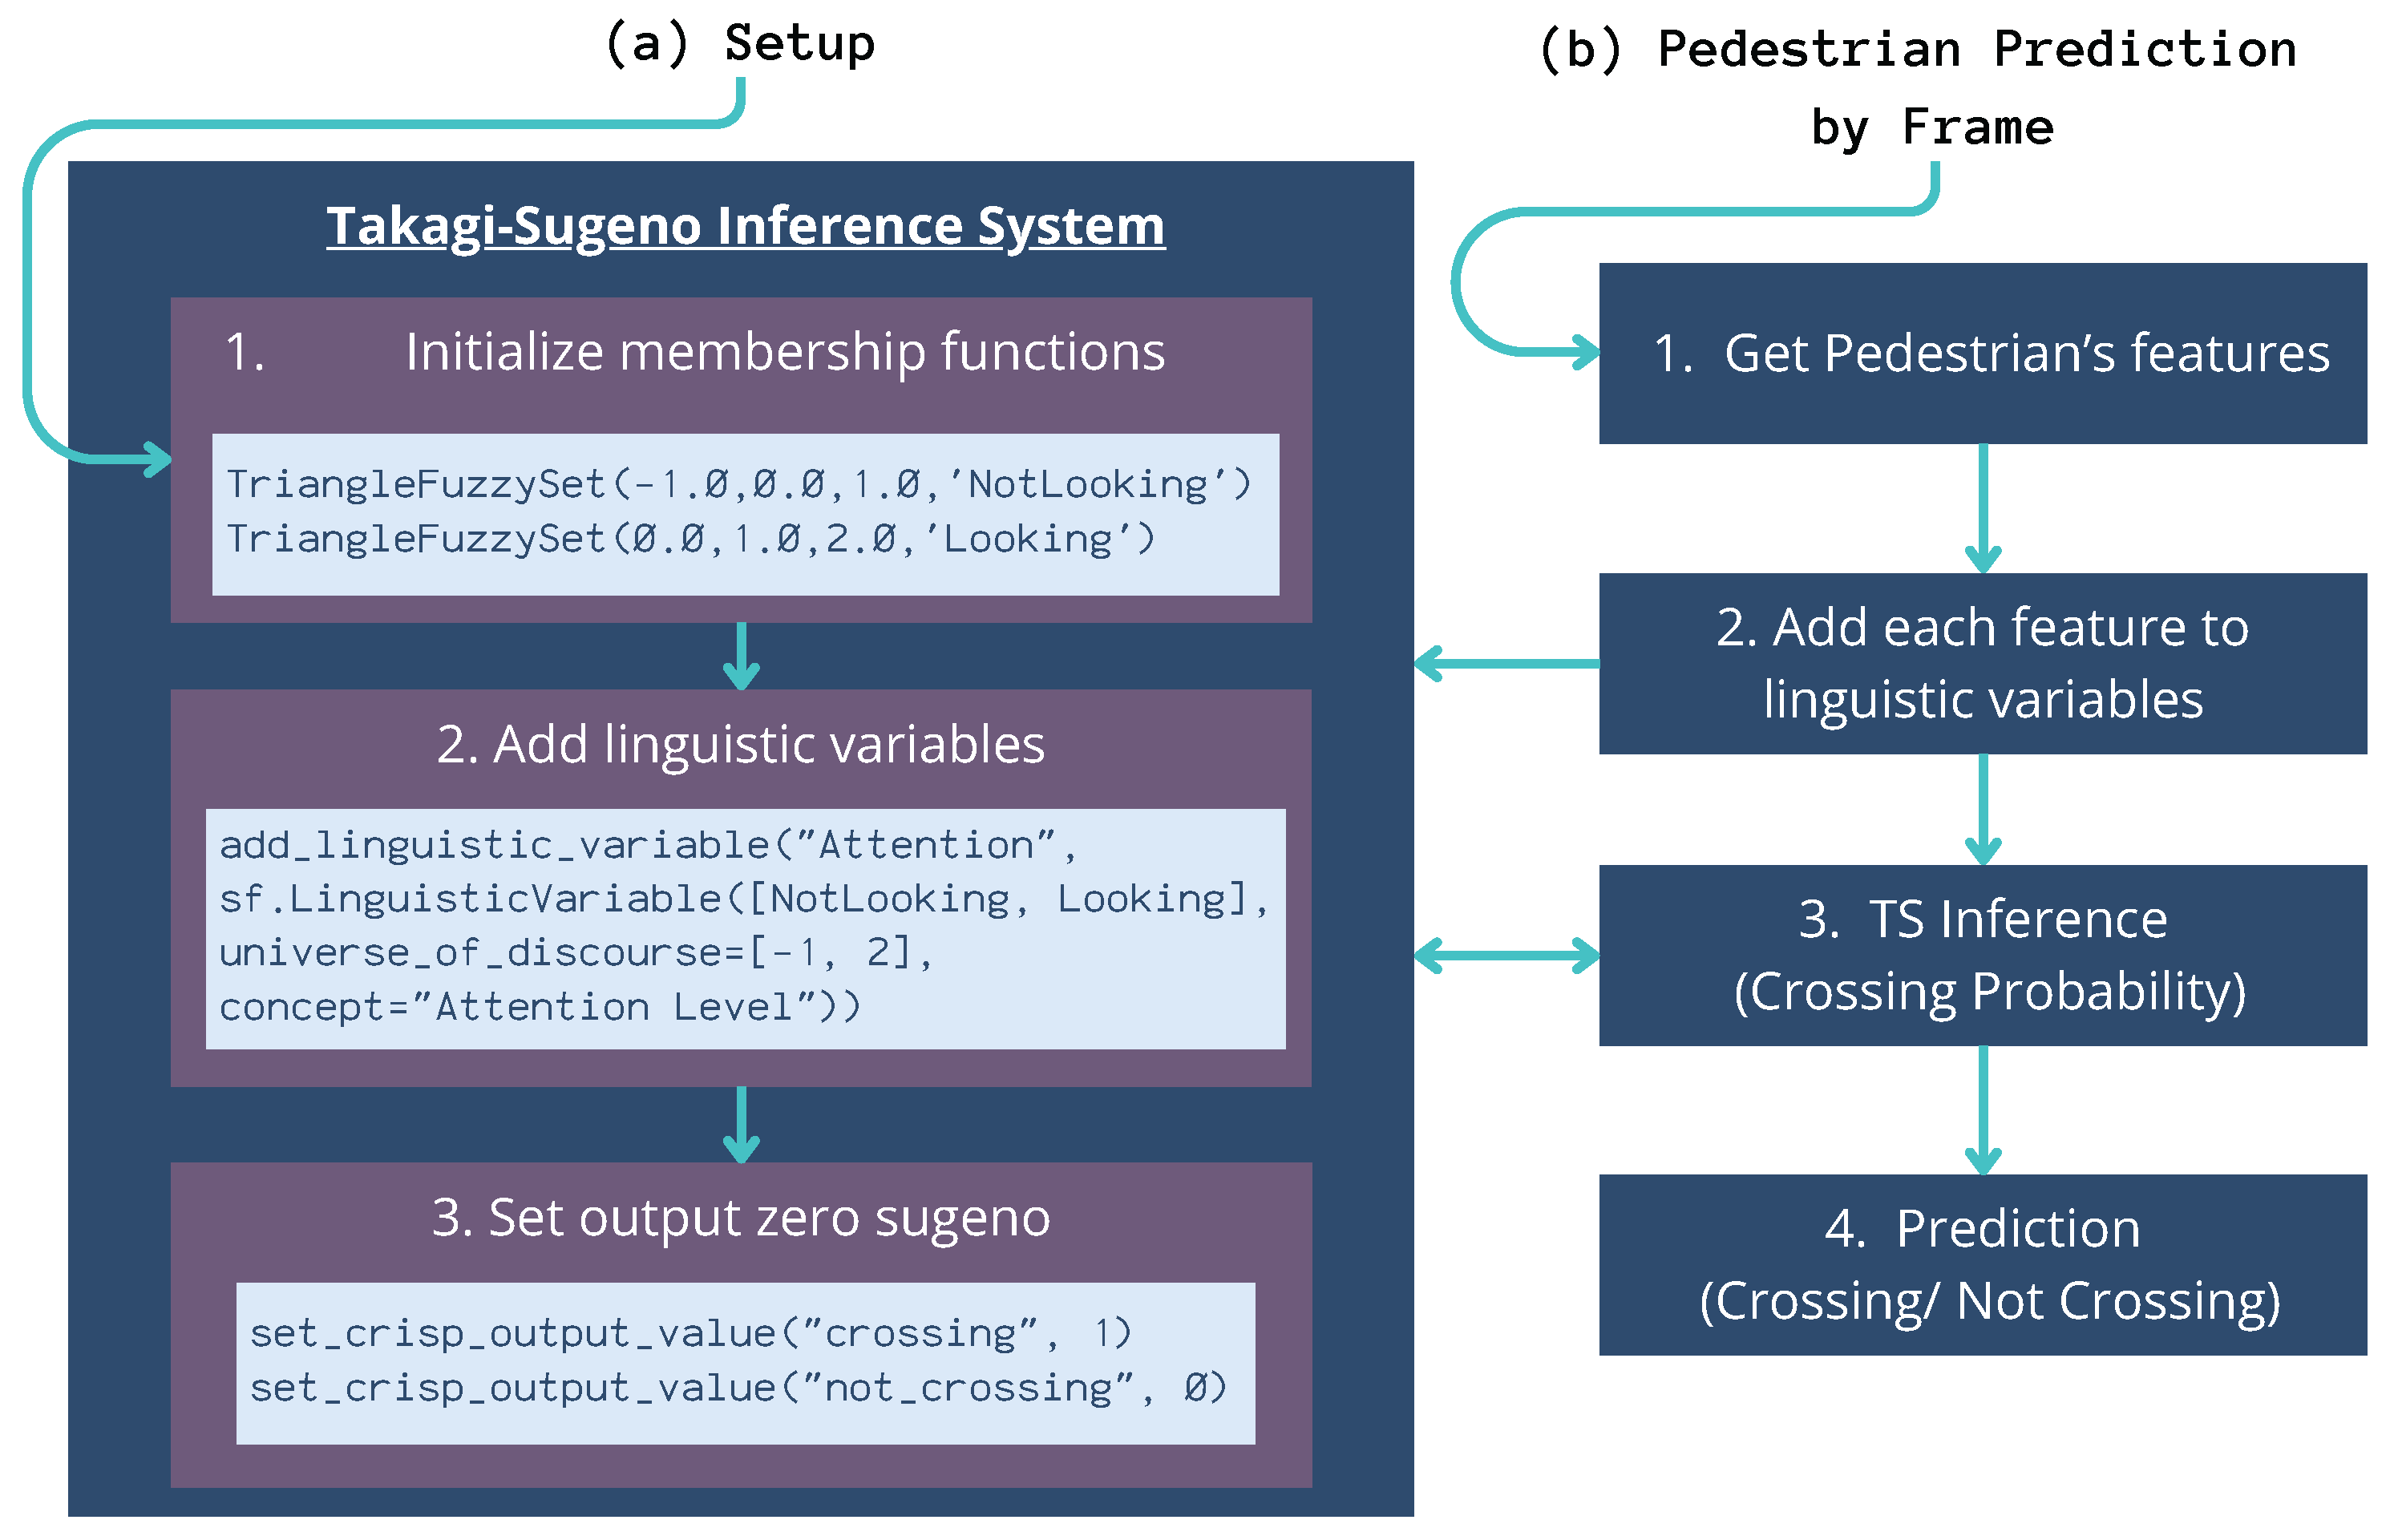
The pedestrian behavior prediction system was defined by integrating the pedestrian features defined on
Section 2.1 as input, utilizing the TS fuzzy inference system, and incorporating the fuzzy rules and membership functions established in phase 1 of this pipeline. The pedestrian behavior predictor operates by analyzing 30 frames as the pre-observation period, followed by using a single frame as the observation time to predict pedestrian behavior for the upcoming second (See
Figure 3).
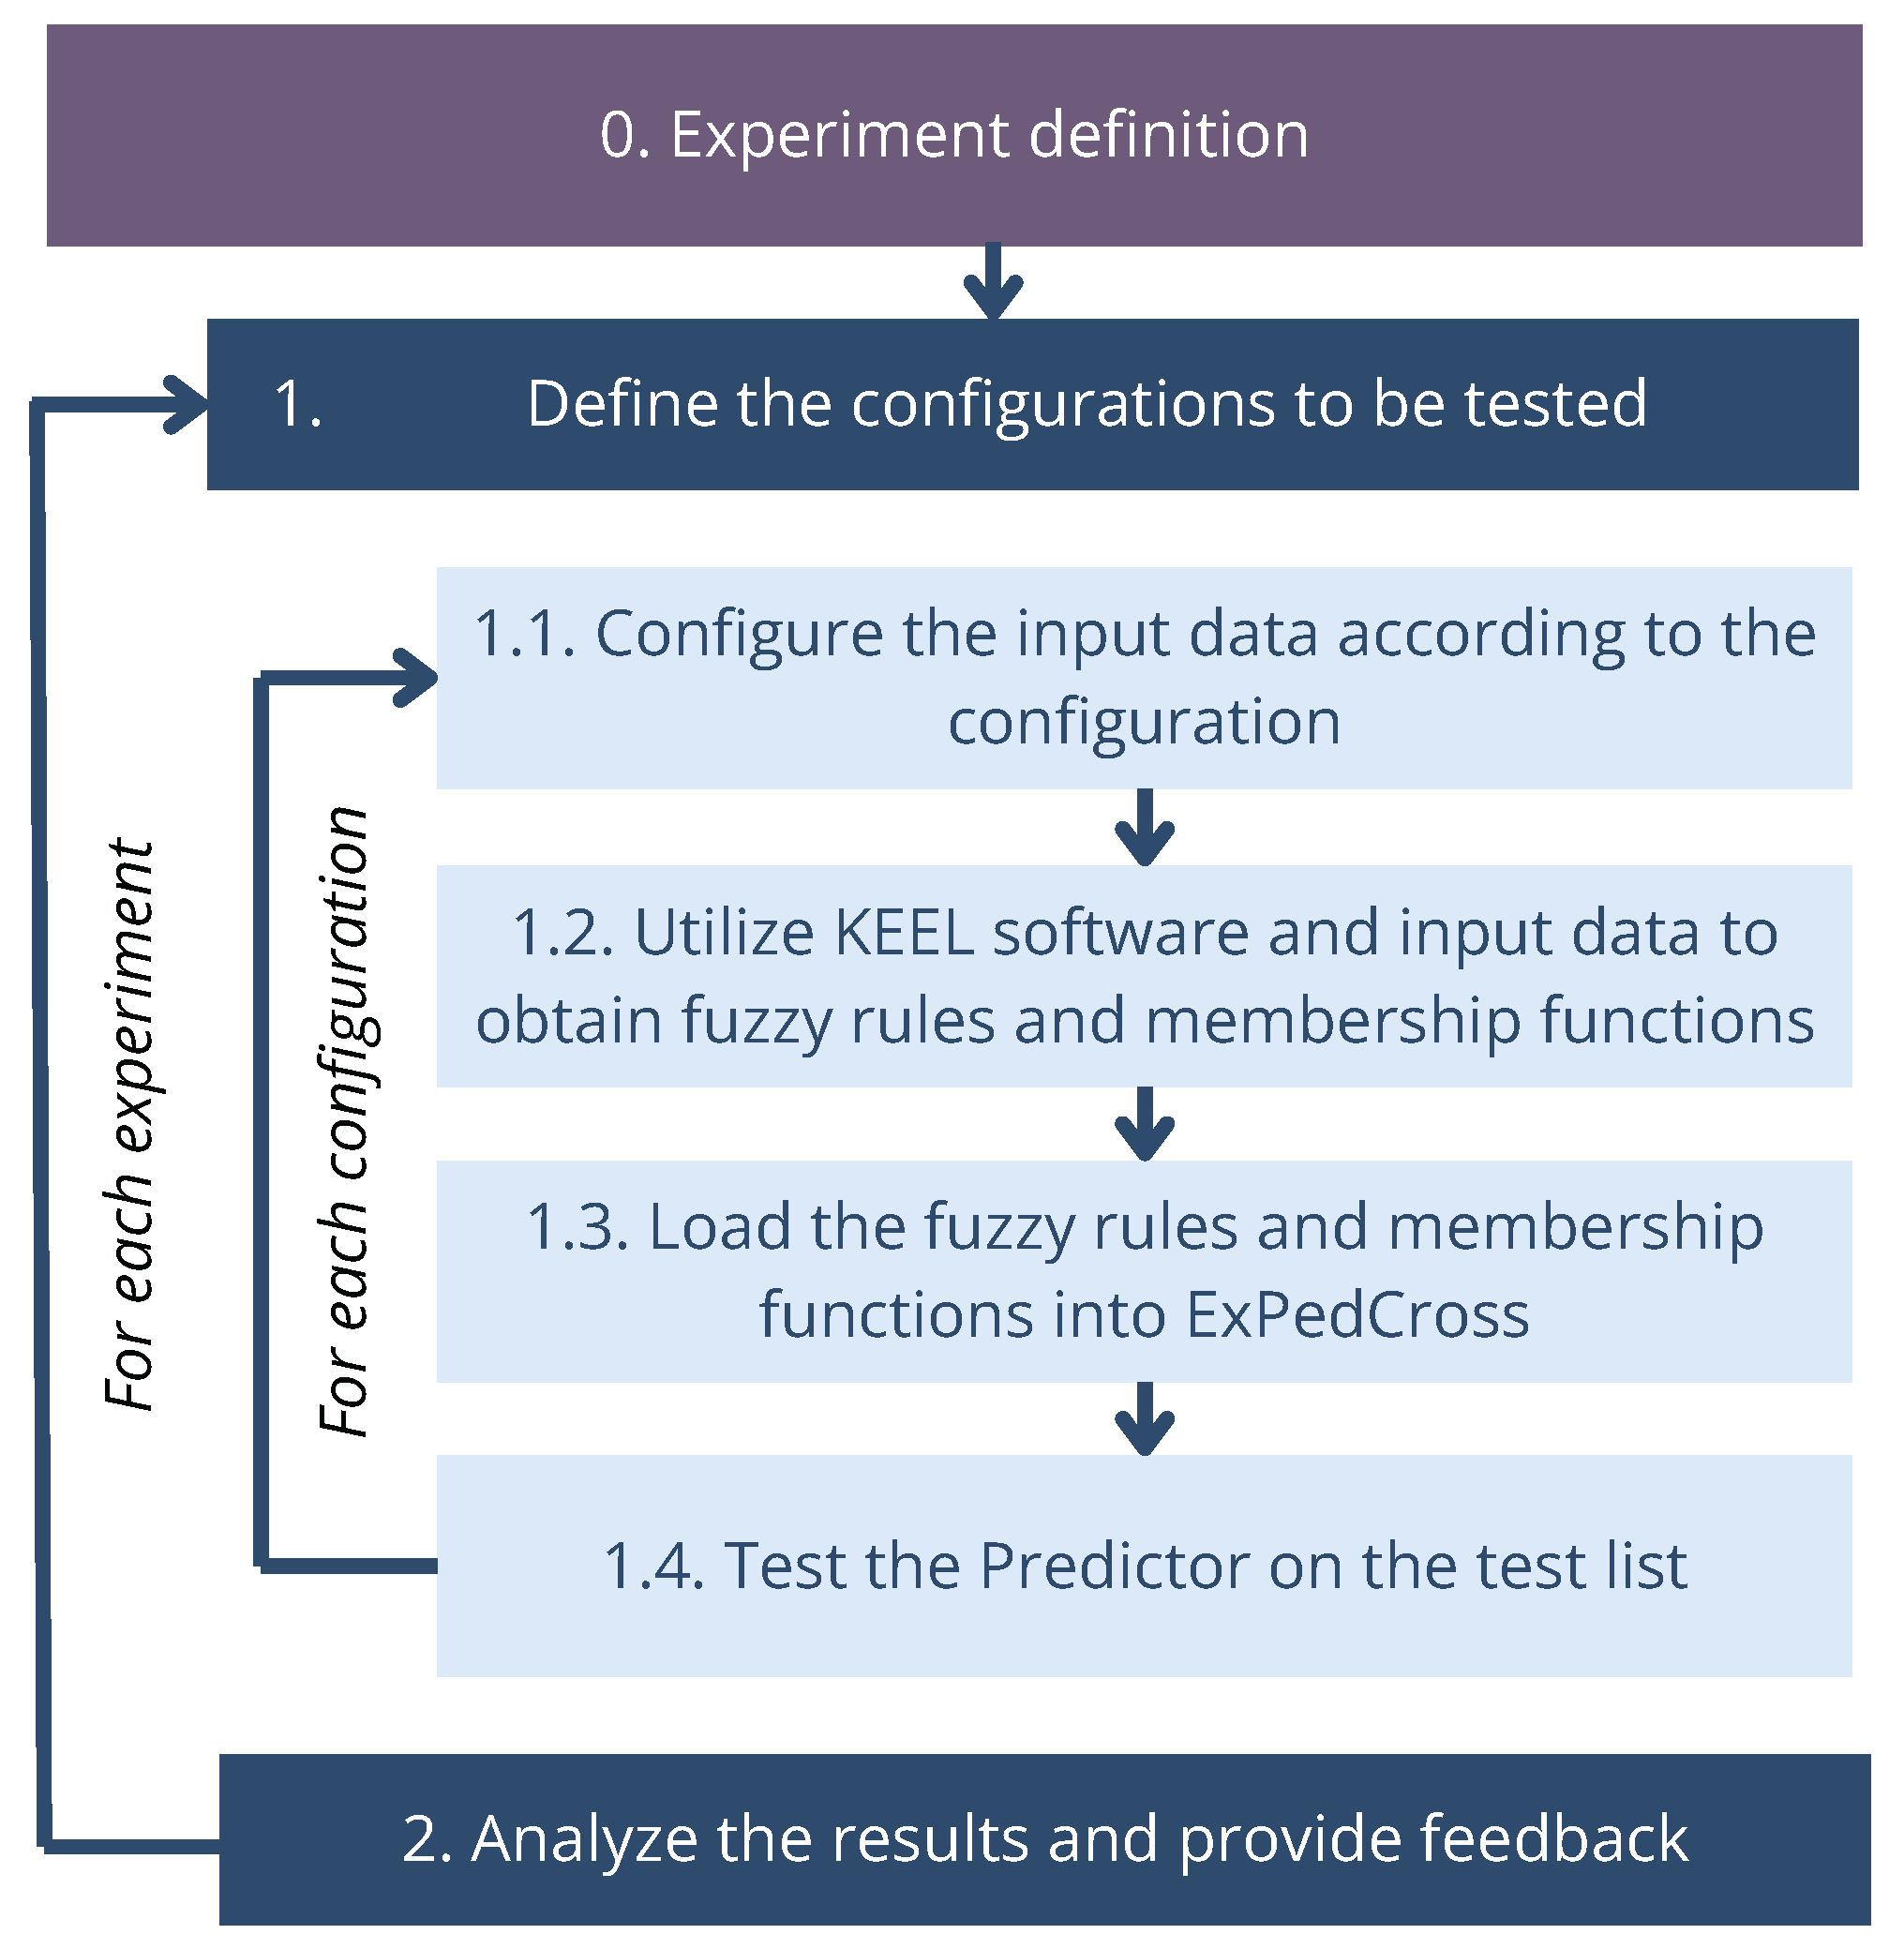
5. Experimental Results and Discussion
The following section presents the experimental results from the five previously mentioned experiments, with a focus on the pedestrian behavior prediction task. Additionally, key guidelines and recommendations derived from these experiments are provided.
5.1. Experiment 1—Dataset Quantity
In the context of ML, one of the most crucial decisions in model training is determining the optimal amount of data to use. The first experiment aimed to answer the following question: Does increasing the amount of training data improve the prediction performance?
To investigate this, we designed a set of incremental data configurations for both PIE and JAAD, gradually increasing the number of data rows. Each row represents the state and pedestrian features for one frame.
As can be observed in
Table 3, the process began with 2000 rows (
J2K and
P2K), evenly balanced between pedestrians who cross and those who do not. The dataset size was then progressively expanded to include 4000 rows (
J4K and
P4K), 8000 rows (
J8K and
P8K), 10,000 rows (
J10K and
P10K), and then 14,000 rows (
J14K and
P14K). Since the PIE dataset is larger, we conducted additional experiments with 20,000 rows (
P20K) and 80,000 rows (
P80K).
By systematically expanding the dataset, we observed that increasing the amount of data within the same dataset can enhance the predictor’s performance. However, this improvement does not necessarily translate to better results across different datasets. According to the accuracy and F1 score results, better performance is observed in configurations that do not include the maximum amount of data. This finding suggests that, for a pedestrian behavior predictor based on fuzzy logic, simply increasing the dataset size does not guarantee better generalization. Moreover, as shown in
Table 3, a higher number of fuzzy rules does not always lead to better performance. Notably, one of the best-performing configurations over the PIE dataset,
P80K, achieved optimal results with the fewest rules of only 36 among all tested configurations.
In addition, it is important to highlight that the J14K configuration, based on JAAD, demonstrated the best average performance across both datasets. This is particularly noteworthy because J14K contains 66,000 fewer records than the P80K configuration and provides similar performance over the PIE dataset. A possible explanation for this outcome is that JAAD videos contain a more diverse set of scenarios and pedestrian behaviors, enabling a better understanding of the factors influencing the crossing decision.
5.2. Experiment 2—Data Preprocessing
This experiment aimed to assess the impact and significance of data selection and filtering in achieving accurate results from the pedestrian behavior predictor. The primary objective was to validate the hypothesis that careful data filtering is essential to generate meaningful fuzzy rules.
To test this hypothesis, we explored various configurations with incremental dataset sizes both with and without frame restrictions defined in
Section 3.1:
For JAAD:
- –
J14K—The filtered 14,000 rows configuration from Experiment 1.
- –
J14Kn—The 14,000 rows configuration without data filtering.
- –
J30Kn—The 30,000 rows configuration without data filtering.
For PIE:
- –
P80K—The filtered 80,000 rows configuration from Experiment 1.
- –
P80Kn—The 80,000 rows configuration without data filtering.
- –
P160K—The 160,000 rows configuration without data filtering.
By comparing these configurations, we aimed to determine whether unfiltered data introduce noise that negatively impacts the extraction of reliable fuzzy rules, ultimately affecting predictor performance.
As shown in
Table 4, data selection and filtering played a crucial role in the generation of effective fuzzy rules. The results indicate that rules derived from datasets with frame restrictions consistently outperformed those generated from unfiltered data, leading to improved performance of the pedestrian behavior predictor.
5.3. Experiment 3—Randomness
The objective of this experiment was to determine whether incorporating human reasoning in the selection of videos for fuzzy rule generation could enhance the performance of the pedestrian behavior predictor or if random selection would be sufficient to achieve accurate results. To evaluate this hypothesis, we compared the results against the J8K and P14K configurations from Experiment 1—dataset quantity.
As outlined in the data distribution (See
Section 4.1), before selecting input data for the fuzzy rule mining process, videos were systematically ranked based on their quality and relevance to pedestrian behavior prediction. This experiment introduced six additional configurations, each containing the same number of records as
J8K (8000 records) and
P14K (14,000 records) but with randomly selected videos contributing to the training set used for mining the fuzzy rules.
According to the results presented in
Table 5, random data selection can enhance the performance of the explainable predictor within its own dataset, taking into account both accuracy and F1 score. Notably, the
J8KR3 and
P14KR1 configurations achieved the best results for JAAD and PIE, respectively. However, the process of analyzing and systematically ranking videos based on relevance, quality, and contextual suitability proved to be beneficial. This structured approach not only improved the predictor’s overall performance but also contributed to its generalization capabilities across different datasets.
5.4. Experiment 4—Features Ablation
This experiment aimed to explore the relationship between different pedestrian features and their impact on prediction performance. It built upon the best performing configurations from Experiment 1, specifically J14K and P80K.
To assess the significance of each feature, the input data for the fuzzy rule mining process was systematically modified by removing one feature at a time from
J14K and
P80K. This approach allowed us to evaluate how the absence of each feature influenced the predictor’s accuracy.
Table 6 presents the results of the different configurations tested:
According to the results, the most influential feature for JAAD was Proximity, while for PIE, the most critical features were Distance and Action. This conclusion is based on the drop in prediction performance observed when these features were removed from the input data during the fuzzy rule learning process (i.e., the J14K-NotProximity and P80K-NotDistance configurations). The significant decline in accuracy highlights the essential role these features play in pedestrian behavior prediction.
Additionally, during cross-testing, it was observed that Orientation and the Zebra crossing label from JAAD and the Distance from PIE had a negative impact on the results. This suggests that these features are not consistently represented across datasets. Variability in how these features are defined and labeled in different datasets can introduce inconsistencies, reducing the predictor’s ability to generalize across different environments.
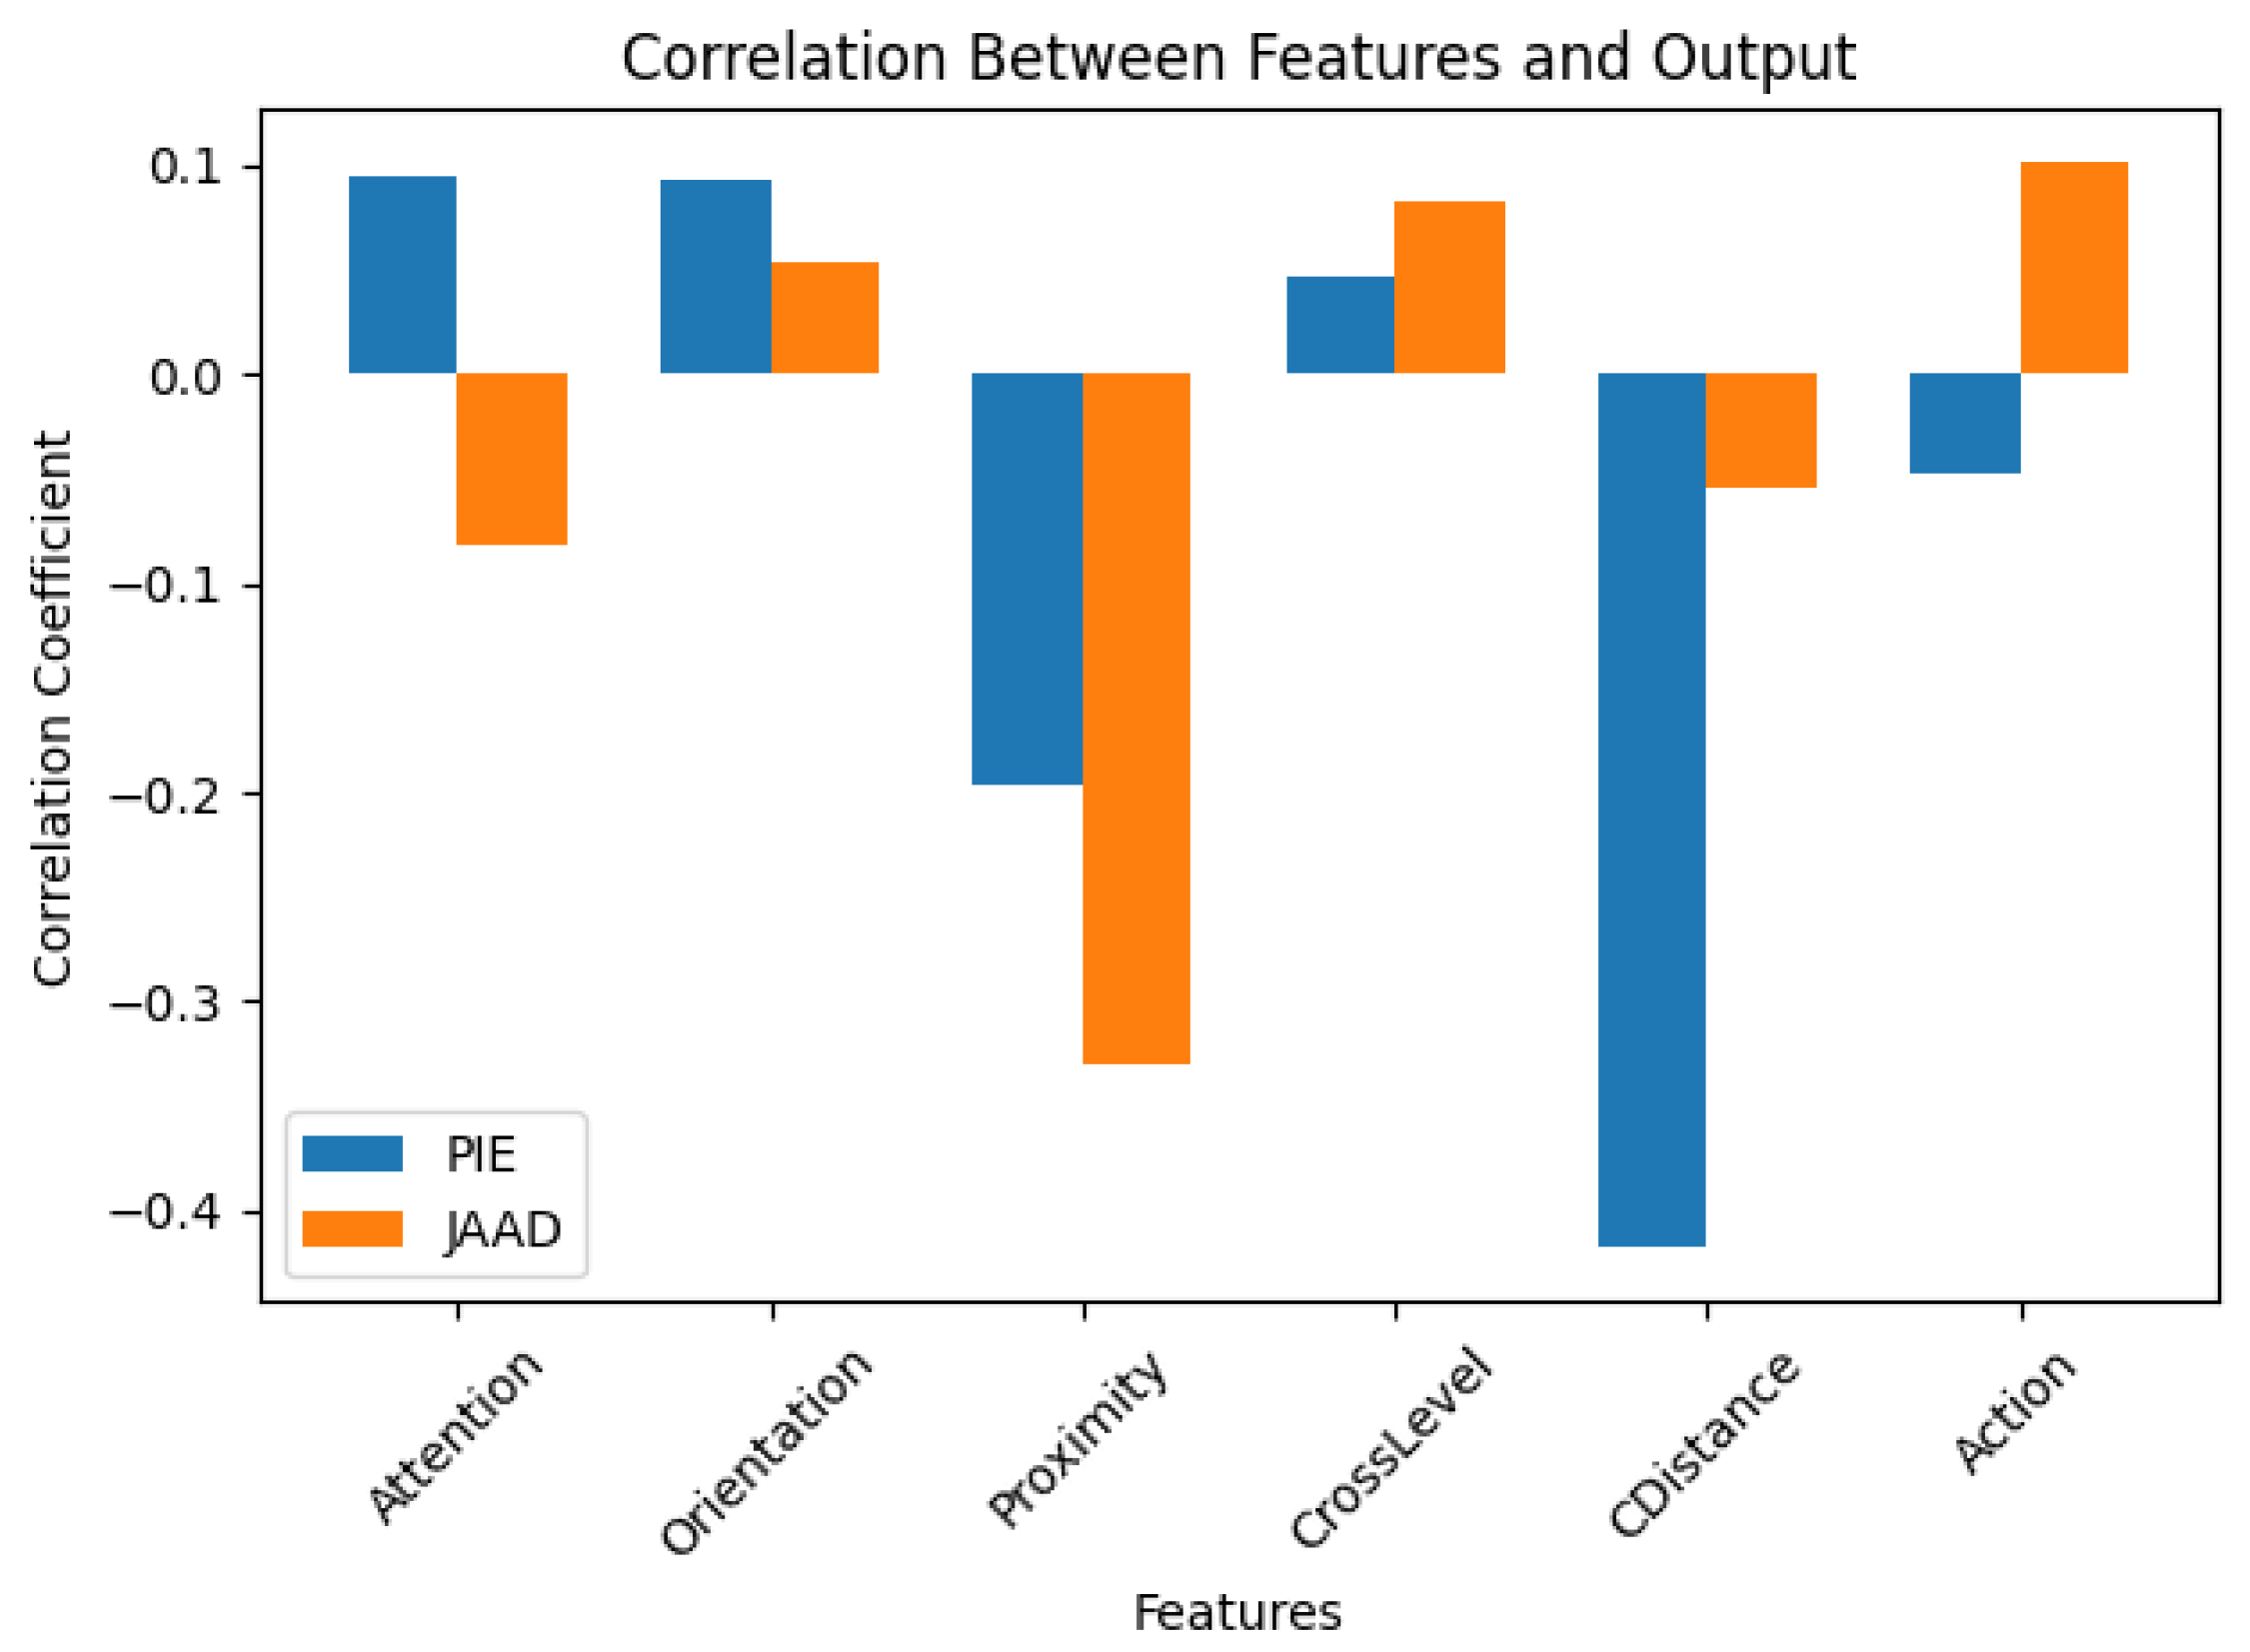
To further investigate the relationship between features and pedestrian behavior, a correlation analysis was conducted using data from the
J14K and
P80K configurations. As illustrated in
Figure 8, the pedestrian behavior exhibits a slight positive correlation with the pedestrian action in JAAD. This suggests that as the pedestrian’s action class increases (see
Table 1), the likelihood of crossing also increases.
Moreover, a moderate negative correlation was found between proximity to the road and crossing likelihood in both JAAD and PIE. This indicates that pedestrians closer to the road are more likely to cross. Similarly, in the PIE dataset, a moderate negative correlation was identified between crossing action and pedestrian distance, implying that pedestrians closer to the ego vehicle have a higher probability of crossing.
These findings underscore the importance of carefully selecting and interpreting features to ensure that the predictor captures meaningful patterns across different datasets. Conversely, the remaining pedestrian features do not show a strong correlation with the pedestrian’s decision to cross. This indicates that, on their own, the evaluated features are not sufficiently representative to accurately predict pedestrian crossing behavior. Instead, they should be complemented with additional features that provide more contextual and informative cues, enhancing the overall predictive capability of the model.
5.5. Experiment 5—Incorporation of Diverse Datasets
The primary objective of this experiment was to determine whether the performance of the explainable predictor improves when training data from multiple datasets is combined. To investigate this, three training configurations were designed, integrating data from both JAAD and PIE during the fuzzy rule mining process. These configurations are defined as follows:
J8K-P8K: Consists of 8000 records from each dataset.
J10K-P10K: Includes 10,000 records from each dataset.
J14K-P80K: Incorporates 14,000 records from JAAD and 80,000 records from PIE.
These configurations were selected to analyze the impact of different dataset proportions on the model’s ability to generalize across diverse pedestrian behavior scenarios.
As shown in
Table 7, combining datasets to generate the training input results in only a marginal improvement in performance during cross-testing. In the JAAD dataset there is not a clear improvement neither in the accuracy nor F1 score, while in the PIE dataset, there are improvements. This outcome suggests that the limited performance gain is likely due to the datasets containing similar scenarios, reducing the potential benefits of data fusion.
5.6. Analysis of the Explainability of the Experimental Results
Based on the results obtained from the five experiments mentioned, we have summarized the best performing configurations of the pedestrian behavior predictor. These results are presented in
Table 8 and include fuzzy rules trained with the following datasets: (1) 14,000 records from ordered JAAD videos (
J14K), (2) 14,000 records from randomly selected JAAD videos (
J14KR3), and (3) a combined dataset of 10,000 records from PIE and 10,000 records from JAAD (
J10K-P10K).
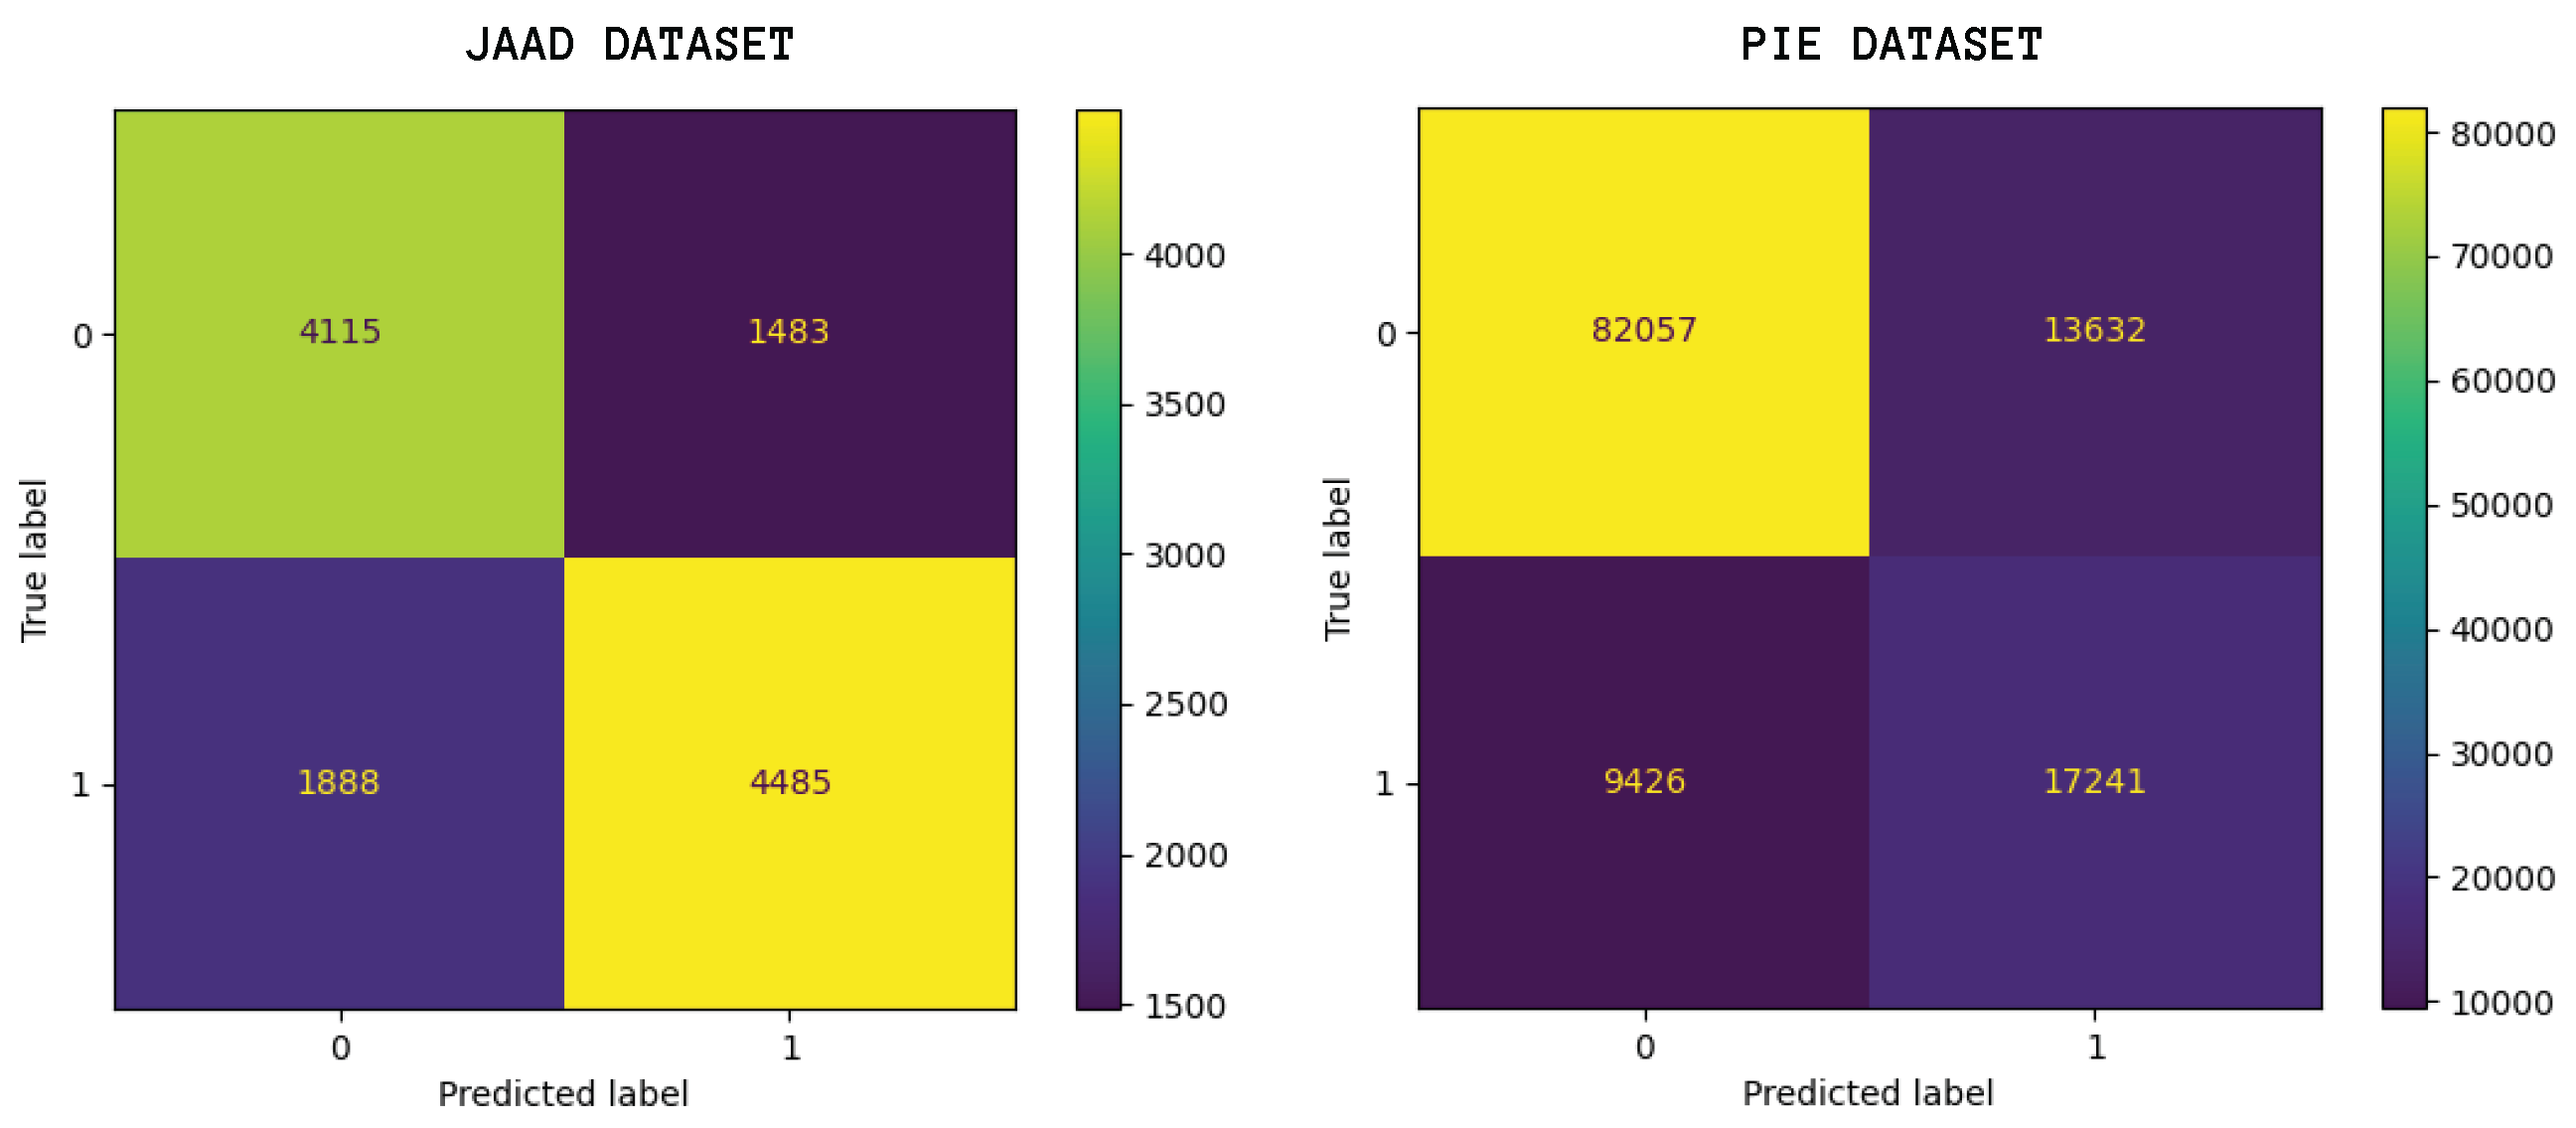
It is important to note that the results of these configurations are associated with balanced mispredictions between the two pedestrian behaviors (crossing or not crossing) as can be observed in the confusion matrix shown in
Figure 9. This confusion matrix was elaborated from the results provided using the J10K-P10K configuration.
In the JAAD dataset, mispredictions occur in 26% of cases where the model predicts a pedestrian will cross when they actually will not, and in 29% of cases where the model predicts a pedestrian will not cross when they actually will. In contrast, for the PIE dataset, 14% of predictions incorrectly classify a pedestrian as crossing when they are not, while 35% of predictions fail to detect actual crossing behavior. This analysis suggests that the F1 score remains unaffected because the predictor achieves high accuracy in at least one of the classification categories, balancing the overall performance despite specific misclassifications trends.
Table 9 presents a comparison between the best results we obtained and some state-of-the-art approaches based on the benchmark [
9]. According to the table, although the neuro-symbolic approach does not show a significant improvement in terms of accuracy and F1 score, the key advantage of our method lies in producing explainable predictions, from the input to the final result. Nevertheless, our model J8KR3 provides more consistent results on the JAAD dataset.
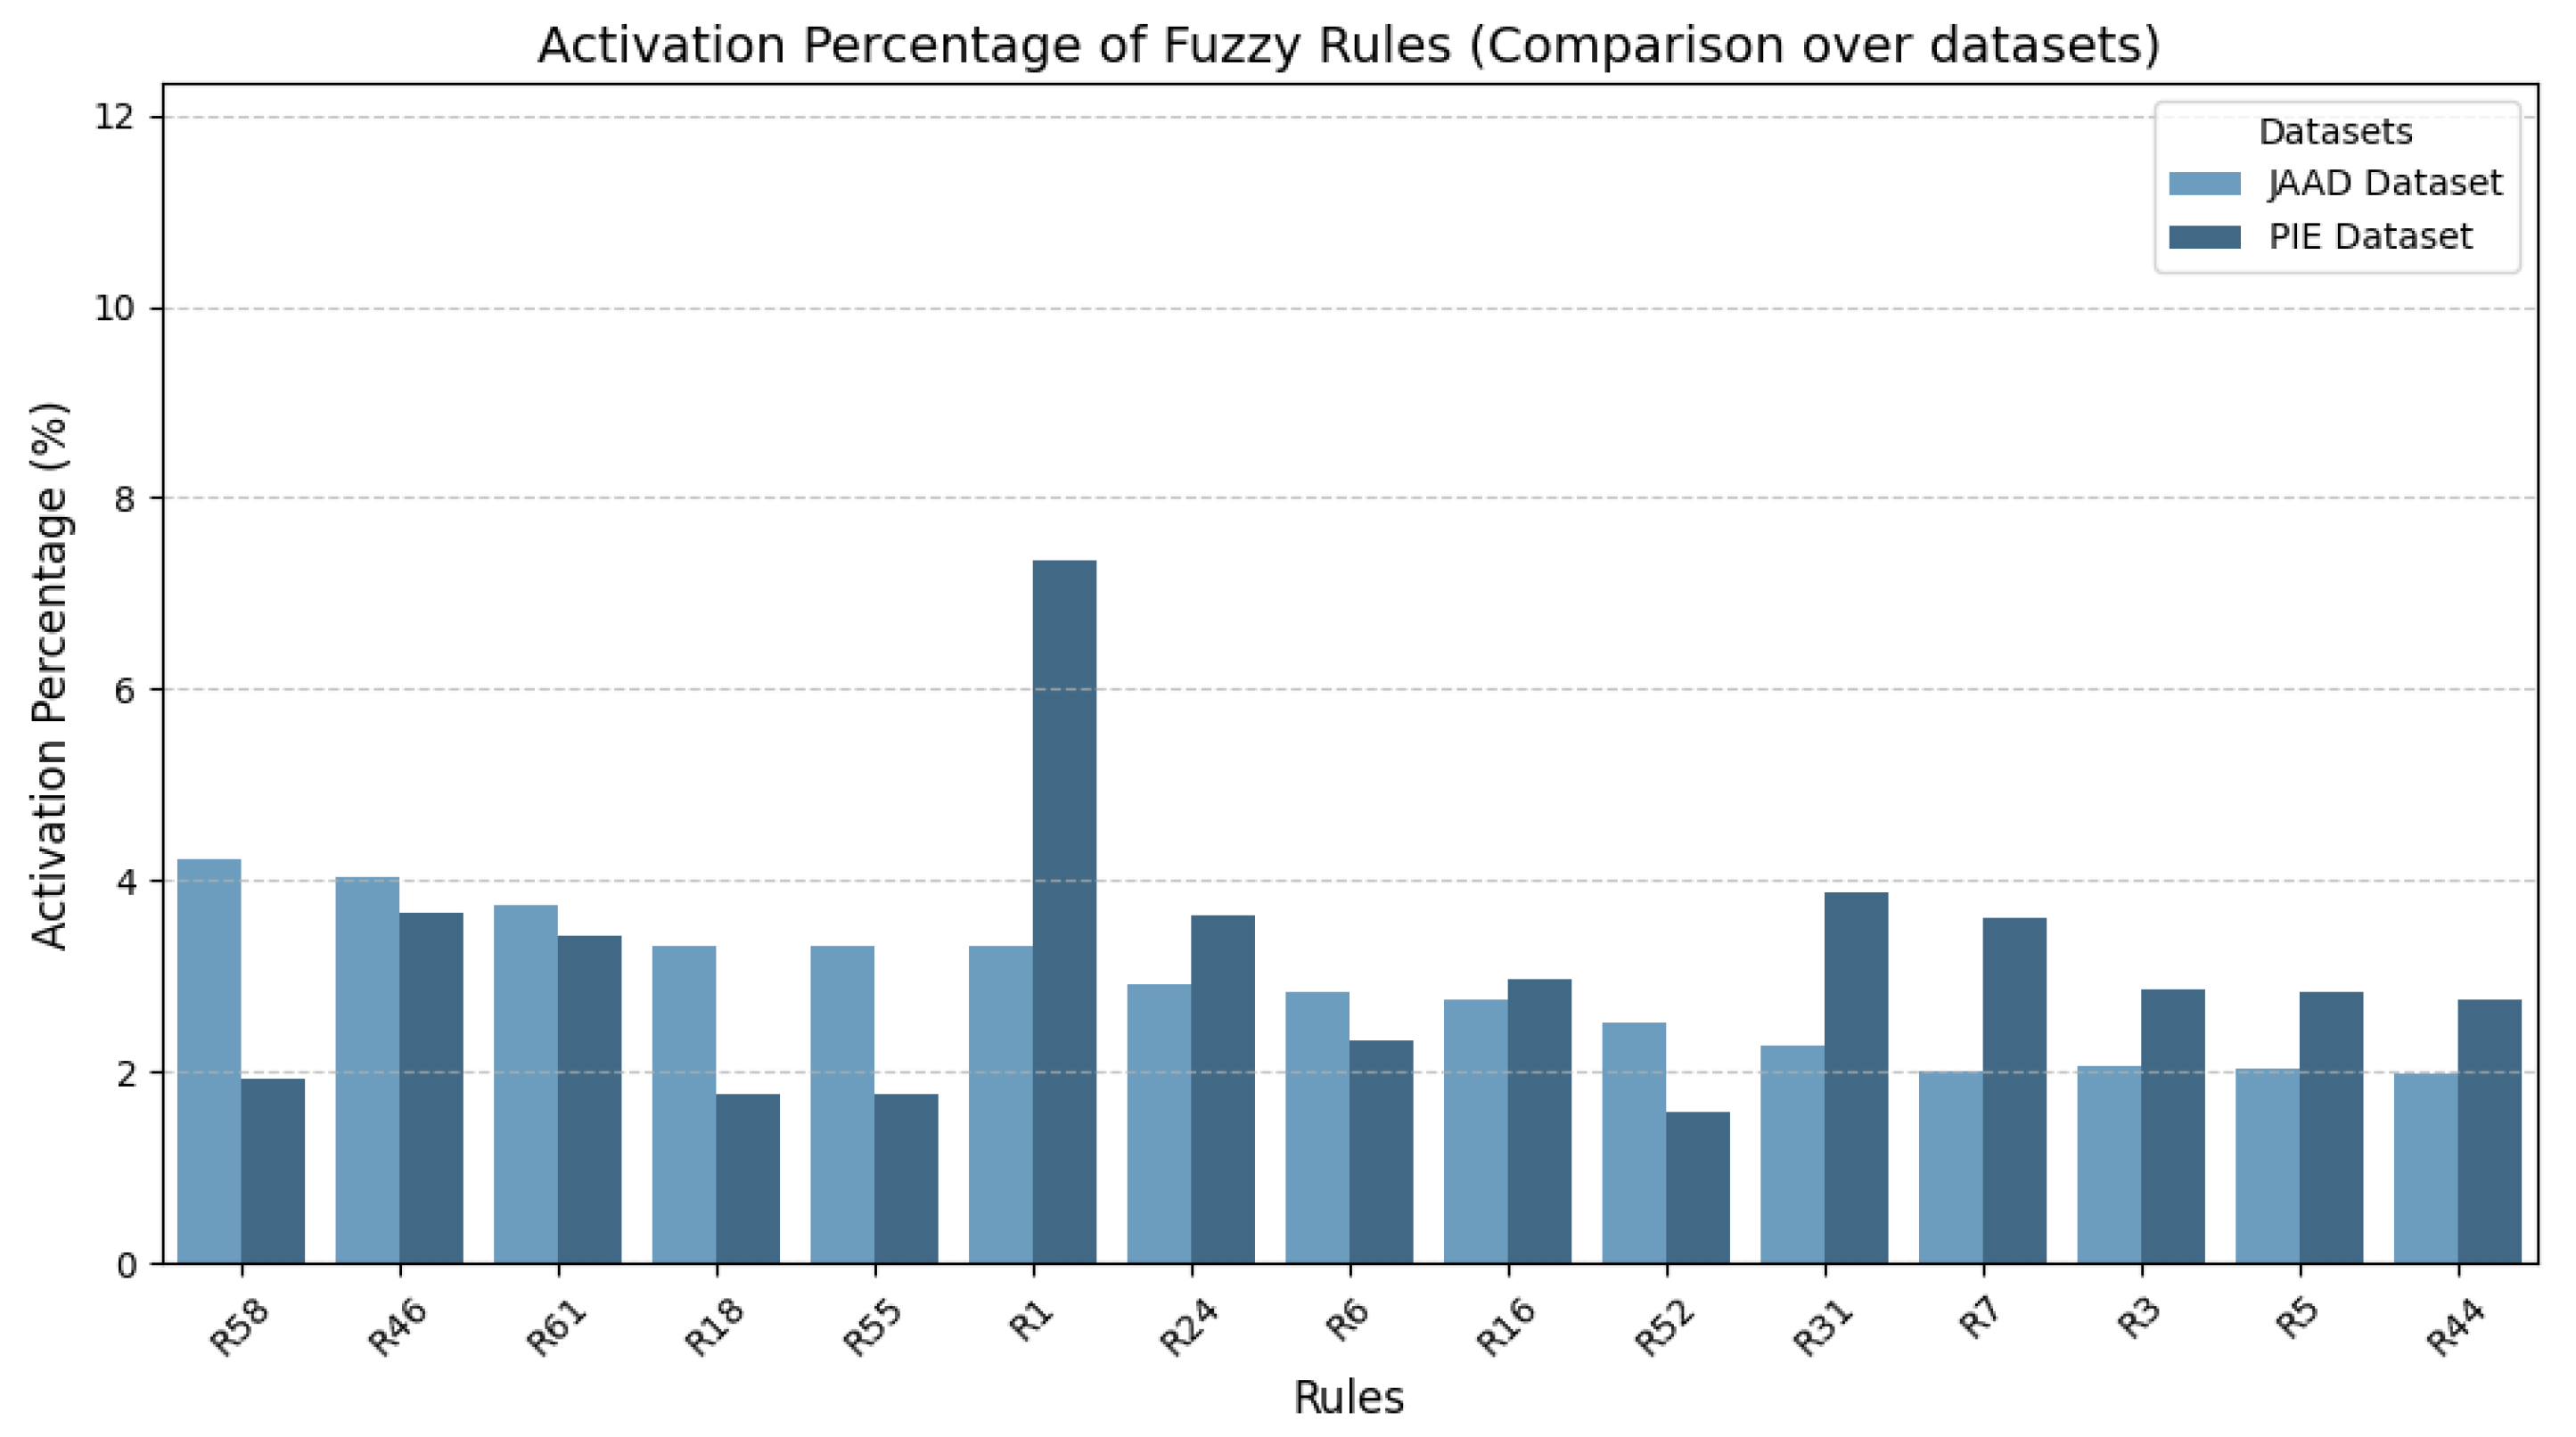
Regarding explainability, we performed an analysis using the best performing configuration,
J10K-P10K composed by 64 rules to examine the fuzzy rules activated by the pedestrian behavior predictor when assessing pedestrian crossing behavior in the
and
test sets. As is shown in
Figure 10, over the
it is evident that three primary rules (Rule 58, Rule 46, and Rule 61) are activated most frequently, while the remaining rules display a relatively similar activation percentage. In contrast, within the
dataset, there is a significant disparity between the most frequently activated rule and the other fourteen. Rule 1 was the most frequently activated, occurring 7.34% of the time.
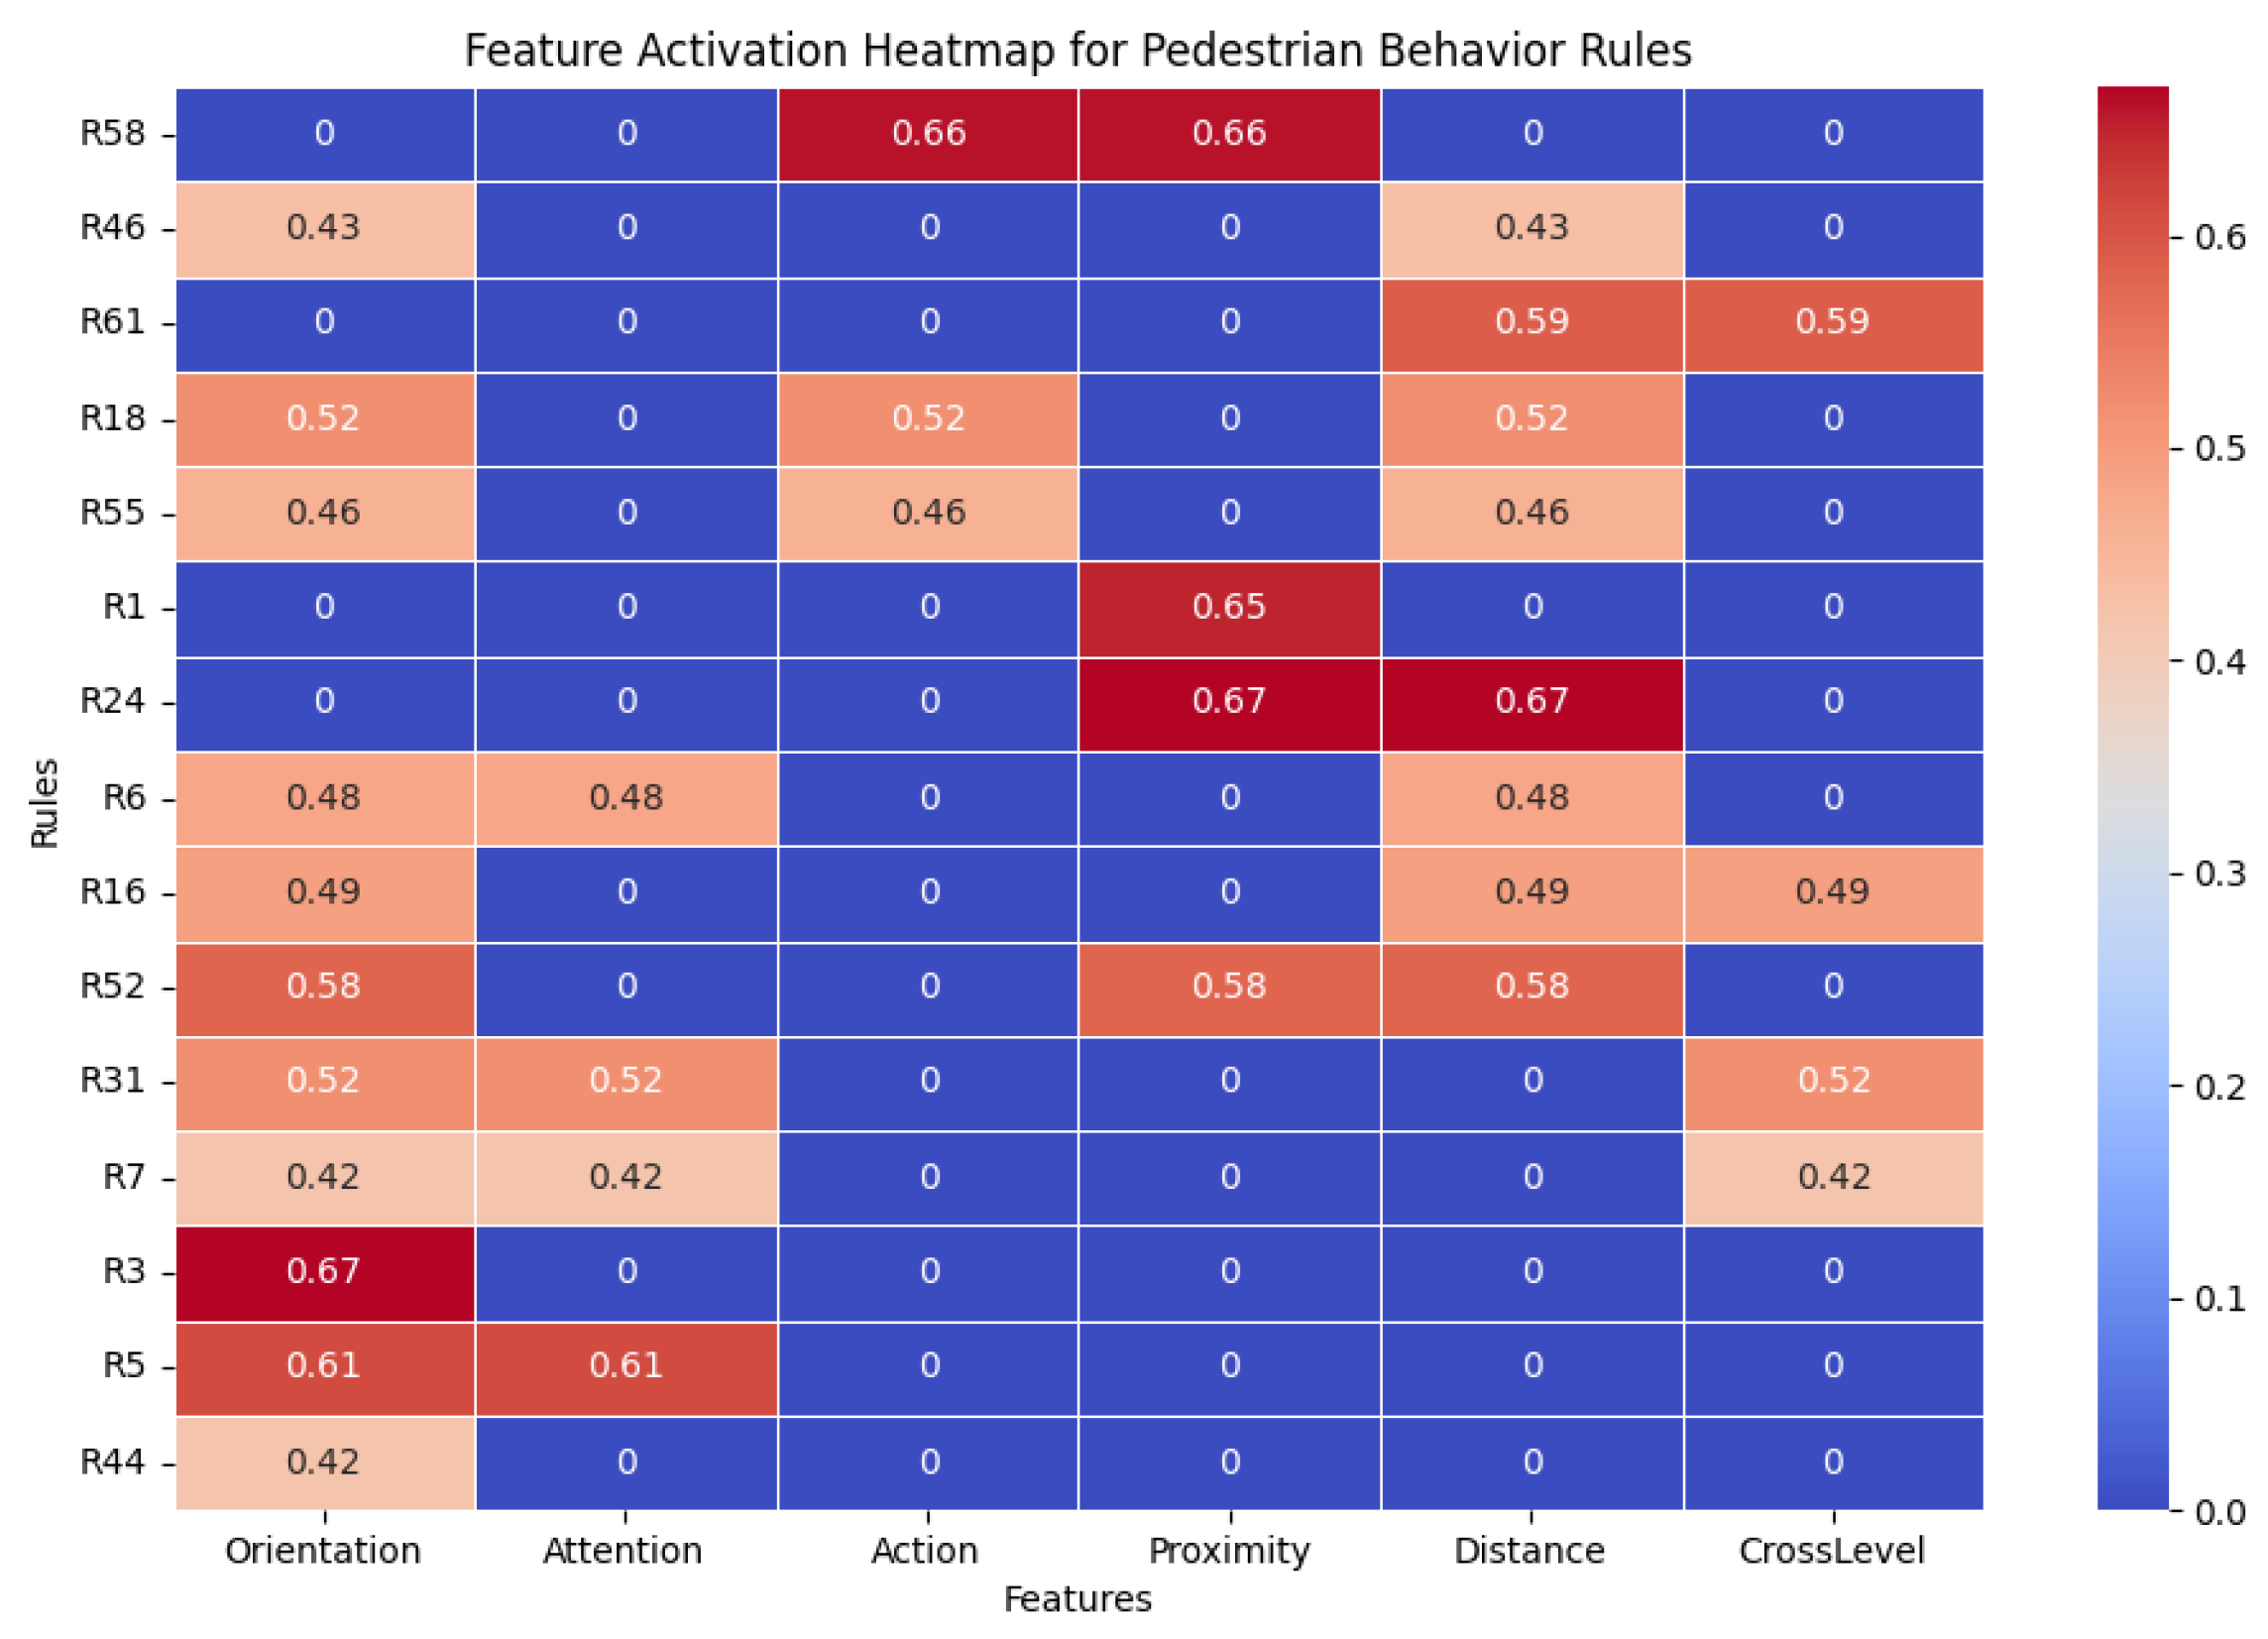
Figure 11 presents the distribution and impact of pedestrian features on the most activated fuzzy rules. From an explainability perspective, the most frequently activated rules offer preliminary insights into why a pedestrian chooses to cross and how explainable features support decision-making transparency.
Proximity and
Distance emerge as the most influential factors as evidenced by the high weights in rules where these features are present.
Orientation plays a significant role in decision-making, but contradictory rules indicate that it must be analyzed in combination with other features. While orientation provides directional context, its influence varies depending on additional conditions. Pedestrians facing the road are more likely to cross, whereas those walking forward or away tend to refrain from crossing.
Pedestrian Action serves as a strong supporting feature but is not a standalone predictor. Some pedestrians may walk near the road without actually crossing, highlighting the need for additional contextual cues.
Finally, Attention and Zebra Crossing Presence (CrossLevel) contribute to the prediction but act as secondary factors. Rather than determining pedestrian behavior outright, they refine and enhance the accuracy of predictions, complementing the primary features.
To visually illustrate the model’s output,
Figure 12 presents an example prediction from the JAAD test set. In this example, the pedestrian is about to cross the road, and the figure showcases how the neuro-symbolic approach predicts the probability of crossing across different frames. Additionally, it highlights the most activated rules and the key features that influenced the prediction, providing valuable insight into the model’s decision-making process.
For each frame, the linguistic values of each explainable feature are displayed, along with a bar indicating the feature’s relevance based on the activated rules. The impact of proximity, distance, and orientation is evident throughout the example. Notably, proximity becomes particularly significant when the probability of crossing is high, reinforcing its crucial role in pedestrian behavior prediction.
7. Conclusions and Future Work
In this work, we have presented a novel, interpretable and explainable approach for pedestrian behavior predictor. The approach is based on a neuro-symbolic model using fuzzy logic. The experiments addressed some evaluation factors which allow to define some guidelines and recommendations regarding the process of data selection and feature selection over the explainable and interpretable context. We emphasize that the process of selecting the right dataset, one that is suitable, accurate, and comprehensive, is indeed a challenging task within the domain of ML context.
From these insights, it is important to highlight that in the context of an explainable predictor, having a large amount of data does not necessarily lead to better results and does not guarantee improved generalization on its own. Additionally, as we look for explainable predictions, it is crucial to include a deep analysis of the videos and annotations before using them. Another insight shows us that including data selection and filtering strategies is also important with a view to creating meaningful fuzzy rules.
On the other hand, it is important to mention that the features to use need to be selected carefully, and one feature by itself may not be enough for obtaining accurate results; the features need to be complemented with additional features that convey more representative information. Likewise, the divergent representation of these features across datasets may lead to inconsistencies in prediction performance when the explainable predictor is applied; therefore, each feature has to be analyzed and used for each dataset in an optimal way.
Regarding the use of different features extracted from the JAAD and PIE dataset in an explainable approach, the proximity, orientation, action and distance are presented as strong features which can reveal meaningful information about the pedestrian behavior.
In the future, we will explore more complex strategies and approaches to develop an explainable and interpretable pedestrian behavior predictor. In addition, we will work over the features extraction including features which can encapsulate the pedestrian motion or behavior history.


