Article

Shear Performance of RC Beams Reinforced by Thin Layer of Epoxy Mortar with High Strength and High Toughness

School of Civil Engineering and Architecture, Guangxi University of Science and Technology, Liuzhou 545006, China
*
Author to whom correspondence should be addressed.
Appl. Sci. 2025, 15(11), 6266; https://doi.org/10.3390/app15116266
Submission received: 24 April 2025 / Revised: 22 May 2025 / Accepted: 26 May 2025 / Published: 3 June 2025

Abstract

This study aims to improve the shear performance of reinforced concrete (RC) beams by utilizing the favorable tensile and shear deformation capabilities of high-strength, high-toughness epoxy mortar. This study investigates the effect of reinforcement layer thickness on the shear failure modes, bearing capacity, and deformation capacity of beams through static tests on three specimens reinforced with thin layers of high-strength, high-toughness epoxy mortar and one unreinforced beam. The results show that reinforcing RC beams with thin layers of high-strength, high-toughness epoxy mortar can significantly enhance its shear bearing capacity and deformation capacity. The reinforcement layer of epoxy mortar can partially exert the shear resistance provided by the stirrups. The thicker the reinforcement layer, the more significant the improvement in the shear bearing capacity and deformation capacity of the strengthened beam. The epoxy mortar layer bonds well with the concrete, but delamination between the cover concrete and the core concrete leads to failure of the reinforcement layer, meaning that shear bearing capacity does not increase linearly with the thickness of the epoxy mortar layer. Based on the experimental results, a shear bearing capacity calculation formula for RC beams reinforced with thin layers of high-strength, high-toughness epoxy mortar is proposed, which matches the experimental results well.

1. Introduction

Reinforced concrete (RC) beams are the primary load-bearing components in building structures, and their main modes of failure are bending failure and shear failure [1,2,3,4,5]. When a concrete beam undergoes shear failure, it exhibits distinct brittle characteristics, with poor ductility and significant difficulty in reinforcing or repair [6,7,8,9]. Therefore, when the shear bearing capacity of concrete beams is inadequate, it is important from an engineering perspective, to improve their shear performance and ameliorate their shear failure modes by using new materials and technologies [10,11,12,13,14]. Existing conventional reinforcing methods mainly include increasing the cross-section [15,16,17,18], bonding steel plate reinforcements [19,20], and bonding fiber-reinforced composite reinforcements [21,22,23]. However, these reinforcement methods possess certain deficiencies. For instance, increasing the cross-section significantly impacts the structure’s self-weight. In the bonded steel plate method, the performance of the adhesive material directly affects the bonding effectiveness; if the bonding performance is insufficient, it reduces the reinforcing effect. Carbon fiber has poor fire resistance and requires high standards for adhesive materials and construction techniques. Carbon fiber has poor fire resistance and requires high standards for adhesive materials and construction techniques. Among other strengthening materials, ECC (Engineered Cementitious Composite) has low tensile strength and cracks prematurely, making it generally unsuitable as a standalone reinforcement material [24,25,26]. Polyurethane mortar has a propensity to react with moisture during its preparation, generating copious amounts of bubbles, which affects the performance of the material [27]. The actual preparation environment in engineering applications often cannot meet the requirements, and its long-term stability still needs to be verified.
All the above reinforcement methods have a longer construction period, which results in significant impacts on traffic during bridge reinforcement. In contrast, epoxy resin mortar, using epoxy resin as the base material, has good fluidity and is easy to apply. Its hardening time is shorter, allowing for the restoration of traffic in a relatively short period after reinforcement [28,29]. Additionally, it offers advantages, such as its fire-resistant property [30,31], better bonding, resistance to delamination, and high tensile strength. However, the toughness limitation of commonly used epoxy mortars should not be overlooked. Specifically, the ultimate tensile strain is typically lower than 1500 με, which is significantly lower than the yield strain (2000 με) of stirrup in concrete structures and the design ultimate tensile strain (10,000 με). This means that, before the original structural reinforcement reaches its yield point, the epoxy resin mortar may fail due to cracking, thus losing its ability to function effectively. Therefore, in reinforcement engineering, epoxy resin mortar is typically employed as a bonding material. It bonds reinforcing materials (e.g., high-strength steel wires, fiber-reinforced bars, and steel cables) to the reinforced beams, enabling them to work together under load, thereby enhancing the structural load-bearing capacity. However, due to its tendency to crack prematurely, the epoxy resin mortar itself does not contribute directly to increasing the load-bearing capacity of the structure but rather serves primarily as an adhesive [32,33].
To address this issue, our research team has incorporated chemical toughening agents into the epoxy resin mortar to form an interpenetrating network structure at the microscopic level, thereby alleviating its brittleness [34,35]. We have developed a novel high-strength, high-toughness epoxy mortar that exhibits high tensile strength (19.4 MPa) and ultimate tensile strain (>10,000 με). This material ensures that reinforced concrete structures will not crack prematurely due to inadequate toughness. It can remain active throughout the entire loading process of the structure, effectively enhancing the structural bearing capacity and suppressing cracking.
To further investigate the shear performance of RC beams reinforced with thin layers of high-strength, high-toughness epoxy mortar, our study team created three specimens with thin layers of high-strength and high-toughness epoxy mortar and one unreinforced beam. Through four-point flexural tests, we examined how reinforcement layer thickness affects shear failure modes, load-bearing capacity, and deformation characteristics. A formula for calculating the shear capacity of RC beams reinforced with high-strength and high-toughness epoxy mortar thin layers was established, providing a reference for the design and engineering application of this reinforcement technique.

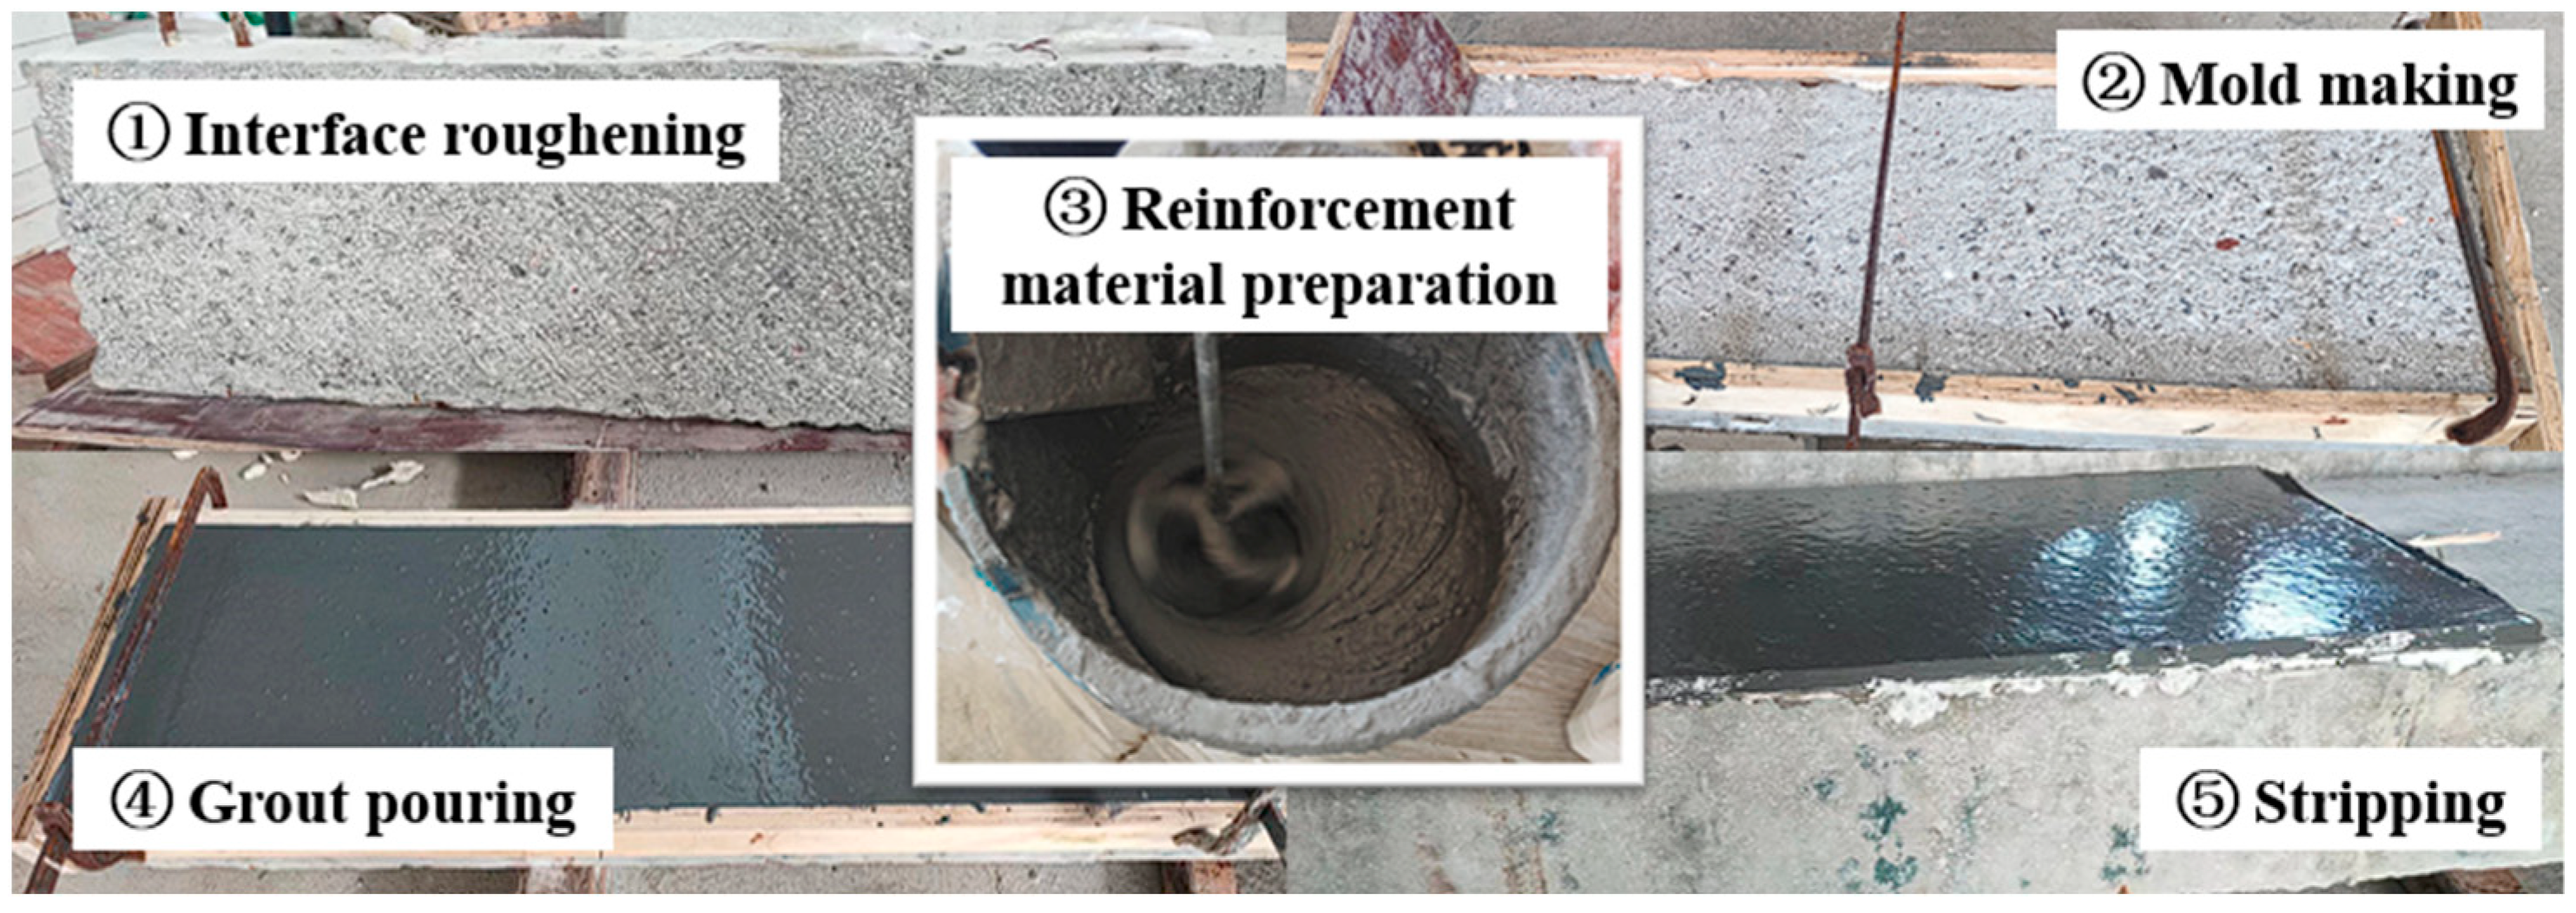
2. Materials and Methods

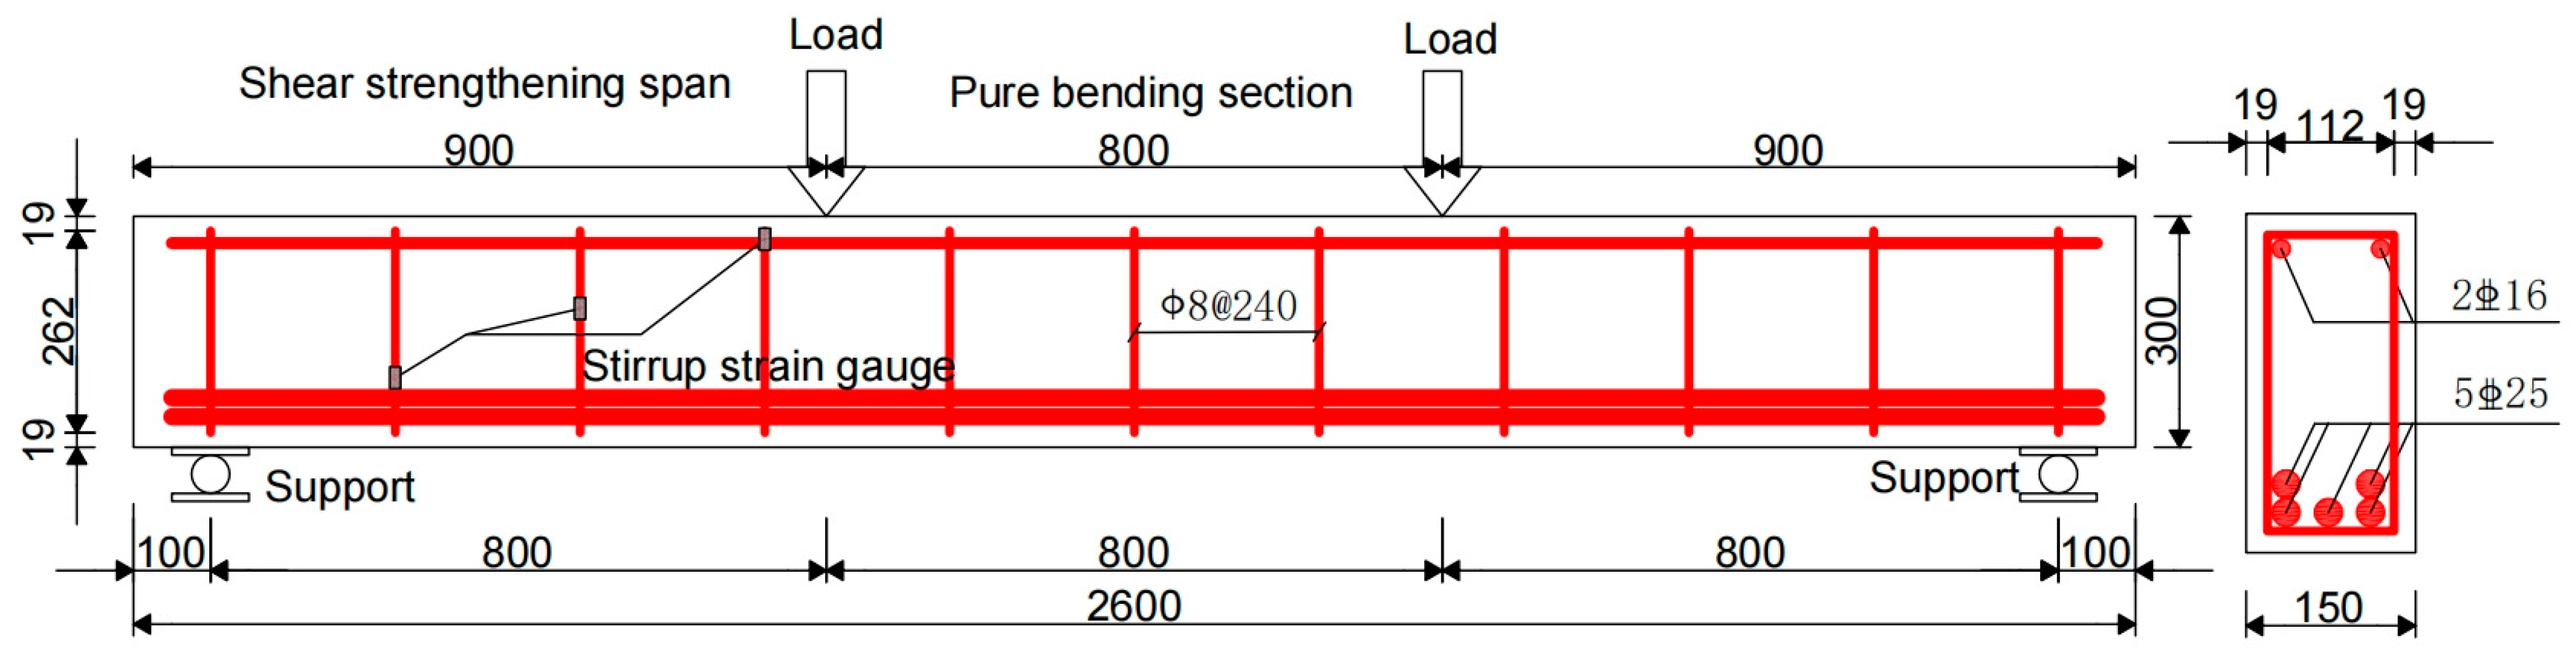
2.1. Specimen Design and Properties

Four rectangular RC beam specimens with a cross-section of 150 mm × 300 mm and a length of 2600 mm were fabricated by considering three replacement thicknesses (10, 20, and 30 mm) to investigate their behavior; see Figure 1. The geometrical dimensions and the layout of steel reinforcements are shown in Figure 2. As shown, two 16 mm diameter bars (HRB400) and five 25 mm diameter bars (HRB400) were applied as compressive and tensile longitudinal bars of the beams. A diameter of 8 mm (HPB300) with a spacing of 240 mm was used for the stirrups, and the ratio was 0.28%; see Table 1. To prevent the reinforced beam from experiencing pure bending failure, which could occur if its shear capacity exceeded its flexural capacity, the stirrups were not configured in compliance with the minimum reinforcement ratio requirements specified in the code. The thickness of the concrete cover was 19 mm.
As shown in Figure 3, upon the completion of curing for the unreinforced RC beam, roughening treatment is applied to both sides of the beam. Subsequently, the formwork is set up for the pouring of epoxy mortar, and curing is performed at normal temperature for 14 days.

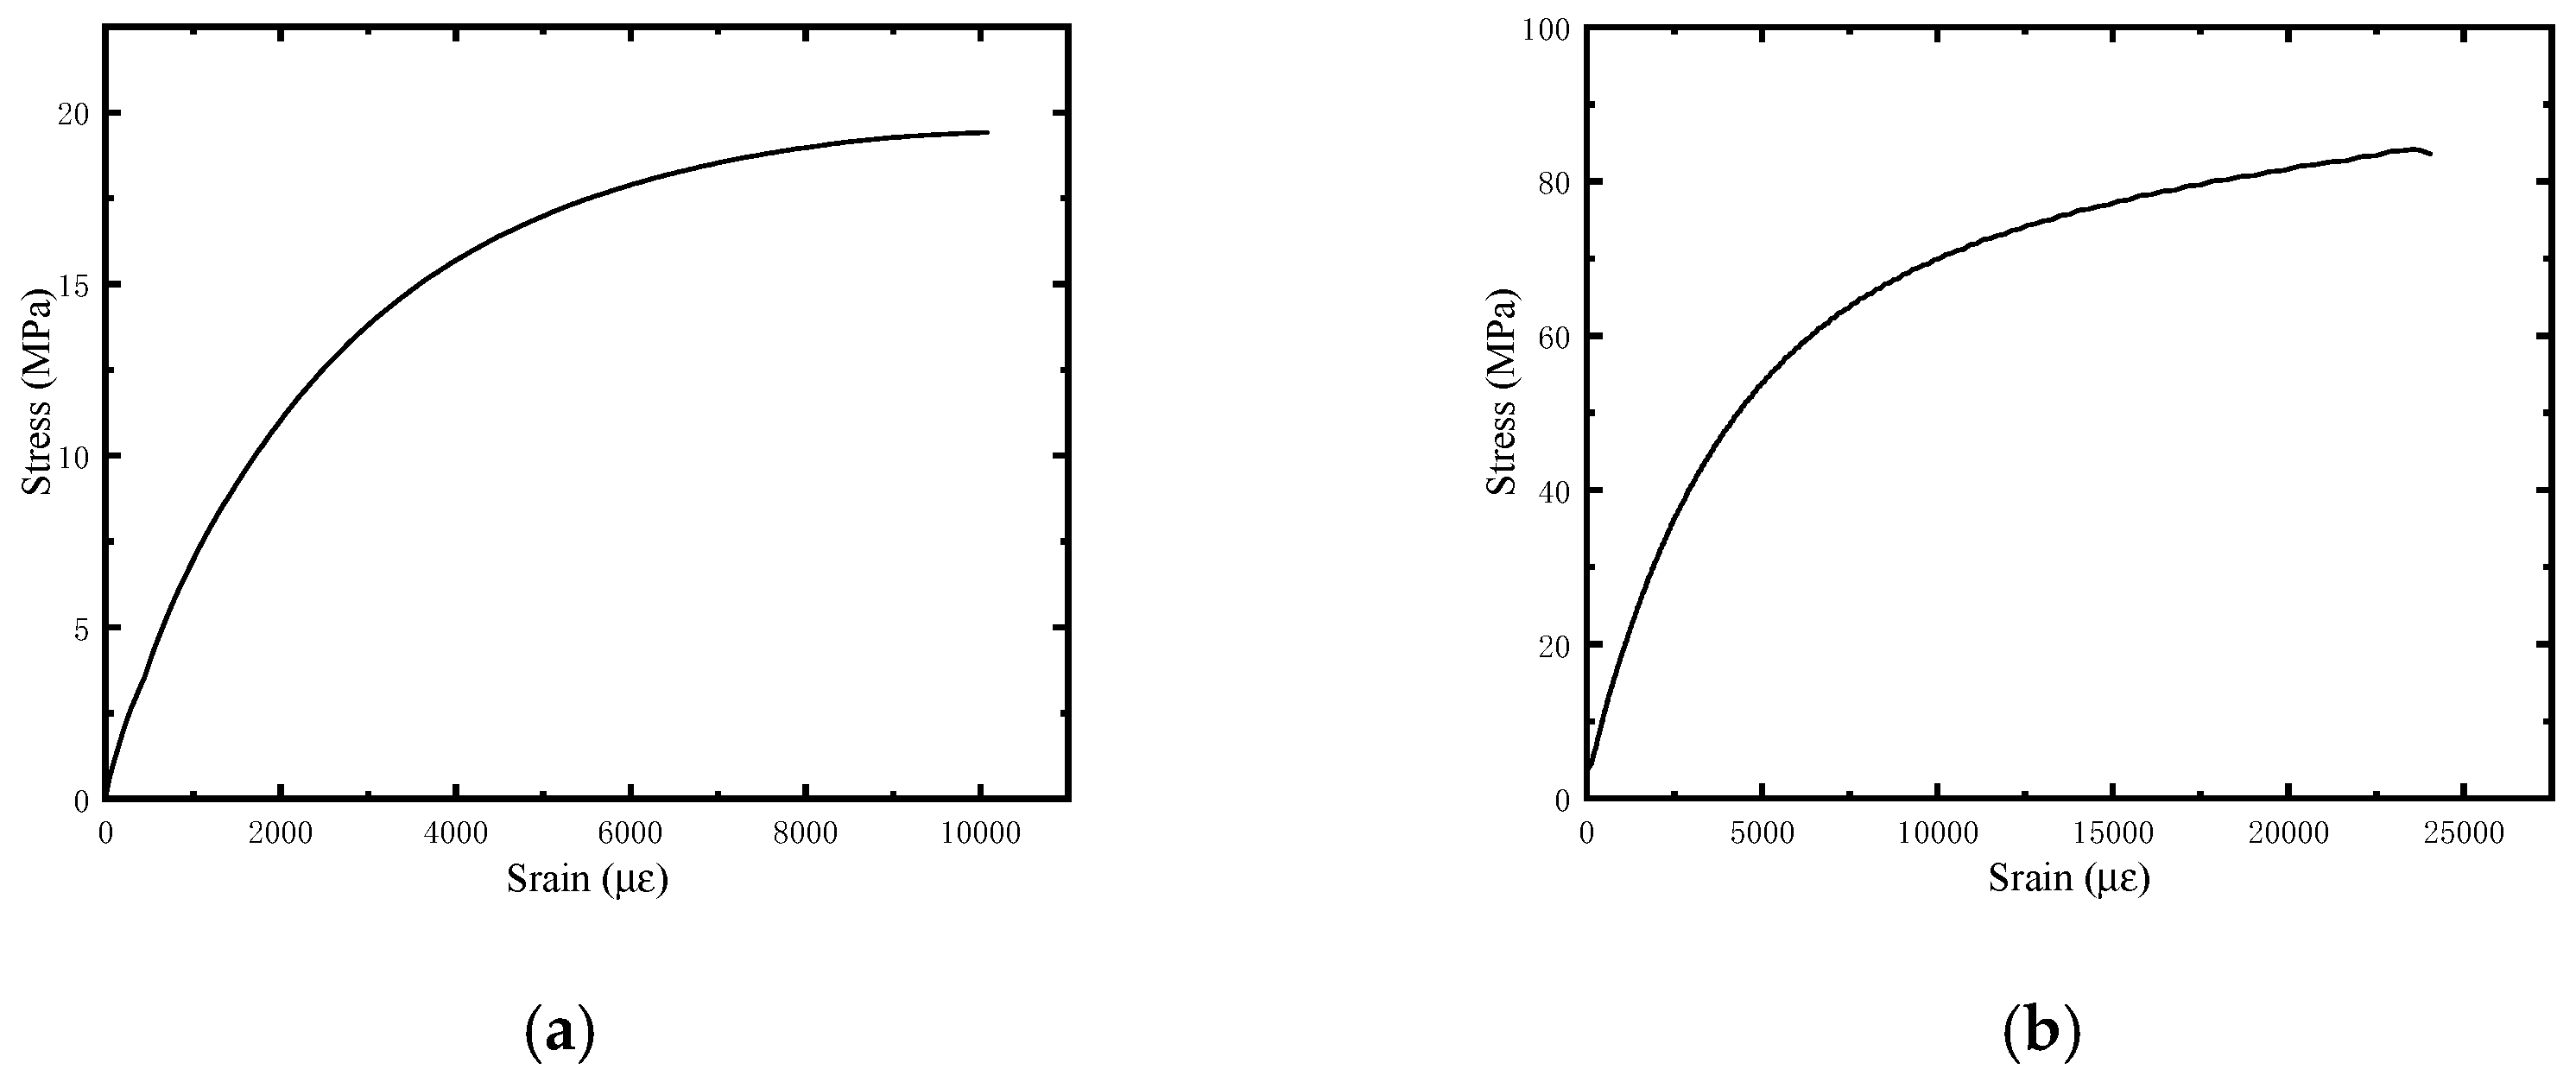
2.2. Mechanical Properties

The high-toughness epoxy mortar is composed of epoxy resin, diluent, flexible curing agent, toughening agent, coupling agent, defoaming agent, fly ash, and quartz sand, mixed in specific proportions. The mix ratio of the epoxy mortar is shown in Table 2. In accordance with the requirements of DL/T 5193-2021 [36] “Technical Specifications for Epoxy Resin Mortar”, tensile tests are conducted using a “dumbbell-shaped” component, and compressive tests are performed on 40 mm × 40 mm × 40 mm samples. Strain gauges are bonded to both sides of the specimens. Stress–strain curves are then plotted based on the force and strain data collected during the tests, as shown in Figure 4. The material properties of the steel rebar used in the experiment were obtained through tensile tests. The results are shown in Table 3.

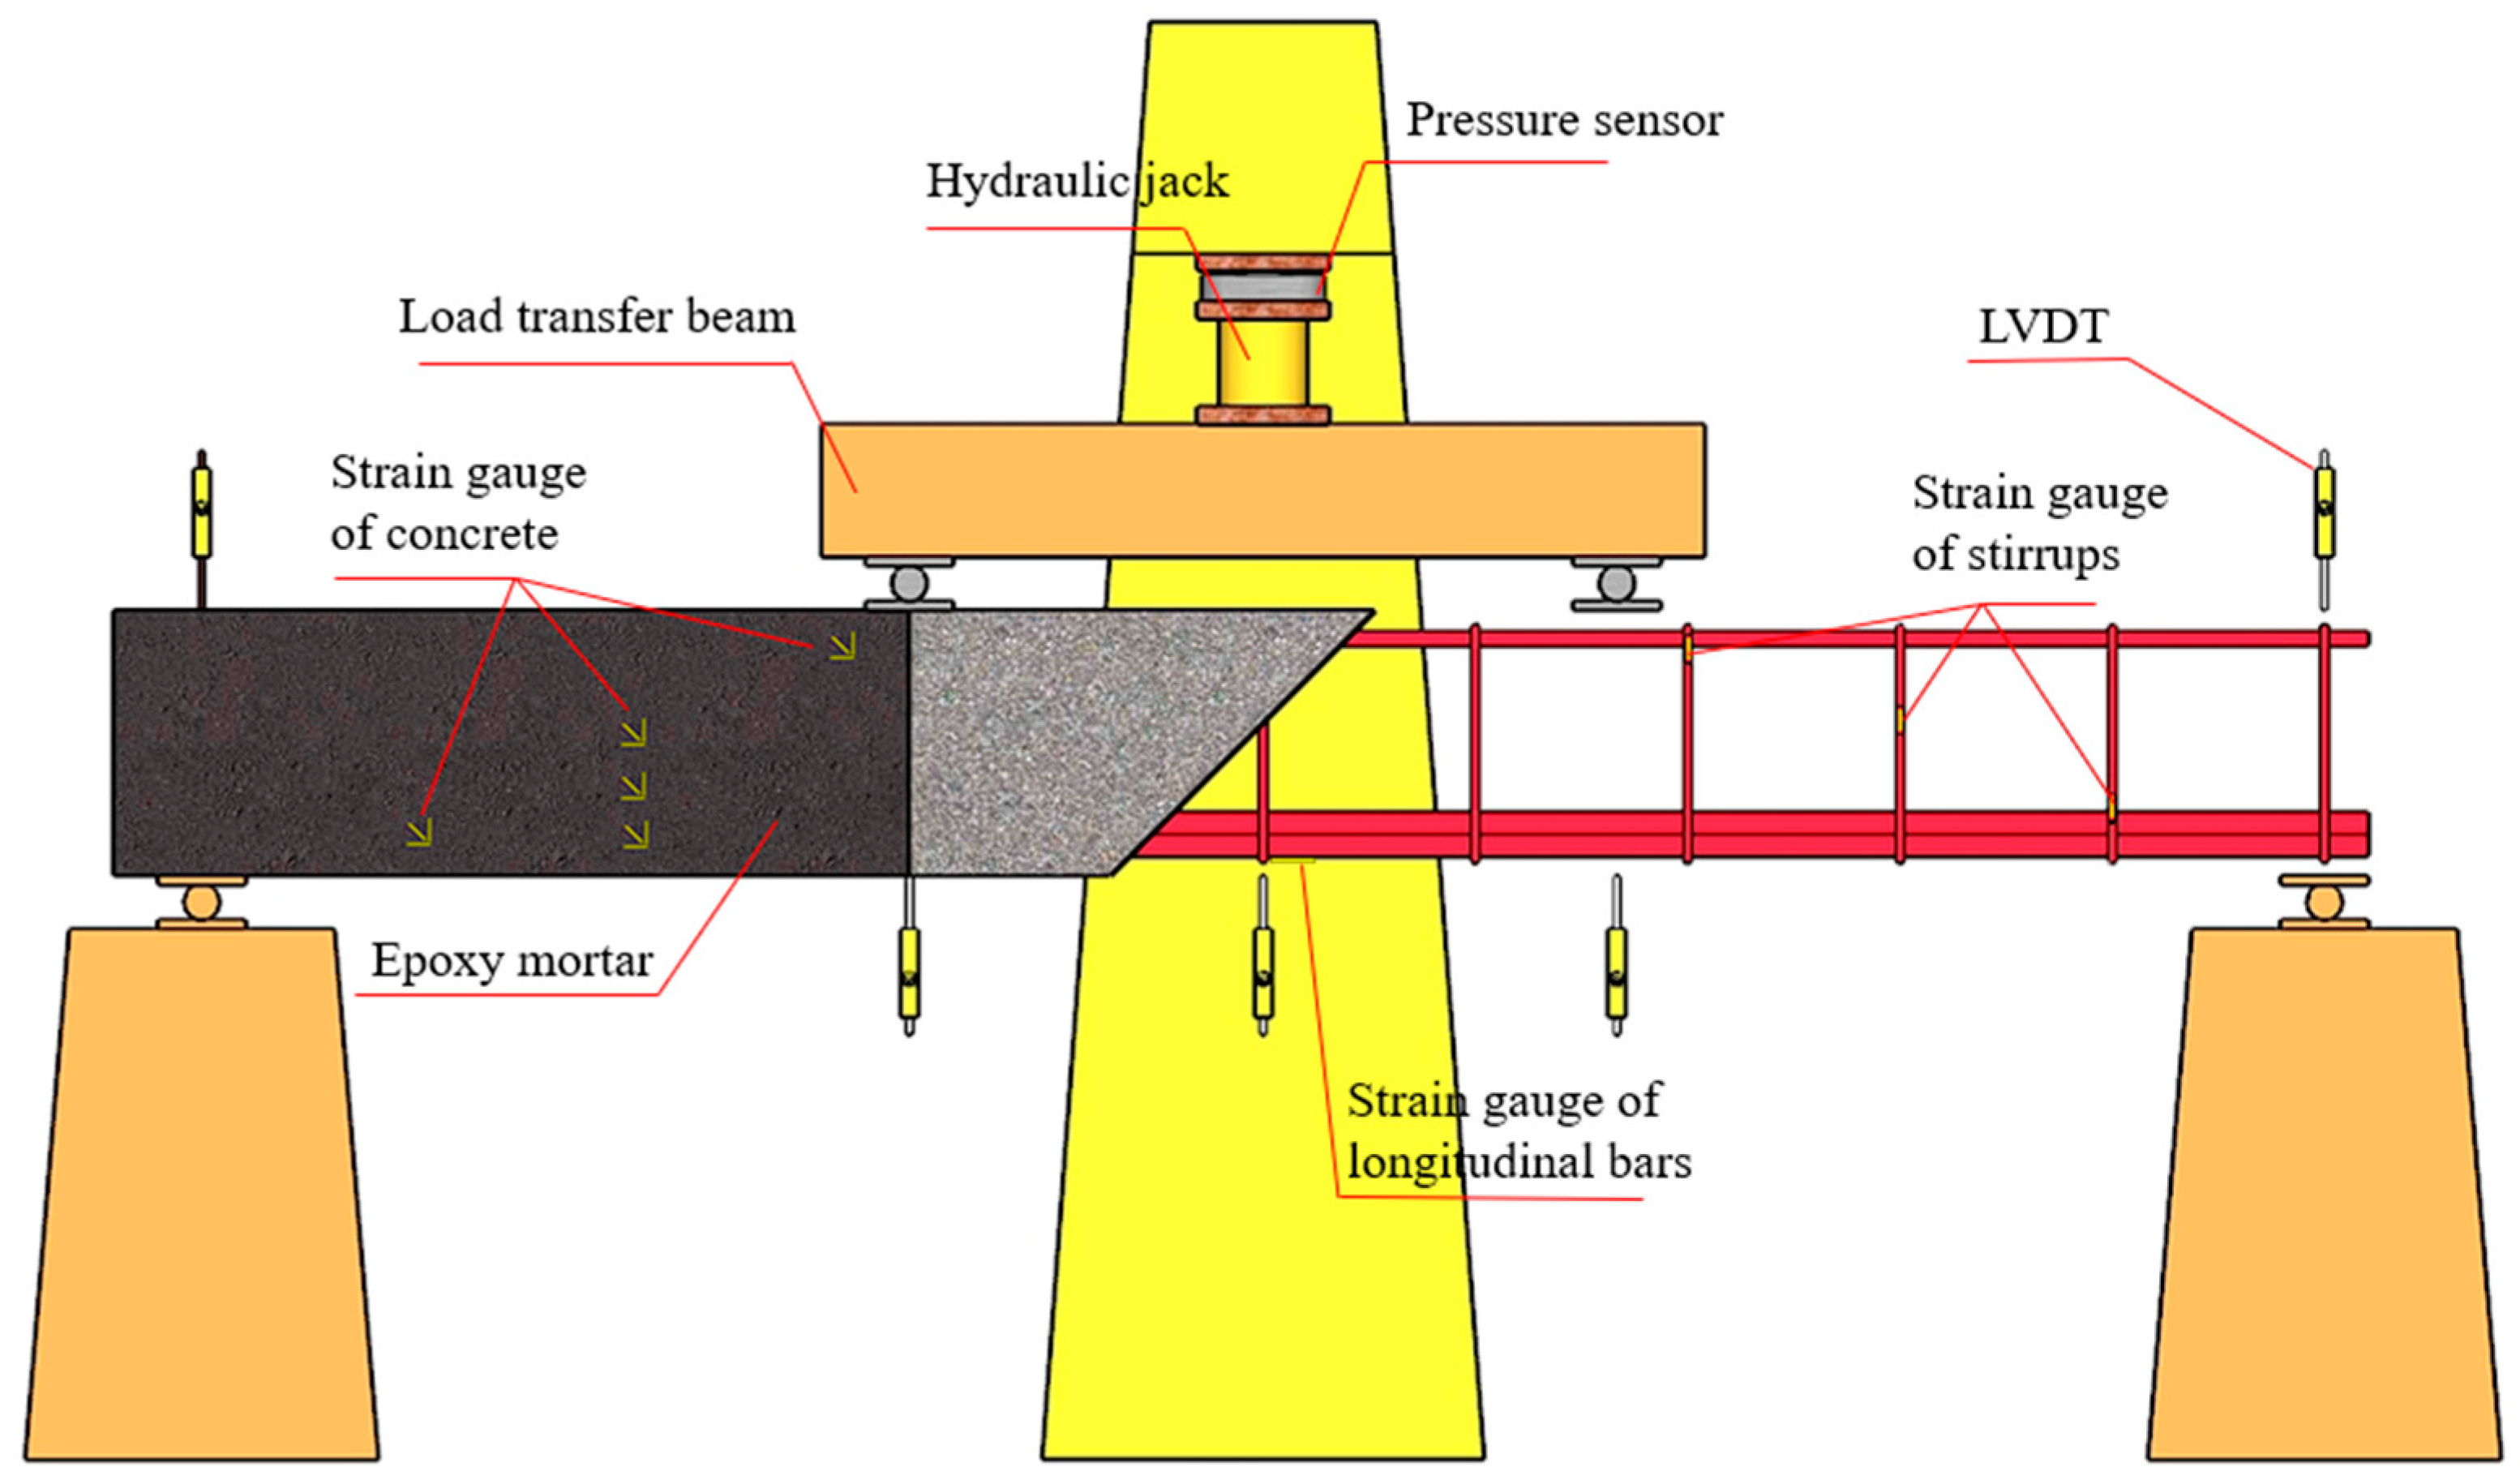
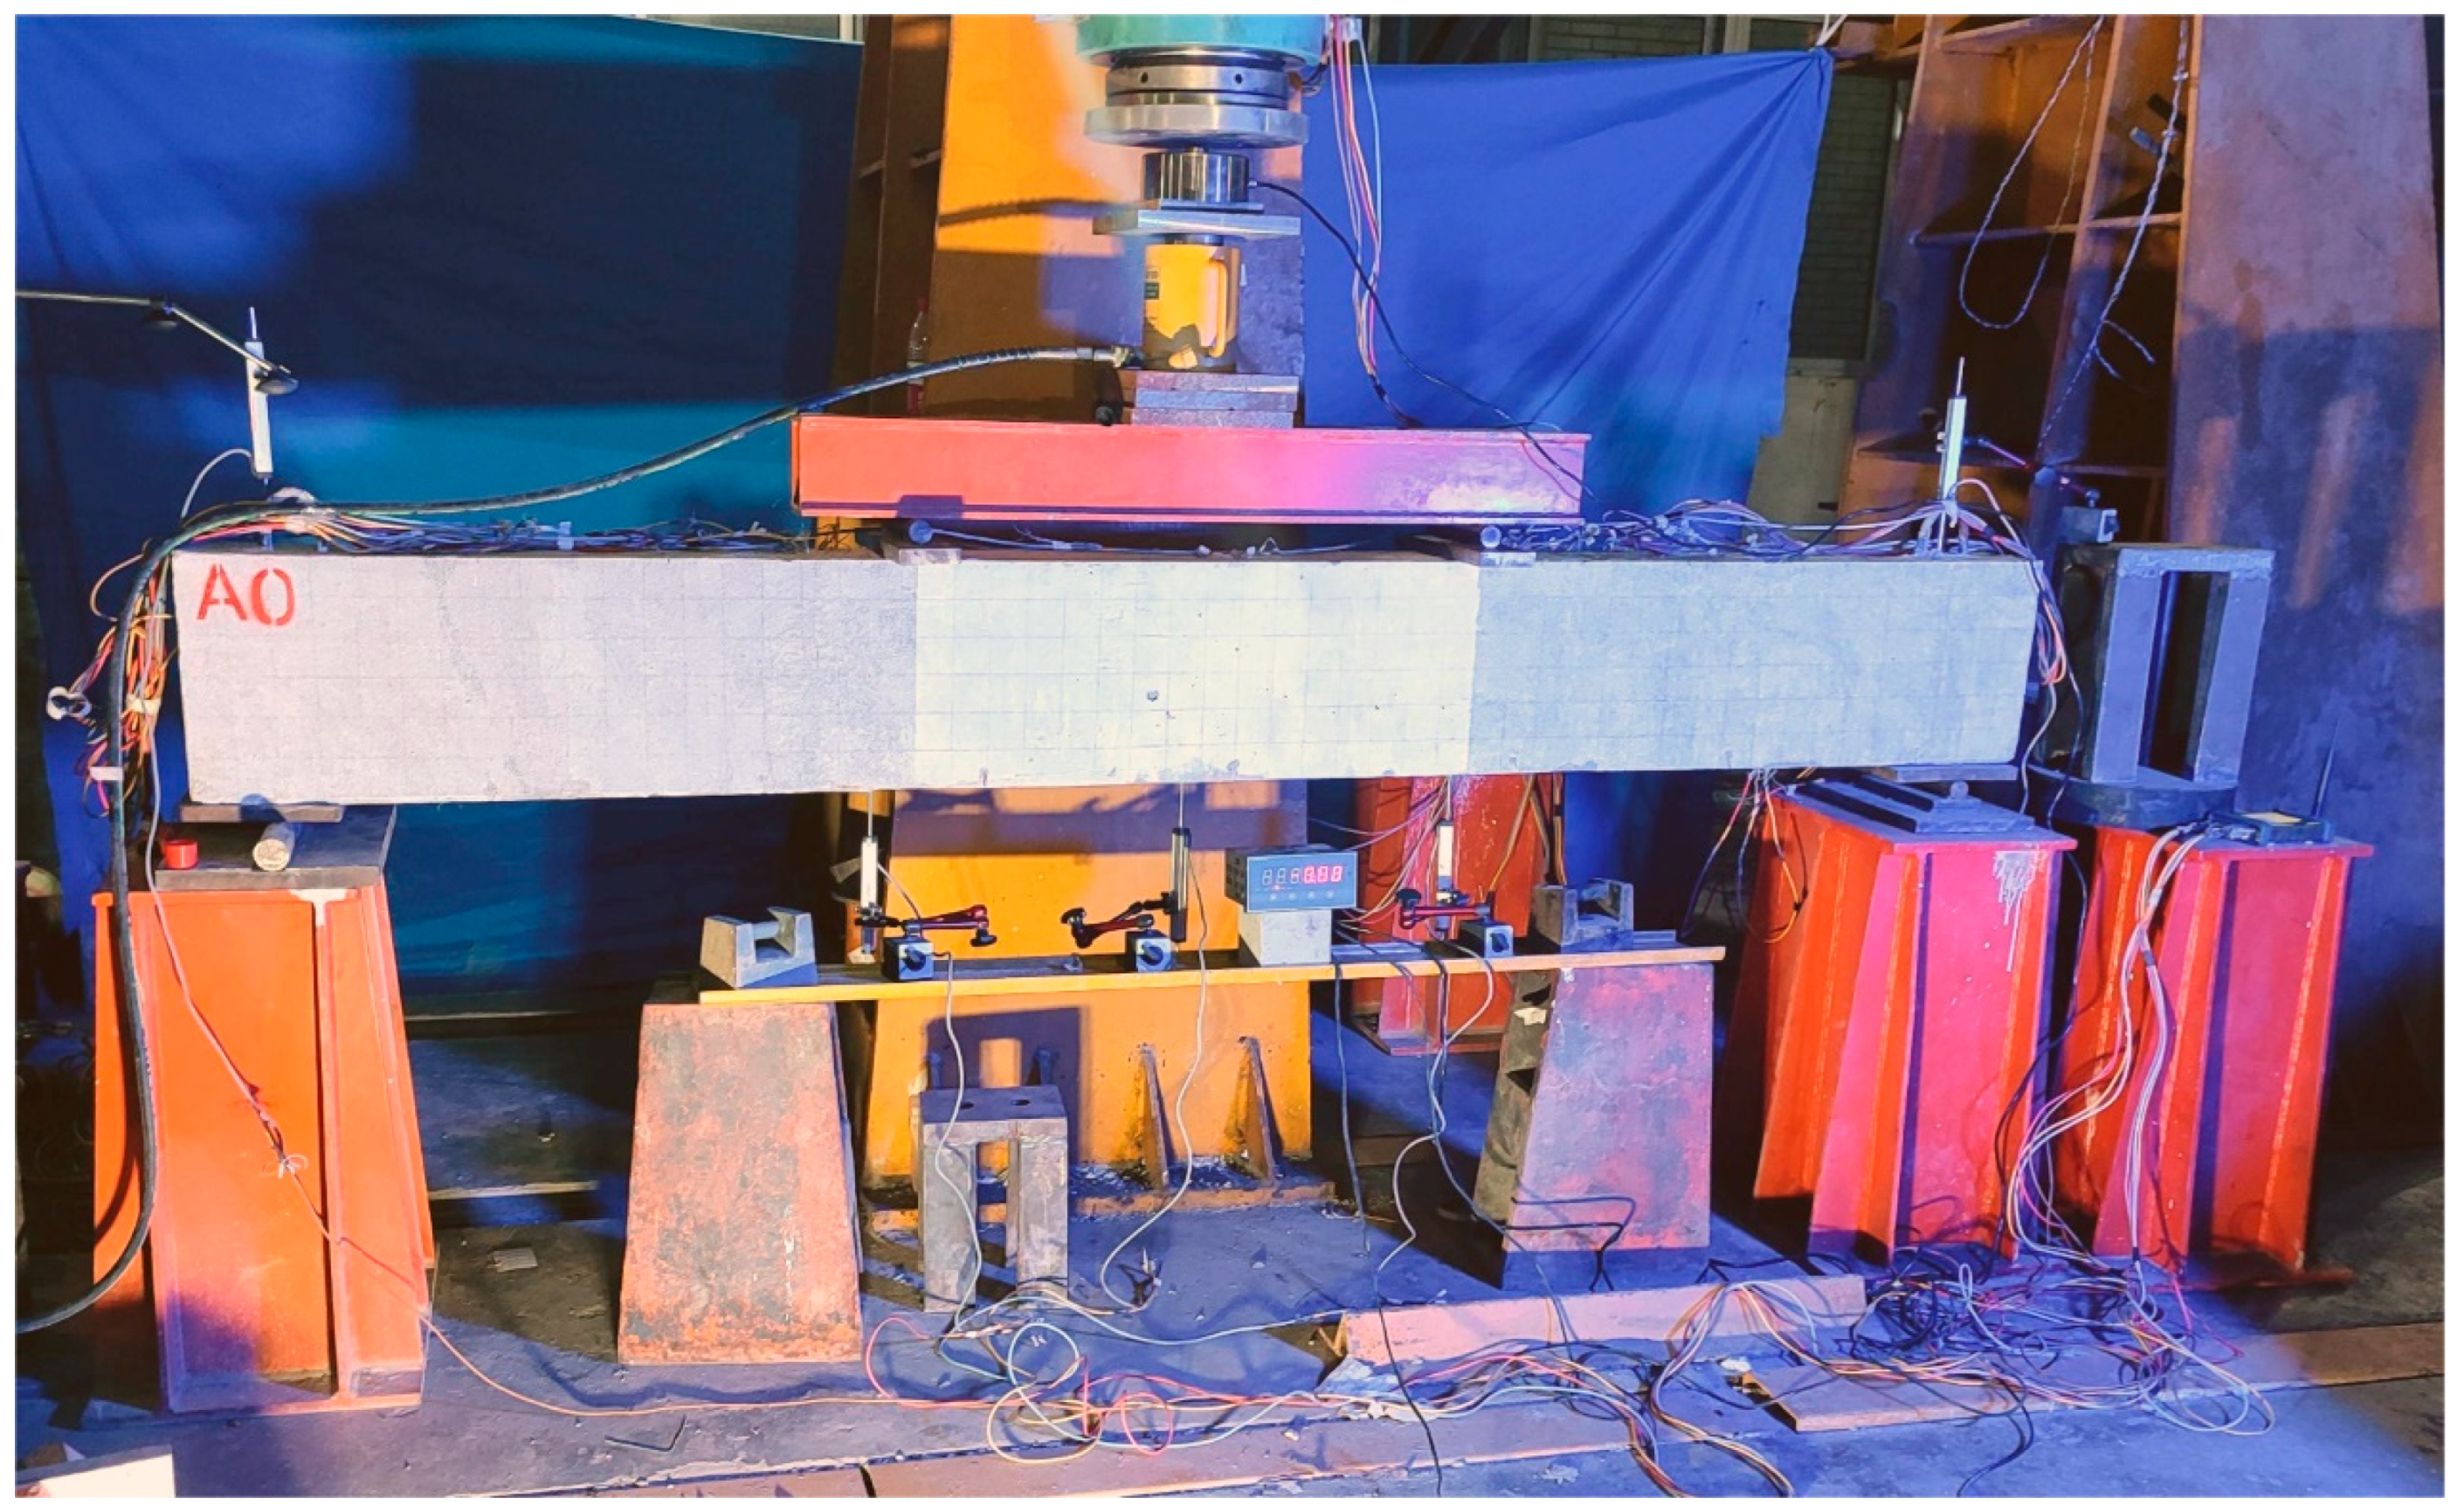
2.3. Loading and Measurement Protocol

In this experiment, a 50-ton hydraulic jack was adopted to impose load on all the specimens on a reaction frame, and the loading device is depicted in Figure 5. A pre-load of 10 kN was performed before formal loading to check the instrument readings and ensure the proper functioning of the loading equipment, after which the load on the beam specimens was monotonically graded and applied by the force-controlled loading method. The loading intervals were approximately 10 kN. When the load is unable to be maintained, the displacement-controlled loading method is used, with an increment of 0.5 mm at each stage until the specimens are completely impaired, whereupon the loading is terminated. Figure 6 presents the on-site images of the specimens during the test loading process.
The primary contents tested in the experiment comprise the load, midspan deflection, support settlement, strains of tensile longitudinal reinforcements and stirrups, surface strain at the anticipated cracking locations on the shear span, as well as the occurrence and propagation of cracks.

3. Failure Mode

3.1. Control Beam A0

At the initial loading stage, there was no obvious crack on the surface of the specimen, and the specimen remained in an elastic state. When the load reached 112.7 kN, the first bending crack emerged in the beam, with a width of 0.02 mm. At this moment, the stiffness of the beam decreased for the first time. When the load reached 144.0 kN, the first oblique crack appeared in the shear span near the loading point, with a width of 0.02 mm. The stiffness of the beam underwent a second decline, and the maximum width of the bending crack expanded to 0.03 mm. Upon continuous loading, the number of bending cracks no longer increases, and the existing cracks cease to extend further. The oblique cracks gradually multiply and broaden continuously. Before the beam fails, the maximum width of the oblique crack is 1.41 mm. It can be observed from the strain curve of the stirrups in Figure 7 that, prior to the emergence of the oblique cracks, the stirrups do not withstand shear force, and the shear force at this point is mainly resisted by the concrete. When the first oblique crack emerged, and the strain of the stirrups began to increase, the stirrups began to undertake the shear force. Due to the configuration of the stirrups being relatively rare, the stirrups promptly reached the yield state. Subsequently, the RC beam yielded (the equivalent energy method is employed in this paper to determine the yield point). When approaching the ultimate load, the stiffness further decreased, eventually causing failure, with the ultimate load being 292.1 kN.

3.2. Strengthen Beams A1, A2, and A3

The initial bending crack emergence points of the reinforced beams A1, A2, and A3 are essentially identical to that of A0. Given that the reinforcing material, namely, high-toughness epoxy mortar, is a brittle substance, no distinct manifestations were observed in the reinforcement layer before the beam’s failure. Only the sound of the concrete within the beam fracturing was audible.
In A1, obvious longitudinal cracking occurred at three positions of the tensile longitudinal reinforcement at the bottom of the beam and formed a reticular crack. The phenomena of A2 and A3 were even more pronounced. Not only did the cracks widen but the internal longitudinal reinforcement was also visible at the bottom of the shear span, as shown in Figure 8.

4. Results and Discussion

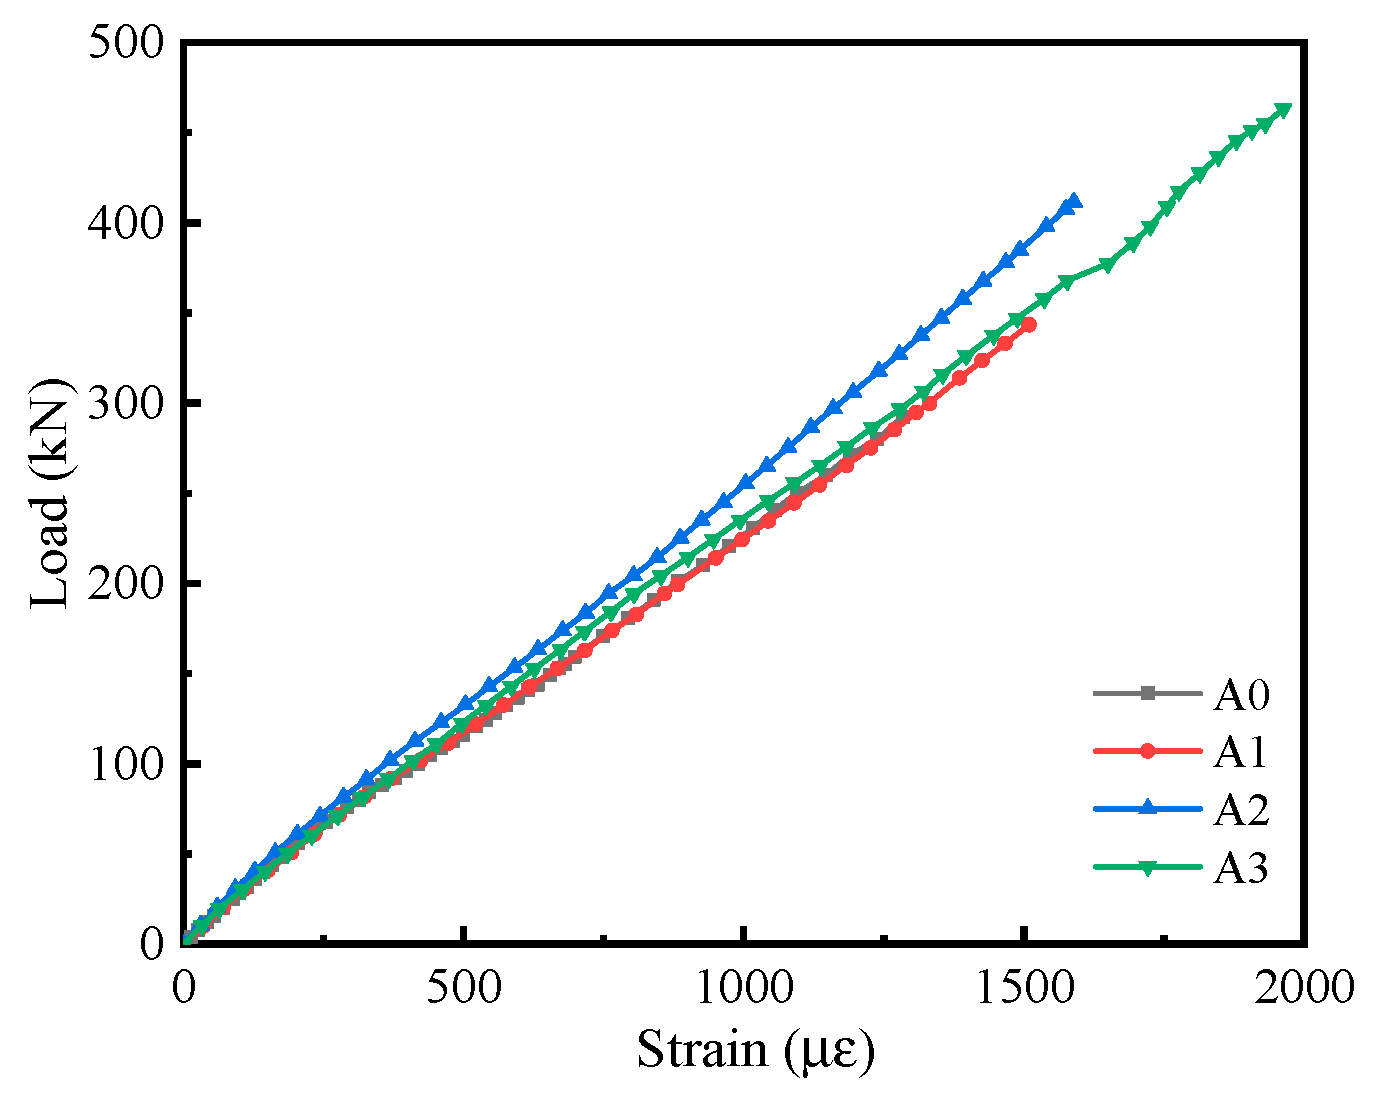
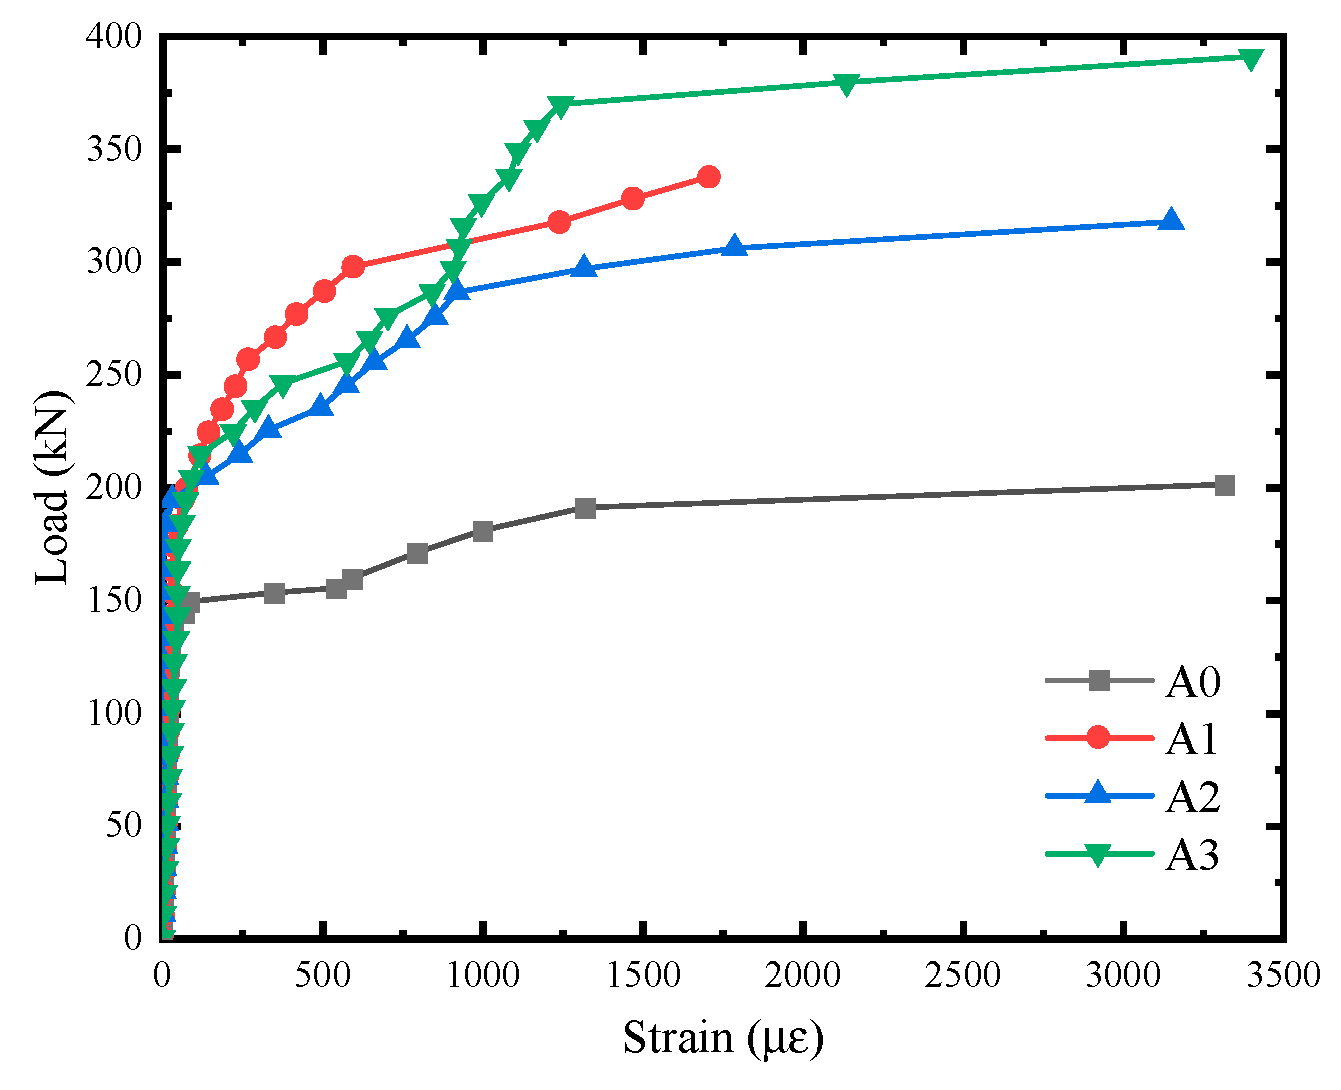
4.1. Strain of Reinforcement

From the load–longitudinal reinforcement strain curves presented in Figure 9, it is evident that the strain of the longitudinal reinforcement in the test beam did not yield, and all of them presented shear failure. This indicates that the maximum load measured in this test constitutes the shear resistance capacity of the beam.
It can be discerned from the load–stirrup strain curves depicted in Figure 10 that the alteration of the stirrup is relatively minor during the initial loading stage. At this stage, no shear cracks emerge in the control beam A0, no noise is audible within the reinforced beams, and the original beam does not sustain failure. The internal forces engendered by the external load are pre-dominantly carried by the concrete and the epoxy mortar reinforcement layer.
The yield strain of the stirrups observed in Figure 10 does not align with the data presented in Table 3 from the material performance test. This discrepancy arises because the strain gauge measurements in the material performance test capture localized strains, whereas the strain distribution of the stirrups embedded in concrete is non-uniform, with the highest strain occurring at the main crack locations. Additionally, the randomness in the cracking positions of the beam means that the strain measurement points may not coincide with these crack locations. Despite this inconsistency, the distinct step change in the stirrup strain indicates that the stirrups have entered the yield stage.

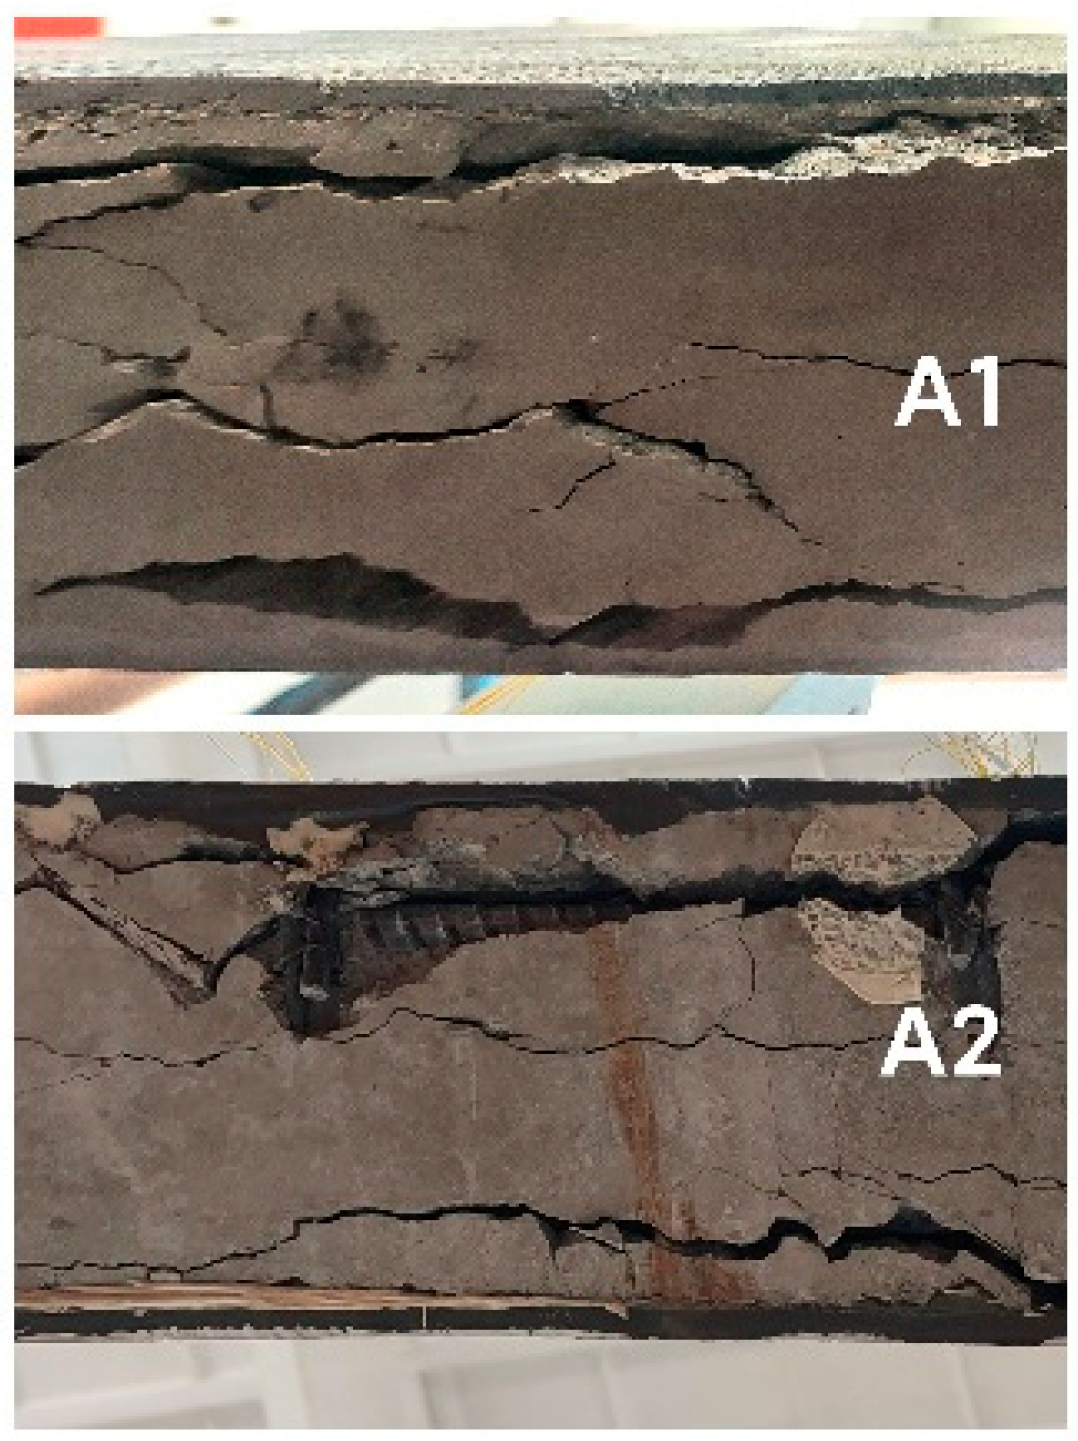
4.2. Failure Phenomena

Concerning the control beam A0, when loaded to a certain value, initially, vertical cracks in the pure bending section appear on the beam; subsequently, oblique cracks arise in the shear span, and the vertical cracks cease to extend or multiply. When the load is increased to a certain value, the quantity of oblique cracks ceases to increase. At this juncture, a principal crack with a relatively large width is formed in the area where the oblique cracks are densely distributed, and the stirrups intersecting with the principal crack gradually yield. After that, the main crack continued to extend to the loading point. The failure of beam A0 belongs to shear compression failure.
The failure modes of reinforced beams A1, A2, and A3 are basically the same. When the load is applied to a certain value, vertical cracks emerge in the pure bending section of the beam. As the load increased further, the sound of concrete failure within the beam can be clearly heard. In the shear span, insufficient bearing capacity led to the tensile failure of the internal concrete, and the strains of the stirrups and the reinforcement layer started to increase. Subsequently, the stirrups of the beam successively started to yield, eventually resulting in the failure of the beam. After removing the reinforcement layer, it was discovered that the concrete cover in the shear span had been subjected to tensile damage and detached from the core concrete, and the failure location was largely consistent with the position of the main oblique crack of the comparative beam A0.
It can be seen from Figure 11 that all four test beams experienced shear compression failure. Among them, the failure of the comparative beam A0 was more inclined to shear tension failure. However, with the increase in the thickness of the reinforcement layer, the failure pattern of the internal concrete gradually tended toward web crushing failure, and the failure area gradually expanded. The top concrete near the loading point of beams A2 and A3 suffered compression failure. Therefore, it can be concluded that the epoxy mortar reinforcement layer has obviously improved the shear capacity of the beam, but the failure mode of the beam is still brittle failure. Shear failure of the strengthening layer occurred as a consequence of shear stress redistribution within the flexural shear zone, originating from the internal concrete shear damage.

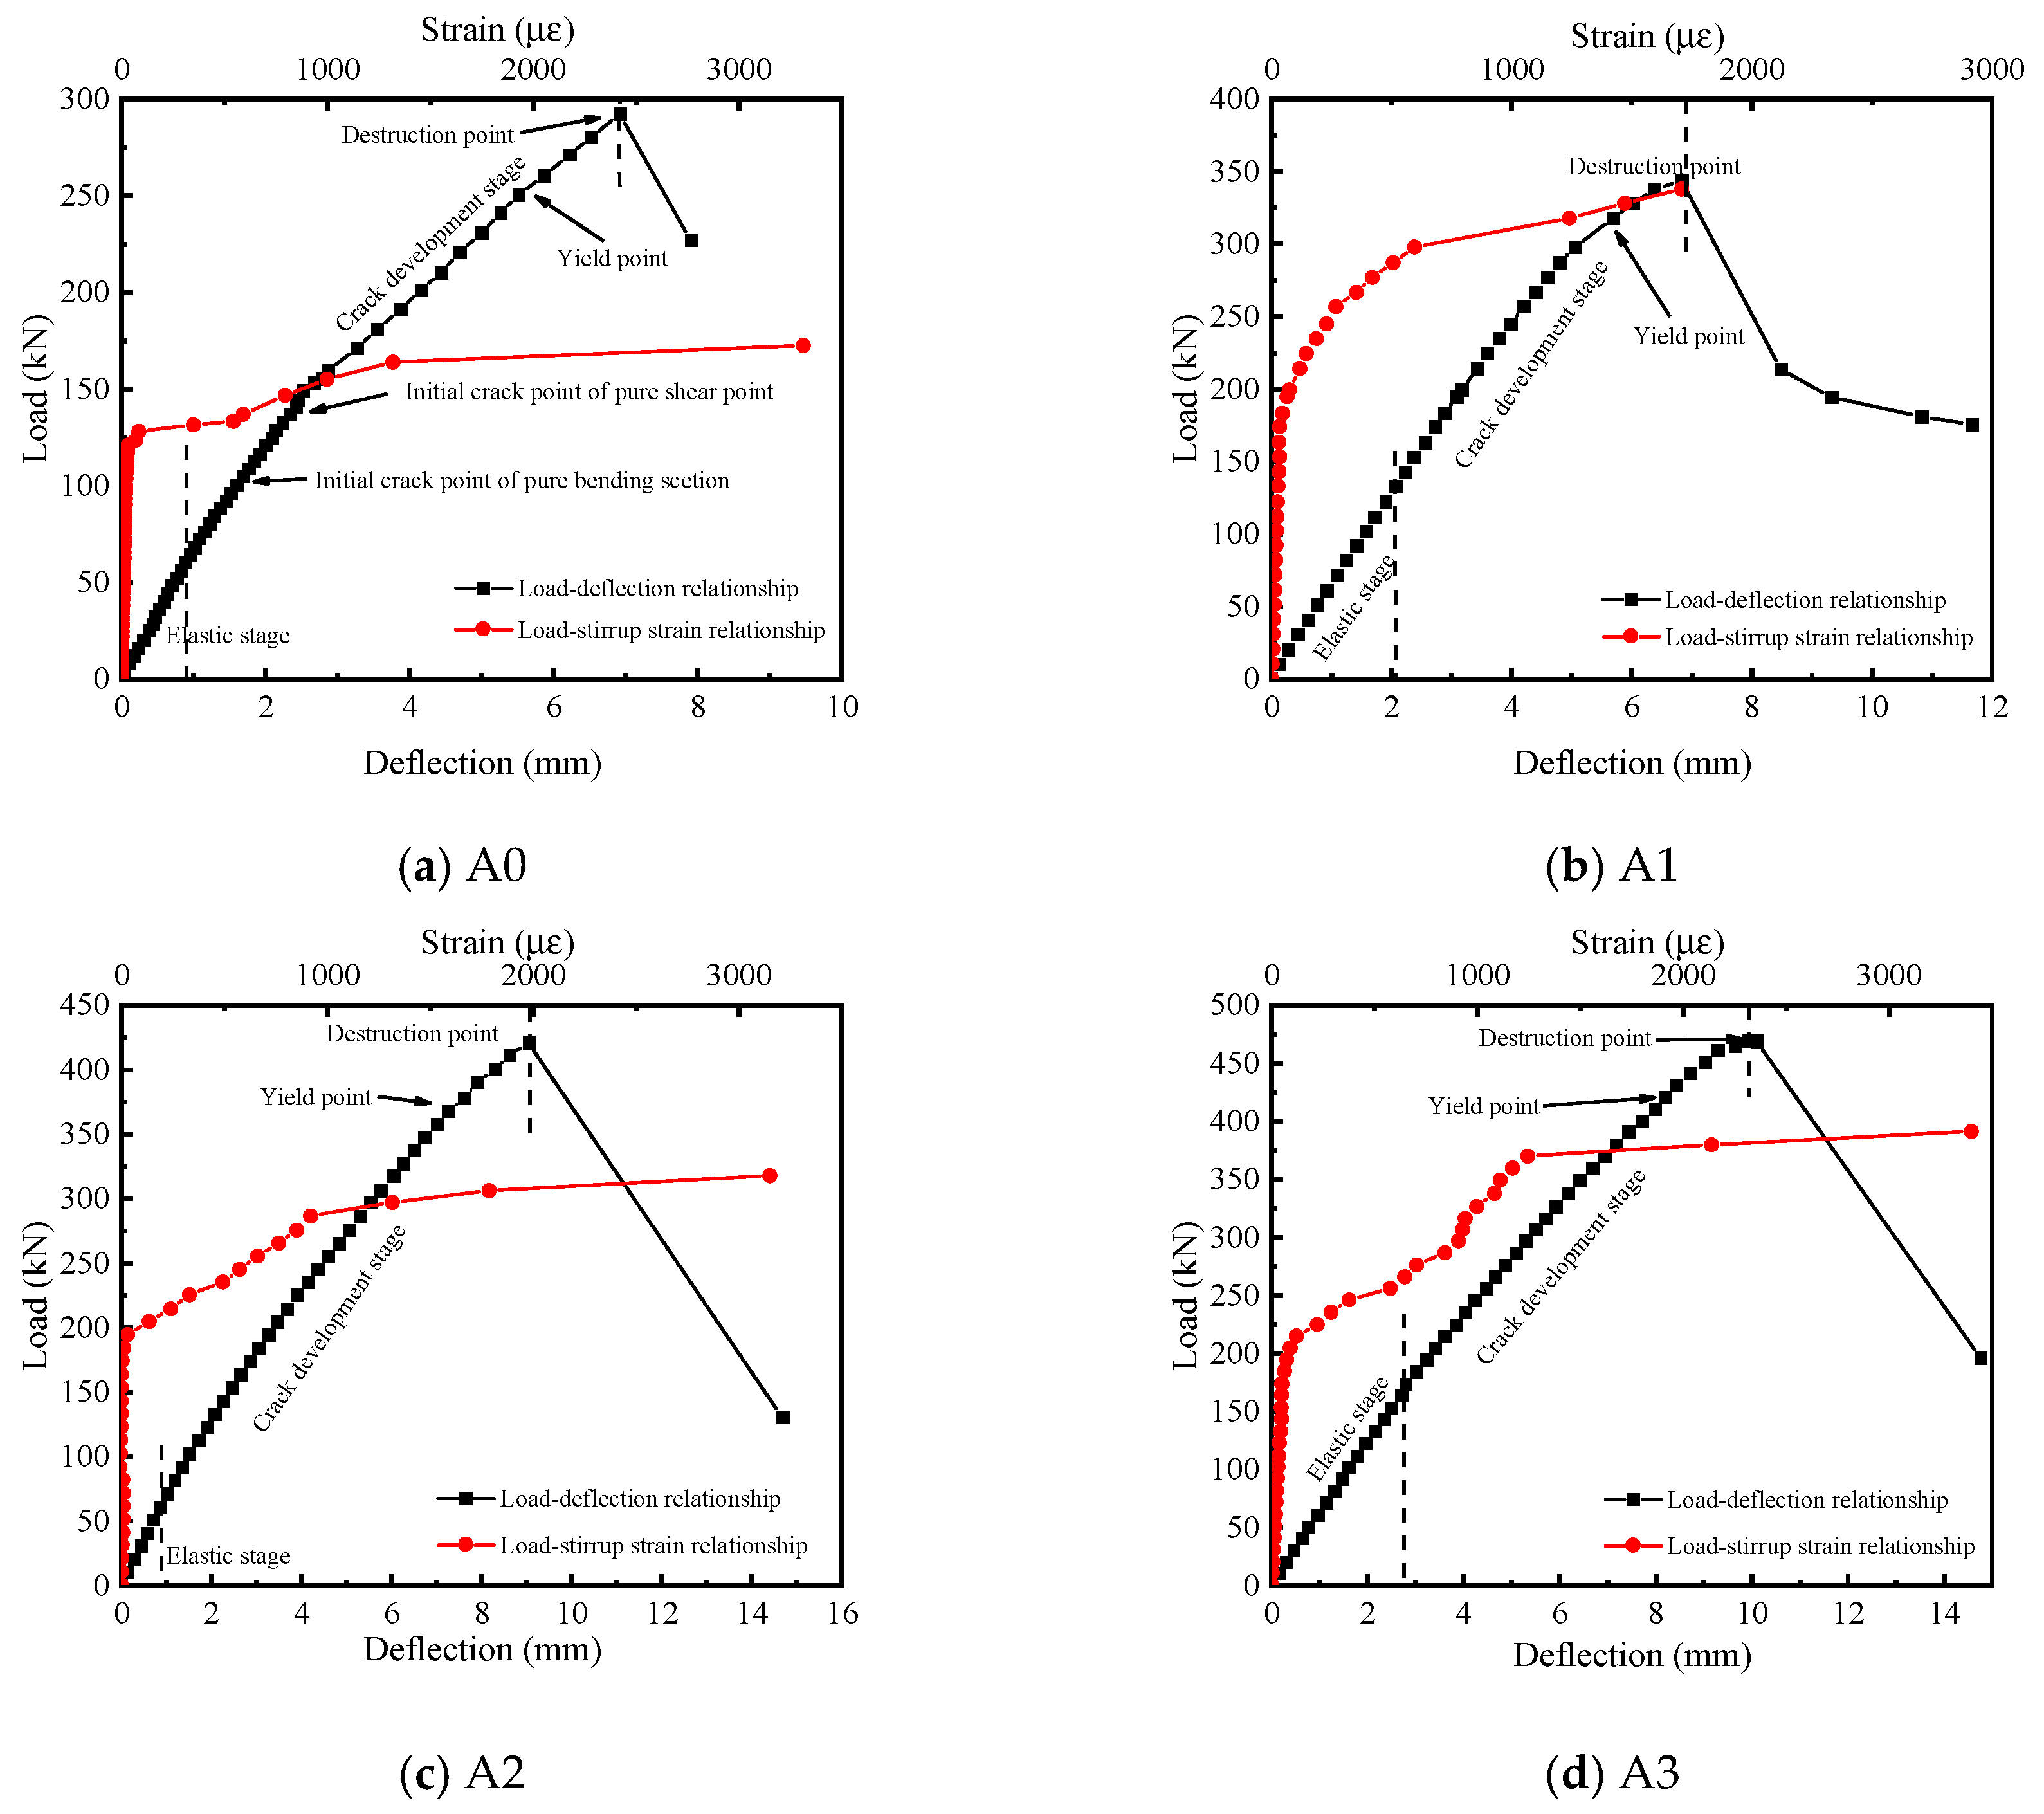
4.3. Load–Deflection Curves

From the load–deflection curves in Figure 12, it can be seen that, before the crack emerges, the curve is basically linear, and at this time, the beam is in the elastic stage. When the crack occurs, the curvature of the load–midspan deflection curve of the reinforced beam starts to reduce. However, the curvature change in the reinforced beams is not obvious due to the high tensile strength of the epoxy mortar. With the continuous increase of the load, the stirrups start to yield, causing the growth rate of the beam’s shear capacity to slow down, while the deflection develops faster. After the beam reaches the ultimate capacity, the control beam A0 undergoes brittle shear failure, and the peak rapidly drops. Because the epoxy mortar used in the reinforced beams is also a brittle material, the peak rapidly drops to a load lower than that after the failure of contrast beam A0 after failure.
The ultimate capacities of the beams were, respectively, enhanced by 17.6%, 40.9%, and 60.6% through the three reinforced beams. Due to the fact that the tensile strength of epoxy mortar is significantly greater than that of concrete, the portion of the concrete cover bonded to the reinforcement layer detaches from the original beam. As a result, the ultimate capacity does not increase linearly with the thickness of the reinforcement layer. Furthermore, as the ultimate capacity of the beam is enhanced, the area of concrete failure within the reinforced beam expands. When the reinforced beam attains the ultimate load, the bearing capacity of the beam drops to a greater extent compared to that of the control beam A0.

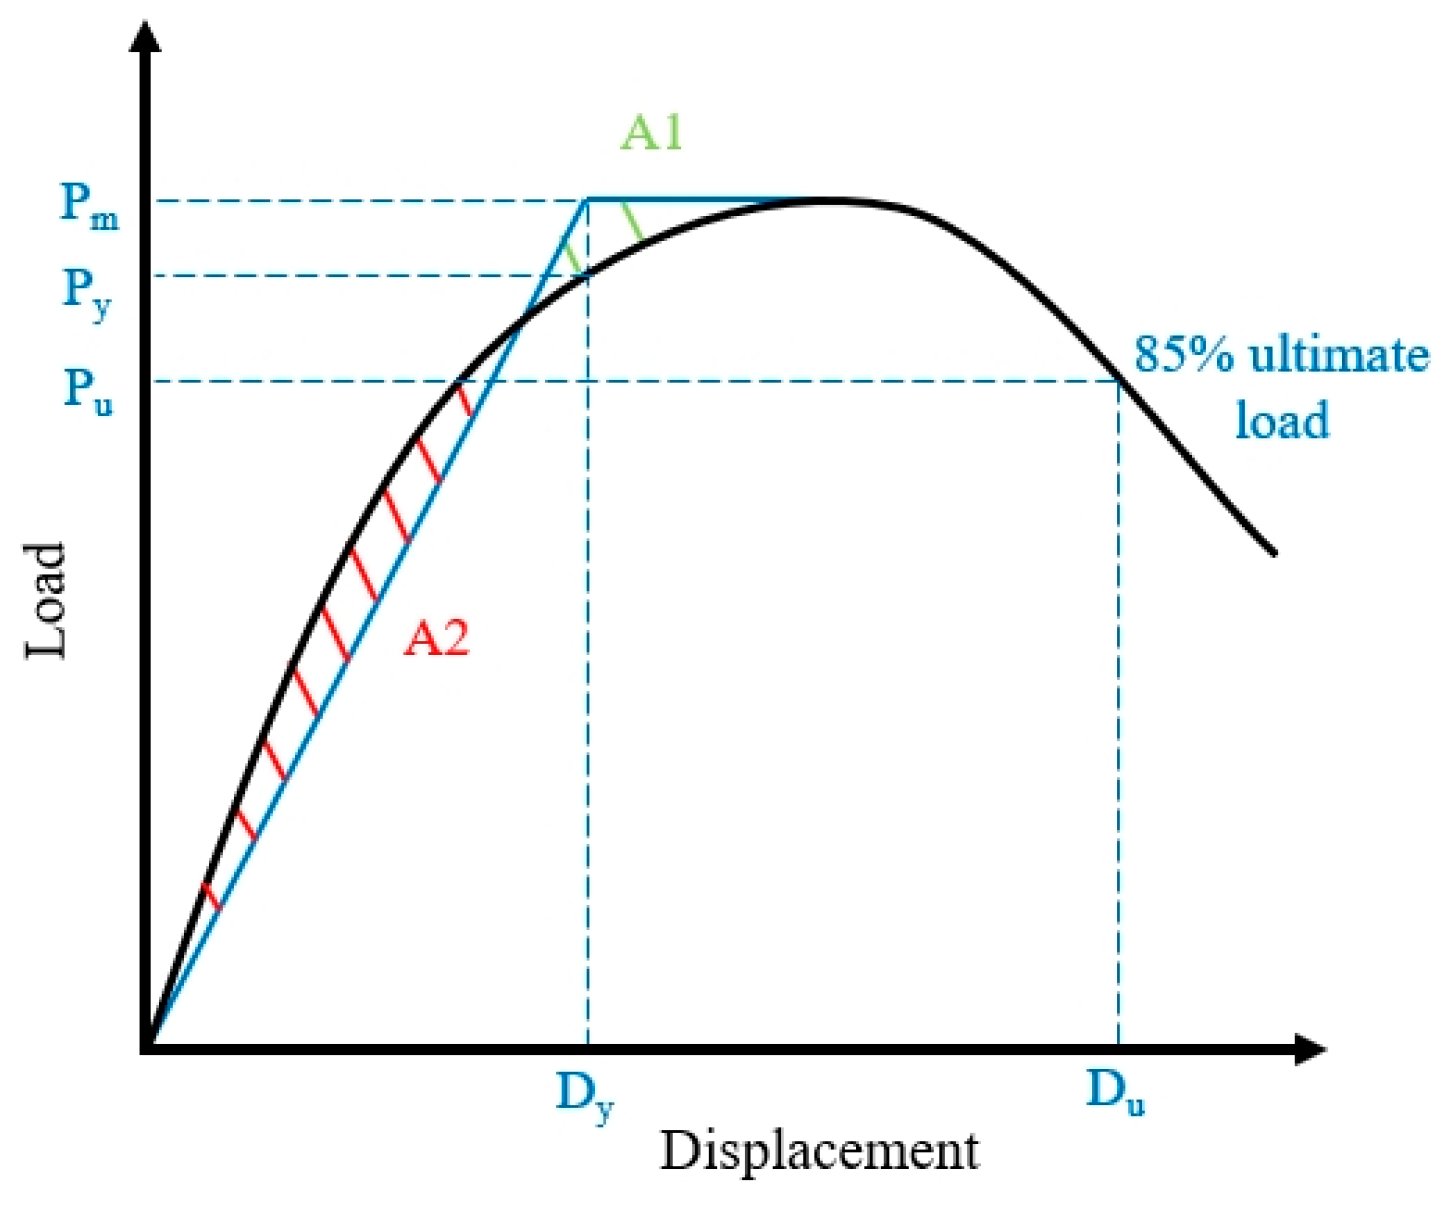
4.4. Deformation Capacity

Ductility is an important indicator to measure the elastoplastic deformation ability of a structure. It refers to the ability of a structural member to withstand deformation without a significant reduction in bearing capacity, and displacement ductility can also be defined as the ability of a structural member to withstand elastoplastic deformation before final failure. In general, the displacement ductility of a structural member can be quantified in terms of displacement ductility coefficients.
According to Ref. [13], the ductility of the strengthened beams is quantitatively evaluated by the ductility (μ), which is defined as μ = Du/Dy, wherein Du is the deflection at the ultimate load, and Dy is the deflection at the yielding load.
From the load–displacement curve of Figure 12, it can be observed that the strengthened beam exhibits no distinct yield point. Hence, the equivalent energy method is employed in this paper to determine the yield point Dy of the specimen. The calculation model is depicted as shown in Figure 13. The original curve is substituted by an ideal elastic–plastic two-segment line with equivalent envelope areas (A1 = A2), and the displacement at the inflection point of the two-segment line is regarded as the yield displacement, with the corresponding point on the curve being the yield point Dy. Commonly, in the descending segment of the load–displacement curve, the displacement corresponding to 85% of the peak load is considered as the ultimate load Du of the component. Nevertheless, as indicated by the load–displacement curve, the specimen undergoes sudden failure after reaching the peak load. Therefore, the ultimate displacement in this paper is taken as the ultimate load Dm. The calculation results are shown in Table 4. The application of high-toughness epoxy mortar for reinforcement on both sides of the beam does not improve the ductility of the beam. This is because the definition of ductility is highly sensitive to the yield displacement, and the reinforcing material, while increasing the ultimate displacement of the beam, also increases its yield displacement.

4.5. Shear Capacity

Compared with the control beam A0, the ultimate loads of the strengthened beams A1, A2, and A3 were increased by 17.6%, 40.9%, and 60.6%, respectively. The epoxy mortar itself has relatively high tensile strength and toughness. When it is applied in the shear reinforcement of RC beams, it can jointly bear the load with the beams and then enhance their shear bearing capacity.
Since the tensile strength of the epoxy mortar is much greater than that of concrete, during the loading process, the original beam concrete fails much earlier than the reinforcement layer. This leads to delamination failure between the protective layer concrete and the core concrete in the reinforced beams. Consequently, the strengthening effect of the reinforcement layer is reduced.

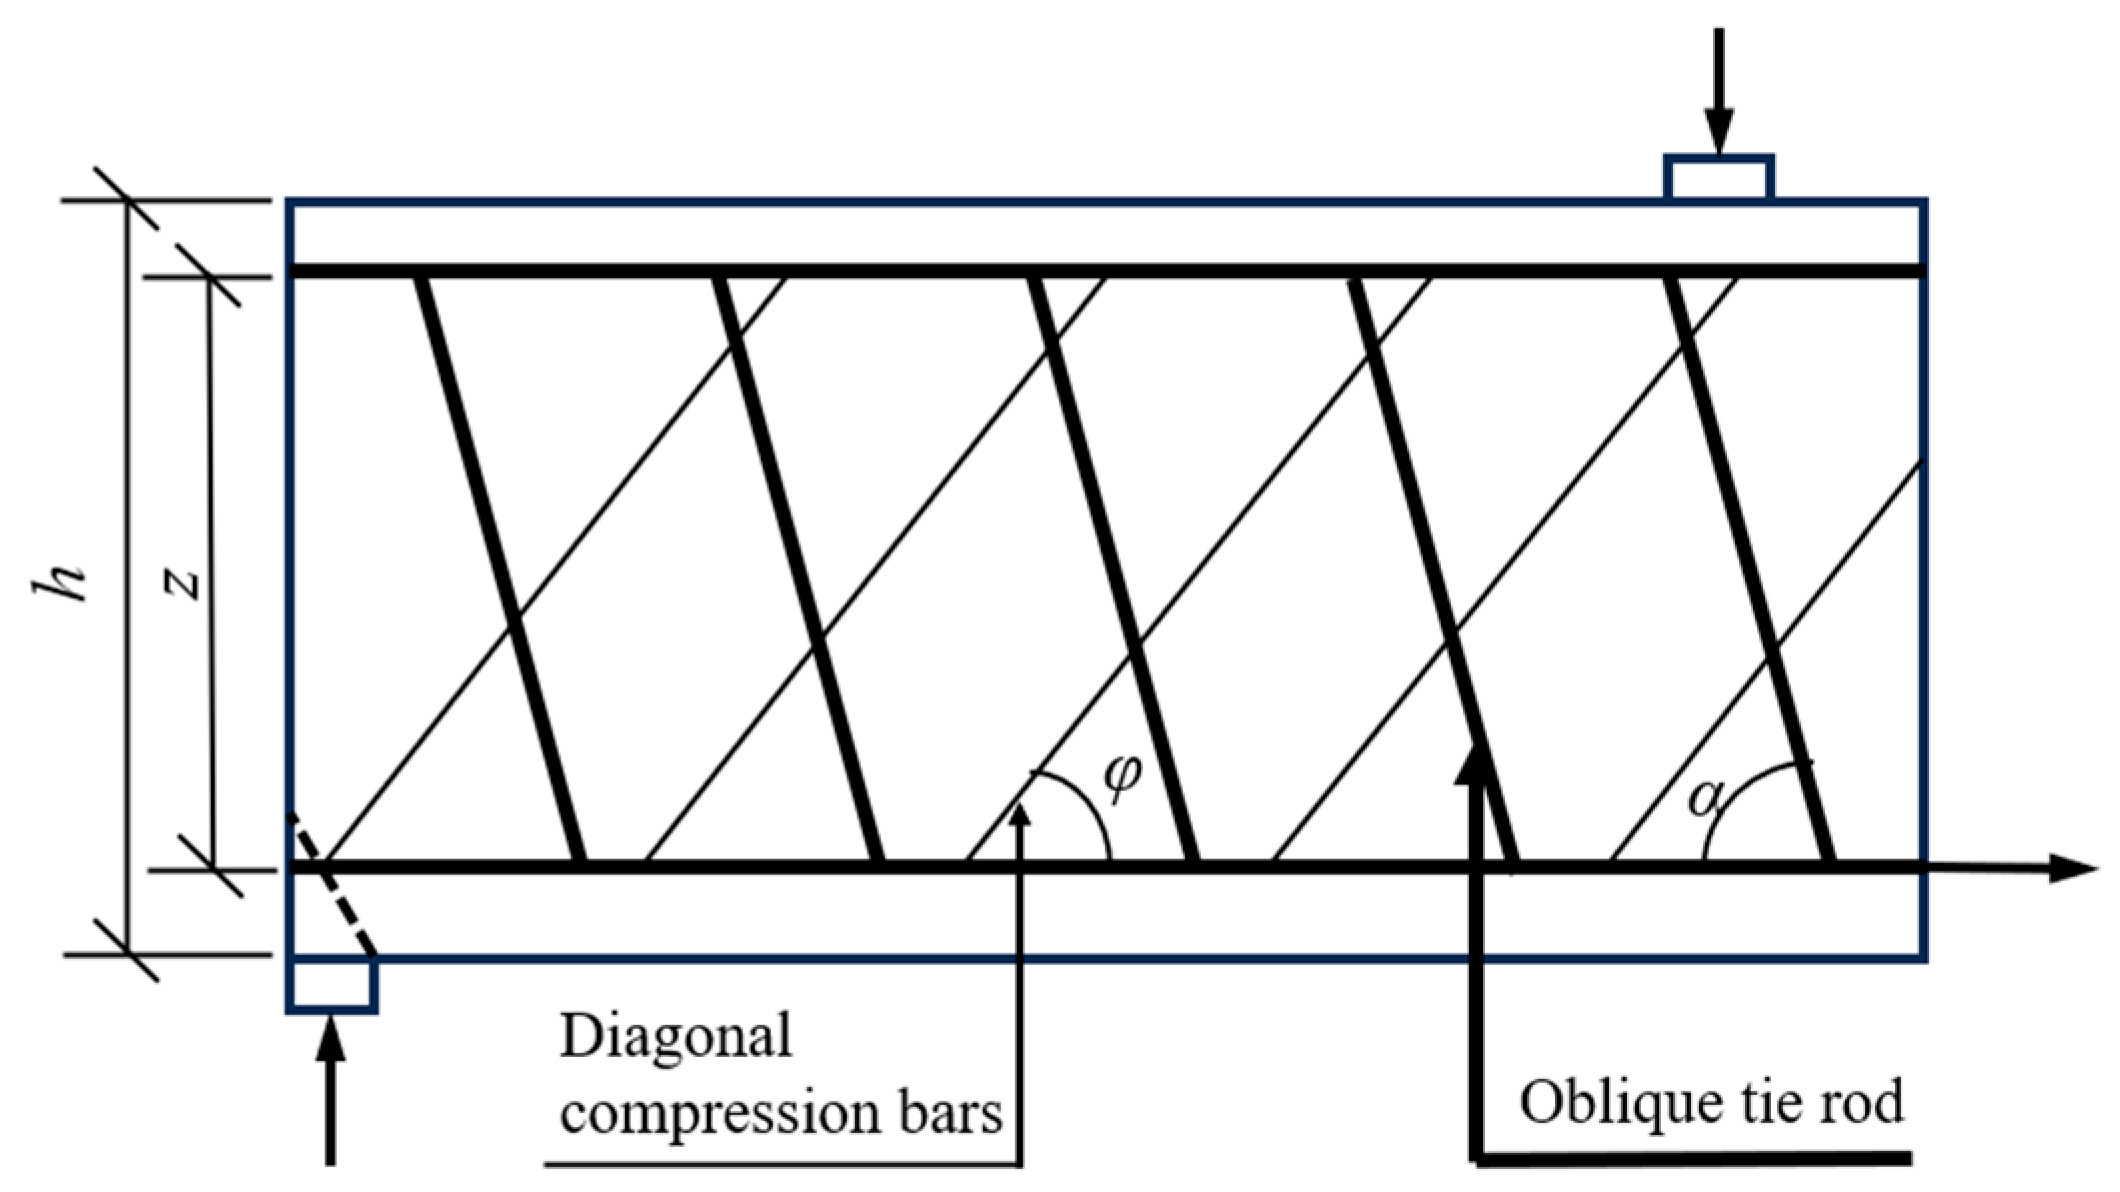
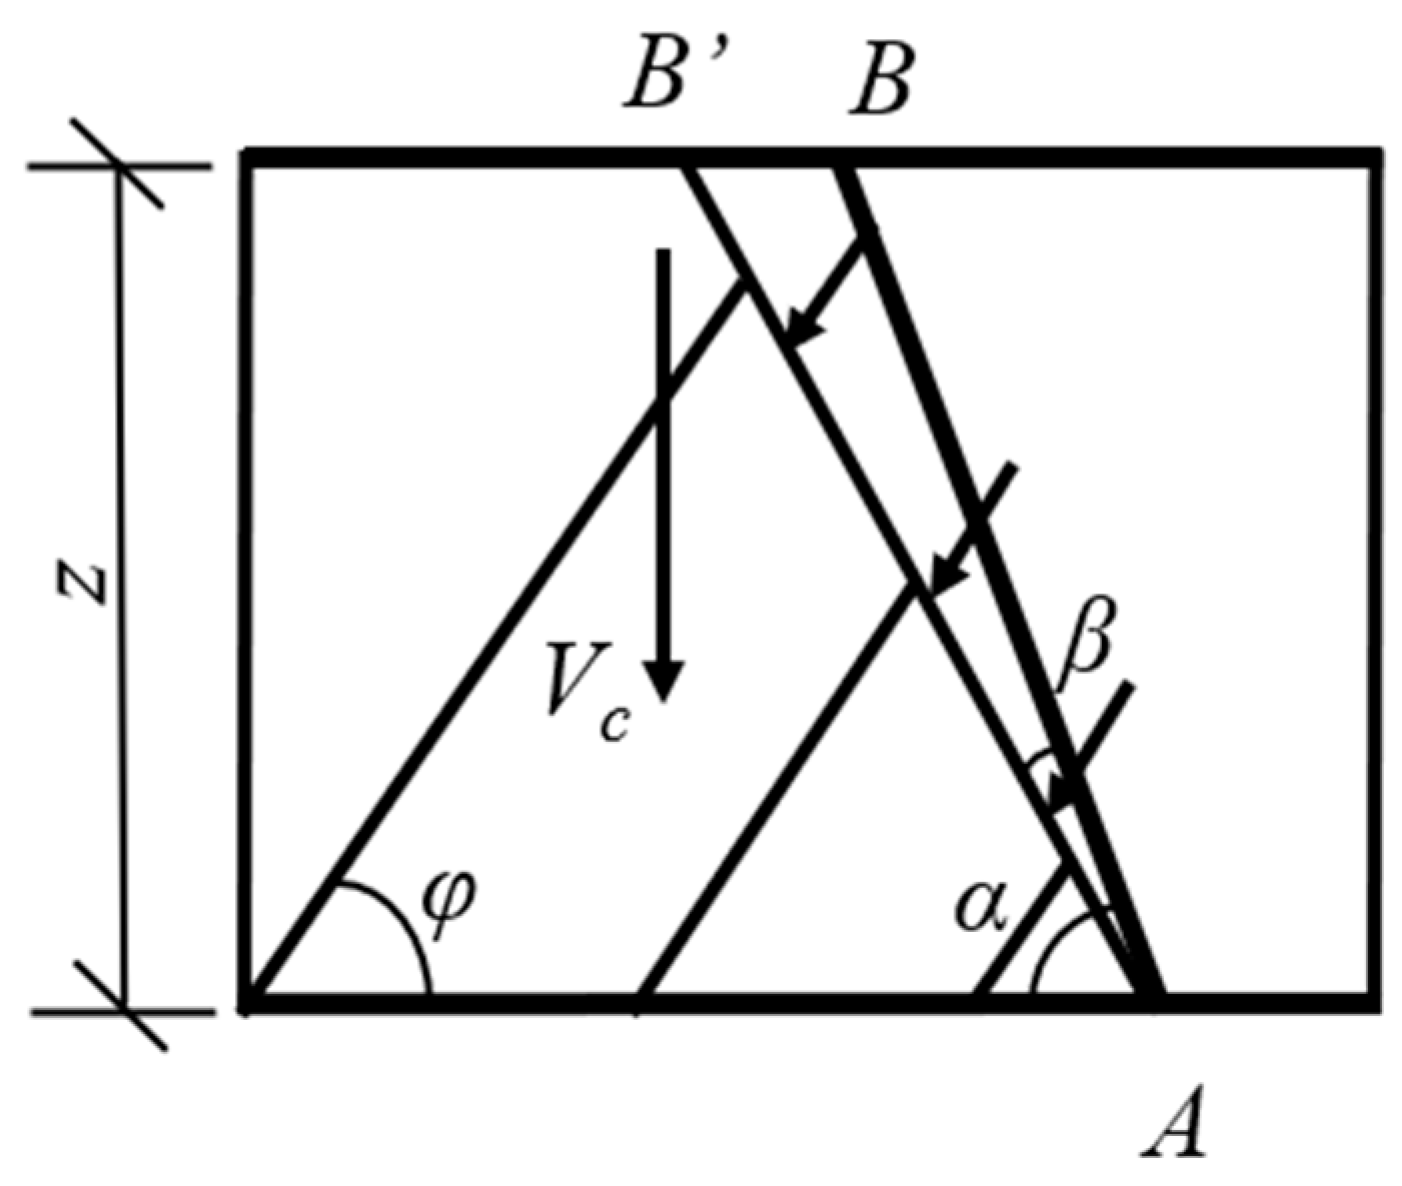
5. Calculation Method of Shear Capacity Based on Truss-Arch Model

The investigation of the shear resistance mechanism for reinforced concrete members in inclined sections remains one of the most significant challenges in structural mechanics. This complexity primarily arises from the evolution of discontinuous stress fields, which are induced by the redistribution of stresses within the cross-section following cracking. In recent years, advancements in computational mechanics have facilitated a deeper understanding of shear resistance mechanisms. Scholars have successively introduced analytical frameworks, including the truss-arch model [37], Modified Compression Field Theory [38], and fixed-angle softened-truss models [39], thereby gradually constructing a comprehensive theoretical foundation for the shear force transmission mechanism in cracked concrete. This paper employs a simplified superposition approach and applies the truss-arch theory to investigate and analyze the shear behavior of the original concrete beam and the high-toughness epoxy mortar overlay. Furthermore, a calculation formula for the shear capacity of the high-toughness epoxy mortar-reinforced beam is proposed.
The truss-arch model, proposed by Watson et al. [40] and Ghee et al. [41], is an extension of the truss model that incorporates the arching action of concrete. Shi et al. [42] undertook a meticulous theoretical analysis of the truss-arch model and derived a calculation formula for the shear capacity based on the truss-arch model. They contrasted the calculated values with the current codes in China and the United States. The results indicate that, in comparison with the codes of the two countries, the shear capacity calculated based on the truss-arch model is in better agreement with the test values, and the truss-arch model can serve as a theoretical model for the shear failure of RC beams. The truss-arch model assumes that the shear forces in the members are shared by both the truss and arch models, meaning that the compressed concrete in the member serves as both the compression flange and the inclined compression member, as well as the arch itself, as shown in Figure 14.
The truss model is shown in Figure 15. In this model, the tensile longitudinal reinforcement and stirrup are treated as tension bars, the concrete is treated as the oblique compression bar, and the strengthening layer epoxy mortar serves as both a tension bar and an oblique compression bar. Together, the stirrups, concrete, and epoxy mortar transfer the shear force to the supports. T is the tension in the oblique tie rod, P is the compression in the oblique compression bar, h is the height of the RC beam, and z is the distance between the upper and lower stringers in the truss model.
(1)
Shear capacity provided by oblique tie rod
The oblique tie rod model is shown in Figure 16, where the stirrups and epoxy mortar work together to bear the truss tension.
T = ρ s f y v b + f t b m z cot φ
where ρs and fyv are the stirrup ratio and stirrup yield strength, respectively; ft is the tensile strength of epoxy mortar; b and bm are the original beam and reinforcement layer widths, and φ is the angle between the truss diagonal compression rod and the beam axis; α is the angle of the oblique tie rod, and α = 90° because the stirrups were arranged vertically along the beam axis.
The vertical projection of the truss tension T constitutes the shear force borne by the truss tie rod.
V t u = T sin α = ρ s f y v b + f t b m z cot φ
(2)
Shear capacity provided by oblique compression bar
The oblique compression bar model is shown in Figure 17.
The overall compression exerted on the compression bar is
C = σ c b z cos φ
The vertical projection of the truss compression C constitutes the shear force borne by the truss compression bar.
V c = C sin φ = σ c b z cos φ sin φ
(3)
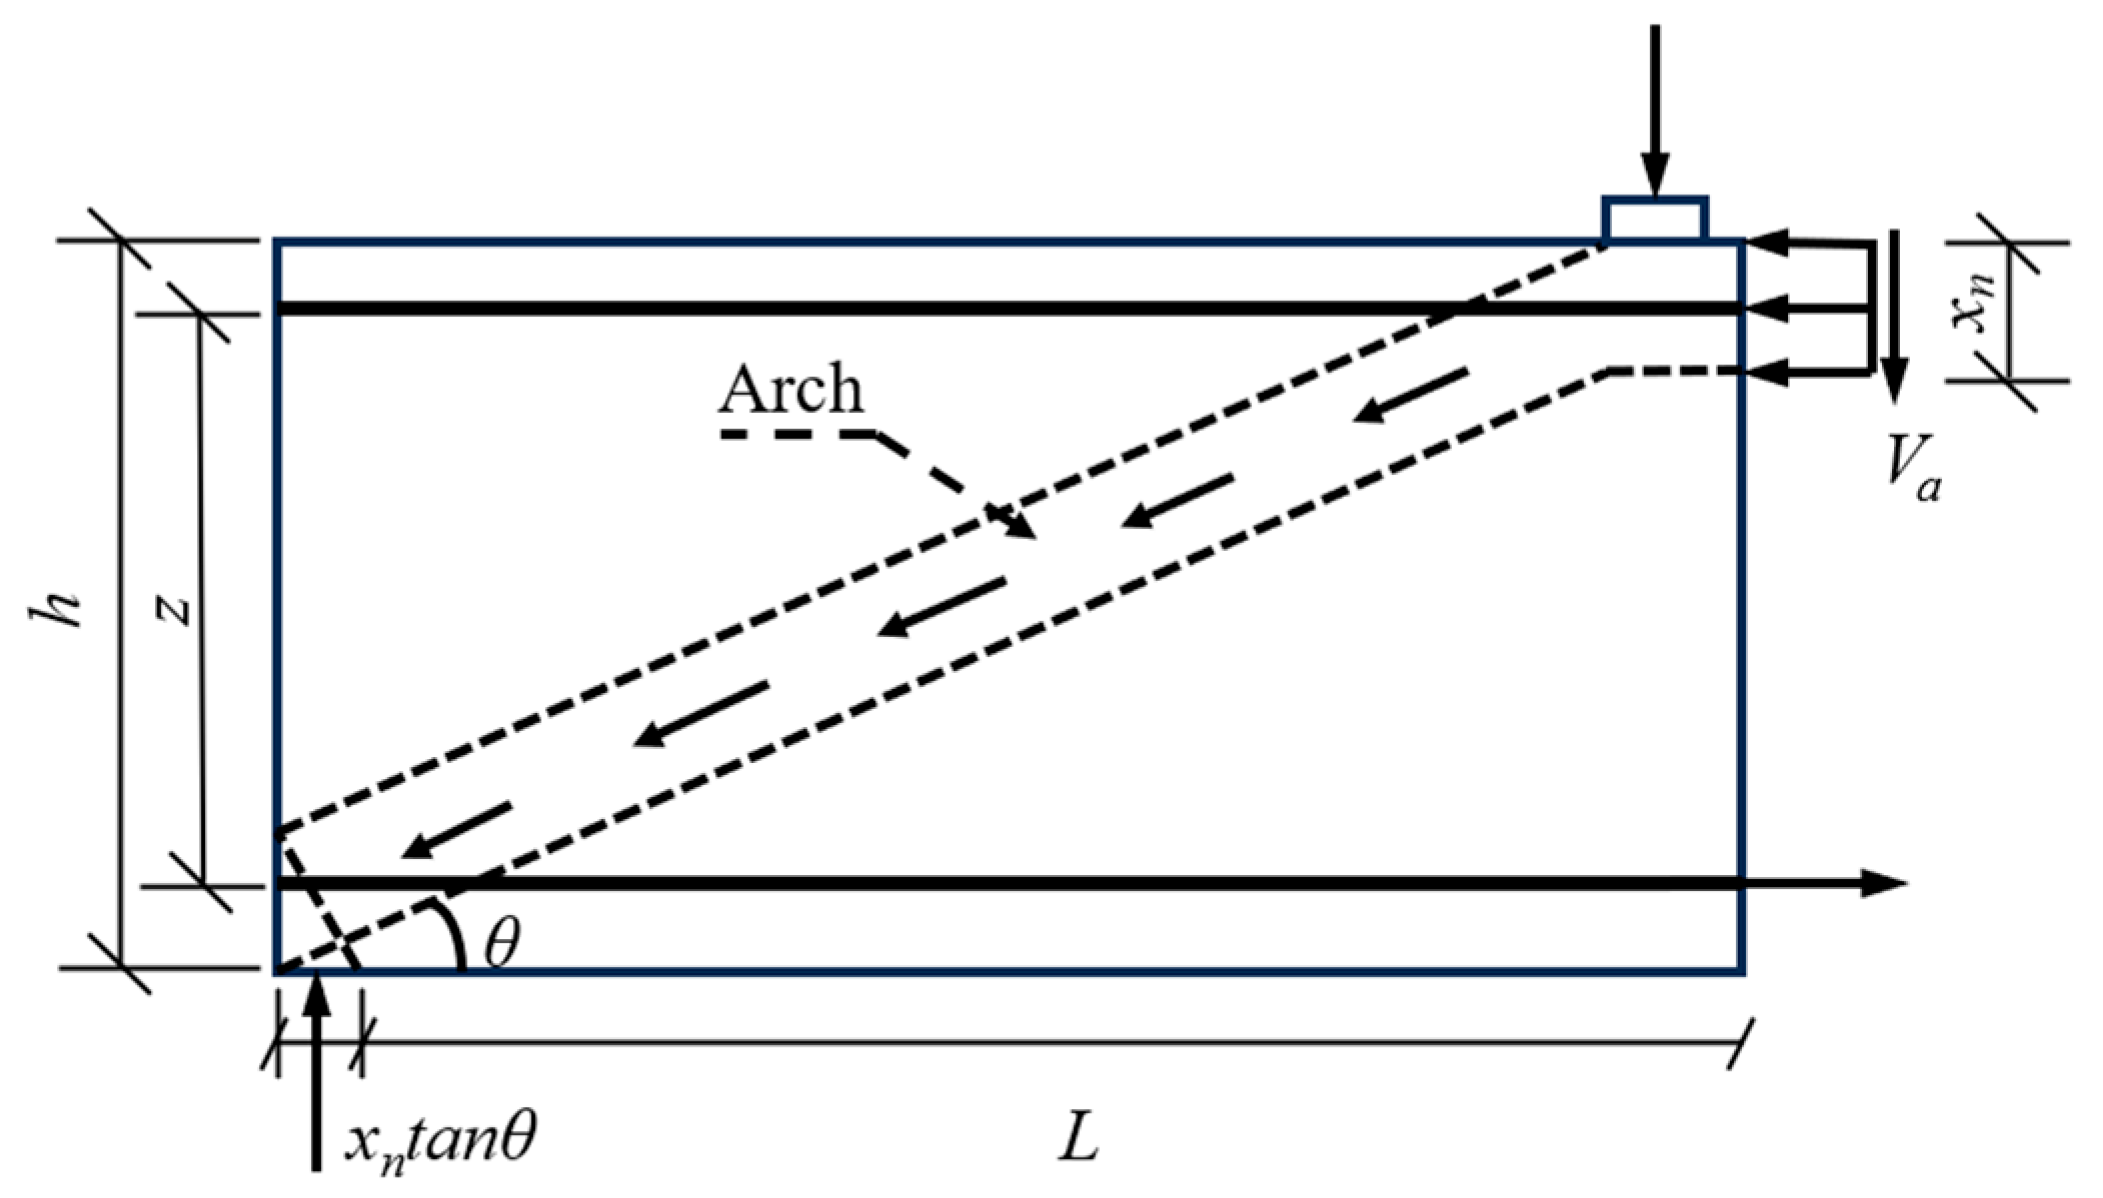
Shear capacity provided by arch
In an ideal scenario, when C = T, as depicted in Figure 18, the truss compression bar and the truss tie rod concurrently attain their maximum strength and fail simultaneously. Nevertheless, in actual circumstances, the stirrups are often provided in excessive amounts. In this situation, the stirrups fail to yield, and the concrete is crushed before attaining its compressive strength. In another case, when the stirrups yield, the concrete has not yet reached its compressive strength, and the failure is ductile with a certain degree of post-yielding strain and a shear force acting in the form of an arch.
At this point, the stress in the RC beam is as follows:
ρ s f y v b + f t b m z cot φ = σ c b z cos φ
σ c can be expressed as follows:
σ c = ρ s f y v sin φ + f t b m sin φ b
The excess strength of an RC beam, σa, can be represented as follows:
σ a = ν f c + f c , h y cos φ θ σ c
where ν is the softening coefficient of concrete, which will be discussed later; fc,hy is the compressive strength of epoxy mortar.
Substituting Equation (6) into Equation (7) provides the following:
σ a = ν f c + f c , h y cos φ θ ρ s f y v sin φ + f t b m sin φ b
At this moment, the shear force by the arch is as follows:
V a = σ a sin θ b x n
Based on the geometric relations depicted in Figure 18, the following can be derived:
tan θ = h x n / L + x n tan θ
where L is the span of the specimen, providing the following:
tan θ = 1 2 L x n 2 + 4 h x n x n L x n
sin θ = h x n h x n 2 + L + x n tan θ 2
As can be observed from the figure, the horizontal projected length of the cracking zone is zcotφ, and the height of the compression zone of the RC beam within the height of the compression zone is xn = hsinφcotφ, which provides the following:
V a = ν f c b + f c , h y b m cos φ θ ρ s f y v b sin φ + f b b m 2 b sin θ sin φ cos φ h
(4)
Shear capacity calculation
Substituting Equation (6) into Equation (3) and incorporating the concrete softening coefficient ν, the concrete of the RC beam and the epoxy mortar are calculated separately, providing the following:
V c = ν ρ s f y v b + f t b m 2 b z cos φ
This truss-arch model comprehensively considers the compressive effect of concrete, the tensile effect of reinforcement, and the tensile and compressive effects of epoxy mortar in the components. Therefore, the shear capacity of the specimens is the sum of the shear capacities of the truss model and the arch model, which is expressed by the formula as follows: Vu = Vtu + Vc + Va. By substituting Equations (2), (13), and (14), the calculation formula for the shear capacity of an RC beam reinforced with high-strength and high-toughness epoxy mortar based on the truss-arch model can be obtained:
V u = ρ s f y v b + f t b m z cot φ + ν ρ s f y v b + f t b m 2 b z cos φ + sin θ sin φ cos φ h ν f c b + f c , h y b m cos φ θ ρ s f y v b sin φ + f t b m 2 sin φ b
The experiments indicate that, in the failure process of the strengthened beam, the original concrete inside the strengthened beam is damaged prior to the reinforcement layer, and this will cause the epoxy mortar of the reinforcement layer to peel from the original beam and be unable to bear the force in coordination with the original beam. Therefore, the shear capacity of the reinforced beam cannot increase linearly with the increase in the thickness of the reinforcement layer. This paper will introduce the thickness reduction coefficient η, which is related to the thickness of the original beam and that of the reinforcement layer, specifically
η = 0.7 b b m + b
Substituting Equation (16) into Equation (15) provides the following:
V u = ρ s f y v b + f t η b m z cot φ + ν ρ s f y v b + f t ( η b m ) 2 b z cos φ + sin θ sin φ cos φ h ν f c b + f c , h y η b m cos φ θ ρ s f y v b sin φ + f t η b m 2 sin φ b
(5)
Ascertain the values of the calculation parameters
① Oblique compression bar inclination angle
The angle φ is related to the failure mode of the beam, and many factors will affect the value of the included angle, such as the section size, concrete strength, stirrup ratio, load application method, and shear span to effective depth ratio. And the angle φ generally varies within the range of 26.6°~45°. In this paper, a conservative assumption is made that the dip angle φ is taken as 45°; that is, cotφ = 1 [43,44,45].
② Softening coefficient of concrete
After concrete is subjected to shear cracking, the stress state of the concrete element turns into a biaxial stress state of tension and compression. The compressive strength of concrete and the corresponding compressive strain are both lower than those in the uniaxial compression state, which is manifested in the codes of various countries. The softening coefficient of concrete adopted in this article is presented as ν = 0.7-fc/120. Moreover, when ν < 0.4, ν = 0.4.
(6)
Verifications of the proposed calculation methods
Using the above formula, the shear resistance capacity of the control beam A0 and the reinforced beams A1, A2, and A3 were calculated and verified, as shown in the following Table 5. It can be observed from the table that the calculated values are in good accordance with the experimental values, within the error margin of the computational model as reported in Ref. [41], and this can offer theoretical references for the practical reinforcement application of high-strength and high-toughness epoxy mortar to RC beams.

6. Conclusions

This study investigated the shear performance of the RC beams strengthened by high-strength and high-toughness epoxy mortar. The influence of reinforcement layer thickness on the shear performance was analyzed, and the feasibility and effectiveness of this reinforcement material were verified. The truss arch model was applied to calculate the shear capacity of the high-strength and high-toughness epoxy mortar-strengthened RC beams. The following conclusions can be drawn:
(1)
All the beams in the experiment suffered shear failure. The shear capacity and ductility of the RC beams strengthened by high-strength and high-toughness epoxy mortar were significantly improved. The ultimate shear capacity increased by up to 60.6%, and the corresponding displacement increased by 43.2%.
(2)
The high-strength and high-toughness epoxy mortar demonstrates superior adhesion to concrete. In all the strengthened beams, no debonding failure occurred between the reinforcement layer and the original concrete, and there was no slippage. Cracks were not identified in the reinforcement layer prior to the failure of the beams. The maximum strain of the epoxy mortar is conspicuously greater than that of common reinforcing bars, facilitating its ability to withstand forces throughout the entire process.
(3)
The “thickness reduction coefficient” was introduced into the shear capacity formula of the reinforced beam based on the truss-arch model. The maximum shear capacity was finally calculated and has a closely matched test result.

Author Contributions

W.L.: Conceptualization, Methodology, Supervision, Validation; T.W.: Data curation, Writing—Original draft preparation, Software; L.L.: Visualization; C.J.: Methodology. All authors have read and agreed to the published version of the manuscript.

Funding

This study was funded by the Guangxi Science and Technology Planning Project (GuikeAB23075093, GuikeAD21159010), the Doctoral Foundation of Guangxi University of Science and Technology (No: 21Z26).

Institutional Review Board Statement

Not applicable.

Informed Consent Statement

Not applicable.

Data Availability Statement

The raw data supporting the conclusions of this article will be made available by the authors upon request.

Acknowledgments

The authors would like to acknowledge the Guangxi Science and Technology Planning Project (GuikeAB23075093, GuikeAD21159010), the Doctoral Foundation of Guangxi University of Science and Technology (No: 21Z26).

Conflicts of Interest

The authors declare no conflicts of interest.

References

  1. Liang, X.Z.; Peng, J.Z.; Ren, R.B. A state-of-the-art review: Shear performance of the concrete beams reinforced with FRP bars. Constr. Build. Mater. 2023, 364, 129996. [Google Scholar] [CrossRef]
  2. Elsamak, G.; Ghalla, M.; Hu, J.W.; Albogami, A.; Emara, M.; Ahmed, S.O. Embedded aluminum sections and prestressed high-performance concretes for improving shear performance of RC beams. Case Stud. Constr. Mater. 2025, 22, e04168. [Google Scholar] [CrossRef]
  3. Moussa, A.M.A.; Said, H.O.A.; Khodary, F.; Hassanean, Y.A. Shear behavior of high-strength concrete beams reinforced with carbon fiber-reinforced polymer bars. Eng. Struct. 2025, 325, 119411. [Google Scholar] [CrossRef]
  4. Peng, K.D.; Huang, J.Q.; Huang, B.T.; Xu, L.Y.; Dai, J.G. Shear strengthening of reinforced concrete beams using geopolymer-bonded small-diameter FRP bars. Compos. Struct. 2023, 305, 116513. [Google Scholar] [CrossRef]
  5. Jin, L.; Qin, P.; Zhang, J.; Li, D.; Jiang, X.; Du, X. Size effect in shear failure of RC beams reinforced with CFRP sheets: Influences of CFRP adhesion angle and shear-span ratio. Eng. Struct. 2025, 326, 119543. [Google Scholar] [CrossRef]
  6. Cao, T.N.T.; Nguyen, X.H.; Nguyen, H.C.; Le, D.D. Shear performance of short-span FRP reinforced concrete beams strengthened with CFRP and TRC. Eng. Struct. 2021, 242, 112548. [Google Scholar] [CrossRef]
  7. Zhou, J.; Leng, J.; Zhang, Z.; Du, J.; Zou, Y. Experimental investigation on shear behavior of damaged and acid rain-corroded RC T-beams strengthened with ultra-high-performance concrete. Eng. Struct. 2025, 327, 119618. [Google Scholar] [CrossRef]
  8. Guo, R.; Ren, Y.; Li, M.Q.; Hu, P.; Du, M.; Zhang, R. Experimental study on flexural shear strengthening effect on low-strength RC beams by using FRP grid and ECC. Eng. Struct. 2021, 227, 111434. [Google Scholar] [CrossRef]
  9. Park, R.; Paulay, T. Reinforced Concrete Structures; John Wiley and Sons: New York, NY, USA, 1975. [Google Scholar]
  10. Polder, R.B.; Peelen, W.H.A.; Courage, W.M.G. Non-traditional assessment and maintenance methods for aging concrete structures-technical and non-technical issues. Mater. Corros. 2012, 63, 1147–1153. [Google Scholar] [CrossRef]
  11. Ruggieri, S.; Calò, M.; Cardellicchio, A.; Uva, G. Analytical-mechanical based framework for seismic overall fragility analysis of existing RC buildings in town compartments. Bull. Earthq. Eng. 2022, 20, 8179–8216. [Google Scholar] [CrossRef]
  12. Ruggieri, S.; Porco, F.; Uva, G.; Vamvatsikos, D. Two frugal options to assess class fragility and seismic safety for low-rise reinforced concrete school buildings in Southern Italy. Bull. Earthq. Eng. 2021, 19, 1415–1439. [Google Scholar] [CrossRef]
  13. Li, R.; Deng, M.; Chen, H.; Zhang, Y. Shear strengthening of RC shear-deficient beams with highly ductile fiber-reinforced concrete. Structures 2022, 44, 159–170. [Google Scholar] [CrossRef]
  14. Yu, F.; Guo, S.Q.; Wang, S.L.; Fang, Y. Experimental study on high pre-cracked RC beams shear-strengthened with CFRP strips. Compos. Struct. 2019, 225, 111163. [Google Scholar] [CrossRef]
  15. Peng, G.; Hu, X.; Niu, D.; Zhong, S.; Huang, D. Experimental study on the shear behavior of RC beams strengthened with cementitious grout. Structures 2023, 50, 1403–1415. [Google Scholar] [CrossRef]
  16. Deng, M.K.; Li, Q.Q.; Ma, F.D.; Huang, Z. Experimental study on the shear behavior of RC beams reinforced by high ductile concrete. Eng. Mech. 2020, 37, 55–63. (In Chinese) [Google Scholar]
  17. Karayannis, C.G.; Chalioris, C.E.; Sirkelis, G.M. Local retrofit of exterior RC beam–column joints using thin RC jackets—An experimental study. Earthq. Eng. Struct. Dyn. 2008, 37, 727–746. [Google Scholar] [CrossRef]
  18. Ombres, L.; Verre, S. Shear strengthening of reinforced concrete beams with SRG (Steel Reinforced Grout) composites: Experimental investigation and modelling. J. Build. Eng. 2021, 42, 103047. [Google Scholar] [CrossRef]
  19. Sahranavard, S.; Jahangir, H.; Kazemi, H.H. An experimental and numerical investigation of RC slabs externally strengthened by perforated steel plates. Structures 2022, 45, 1239–1252. [Google Scholar] [CrossRef]
  20. Adhikary, B.B.; Mutsuyoshi, H.; Sano, M. Shear strengthening of reinforced concrete beams using steel plates bonded on beam web: Experiments and analysis. Constr. Build. Mater. 2000, 14, 237–244. [Google Scholar] [CrossRef]
  21. Deng, Y.; Li, Z.; Zhang, H.; Corigliano, A.; Lam, A.C.; Hansapinyo, C.; Yan, Z. Experimental and analytical investigation on flexural behaviour of RC beams strengthened with NSM CFRP prestressed concrete prisms. Compos. Struct. 2021, 257, 113385. [Google Scholar] [CrossRef]
  22. Xue, Y.J.; Wang, W.W.; Tian, J.; Wu, Z.H. Experimental study and analysis of RC beams shear strengthened with FRP/SMA composites. Structures 2023, 55, 1936–1948. [Google Scholar] [CrossRef]
  23. Alshamrani, S.; Rasheed, H.A.; Salahat, F.H.; Borwankar, A.; Divilbiss, N. Seismic flexural behavior of CFRP strengthened reinforced concrete beams secured with fiber anchors. Eng. Struct. 2024, 305, 117728. [Google Scholar] [CrossRef]
  24. Deng, L.; Liu, Y.; Zhou, Z.; Zou, Y.; Shi, W.; Jin, Z.; Zhong, Q. Flexural performance of BFRP grid–ECC in strengthening damaged RC beams. Structures 2024, 69, 107420. [Google Scholar] [CrossRef]
  25. Su, Y.; Wang, X.; Wu, C.; Xu, M.; Ma, L.; Jin, C. Punching shear behavior of RC slab-column connections enhanced with ECC in core area. Structures 2025, 74, 108567. [Google Scholar] [CrossRef]
  26. Hu, Z.; Elchalakani, M.; Hassanli, R.; Ran, H.; Sadakkathulla, M.A.; Nie, S. Structural health monitoring of lightweight concrete beams strengthened with ultra-lightweight ECC-FRP mesh composite. Eng. Struct. 2025, 322, 119224. [Google Scholar] [CrossRef]
  27. Hussain, H.K.; Zhang, L.Z.; Liu, G.W. An experimental study on strengthening reinforced concrete T-beams using new material poly-urethane-cement (PUC). Constr. Build. Mater. 2013, 40, 104–117. [Google Scholar] [CrossRef]
  28. Moy, C.K.S.; Revanna, N. Experimental and DIC Study of Reinforced Concrete Beams Strengthened by Basalt and Carbon Textile Reinforced Mortars in Flexure. Buildings 2023, 13, 1765. [Google Scholar] [CrossRef]
  29. Yang, L.M.; Long, X.F.; Cen, Q.H. Research on the Performance of Epoxy Resin Concrete for Maintenance and Reinforcement. J. Highw. Transp. Res. Dev. 2018, 14, 176–178. (In Chinese) [Google Scholar]
  30. Liu, K.F.; Xu, Z.S. Research on the Fire Resistance Performance of Epoxy Resin Concrete. China Concr. Cem. Prod. 2015, 9, 6–9. (In Chinese) [Google Scholar] [CrossRef]
  31. Chen, J.B.; Deng, A.Z.; Chen, K.; Rong, X.; Liu, K. Temperature sensitivity of mechanical property of epoxy resin mortar. New Chem. Mater. 2016, 44, 249–251, 253. (In Chinese) [Google Scholar]
  32. Du, Y.X.; Shao, X.; Chu, S.H.; Zhou, F.; Su, R.K.L. Strengthening of preloaded RC beams using prestressed carbon textile reinforced mortar plates. Structures 2021, 30, 735–744. [Google Scholar] [CrossRef]
  33. Meng, Y. High Toughness Resin Concrete with Steel Wire Mesh and the Reinforcement Theoretical Research on Prestressed Concrete Simply Supported Plate Beam Bridge. Ph.D. Thesis, Southwest Jiaotong University, Chengdu, China, 2015. Available online: https://kns.cnki.net/KCMS/detail/detail.aspx?dbcode=CDFD&dbname=CDFDLAST2021&filename=1017022357.nh (accessed on 6 April 2025). [CrossRef]
  34. Li, W.Z.; Huang, X.S.; Liu, X.H.; Wen, T.; Jing, C.; Li, L. Flexural Performance of Reinforced Concrete Beams Strengthened with a Novel High-Strength and High-Toughness Epoxy Mortar Thin Layer. Appl. Sci. 2024, 14, 3999. [Google Scholar] [CrossRef]
  35. Li, W.Z.; Huang, X.S.; Liu, X.H.; Wen, T.; Jing, C.; Li, L. Preparation and mechanical properties of novel epoxy mortar incorporating hybrid toughening constituents. Iran. J. Sci. Technol. Trans. Civ. Eng. 2024, 49, 641–665. [Google Scholar] [CrossRef]
  36. DL/T 5193-2021; Technical Specification for Epoxy Resin Mortar. National Energy Administration: Beijing, China, 2021. (In Chinese)
  37. Jin, C.; Wu, C.; Pan, Z.; Meng, S. A truss-arch model-based method for calculating shear walls with small shear span ratio. J. Build. Eng. 2023, 80, 108052. [Google Scholar] [CrossRef]
  38. Hippola, H.M.S.S.; Wijesundara, K.K.; Nascimbene, R. Response of shear critical reinforced concrete frames and walls under monotonic loading. Eng. Struct. 2022, 251, 113483. [Google Scholar] [CrossRef]
  39. Haggin, J. Molecular Sieve with Unique Structural Features Synthesized. Chem. Eng. News Arch. 1994, 72, 23. [Google Scholar] [CrossRef]
  40. Watson, S.; Zahn, F.A.; Park, R. Confining Reinforcement for Concrete Columns. J. Struct. Eng. 1994, 120, 1798–1824. [Google Scholar] [CrossRef]
  41. Priestley, M.J.N.; Verma, R.; Xiao, Y. Seismic Shear Strength of Reinforced Concrete Columns. J. Struct. Eng. 1994, 120, 2310–2329. [Google Scholar] [CrossRef]
  42. Shi, Q.X.; Wang, P.; Wang, Q.W. Shear capacity calculation analysis of reinforced concrete beams based on truss-arch model. J. Civil. Archit. Environ. Eng. 2013, 35, 7–12. (In Chinese) [Google Scholar] [CrossRef]
  43. Guan, P.W. Research on Seismic Shear Capacity of Columns within Yield Hinge Regions. Ph.D. Thesis, Hunan University, Changsha, China, 2001. (In Chinese). [Google Scholar]
  44. Pang, X.B.; Hsu, T.T.C. Fixed Angle Softened Truss Model for Reinforced Concrete. ACI Struct. J. 1996, 93, 197–207. [Google Scholar]
  45. Al-Nahlawi, K.A.; Wight, J.K. Beam analysis using concrete tensile-strength in truss models. ACI Struct. J. 1992, 89, 284–290. [Google Scholar]
Figure 1. Dimensions and rebar of RC beam specimens.
Applsci 15 06266 g001
Figure 2. Section details and strengthening of test beams.
Applsci 15 06266 g002
Figure 3. Sample preparation.
Applsci 15 06266 g003
Figure 4. Stress–strain curves of epoxy resin mortar. (a) Tensile stress–strain relationship of epoxy mortar. (b) Compressive stress–strain relationship of epoxy mortar.
Applsci 15 06266 g004
Figure 5. Load and test device.
Applsci 15 06266 g005
Figure 6. Loading device of the specimens.
Applsci 15 06266 g006
Figure 7. Load–deflection/stirrup strain curves.
Applsci 15 06266 g007
Figure 8. RC beam bottom crack.
Applsci 15 06266 g008
Figure 9. Load–longitudinal reinforcement strain curves.
Applsci 15 06266 g009
Figure 10. Load–stirrup strain curves.
Applsci 15 06266 g010
Figure 11. Failure modes of test beams.
Applsci 15 06266 g011
Figure 12. Load–deflection curves.
Applsci 15 06266 g012
Figure 13. Calculation model of ductility.
Applsci 15 06266 g013
Figure 14. The truss arch model.
Applsci 15 06266 g014
Figure 15. The truss model for RC beam.
Applsci 15 06266 g015
Figure 16. Truss model for RC beam under tension.
Applsci 15 06266 g016
Figure 17. Truss model for RC beams under stress.
Applsci 15 06266 g017
Figure 18. The arch model for RC beam.
Applsci 15 06266 g018
Table 1. Parameters of specimens.
SpecimenL0/mmb × h/(mm × mm)λa/mmbm/mm
A02600150 × 3003.0800
A12600150 × 3003.08005
A22600150 × 3003.080010
A32600150 × 3003.080015
Notes: b, h, and L0 are the width, depth, and effective span of the beams, respectively. a is the shear span length of beams. bm is the thickness of the reinforcement layer.
Table 2. Mass ratio of each component of epoxy resin mortar.
Epoxy ResinDiluentToughenersDefoamerCuring AgentSilane CouplingFly AshQuartz Sand
10010101.5333184.5430.5
Table 3. Main parameters of specimens.
Steel RebarDiameter
(mm)
Yield Strength (MPa)Ultimate Strength (MPa)Yield Strain (με)Notes
HRB400254356012016Tensile reinforcement
HRB400164325991985Compressive reinforcement
HPB30084005571978Stirrups
Table 4. Calculation results of ductility.
SpecimenDy (mm)Du (mm)Py (mm)μ (mm)
A05.586.92261.631.12
A15.686.84317.531.20
A27.749.05382.921.17
A38.539.93434.671.16
Table 5. Comparison of the experimental ultimate load and calculated values.
Specimenbm (mm)Pu,exp (kN)Vu,exp (kN)Vu,cal (kN) V u , c a l V u , exp
A00292.1140.0104.20.71
A110343.6171.8143.80.83
A220411.5205.8175.30.85
A330463.2231.6200.30.85
Average value0.81
Notes: P u , e x p , V u , e x p , and V u , c a l represent the experimental ultimate load, the actual shear capacity, and the calculated values, respectively. The experimental ultimate load V u , e x p is taken as half of the total force obtained from the jack P u , e x p , i.e., V u , e x p = P u , e x p / 2 .
Disclaimer/Publisher’s Note: The statements, opinions and data contained in all publications are solely those of the individual author(s) and contributor(s) and not of MDPI and/or the editor(s). MDPI and/or the editor(s) disclaim responsibility for any injury to people or property resulting from any ideas, methods, instructions or products referred to in the content.

