Article

The Spatial and Non-Spatial Analyses of the Bike-Sharing Service in Small Urban Areas in Slovakia: The Case Study

by
Stanislav Kubaľák
,
Kristína Ovary Bulková
* and
Martin Holienčík
Department of Quantitative Methods and Economic Informatics, Faculty of Operation and Economics of Transport and Communication, University of Žilina, 010 01 Žilina, Slovakia
*
Author to whom correspondence should be addressed.
Appl. Sci. 2025, 15(11), 6240; https://doi.org/10.3390/app15116240
Submission received: 2 May 2025 / Revised: 26 May 2025 / Accepted: 28 May 2025 / Published: 1 June 2025

Abstract

The aim of this paper is to develop a case study of the recent situation of a bike-sharing service in a chosen small urban area. Žilina is situated in northern Slovakia, with a population exceeding 80,000 and an area of 80.03 km2. This study represents a complex analysis of the available data on a bike-sharing service, as well as data on bicycle rentals from a local provider. Both were processed by the QGIS software. First, the number of rentals and the attractiveness of the bicycle stations were evaluated, taking into account the seasons from 2019 to the end of the 2023 season. Spatial analysis, based on marking the availability of the isochrones of the 32 bike-sharing stations at the end of the season 2024, was conducted considering the map’s characteristics. The analysis was supplemented with a questionnaire survey of bike-sharing service users. This study provides an overall view of the recent situation of a bike-sharing service operating for five years in a small urban area with the intention of identifying deficiencies and improving the service for future system expansion. The originality of this paper lies in the processing of a wide dataset with an extensive set of control variables and the connection of spatial and non-spatial analyses. The approaches and results can serve as proposals for introducing or designing bike-sharing services in other small urban areas for researchers.

1. Introduction

People commuting to work, school, or hobbies are looking for alternative transportation to individual car transport because of the cumulative traffic density in, as well as out of, cities. It is in the interests of those who are competent to transfer the largest possible number of people to public passenger transport or to motivate them to use bicycles or walk for short routes.
The bicycle is a strong alternative, which is becoming more and more popular, especially regarding transport within agglomeration. It is considered a sustainable and extremely convenient way for population mobility [1].
For this reason, the emphasis has been placed on enforcing and supporting bicycle transportation in recent years. Some European countries, like the Netherlands or Denmark, developed their national strategies for bicycle transportation before the beginning of the 21st century, and their bicycle-sharing system shows the success of these strategies. Slovakia belongs to the countries that need to expand infrastructure for cyclists to ensure a better flow of traffic, and especially, for the safety of cyclists [2].
The introduction of shared bicycle systems (bike-sharing) is also a progressive tool for more sustainable mobility. Bike-sharing can be considered a type of public transport [3] that possibly reduces dependence on individual car transportation and subsequently also prevents air pollution and noise production [4,5]. The fundamentals do not lie in profit but in the quality of improvement in life in the municipality.
The aim of this article is to evaluate the efficiency of a bike-sharing service and identify improvement opportunities for this bike-sharing service in Žilina, a small urban area in northern Slovakia. First, the detailed description of the existing system will be provided based on the data provided by the company that operates bike-sharing in Žilina. For example, real data includes the number of bicycle rentals, the average time of the rental, or the time distribution of bike rentals individually per day. These data are processed in tables as well as graphically. Afterward, the sociological survey for city residents or commuters to Žilina was created, distributed, and processed to achieve important insights into the supposed extended bike-sharing system in the Žilina municipality. This study is guided by the research question: “How can spatial and non-spatial analysis reveal the strengths and weaknesses of bike-sharing services in small urban areas like Žilina?”
The research proceeded from all available data and the characteristics of the municipality’s area, and it is based on the following preconditions:
  • A comparison of the bike-sharing systems in European cities with similar areas to municipalities like Žilina;
  • A spatial analysis based on the map’s characteristics and availability of isochrone bike-sharing stations;
  • The mentioned sociological survey was based on a questionnaire with 364 participants, where only 37% of participants stated that the bike-sharing station locations as ideal.
Bike-sharing system expansion must be provided logically, and each proposed part of the expansion requires justification to avoid an unnecessary waste of funds as well as to simply ensure that the service is used sufficiently. Based on the determined preconditions, this paper presents a proposal for expanding the shared bicycle system in the city of Žilina with new stations and bicycles.
The main originality of this paper derives from all the mentioned preconditions, from the connection of the spatial and non-spatial analyses proceeding from 5 years of real data, and from the sociological survey by questionnaire distribution. This research represents a unique investigation of the bike-sharing service system in a small urban area within Central and Eastern Europe.

2. Literature Review

Sustainable mobility can be characterized by the formed communication behavior of users in a spatial structure and transport, while individual car transportation does not degrade public and non-motorized transport [1]. The number of bicycles shared in the world using bike-sharing services has already reached above 9 million [6,7]. The states’ reasons for supporting bicycle transportation comprise four categories:
  • Economics;
  • Ecologic;
  • Medical;
  • Social reasons.
Recent studies dealing with the issue of examining the impact of public bike-sharing systems on mobility approaches the problem from different perspectives, such as an overview of approaches to introducing the bike-sharing system [8,9], a general framework of the existing bike-sharing services [10,11,12,13], accident rates and safety [14,15,16,17,18], the environmental impact [19,20], a sociometric survey of users of the service [21,22,23,24], and an examination of the service’s reachability [1,25,26,27,28]. Each of these perspectives represents a factor impacting the success of introducing the bike-sharing service. These can be summarized follows:
-
overview of bike-sharing system implementation,
-
framework of existing services,
-
accident and safety studies,
-
environmental impact assessments,
-
sociometric user surveys,
-
reachability, and accessibility studies.
Environmental benefits are among the most common factors or reasons for introducing the bike-sharing services because of reducing greenhouse gas emissions [29,30,31]. However, these environmental benefits largely depend on the actual replacement of car trips by bike-sharing, which leads to the assumption that the high interest in the bike-sharing service can replace car trips [29,30,32]. For example, evaluations of the Chinese bike-sharing system have demonstrated significant environmental benefits, where authors [29] estimated annual savings of 25,240 tons of CO2 and 64 tons of NOx emissions. Even more significant is the evaluation of the bike-sharing system in Beijing, where a reduction in CO2 emissions of 616,040 tons in 2015 was estimated [33]. However, these estimates assumed a high rate of car replacement by bike-sharing.
Bike-sharing service development also has the potential for health benefits, promotes active travel, and increases physical activity levels [27,34]. Moreover, the health benefits of increasing physical activity outweigh the risks of traffic accidents and exposure to harmful air. An analysis of the New York City bike-sharing system revealed it as the most cost-effective preventive tool for public health [35]. This also relates to the alleviation of traffic congestion in cities. Wang et al. [36] measured the impact of bike-sharing on traffic congestion in 96 urban areas in the USA and calculated differences before and after the introduction of bike-sharing, then between urban areas with and without bike-sharing service, using annual congestion statistics. The service could enable significant economic benefits through reduced travel times. The data analysis of bike-sharing service in Lyon (France) showed 68.2% of bike-sharing trips are shorter than travelling by car, resulting in an average distance reduction of 13% [37]. Furthermore, Woodcock et al. [38] estimated a 20% reduction in travel time due to using the bike-sharing service in London (United Kingdom).
Then, sufficient cycling infrastructure is directly related to higher safety for cyclists on the roads. Poor safety and infrastructure could represent an important reason for reluctance to use bicycle transportation in general [39]. There are many problems related to cycle infrastructure in the Slovak Republic. Several cities are missing coherent and continuous cycle paths, which limit cyclists from moving smoothly between destinations. However, local governments are trying to support the construction and renewal of cycling infrastructure, although these measures have not yet resulted in a fully connected network [2]. For example, authors [40] analyze the potential of bike-sharing bicycles in Nitra (5th largest city in Slovakia) considering the possibilities as well as limitations in the city by extensive survey among 625 residents, where “the lack of cycling paths” was the most common reason for not using the bike-sharing system (25% of respondents). The potential of cycling in Slovakia is underestimated because of the lack of cycling infrastructure documentation [41]. The COVID-19 pandemic situation also had an impact on the development of the bike-sharing system. The authors [42] processed data from 2019 and 2020 and determined users’ behavior change during this period.
The operator or municipality should consider three important aspects: the identification of the objectives and setting indicators for their monitoring, the feasibility study, system type selection and policy setting, and the development of a business and financial plan. Objectives should reflect the maximal utilities, for example, reducing greenhouse gas emissions produced by motorized traffic (this one was primarily for the bike-sharing institute in Paris) [43] or improving access to public transport. After defining objectives, it is necessary to determine metrics for monitoring and comparing the system’s performance year-on-year or with other cities. There are two metrics for efficiency and a credible optimizing system. First one, the average daily ride time with 1 bicycle reflects the usability of the bike-sharing service with a suitable interval between 4 and 8 rides. Less than 4 rides per day indicates financial unsustainability for the operator, which can be caused by either insufficient cycling infrastructure or an unnecessarily high number of bicycles. However, more than 8 rides per day indicate limited availability of the service and low credibility of the service. Then, the average daily number of rides per 1000 inhabitants describes the increase or decrease in service usage, and so the market penetration of the bike-sharing service. The value of the objective is not explicitly given, but one ride per 20–40 inhabitants is appropriate with the intention to increase its year-on-year [44,45,46,47]. After defining objectives, the preparation of a feasibility study involves the choice of bike-sharing system type, the scope of the service, and the policy settings like method of rent, tariff, fines, etc. The study serves for the evaluation of the basic system requirements, potential investments, and revenue sources. Fundamentals of technical and territorial nature, like choosing the appropriate type of bicycle or the correct location of bike-sharing stations, must be considered for suitable locations of stations, capacity of stations, etc. Also, the identification of local contextual elements and potential barriers to implementation (for example, weather, topography, cycling infrastructure, culture, and the political and legal aspects of the city or state) needs to be considered for the suitability of a municipality for a bike sharing service. And finally, the business and financial plan represents the last aspect and includes the financial analysis of service development options.
Studies that deal with planning include several approaches. A study that deals with strategic planning for the introduction of a shared bike system in Košice. Authors [41] deal with strategic planning for the introduction of the bike-sharing service in Košice (the 2nd largest city in Slovakia). Optimal locations for bicycle stations were identified and evaluated using the proportional index method to ensure an objective assessment. Another study [48] provides a spatial framework for planning station-based bike-sharing systems, which may be useful in analyzing and planning such systems in small urban areas. The case study of the city of Salzburg (Austria) serves to illustrate a procedure involving the analysis of urban characteristics and estimating demand to design efficient bicycle station locations. The study deals with the practical application of a spatial framework for planning bike-sharing systems in an urban environment [48].
For the introduction of a new public bicycle transportation system or the extension of the existing bike-sharing system, principles for quality bike-sharing systems are recommended: coverage of an area of at least 10 km2, the station density 10–16 stations at km2, distance between stations 300–500 m and the number of bicycles 10–30 bicycles for 1000 inhabitants in selected area [45,47]. The availability of bike-sharing services to the public is reflected in the accessibility of bike stations. Spatial analysis can be processed by several methods to evaluate aspects needed for efficient bike-sharing service: analysis of cycle path growth in 25 years [49], spatial analysis using the clustering method [49,50], creating simulations with several different scenarios [51,52], and others. Authors in [53] used the Mixed Integer Linear Program (MILP) for optimizing bike-sharing stations. Spatial analysis of bike-sharing stations using geographic information systems (GIS) can offer a clear summary helpful in the planning and evaluation of bike-sharing systems, like in [54], especially in small cities.
There are many indicators used to assess the efficiency of transport services and spatial development systems. Assessing efficiency, we should consider the population or area covered by the chosen service (bike-sharing service), considering the travel time to the center of the area [55], which describes the availability of isochrones. Most often, spatial analysis using isochronous availability for bike-sharing service is focused on the relation with public transportation service (buses or trains) [52,56,57]. In general, the isochrone map is a visual–analytical tool that may be used to measure place-centered availability with temporal constraints, especially in urban planning and public management of transportation [58]. The advantage of isochrones of availability consists of the approximation of accessibility, because they are based on the actual street network usable for transport participants [57].

3. Materials and Methods

3.1. Bike-Sharing Service in Žilina

Žilina is the 4th biggest municipality in Slovakia with an area of 80.03 km2 and a population of 80,342 inhabitants, which according to OECD [59] belongs to small urban areas. Just like in other areas, the municipality’s capacity cannot handle the onslaught of individual car transport, especially in the morning and afternoon rush hours.
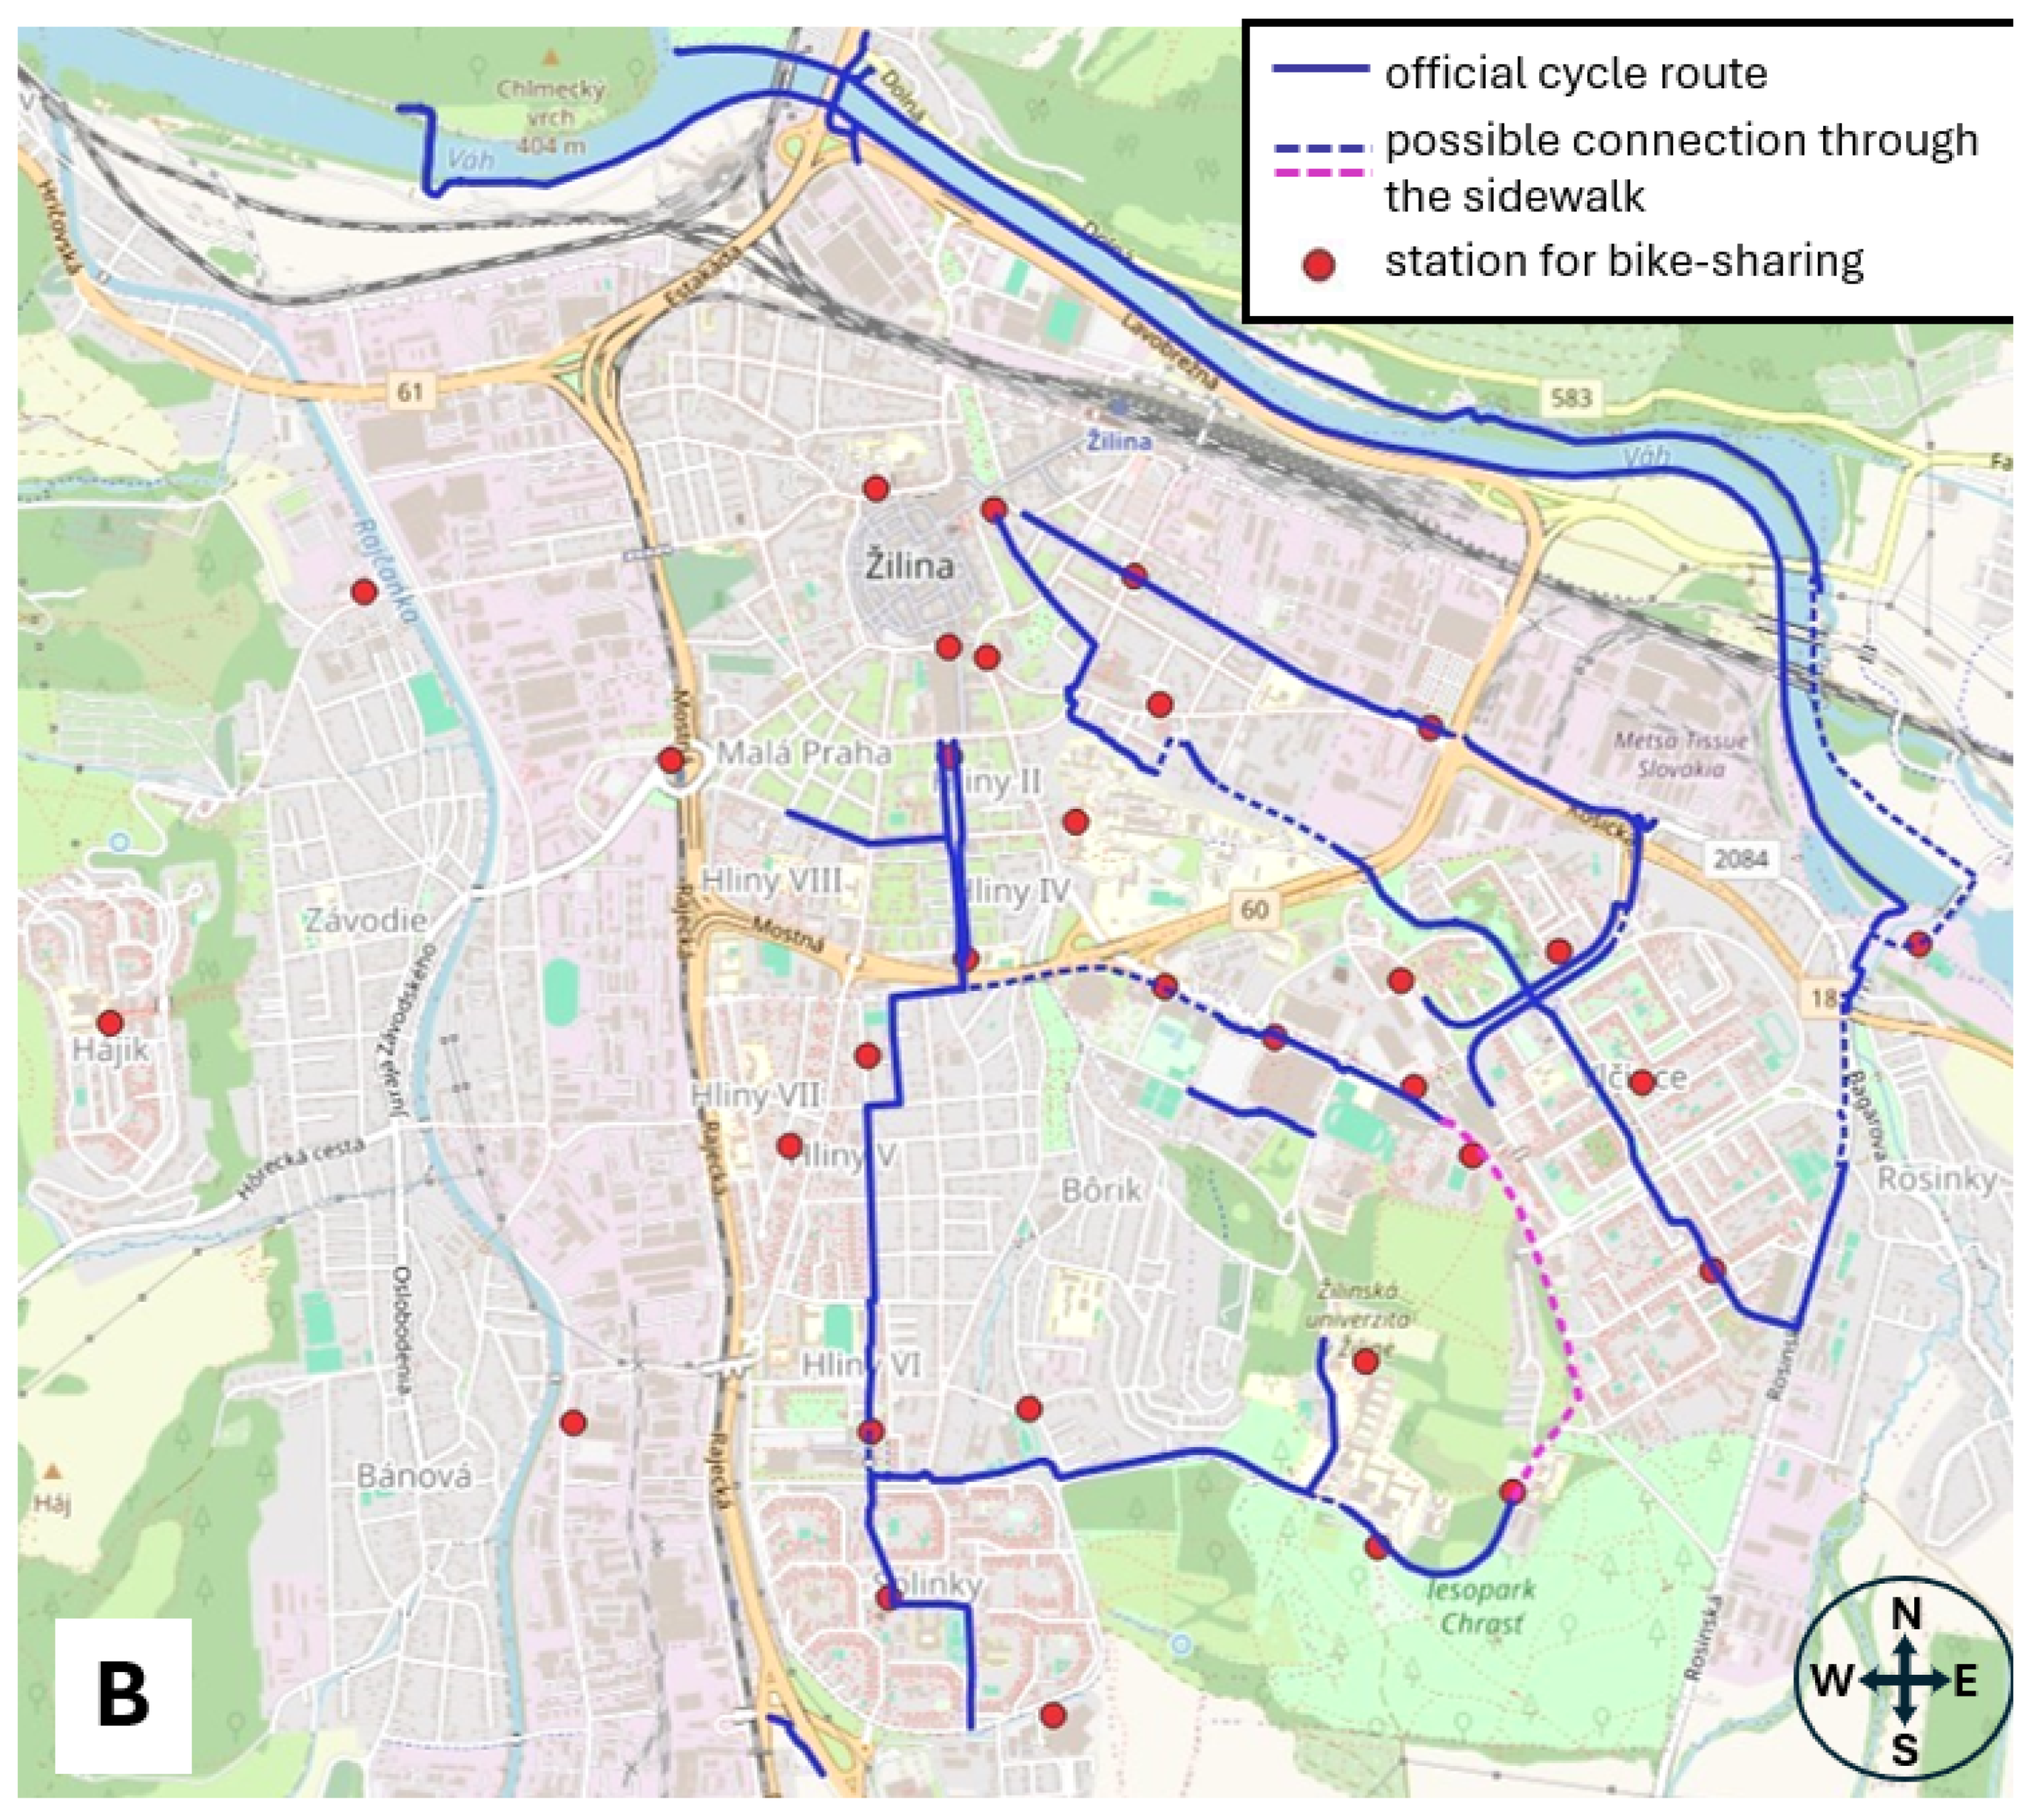
Figure 1B above represents the actual bicycle infrastructure in Žilina. The official cycle paths are highlighted by blue lines and cover the surrounding areas, which lead to the edge of the city center of Žilina. However, the paths are not interconnected, which limits their usability, so bicycle infrastructure in Žilina does not form a continuous circuit, while a considerable part is on the road shared with cars or associated with a pedestrian sidewalk. The dashed line shows “connecting sections” which cyclists often use as a continuation after the end of the official cycle path. In general, cyclists consider moving on sidewalks and pedestrian zones safer compared to roads, even if it is prohibited in urban environments.
Žilina is the municipality with a total of 20 districts, as shown in Figure 1A above, while the density of bike-sharing stations is high in some areas, especially in the city center. But in some locations quite close to the city center, bike-sharing is completely absent.
Bike-sharing service in Žilina started in 2019, called BikeKIA, with 120 bicycles and 20 stations. The service started based on the collaboration of the operator (ARRIVA Slovakia, a. s., Nitra, Slovakia) and the main sponsor (Kia Slovakia Fundation, Teplička nad Váhom, Slovakia) [60]. Bike-sharing service in Žilina provides a combination of bicycle stands (21 stations) with virtual stations (11 stations). The service is equipped with 195 standard bikes suitable for sharing systems (SMARTbike 2.0 and SMARTbike 2.0 armiert) located at 32 rental stations. A large part of them (marked by a red point in Figure 1 above) is located near the highlighted cycle paths. The gradual expansion of the bike-sharing system across active seasons reflects growing interest in this service. Since the start of the service till present, the system has recorded an increase of 62.5% in the number of bicycles and an increase of 60% in the case of stations. The seasonal development of the bike-sharing system in Žilina is clearly shown in Table 1 below.
Bicycles are available for short-term rent with mobile applications. There was one hour free of charge for the use of bicycles from the beginning of service. It was shortened to half an hour before the season in 2021. The resolution about reducing the free ride time came after analysis of the previous two seasons, which showed 88% rides shorter than 30 min and the average ride time was around 16 min. Similarly, from 2024 to present, free riding time was established at 15 min.

3.2. Data Analysis

The analysis consists of spatial and non-spatial analysis. Analysis of the attractiveness of the bike-sharing stations fell under the non-spatial analysis and was focused on statistical evaluation over the years. The attractiveness of bike-sharing stations is based on the processing of the provider’s data about bicycle rentals from the beginning of the service in 2019 till the end of the 2023 season. Season 2024 statistics are still in the process, and the operator has not yet provided them for research processing. However, spatial analysis requires just the map’s characteristics and basic data about the number and location of the bicycle stations. For this reason, data until the end of the season 2024 was processed.
First, the rate of bike-sharing system usage is researched in the form of a general analysis of seasons from 2019 to 2023. The data from the operator Arriva Slovakia a. s., the company of bike sharing in Žilina, is based on the real records about the amount of bicycle rentals, about the average time of one rental, or about the time distribution of bicycle rentals per day or months and grouped in the following Table 2.
The bike-sharing efficiency can be determined by the indicator describing the average daily number of rides on one bicycle. The optimal value should be between 4 and 8 rides. Lower values indicate the financial unsustainability of the service, while the reason can be caused by the insufficient cycling infrastructure. On the other hand, more than 8 rides, or a very high number of average daily rides, may mean limited availability of bicycles.
The dataset contained extreme values in rental duration (up to 200–1200 min), probably caused by incorrect or incomplete termination of the bicycle rental. The dataset included information on how the rental was terminated: either by the user or by the provider. In most cases, rentals with abnormally long durations were terminated by the provider, indicating a malfunction of the locking system or negligence by the user when terminating the rental.
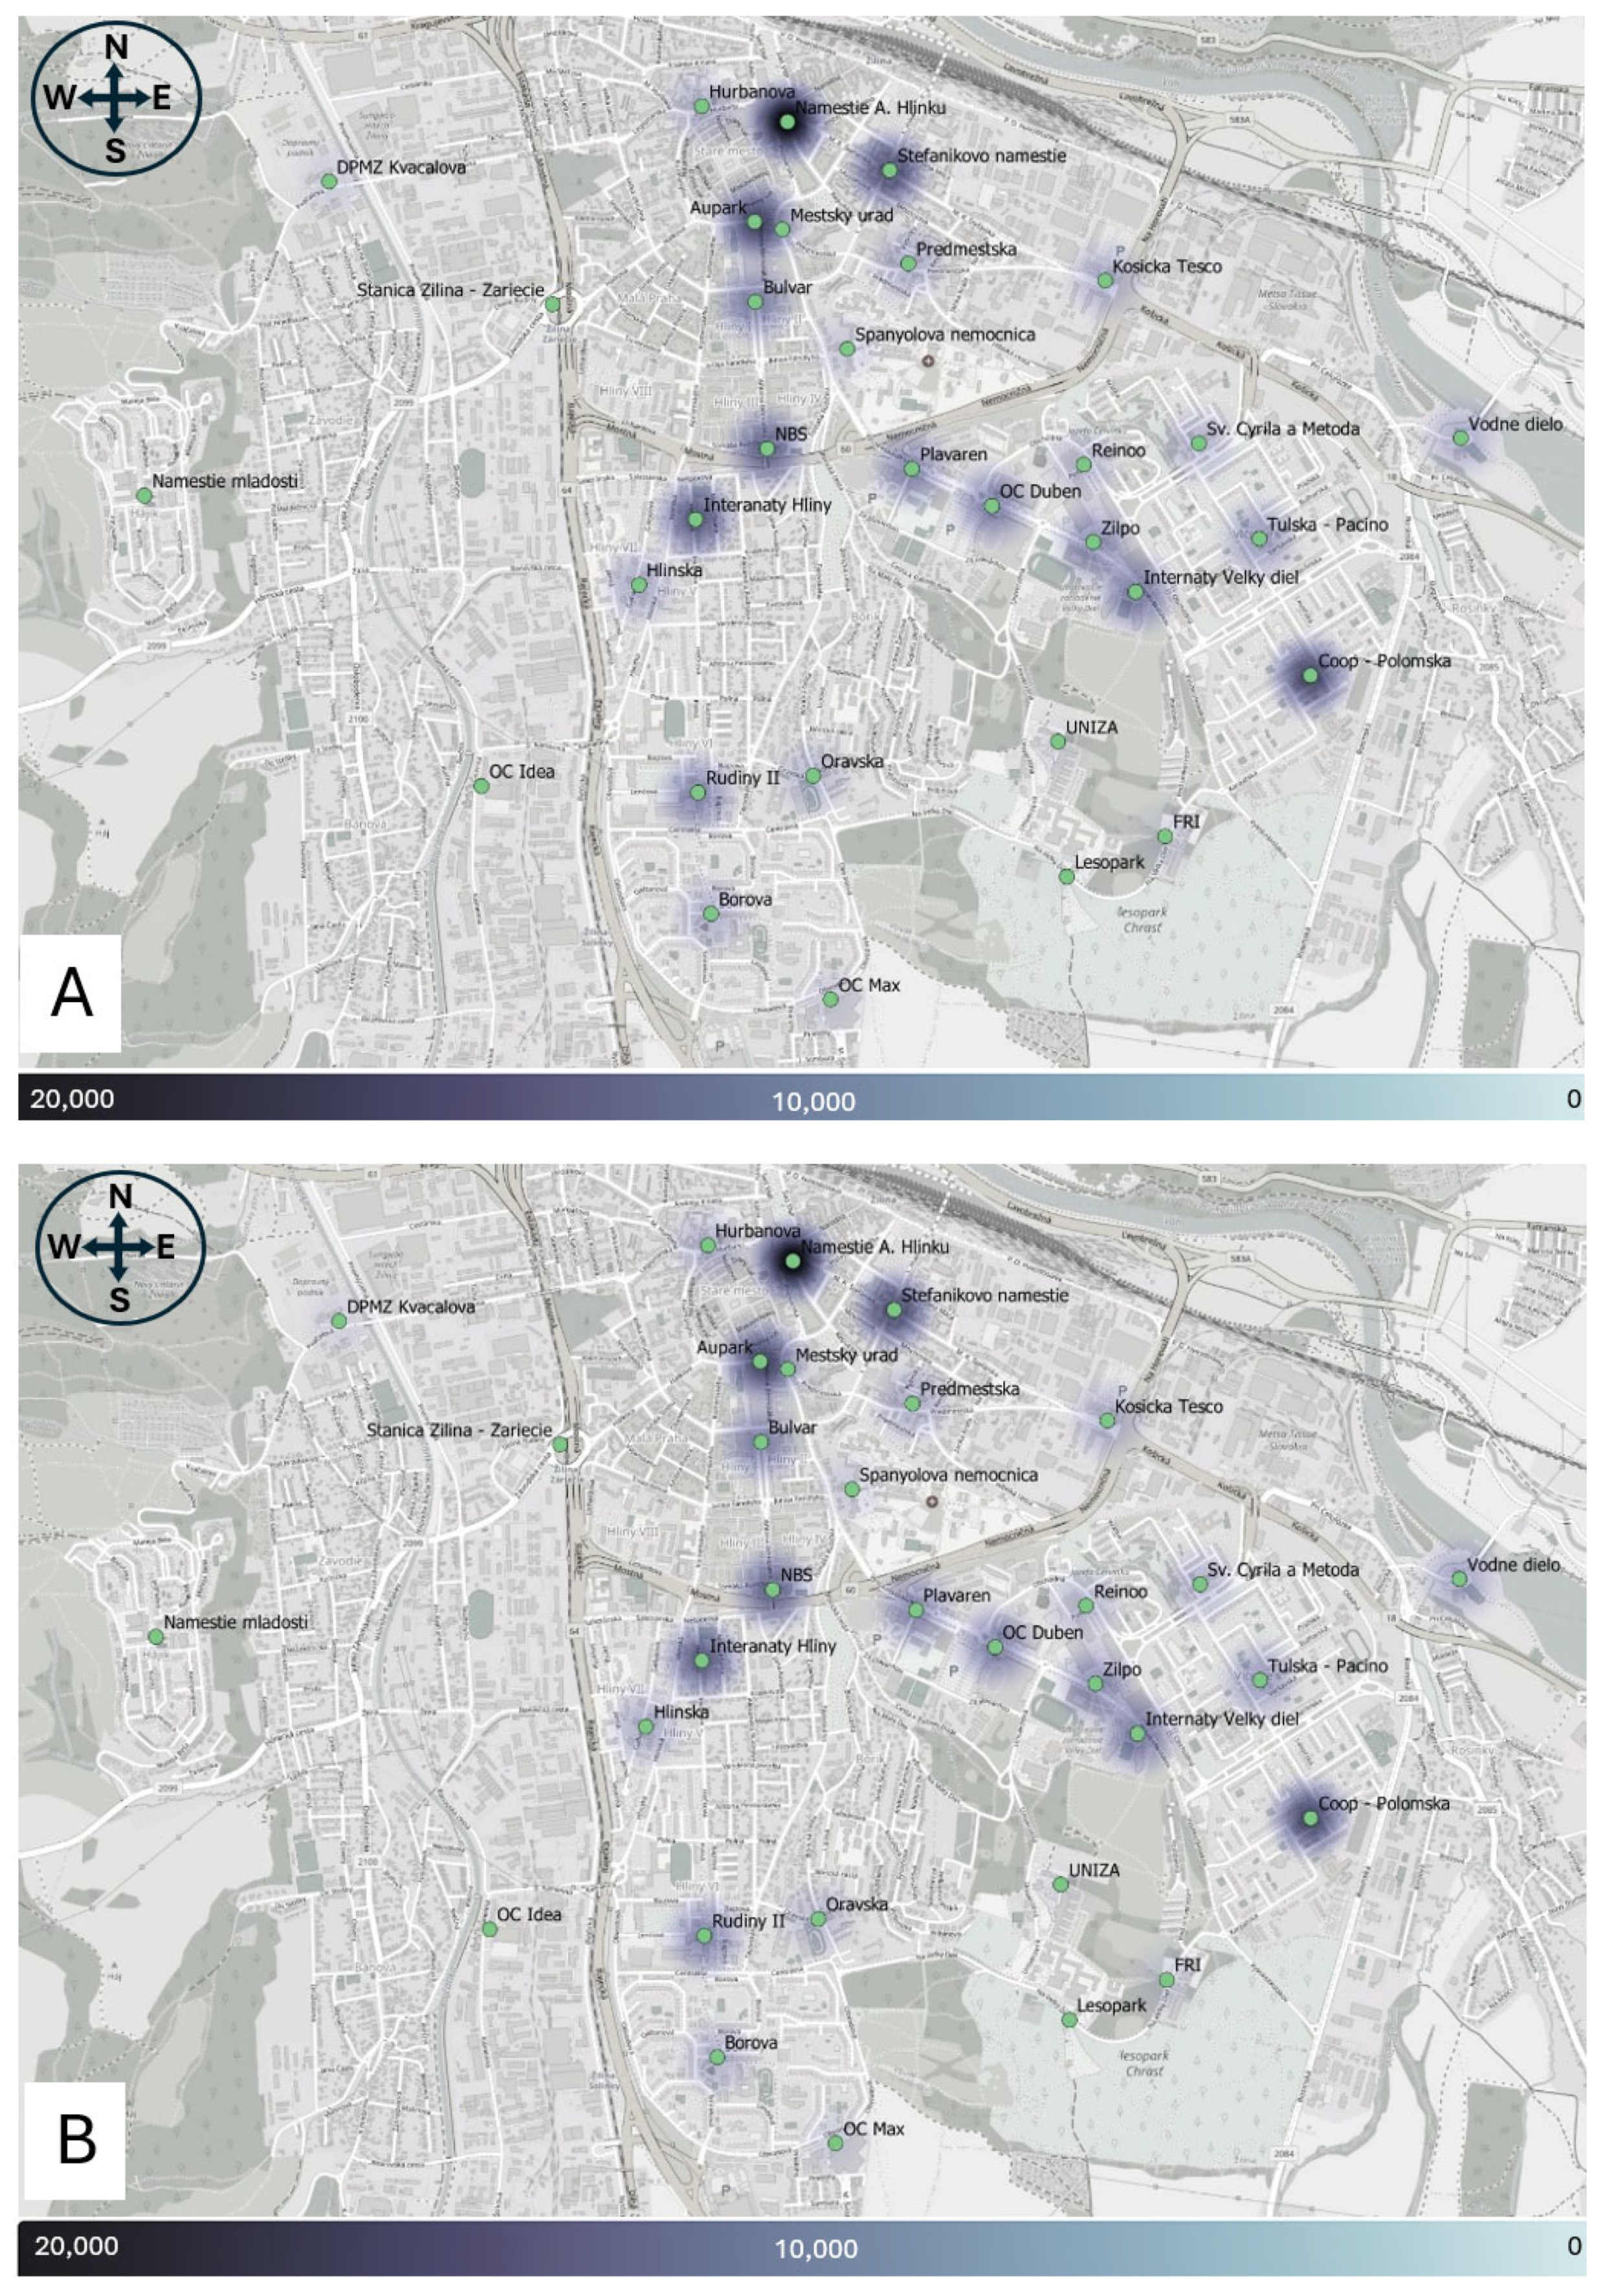
According to the operating model of the bike-sharing system, typical rentals last less than 60 min. Rentals longer than 120 min are unlikely and likely reflect user or system error. Afterwards, the reachability of the existing 32 bicycle stations (standing and virtual) will be examined by spatial analysis. First, the availability of isochrones will be estimated. As well as in the case of public passenger transport, there is a possibility of determining the availability isochrone of the bike-sharing service for analysis and later potentially proposals. This zone is often visualized as a circle centered on each bike-sharing station with a radius representing the average walking distance (e.g., 400 m). However, in practice, true isochrones should reflect actual pedestrian access along the street network rather than simple geometric circles, and the analysis acknowledges this simplification. It can be assumed that as the catchment area in which the potential customer’s distance from the bike-sharing station increases, the interest in the service decreases. The determined radius will be based on city transport standards, where the time isochronous availability of approximately 5 min is considered by default [61]. If we calculate with the average walking pedestrian’s speed of 1.34 m/s [62], which makes 4.824 km/h, then the distance comes out to 400 m. The procedure for determining the station area should follow from the center (represented by bicycle stations) and a certain maximum travel time to the center of the area [55]. Subsequently, the usability of the stations in terms of bike rentals and returns will be displayed by heatmaps. The number of the use of the bike station is used is represented by colored circles. The more saturated color of the radius around the bike station means the greater number of bike rentals or returns. Station utilization will be observed based on the number of rentals or returns. Because of the expansion of the service and replenishment of bicycles every year, data from the season 2023 will be used for the analysis to know the most current situation for expansion proposals.
Microsoft Excel was used for processing non-spatial analyses. QGIS (Quantum Geographic Information System) Desktop version 3.4.15 [63], Open Street Maps [64] were used for processing spatial accessibility analyses, and PTV Visum 2020 [65] was used for processing data from Žilina.

3.3. Questionnaire Survey

The minimal research sample was calculated based on the number of inhabitants of the municipality, the required level of confidence, and the rate of deviation. The calculation was provided by an online calculator [66] with the level of confidence established at 95% and the rate of deviation 6%. At least 266 respondents need to have a confidence level of 95% that the real value is within ±6% of the surveyed value, as in Table 3 below.
The questionnaire was submitted to inhabitants or commuters of Žilina municipality. Together, 354 respondents attended the questionnaire survey. The questionnaire was created to collect the bike-sharing service users’ opinions about the current situation as well as about the bike-sharing improvements. The introductory question was aimed at social status. The following questions crucial for the study were formulated as follows:
  • Q1: How would you generally assess the level and condition of cycling infrastructure in the city of Žilina (for example, the quality or connectivity of the cycling routes)? (4-level assessment answers: high quality—sufficient quality—below average quality—non-sufficient quality).
  • Q2: What factors do you consider key factors for deciding whether to use shared bikes? Select a maximum of 4 options from: price for the service (including free ride), the quality of the cyclist infrastructure, possibility of using the electric bike in the service, bicycle equipment, reachability of the bicycle, current traffic situation in the city, other: …
  • Q3: Do you consider the current distribution of 32 shared bike stations in the city of Žilina sufficient based on the municipality plan?
  • Q4: Do you consider the current number of bicycles in the system (195) sufficient, or would you welcome the gradual addition of more to increase the availability of the system?
  • Q5: In which parts of Žilina do you feel a lack of shared bike stations, and would you like to see them added? Select a maximum of 5 options from: Bánová, Bôrik, Budatín, Bytčica, Hájik, Hliny, Mojšová Lúčka, Považský Chlmec, Rosinky, Solinky, the city center of Žilina, Strážov, Trnové, Vlčince, Závodie.
  • Q6: In some districts, bike-sharing stations are either missing or severely underrepresented, limiting service accessibility. Select up to 4 of the listed city districts where bike sharing should primarily be expanded. Select from: Bánová, Budatín, Bytčica, Mojšová Lúčka, Považský Chlmec, Rosinky, Strážov, Trnové, Závodie.
  • Q7: Do you have any suggestions for placing the bike-sharing stations in Žilina?
The questionnaire was aimed at the users of the bike-sharing service in Žilina, and it was distributed by social networks during April 2024, at the start of the season 2024. Non-users were directed to the end of the questionnaire.

4. Results

4.1. Spatial and Non-Spatial Analysis

The basic data about bike-sharing service in Žilina was compared with 10 other European cities with similar areas, also with existing bike-sharing services in Table 4 below based on [60,67,68,69,70,71,72,73,74,75,76,77]. The range of the areas was chosen in the range ±10 km2. The calculation in terms of the number of stations per 1 km2 and the average number of bike-sharing stations is considered. Data was provided on publicly available information on the website [67].
The numbers showing how many stations are located in the listed cities are very variable, and they range from 22 to 106 stations. In general, the number of bike-sharing stations is not related to the area of the municipality, and it is dependent on several factors which can be unique for the chosen municipality. However, the bike-sharing service in Žilina, with the number of stations, is far below the average number of bike-sharing stations in the list of cities (61 stations).
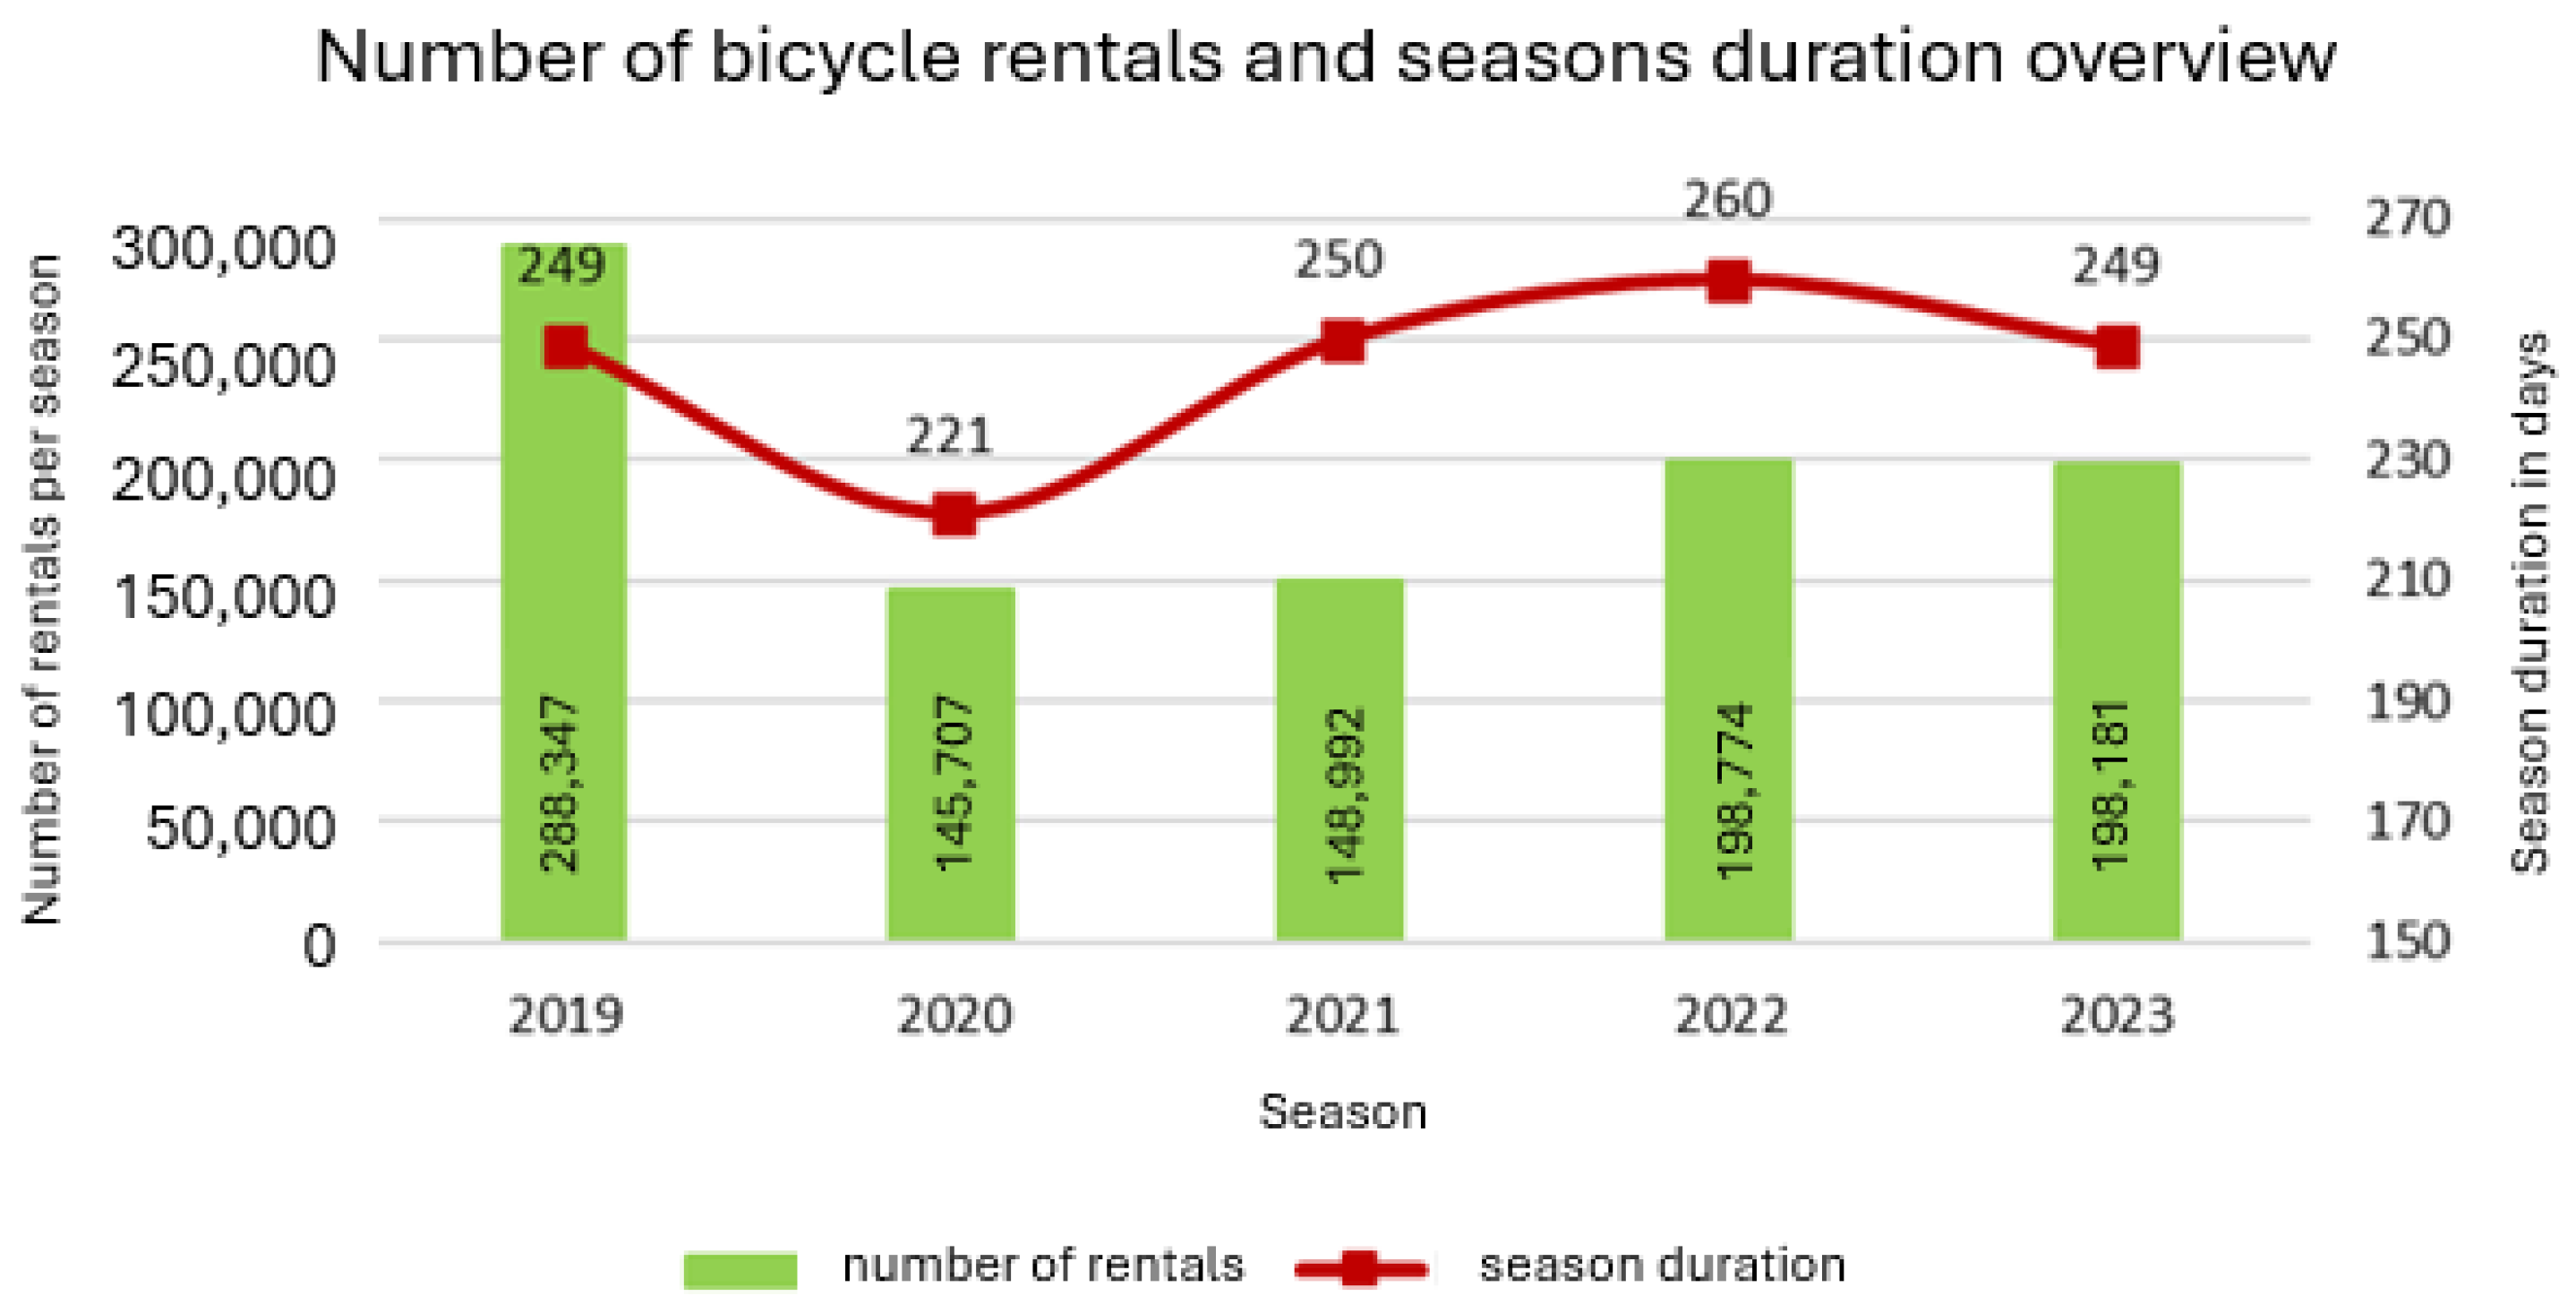
The service was introduced in 2019, and the performance of individual seasons in terms of the number of rentals made by users is shown in the complex graph below in Figure 2. The season of using bike-sharing services last usually from the end of March or the beginning of April till the beginning of December. Season duration represents, on average, more than two-thirds of the year.
Before the introduction season in 2019, a relatively strong marketing campaign was launched, for example on social media, and recorded 290,000 rides, the highest number of bicycle rentals. A significant shortening of the season as well as a decrease in bicycle rentals happened, especially due to COVID-19 pandemic regulations in 2020, when the season started even in May. During the year 2021, interest in the service was comparable to the year 2020 [42]. The number of rentals increased little after ending the pandemic regulations, and comparable results for the years 2022 and 2023 reached almost 200,000 rentals.
During the observed seasons, the average length of the bicycle rental varied. The graph in Figure 3 below shows the highest average riding time in 2019, with 14.6 min. and in 2020 with 17 min. The free ride time was established for 1 hour in these two years. With the reduction in free ride time, the average rental time also decreased and oscillated at the same level during the 2021–2023 seasons.
The first season in 2019 reports the highest value indicator of the bike-sharing service efficiency. It showed the value of this indicator slightly beyond the limit of the recommended interval (9.56 daily number of rides on one bicycle). The following values of the indicator of the bike-sharing service efficiency oscillate at approximately a similar value. The next two seasons, 2020–2021, recorded a decrease in the number of rentals, which also reduced the value of the indicator, but still within the optimal value (to 5.49 and 4.85 daily number of rides on one bicycle). The last two seasons, 2022–2023, the value of the indicator remained at the same level (5.27 and 5.49 daily number of rides on one bicycle); however, the number of bicycles and subsequently the number of rentals increased, as is shown in Table 2 in the previous chapter.
The attractiveness of the existing bike stations on the heatmaps in Figure 4 below shows that bike stations situated in the city center are the busiest. The station “Námestie A. Hlinku” dominates significantly in rentals (19,587) as well as in returns (19,717), thanks to its location (nearest distance to the railway station). The second busiest bike station “COOP–Polomská” (14,100 rentals and 14,147 returns) is situated on the most populated part of the municipality, the housing estate Vlčince, in addition to two upper secondary schools. Other busier bike stations are also situated across the city center (more than 10,000 rentals or returns). Transport connections were the most numerous between the two busiest bike stations from “Námestie A. Hlinku to COOP–Polomská” (1839 rides). In terms of the number of rentals or returns, there are also bike stations with low usage (fewer than 1000 rentals or returns), mostly in more distant areas of the municipality.
The location of the stations should cover the catchment area reachable for the customers to maintain their interest. The suitable distance between stations can by typified in an interval of 300 to 500 m from each other (because of the average walking speed differences in the urban environment or possibilities of the municipality to build stations) and the same time the catchment area covering the isochronous availability of the station with the radius of 400 m at the same time.
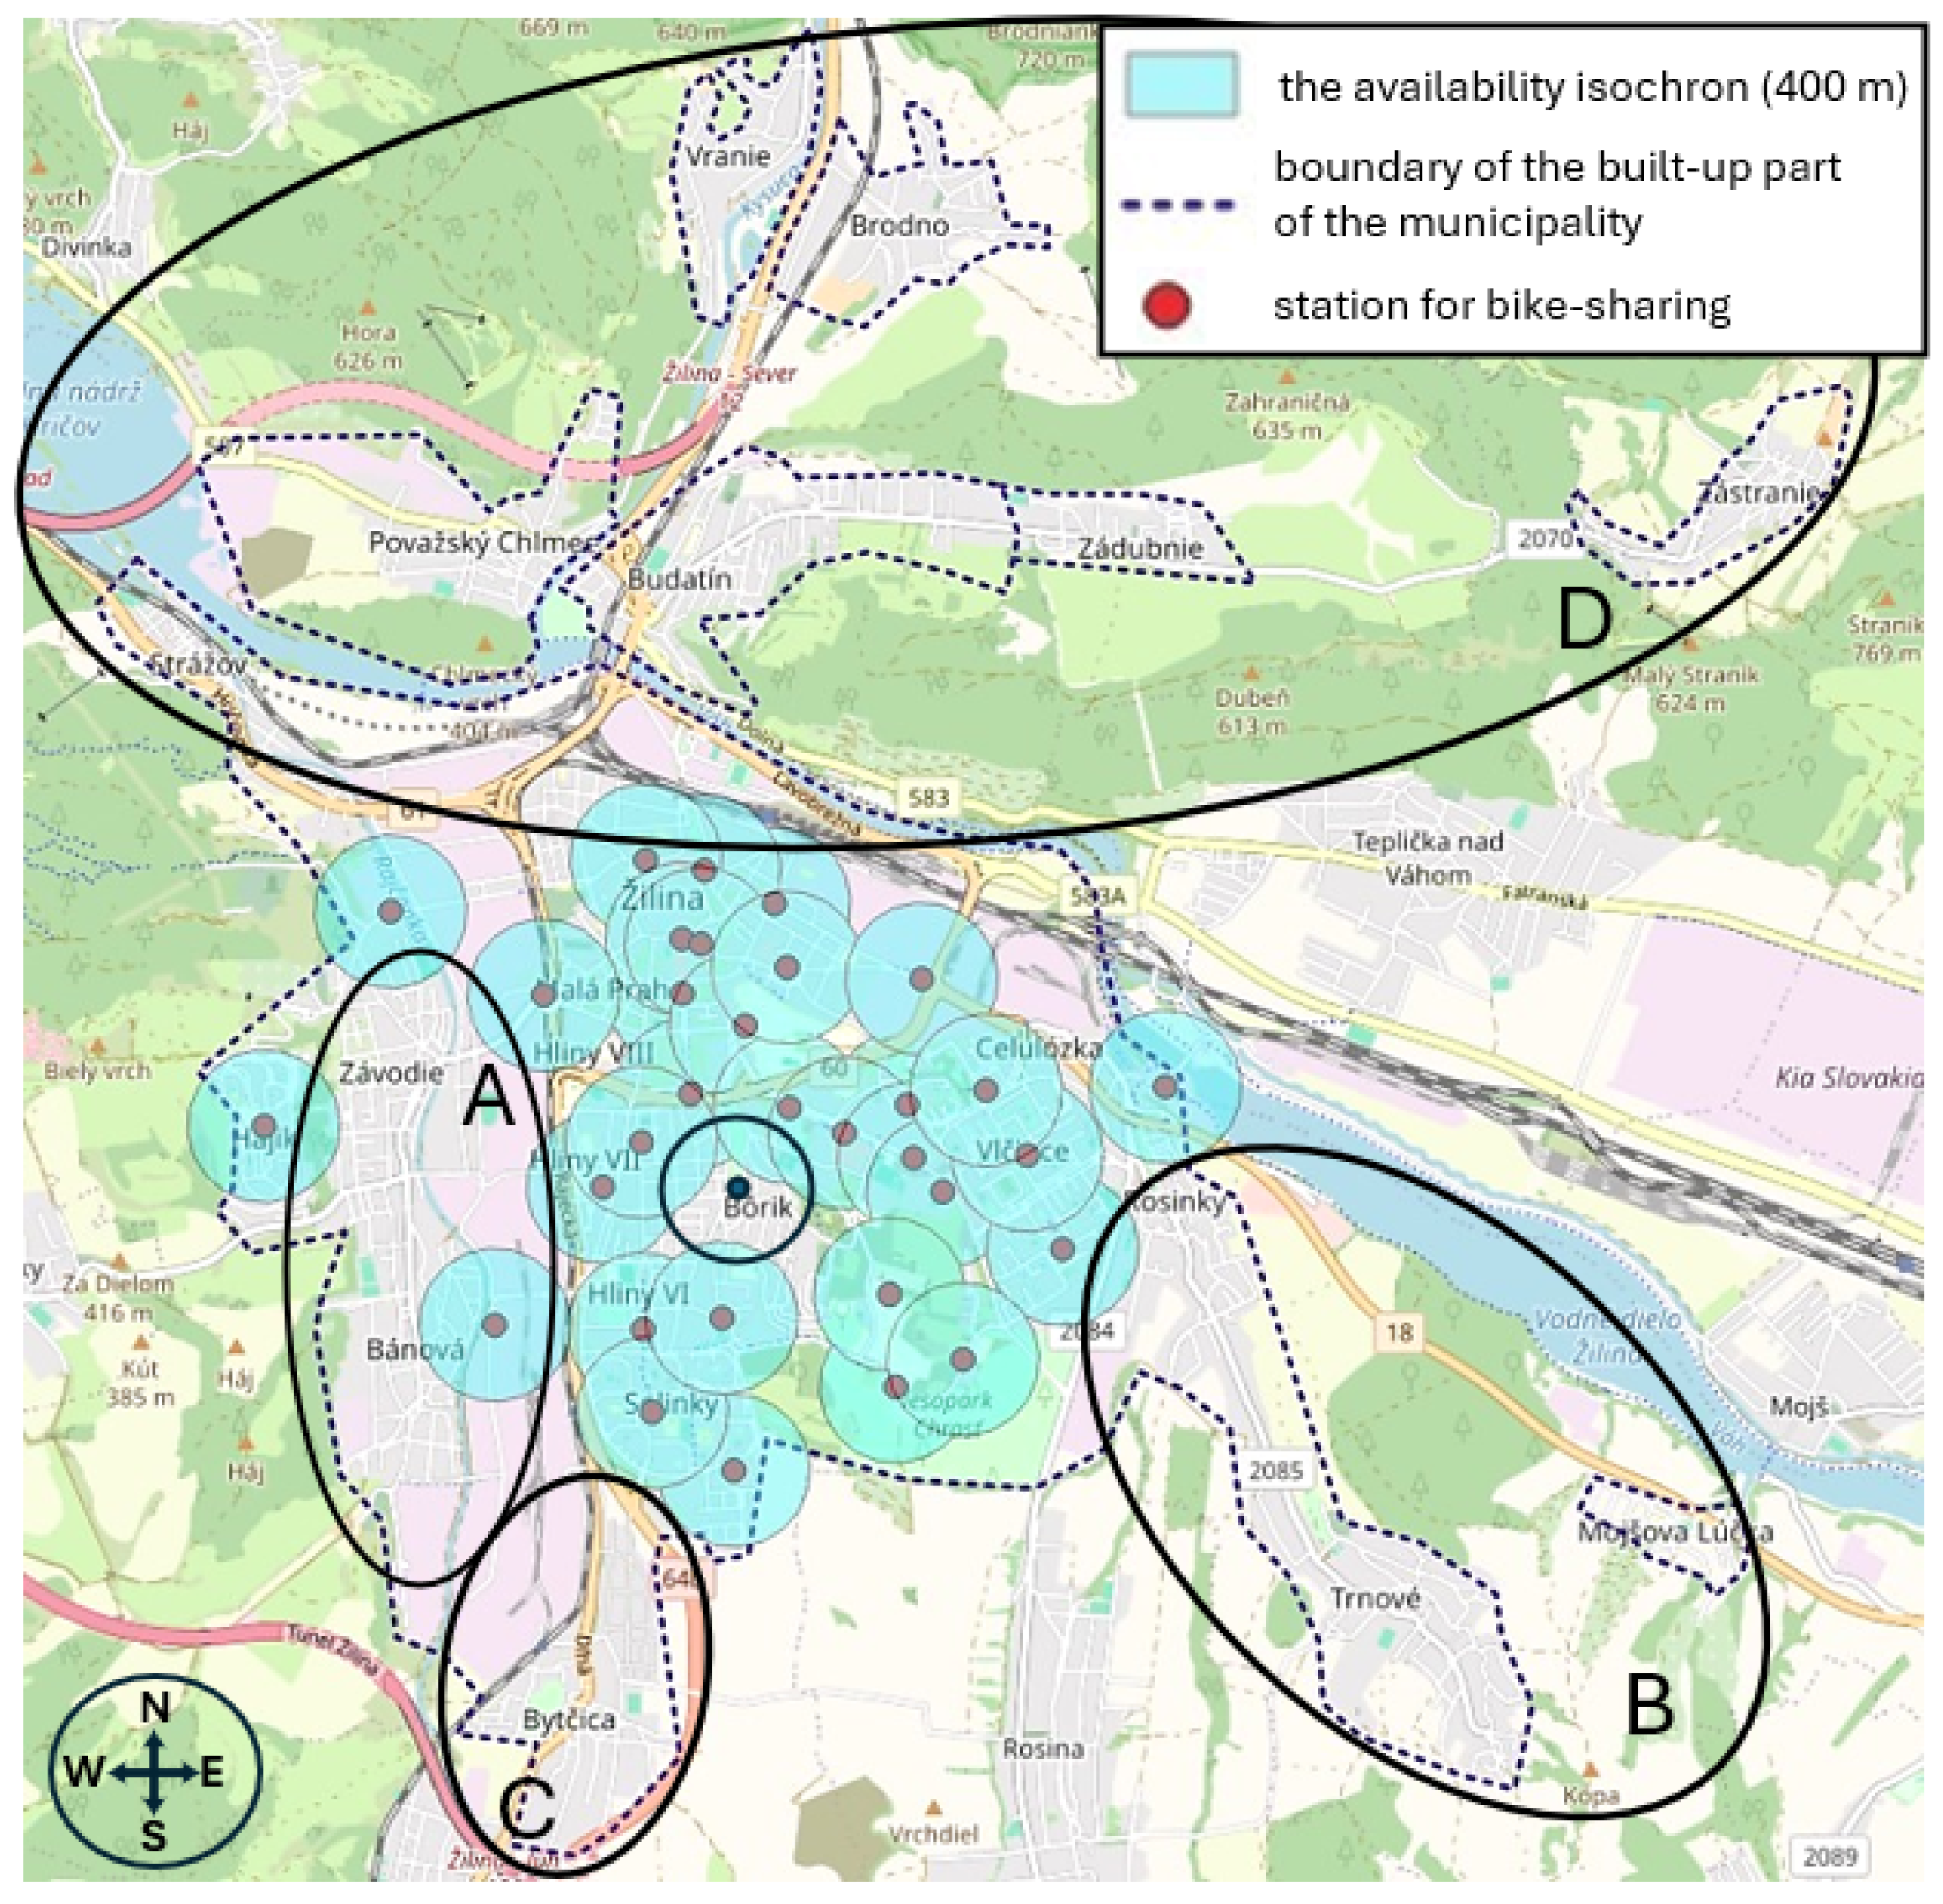
Based on the measurement by the QGIS program, the catchment area of the bike-sharing service currently covers a slightly larger area than 10 km2. The blue virtual circles represent the availability of isochrones and four zones (A–D) with low coverage or completely lacking the bike-sharing service, shown in Figure 5 above. The virtual circles cover mostly the city center of the municipality, and the further away from the center, the lower the service coverage; like in Závodie, Bánová (both belong to zone A), Rosinky (upper part of zone B). Surprisingly, the urban district Bôrik, which is in the middle between the plotted isochrones, is without a bike sharing station.
Moreover, there are districts without the service availability; for example, secluded suburban districts Považský Chlmec, Budatín, Zádubnie, Vranie and Brodno in north, Zástranie north-east, and Strážov in north-west of the municipality (zone D), then Mojšová Lúčka with Trnové in south-east of the municipality (zone B) and Bytčica in south of the municipality (zone C).

4.2. Research Survey

The questionnaire was aimed only at users of the bike-sharing service in Žilina. Participants listed their social status as students (62.1%), then employed (34.5%), when other options were unemployed or retired (3.4%).
The first question, Q1 asked about the cyclist’s infrastructure quality in Žilina municipality. Almost half of the respondents (48%) considered the quality of cycle infrastructure below average and 42.1% of respondents considered it sufficient, 6.5% of respondents considered it insufficient, and only 3.4% of respondents considered the high quality of cycle infrastructure. In question Q2, respondents were asked to specify the most important factors in decisions about bike-sharing service usage. The question had pre-formulated answers, and there was a possibility of marking a maximum of four of them.
Respondents marked on average three options, and results are shown in Figure 6 above. The most common factor was the “Price for the service, including free ride time”, and the least marked answer was “Possibility of using the electric bike”. Then, respondents were asked in question Q3 if the current distribution of bike-sharing stations is sufficient. More than 40% of respondents considered the bike-sharing station’s placement as not sufficient, but on the other hand, 37% of respondents replied the opposite, and 23% could not assess and did not reply to this question. To make the decision easier, a map with the current location of the stations was also attached to this question. Also, when respondents were asked in question Q4 whether the number of bicycles is sufficient, while 55.9% of people replied that the extension of bicycles is needed, then approximately a fifth, 20.9%, think that the number is sufficient, and 23.2% of those surveyed were unable to form an opinion.
The following questions were considered as most important for future proposals for the service extension. Respondents could express their own opinion about the municipality’s districts, with the lack of bike-sharing stations in question Q5. Respondents’ preferences are visualized in Figure 7 below, with notes about zones lacking the bike-sharing areas.
Most respondents replied that districts Závodie and Bánová (zone A) should be the preferred localities for bike-sharing station extension. There is one bike-sharing station. However, it is situated on the very edge of this district, so it is not accessible to a large portion of people. Also, the same situation is in district Bánová. The bike-sharing station is situated near the small shopping center in the industrial zone, while the residential area of this district is split by the river. District Budatín (zone D) is a suitable place for a new bike-sharing station because of its location near the recreational and sports potential of the area. Bôrik is marked as the fifth preference district for bike-sharing service extension.
The next question, Q6, was aimed only at districts where the bike-sharing service is completely missing. Respondents who in the previous question selected areas covered with availability isochrone could also consider districts that are not so frequented by them. Závodie district was selected again as the most preferred locality for bike-sharing station extension, as in Figure 8 below.
Finally, respondents were asked to propose specific places in their area suitable for a new bike-sharing station in Q7. A total of 98 responses were collected for this question. The most requested location was the railway station, followed by a park situated in Bôrik district and then a park situated in Budatín district. Locations that were specified at least by street name or closer territorial affiliation were considered. In Závodie, which is the most preferred district for bike-sharing stations extension based on answers in previous questions, 8 specific locations were proposed by 15 respondents. Also, 4 new locations in the city center were proposed. However, it is worth mentioning the repeated proposal at the central bus station.

4.3. The Extension Bike-Sharing Station Proposal

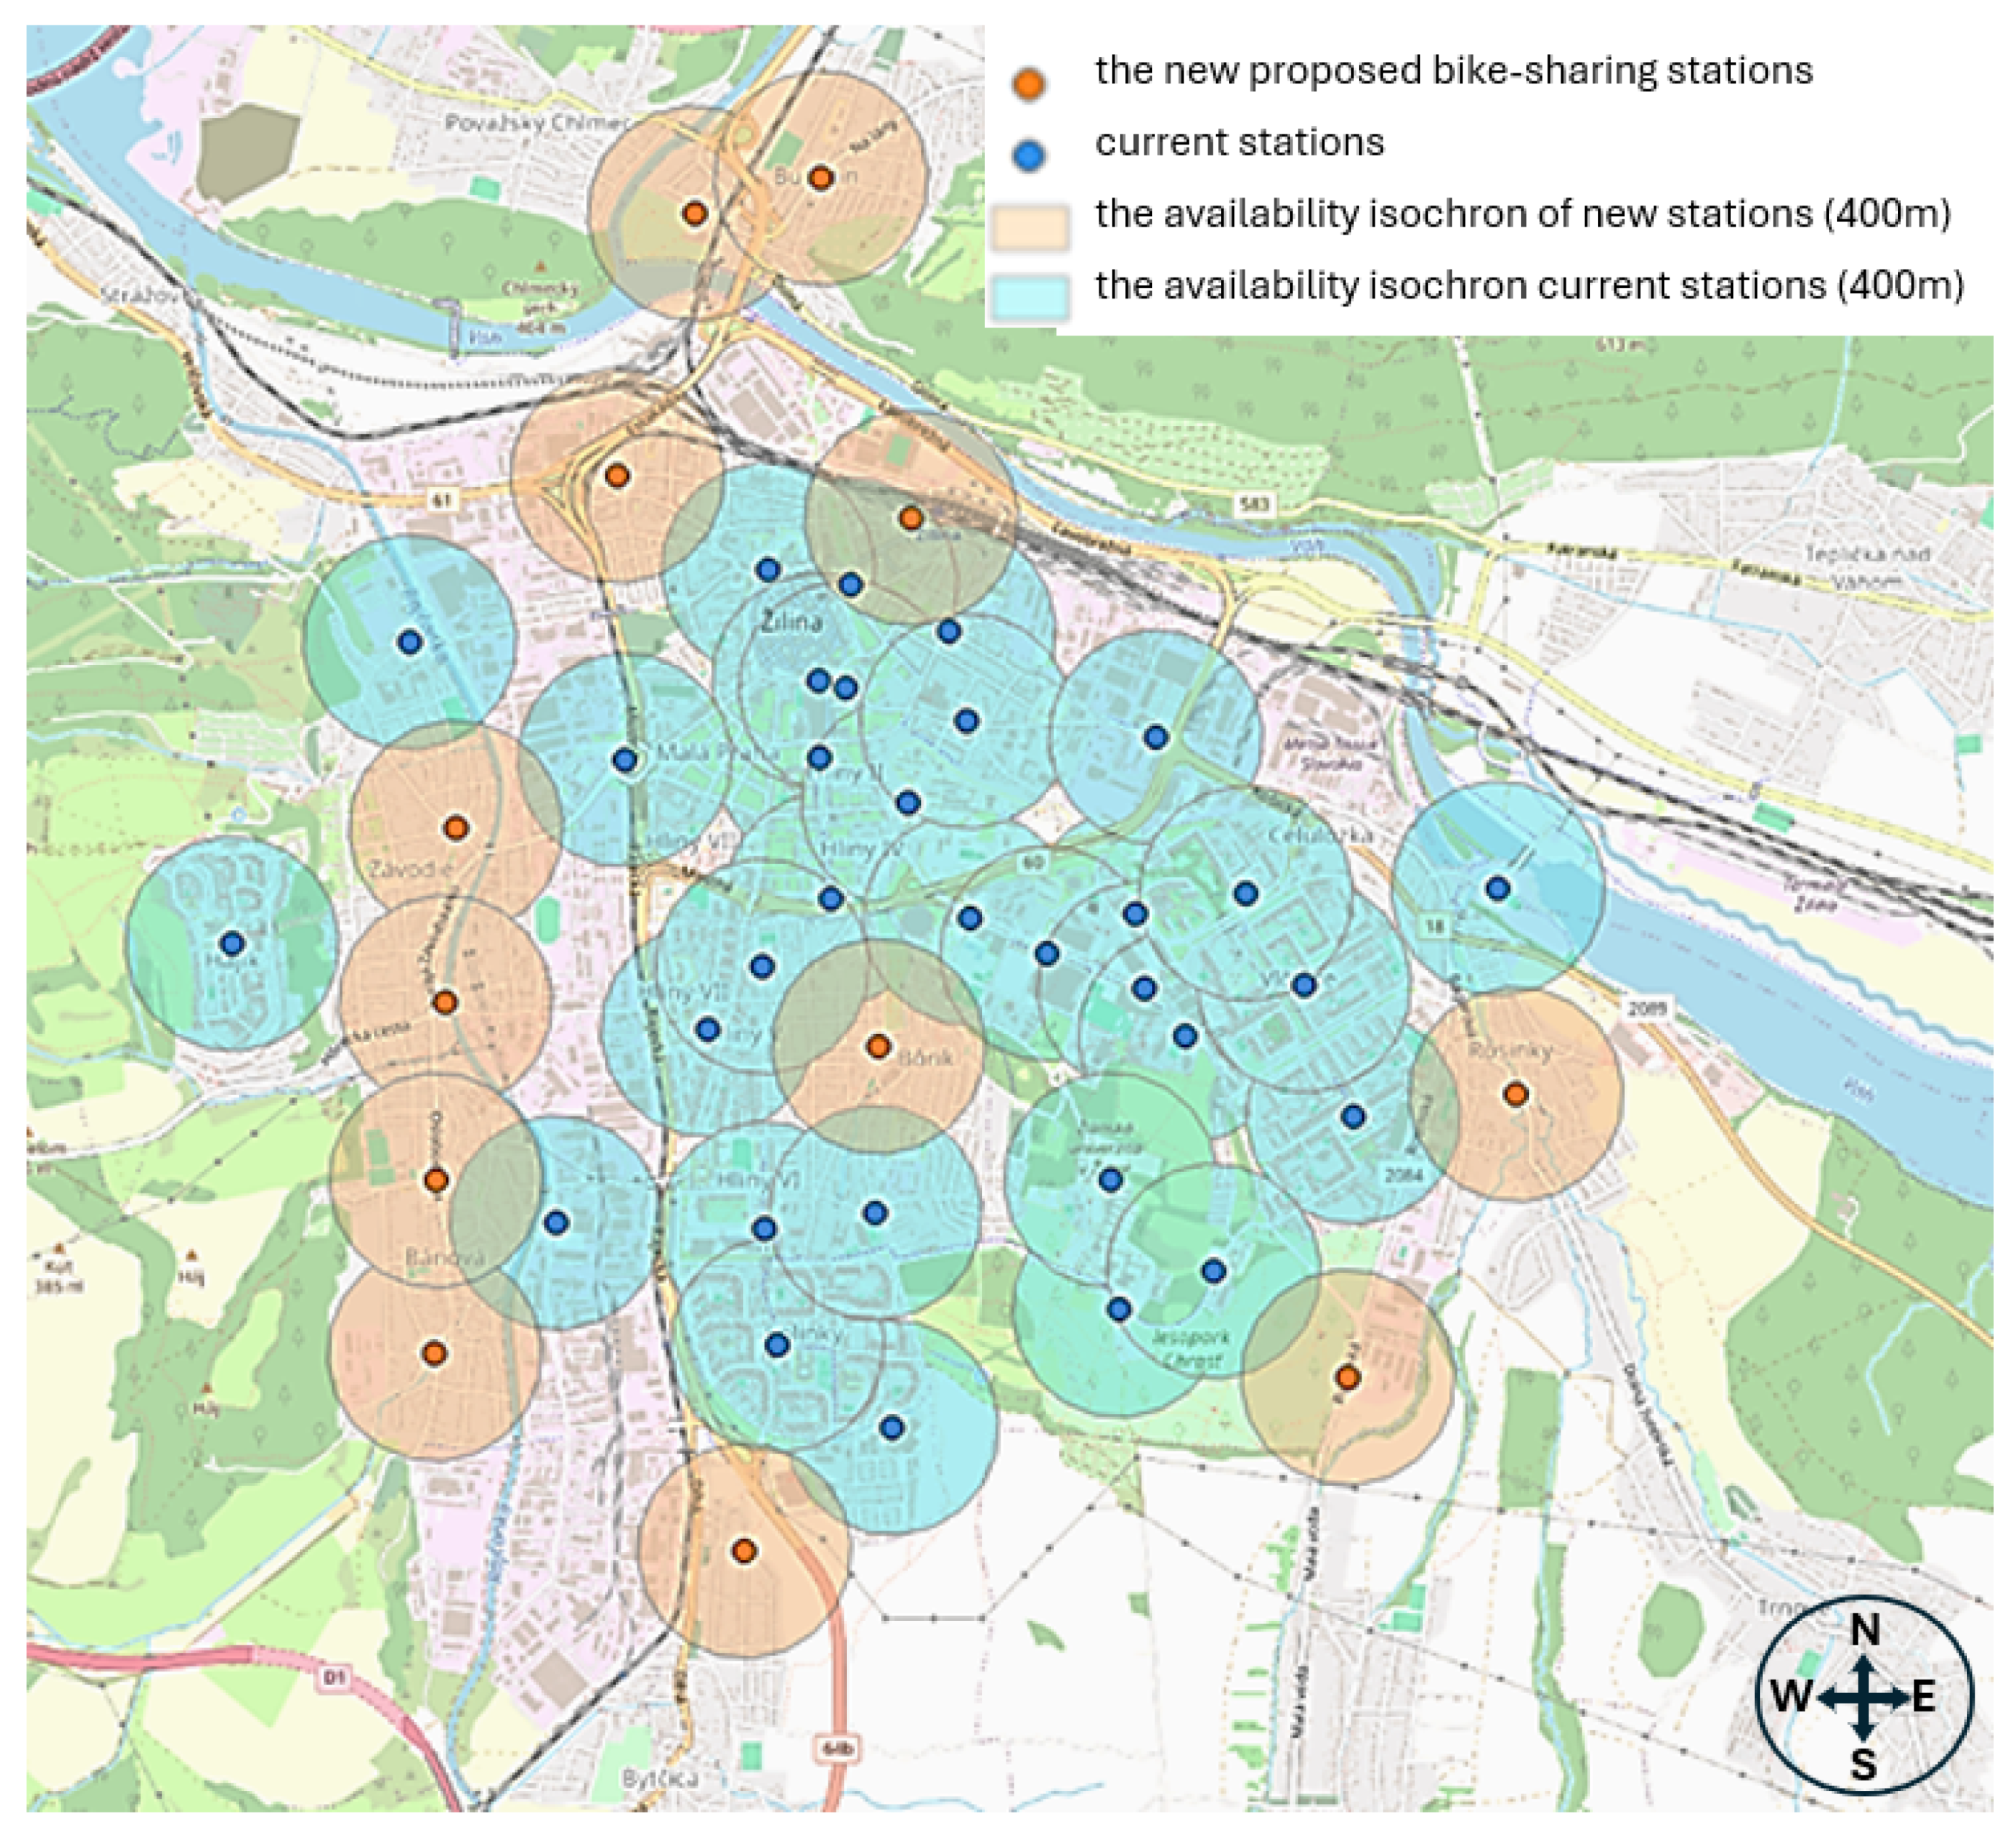
The analysis with the evaluation of questionnaire responses showed new expansion possibilities considering the plan of municipalities with potential territorial urban land. The proposal for the bike-sharing station extension brought in 12 new stations covering the most missing districts from the spatial analysis, as in Figure 9 below.
The overview of the municipality’s districts without availability of the bike sharing service higher than 50% in the current situation is processed in Table 5 below.
The population without availability of the bike-sharing service is estimated according to the number of residents of the selected district (which does not fall within the availability of isochrones) and the total population. The indicative number of people to whom the bike-sharing service is available can be estimated according to officially published population numbers [78].

5. Discussion

The paper was aimed at analyzing the bike-sharing service in the small urban town of Žilina, Slovakia. There is only one operator for service provision, ARRIVA Slovakia, a. s. with the sponsor Kia Slovakia Foundation. Data provided by the company mentioned was processed in the analysis of the current situation with bike-sharing service in the chosen municipality. The analysis itself consisted mainly of spatial analysis using the QGIS program and then by sociological survey. User needs can be inferred based on responses from the submitted questionnaire.
Clarification is needed regarding the method of spatial analysis. In this study, QGIS was used to create Euclidean buffer zones with a fixed radius of 400 m around bike stations. While this approach allows for a quick visual estimation of accessibility, it oversimplifies real-world travel behavior. True isochrone analysis should be based on network-based travel time along pedestrian-accessible streets. This simplification was applied due to limitations in network data and computational capacity, but it likely overestimates the effective service area and should be interpreted accordingly.
The average daily ride time decreased from year to year as shown in Figure 3 from the results, which was probably caused by changing tariffs between seasons. With the shorter free ride time, the average time of one rental also decreased. Between seasons 2021–2023, it oscillated at the same level and slightly increased. We can consider the bike sharing service in Žilina municipality as effective (the value of the average is between 4 and 8). Considering responses in question Q2, the users of bike-sharing service in Žilina consider mostly the price of the service, or free ride time (296 responses).
Moreover, the network of the bike sharing stations covers more than 10 km2, which is the minimum area needed for starting the service considering the described isochrone of availability of 400 m. There is not commonly agreed-upon determination of catchment area; in [57] the 500 m catchment area was used, or in [79] the walk distance was suggested from 400 m to 800 m. Spatial analysis by isochrones of availability was chosen as a universal tool to examine the recent situation. The Isochrone map contains the circles of availability, which serve as a passive accessibility measure visualizing time. This measure was considered more important to travelers than distance [80]. The reachability of bike-sharing stations was second, often answered in the questionnaire survey in question Q2, with 206 responses. Individuals’ decision to use the bike-sharing systems also depends on the availability of bicycles or the distance of stations [81,82], which requires a dense network of stations to increase interest in this service. Respondents could express their opinion in Q3 if the bike-sharing station’s location is sufficient, and 37% considered it sufficient. In comparison with similar large European cities in Table 4, the expansion with new stations is appropriate in the Žilina municipality.
Bicycle infrastructure development has an impact on using the bicycle, and with available bike-sharing service, can attract new interested parties, maybe less experienced cyclists [39]. The quality of the cycling infrastructure was also an important factor in question Q2 from the sociological survey (206 responses) and reflects safer and more effective cycling in the city. The cyclist infrastructure in Žilina is not continuous, as shown in Figure 1A, 48% of respondents considered the quality below the average in question Q1. As the authors show in [83], the success of introducing the bike-sharing system is not aimed at the quantity of infrastructure but its proper integration into the urban fabric.
The spatial analysis showed shortcomings and new opportunities for the improvement of the service. The availability isochrone did not cover 13 municipalities’ districts, which were split into four zones A–D as shown in Figure 5, as well as the Bôrik (residential area with city park) district placed in the middle of the municipality’s area. Respondents’ opinions about the extension of the bike-sharing stations into the districts lacking this service were collected in questions Q5, Q6, and Q7. The respondents proceeded logically, and the primacy of the city districts of Závodie and Budatín is valid. These districts with lack bike-sharing stations are the two closest districts to the city center, located in its immediate vicinity, and the addition of public bicycle stations would be very acceptable (Závodie in zone A to the west and Budatín in zone D to the north of the center). The identified extension requirements for the bike-sharing service are also reflected in the population estimates of underserved areas living in the area uncovered by the service in Table 5.
The combination of spatial analysis (isochrone mapping and heatmaps) and the social survey allowed for cross-validation of findings. For example, areas identified as underserved in the spatial analysis (zones A–D) strongly corresponded with the locations respondents most frequently highlighted for station expansion (Q5 and Q6). This alignment strengthens the justification for proposed station placements and shows the value of integrating objective GIS-based data with subjective user experience to shape a future expansion strategy that is both evidence-based and user-informed.
The busiest bike-sharing stations showed heatmaps in Figure 4 in the city center (main square close to the train and bus station) and in the middle of the biggest residential Vlčince district. The availability of isochrones fully covered the city center, but still respondents proposed the extension of bike-sharing stations to new locations: train station, bus station, streets known for the headquarters of many companies, etc. Problems can be caused by several reasons. The city that does not own the necessary land appears as the most likely, also in cases with Bôrik, especially the city park area, and in other requiring districts in zones A–D mentioned above. On the other hand, the low usability of bike stations with fewer than 1000 rentals or returns also showed up in the spatial analysis. Reasons for low demand for the service can be split up into three groups. First, the location of the bike-sharing station is not in a well-accessible area, or it is located at a higher altitude (like bike stations UNIZA, Lesopark, Námestie Mladosti). The rebalancing of city-wide stations to maintain bike availability on the stations is an important issue for bike-sharing service [84]. Then, the bike station does not cover a large population in its isochronous availability (OC Max, FRI). And third, the bike-sharing station is located on the outskirts of the municipality for nearby company employees (DPMŽ Kvačalova, Stanica Žilina–Záriečie, OC IDEA).
Even though multiple methods were used for complex evaluation of the bike-sharing system in the chosen city Žilina (4th biggest city in Slovakia, identified as a small urban area), the analysis was not related to public transport as one of the indicators of bike-sharing service efficiency. The relationship between bike-sharing services and public transport offers a sustainable urban mobility system [57]. Ref. [50] added that bike-sharing systems complement or replace other ways of transit. The relationship between public transport and bike-sharing service depends upon the length of the trip [85], and wider data, like from a public transport provider or extension of the questionnaire aimed at public transportation, would be needed for the evaluation. The questionnaire was completed by 354 users of the bike-sharing system in Žilina, which is more than required (266 respondents). However, more than 60% of respondents stated their status as students. The reason may be using the bike-sharing service is most often used by students, or a limited procedure in questionnaire distribution as an online survey shared on social media. All the limitations mentioned offer further opportunities for future research.

6. Conclusions

The presented study dealt with the complex analysis of the bike-sharing service in a small urban area in Slovakia using the example of the city of Žilina. The aim was to assess the current state of this service, identify its strengths and weaknesses, and suggest possible improvements. The analysis was carried out by combining spatial methods in the GIS software QGIS, statistical summarization of non-spatial analysis, and a questionnaire survey among users of this service.
Spatial analysis showed that the current coverage of bike-sharing stations in Žilina is insufficient, especially in some municipality districts, such as Závodie, Bánová, Budatín, and Bôrik (marked in the figure). Although the stations in the city center have a high level of use, some peripheral locations are not served, which limits the potential users of this service, as shown in the analysis. The survey questionnaire confirmed that the availability of stations and the price of the service are key factors for using the service. Most respondents agreed that expanding the bike-sharing network in Žilina would be beneficial.
The analysis shows that for bike-sharing to function effectively in Žilina, it is necessary to:
(1)
Expand the network of stations to areas with insufficient coverage.
(2)
Improve cycling infrastructure and connect existing cycle routes.
(3)
Consider the possibilities of further improvements, such as the introduction of electric bicycles.
(4)
Improve the information campaign to attract new users.
The findings of this study provide useful recommendations for responsible entities managing bike-sharing in Žilina, as well as for city authorities dealing with the development of sustainable mobility. The implementation of the proposed measures could lead to a more efficient use of bike-sharing and increase its benefits for inhabitants.

Author Contributions

Conceptualization, S.K., K.O.B. and M.H.; methodology, S.K. and K.O.B.; software, S.K. and M.H.; validation, S.K. and K.O.B.; formal analysis, S.K. and K.O.B.; investigation, S.K. and K.O.B.; resources, S.K. and K.O.B.; data curation, S.K. and K.O.B.; writing—original draft preparation, K.O.B.; writing—review and editing, S.K. and K.O.B.; visualization, K.O.B.; supervision, K.O.B.; project administration, S.K.; funding acquisition, S.K. All authors have read and agreed to the published version of the manuscript.

Funding

This publication was created thanks to support from the Institutional Research of the Faculty of Operation and Economics of Transport and Communications, University of Zilina 034ŽU-4/2025—Inovatívne vzdelávanie projektového manažmentu pre udržateľnú a inteligentnú dopravu v EÚ v súlade s Priemyslom 5.0.

Institutional Review Board Statement

Ethical review and approval were waived for this study by the EURAXESS Centre of the University of Žilina due to the full anonymization of the date with no possibility of retrospective deanonymization of individuals.

Informed Consent Statement

Informed consent was obtained from all subjects involved in the study.

Data Availability Statement

Data are contained within the article.

Conflicts of Interest

The authors declare no conflict of interest.

References

  1. Macioszek, E.; Świerk, P.; Kurek, A. The Bike-Sharing System as an Element of Enhancing Sustainable Mobility—A Case Study Based on a City in Poland. Sustainability 2020, 12, 3285. [Google Scholar] [CrossRef]
  2. Ministerstvo Dopravy, Výstavby a Regionálneho Rozvoja SR. Národná Stratégia Rozvoja Cyklistickej Dopravy a Cykloturistiky v Slovenskej Republike; Cykloportál.sk: Bratislava, Slovakia, 2022; Available online: https://www.cykloportal.sk (accessed on 26 March 2025).
  3. Gogola, M.; Lokšová, Z.; Poliaková, B. Systémy Verejnej Osobnej Dopravy, 2013th ed.; EDIS: Žilina, Slovakia, 2013; ISBN 978-80-554-0663-3. [Google Scholar]
  4. Ge, Y.; Qu, W.; Qi, H.; Cui, X.; Sun, X. Why People like Using Bikesharing: Factors Influencing Bikeshare Use in a Chinese Sample. Transp. Res. Part D Transp. Environ. 2020, 87, 102520. [Google Scholar] [CrossRef]
  5. Jung, J.; Jung, D. Analysis of Factors Affecting the Extra Journey Time of Public Bicycles. Sustainability 2023, 15, 13804. [Google Scholar] [CrossRef]
  6. DeMaio, P.; O’Brien, O.; Rabello, R.; Chou, S.; Benicchio, T. The Meddin Bike-Sharing World Map Report. 2022. Available online: https://bikesharingworldmap.com/reports/bswm_mid2022report.pdf (accessed on 24 March 2025).
  7. Biassoni, F.; Lo Carmine, C.; Perego, P.; Gnerre, M. Choosing the Bicycle as a Mode of Transportation, the Influence of Infrastructure Perception, Travel Satisfaction and Pro-Environmental Attitude, the Case of Milan. Sustainability 2023, 15, 12117. [Google Scholar] [CrossRef]
  8. Shui, C.S.; Szeto, W.Y. A Review of Bicycle-Sharing Service Planning Problems. Transp. Res. Part C Emerg. Technol. 2020, 117, 102648. [Google Scholar] [CrossRef]
  9. Mátrai, T.; Tóth, J. Comparative Assessment of Public Bike Sharing Systems. Transp. Res. Procedia 2016, 14, 2344–2351. [Google Scholar] [CrossRef]
  10. Premier’s Council for Active Living. Research into Barriers to Cycling in NSW; Yumpu.com: Sydney, Australia; Available online: https://www.yumpu.com/en/document/view/3546676/research-into-barriers-to-cycling-in-nsw-the-premiers-council-for- (accessed on 24 March 2025).
  11. Irlam, J.H. Barriers to Cycling Mobility in Masiphumelele, Cape Town: A Best-Worst Scaling Approach. Master’s Thesis, University of Cape Town, Cape Town, South Africa, 2016. [Google Scholar]
  12. Wang, K.; Chen, Y.-J. Joint Analysis of the Impacts of Built Environment on Bikeshare Station Capacity and Trip Attractions. J. Transp. Geogr. 2020, 82, 102603. [Google Scholar] [CrossRef]
  13. Ai, Y.; Li, Z.; Gan, M. A Solution to Measure Traveler’s Transfer Tolerance for Walking Mode and Dockless Bike-Sharing Mode. J. Supercomput. 2019, 75, 3140–3157. [Google Scholar] [CrossRef]
  14. Glász, A.; Juhász, J. Car-Pedestrian and Car-Cyclist Accidents in Hungary. Transp. Res. Procedia 2017, 24, 474–481. [Google Scholar] [CrossRef]
  15. Evgenikos, P.; Yannis, G.; Folla, K.; Bauer, R.; Machata, K.; Brandstaetter, C. How Safe Are Cycl. Eur. Roads? Transp. Res. Procedia 2016, 14, 2372–2381. [Google Scholar] [CrossRef]
  16. Mantuano, A.; Bernardi, S.; Rupi, F. Cyclist Gaze Behavior in Urban Space: An Eye-Tracking Experiment on the Bicycle Network of Bologna. Case Stud. Transp. Policy 2017, 5, 408–416. [Google Scholar] [CrossRef]
  17. Weber, T.; Scaramuzza, G.; Schmitt, K.-U. Evaluation of E-Bike Accidents in Switzerland. Accid. Anal. Prev. 2014, 73, 47–52. [Google Scholar] [CrossRef] [PubMed]
  18. Kubal’ák, S.; Gogola, M. The Accident Rate of Cyclists in the Slovak Republic in Bike-Sharing System. In Proceedings of the 2020 XII International Science-Technical Conference AUTOMOTIVE SAFETY, Kielce, Poland, 21–23 October 2020; pp. 1–5. [Google Scholar]
  19. Sallis, J.F.; Frank, L.D.; Saelens, B.E.; Kraft, M.K. Active Transportation and Physical Activity: Opportunities for Collaboration on Transportation and Public Health Research. Transp. Res. Part A Policy Pract. 2004, 38, 249–268. [Google Scholar] [CrossRef]
  20. Arbeláez Vélez, A.M. Environmental Impacts of Shared Mobility: A Systematic Literature Review of Life-Cycle Assessments Focusing on Car Sharing, Carpooling, Bikesharing, Scooters and Moped Sharing. Transp. Rev. 2024, 44, 634–658. [Google Scholar] [CrossRef]
  21. Shaaban, K. Why Don’t People Ride Bicycles in High-Income Developing Countries, and Can Bike-Sharing Be the Solution? The Case of Qatar. Sustainability 2020, 12, 1693. [Google Scholar] [CrossRef]
  22. Link, C.; Strasser, C.; Hinterreiter, M. Free-Floating Bikesharing in Vienna—A User Behaviour Analysis. Transp. Res. Part A Policy Pract. 2020, 135, 168–182. [Google Scholar] [CrossRef]
  23. Peters, L.; MacKenzie, D. The Death and Rebirth of Bikesharing in Seattle: Implications for Policy and System Design. Transp. Res. Part A Policy Pract. 2019, 130, 208–226. [Google Scholar] [CrossRef]
  24. Soltani, A.; Allan, A.; Anh Nguyen, H.; Berry, S. Bikesharing Experience in the City of Adelaide: Insight from a Preliminary Study. Case Stud. Transp. Policy 2019, 7, 250–260. [Google Scholar] [CrossRef]
  25. Faghih Imani, A.; Miller, E.J.; Saxe, S. Cycle Accessibility and Level of Traffic Stress: A Case Study of Toronto. J. Transp. Geogr. 2019, 80, 102496. [Google Scholar] [CrossRef]
  26. Aliari, S.; Nasri, A.; Motalleb Nejad, M.; Haghani, A. Toward Sustainable Travel: An Analysis of Campus Bikeshare Use. Transp. Res. Interdiscip. Perspect. 2020, 6, 100162. [Google Scholar] [CrossRef]
  27. Fishman, E.; Washington, S.; Haworth, N.; Mazzei, A. Barriers to Bikesharing: An Analysis from Melbourne and Brisbane. J. Transp. Geogr. 2014, 41, 325–337. [Google Scholar] [CrossRef]
  28. Kubaľák, S.; Gogola, M.; Černý, M. Options for Assessing the Impact of the Bike-Sharing System on Mobility in the City Žilina. Transp. Res. Procedia 2021, 55, 378–386. [Google Scholar] [CrossRef]
  29. Zhang, Y.; Mi, Z. Environmental Benefits of Bike Sharing: A Big Data-Based Analysis. Appl. Energy 2018, 220, 296–301. [Google Scholar] [CrossRef]
  30. DeMaio, P. Bike-Sharing: History, Impacts, Models of Provision, and Future. J. Public Transp. 2009, 12, 41–56. [Google Scholar] [CrossRef]
  31. Ricci, M. Bike Sharing: A Review of Evidence on Impacts and Processes of Implementation and Operation. Res. Transp. Bus. Manag. 2015, 15, 28–38. [Google Scholar] [CrossRef]
  32. Machynová, Z. Obľúbený bikesharing sa vracia do ulíc mesta, v tomto roku sa rozšíri o nové stanice i bicykle. Mesto Žilina 2022. Available online: https://www.zilina.sk (accessed on 26 March 2025).
  33. Guo, X.; Sun, H.; Hu, S.; Wu, J.; Zhou, J.; Wang, X. Quantifying Saturation Point of Beijing Bike-Sharing Market from Environmental Benefit: A Data Mining Framework. J. Clean. Prod. 2023, 423, 138686. [Google Scholar] [CrossRef]
  34. Zheng, F.; Gu, F.; Zhang, W.; Guo, J. Is Bicycle Sharing an Environmental Practice? Evidence from a Life Cycle Assessment Based on Behavioral Surveys. Sustainability 2019, 11, 1550. [Google Scholar] [CrossRef]
  35. Jacobsen, P. Safety in Numbers: More Walkers and Bicyclists, Safer Walking and Bicycling. Inj. Prev. 2003, 9, 205–209. [Google Scholar] [CrossRef]
  36. Wang, M.; Zhou, X. Bike-Sharing Systems and Congestion: Evidence from US Cities. J. Transp. Geogr. 2017, 65, 147–154. [Google Scholar] [CrossRef]
  37. Jensen, P.; Rouquier, J.-B.; Ovtracht, N.; Robardet, C. Characterizing the Speed and Paths of Shared Bicycle Use in Lyon. Transp. Res. Part D Transp. Environ. 2010, 15, 522–524. [Google Scholar] [CrossRef]
  38. Woodcock, J.; Tainio, M.; Cheshire, J.; O’Brien, O.; Goodman, A. Health Effects of the London Bicycle Sharing System: Health Impact Modelling Study. BMJ 2014, 348, g425. [Google Scholar] [CrossRef]
  39. Caggiani, L.; Camporeale, R. Toward Sustainability: Bike-Sharing Systems Design, Simulation and Management. Sustainability 2021, 13, 7519. [Google Scholar] [CrossRef]
  40. Holienčinová, M.; Kádeková, Z.; Holota, T.; Nagyová, Ľ. Smart Solution of Traffic Congestion through Bike Sharing System in a Small City. Mob. Netw. Appl. 2020, 25, 868–875. [Google Scholar] [CrossRef]
  41. Neradilová, H.; Ragulský, T. Cycling Traffic Development in Slovakia in the Terms of the City of Košice. MATEC Web Conf. 2017, 134, 00042. [Google Scholar] [CrossRef]
  42. Kubaľák, S.; Kalašová, A.; Hájnik, A. The Bike-Sharing System in Slovakia and the Impact of COVID-19 on This Shared Mobility Service in a Selected City. Sustainability 2021, 13, 6544. [Google Scholar] [CrossRef]
  43. Polis Network. Paris and Antwerp Lead the Way in Bike-Sharing; Polis Network: Brussels, Belgium, 2023; Available online: https://www.polisnetwork.eu (accessed on 26 March 2025).
  44. Pashkevich, A.; Kłos, M.J.; Jaremski, R.; Aristombayeva, M. Method to Evaluate a Bike-Sharing System Based on Performance Parameters. In Decision Support Methods in Modern Transportation Systems and Networks; Sierpiński, G., Macioszek, E., Eds.; Springer International Publishing: Cham, Switzerland, 2021; pp. 95–113. ISBN 978-3-030-71771-1. [Google Scholar]
  45. Yanocha, D.; Mason, J.; Patlán, M.; Benicchio, T.; Alfred, I.; Laksmana, U. The Bikeshare Planning Guide. 2018. Available online: https://www.itdp.org/publication/the-bike-share-planning-guide/ (accessed on 26 March 2025).
  46. NACTO. NACTO Publications; National Association of City Transportation Officials: New York, NY, USA, 2024; Available online: https://nacto.org/publications/ (accessed on 26 March 2025).
  47. Gogola, M.; Poliaková, B.; Veterník, M. Štúdia Uskutočniteľnosti na Systém Požičovne Bicyklov (Bikesharing) v Meste Žilina; Mesto Žilina: Žilina, Slovakia, 2015. [Google Scholar]
  48. Loidl, M.; Witzmann-Müller, U.; Zagel, B. A Spatial Framework for Planning Station-Based Bike Sharing Systems. Eur. Transp. Res. Rev. 2019, 11, 9. [Google Scholar] [CrossRef]
  49. Houde, M.; Apparicio, P.; Séguin, A.-M. A Ride for Whom: Has Cycling Network Expansion Reduced Inequities in Accessibility in Montreal, Canada? J. Transp. Geogr. 2018, 68, 9–21. [Google Scholar] [CrossRef]
  50. Qian, X.; Xiao, R.; Joby, R.; Jaller, M. Optimizing Bikeshare Service to Connect Affordable Housing Units with Transit Service. J. Transp. Geogr. 2024, 117, 103894. [Google Scholar] [CrossRef]
  51. Jiménez, E.; Soriguera, F. A New Dynamic Repositioning Approach for Bike Sharing Systems. Transp. Res. Procedia 2020, 47, 227–234. [Google Scholar] [CrossRef]
  52. Shelat, S.; Huisman, R.; van Oort, N. Analysing the Trip and User Characteristics of the Combined Bicycle and Transit Mode. Res. Transp. Econ. 2018, 69, 68–76. [Google Scholar] [CrossRef]
  53. Martinez, L.M.; Caetano, L.; Eiró, T.; Cruz, F. An Optimisation Algorithm to Establish the Location of Stations of a Mixed Fleet Biking System: An Application to the City of Lisbon. Procedia-Soc. Behav. Sci. 2012, 54, 513–524. [Google Scholar] [CrossRef]
  54. Żochowska, R.; Jacyna, M.; Kłos, M.J.; Soczówka, P. A GIS-Based Method of the Assessment of Spatial Integration of Bike-Sharing Stations. Sustainability 2021, 13, 3894. [Google Scholar] [CrossRef]
  55. Śleszyński, P.; Olszewski, P.; Dybicz, T.; Goch, K.; Niedzielski, M.A. The Ideal Isochrone: Assessing the Efficiency of Transport Systems. Res. Transp. Bus. Manag. 2023, 46, 100779. [Google Scholar] [CrossRef]
  56. Younes, H.; Nasri, A.; Baiocchi, G.; Zhang, L. How Transit Service Closures Influence Bikesharing Demand; Lessons Learned from SafeTrack Project in Washington, D.C. Metropolitan Area. J. Transp. Geogr. 2019, 76, 83–92. [Google Scholar] [CrossRef]
  57. Radzimski, A.; Dzięcielski, M. Exploring the Relationship between Bike-Sharing and Public Transport in Poznań, Poland. Transp. Res. Part A Policy Pract. 2021, 145, 189–202. [Google Scholar] [CrossRef]
  58. Li, Q.; Zhang, T.; Wang, H.; Zeng, Z. Dynamic Accessibility Mapping Using Floating Car Data: A Network-Constrained Density Estimation Approach. J. Transp. Geogr. 2011, 19, 379–393. [Google Scholar] [CrossRef]
  59. OECD The Organisation for Economic Co-Operation and Development. Available online: https://www.oecd.org/en.html (accessed on 25 March 2025).
  60. BikeKIA. BikeKIA—Bikesharing v Žiline—Požičaj si bicykel. 2024. Available online: https://www.bikekia.sk (accessed on 26 March 2025).
  61. Staricco, L. 15-, 10- or 5-Minute City? A Focus on Accessibility to Services in Turin, Italy. J. Urban. Mobil. 2022, 2, 100030. [Google Scholar] [CrossRef]
  62. Bosina, E.; Weidmann, U. Estimating Pedestrian Speed Using Aggregated Literature Data. Phys. A Stat. Mech. Its Appl. 2017, 468, 1–29. [Google Scholar] [CrossRef]
  63. GIS Support. Priestorové Analýzy—GIS Riešenia. 2024. Available online: https://www.gis-riesenia.sk/ (accessed on 26 March 2025).
  64. OpenStreetMap. OpenStreetMap. Available online: https://www.openstreetmap.org/ (accessed on 26 March 2025).
  65. PTV Group. Empowering Mobility for a Cleaner, Smarter & Safer Future. Available online: https://www.ptvgroup.com/en (accessed on 25 March 2025).
  66. Calculator.net. Sample Size Calculator. Available online: https://www.calculator.net/sample-size-calculator.html (accessed on 25 March 2025).
  67. The Meddin Bike-sharing World Map The Meddin Bike-Sharing World Map. Available online: https://bikesharingworldmap.com/ (accessed on 25 March 2025).
  68. Arboria. Arboria Bike—Trnavský systém zdieľaných elektrobicyklov. Available online: https://arboriabike.sk/ (accessed on 26 March 2025).
  69. Nextbike Czech Republic. Jihlava—Nextbike Czech Republic. Available online: https://www.nextbikeczech.com/mesta/ (accessed on 26 March 2025).
  70. Biketower. Biketower—CZ Pardubice. 2024. Available online: https://www.biketower.cz (accessed on 26 March 2025).
  71. Bike Share Map: Offenburg Bike Share Map: Offenburg (EinfachMobil). Available online: https://bikesharemap.com/offenburg/ (accessed on 26 March 2025).
  72. Vélhop. Service de Location de Vélo de l’Eurométropole de Strasbourg. 2023. Available online: https://www.velhop.strasbourg.eu (accessed on 26 March 2025).
  73. Comune di Trieste. Mobilità Sostenibile—Comune di Trieste. 2024. Available online: https://www.comune.trieste.it/mobilita-sostenibile (accessed on 26 March 2025).
  74. Brescia mobilita Brescia Mobilita. Available online: https://bicimia.bresciamobilita.it/default.aspx (accessed on 26 March 2025).
  75. Temperatura, mora Temperatura mora Widget. Available online: https://temperatura-mora.hr/widget/ (accessed on 26 March 2025).
  76. Beryl. Brighton and Hove—Beryl Bike-Sharing Scheme. Available online: https://beryl.cc/scheme/brighton-and-hove (accessed on 26 March 2025).
  77. The city bike The City Bike. Available online: https://www.kolumbus.no/en/travel/bicycle/bysykkelen/ (accessed on 26 March 2025).
  78. CG eGOV—Administratívne Členenie CG eGOV—Administratívne Členenie. Available online: https://egov.zilina.sk/Default.aspx?NavigationState=160:0: (accessed on 25 March 2025).
  79. Guerra, E.; Cervero, R.; Tischler, D. Half-Mile Circle: Does It Best Represent Transit Station Catchments? Transp. Res. Rec. 2012, 2276, 101–109. [Google Scholar] [CrossRef]
  80. Bhellar, M.G.; Talpur, M.A.H.; Khahro, S.H.; Ali, T.H.; Javed, Y. Visualizing Travel Accessibility in a Congested City Center: A GIS-Based Isochrone Model and Trip Rate Analysis Considering Sustainable Transportation Solutions. Sustainability 2023, 15, 16499. [Google Scholar] [CrossRef]
  81. Kou, Z.; Cai, H. Comparing the Performance of Different Types of Bike Share Systems. Transp. Res. Part D Transp. Environ. 2021, 94, 102823. [Google Scholar] [CrossRef]
  82. Cheng, L.; Yang, J.; Chen, X.; Cao, M.; Zhou, H.; Sun, Y. How Could the Station-Based Bike Sharing System and the Free-Floating Bike Sharing System Be Coordinated? J. Transp. Geogr. 2020, 89, 102896. [Google Scholar] [CrossRef]
  83. Mahajan, S.; Argota Sánchez-Vaquerizo, J. Evaluating Urban Bike-Sharing Accessibility: A Comparative Study of 40 Cities Worldwide. 2024. Available online: https://ssrn.com/abstract=4853905 (accessed on 25 March 2025).
  84. Vichova, K.; Peterek, K.; Hrabec, D.; Taraba, P. Bike-Sharing System in the Czech Republic and Foreign. Transp. Res. Procedia 2023, 74, 11–18. [Google Scholar] [CrossRef]
  85. Levy, N.; Golani, C.; Ben-Elia, E. An Exploratory Study of Spatial Patterns of Cycling in Tel Aviv Using Passively Generated Bike-Sharing Data. J. Transp. Geogr. 2019, 76, 325–334. [Google Scholar] [CrossRef]
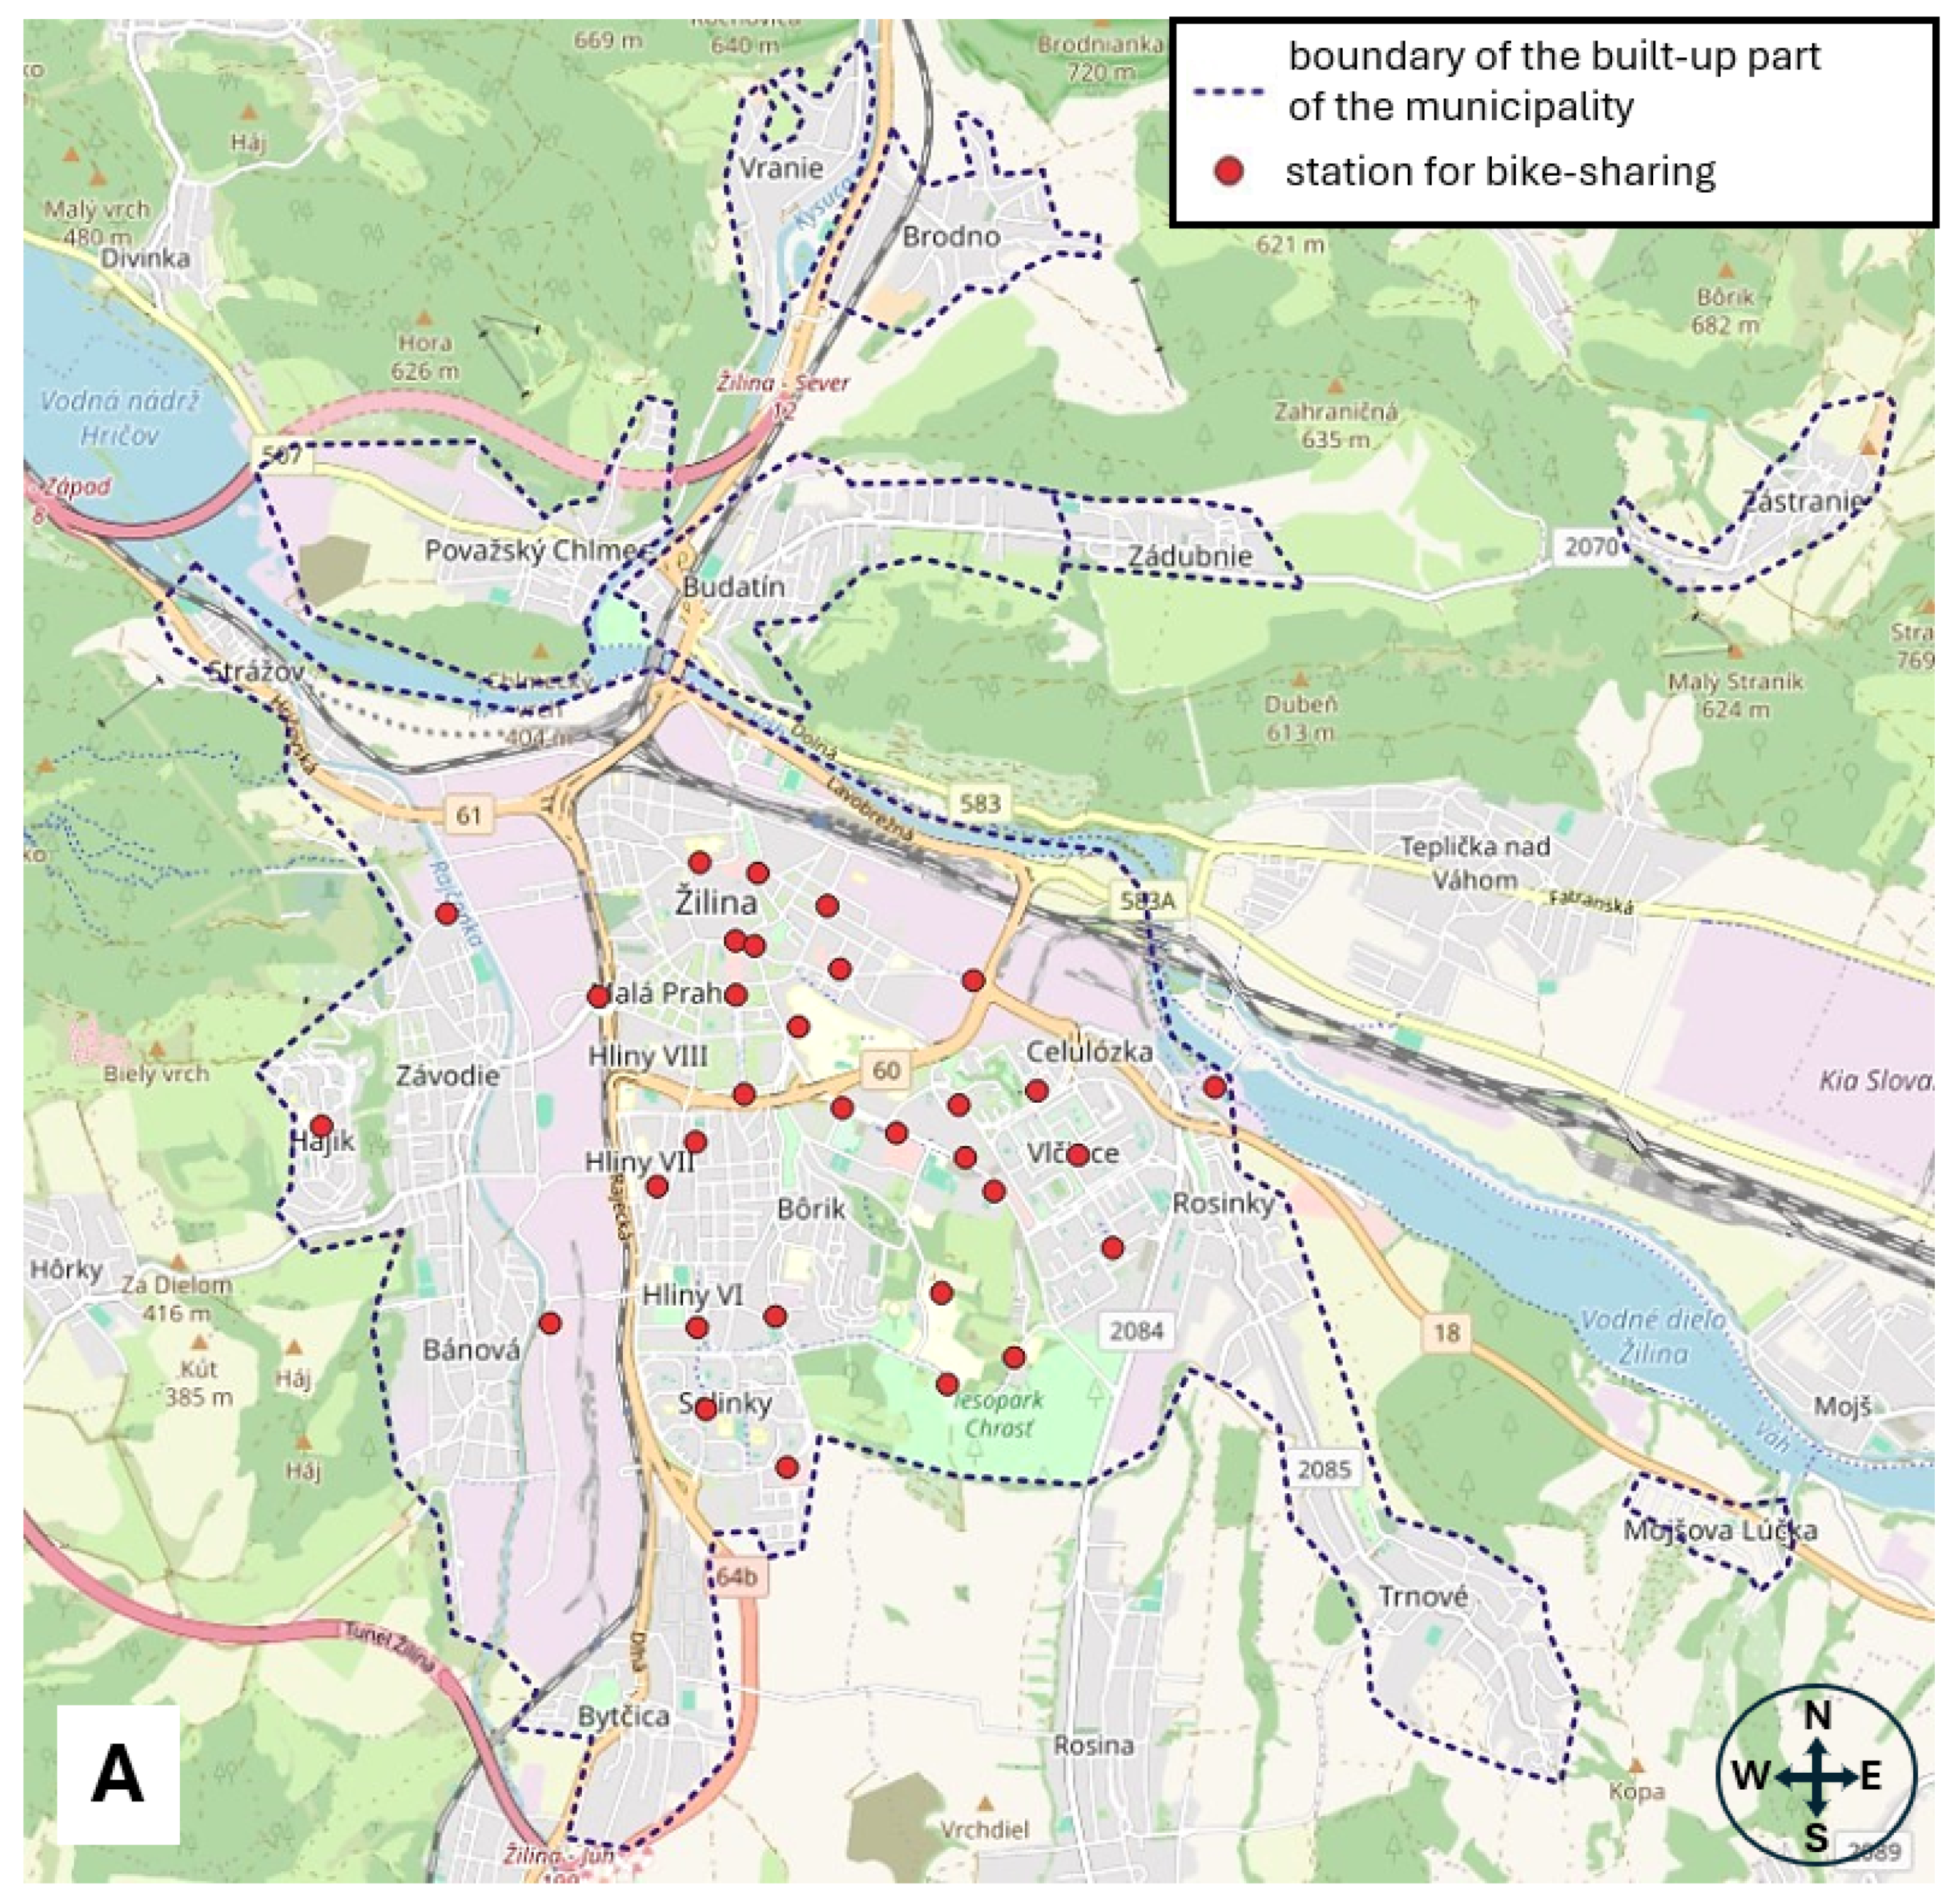
Figure 1. Full map of the municipality of Žilina with (A) and the bicycle infrastructure of Žilina (B) with marked bike-sharing stations.
Applsci 15 06240 g001aApplsci 15 06240 g001b
Figure 2. Number of bicycle rentals and seasonsduration overview from 2019 to 2023.
Applsci 15 06240 g002
Figure 3. Graph presenting the average rental time in seasons 2019–2023.
Applsci 15 06240 g003
Figure 4. Heat maps showing the attractiveness of the stations in terms of (A) bike rentals and (B) bike returns.
Applsci 15 06240 g004
Figure 5. The coverage of the system of shared bicycles in Žilina by spatial analysis.
Applsci 15 06240 g005
Figure 6. Graph showing responses to question Q2.
Applsci 15 06240 g006
Figure 7. Graph showing responses to question Q5.
Applsci 15 06240 g007
Figure 8. The graph shows responses to question Q6.
Applsci 15 06240 g008
Figure 9. The extension of bike-sharing stations proposal.
Applsci 15 06240 g009
Table 1. BikeKIA bike-sharing service development through the years processed based on provided data from the operator.
SeasonNumber of
Bicycles
Number
of Stations
Free ride Time
in Minutes
20191202060
20201202060
20211232130
20221453030
20231453030
20241953215
Table 2. Summarization of the obtained data from the operator of the bike-sharing in Žilina.
The Year of the SeasonThe Population of ŽilinaNo. of BicyclesNo. of RentalsDuration of the Season
(in Days)
Average Daily Ride Time
(in Minutes)
Average Daily Rides on 1 Bicycle
201982,867120288,34724914.69.65
202082,494120145,707221175.49
202182,301123148,99225011.64.85
202281,062123–145198,77426010.75.27
202380,342145198,18124910.85.49
Table 3. The calculation of the minimal research sample for the survey.
Population size80,342
Confidence level95%
Margin of error6%
Research sample266 respondents
Table 4. The overview of the bike-sharing service in European cities with similar areas like Žilina municipality.
Name of the City
[Country]
InhabitantsArea of the City
in km2
Bike-Sharing StationsBike-Sharing Stations per 1 km2
Žilina81,21980.03 km2320.40
Trnava [SK]62,75471.54 km2961.34
Jihlava [CZ]53,98687.86 km2600.68
Pardubice [CZ]92,36277.71 km2610.78
Offenburg [DE]59,21578.38 km2220.28
Strassburg [FR]287,22878.26 km2310.40
Terst [IT]202,12384.49 km2230.27
Brescia [IT]189,90290.68 km2931.03
Split [HR]188,69479.33 km2961.21
Brighton and Hove [GB]256,60087.54 km21061.21
Stavanger [NO]119,58671.4 km2500.70
The average number of bike-sharing stations61
Table 5. Overview of population districts lacking the bike-sharing service.
The Population of Municipality Žilina in 2023: 80,342
Districts Without Bike-Sharing ServiceCurrent SituationThe Extension Bike-Sharing Station Proposal
DistrictPopulationRelative Bike-Sharing Service Uncovered Area Based on Isochrones of AvailabilityEstimation of Population Without Availability of the ServiceRelative Bike-Sharing Service Uncovered Area Based on Isochrones of AvailabilityEstimation of Population Without Availability of the Service
Applsci 15 06240 i001Bôrik349465%227120%699
ABánová198185%168420%396
Závodie276180%220920%552
BRosinky68785%58420%137
Mojšova Lúčka442100%442100%442
Trnové2624100%2624100%2624
CBytčica2173100%217375%1630
DBudatín1825100%182530%548
Považský Chlmec1442100%144295%1370
Brodno1314100%1314100%1314
Strážov520100%520100%520
Vranie774100%774100%774
Zádubnie721100%721100%721
Zástranie921100%921100%921
SUM21,679 19,504 16,177
Disclaimer/Publisher’s Note: The statements, opinions and data contained in all publications are solely those of the individual author(s) and contributor(s) and not of MDPI and/or the editor(s). MDPI and/or the editor(s) disclaim responsibility for any injury to people or property resulting from any ideas, methods, instructions or products referred to in the content.