Article

Portable NIR Spectroscopy Combined with Machine Learning for Kiwi Ripeness Classification: An Approach to Precision Farming

by
Giuseppe Altieri
1,
Sabina Laveglia
1,*,
Mahdi Rashvand
2,
Francesco Genovese
1,
Attilio Matera
1,
Alba Nicoletta Mininni
1,
Maria Calabritto
1 and
Giovanni Carlo Di Renzo
1
1
Department of Agricultural, Forestry, Food and Environmental Sciences (DAFE), University of Basilicata, 85100 Potenza, Italy
2
Centre for Business and Industry Transformation, Nottingham Trent University, Nottingham NG1 4FQ, UK
*
Author to whom correspondence should be addressed.
Appl. Sci. 2025, 15(11), 6233; https://doi.org/10.3390/app15116233
Submission received: 16 May 2025 / Revised: 29 May 2025 / Accepted: 30 May 2025 / Published: 1 June 2025
(This article belongs to the Special Issue Technologies and Techniques for the Enhancement of Agriculture 4.0)

Abstract

:
This study aims to evaluate and classify the ripening stages of yellow-fleshed kiwifruit by integrating spectral and physicochemical data collected from the pre-harvest phase through 60 days of storage. A portable near-infrared (NIR) spectrometer (900–1700 nm) was used to develop predictive models for soluble solids content (SSC) and firmness (FF), testing multiple preprocessing methods within a Partial Least Squares Regression (PLSR) framework. SNV preprocessing achieved the best predictions for FF (R2P = 0.74, RMSEP = 12.342 ± 0.274 N), while the Raw-PLS model showed optimal performance for SSC (R2P = 0.93, RMSEP = 1.142 ± 0.022°Brix). SSC was more robustly predicted than FF, as reflected by RPD values of 2.6 and 1.7, respectively. For ripening stage classification, an Artificial Neural Network (ANN) outperformed other models, correctly classifying 97.8% of samples (R2 = 0.95, RMSE = 0.08, MAE = 0.03). These results demonstrate the potential of combining NIR spectroscopy with AI techniques for non-destructive quality assessment and accurate ripeness discrimination. The integration of regression and classification models further supports the development of intelligent decision-support systems to optimize harvest timing and postharvest handling.

1. Introduction

The kiwifruit is a perennial fruit belonging to the Actinidiaceae family, specifically the genus Actinidia. Usually, kiwifruit are harvested unripe and stored in controlled environment storage rooms for long periods of time before being marketed. As a climacteric fruit, it produces ethylene (“ripening hormone”) during the postharvest ripening process [1]. Combined with pre-harvest factors, this contributes to the variation in fruit quality both at harvest and during chilled storage, resulting in the difficulty of sorting fruits according to their storage potential. To reduce losses along the agrifood supply chain, the optimal assessment of fruit ripeness is a crucial aspect in order to optimize the quality of the fruit for fresh consumption [2]. Traditionally, ripeness classification has relied on destructive methods, which require sampling and chemical and physical analysis that are limiting in terms of cost, time, and large-scale applicability [3]. However, it is important to emphasize that maturity requirements can vary significantly depending on the commercial destination of the product: for fresh consumption, fruits at the optimal stage of ripeness are preferred, with desirable organoleptic qualities such as aroma, sweetness, and texture, whereas for storage or long-distance transportation, it is often preferable to harvest slightly unripe fruits, which are more resistant to mechanical damage and spoilage, in order to preserve quality at the point of sale.
Near-infrared visual spectroscopy (Vis-NIR) is one of the most commonly used non-destructive techniques to estimate the internal quality of fruits [4]. Spectroscopy is based on the bonding that governs the interaction between near-infrared (NIR) light and the vibrations of chemical bonds in organic molecules inside the products. Each chemical compound has distinctive absorption and reflection bands in the NIR spectrum [5]. Due to these basic principles, the measurement of the ripeness of orchards non-destructively has a solid basis from the past [6].
The use of portable NIR devices facilitates the quick collection of data on the chemical composition and structural characteristics of fruits, making this technology especially advantageous for field applications as well as along the supply chain [7]. Nowadays, several applications of NIRs spectroscopy have been carried out on the evaluation of insight quality of fruits like melons [8], apricot [9], apple [10], citrus [11], strawberries [12], and also kiwifruit [1,4].
Soluble solids content (SSC) and flesh firmness (FF) are key parameters strongly correlated with final consumption quality, including sweetness and texture [13]. According to the literature, flesh firmness (FF) in kiwifruits must be equal to or greater than approximately 62 N, while the soluble solids content (SSC) should range from 6.2 to 6.5°Brix for fresh consumption and from 7 to 9°Brix for storage [14,15].
The integration of NIR spectroscopy (NIRS) sensors with machine learning (ML) models offers promising opportunities for classifying fruit ripening stages and predicting quality traits [4]. Traditional ML models, primarily based on linear relationships between instances and predictors in chemometric applications, have reached a significant milestone, consistently proving to be robust tools for predicting fruit quality parameters, as confirmed by several studies [10,11,12,16].
Partial Least Squares Regression (PLSR) remains the most widely used linear method for multivariate modeling due to its robustness and being easy to interpret [17]. On kiwifruit applications, Ciccoritti et al. (2019) [13] achieved high predictive performance using PLS models for SSC (R2 = 0.993, RMSEP = 0.40) and dry matter (DM) (R2 = 0.983, RMSEP = 0.33), confirming the reliability of the prediction task. Similar results were reported by Benelli et al. (2022) [15], who applied PLS models to the ‘Hayward’ variety and achieved predictive R2 values of up to 0.94 for SSC and 0.92 for FF. Vis/NIR spectroscopy (375–1050 nm) was used to monitor the ripening of ‘Jintao’ kiwifruit over a 13-week harvest period by [18]. The developed PLS models achieved good predictive performance, with R2 values of 0.81 for SSC and 0.88 for Hue [18]. A similar approach is multi-range data fusion, as demonstrated by Cevoli et al. (2024) [19], who integrated Vis/NIR HSI (400–1000 nm) and FT-NIR (800–2500 nm) spectra through both low-level (concatenation of pretreated spectra) and mid-level (fusion of features extracted via Principal Component Analysis (PCA) or PLS from each dataset) data fusion techniques. The best results were achieved with feature fusion (mid-level, PLS scores), showing R2 values greater than 0.85 for SSC, DM, and FF, confirming the efficacy of an integrated approach across spectral bands. More recently, Xia et al. (2024) [20] compared both diffuse reflectance and diffuse transmission, or predicting SSC in kiwifruit. Their study combined various preprocessing techniques (e.g., Savitzky–Golay smoothing and multiplicative scatter correction (MSC)) with competitive adaptive reweighted sampling (CARS) for wavelength selection and used PLS regression to build predictive models. The diffuse reflectance method yielded superior performance (R2 = 0.98, RMSEP = 0.66) compared to the transmission method (R2 = 0.95, RMSEP = 0.93), highlighting its higher potential in SSC prediction.
Partial Least Squares Discriminant Analysis (PLS-DA) and Linear Discriminant Analysis (LDA) are widely employed in the classification assessment of kiwifruit. For example, Benelli et al. (2022) [15] used Vis-NIR spectroscopy (400–1000 nm) to classify ‘Hayward’ kiwifruit into three maturity stages based on soluble solids content (SSC) and flesh firmness (FF), achieving classification sensitivities of 97% (for SSC) and 93% (for FF) using PLS-DA and soft PLS-DA models. Similarly, Lee et al. (2025) [1] developed PLS-DA and Support Vector Machine Classification (SVMC) models to distinguish ripening stages, reporting classification accuracies of 91.46% and 91.55% for PLS-DA and SVMC, respectively.
Vis-NIR reflectance has thus proven to be a reliable non-destructive technique for monitoring compositional changes and assessing quality in kiwifruit during both the harvest and postharvest periods [21]. However, given the dynamic nature of quality parameters over time, the application of more complex or nonlinear models may be required to capture these changes effectively. For instance, Support Vector Machines (SVMs) have outperformed linear models such as PLS in predicting SSC and firmness after storage [1,22]. Similarly, Artificial Neural Networks (ANNs), as demonstrated by [23], have proven to be effective tools for predicting firmness and its interactions with mineral composition during kiwifruit storage. In addition, convolutional neural networks (CNNs) have shown great potential in multi-source data fusion scenarios, achieving an R2 of 0.864 in SSC prediction [24].
Due to their ability to model complex, often nonlinear and previously unknown relationships between input variables and quality parameters during ripeness stages and postharvest storability, advanced machine learning (ML) models have become key tools for classification tasks in kiwifruit research. For instance, Li M. et al. (2022) [4] used spectral data acquired at harvest time to classify fruit based on firmness (with a threshold of 9.8 N) using Random Forest (RF), SVM, and Decision Stumps (DS) models. The best performance was achieved after 125 days of storage, with 79% of firm and 54% of soft fruits correctly classified. Shang et al. (2023) [25] developed PLS-DA and simplified k-nearest neighbors (KNN) models to discriminate kiwifruit maturity stages, obtaining classification accuracies of 93.3% and 98.3%, respectively. More recently, Qin et al. (2024) [26], explored the application of NIR sensors for real-time firmness evaluation during robotic fruit handling. By employing KNN and SVM classifiers, they achieved classification accuracies of 97.5% and 96.24%, respectively.
In this context, the ability to classify kiwifruit based on their ripeness stage at harvest and their predicted behavior during storage represents a valuable tool for precision harvesting strategies. The integration of Vis-NIR spectroscopy with advanced classification algorithms enables the development of decision-support systems capable of guiding harvest operations. Such tools can discriminate fruits not only by their current quality attributes but also by their anticipated postharvest evolution, thereby allowing selective harvesting. Most of the literature has focused on long-term storage scenarios, with studies assessing internal quality attributes over extended periods ranging from 120 to 150 days [1,22], with the aim of supporting storage management decisions and optimizing fruit destination. In contrast, few studies have explored the use of Vis-NIR spectroscopy to monitor quality evolution over shorter periods, up to 8 weeks [27].
This study aims to contribute to the assessment and classification of kiwifruit quality at harvest. Unlike conventional approaches, which mainly focus on data collected at or after harvest, this work also integrates spectral and physicochemical information gathered during the pre-harvest phase, allowing for the continuous monitoring of quality traits up to 60 days after storage.
Using portable near-infrared (NIR) spectroscopy (900–1700 nm), the goal is to develop predictive and classification models of kiwifruit ripening based on key commercial parameters: soluble solids content (SSC) and firmness (FF). The ultimate aim is to improve the accuracy of ripening stage prediction and classification, thereby supporting more informed decisions regarding harvest timing and postharvest management, in a short- to medium-term perspective.

2. Materials and Methods

2.1. Sample Preparation

The kiwifruit Actinidia chinensis cv Zesy002 (trade name: Zespri™ Sungold) was cultivated in the Metaponto area (Province of Matera, Basilicata, Italy). Fruits were harvested in September 2024 at two times: two weeks before reaching commercial maturity and at commercial harvest. This sampling strategy was selected to capture clearly distinct stages relevant for practical harvesting decisions. Immediately after harvest (day 0), the fruits were transferred to a cold storage chamber and kept at an initial temperature of 10 °C. During storage, a daily ozone treatment was applied at a flow rate of 5 ppm/min for 30 min, administered each day throughout the storage period.
The storage temperature was gradually reduced from day 0, with a controlled decrease of approximately 1 °C per day, until reaching −0.5 °C on day 10. After the gradual cooling phase, the fruits were stored at −0.5 °C for the remainder of the storage period.

2.2. Data Collection

Near-infrared (NIR) analysis was performed using a portable PoliSPEC-NIR spectrophotometer (courtesy of IT-Photonics S.r.l., Fara Vicentino, Italy). The device operates in the spectral range of 900–1700 nm, with a spectral resolution of 3.2 nm. It is equipped with a halogen lamp as light source and an InGaAs (Indium Gallium Arsenide) detector with a 256-pixel array. The instrument also features a front-mounted heat sink and a thermal control system to minimize signal distortion caused by temperature fluctuations during field use.
Spectral data were collected at three distinct time points: 10 days before harvest (pre-harvest, PH), at harvest (day 0, D0), and after 60 days of refrigerated storage (day 60, D60). A total of 200 samples were analyzed. Measurements were performed in duplicate on opposite equatorial sides of each fruit, and the two spectra were averaged to obtain a representative spectrum for each sample.

2.3. Soluble Solids Content and Firmness Analysis on Kiwifruit

At each sampling time, the soluble solids content (SSC) was determined using a portable refractometer (Atago model ATC-1E, Minato-ku, Tokyo, Japan) with a Brix scale range from 0 to 32 ± 0.2%.
Fruit firmness (FF) was determined using an Instron texture analyzer (Model 3343, Instron Co., Norwood, MA, USA), equipped with a flat-tipped cylindrical stainless steel probe of 8 mm. The penetration test was performed at a constant speed of 4 mm/min. Firmness was assessed by measuring the force required to penetrate the fruit flesh, excluding the skin, to a depth corresponding to 20% of the fruit’s equatorial height. Results were expressed in Newtons (N).

2.4. Data Analysis

2.4.1. Development of a Predictive Model for Soluble Solids Content and Firmness

Partial Least Squares Regression (PLSR) is a widely used technique for developing linear prediction models based on spectral data and measured qualitative parameters, such as firmness and soluble solids content (SSC) [12,15,28]. This approach enables the analysis of the relationship between the independent variables (spectral matrix X) and the dependent variables (Y matrix), while reducing data dimensionality and mitigating the influence of noise. The principle of PLSR relies on the decomposition of the X matrix into new latent components that simultaneously maximize covariance with Y in order to construct robust and efficient predictive models.

Data Preprocessing

To enhance the signal-to-noise ratio and reliability of the predictive models, different spectral pretreatment methods were used. More specifically, Multiplicative Scatter Correction (MSC) and Standard Normal Variate (SNV) were used to normalize the scattering effect. MSC assumes that all the samples have the same scattering as a reference spectrum (e.g., the mean spectrum). The method is to calculate a linear-regressed model between all of the measured spectra and the reference spectrum and correct the measured spectra using the linear-regressed model obtained [29]. Similar to MSC, SNV operates individually on each spectrum by subtracting its mean and dividing by its standard deviation [30]. Additionally, the Savitzky–Golay filter was applied to compute first- (SG1) and second-order (SG2) derivatives, aiming to reduce high-frequency noise while preserving low-frequency information [31]. For dimensionality reduction, a Principal Component Analysis (PCA) was used, retaining the components that explained at least 95% of the total spectral variance [28].
To optimize the performance of the PLSR model, an iterative procedure was implemented for the removal of outliers and uninformative wavelengths, as described in [32]. Briefly, outliers were identified based on cross-validation residuals, which were then normalized using the z-score and excluded if associated with anomalous values relative to the overall distribution. In parallel, relevant wavelengths were selected by analyzing the PLSR loading coefficients, normalized with respect to their standard deviation and to the spectral variability specific to each wavelength.

Performance Analysis of the Prediction Model

The performance of the PLSR model, developed using 80% of the calibration dataset, was evaluated using the coefficient of determination (R2), root mean square error of calibration (RMSE), and Residual Predictive Deviation (RPD), as shown in Equations (1)–(3). A 2-fold cross-validation was employed to balance computational efficiency and model robustness, helping to reduce overfitting.
R 2 = 1 i = 1 n ( y i y ^ i ) 2 i = 1 n ( y i y - ) 2
RMSE = 1 i = 1 n ( y i y ^ i ) 2 n
R P D = SD RMSE
where yi is the measured value, y ^ i is the predicted value, y - is the mean of predicted values, n is the number of samples, and SDγ is the standard deviation of measured values.

2.4.2. Development of a Classification Model for Fruit Ripeness Assessment

Linear Discriminant Analysis (LDA)

Linear Discriminant Analysis (LDA) was used to improve the discrimination between kiwi samples. LDA is a classification method that maps n-dimensional sample vectors to an m-dimensional space and optimizes separations of the groups by maximizing between-class variance and minimizing within-class variance. LDA is closely related to analysis of variance and classification, with the objective of modeling an independent variable as a linear combination of predictor variables [33].

Decision Trees (DTs)

Decision Tree (DT) is one of the most used and inductive approaches for data transformations. It is suitable for the treatment of discrete-valued functions and even with noisy data. Predictions are generally made for the decision tree using a set of rules that adhere to its statistical properties [34]. We used three different decision tree (DT)-based methods in our study to evaluate the degree of matching for the data, which were J48 (an improved version of the DT learner which lowers the error rate), CART (which partitions the training data into subregions to create the output feature space), and LMT (a hybrid classifier of logistic model tree (LMT) model.

Artificial Neural Network (ANN)

To design the ANN, the inputs (spectra data) and the output, as well as the general ANN format, must be defined. In order to design a system for an ANN, an optimal choice needs to be made for the configuration parameters, which are the structure, the training algorithm, transfer functions, and the number of different layers and number of neurons. Learning algorithms often entail backpropagation with Jacobian and gradient partial derivatives, with supervised or self-supervised weight and bias updates [35]. Levenberg–Marquardt (LM) training algorithms have been examined to evaluate the strength of the network.
The size of neurons and hidden layers also affects the error rate for neural networks. Although increasing these components may enhance accuracy, it also can result in increased computational complexity and the possibility of overfitting. To obtain a trade-off between the performance and complexity of the system, a network with two hidden layers and 20 neurons was used in this study. The number of neurons in the layers was odd-odd or even-even. To prevent overfitting during the training, the dataset was divided into training, validation, and test sets. In addition, a 10-fold cross-validation method was used for more reliable model evaluation by splitting the data into subsets.

Support Vector Machine (SVM)

SVM is a nonparametric method that maps the features into a higher-dimensional space and creates a separable hyperplane based on the Gram matrix of the kernel functions [36]. In the current study, four computationally kernels were adopted: Radial Basis Function (RBF, Equation (4)), Polynomial (Equation (5)), Gaussian (Equation (6)), and Pearson Universal Kernel (Equation (7)).
f x y = e α x y 2
f x y = x y + 1 n x y + 1 n y 2 + 1 n
f x y = e x p x i x 2 2 σ 2
f x y = 1 1 + ( 2 x y 2 2 1 β 1 ) 2 β
where α is the kernel size, x and y are feature vectors, n stands for the polynomial order, and σ and β specify the gaussian functions.
In order to achieve a good performance of the Polynomial and Gaussian kernel functions, it is important to perform an appropriate regularization of the penalty factor (C). This also impacts the performance of SVM by testing how well the model fits the training data. Moreover, the regularization coefficient (γ) sets the extent to which the data are transformed into a higher-dimensional space by scaling the spread of the RBF and Pearson kernels. In this work, 5 levels of C (0.01, 0.1, 1, 10, and 100) and 3 levels of γ (0.01, 0.1, and 1) were used to find a suitable location of the hyperplanes. The model was then evaluated in an iterative manner until optimal results were obtained.
A summary of the data analysis is presented in Table 1. The table outlines the spectral preprocessing techniques and the corresponding models applied to predict quality parameters (SSC and firmness) and to classify ripening stages of kiwifruit. Detailed kernel types, model configurations, and training parameters are also reported where applicable.

Performance Analysis of the Classification Model

A comparison between the utilized models to select the best model for the developed system was applied. The criteria were the correlation coefficient (R), mean absolute error (MAE), and root mean squared error (RMSE), which were measured by the following equations:
R = 1 i = 1 n ( C i C i i ) 2 i = 1 n ( C i C m ) 2
MAE = 1 n i = 1 n C i C i i
RMSE = 1 n i = 1 n ( C i C i i ) 2
where Ci, Cii, Cm, and n were the discriminated Kiwi, predicted Kiwi, the mean value of the Kiwi samples, and the total number of samples, respectively. In addition, external cross-validation was used to assess the prediction performance of the models.

3. Results and Discussion

3.1. Firmness and SSC Prediction Results

3.1.1. Partial Least Squares Regression (PLSR) Model Accuracy

The results of the PLSR model under the different configurations analyzed, after the selection of relevant wavelengths and the removal of outliers, are summarized in Table 2, following a Monte Carlo simulation with 100 iterations.
The regression models developed for predicting firmness generally demonstrated good predictive performance in cross-validation (CV), with R2CV values ≥ 0.85. The best results in CV were obtained using the SG2 (R2CV = 0.880; RPDCV = 2.92) and MSC (R2CV = 0.872; RPDCV = 2.82) preprocessing methods. These were followed by the Raw and SNV models, which showed similar performances (R2CV = 0.856), with RPDCV values around 2.65. However, in external prediction, model performance decreased significantly, with R2P values ranging from 0.562 (SG1) to 0.749 (SNV). The SNV-PLS model achieved the best trade-off between accuracy and robustness (R2P = 0.749; RMSEP = 12.342; RPDP = 2.02), standing out for its stability across the tested configurations. In contrast, the SG1-PLS model yielded the poorest results (R2P = 0.562; RMSEP = 16.312; RPDP = 1.53).
Regarding the soluble solids content (SSC), the models showed greater consistency between CV and external prediction. During training, all models achieved R2CV > 0.96 and RPDCV > 5, with RMSECV values ranging from 0.744 to 0.803°Brix, indicating strong model fitting and reliable performance during cross-validation.
This trend was also confirmed in external prediction (P), where the models maintained excellent performance, with R2P > 0.91 and RPDP > 3, confirming their strong predictive reliability. Specifically, the Raw-PLS model achieved the best overall results (R2P = 0.935; RMSEP = 1.142; RPDP = 3.98), closely followed by the SG1-PLS model (R2P = 0.934; RMSEP = 1.151; RPDP = 3.95). These results indicate that SSC strongly correlates with spectral features, independently of the applied preprocessing method.
These results are clearly illustrated in Figure 1, which shows the predictive performance of the best PLS models for estimating firmness (SNV-PLS) and soluble solids content (SSC, Raw-PLS), after the selection of relevant wavelengths and removal of outliers, along with the relative trend of the RPD metric during the model optimization cycle. Compared to the firmness model, the SSC model shows greater consistency between cross-validation results and external prediction outcomes, suggesting a lower risk of overfitting. This behavior can be partly attributed to the narrower range of the SSC target variable (from 5.2 to 18°Brix) compared to firmness (from 2.36 to 92.26 N), as well as to variability related to the presence of different maturation stages at the sampling times used in this study. Specifically, two ripening classes (related to the pre-harvest and postharvest periods) appear to contribute to this variability, highlighting a marked difference in postharvest (D60) kiwifruits. The more diverse data distribution introduces complexity in establishing consistent predictive relationships, which may reduce the performance of external validation. In contrast, the distribution of SSC values across the three data acquisition periods (pre-harvest, harvest, and postharvest) is more uniform, resulting in better generalization and a lower risk of overfitting, together with a likely more linear spectral response to sugar content, as also highlighted by the RPD trend during wavelength selection.
As is known, firmness is under the influence of several quality-related attributes of the fruit. According to [22], the spectral information acquired at harvest may not accurately reflect the firmness that the fruit will exhibit after the storage period. As a result, obtaining reliable quantitative predictions is particularly challenging. Kiwi firmness is a physical property linked to the internal cellular structure, whose variability can affect both the spectral features and surface scattering. McGlone. (1998) [37] hypothesized that pectin modifications, mainly responsible for changes in firmness, are more difficult to detect compared to other more abundant constituents, such as total soluble solids (TSS). Furthermore, cell turgor, which significantly contributes to perceived firmness, depends on the fruit’s water content and the rate of water loss from the outer and inner pericarp tissues [38]. Finally, the intrinsic limitations of NIR, as pointed out by [22], clarify that near-infrared light penetrates only about 2 mm beneath the skin, whereas standard firmness measurements are based on penetration forces at approximately 8 mm depth 7.
The results obtained in this study confirm that the quantitative prediction of firmness (FF) is more complex than estimating the sugar content, as previously highlighted by [19,22]. A comparison with the literature shows that, in the case of firmness, the SNV-PLS model developed achieved moderate predictive performance (R2P = 0.749; RMSEP = 12.342 N), which is lower than the performance reported by [19], who achieved R2P = 0.78 and RMSEP = 11.96 N using Vis/NIR data, but superior to the study by [22], which reported R2P = 0.50 and RMSEP = 4.41 N, despite considering a narrower range of firmness. In comparison, Ciccoritti et al. (2019) [13] reported even higher performance, obtaining the best predictive model for firmness using raw spectra (R2P = 0.90, RMSEP = 28.8 N). Similarly, Benelli et al. (2022) [15] achieved significant predictive values, with R2P ranging between 0.82 (RMSE = 14.51 N) and 0.92 (RMSEP = 9.87 N).
Regarding the sugar content, the Raw-PLS model developed in the present work (R2P = 0.935; RMSEP = 1.142°Brix) showed results comparable to those obtained by [19], with R2P = 0.859 and RMSEP = 1.45°Brix, and superior to those reported by [21], whose models based on combinations of pretreatments (SG, SNV, MSC) and variable selection (SPA, CARS) achieved R2Pvalues between 0.22 and 0.69, with RMSEP between 1.07 and 1.81°Brix. An excellent performance was reported by [13], with SNV producing the best predictive model for SSC (R2P = 0.993, RMSEP = 0.40°Brix), while [15] obtained predictive R2 values ranging from 0.85 (RMSEP 1.10°Brix) to 0.94 (RMSEP = 0.73°Brix), confirming the generally higher accuracy observed for SSC prediction compared to firmness.
Moreover, portable NIR devices have shown promising results in predicting SSC and firmness in various fruits. SW-NIR spectroscopy (900–1650 nm), combined with Savitzky–Golay second-derivative preprocessing and SPA-PLS modeling, has been used to predict SSC in mango, achieving R2P = 0.78 and SEP = 0.67°Brix ([39]). Similarly, Yu & Yao. (2022) [40] applied a portable NIR spectrometer (900–1700 nm) to pears, obtaining excellent results using a Si-GA-PLS model, with R2P values of 0.9406 for SSC and 0.9119 for firmness. Compared to the present study, these findings emphasize the need to further optimize the predictive models. Nevertheless, an RPD value between 2 and 2.5 is considered a rough but acceptable prediction, while a value above 2.5 represents a good or excellent prediction [41]. Therefore, the model developed for SSC (RPDP = 3.98) can be considered reliable for practical applications, while the one for firmness (RPDP = 2.02) requires further optimization to enhance its predictive capacity.

3.1.2. Feature Extraction

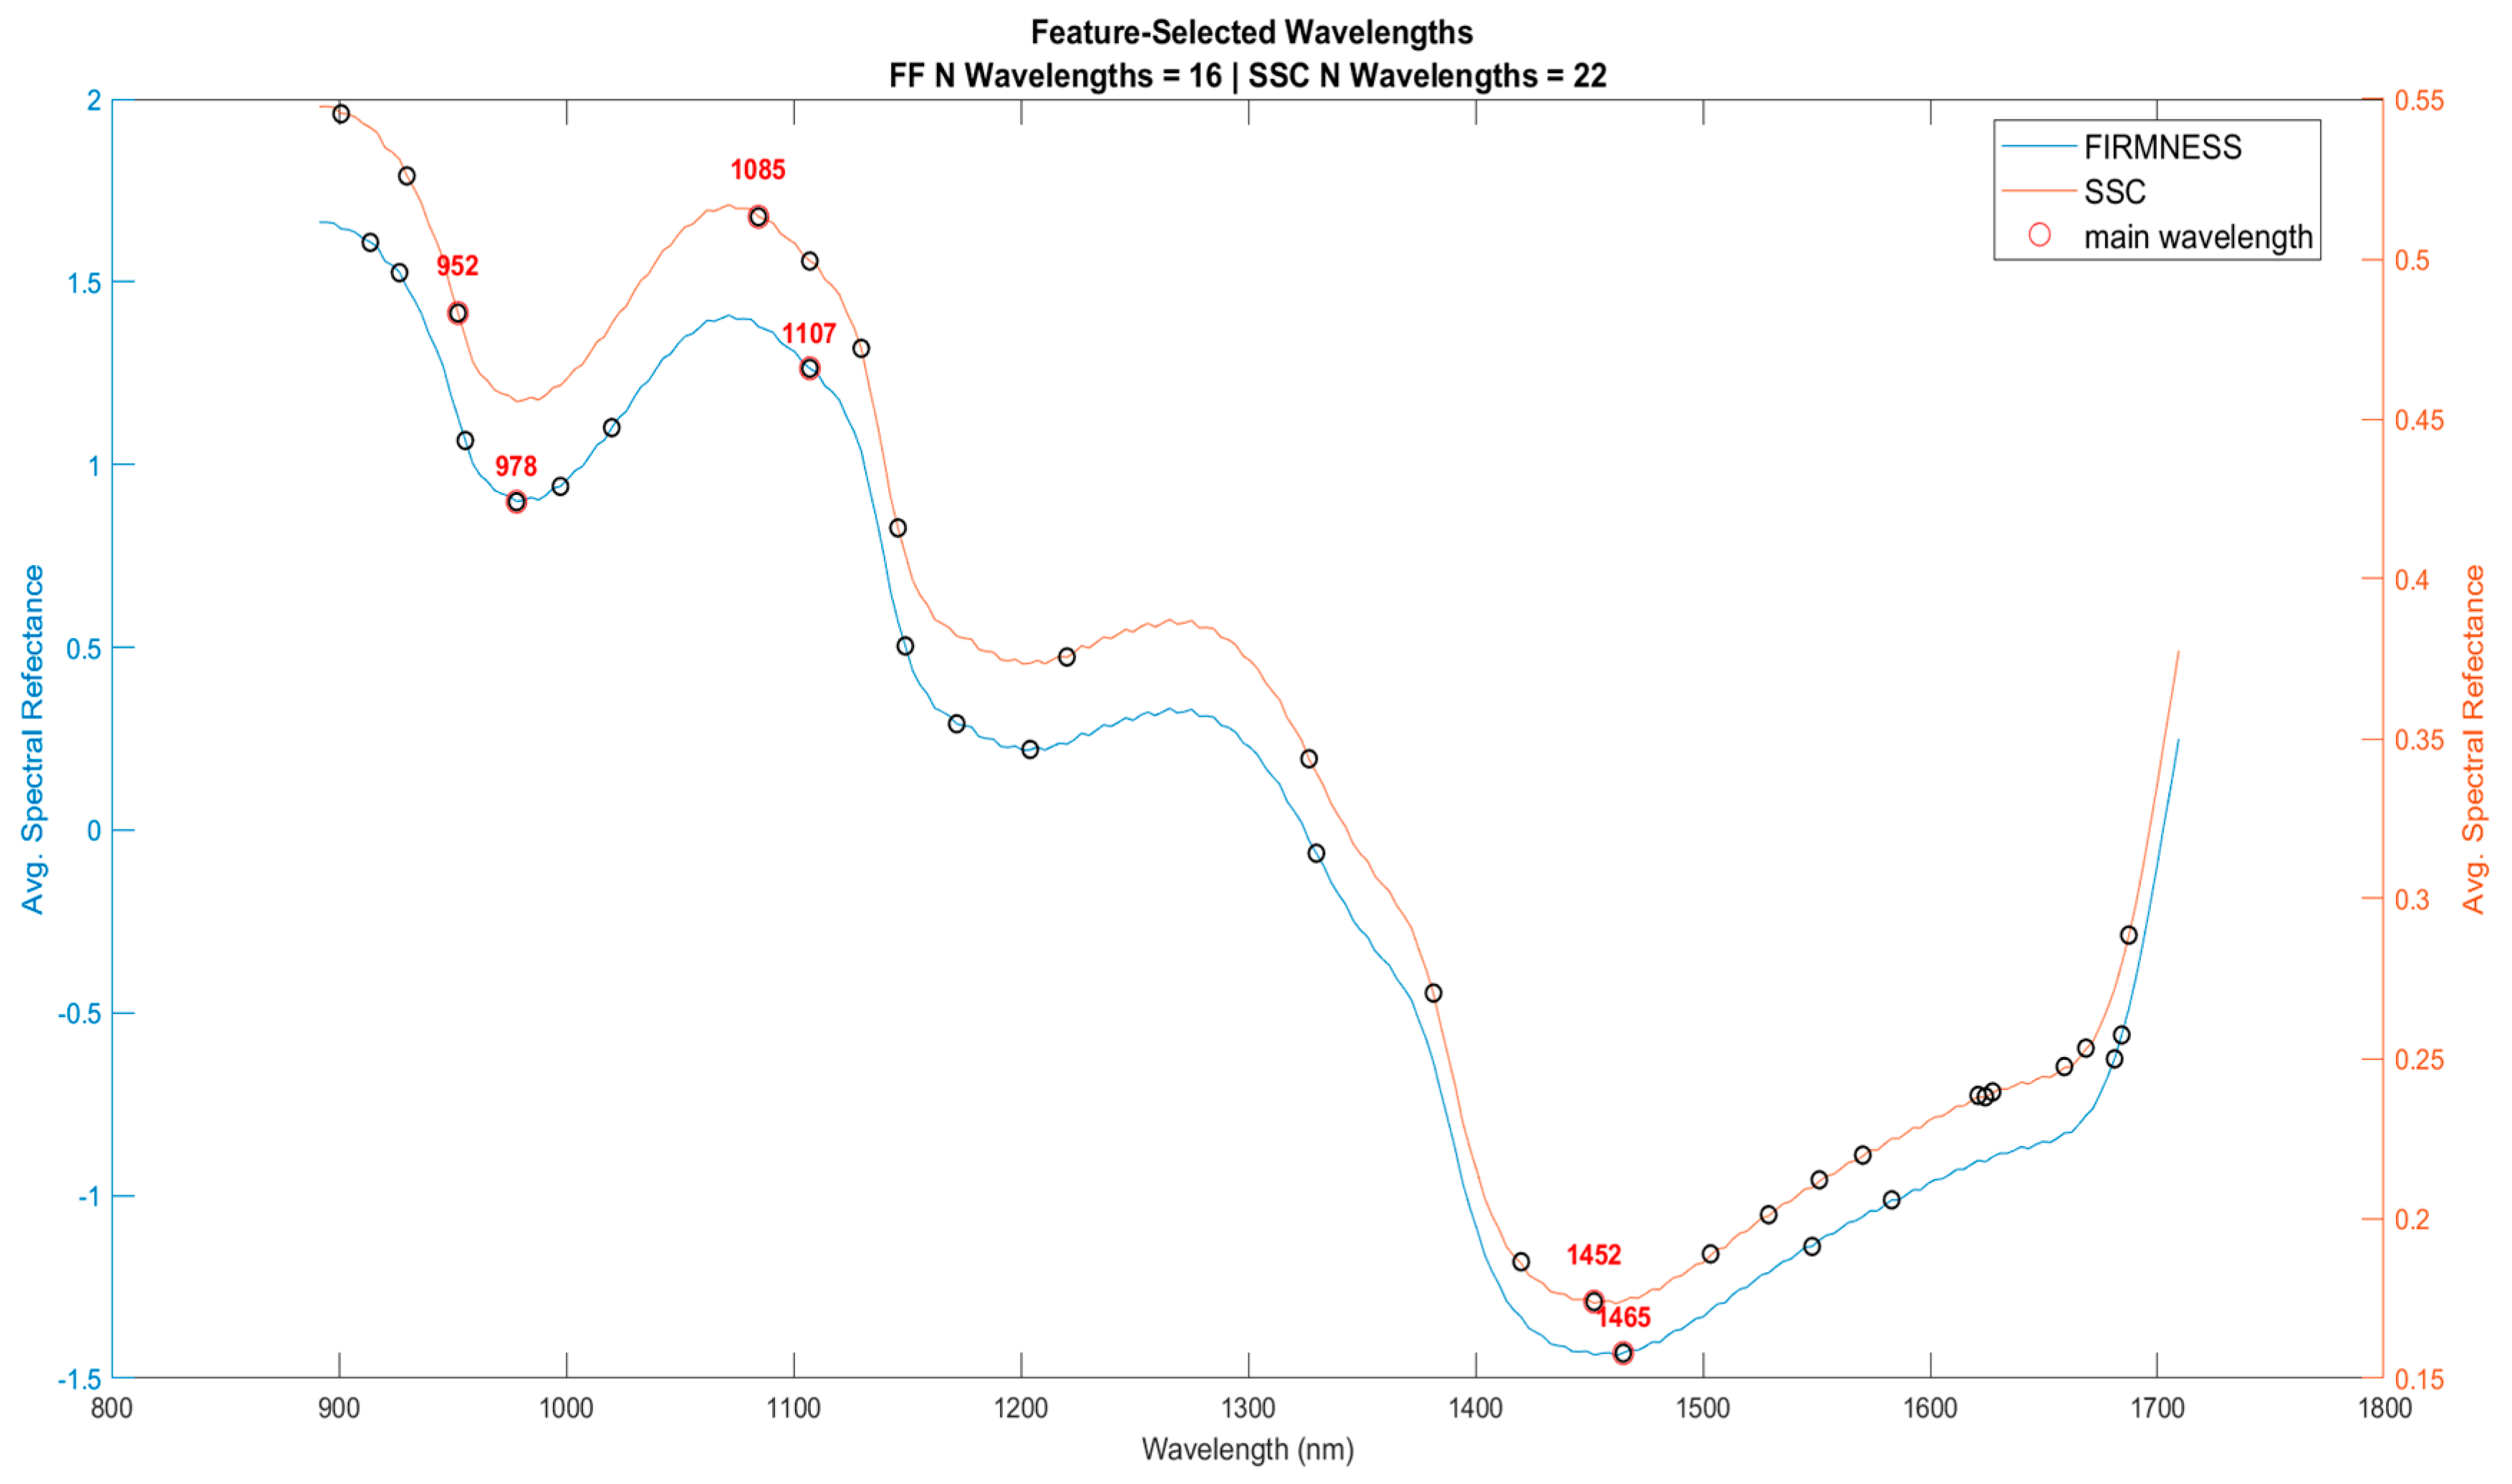
Figure 2 shows the trend of the average spectrum of the best models selected for predicting soluble solids content (SSC) and firmness (FF) in kiwifruits. The curves represent the normalized average reflectance of the considered spectra. The selected wavelengths used in the predictive models for SSC and firmness are summarized in Table 3. The main selected wavelengths (around 958, 978, 1085, 1107, 1452, and 1465 nm) are strongly consistent with those reported in the literature. Several authors have identified characteristic peaks in kiwi spectra around 974 nm, 1200 nm, 1460 nm, and 1780 nm, confirming their relevance to O-H and C-H bonds, associated with sugar content, water, and the cellular structure of kiwis [13,19,20,42].The first broad peak, centered around 974 nm, is attributed to the combined absorption of water and carbohydrates [37], while [43] identified the bands at 980.39 and 1470.59 nm as corresponding to the first and second overtone of the O-H bond in water, respectively. Additionally, the bands around 1197.60 nm and 1785.71 nm are related to the overtones of the CH group, suggesting a connection with sugars, cellulose, and cellular water [13].
Vis/NIR spectroscopy can be effectively used to determine the SSC content in kiwifruit [20]. However, one of the main concerns regarding the performance and robustness of NIR models for fruits and vegetables is the influence of the “richness” of variation within the calibration sample, a topic that has been widely discussed [41]. This concern is further highlighted by the performance observed in our firmness prediction.

3.2. Ripeness Classification Results

3.2.1. ML Models’ Accuracy

Table 4 presents the performance analysis of different ML models for the classification of the samples. LDA had a relatively good performance with R2: 0.48, RMSE: 0.46, MAE: 0.40. The smaller value of R2 with relatively higher error measures shows the poor capability of LDA in dealing with nonlinear separability between kiwifruit classes. Being a linear model, it assumes normally distributed features and equal covariance between classes, which may not be the case for this dataset. This is what causes the model to poorly classify samples, particularly when the class boundaries are not well-defined.
ANN model ranked as the best model with the best R2 of 0.95, the least RMSE of 0.08, and the minimum MAE of 0.03 among the other models. These findings demonstrate great model generalization and accurate detection of the right class of kiwifruit. The better performance of the network may be attributed to its capacity for modeling complex nonlinear relationships and learning from higher-dimensional data. The low value of error rates and high value of determination coefficient show that the ANN model does well with noise and overlapping features, which is the best model for this classification task.
We compared the results for three DT techniques: J48, CART, and LMT. The best performance was achieved by LMT with: R2: 0.50, RMSE: 0.45, and MAE: 0.38. J48 and CART produced a little lower R2 values (0.48) and slightly higher errors, especially in MAE (J48: 0.41, CART: 0.42). These results indicate that Decision Trees can model patterns in structured data; their performance might be inhibited based on learning style hyperparameters that either learns overly-simplified concepts (underfit) or have trouble generalizing the target function (overfit). Since LMT fuses logistic regression and the structure of tree-based learning, it is possible to have a better generalization and error rate than of the others.
With the SVM model, four kernel functions were compared. For kernels, the RBF function presented the superior performance with the highest R2 and the smallest RMSE and MAE. This demonstrates that the RBF network does well with nonlinear associations. Excise and Pearson, as well as Polynomial kernels, presented a slightly lower performance, which means they could not adapt themselves well to the complexity of the data. However, in general, SVM models provided a better trade-off between accuracy and error when compared to LDA and standard Decision Tree approaches.

3.2.2. Best ML Models’ Performance

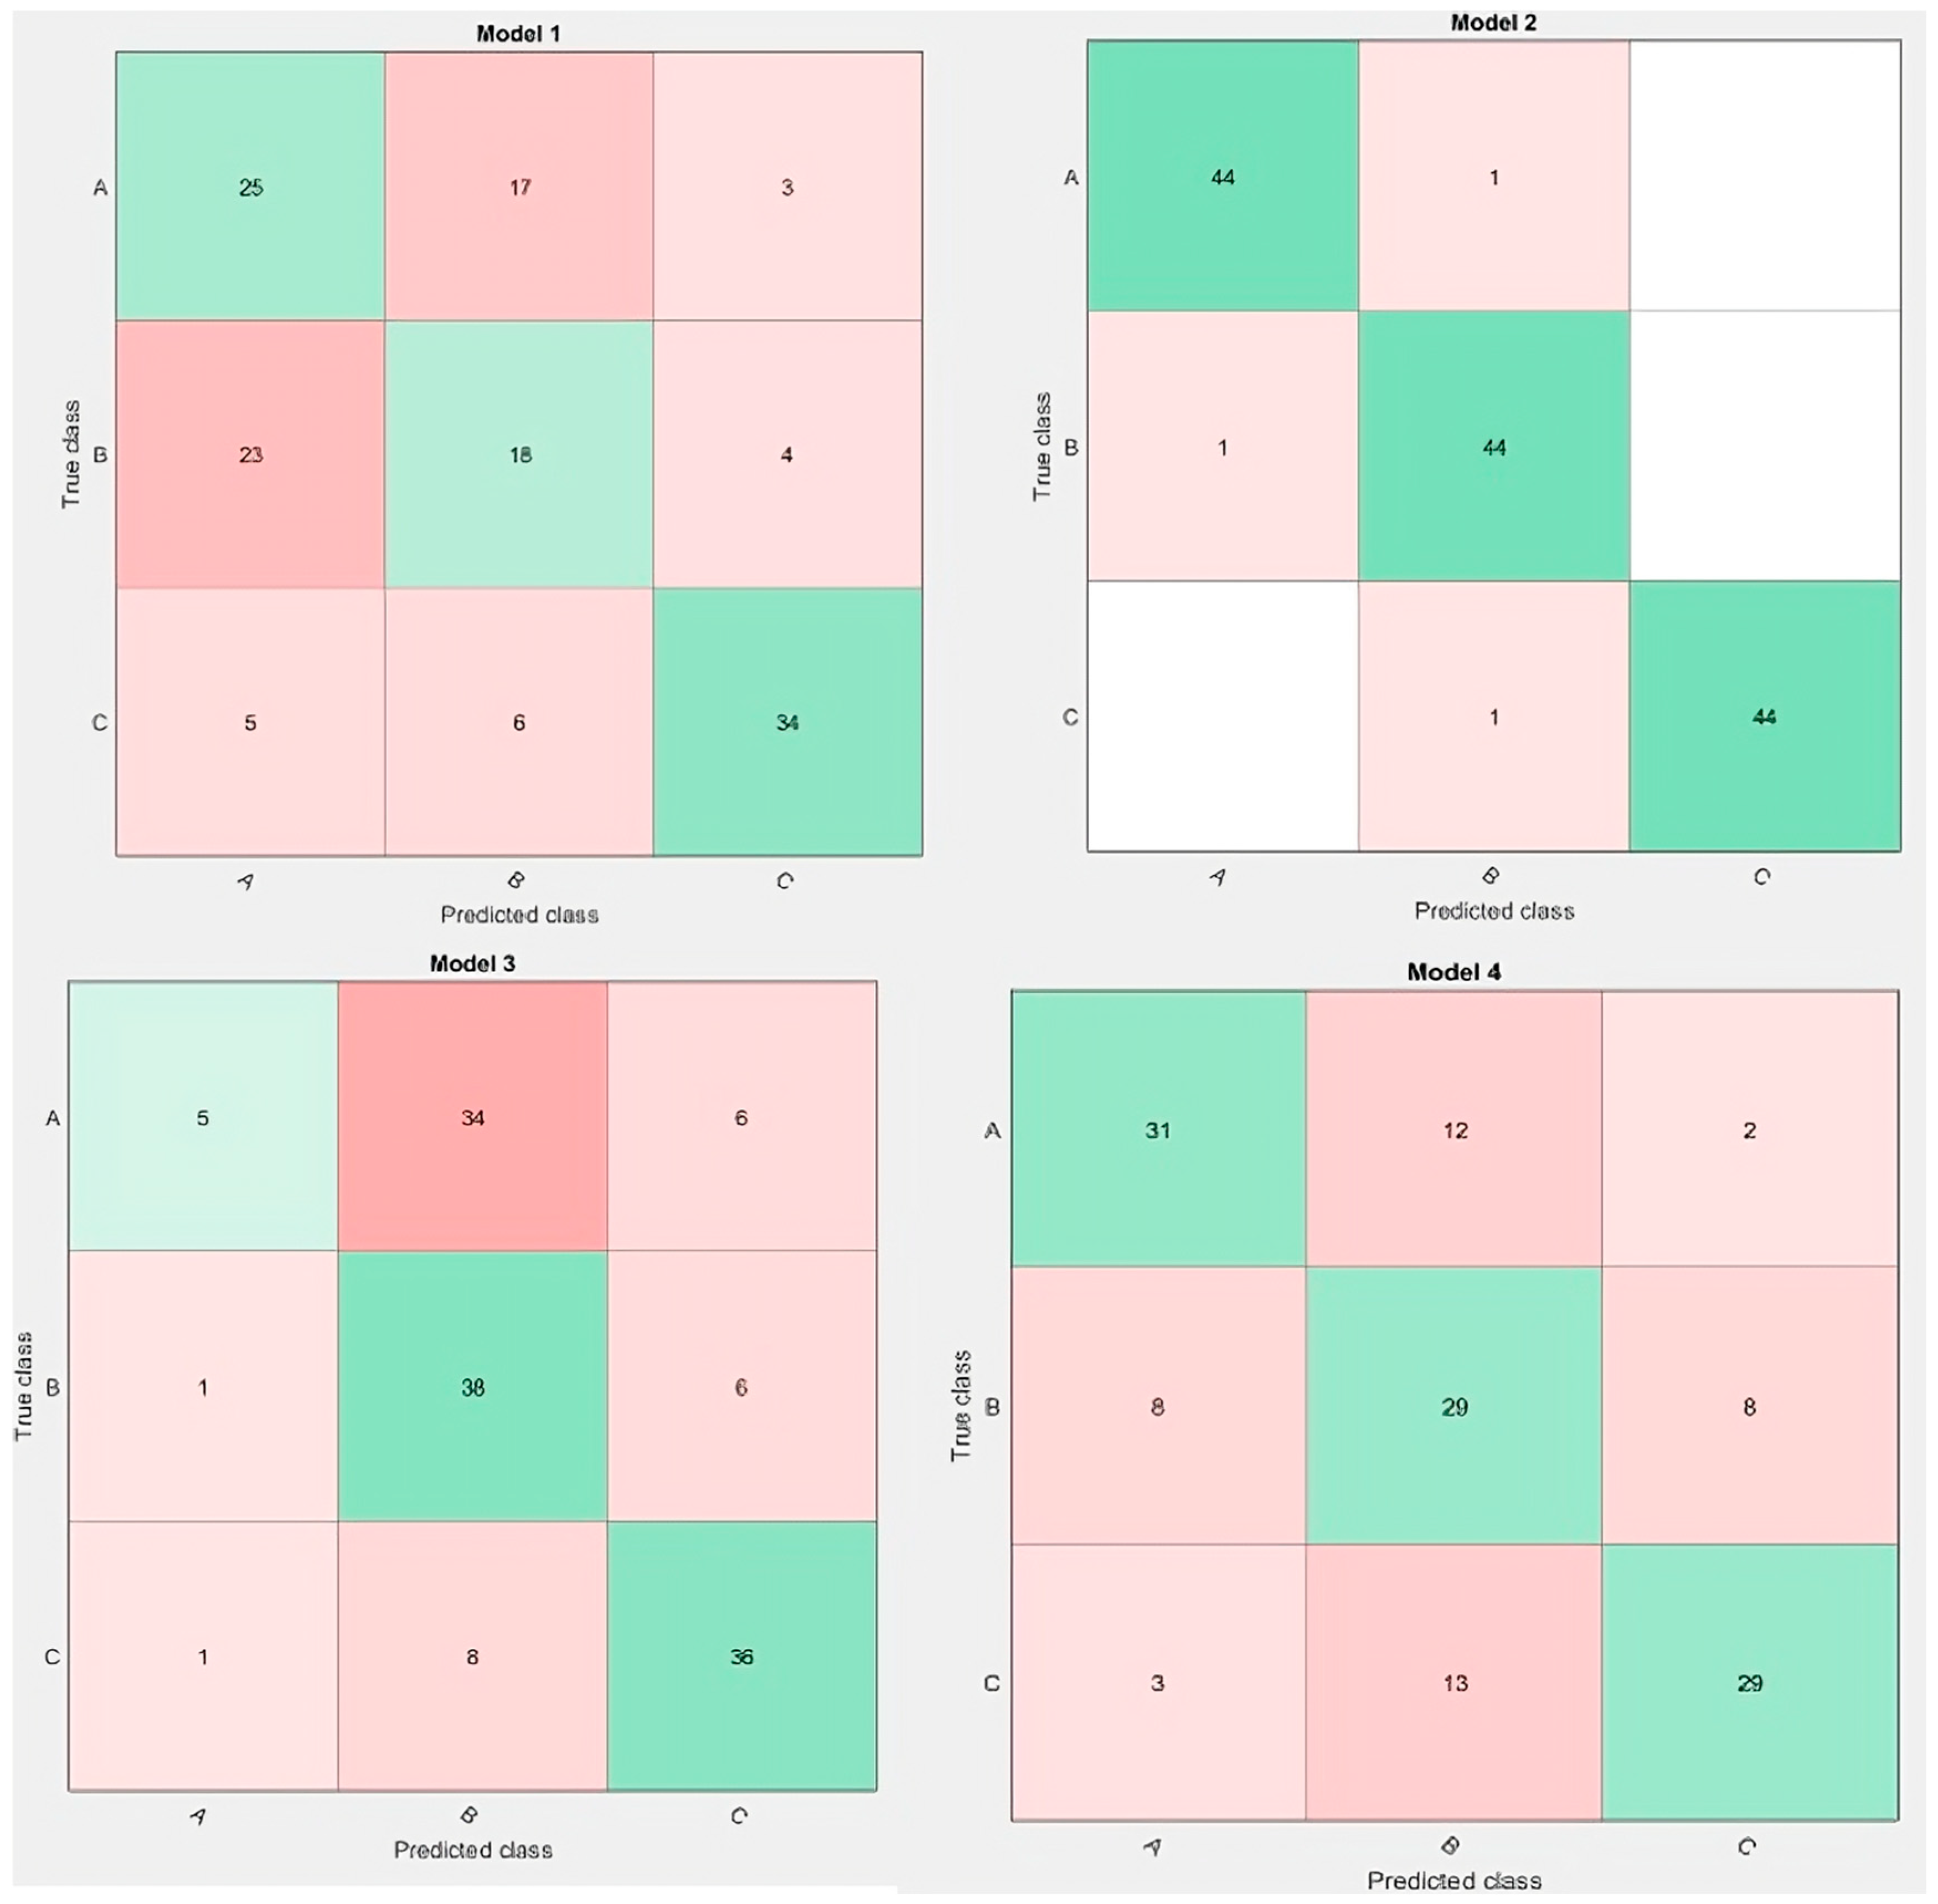
Figure 3 illustrates the confusion matrix for the classification of kiwifruits for each ML model. Classes A, B, and C correspond, respectively, to pre-harvest, harvest, and postharvest stages. The accuracy of DTs is moderate, and there were many wrong classifications between classes A and B, with only 25 out of 45 samples of class A and 18 out of 45 of class B being correctly classified, showing that the model performed poorly toward especially for these two classes. Class C presented worse results, but still, with only 34 correct predictions, the tree model seems able to at least distinguish one class better. The low-to-moderate R2 (0.50) value confirms the low explanatory power, and the relatively high RMSE (0.45) and MAE (0.38) values reflect inaccuracy in prediction, especially for classes A and B.
ANN clearly dominates the others, providing almost perfect classification with one misclassified data for each class. It was able to accurately predict 44 out of 45 cases in all classes, indicating the good generalization and pattern recognition ability for the classifier. This indicates that the ANN was able to learn the intricate relationships among the input features and the class label. The extremely high R2 (0.95) and low RMSE (0.08) and MAE (0.03) indicate a high accuracy and small error for the estimation, which is in agreement with the high classification accuracy found in the confusion matrix.
Like the DT, the LDA achieved a relatively poor performance, in particular with class A (only 5 correctly classified out of 45 samples). It is prone to classify class A as class B, which means that there are problems in dealing with nonlinearly separable data or overlapping feature distributions. The results of the LDA show a poor ability to discriminate, especially for classes A and B. The fact that the LDA is linear may lead to this loss of performance in a too complex nonlinear classification frontier. The SVM was fairly weak, yet offered a better class separation in comparison to the DTs and the LDA. It accurately predicted 31, 29, and 29 for classes A, B, and C, respectively, but there is still some confusion, particularly for class B, which was frequently misclassified as A or C, which suggests that the SVM was better but not entirely stable with regard to data overlap or kernel bound.
Recent studies have demonstrated the effectiveness of ML models in classifying fruit quality attributes. Worasawate & Chiangga. (2022) [44] developed four common machine learning (ML) classifiers, the k-mean, naïve Bayes, Support Vector Machine, and Feed-Forward Artificial Neural Network (FANN), all of which were aimed at classifying the ripeness stage of mangoes at harvest. Further, Sarakum & Sukpancharoen. (2025) [45] proposed a novel non-destructive approach for classifying the sweetness of Khao Tang Kwa pomelos by integrating machine learning (ML) techniques with acoustic signal and image processing. They used deep learning and vision-based features to classify, achieving an R2 of 0.93 and low error values. These findings closely align with our results, where the Artificial Neural Network (ANN) model yielded the best performance for kiwifruit classification (R2: 0.95, RMSE: 0.08, MAE: 0.03). The effectiveness of ANN in our study mirrors the superior performance of complex, nonlinear models highlighted in these works, reaffirming their capacity to handle subtle variations in fruit morphology and physicochemical properties

4. Conclusions

The study evaluated the application of a portable NIR spectrometer for the prediction of soluble solids content (SSC) and firmness (FF) in yellow-fleshed kiwifruit and for the classification of ripening stages.
The various preprocessing methods tested in the PLSR models for FF prediction showed good performance in cross-validation, with the best results achieved using the SG2 and MSC methods. However, in external prediction, the performance decreased, with the SNV-PLS model offering the best balance between accuracy and robustness (R2P = 0.73). For soluble solids content (SSC), the models maintained excellent performance in both cross-validation and external prediction, with the Raw-PLS model achieving the best overall results (R2P = 0.93). Additionally, by selecting a minimum number of spectral features, 16 and 22 wavelengths for FF and SSC, respectively, the results highlight the importance of these choices for the applicability of portable instruments, as they allow reliable estimates using a more compact spectral dataset, ideal for use in low-cost portable measurement devices.
Regarding the classification of ripening stage, the artificial neural network (ANN) model outperformed all other approaches evaluated, correctly classifying 97.8% of the samples in each class and showing excellent performance (R2 = 0.95, RMSE = 0.08, MAE = 0.03). These results confirm the ANN’s strong learning and generalization capabilities, thanks to its ability to model complex and nonlinear relationships and to handle high-dimensional data.
Therefore, the portable NIR spectrometer, in combination with chemometric and artificial intelligence techniques, proved to be a promising tool for the non-destructive assessment of kiwifruit quality and the discrimination of ripening stages. This approach facilitates the separation of fruits suitable for long-term storage from those better suited for immediate market distribution, ultimately improving supply chain efficiency and reducing postharvest losses.
However, analyzing the regression and classification components separately provides only a partial view of the decision-making potential associated with fruit quality. Integrating these two approaches paves the way for the development of a combined predictive system, in which the estimation of key quality parameters (such as Brix) feeds into a classification model capable of supporting more informed and automated operational decisions.

Author Contributions

Conceptualization, S.L., G.A. and M.R.; methodology, F.G., A.M., M.C. and A.N.M.; software, S.L. and M.R.; validation, S.L., M.R. and G.A.; formal analysis, S.L.; investigation, S.L.; resources, S.L.; data curation, S.L., A.M., A.N.M., M.C. and F.G.; writing—original draft preparation, S.L.; writing—review and editing, S.L., M.R. and G.A.; visualization, F.G., A.M., M.C. and A.N.M.; supervision, G.A.; project administration, G.A. and G.C.D.R.; funding acquisition, G.A. and G.C.D.R. All authors have read and agreed to the published version of the manuscript.

Funding

This study was carried out within the Agritech National Research Center and received funding from the European Union Next-GenerationEU (PIANO NAZIONALE DI RIPRESA E RESILIENZA (PNRR)—MISSIONE 4 COMPONENTE 2, INVESTIMENTO 1.4—D.D. 1032 17/06/2022, CN00000022). This manuscript reflects only the authors’ views and opinions; neither the European Union nor the European Commission can be considered responsible for them.

Institutional Review Board Statement

Not applicable.

Informed Consent Statement

Not applicable.

Data Availability Statement

Data are available upon suitable request to the corresponding author.

Acknowledgments

The authors are grateful to ITPhotonics S.r.l. Italia for making PolispecNIR available for this research and for the development of the method, and Ing. Fabrizio Renzi of Quantum Design S.r.l. for the technical support dedicated to this study.

Conflicts of Interest

The authors declare no conflicts of interest.

References

  1. Lee, J.-E.; Kim, M.-J.; Lee, B.-Y.; Hwan, L.J.; Yang, H.-E.; Kim, M.S.; Hwang, I.G.; Jeong, C.S.; Mo, C. Evaluating Ripeness in Post-Harvest Stored Kiwifruit Using VIS-NIR Hyperspectral Imaging. Postharvest Biol. Technol. 2025, 225, 113496. [Google Scholar] [CrossRef]
  2. Prasad, K.; Jacob, S.; Siddiqui, M.W. Fruit Maturity, Harvesting, and Quality Standards. In Preharvest Modulation of Postharvest Fruit and Vegetable Quality; Academic Press: Cambridge, MA, USA, 2018; pp. 41–69. [Google Scholar] [CrossRef]
  3. Gupta, A.K.; Koch, P.; Yumnam, M.; Medhi, M.; Madufor, N.J.; Opara, U.L.; Mishra, P. Biosensors Involved in Fruit and Vegetable Processing Industries. In Biosensors in Food Safety and Quality; CRC Press: Boca Raton, FL, USA, 2022; pp. 111–134. [Google Scholar]
  4. Li, M.; Pullanagari, R.; Yule, I.; East, A. Segregation of ‘Hayward’ Kiwifruit for Storage Potential Using Vis-NIR Spectroscopy. Postharvest Biol. Technol. 2022, 189, 111893. [Google Scholar] [CrossRef]
  5. Pandiselvam, R.; Prithviraj, V.; Manikantan, M.R.; Kothakota, A.; Rusu, A.V.; Trif, M.; Mousavi Khaneghah, A. Recent Advancements in NIR Spectroscopy for Assessing the Quality and Safety of Horticultural Products: A Comprehensive Review. Front. Nutr. 2022, 9, 973457. [Google Scholar] [CrossRef]
  6. Birth, G.; Norris, K. Instrument Using Light Transmittance for Nondestructive Measurement of Fruit Maturity. Food Technol. 1958, 12, 592–595. [Google Scholar]
  7. Li, B.; Lecourt, J.; Bishop, G. Advances in Non-Destructive Early Assessment of Fruit Ripeness towards Defining Optimal Time of Harvest and Yield Prediction—A Review. Plants 2018, 7, 3. [Google Scholar] [CrossRef]
  8. Hu, R.; Zhang, L.; Yu, Z.; Zhai, Z.; Technology, R. Optimization of Soluble Solids Content Prediction Models in ‘Hami’melons by Means of Vis-NIR Spectroscopy and Chemometric Tools. Infrared Phys. Technol. 2019, 102, 102999. [Google Scholar] [CrossRef]
  9. Amoriello, T.; Ciorba, R.; Ruggiero, G.; Masciola, F.; Scutaru, D.; Ciccoritti, R. Vis/NIR Spectroscopy and Vis/NIR Hyperspectral Imaging for Non-Destructive Monitoring of Apricot Fruit Internal Quality with Machine Learning. Foods 2025, 14, 196. [Google Scholar] [CrossRef]
  10. Xia, Y.; Huang, W.; Fan, S.; Li, J.; Technology, L. Effect of Spectral Measurement Orientation on Online Prediction of Soluble Solids Content of Apple Using Vis/NIR Diffuse Reflectance. Infrared Phys. Technol. 2019, 97, 467–477. [Google Scholar] [CrossRef]
  11. Xiao, Y.; Li, C.; Jin, C.; Luo, J.; Qi, H.; Zhang, C. Detection of Soluble Solid Content in Citrus Fruit Using Near-Infrared Spectroscopy with Machine Learning Regression: An Exploration of the Influence of Sampling Positions. J. Food Compos. Anal. 2025, 142, 107554. [Google Scholar] [CrossRef]
  12. Qiao, Y.; Wang, C.; Zhu, W.; Sun, L.; Bai, J.; Zhou, R.; Zhu, Z.; Cai, J. Online Assessment of Soluble Solids Content in Strawberries Using a Developed Vis/NIR Spectroscopy System with a Hanging Grasper. Food Chem. 2025, 478, 143671. [Google Scholar] [CrossRef]
  13. Ciccoritti, R.; Paliotta, M.; Amoriello, T.; Carbone, K. FT-NIR Spectroscopy and Multivariate Classification Strategies for the Postharvest Quality of Green-Fleshed Kiwifruit Varieties. Sci. Hortic. 2019, 257, 108622. [Google Scholar] [CrossRef]
  14. Walsh, K.B.; McGlone, V.A.; Han, D.H. The Uses of near Infra-Red Spectroscopy in Postharvest Decision Support: A Review. Postharvest Biol. Technol. 2020, 163, 111139. [Google Scholar] [CrossRef]
  15. Benelli, A.; Cevoli, C.; Fabbri, A.; Ragni, L. Ripeness Evaluation of Kiwifruit by Hyperspectral Imaging. Biosyst. Eng. 2022, 223, 42–52. [Google Scholar] [CrossRef]
  16. Fatchurrahman, D.; Nosrati, M.; Amodio, M.L.; Chaudhry, M.M.A.; de Chiara, M.L.V.; Mastrandrea, L.; Colelli, G. Comparison Performance of Visible-NIR and Near-Infrared Hyperspectral Imaging for Prediction of Nutritional Quality of Goji Berry (Lycium barbarum L.). Foods 2021, 10, 1676. [Google Scholar] [CrossRef]
  17. Walsh, K.B.; Blasco, J.; Zude-Sasse, M.; Sun, X. Visible-NIR ‘point’spectroscopy in Postharvest Fruit and Vegetable Assessment: The Science behind Three Decades of Commercial Use. Postharvest Biol. Technol. 2020, 168, 111246. [Google Scholar] [CrossRef]
  18. Afonso, A.M.; Antunes, M.D.; Cruz, S.; Cavaco, A.M.; Guerra, R. Non-Destructive Follow-up of ‘Jintao’ Kiwifruit Ripening through VIS-NIR Spectroscopy—Individual vs. Average Calibration Model’s Predictions. Postharvest Biol. Technol. 2022, 188, 111895. [Google Scholar] [CrossRef]
  19. Cevoli, C.; Iaccheri, E.; Fabbri, A.; Ragni, L. Data Fusion of FT-NIR Spectroscopy and Vis/NIR Hyperspectral Imaging to Predict Quality Parameters of Yellow Flesh “Jintao” Kiwifruit. Biosyst. Eng. 2024, 237, 157–169. [Google Scholar] [CrossRef]
  20. Xia, Y.; Zhang, W.; Che, T.; Hu, J.; Cao, S.; Liu, W.; Kang, J.; Tang, W.; Li, H. Comparison of Diffuse Reflectance and Diffuse Transmittance Vis/NIR Spectroscopy for Assessing Soluble Solids Content in Kiwifruit Coupled with Chemometrics. Appl. Sci. 2024, 14, 10001. [Google Scholar] [CrossRef]
  21. Wan, C.; Yue, R.; Li, Z.; Fan, K.; Chen, X.; Li, F. Prediction of Kiwifruit Sweetness with Vis/NIR Spectroscopy Based on Scatter Correction and Feature Selection Techniques. Appl. Sci. 2024, 14, 4145. [Google Scholar] [CrossRef]
  22. Li, M.; Pullanagari, R.R.; Pranamornkith, T.; Yule, I.J.; East, A.R. Quantitative Prediction of Post Storage ‘Hayward’ Kiwifruit Attributes Using at Harvest Vis-NIR Spectroscopy. J. Food Eng. 2017, 202, 46–55. [Google Scholar] [CrossRef]
  23. Torkashvand, A.M.; Ahmadi, A.; Nikravesh, N.L. Prediction of Kiwifruit Firmness Using Fruit Mineral Nutrient Concentration by Artificial Neural Network (ANN) and Multiple Linear Regressions (MLR). J. Integr. Agric. 2017, 16, 1634–1644. [Google Scholar] [CrossRef]
  24. Xiao, Y.; Yuan, D.; Zou, Z.; Li, M.; Wang, Q.; Zhen, J.; Wang, H.; Ku, Q.; Jiang, J.; Xu, L. The Prediction of Kiwi Quality Attributes Based on Multi-Source Data Fusion Comprehensive Analysis Model Using HSI and FHSI. J. Food Compos. Anal. 2025, 144, 107645. [Google Scholar] [CrossRef]
  25. Shang, J.; Tan, T.; Feng, S.; Li, Q.; Huang, R.; Meng, Q. Quality Attributes Prediction and Maturity Discrimination of Kiwifruits by Hyperspectral Imaging and Chemometric Algorithms. J. Food Process Eng. 2023, 46, e14348. [Google Scholar] [CrossRef]
  26. Qin, L.; Zhang, J.; Stevan, S.; Xing, S.; Zhang, X. Intelligent Flexible Manipulator System Based on Flexible Tactile Sensing (IFMSFTS) for Kiwifruit Ripeness Classification. J. Sci. Food Agric. 2024, 104, 273–285. [Google Scholar] [CrossRef]
  27. Hu, W.; Sun, D.-W.; Blasco, J. Rapid Monitoring 1-MCP-Induced Modulation of Sugars Accumulation in Ripening ‘Hayward’ Kiwifruit by Vis/NIR Hyperspectral Imaging. Postharvest Biol. Technol. 2017, 125, 168–180. [Google Scholar] [CrossRef]
  28. Sarkar, S.; Basak, J.K.; Moon, B.E.; Kim, H.T. A Comparative Study of PLSR and SVM-R with Various Preprocessing Techniques for the Quantitative Determination of Soluble Solids Content of Hardy Kiwi Fruit by a Portable Vis/NIR Spectrometer. Foods 2020, 9, 1078. [Google Scholar] [CrossRef] [PubMed]
  29. Geladi, P.; MacDougall, D.; Martens, H. Linearization and Scatter-Correction for near-Infrared Reflectance Spectra of Meat. Appl. Spectrosc. 1985, 39, 491–500. [Google Scholar] [CrossRef]
  30. Candolfi, A.; De Maesschalck, R.; Jouan-Rimbaud, D.; Hailey, P.A.; Massart, D.L. The Influence of Data Pre-Processing in the Pattern Recognition of Excipients near-Infrared Spectra. J. Pharm. Biomed. Anal. 1999, 21, 115–132. [Google Scholar] [CrossRef]
  31. Steinier, J.; Termonia, Y.; Deltour, J. Smoothing and Differentiation of Data by Simplified Least Square Procedure. Anal. Chem. 1972, 44, 1906–1909. [Google Scholar] [CrossRef]
  32. Altieri, G.; Genovese, F.; Tauriello, A.; Di Renzo, G.C. Models to Improve the Non-Destructive Analysis of Persimmon Fruit Properties by VIS/NIR Spectrometry. J. Sci. Food Agric. 2017, 97, 5302–5310. [Google Scholar] [CrossRef]
  33. Ghazal, S.; Qureshi, W.S.; Khan, U.S.; Iqbal, J.; Rashid, N.; Tiwana, M.I. Analysis of Visual Features and Classifiers for Fruit Classification Problem. Comput. Electron. Agric. 2021, 187, 106267. [Google Scholar] [CrossRef]
  34. Houetohossou, S.C.A.; Houndji, V.R.; Hounmenou, C.G.; Sikirou, R.; Kakaï, R.L.G. Deep Learning Methods for Biotic and Abiotic Stresses Detection and Classification in Fruits and Vegetables: State of the Art and Perspectives. Artif. Intell. Agric. 2023, 9, 46–60. [Google Scholar] [CrossRef]
  35. Gill, H.S.; Murugesan, G.; Mehbodniya, A.; Sekhar Sajja, G.; Gupta, G.; Bhatt, A. Fruit Type Classification Using Deep Learning and Feature Fusion. Comput. Electron. Agric. 2023, 211, 107990. [Google Scholar] [CrossRef]
  36. Cheepsomsong, T.; Phuangsombut, A.; Phuangsombut, K.; Sangwanangkul, P.; Siriphanich, J.; Terdwongworakul, A. Evaluation of Durian Maturity Using Short-Range, Coded-Light, Three-Dimensional Scanner with Machine Learning. Postharvest Biol. Technol. 2025, 222, 113342. [Google Scholar] [CrossRef]
  37. McGlone, V.; Technology, S. Firmness, Dry-Matter and Soluble-Solids Assessment of Postharvest Kiwifruit by NIR Spectroscopy. Postharvest Biol. Technol. 1998, 13, 131–141. [Google Scholar] [CrossRef]
  38. Li, H.; Pidakala, P.; Billing, D.; Technology, J. Kiwifruit Firmness: Measurement by Penetrometer and Non-Destructive Devices. Postharvest Biol. Technol. 2016, 120, 127–137. [Google Scholar] [CrossRef]
  39. Khatun, M.S.; Al Masum, A.; Islam, M.H.; Ashik-E-Rabbani, M.; Rahman, A. Short Wave-near Infrared Spectroscopy for Predicting Soluble Solid Content in Intact Mango with Variable Selection Algorithms and Chemometric Model. J. Food Compos. Anal. 2024, 136, 106745. [Google Scholar] [CrossRef]
  40. Yu, Y.; Yao, M. A Portable NIR System for Nondestructive Assessment of SSC and Firmness of Nanguo Pears. LWT 2022, 167, 113809. [Google Scholar] [CrossRef]
  41. Nicolaï, B.M.; Beullens, K.; Bobelyn, E.; Peirs, A.; Saeys, W.; Theron, K.I.; Lammertyn, J. Nondestructive Measurement of Fruit and Vegetable Quality by Means of NIR Spectroscopy: A Review. Postharvest Biol. Technol. 2007, 46, 99–118. [Google Scholar] [CrossRef]
  42. Zhu, H.; Chu, B.; Fan, Y.; Tao, X.; Yin, W.; He, Y. Hyperspectral Imaging for Predicting the Internal Quality of Kiwifruits Based on Variable Selection Algorithms and Chemometric Models. Sci. Rep. 2017, 7, 7845. [Google Scholar] [CrossRef]
  43. Fu, X.; Ying, Y.; Lu, H.; Xu, H.; Yu, H. FT-NIR Diffuse Reflectance Spectroscopy for Kiwifruit Firmness Detection. Sens. Instrum. Food Qual. Saf. 2007, 1, 29–35. [Google Scholar] [CrossRef]
  44. Worasawate, D.; Sakunasinha, P.; Chiangga, S. Automatic Classification of the Ripeness Stage of Mango Fruit Using a Machine Learning Approach. AgriEngineering 2022, 4, 32–47. [Google Scholar] [CrossRef]
  45. Sarakum, T.; Sukpancharoen, S. Non-Destructive Sweetness Classification of Khao Tang Kwa Pomelos Using Machine Learning with Acoustic and Image Processing. J. Food Compos. Anal. 2025, 142, 107385. [Google Scholar] [CrossRef]
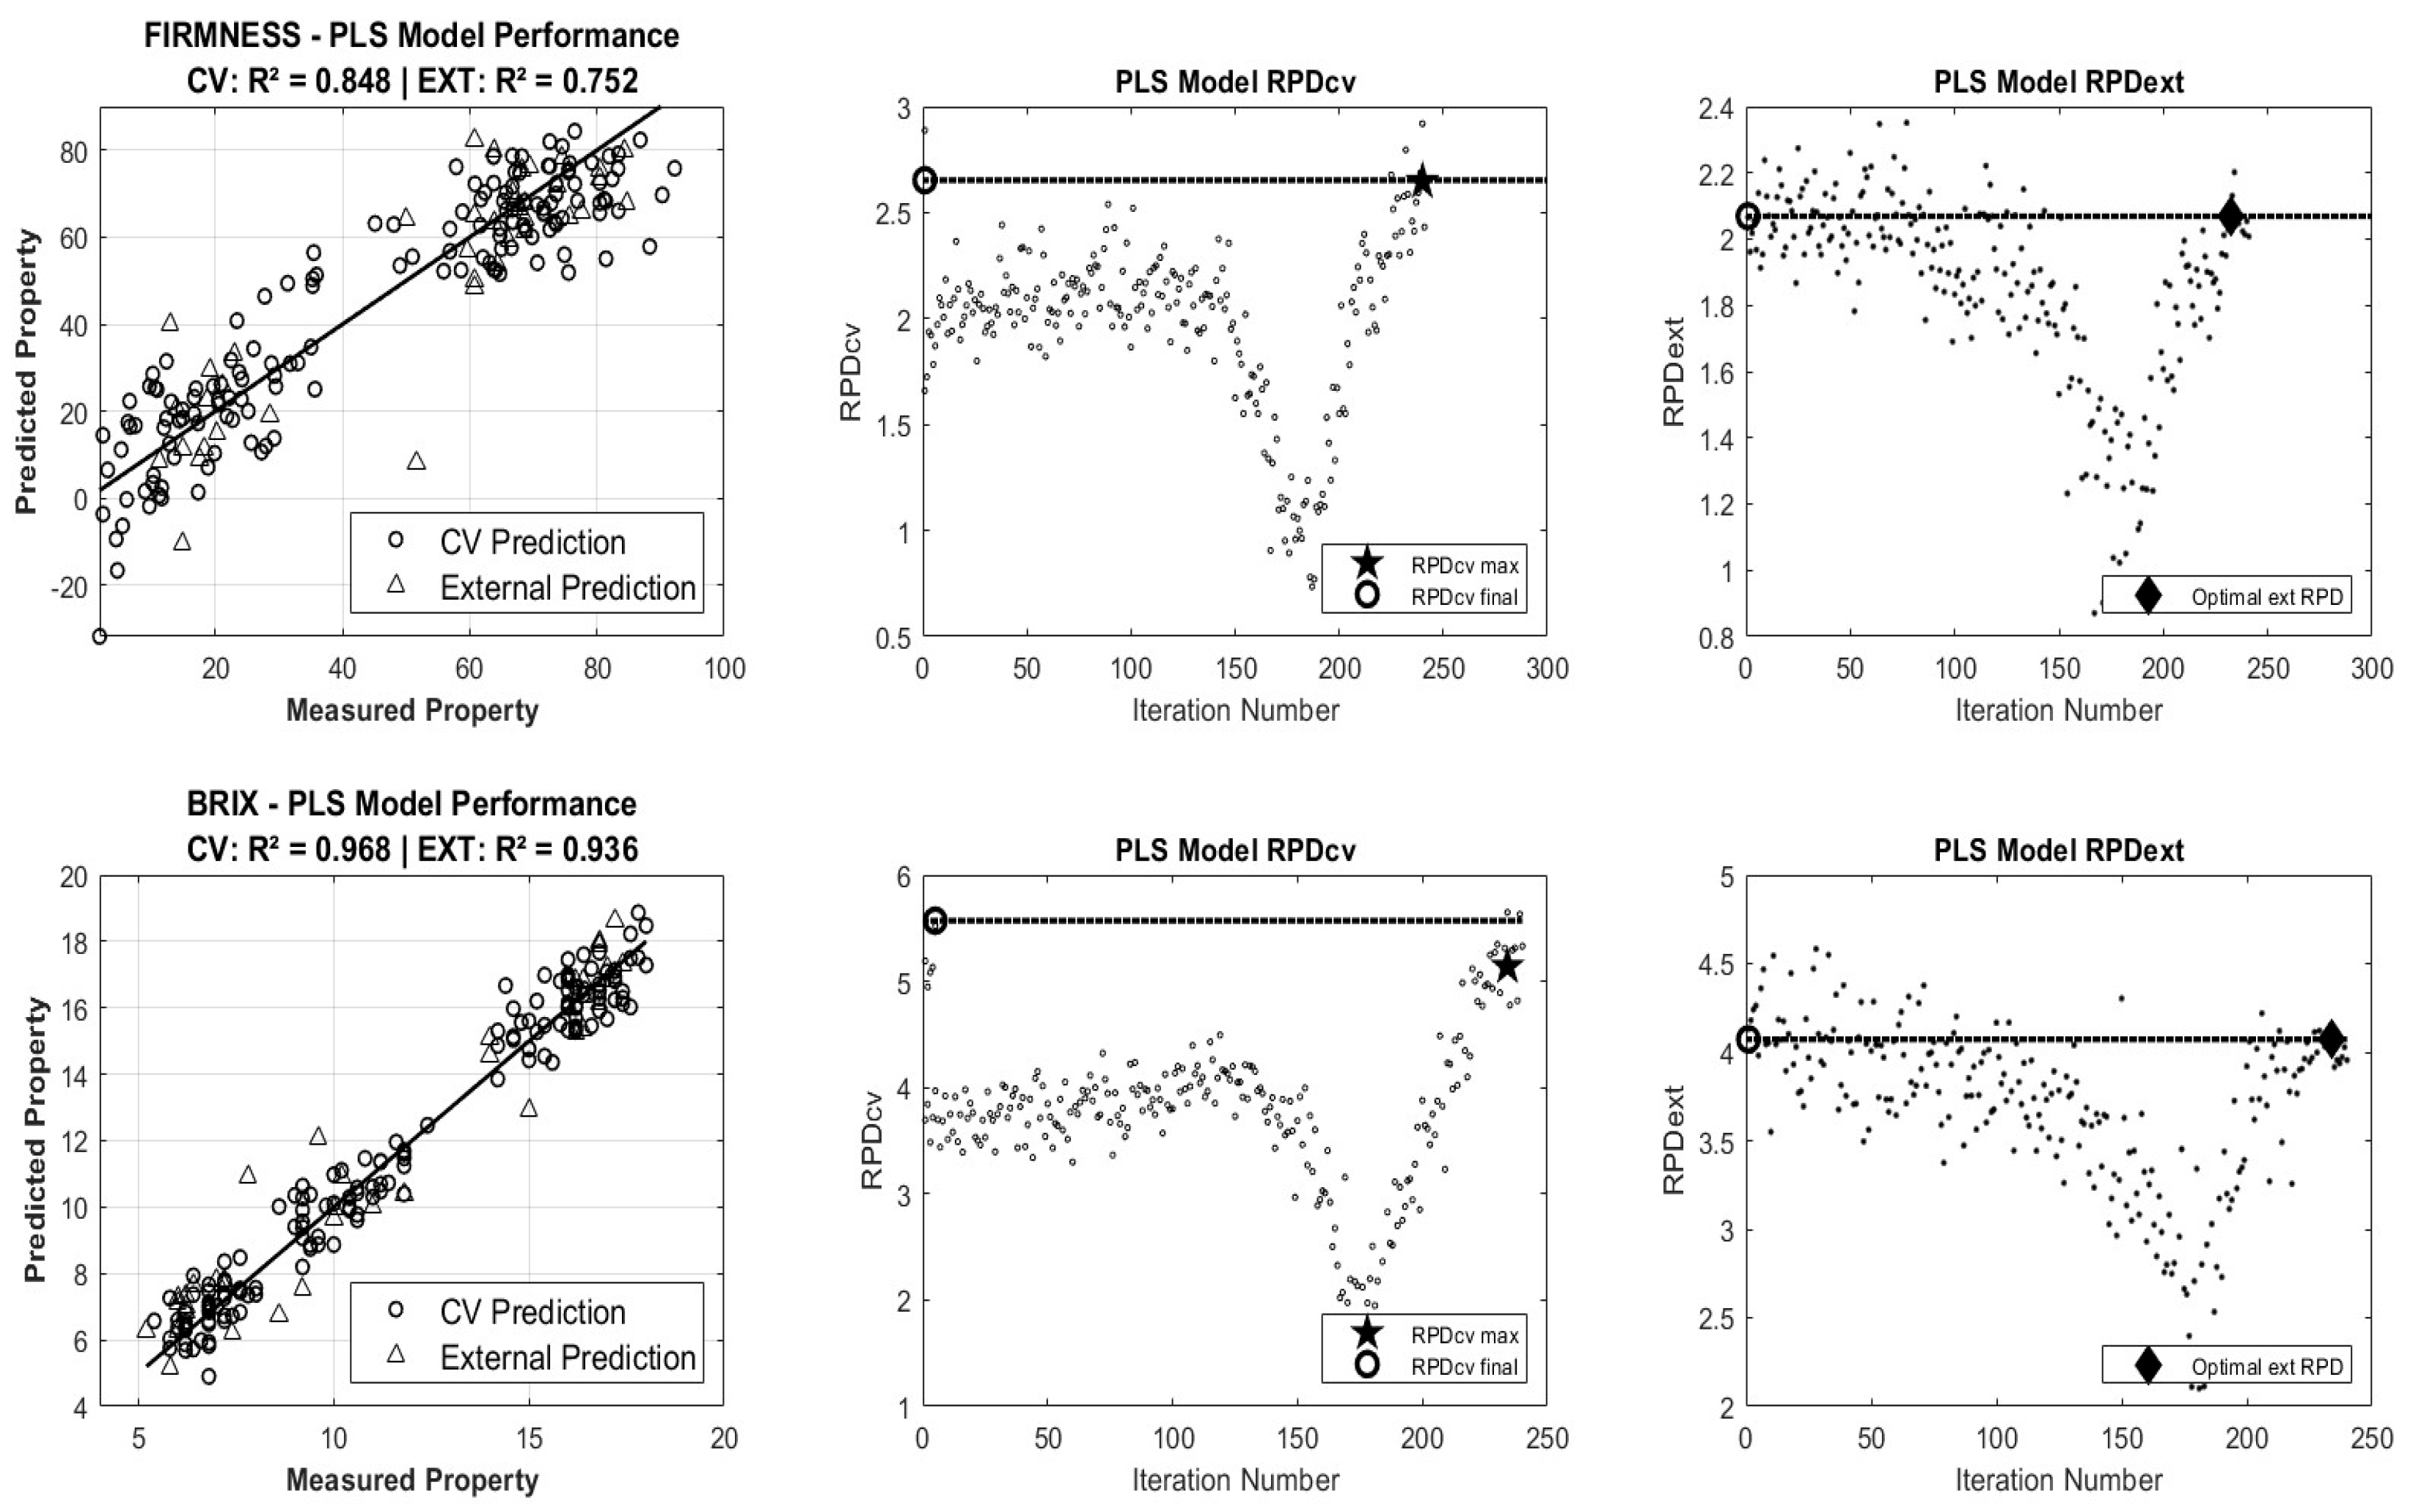
Figure 1. Performance of the selected PLSR models for firmness (SNV-PLS) and soluble solids content (RAW-PLS) in relation to cross-validation (CV) and external validation (EXT), after wavelength selection and outlier removal, along with the trend of RPD values in cross-validation (RPDcv) and external validation (RPDext) during the iterative optimization cycle of the models. The star point (★) on the RPDcv curve and the diamond (♦) on the RPDext curve represent the maximum RPD value reached by the model, selected as the best compromise between cross-validation accuracy and prediction. The circle on the Y-axis represents the corresponding value of the optimized model after 100 Monte Carlo runs.
Applsci 15 06233 g001
Figure 2. Normalized mean spectrum of the wavelengths selected for the prediction of firmness (16 WL) and SSC (22 WL), highlighting representative peaks (within ±0.1% of the interpolated spectral peak positions) and shared wavelengths.
Applsci 15 06233 g002
Figure 3. Confusion matrices of machine learning models used for classifying three classes of kiwifruit (A, B, and C): model 1 (decision tree), model 2 (artificial neural network), model 3 (linear discriminant analysis), and model 4 (support vector machine). Classification results are shown as a color map, ranging from correct classifications in green to incorrect classifications in red.
Applsci 15 06233 g003
Table 1. Summary of preprocessing methods and machine learning models used for prediction and classification tasks.
ModelsAbbreviation/Details
Prediction taskPartial Least Squares Regression (PLSR)Raw-PLS
Standard Normal Variate + PLSRSNV-PLS
Multiplicative Scatter Correction + PLSRMSC-PLS
Savitzky–Golay 1st derivative + PLSRSG1-PLS
Savitzky–Golay 2nd derivative + PLSRSG2-PLS
Classification taskLinear Discriminant Analysis (LDA)
Decision Trees (DT)
  • J48—Based on C4.5 algorithm
  • CART—Classification and Regression Trees
  • LMT—Logistic Model Tree
Artificial Neural Network (ANN)2 hidden layers, 20 neurons per layer; odd-odd or even-even configuration; Levenberg–Marquardt training.
Support Vector Machine (SVM)Kernels = Radial Basis Function (RBF), Polynomial, Gaussian, Pearson Universal;
Regularization parameters: C = {0.01, 0.1, 1, 10, 100}, γ = {0.01, 0.1, 1}
Table 2. PLSR model performance in cross-validation and external prediction over 100 Monte Carlo runs. The values of the coefficient of determination (R2), root mean square error (RMSE), and residual predictive deviation (RPD) are reported both for cross-validation (CV) and external prediction (P).
ParameterModelR2CVRMSECVRPDCVOutliersN° SamplesSelected WavelengthR2PRMSEPRPDP
FirmnessRaw-PLS0.856 (0.021)10.451 (0.752)2.66 (0.18)8152300.728 (0.023)12.854 (0.533)1.95 (0.08)
SNV-PLS0.856 (0.014)10.501 (0.524)2.65 (0.13)8152160.749 (0.011)12.342 (0.274)2.02 (0.05)
MSC-PLS0.872 (0.016)9.795 (0.596)2.82 (0.17)8152220.662 (0.013)14.336 (0.276)1.74 (0.03)
SG1-PLS0.853 (0.020)10.463 (0.697)2.64 (0.17)8152230.562 (0.022)16.312 (0.415)1.53 (0.04)
SG2-PLS0.880 (0.015)9.462 (0.579)2.92 (0.17)8152250.625 (0.014)15.088 (0.278)1.66 (0.03)
SSCRaw-PLS0.967 (0.004)0.753 (0.042)5.57 (0.31)4156220.935 (0.003)1.142 (0.022)3.98 (0.08)
SNV-PLS0.964 (0.004)0.781 (0.046)5.33 (0.31)0160280.918 (0.005)1.289 (0.039)3.53 (0.11)
MSC-PLS0.965 (0.004)0.770 (0.048)5.37 (0.34)4156230.929 (0.003)1.194 (0.027)3.81 (0.09)
SG1-PLS0.968 (0.004)0.744 (0.042)5.60 (0.32)0160220.934 (0.003)1.151 (0.022)3.95 (0.08)
SG2-PLS0.962 (0.004)0.803 (0.042)5.18 (0.26)3157170.931 (0.002)1.177 (0.017)3.86 (0.06)
Table 3. Selected wavelengths for soluble solids content (SSC) and firmness (FF) prediction using the best PLS models.
ModelParametersSelected Wavelengths
Raw-PLSSSC901.00, 929.90, 952.41, 1084.58, 1107.19, 1129.81, 1145.96, 1220.28, 1326.78, 1381.52, 1420.09, 1452.17, 1503.38, 1528.92, 1551.23, 1570.33, 1621.09, 1624.25, 1627.42, 1659.01, 1668.46, 1687.35
SNV-PLSFF913.84, 926.69, 955.63, 978.16, 997.48, 1020.04, 1107.19, 1149.19, 1171.81, 1204.12, 1330.00, 1464.99, 1548.05, 1583.04, 1681.06, 1684.20
Table 4. Performance metrics of ML models and their respective methods or kernel functions used for classifying three classes of kiwifruit.
ModelLDAANNDTs SVM
Method J48CARTLMTRBFPolynomialGaussianPearson
Performance
R20.480.950.480.500.480.650.590.610.57
RMSE0.460.080.460.450.470.350.390.380.42
MAE0.400.030.410.380.420.280.310.290.34
Disclaimer/Publisher’s Note: The statements, opinions and data contained in all publications are solely those of the individual author(s) and contributor(s) and not of MDPI and/or the editor(s). MDPI and/or the editor(s) disclaim responsibility for any injury to people or property resulting from any ideas, methods, instructions or products referred to in the content.