Abstract
Given that aging deterioration significantly influences the structural behavior of reinforced concrete (RC) nuclear power plant (NPP) structures, it is crucial to incorporate changes in the material properties of NPPs for accurate prediction of seismic responses. In this study, machine learning (ML) models for predicting the seismic response of RC NPP structures were developed by considering aging deterioration. The OPR1000 was selected as a representative structure, and its finite element model was generated. A total of 500 artificial ground motions were created for time history analyses, and the analytical results were utilized to establish a database for training and testing ML models. Six ML algorithms, commonly employed in the structural engineering domain, were used to construct the seismic response prediction model. Thirteen intensity measures of artificial earthquakes and four material properties were employed as input parameters for the training database. The floor response spectrum of the example structure was chosen as the output for the database. Four evaluation metrics were implemented as quantitative measures to assess the prediction performance of the ML models. This study used multiple input variables to represent the characteristics of the seismic loads and changes in material properties, thereby increasing the minimum required database size for ML model development. This increase may extend the time and effort required to construct the database. Consequently, this study also explored the possibility of reducing the minimum required database size and the prediction performance through input dimension reduction of the ML model. Numerical results demonstrated that the developed ML model could effectively predict the seismic responses of RC NPP structures, taking into account aging deterioration.
1. Introduction
The Fukushima nuclear power plant accident, triggered by the Great East Japan Earthquake in 2011, marked a significant turning point in highlighting the importance of seismic safety in nuclear power plant (NPP) structures. In Korea, several recent earthquakes have damaged building structures, notably the 2016 Gyeongju earthquake near Wolseong Nuclear Power Plant Units 1 to 4, which were manually shut down after the quake, thereby amplifying public interest and concerns regarding the seismic safety of nuclear facilities.
Various methods are employed to assess the safety of NPP structures against earthquakes. In recent years, seismic probabilistic risk assessment (SPRA) has become a widely adopted methodology [1,2]. In the SPRA approach, seismic safety assessments are conducted by integrating the earthquake hazard curve specific to the nuclear power plant’s site with the structure’s seismic fragility curve or that of installed equipment [3]. This integration necessitates conducting multiple time history analyses of NPP structures under various seismic loads. To facilitate these analyses, commercial finite element analysis programs such as Abaqus are often utilized. However, because the finite element models of NPP structures consist of numerous elements and nodes, time history analyses are both time-consuming and resource-intensive. In response to this, ongoing research is exploring various methods to predict the seismic response of nuclear power plant structures efficiently, aiming to minimize computational resources and time while maintaining accuracy.
Lee et al. [4] performed a multivariate seismic fragility analysis of reinforced concrete squat shear walls, leveraging surrogate models to derive a simplified closed-form equation for a specific surrogate seismic demand model. Multiple methodologies, such as the response surface method, support vector machines, Gaussian process regression, and neural networks, are employed to construct and test these surrogate models. Jia and Wu [5] developed fragility curves using Monte Carlo simulation with high computational efficiency, facilitated by the ensemble neural network. Kiani et al. [6] applied classification-based machine learning tools to predict structural responses and fragility curves, exploring ten different methods in this area. Kazemi et al. [7] utilized well-known machine learning techniques to develop a predictive model for the seismic response and performance assessment of reinforced concrete moment-resisting frames.
As evidenced by the recent studies, machine learning (ML) techniques have been progressively employed in different areas of structural engineering [8]. They are particularly becoming prevalent as alternative approaches to complex finite element analysis models for predicting structural responses [9]. Although these studies have mostly addressed relatively simple building structures, the development of machine learning-based seismic response prediction models for more complex nuclear power plant structures is still in its early stages.
Several recent studies have demonstrated the use of machine learning techniques in structural safety assessments. For example, Harirchian et al. [10] employed four machine learning techniques to derive seismic fragility curves for non-engineered masonry structures using an extensive dataset collected from 646 masonry walls in Malawi. The study demonstrated that ML models could accurately predict the probability of structural collapse based on peak ground acceleration (PGA). This research highlights the potential of ML to efficiently generate fragility curves for regions lacking detailed structural models, offering a data-driven alternative to conventional numerical methods. Afshar et al. [11] presented a comprehensive review of ML applications for structural response prediction in the context of structural health monitoring (SHM) for civil engineering structures. It highlights the growing role of ML, deep learning (DL), and meta-heuristic algorithms in predicting structural behavior. The paper emphasizes that these methods can achieve acceptable prediction accuracy while offering increased speed, efficiency, and adaptability compared to conventional approaches. In a related study, Harirchian et al. [12] presented a comprehensive literature review on the use of soft computing techniques for rapid visual screening (RVS) of existing buildings. They highlighted the limitations of conventional seismic assessment methods for large inventories and emphasized the value of machine learning and probabilistic approaches in enabling scalable and uncertainty-tolerant vulnerability evaluation. Ge et al. [13], on the other hand, developed a DL-based model that achieved high-accuracy damage detection in steel structures using multi-scale convolutional layers, and attention mechanisms. Their model demonstrated strong adaptability and robustness across various structural types and seismic conditions, offering practical potential for next-generation SHM systems. Zain et al. [14] assessed the seismic vulnerability of RC and unreinforced masonry school buildings using ML models such as XGBoost and Random Forest, achieving high prediction accuracy for fragility curves based on IDA results. Gondaliya et al. [15] developed an ML-based framework combining classification and regression models to predict damage in RC frames, employing stacking ensemble methods to address epistemic uncertainty. Noureldin et al. [16] proposed an integrated ML procedure using neural networks and fuzzy inference systems for qualitative seismic design and assessment, which was validated against nonlinear time history analysis. Bhatta and Dang [17] evaluated several ML algorithms using real earthquake damage data from Nepal to predict seismic damage of RC buildings, demonstrating the models’ applicability in post-disaster response scenarios.
In the nuclear domain, Belytskyi et al. [18] applied computer vision and ML methods to measure component dimensions in difficult-to-access NPP environments, focusing on precision reconstruction under operational constraints. Gong et al. [19] provided a broad review of AI-based fault detection and diagnosis techniques in NPPs, emphasizing their advantages over traditional physics-based methods. Wang et al. [20] proposed a machine learning-driven probabilistic seismic demand model (PSDM) for NPPs using multiple intensity measures, showing improved accuracy and reduced analysis time through ML-assisted fragility modeling. This study simplified the NPP by building a lumped-mass stick model of the containment and secondary system. Zheng et al. [21] introduced a damage-state-based fragility analysis approach for NPPs that accounts for structural uncertainties and demonstrated the utility of explainable ML techniques in sensitivity analysis. However, these studies did not explicitly consider material degradation due to aging, which is a critical factor in long-term seismic performance of NPP structures.
In addition to structural performance prediction, several studies have explored the application of machine learning to material degradation modeling. Taffese et al. [22] used ML algorithms to predict concrete aging factors based on material and environmental parameters, highlighting the ability of advanced models like LightGBM to achieve high accuracy without extensive physical testing. Li et al. [23] reviewed the role of ML in concrete research, discussing its applications, limitations, and best practices for mixture design and durability modeling under increasingly complex cementitious systems. Although these studies offer important contributions to understanding concrete aging at the material level, they do not directly address seismic response prediction at the structural scale.
Nuclear power plant structures, typically constructed from thick reinforced concrete (RC), are designed to robustly prevent the leakage of radioactive materials. However, reinforced concrete is susceptible to aging deterioration from various factors, such as chloride penetration, carbonation, radioactivity, and thermal effects. This deterioration can change the properties of the structural material, potentially leading to rebar corrosion, loss of concrete and steel section, and overall degradation of performance [24]. In RC NPP structures, such aging deterioration can lead to changes in key material properties including elastic modulus, yield strength, density, and damping capacity. These modifications can influence the dynamic characteristics of the structure, thereby reducing its seismic resistance and altering its seismic responses [25]. Consequently, it is essential to consider these changes in material properties due to aging deterioration to accurately predict the seismic response of nuclear power plant structures.
Building on this understanding, our study developed a seismic response prediction model for NPP structures that incorporates aging deterioration, utilizing machine learning techniques, and evaluated its accuracy. The OPR1000 (Optimized Power Reactor 1000 MW), a Korean standard nuclear power plant, was chosen as the target structure. Currently, a total of 10 OPR1000 units are either operational or under construction at the Gori, Wolseong, Hanbit, and Hanul nuclear power plant sites. The structure of the OPR1000 consists of two main components: the reactor containment building, which houses the reactor coolant system, and the reactor auxiliary building, which contains auxiliary system facilities vital for the operation of the reactor coolant system. The foundations of these buildings are isolated from each other.
In regions with low-to-moderate seismic activity, such as Korea, reactor containment buildings are more prone to indirect damage caused by failures in auxiliary building facilities rather than direct structural damage from earthquakes. Therefore, this study focused on predicting the seismic responses of the OPR1000 auxiliary buildings using the developed machine learning model. To construct an effective machine learning model, it is critical to develop a comprehensive database for training and testing.
To develop ML models capable of accurately predicting the seismic response of actual nuclear structures, a sufficient amount of real-world seismic response data from instrumented NPPs is essential. Unfortunately, such data are scarce in both quantity and diversity due to the inherent difficulty in collecting strong-motion response records from operating nuclear facilities. As a result, the majority of studies—including this study—have relied on simulation-based datasets constructed from finite element analyses. Therefore, time history analyses were performed using the finite element analysis model of the OPR1000 auxiliary building subjected to seismic loads. As part of the time history analysis, 500 artificial earthquake loads were generated based on the ground characteristics of the Ulsan area [26], a primary location for domestic nuclear power plants.
The seismic responses of an NPP structure largely depend on the characteristics of the seismic loads and the properties of RC materials. Therefore, the machine learning model included input variables that reflect both seismic load characteristics and changes in material properties due to aging deterioration. In this study, several indicators representing the dynamic characteristics of ground motion time series data were considered. The widely used earthquake intensity measures, typically applied in seismic fragility analysis of structures and facilities, were chosen as input variables for the machine learning model. Additionally, to account for aging deterioration in RC material properties, changes in elastic modulus, Poisson’s ratio, density, and damping ratio were also included as input variables in the ML prediction model. The seismic response prediction ML model developed in this study aims to evaluate the seismic fragility of MCC (Motor Control Center) cabinets installed in the OPR1000 auxiliary building. To achieve this objective, a database was established by calculating the floor response spectrum around the resonance frequency of the MCC cabinet on the floors where these cabinets are installed.
Figure 1 illustrates the percentage breakdown of various ML methods applied in structural engineering [12]. The analysis categorizes these methods into seven groups: neural networks (NN), Support Vector Machines (SVM), Boosting Algorithms (BA), Regression Analysis (RA), Random Forest (RF), Decision Trees (DT), and a miscellaneous group (including k-Nearest Neighbors (kNN)). Except for RA, six machine learning algorithms were utilized to develop ML models for seismic response prediction. The accuracy of these ML models was quantitatively assessed using metrics such as root mean square error (RMSE), mean square error (MSE), mean absolute error (MAE), and the coefficient of determination (R2).
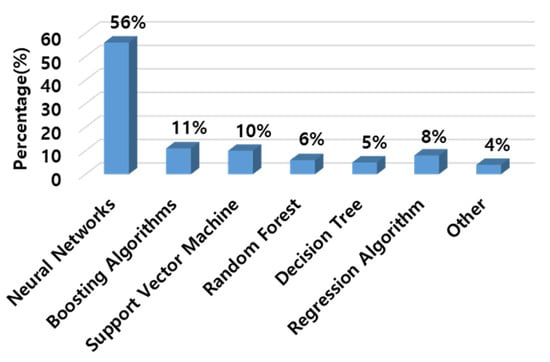
Figure 1.
Proportion of ML methods utilized in structural engineering.
Given the extensive range of input variables representing seismic load characteristics and changes in material properties in this study, the minimum database size required to develop the ML models is considerably large. This requirement imposes greater demands on time and effort for database construction. To address this challenge, the study explored strategies to reduce the necessary database size and evaluated the prediction performance of the ML models through the reduction in input dimensionality [27]. Feature selection and extraction were employed as methods to reduce input dimensionality.
Existing studies have primarily focused on relatively simple building structures or have overlooked the influence of material aging, making it difficult to apply their findings directly to complex infrastructure such as nuclear power plants. Addressing these gaps, the present study is expected to contribute to the advancement of ML-based seismic response prediction by (1) applying machine learning techniques to a structurally complex NPP structure, (2) incorporating aging-related material degradation through probabilistic variation of RC properties, and (3) demonstrating the potential to achieve accurate predictions with a reduced training dataset by optimizing input dimensionality, thereby improving the efficiency of data generation, which is typically time-consuming and resource-intensive in simulation-based studies. These efforts are anticipated to enhance the applicability and scalability of machine learning approaches in the seismic assessment of aging nuclear structures.
2. Example NPP Structure and Earthquake Loads
2.1. NPP Example Structure Model
In this study, the OPR1000 auxiliary building, as depicted in Figure 2, was selected as the example structure for predicting the dynamic responses of an NPP structure under seismic loads. The analysis model illustrated in the figure was created using Abaqus/CAE 2022, a widely recognized structural analysis software. The majority of structural components in the auxiliary building, including walls, slabs, and beams, were modeled using a four-node shell element with reduced integration (S4R). The main columns were represented using three-dimensional two-node beam elements (B31). The finite element model comprised a total of 19,689 elements and 17,765 nodes. It is important to note that only the auxiliary building of the OPR1000 was modeled, given that the foundations of the containment and auxiliary buildings are distinct.
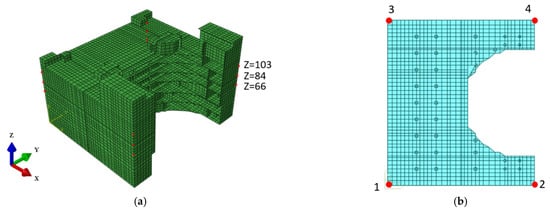
Figure 2.
Finite element model of the OPR1000 auxiliary building: (a) perspective; (b) plan.
The reinforced concrete material utilized in the analysis possesses an elastic modulus of 2.78 × 10⁴ N/mm2, a Poisson’s ratio of 0.17, and a density ranging from 7.32 × 10⁻⁷ to 10.59 × 10⁻⁷ N/mm2. Damping was modeled using Rayleigh Damping, which incorporated a 5% damping ratio. The eigenvalue analysis determined that the natural frequencies of the primary modes in the X and Y directions were 6.16 Hz and 4.25 Hz, respectively.
Figure 3 depicts the input/output relationship of the database that was utilized to develop the machine learning model. As shown, the time history analysis was performed iteratively, incorporating variations in ground motion and material properties owing to aging deterioration as input variables. The machine learning model output was designated as the floor acceleration response, crucial for assessing the seismic safety of the MCC cabinet installed in the auxiliary building. The response was measured at the highest floor (Z = 103 ft), where the acceleration is most significantly amplified. Acceleration time histories in the X and Y directions were calculated at the four corners indicated in Figure 2b, using finite element analysis. The calculated acceleration time history was further processed into the floor response spectrum corresponding to the resonance frequency band of the MCC cabinet. Further discussion on this topic will follow in the subsequent section.
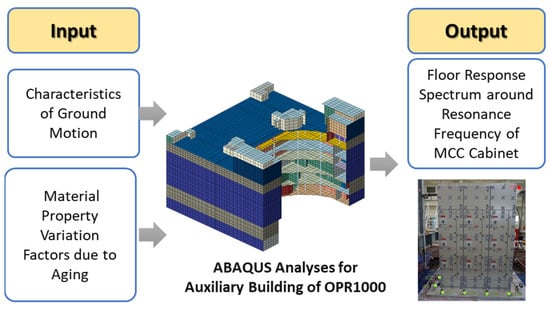
Figure 3.
Configuration of inputs and outputs in the ML database.
2.2. Artificial Earthquake Loads
To construct a realistic seismic loading scenario for the example NPP structure, artificial ground motions were generated using the stochastic simulation model proposed by Rezaeian and Kiureghian [28]. This technique is notable for its ability to incorporate a variety of earthquake scenarios using probabilistic models to manage seismic wave uncertainty, thereby enabling the generation of more realistic ground motions.
Rezaeian and Kiureghian’s method determines seismic wave characteristics through frequency domain analysis and generates artificial earthquakes based on these parameters. It adjusts the amplitude using actual earthquake records to ensure that the artificial seismic wave closely resembles the actual vibration intensity of a real earthquake. For this study, the ground characteristics of the Ulsan area, where many NPP structures are located in Korea, were used as the input parameters.
To ensure that the input parameters reflected actual geological and geotechnical conditions, the values were selected based on site-specific investigation documents rather than arbitrary assumptions. The fault type was set to strike-slip, with a moment magnitude of 6.0 and a rupture distance of 40 km, based on a geological report on regional fault structures. The shear wave velocity (V30) was set to 715 m/s, as reported in a site-specific geotechnical investigation conducted in the same region. By grounding the input parameters in real investigation data, the artificial ground motions were tailored to reflect both the tectonic setting and site-specific seismic response characteristics of the target location. The probabilistic nature of the Rezaeian and Kiureghian’s method further enabled the generation of a broad set of motions with controlled variability, making the dataset suitable for machine learning model training.
In this study, 500 artificial earthquake loads were generated using this method. Spectral acceleration graphs for 100 randomly selected earthquakes are displayed in Figure 4. This figure illustrates the diverse characteristics of the generated artificial ground motions, which help prevent overfitting during the machine learning process. Moreover, this diversity allows for objective verification by using a test dataset with different characteristics from the training dataset when evaluating the performance of the machine learning models. The acceleration time history of a randomly selected sample earthquake from the generated ground motions is presented in Figure 5. As depicted in the figure, the waveform of the artificial seismic wave is irregular, resembling that of actual seismic events.
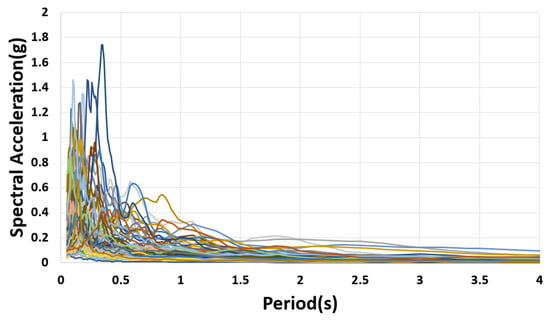
Figure 4.
Acceleration response spectra for 100 selected earthquakes.
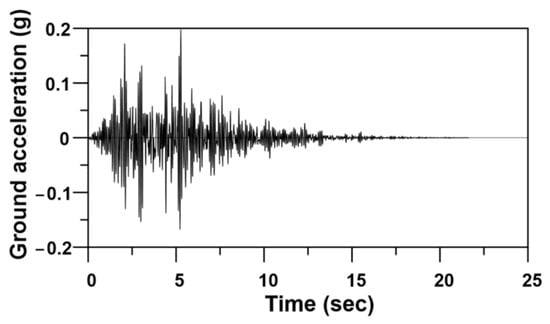
Figure 5.
Time history of ground acceleration for a simulated earthquake.
3. Construction of Training and Test Datasets for Machine Learning Model
A database was developed to train and validate a machine learning model for predicting the seismic response of the example NPP structure. The input for the machine learning model includes seismic load characteristics and material properties accounting for aging deterioration effects, while the output was defined as the floor acceleration response of the target story. The inputs and outputs of the database are illustrated in Figure 6.
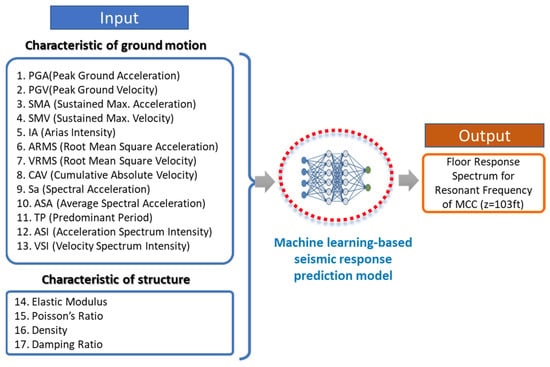
Figure 6.
Input and output features of the ML model.
As shown in the figure, 13 earthquake intensity measures were employed to characterize the seismic load. These measures include four amplitude-related metrics, such as PGA and peak ground velocity (PGV); four energy-related metrics, including Arias intensity (IA) and root mean square acceleration (ARMS); and five frequency-related metrics, such as spectral acceleration (Sa) and average spectral acceleration (ASA). Details of all 13 earthquake intensity measures used in this study are provided in Table 1.

Table 1.
Earthquake intensity measures indicating seismic characteristics.
Because the example NPP structure is situated in regions with low-to-moderate seismic activity, its structural response to seismic loads is assumed to be elastic. Consequently, linear elastic time history analyses were conducted to determine its seismic responses. The linear elastic structural analysis incorporated variations in elastic modulus, Poisson’s ratio, density, and damping ratio to account for aging deterioration effects on the structural properties of reinforced concrete materials.
The material propertiemaxs used in the analysis adhered to a log-normal distribution. Table 2 presents the median values and coefficients of variation for these properties. Based on prior research on the impact of aging deterioration on RC materials [29,30,31,32], variability assumptions included an elastic modulus change of up to approximately 20%, a density change of about 5%, a damping ratio alteration of around 40%, and a Poisson’s ratio adjustment of approximately 10%. These parameters helped generate a dataset for material properties, enabling the training of a machine learning model to accurately reflect changes due to aging deterioration.

Table 2.
Variation of material parameters (Unit: N, mm).
Although environmental factors such as carbonation, neutralization, temperature variation, and radiation exposure were not explicitly modeled, their effects were indirectly considered through adjustments in material property inputs. For example, degradation of the elastic modulus caused by carbonation, reinforcement corrosion, or radiation can all be represented within a single framework by updating input parameters accordingly. This allows engineers to reflect site-specific deterioration patterns based on empirical data or design guidelines. While the model does not internally simulate environmental processes, it is well suited to capture their consequences, offering high adaptability across a broad range of aging scenarios.
The overall data distribution was assessed using histograms of the 13 earthquake intensity measures for the 500 artificial ground motions created in this study, as depicted in Figure 7. The analysis confirms that all 13 input variables roughly follow a log-normal distribution, ensuring the database adequately represents the ground motion characteristics. This database aims to train the machine learning model effectively using ground motions from low and moderate seismic regions with varied characteristics.
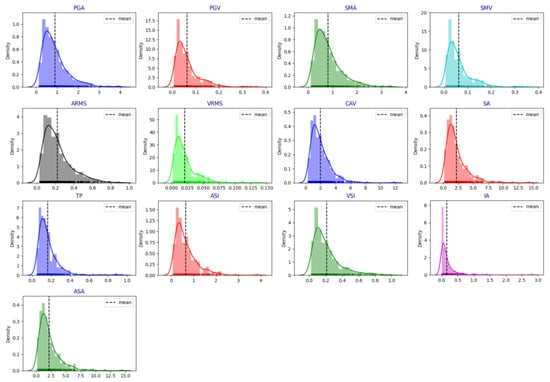
Figure 7.
Distribution of earthquake intensity measures.
To determine the output values for the database, time history analysis results from the OPR100 auxiliary building, subjected to 500 artificial earthquake loads, were employed. The floor response spectrum (FRS) was calculated using the X and Y directional floor acceleration time histories recorded at four response positions per story, as shown in Figure 2. Spectral envelopes, indicating maximum FRS for each direction, were constructed from the FRS values at the four positions, as illustrated in Figure 8.
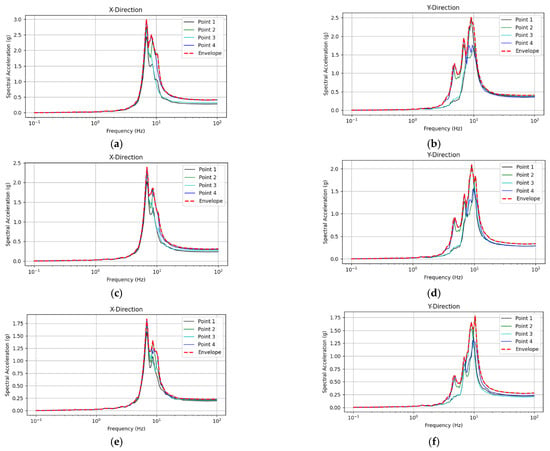
Figure 8.
Example of a floor response spectrum: (a) X-direction response at height of 103 ft; (b) Y-direction response at height of 103 ft; (c) X-direction response at height of 84 ft; (d) Y-direction response at height of 84 ft; (e) X-direction response at height of 66 ft; (f) Y-direction response at height of 66 ft.
The maximum FRS within the resonance frequency band of the MCC cabinet was calculated as the database output. For this study, the resonance frequency of the MCC cabinet was assumed to be 10 Hz. The database output was determined by integrating the floor acceleration spectrum over the resonance frequency range ±5 Hz as depicted in Equation (1).
Here, Sa represents the floor spectral acceleration. Figure 9 illustrates the distribution of the database outputs calculated for 500 artificial seismic loads using Equation (1). As depicted, the output data follow an approximate log-normal distribution. Out of the 500 datasets, 80% were randomly selected for training, while the remaining 20% were allocated for testing ML models. In other words, the ML models were tested on unseen data, with 20% of the dataset set aside exclusively for evaluation. This test set was not used during training or hyperparameter tuning, ensuring that generalization performance was evaluated without bias.
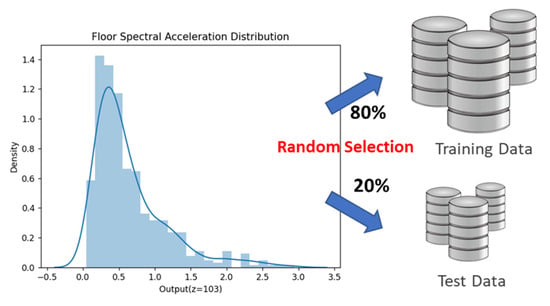
Figure 9.
Distribution of output data and data partitioned for training and testing.
To analyze Pearson correlation between the input and output features of the constructed database, a correlation heatmap is presented in Figure 10. The figure shows that PGA, SMA, and ARMS all exhibit a correlation coefficient of 0.82, indicating a strong correlation. Sa and ASA also showed a relatively high correlation coefficient of 0.79. Overall, the correlation of acceleration-related indices was notably high, whereas the correlation of velocity-related indices was relatively low. The damping ratio among the features of material property changes showed a correlation coefficient of −0.27, indicating a negative correlation. Generally, the changes in material properties presented a relatively low correlation compared to ground motion characteristics, suggesting that the seismic responses of the structure are primarily influenced by the seismic load.
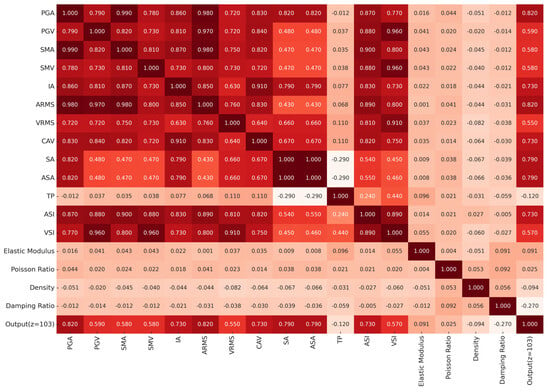
Figure 10.
Correlation heatmap between features.
4. Machine Learning Algorithms and Performance Evaluation Indices
4.1. Selected Machine Learning Algorithms
In this study, six machine learning algorithms including DT, RF, SVM, kNN, XGBoost, and NN [8] were employed to develop ML models that predict seismic responses of an NPP structure considering aging deterioration. This section briefly introduces the six selected ML algorithms. Four performance evaluation indices of ML models are also detailed.
DT is a widely recognized supervised machine learning algorithm used extensively in classification and regression tasks [33]. It represents decisions and their potential outcomes in a tree-like structure. Each decision node divides the data into subsets based on specific feature values. These partitions aim to maximize the usefulness of each division, often determined by metrics such as Gini impurity, entropy, or variance reduction. The final classifications or outcomes appear as the leaf nodes of the tree.
The RF algorithm is a highly effective and versatile ensemble learning technique, valued for its ability to improve prediction accuracy and reduce overfitting [33]. It operates by constructing multiple decision trees, each trained on a unique random subset of the dataset. Furthermore, within the trees, only a randomly selected subset of features is considered at each split—a strategy known as bagging and feature randomization. By introducing variability among the trees, random forests create a robust model that is less sensitive to noise and errors in the data.
SVM operates by identifying the optimal hyperplane that separates data points into distinct classes [6]. This hyperplane is carefully selected to maximize the margin—the distance between the hyperplane and the nearest data points from each class, termed support vectors. By maximizing this margin, SVM achieves reliable and robust classification, even in datasets that are complex or noisy.
The kNN algorithm is a straightforward yet flexible supervised learning technique widely utilized for both classification and regression tasks [33]. Unlike many machine learning algorithms, kNN operates without a specific training phase. Instead, it predicts outcomes by identifying the k nearest data points, or “neighbors”, to a given query point in the feature space. For regression tasks, it calculates the average of the neighbors’ values to make predictions. The similarity or “closeness” between points is typically determined using distance metrics such as Euclidean distance, Manhattan distance, or Minkowski distance, chosen based on the task’s specific requirements.
XGBoost is an efficient and versatile machine learning algorithm that has become a cornerstone for both classification and regression tasks [7]. Built on the principles of gradient boosting, XGBoost constructs an ensemble of decision trees, where each tree iteratively corrects the residual errors from the previous ones. This stepwise optimization ensures the model achieves highly accurate predictions, even when applied to complex datasets with intricate patterns.
Neural networks are a powerful class of machine learning algorithms inspired by the structure and function of the human brain [7]. These models identify patterns within data by passing inputs through layers of interconnected nodes, or “neurons”, each connection associated with a weight. During training, these weights are updated iteratively using optimization algorithms to minimize the error between the predictions and actual outcomes. A typical neural network consists of three main layers: an input layer that receives raw data, one or more hidden layers that perform intermediate processing, and an output layer that produces the final prediction.
In this section, OpenAI’s ChatGPT (GPT-4o, accessed in January 2025) was used to help draft brief explanatory descriptions of selected machine learning algorithms by summarizing and clarifying the standard characteristics of algorithms such as random forest, XGBoost, and neural networks. All outputs were critically reviewed and revised by the authors to ensure technical accuracy and appropriateness.
4.2. Performance Evaluation Indices
Four commonly used evaluation metrics in regression analysis were employed to assess the seismic response prediction performance of NPP structures for each machine learning algorithm developed in this study. These metrics are presented in Equations (2)–(5). Here, RMSE represents root mean squared error, MSE stands for mean squared error, MAE denotes mean absolute error, and R2 represents the coefficient of determination.
In these equations, n refers to the number of observations, is the predicted value, is the observed value, represents the average of the observed values, and the variance for the target value. The first three error metrics are used to compare the relative accuracy between ML models, as their absolute values are not directly significant. Conversely, the coefficient of determination (R2) quantifies prediction accuracy, with values approaching 1 denoting higher accuracy and those closer to 0 indicating reduced predictive performance.
4.3. Hyperparameter Optimization
To optimize the hyperparameters of each machine learning model, a grid search algorithm combined with 5-fold cross-validation was employed. Grid search systematically evaluates all possible combinations of hyperparameters within predefined search ranges, as summarized in Table 3, Table 4, Table 5, Table 6 and Table 7. For each candidate configuration, the training dataset was partitioned into five equally sized subsets. In each iteration, four folds were used for training and one fold for validation, cycling through all possible validation folds. This procedure allows for a robust assessment of model generalization performance across different data partitions. The average prediction performance across the five folds was calculated for each hyperparameter set, and the configuration yielding the best overall accuracy was selected as optimal. This process was applied independently for each ML algorithm, and the final selected hyperparameters, along with their corresponding search intervals and categorical options, are presented in Table 3, Table 4, Table 5, Table 6 and Table 7. This approach ensures unbiased model tuning and helps prevent overfitting by validating the model performance on unseen subsets of the training data during optimization.

Table 3.
Hyperparameters for the Random Forest model.

Table 4.
Hyperparameters for the Support Vector Machine model.

Table 5.
Hyperparameters for the k-Nearest Neighbors algorithm.

Table 6.
Hyperparameters for the XGBoost model.

Table 7.
Hyperparameters for neural network model.
5. Performance Evaluation of Seismic Response Prediction of ML Models
Employing the six machine learning algorithms described earlier, a seismic response prediction model was created for the example NPP structure, incorporating aging deterioration. To assess the prediction performance of the developed ML model, 20% (100 samples) of the dataset not used during training were selected.
The predicted seismic response values of the ML models, accounting for aging effects, were compared with the target values as shown in Figure 11. In the graph, the horizontal axis denotes the predicted responses, while the vertical axis corresponds to the results from the finite element analysis model, i.e., the target values. High prediction accuracy is evident when the result dots closely align with the diagonal dashed line in the graph. The figure reveals that the prediction results of the DT model are the most dispersed along the diagonal, suggesting that it has the lowest prediction accuracy among all the models. In contrast, the RF model, which employs multiple DT models, displays predictions that are closer to the diagonal compared to the DT model. The SVM model demonstrated superior prediction performance within a limited seismic response range relative to the RF model. However, the kNN model showed decreasing accuracy as the seismic response increased. The XGBoost model performed slightly better than the kNN model, while the NN model achieved the highest overall accuracy, with its prediction results being the most concentrated along the diagonal.
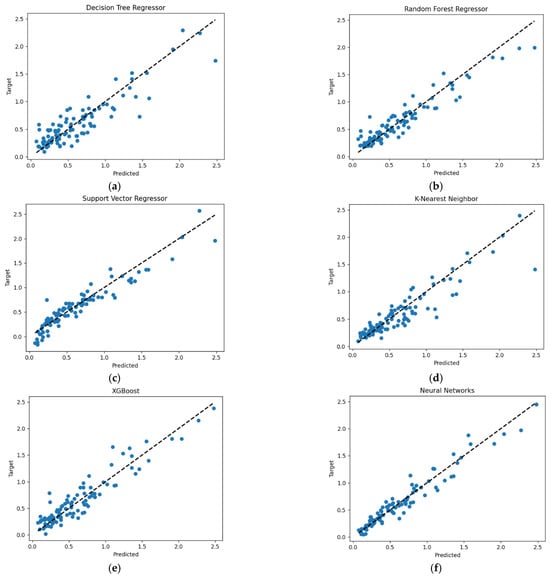
Figure 11.
Comparison of prediction performance across six ML algorithms: (a) Decision Tree; (b) Random Forest; (c) Support Vector Machine; (d) k-Nearest Neighbor; (e) XGBoost; (f) neural networks.
It can be observed from the figure that the prediction results are clustered around the diagonal in areas where the structural response is minimal, indicating high prediction accuracy. However, as the response magnitude increases, the results increasingly deviate from the diagonal, leading to reduced accuracy. This phenomenon can be elucidated by examining the distribution of the established database, as depicted in Figure 7. The database distribution suggests that the machine learning model was inadequately trained for strong seismic loads. This inadequacy is likely due to the predominance of low-to-moderate seismic loads, which are more frequent in Korea, compared to the smaller number of strong seismic loads with high PGA.
Table 8 presents four prediction performance evaluation indices for each model, offering a quantitative assessment of the accuracy of the ML models developed for predicting the seismic response of the NPP structure, considering aging deterioration. As demonstrated in Figure 11, the coefficient of determination (R2) for the DT model was the lowest among the six ML models, at 0.81. The R2 values for the kNN and XGBoost models were 0.84 and 0.88, respectively, indicating slightly enhanced prediction performance compared to the DT model. The RF and SVM models both registered an R2 value of 0.90; however, the RF model displayed a marginally lower MAE, indicating somewhat greater accuracy. Finally, the NN model recorded the highest R2 value at 0.94, with the lowest values for the other error indices, quantitatively confirming its superior prediction performance among the six models.

Table 8.
Comparison of the prediction performance indices of each ML model.
To ensure fair and consistent evaluation of all machine learning algorithms, the initial training phase focused on a single-output model that predicts the FRS at the uppermost floor (Z = 103 ft), where the maximum structural response typically occurs during seismic events. This simplified output setting was used across all six algorithms to facilitate a direct comparison of predictive performance. After identifying the NN model as the most accurate performer, the model was extended to a multi-output configuration to enhance its practical applicability. The multi-output NN model was designed to predict FRS values at three different floor levels simultaneously. This approach reflects the fact that seismic demands in NPP structures vary significantly across elevations.
Figure 12 illustrates the network configuration of the NN model, which was optimized through the hyperparameter optimization process. The input layer consists of 13 ground motion characteristics and 4 material property alterations due to aging, totaling 17 nodes. The output layer delivers the acceleration spectrum for three target floors (Z = 103 ft, 84 ft, 66 ft), comprising a total of three nodes. The NN model comprises three hidden layers, with the node count optimized to 150, 150, and 100, respectively.

Figure 12.
Configuration of the multi-output NN model.
The NN model developed is capable of simultaneously outputting the responses of the three considered floors. The responses from multiple output layers are compared with the corresponding target values as shown in Figure 13. As illustrated in the figure, the floor acceleration response spectrum shows an increase with floor height, indicating larger seismic responses for the upper floors. Despite variations in story heights, the responses of all three floors correlate well with their respective target values.
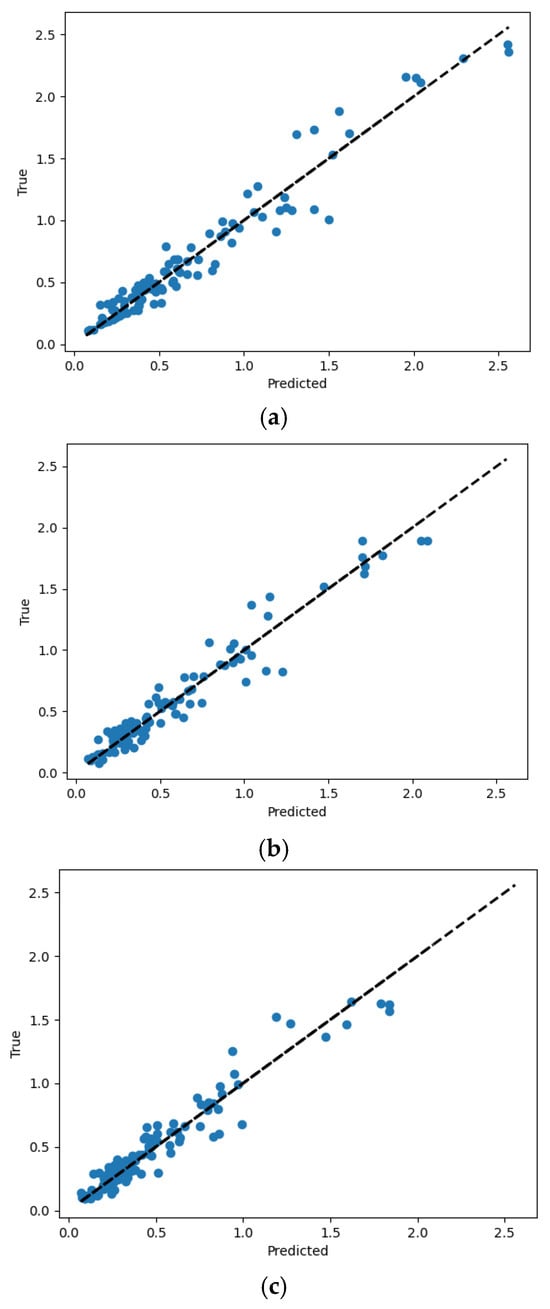
Figure 13.
Comparison of prediction performance of the multi-output NN model: (a) prediction results at a height of 103 ft; (b) prediction results at a height of 84 ft; (c) prediction results at a height of 66 ft.
Four performance evaluation indices for the NN model with three outputs, namely RMSE, MSE, MAE, and R2, are 0.11, 0.01, 0.08, and 0.94, respectively. These indices suggest a slight enhancement in performance over the single-output NN model, which only predicts the seismic response of the uppermost floor, as shown in Table 8. Comparative analysis between the single- and multi-output NN models confirmed that high prediction accuracy was retained even as the number of output values increased, demonstrating that the model is not significantly affected by output dimensionality and is well suited for realistic multi-output applications.
6. Prediction Performance Evaluation by Reducing the Input Dimension of ML Model
As previously mentioned, time history analyses for 500 earthquake loads were conducted to create a database for a machine learning model aimed at predicting the seismic response of NPP structures. Due to the size and complexity of the finite element analysis model used, each time history analysis took approximately 3 to 4 h to complete. Despite this effort, the number of training datasets, i.e., 400 (80% of the total 500 datasets), is relatively small compared to the number of input features utilized. Nevertheless, it remains inefficient to expand the dataset by conducting additional time history analyses, which require substantial computational resources. To address this issue, this study introduces an input dimensionality reduction technique to efficiently train and predict using the machine learning model.
Reducing the input dimensions of a machine learning model presents several advantages, including the prevention of overfitting and improvement of the model’s generalization ability by eliminating unnecessary features and conserving only the most significant ones. Moreover, input dimension reduction minimizes the required size of the training dataset, thus reducing the computational time needed to develop the database, as well as the training time and memory usage. Generally, input dimensionality reduction techniques are divided into feature selection and feature extraction methods, where feature selection involves identifying and preserving the most critical features from an array of available options, and feature extraction entails combining existing features to generate new, more informative ones.
To select a feature, it is crucial to evaluate how significantly it influences the prediction performance of the machine learning model among various input features. The RF algorithm calculates feature importance, which offers an overall assessment of the contribution of each feature to the model’s predictions during the output computation process. The calculated feature importance values are presented in Figure 14, and based on these values, this study selected the following features.
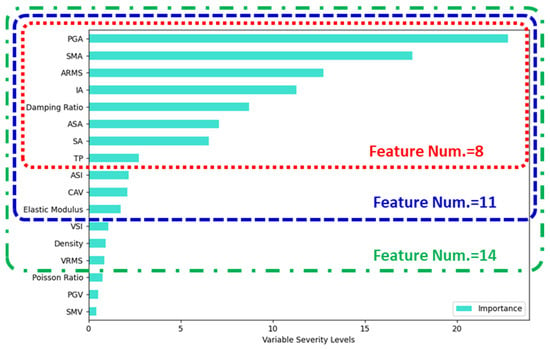
Figure 14.
Analysis of feature importance using the Random Forest algorithm.
As demonstrated in Figure 14, the features with the most significant influence on the output of the machine learning model, ranked by importance, were PGA, SMA, and ARMS. These features predominantly pertain to acceleration response. On the other hand, features like SMV and PGV, associated with velocity response, were of the lowest importance. The results in Figure 14 differ from those in Figure 10 because the two analyses are based on fundamentally different principles. Figure 10 presents Pearson correlation coefficients, which reflect only the linear relationships between individual input variables and the output. In contrast, Figure 14 shows feature importance values derived from the Random Forest model, which account for both nonlinear effects and interactions among variables during model training. Therefore, an input feature may exhibit low correlation but still have high importance in the prediction model, or vice versa. These analyses confirmed that acceleration-based intensity measures and aging-sensitive material properties (damping ratio and elastic modulus) have a significant influence on seismic response predictions.
The feature selection was performed by sequentially adding them from the most to the least significant. The variation in the prediction performance (R2) of the RF machine learning model, as influenced by the number of features included, is depicted in Figure 15. As illustrated in Figure 15, models incorporating more than eight input features ranked by importance display comparable seismic response prediction performance, with a coefficient of determination (R2) approximately 0.9. The two graphs atop Figure 15 juxtapose the predicted and target values generated by the machine learning model. It is noteworthy that the prediction performance of the model employing 17 features closely mirrors that using only 8 features. This underscores that an efficient ML model can be developed using a mere 8 of the 17 features through the RF machine learning model’s feature selection process.
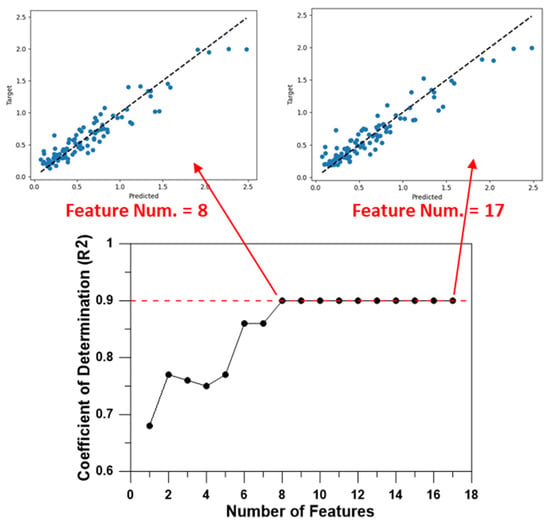
Figure 15.
Results of feature selection using the Random Forest algorithm.
Similarly, the variation in seismic response prediction performance of the NN model based on the number of selected features is detailed in Figure 16. The prediction accuracy (R2) enhances when three or more input features are employed, peaking at a coefficient of determination exceeding 0.9 with 11 or more features. Notably, the use of 14 features resulted in a prediction performance (R2 = 0.95) slightly superior to that achieved with all 17 features (R2 = 0.94). This suggests that omitting input features of low importance can enhance the prediction performance of the machine learning model, instead of depending on an excessive number of input features.
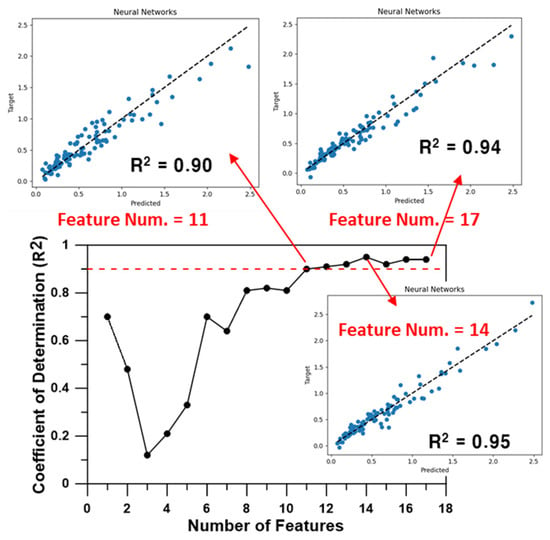
Figure 16.
Results of feature selection using neural networks.
The analysis in Figure 15 and Figure 16 was conducted to evaluate how the number and composition of input features affects the prediction performance of the models. The goal was to determine the minimum number of input variables required to maintain high accuracy, which is crucial for reducing the effort needed to build large training datasets. The results demonstrate that both RF and NN models can maintain good performance with a reduced set of features, contributing to the efficiency and practicality of the ML framework.
This analysis demonstrated that reducing the number of input variables did not lead to a noticeable decline in model performance. In particular, models trained with a reduced set of eight features identified through feature importance analysis achieved prediction accuracy comparable to those using the full 17-feature set. The retained variables, including acceleration-based intensity measures and damping ratio, contributed significantly to predictive performance and offered clear physical interpretability grounded in structural dynamics. Notably, this dimensionality reduction process revealed no substantial trade-off between model accuracy and the inclusion of physically meaningful parameters. On the contrary, eliminating less informative inputs appeared to enhance efficiency and avoid potential overfitting, highlighting the benefit of feature selection guided by engineering relevance and statistical contribution.
As explained previously, reducing the number of input features in a machine learning model aims to minimize the required database size for model development and to enhance training efficiency. To validate this approach, an NN model with 11 input features was developed using 200 randomly selected training datasets. Since the input features of the model were adjusted, hyperparameter optimization was reiterated. The prediction performance of the model using 11 input features was compared to that of the model employing all 17 input features and 400 training datasets in Figure 17 and Table 9. The figure and table verify that the seismic response prediction performance of the model with 11 input features closely mirrors that of the model with 17 input features.
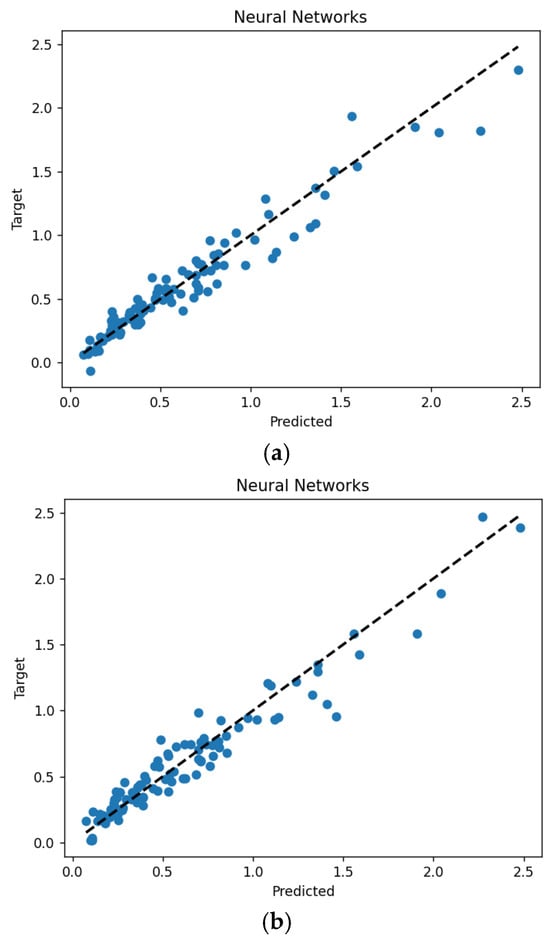
Figure 17.
Prediction performance of the NN model based on the selected number of features: (a) prediction results of a model with 17 features trained using a dataset of 400 instances; (b) prediction results of a model with 11 features trained using a dataset of 200 instances.

Table 9.
Comparison of predictive performance indices by feature selection count.
In this process, the reduction in training dataset size was implemented under an optimized input configuration, where the number of features had been minimized based on prior analysis. The model simplification through input dimensionality reduction enabled a more efficient learning process, allowing for a smaller dataset to be used without degrading predictive performance. This sequential strategy supports the development of lightweight machine learning models that are both accurate and computationally efficient.
Another input dimensionality reduction technique, feature extraction, typically utilizes methods such as Principal Component Analysis (PCA) and Partial Least Squares (PLS). PCA constructs new variables by forming linear combinations of inputs that maximize the covariance among them, whereas PLS constructs new variables that maximize the covariance between inputs and outputs, considering their correlation [34]. Consequently, PCA is often employed in unsupervised learning, and PLS is favored in supervised learning scenarios. Figure 18 displays the prediction performance graph of the NN model based on the number of input features shown in Figure 7, alongside prediction performance for PLS and PCA depending on the number of newly created components via feature extraction.
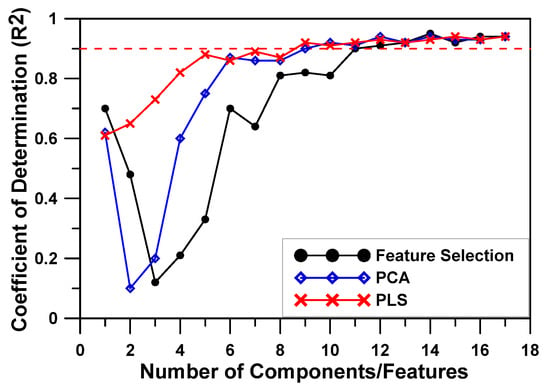
Figure 18.
Comparative performance of feature selection and extraction methods.
From the figure, it is evident that employing a feature extraction method instead of a feature selection method for reducing input dimensions yields comparatively better prediction performance, even with fewer input variables. Both feature selection and PCA techniques exhibit a significant drop in R2 when the number of input variables is limited to two–three, followed by an enhancement in prediction performance as more input variables are incorporated. Conversely, the PLS technique shows consistent improvement in prediction performance as the number of input variables increases, without the initial decline observed in other techniques.
Among the three techniques evaluated in Figure 18, the PLS technique emerged as the most effective for input dimensionality reduction. Notably, it achieved an approximate coefficient of determination (R2) of 0.9 with just five input variables. Based on these findings, the study adopted the PLS technique for input dimensionality reduction and re-optimized the model’s hyperparameters to suit the reduced dimensions.
A primary objective of reducing input dimensionality in this study was to investigate whether a machine learning model with excellent prediction performance could be developed using a smaller dataset, thereby minimizing computational time and effort required for dataset creation. To validate this, the seismic response prediction performance of the NN model was evaluated after extracting 5 and 9 components from a total of 17 input features using the PLS technique for dimensionality reduction, as presented in Figure 19 and Table 10. A dataset of 200 samples was used to train this model.
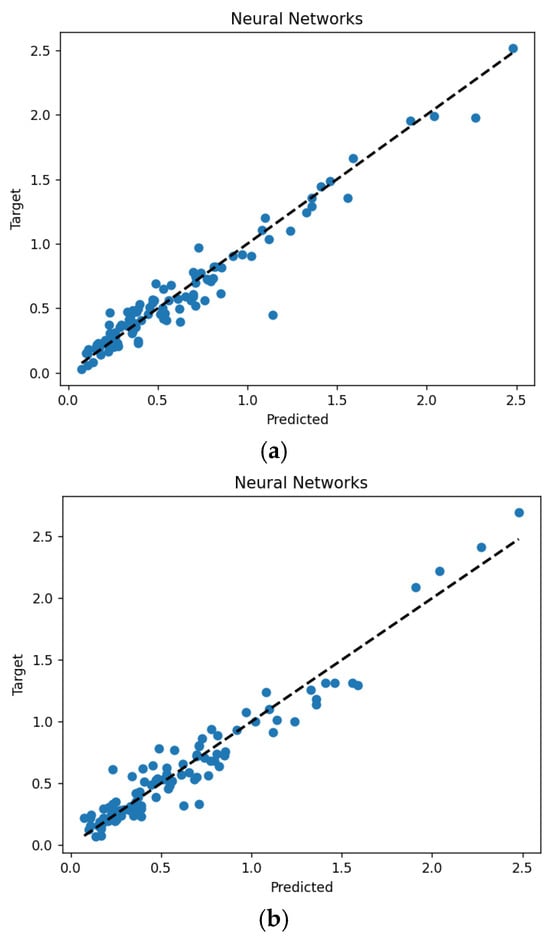
Figure 19.
Prediction performance of the PLS-NN model trained with a dataset of 200: (a) prediction results of the model with 9 components; (b) prediction results of the model with 5 components.

Table 10.
Comparison of predictive performance indices by number of extracted components.
It was confirmed that a model extracting 9 components from 17 features using the PLS technique demonstrated similar prediction performance with only 200 datasets compared to a model trained with 400 datasets. Notably, a model utilizing just 5 components, which represents approximately 30% of the original 17 features, achieved comparable prediction performance to an original model with 17 input variables trained with 400 datasets, despite being trained with only 200 datasets.
In examining model performance across different input feature sets, we also observed that the evaluation metrics (RMSE, MAE, MSE, and R2) remained consistent and stable. This suggests that, beyond assessing predictive accuracy, the results additionally support the robustness of these metrics under varying input conditions, reinforcing their reliability in ML-based seismic response prediction.
7. Conclusions
In this study, seismic response prediction ML models for a nuclear power plant structure, accounting for aging deterioration, were developed, and the prediction performance of each model was evaluated. The OPR1000 auxiliary building was selected as the example structure, and 500 artificial ground accelerations were generated. Time history analyses were conducted to create datasets for training and testing of the ML models. To incorporate the effects of aging on reinforced concrete structures, changes in material properties such as elastic modulus, Poisson’s ratio, density, and damping ratio were considered as input variables in building the database. Thirteen widely used earthquake intensity measures were also utilized as input variables to represent the characteristics of the artificial seismic loads, while the floor response spectrum was selected as the output.
Seismic response prediction models for the example NPP structure, considering aging deterioration, were developed using six machine learning algorithms commonly applied in structural engineering. Among these, the DT model demonstrated the lowest prediction accuracy, with a coefficient of determination (R2) of 0.81. The kNN and XGBoost models showed improved accuracy, achieving R2 values of 0.84 and 0.88, respectively. The RF and SVM models both achieved R2 values of 0.90, indicating better prediction performance compared to the previous three models. Finally, the NN model exhibited the best prediction performance, with a coefficient of determination of 0.94.
Since each time history analysis for constructing the database takes 3 to 4 h in this study, it is essential to minimize the dataset size required for training. To address this, feature selection and feature extraction techniques were applied to reduce the input dimension of the ML model. This study confirmed that a machine learning model with reduced input variables exhibited comparable prediction performance, even when trained with only 50% of the database required for the model incorporating all 17 input variables. Among the input dimensionality reduction techniques, the Partial Least Squares (PLS) method demonstrated the most effective performance. By reducing the 17 total input features to just 5 components, an efficient PLS-NN model was developed, significantly reducing database construction time while maintaining prediction accuracy.
The purpose of this study is to establish a baseline ML framework for seismic response prediction in aging NPP structures. The trained model is intended for use in future seismic fragility assessments of the OPR1000 structure. The methodology and workflow proposed in this study can be adapted to other nuclear systems when appropriate structural models and seismic datasets become available.
While this study focuses on the aging of structural material degradation, functional degradation, such as aging of control systems, sensor malfunctions, and equipment-level deterioration also plays a significant role in seismic responses. Therefore, future research will also try to integrate both material-level deterioration and functional degradation to more comprehensively assess the seismic performance of NPP systems under aging effects.
Author Contributions
Conceptualization, H.K. and S.L.; methodology, S.L. and J.J.; software, H.K. and S.A.; validation, H.K. and S.A.; writing—original draft preparation, H.K. and J.J.; writing—review and editing, H.K., S.L., J.J. and S.A.; visualization, S.L. and J.J.; funding acquisition, H.K. All authors have read and agreed to the published version of the manuscript.
Funding
This work was supported by the Korea Institute of Energy Technology Evaluation and Planning (KETEP) grant funded by the Korean government (MOTIE) (No. RS-2022-KP002849).
Institutional Review Board Statement
Not applicable.
Informed Consent Statement
Not applicable.
Data Availability Statement
The data presented in our study are available on request from the corresponding author.
Acknowledgments
The authors acknowledge the use of OpenAI’s ChatGPT (GPT-4o) in assisting with language and conceptual clarity when drafting algorithm descriptions.
Conflicts of Interest
The authors declare no conflicts of interest.
References
- Lee, Y.; Kim, J.H.; Park, H.G. Seismic fragility analysis of anchorage failure in nuclear power plant structure. J. Korea Concr. Inst. 2022, 34, 321–331. (In Korean) [Google Scholar] [CrossRef]
- Choi, I.K. Review and proposal for seismic safety assessment of nuclear power plants against beyond design basis earthquake. Trans. Korean Soc. Press. Vessel. Pip. 2017, 13, 1–15. (In Korean) [Google Scholar]
- Wakefield, W.; Ravindra, M.; Merz, K.; Hardy, G. Seismic Probabilistic Risk Assessment Implementation Guide; Electric Power Research Institute: Palo Alto, CA, USA, 2003. [Google Scholar]
- Lee, S.; Kwag, S.; Ju, B.S. A development of seismic fragility curve of box-type squat shear walls using data-driven surrogate model techniques. Int. J. Energy Res. 2024, 2024, 5872960. [Google Scholar] [CrossRef]
- Jia, D.W.; Wu, Z.Y. Seismic fragility analysis of RC frame-shear wall structure under multidimensional performance limit state based on ensemble neural network. Eng. Struct. 2021, 246, 112975. [Google Scholar] [CrossRef]
- Kiani, J.; Camp, C.; Pezeshk, S. On the application of machine learning techniques to derive seismic fragility curves. Comput. Struct. 2019, 218, 108–122. [Google Scholar] [CrossRef]
- Kazemi, F.; Asgarkhani, N.; Jankowski, R. Machine learning-based seismic response and performance assessment of reinforced concrete buildings. Arch. Civ. Mech. Eng. 2023, 23, 94. [Google Scholar] [CrossRef]
- Thai, H.T. Machine learning for structural engineering: A state-of-the-art review. Structures 2022, 38, 448–491. [Google Scholar] [CrossRef]
- Kim, H.S.; Kim, Y.; Lee, S.Y.; Jang, J.S. Development of machine learning based seismic response prediction model for shear wall structure considering aging deteriorations. J. Korean Assoc. Spat. Struct. 2024, 24, 83–90. (In Korean) [Google Scholar] [CrossRef]
- Harirchian, E.; Aghakouchaki Hosseini, S.E.; Novelli, V.; Lahmer, T.; Rasulzade, S. Utilizing advanced machine learning approaches to assess the seismic fragility of non-engineered masonry structures. Results Eng. 2024, 21, 101750. [Google Scholar] [CrossRef]
- Afshar, A.; Nouri, G.; Ghazvineh, S.; Hosseini Lavassani, S.H. Machine-learning applications in structural response prediction: A review. Pract. Period. Struct. Des. Constr. 2024, 29, 03124002. [Google Scholar] [CrossRef]
- Harirchian, E.; Aghakouchaki Hosseini, S.E.; Jadhav, K.; Kumari, V.; Rasulzade, S.; Işık, E.; Wasif, M.; Lahmer, T. A review on application of soft computing techniques for the rapid visual safety evaluation and damage classification of existing buildings. J. Build. Eng. 2021, 43, 102536. [Google Scholar] [CrossRef]
- Ge, Q.; Li, C.; Yang, F. Research on the application of deep learning algorithm in the damage detection of steel structures. IEEE Access 2025, 13, 76732–76746. [Google Scholar] [CrossRef]
- Zain, M.; Dackermann, U.; Prasittisopin, L. Machine learning (ML) algorithms for seismic vulnerability assessment of school buildings in high-intensity seismic zones. Structures 2024, 70, 107639. [Google Scholar] [CrossRef]
- Gondaliya, K.M.; Vasanwala, S.A.; Desai, A.K.; Amin, J.A.; Bhaiya, V. Machine learning-based approach for assessing the seismic vulnerability of reinforced concrete frame building. J. Build. Eng. 2024, 97, 110785. [Google Scholar] [CrossRef]
- Noureldin, M.; Ali, A.; Sim, S.H.; Kim, J. A machine learning procedure for seismic qualitative assessment and design of structures considering safety and serviceability. J. Build. Eng. 2022, 50, 104190. [Google Scholar] [CrossRef]
- Bhatta, S.; Dang, J. Seismic damage prediction of RC buildings using machine learning. Earthq. Eng. Struct. Dyn. 2023, 52, 3504–3527. [Google Scholar] [CrossRef]
- Belytskyi, D.; Yermolenko, R.; Petrenko, K.; Gogota, O. Application of machine learning and computer vision methods to determine the size of NPP equipment elements in difficult measurement conditions. Mach. Energy 2023, 14, 42–53. [Google Scholar] [CrossRef]
- Gong, A.; Qiao, Z.; Li, X.; Lyu, J.; Li, X. A review on methods and applications of artificial intelligence on Fault Detection and Diagnosis in nuclear power plants. Prog. Nucl. Energy 2024, 177, 105474. [Google Scholar] [CrossRef]
- Wang, Y.; Zheng, Z.; Ji, D.; Pan, X.; Tian, A. Machine learning-driven probabilistic seismic demand model with multiple intensity measures and applicability in seismic fragility analysis for nuclear power plants. Soil Dyn. Earthq. Eng. 2023, 171, 107966. [Google Scholar] [CrossRef]
- Zheng, Z.; Wang, Y.; Pan, X.; Ji, D. Machine learning based damage state identification: A novel perspective on fragility analysis for nuclear power plants considering structural uncertainties. Earthq. Eng. Eng. Vib. 2025, 24, 201–222. [Google Scholar] [CrossRef]
- Taffese, W.Z.; Wally, G.B.; Magalhães, F.C.; Espinosa-Leal, L. Concrete aging factor prediction using machine learning. Mater. Today Commun. 2024, 40, 109527. [Google Scholar] [CrossRef]
- Li, Z.; Yoon, J.; Zhang, R.; Rajabipour, F.; Srubar, W.V., III; Dabo, I.; Radlińska, A. Machine learning in concrete science: Applications, challenges, and best practices. Npj Comput. Mater. 2022, 8, 127. [Google Scholar] [CrossRef]
- Hariri-Ardebili, M.A.; Sanchez, L.; Rezakhani, R. Aging of Concrete Structures and Infrastructures: Causes, Consequences, and Cures (C3). Adv. Mater. Sci. Eng. 2020, 2020, 9370591. [Google Scholar] [CrossRef]
- Arel, H.S.; Aydin, E.; Kore, S.D. Ageing management and life extension of concrete in nuclear power plants. Powder Technol. 2017, 321, 390–408. [Google Scholar] [CrossRef]
- Choi, J.H.; Kim, Y.S.; Gwon, S.; Edwards, P.; Rezaei, S.; Kim, T.; Lim, S.B. Characteristics of large-scale fault zone and quaternary fault movement in Maegok-dong, Ulsan. J. Eng. Geol. 2015, 24, 485–498. [Google Scholar] [CrossRef]
- Velliangiri, S.; Alagumuthukrishnan, S.; Iwin Thankumar Joseph, S. A Review of dimensionality reduction techniques for efficient computation. Procedia Comput. Sci. 2019, 165, 104–111. [Google Scholar] [CrossRef]
- Rezaeian, R.; Kiureghian, A.D. Simulation of synthetic ground motions for specified earthquake and site characteristics. Earthq. Eng. Struct. Dyn. 2010, 39, 1155–1180. [Google Scholar] [CrossRef]
- Kitsutaka, Y.; Tsukagoshi, M. Method on the aging evaluation in nuclear power plant concrete structures. Nucl. Eng. Des. 2014, 269, 286–290. [Google Scholar] [CrossRef]
- Field, K.G.; Remec, I.; Le Pape, Y. Radiation effects in concrete for nuclear power plants, Part I: Quantification of radiation exposure and radiation effects. Nucl. Eng. Des. 2015, 282, 126–143. [Google Scholar] [CrossRef]
- Le Pape, Y.; Field, K.G.; Remec, I. Radiation effects in concrete for nuclear power plants, Part II: Perspective from micromechanical modeling. Nucl. Eng. Des. 2015, 282, 144–157. [Google Scholar] [CrossRef]
- International Atomic Energy Agency. Ageing Management of Concrete Structures in Nuclear Power Plants; IAEA Nuclear Energy Series No. NP-T-3.5; IAEA: Vienna, Austria, 2016. [Google Scholar]
- Shah, D.; Bhavsar, H.; Shah, D. A comparative analysis of various machine learning algorithms on earthquake dataset. Procedia Comput. Sci. 2020, 167, 107–117. [Google Scholar]
- Chenyu, L.; Xinlian, Z.; Tanya, T.N.; Jinyuan, L.; Tsungchin, W.; Ellen, L.; Xin, M.T. Partial least squares regression and principal component analysis: Similarity and differences between two popular variable reduction approaches. Gen. Psychiatry 2022, 35, e100662. [Google Scholar]
Disclaimer/Publisher’s Note: The statements, opinions and data contained in all publications are solely those of the individual author(s) and contributor(s) and not of MDPI and/or the editor(s). MDPI and/or the editor(s) disclaim responsibility for any injury to people or property resulting from any ideas, methods, instructions or products referred to in the content. |
© 2025 by the authors. Licensee MDPI, Basel, Switzerland. This article is an open access article distributed under the terms and conditions of the Creative Commons Attribution (CC BY) license (https://creativecommons.org/licenses/by/4.0/).