1. Introduction
Seismic design codes generally receive significant attention, resulting in their periodic revision. These updates incorporate not only lessons learned from recent destructive earthquakes but also scientific advances related to new structural typologies, novel materials, and passive or active protection systems, among others [
1,
2,
3,
4,
5].
The seismic design factors applied to the various structural systems currently in use are, in most cases, determined arbitrarily, relying on expert judgment to assign practical values for design purposes. Several studies have addressed this issue extensively, and interested readers are referred to those works [
6,
7,
8,
9,
10,
11,
12,
13].
Following the publication of numerous scientific papers on the calibration and validation of seismic coefficients—and, in particular, the release of FEMA P695 [
14], which systematically introduced a methodology consistent with prevailing analysis and design practices—various initiatives have emerged, aiming to propose seismic design factors in an objective manner.
Although FEMA P695 was originally developed to support the determination of seismic design factors for new structural systems or those composed of innovative materials, the methodology has since been widely applied to the assessment and/or validation of design factors for structures designed in accordance with international standards.
Notable studies that have employed the FEMA P695 methodology to determine seismic design factors include the work by Fiorino et al. [
15], who evaluated the behavior factor
q (equivalent to the response reduction factor
R in American codes) of cold-formed steel (CFS) strap-braced stud walls. Özkılıç et al. [
16] used it to derive design factors for steel buckling-restrained braced frames (BRBFs), while Toufigh and Arzeytoon [
17] quantified performance factors for ribbed bracing systems using simplified archetypes. Similarly, Bakhshivand et al. [
18] investigated the performance factors of dual-steel SMF–SCBF systems, and Shirpour et al. [
19] studied those of quarter-elliptic-braced steel moment frames (QEB-MFs), also using 2D models. More recently, Hadinejad et al. [
20] examined combined SCBF–SMF steel building systems.
The FEMA P695 methodology has also been used for the collapse assessment of specific structural configurations. For instance, Heshmati et al. [
21] analyzed the collapse margin of steel structures subjected to near-fault ground motions. Shakeel et al. [
22] studied CFS shear walls with gypsum board sheathing designed according to the Eurocodes, aiming to advance performance-based design. Song and Xing [
23] applied the methodology to self-centering shear walls to evaluate their collapse capacity.
Other relevant case studies include that of Sadeghpour and Ozay [
24], who applied the methodology to obtain design factors for buildings combining reinforced concrete and steel components modeled in 2D. Another study on mixed structures was presented by Kiani et al. [
25]. The methodology has even been used to calculate seismic design factors for irregular structural configurations, such as in the study by Makhdoom et al. [
26]. Habashizadeh et al. [
27] explored hybrid buildings with reinforced concrete columns and steel beams using planar archetypes and FEMA P695.
With regard to the structural system addressed in this study, Mahrous et al. [
28] assessed the performance factors of reinforced concrete shear walls with boundary elements using simplified 3D models. This typology had previously been studied by Gogus and Wallace [
29] using FEMA P695, with a focus on the influence of the wall aspect ratio. Broberg et al. [
30] also conducted research on rigid buildings, but in their case, they examined concrete-filled steel plate structures to determine the corresponding seismic design factors.
Recent studies have proposed novel refinements to seismic analysis methodologies that align with the goals of this research. Ruggieri and Uva [
31] explored the extension of response spectrum analysis concepts to nonlinear static analysis, evaluating their applicability in cases of irregular RC buildings. Their findings suggested that code-proposed loading profiles based on modal distributions can be efficient alternatives to traditional triangular patterns, particularly for buildings with geometric irregularities. Meanwhile, Vukobratović and Ruggieri [
32] addressed the influence of higher vibration modes and nonlinear non-structural components on floor acceleration demands in RC shear wall buildings, demonstrating the importance of the accurate representation of dynamic responses for performance-based assessments.
Topographic effects have been widely recognized as a significant modifier of seismic ground motion, capable of amplifying demands on hillside structures. Several studies have demonstrated that amplification depends strongly on slope geometry, wave incidence, and subsurface heterogeneity. Di Lernia et al. [
33] proposed a method to decouple the contributions of topography, stratigraphy, and valley effects, showing that amplification factors can locally exceed 1.7 depending on the terrain configuration. Qi et al. [
34] identified two distinct dynamic response patterns in single-surface slopes based on a critical height-to-wavelength ratio, highlighting the influence of slope height on peak ground acceleration. Similarly, Primofiore et al. [
35] showed that simplified 2D models may underestimate amplification in asymmetric ridge topographies, advocating for full 3D simulations in seismic microzonation. Parametric analyses by Kamalian et al. [
36] and Kumar et al. [
37] further confirmed that the shape ratio, wave polarization, and topographic complexity significantly affect the seismic response, often leading to amplification levels that exceed those captured by conventional code-based site classifications. These topographic effects are not explicitly incorporated into the FEMA P695 methodology.
Topographic amplification is a well-documented phenomenon that can significantly affect the seismic demand on hillside structures. One of the earliest and most relevant case studies in Chile was presented by Celebi [
38], who reported amplification effects during the 1985 Central Chile earthquake (Mw 7.8), particularly in the Canal Beagle subdivision near Viña del Mar. There, three- to five-story buildings located on ridges suffered extensive damage, which correlated with a recorded spectral amplification in the 2–4 Hz range, frequencies that matched the fundamental modes of the damaged structures. These observations, derived from dense temporary arrays, highlighted the importance of topographic features in altering ground motion characteristics and called for improved code provisions. Despite these findings, current Chilean seismic codes lack explicit mechanisms to account for slope-induced amplification. The present study built on this historical context by assessing the seismic performance of RC shear wall buildings located on sloping terrain using the FEMA P695 methodology, thereby addressing a critical gap between empirical evidence and design practice.
This study focused on reinforced concrete buildings with shear walls constructed on sloped terrain, a typology that is widely used in residential developments in Chile. Despite its prevalence, the current Chilean seismic design code does not provide specific provisions to account for the effects of slope on the structural response of buildings. A review of major international seismic design standards also revealed a general lack of explicit guidance for structures located on inclined ground, with a few exceptions, such as Eurocode 8 [
3].
In this context, while the FEMA P695 methodology has been extensively used to validate seismic design factors for various structural typologies, its original formulation does not explicitly consider the topographic effects or the geometric particularities of hillside buildings. Nonetheless, its methodological framework can be reasonably extended to such conditions, provided its limitations are recognized and its application is properly justified. In this study, the methodology was adopted as a robust tool to evaluate the influence of slope on the seismic design factors of shear wall buildings.
Urban development needs, particularly in cities with irregular topographies, have increasingly required the construction of buildings on steep natural slopes. The design of such structures involves different requirements compared with those on flat or gently sloped terrain. It has been established that a steep or complex topography can lead to the localized amplification of the seismic response, representing an additional demand on the structure compared with flat-terrain conditions [
39,
40,
41,
42,
43].
Accordingly, the seismic design of buildings located on steep slopes represents a significant technical challenge, as most current international seismic design codes—except for a few cases [
3]—do not explicitly consider the influence of slope on structural responses or design factors. In practice, the design criteria used for flat or low-slope sites are often directly applied to hillside structures, without accounting for the potential impact on seismic demand and structural safety. This study aimed to contribute to addressing this gap through a systematic evaluation of seismic design factors in reinforced concrete shear wall buildings, considering varying slope inclinations. The results provide a foundation for the improved estimation of the seismic demand and structural response in these particular settings.
Buildings located on sloping terrain exhibit several features that affect their seismic behavior due to topography-induced asymmetry and geometric adaptations to the terrain [
44,
45]. Recent research has shown that the presence of slopes can lead to the local amplification of seismic motions due to soil–structure interaction effects and changes in the vibration modes of buildings [
46,
47,
48]. It has been found that hillside buildings may experience increased interstory drifts and higher internal force demands in shear walls, which could compromise structural safety if not properly addressed in designs [
49,
50,
51].
It should be noted that although the FEMA P695 methodology does not explicitly address its application to sites that may exhibit topographic effects, its methodological structure allows for adaptation to buildings located on sloping terrain, which are potentially susceptible to topography-induced seismic amplifications. In the present study, these effects were decoupled due to the high complexity involved in coupling the three-dimensional modeling of the ground response with structural performance analysis. This decision also made it possible to more clearly isolate the influence of slope on structural performance. Nevertheless, it is acknowledged that omitting such effects may lead to an underestimation of the seismic demand in areas with a pronounced topography. Based on the above, future studies could complement this approach through simplified strategies that consider topographic influence, such as semi-empirical amplification factors based on terrain inclination, or through advanced soil–structure interaction models, provided the project has access to sufficient expertise and computational resources.
The seismic design of hillside buildings remains a topic that is still underrepresented in international design codes, despite the extensive documentation of slope effects on structural responses in recent studies [
52,
53,
54]. In this context, the present study sought to contribute to knowledge in this area by applying the FEMA P695 methodology to evaluate seismic design factors in shear wall buildings located on sloped terrain, with the aim of optimizing their structural performance under seismic events. The results highlight the need to differentiate design factors based on the direction of analysis with respect to the slope and propose specific adjustments that improve the estimation of the seismic demand and structural safety for these types of structures.
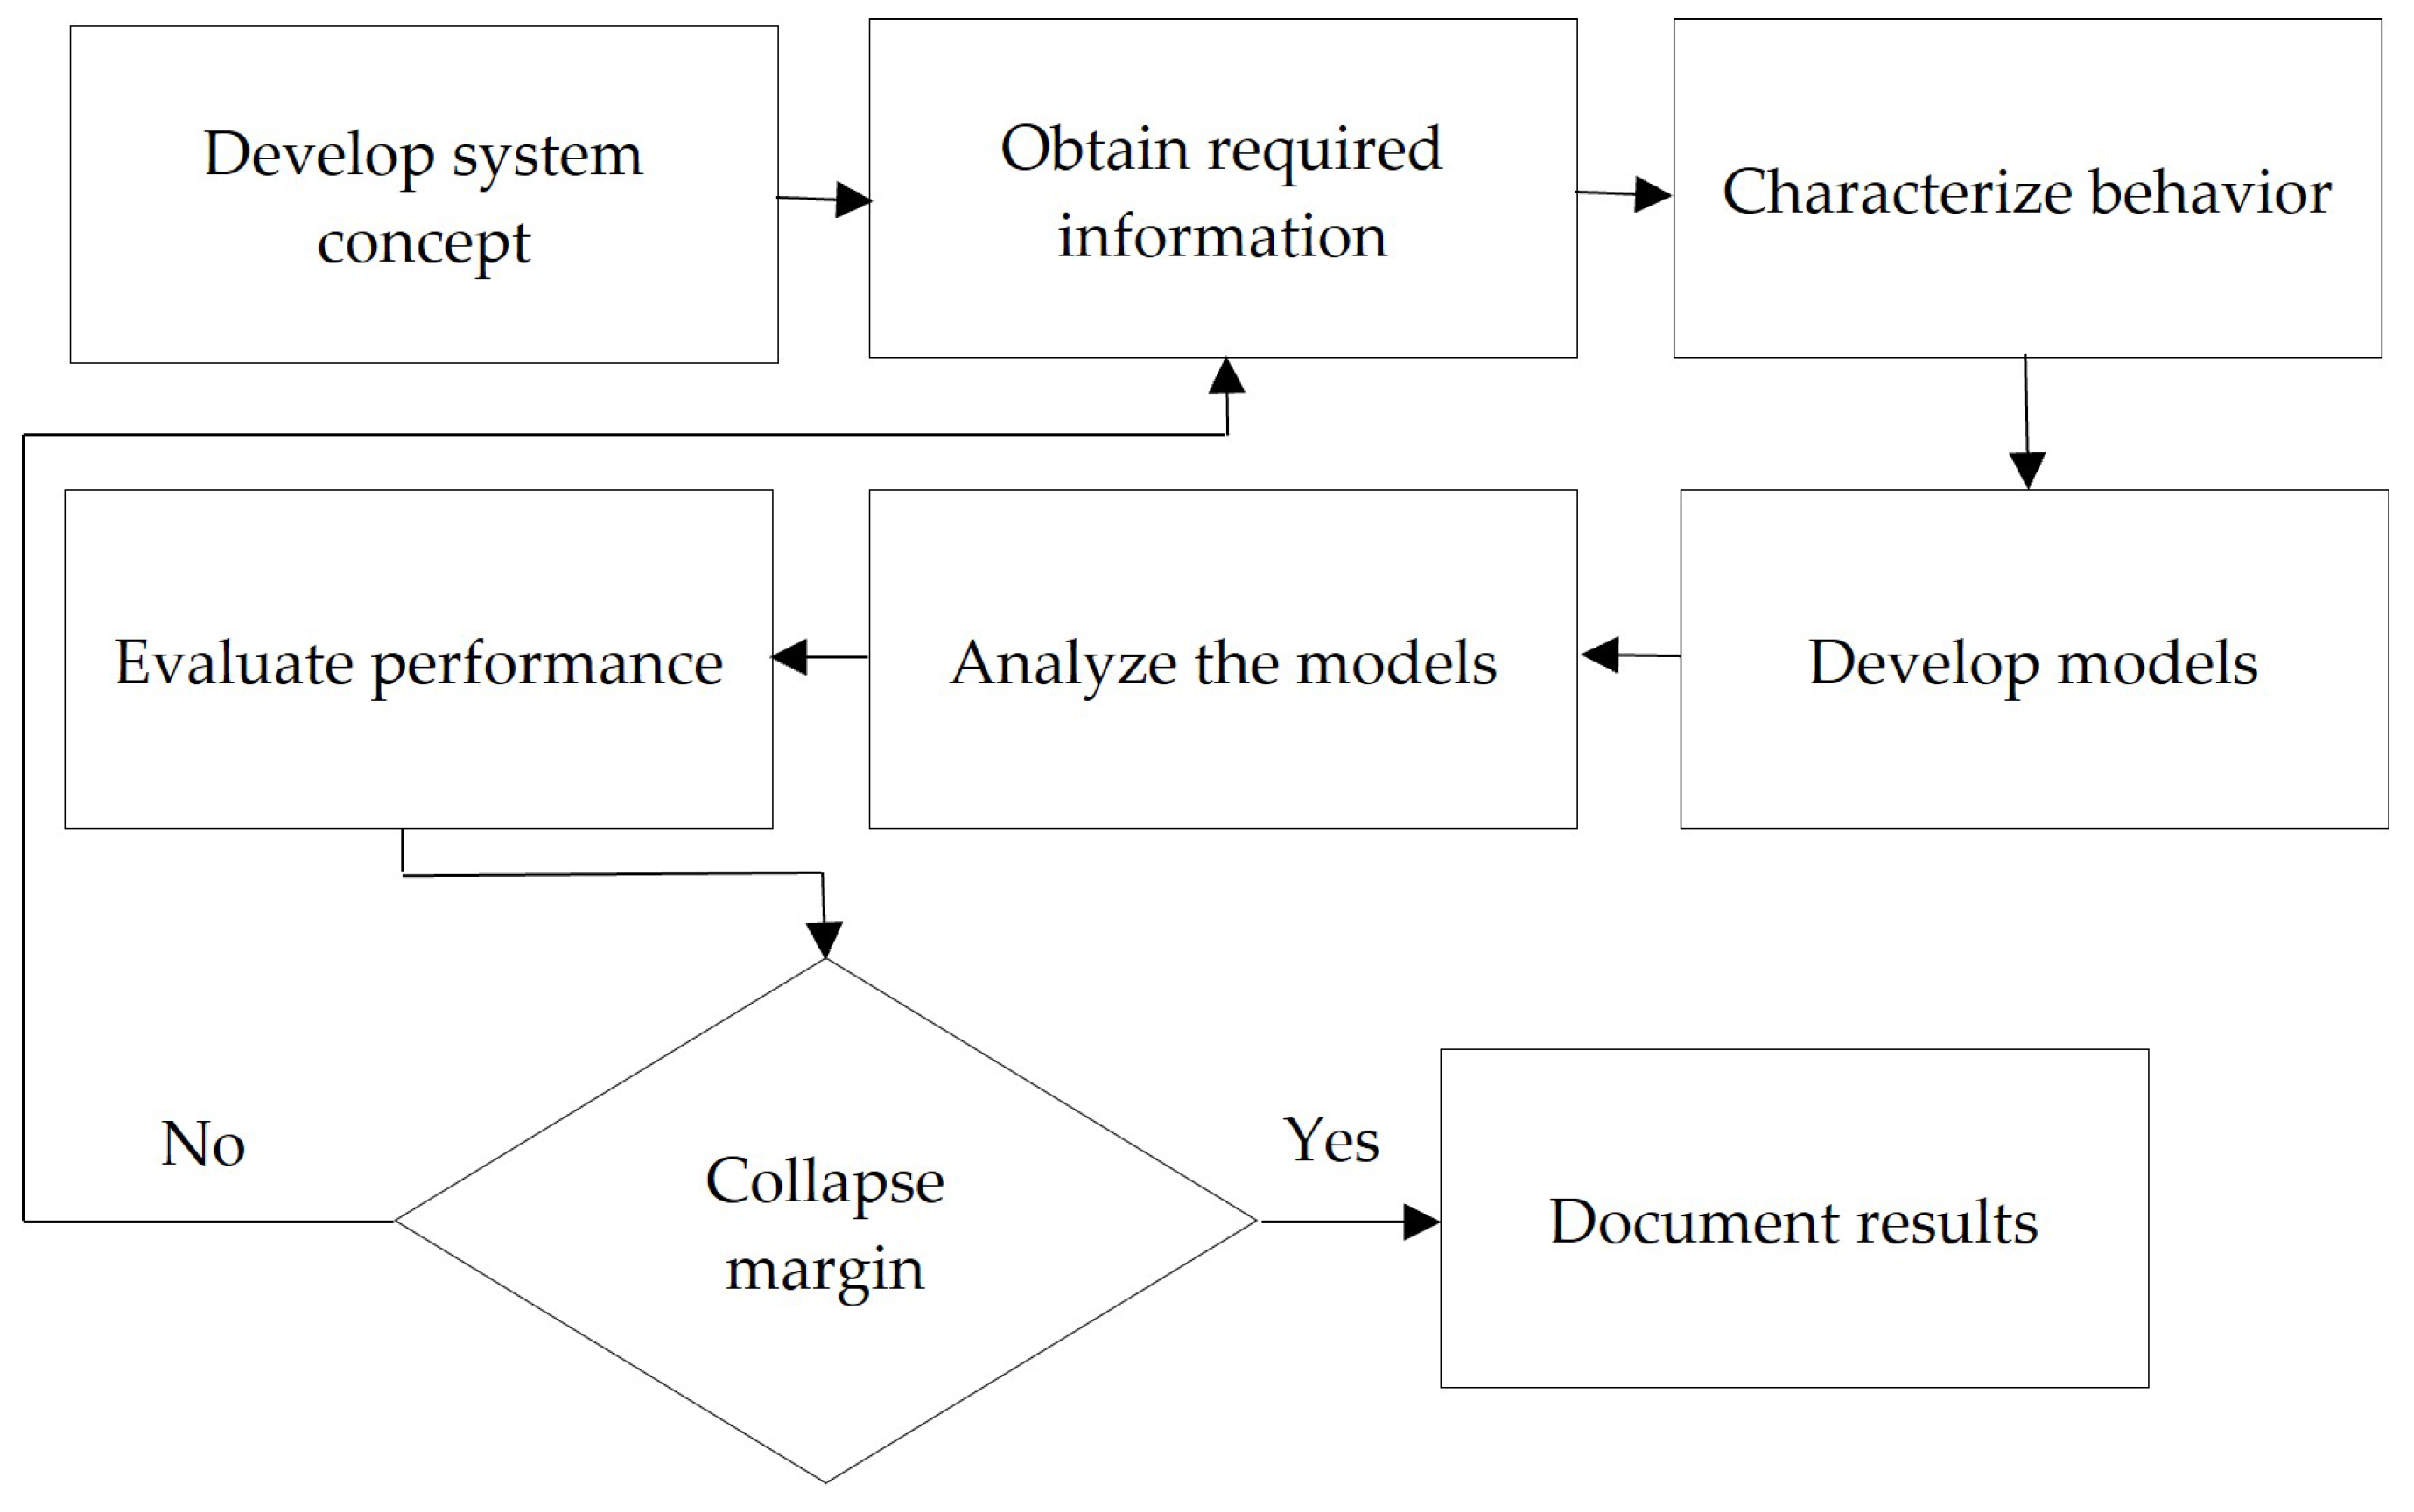
2. Methodology
In general terms, the methodology applied in this study was based on the framework defined in the FEMA P695 document, which allows for the systematic and objective determination of seismic performance factors for various structural typologies and/or materials used in modern seismic-resistant designs of buildings. Although its original application does not explicitly consider hillside structures, its analytical framework is sufficiently flexible to be employed in such contexts. In this work, the methodology was implemented with an emphasis on assessing how seismic design factors vary with different slope inclinations, thereby exploring their validity and applicability under topographic conditions that are rarely addressed in traditional design codes. The overall FEMA P695 methodology is summarized in
Figure 1.
This study began with the development of a set of structural archetypes that represented the specific structural typology under investigation, aiming to validate seismic design parameters and propose improvements where necessary. If the applicable design code lacks defined seismic parameters, the methodology also serves as a solid foundation for their objective determination based on a comprehensive set of analyses.
The methodology primarily relies on two types of nonlinear analyses: pushover analysis and incremental dynamic analysis (IDA). Based on the results of these analyses, and within a framework that implicitly accounts for the uncertainties related to both the structural system and the seismic input, a set of parameters is derived. These parameters enable the validation of existing design coefficients and the identification of additional coefficients that support the structural analysis and design process. The overall objective is to prevent structural systems from exceeding the collapse limit state by employing a collapse margin ratio (CMR).
The main goal of this research was to determine and/or validate the seismic design parameters typically used in linear design procedures prescribed by major international seismic codes, such as the response reduction factor (), the displacement amplification factor (), and the overstrength factor (). These coefficients represent, from the perspective of the structural designer, the material properties and the detailing level of the structural system. In particular, this study evaluated how these factors are affected by the presence of sloping terrain, with the aim of providing technical criteria for their adjustment or validation in complex topographic conditions. The following sections present the relevant methodological details.
2.1. Definition of Archetypes
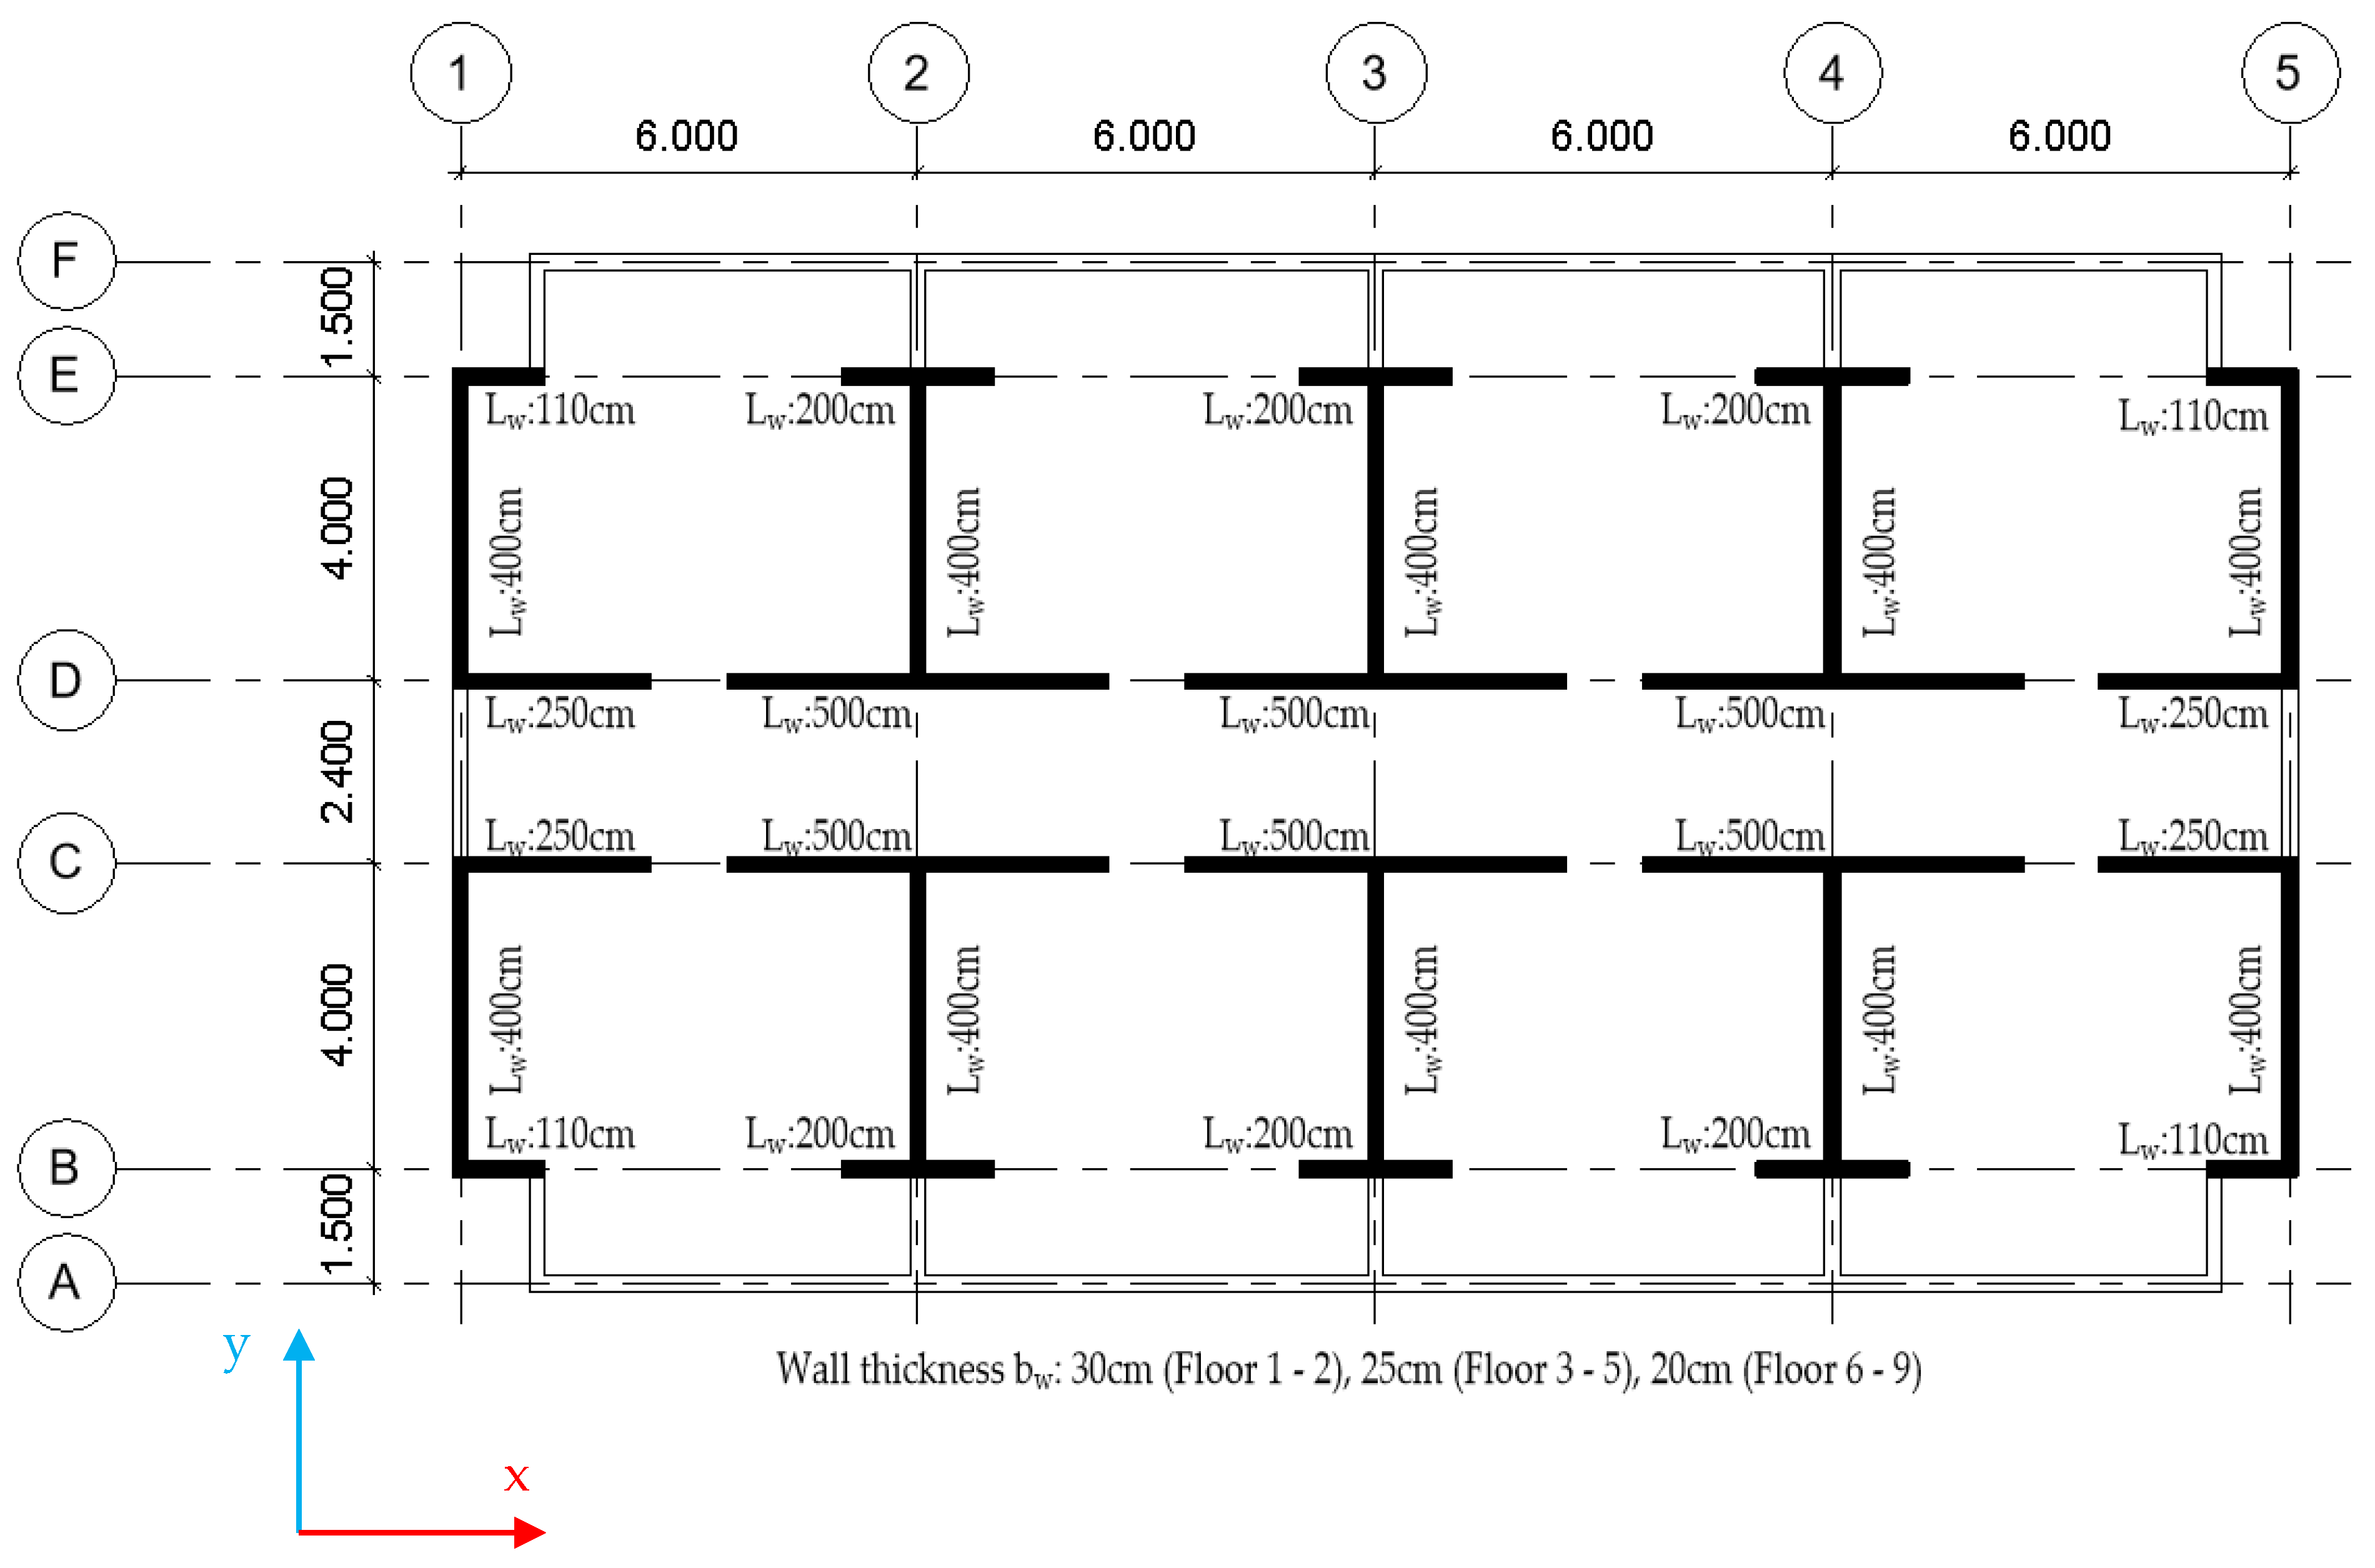
To study the seismic response of shear wall buildings located on sloped ground, a set of archetypes was developed to represent the architectural typology typically used for mid-rise residential buildings, following a structural layout commonly employed in Chile.
The archetypes considered in this research consisted of four nine-story buildings, each structured with reinforced concrete shear walls in both orthogonal directions, and with reinforced concrete beams and slabs. A simple structural configuration was adopted, starting from a symmetric distribution of the walls in both directions.
Figure 2 shows a floor plan view of this configuration, along with the coordinate axis system used to define the two orthogonal directions of the building structure. It is important to note that the structural response in both directions was analyzed independently, since different slope inclinations induced changes in the dynamic characteristics in the direction perpendicular to the slope (the x-axis in
Figure 2).
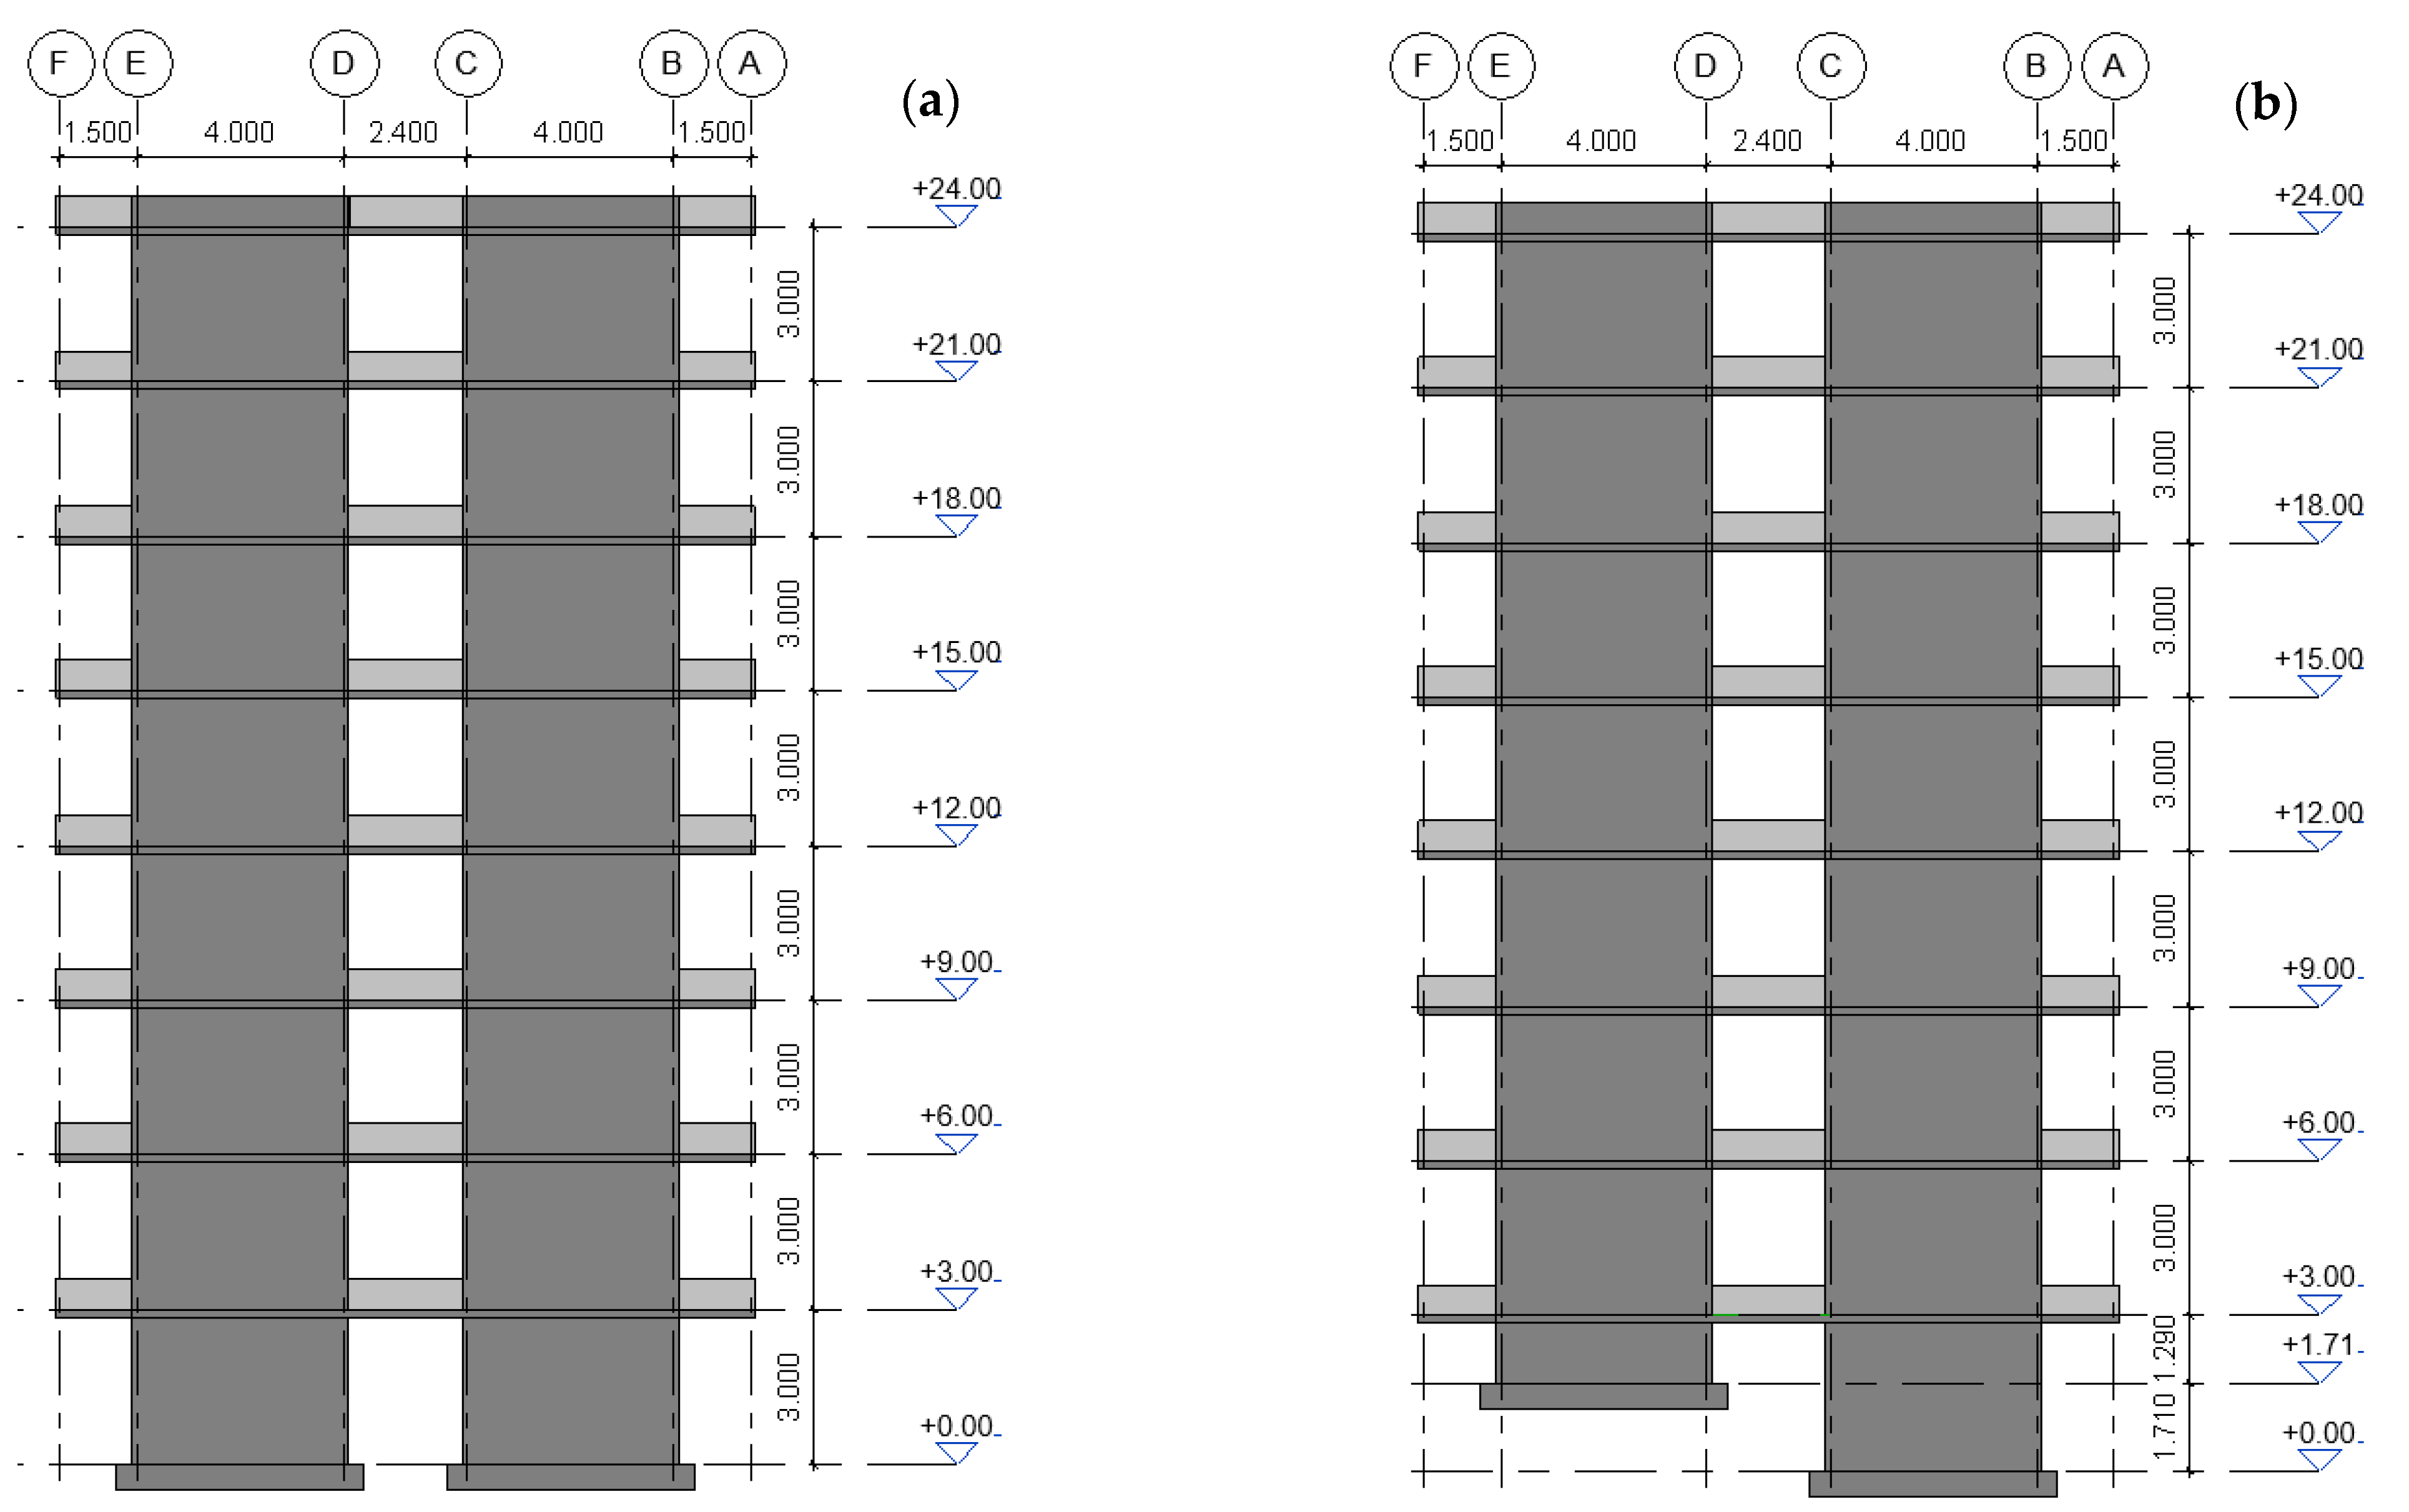
The reference case was a prismatic building with identical floor plans at all levels, as shown in
Figure 3. This structure represented the baseline configuration, assumed to be founded on flat ground. From this initial archetype, three additional configurations were derived by varying the slope angle to 15°, 30°, and 45°. In all cases, the building was assumed to geometrically conform to the natural slope of the terrain, meaning it was directly embedded on the hillside without the use of terraces, intermediate platforms, or cut-and-fill operations.
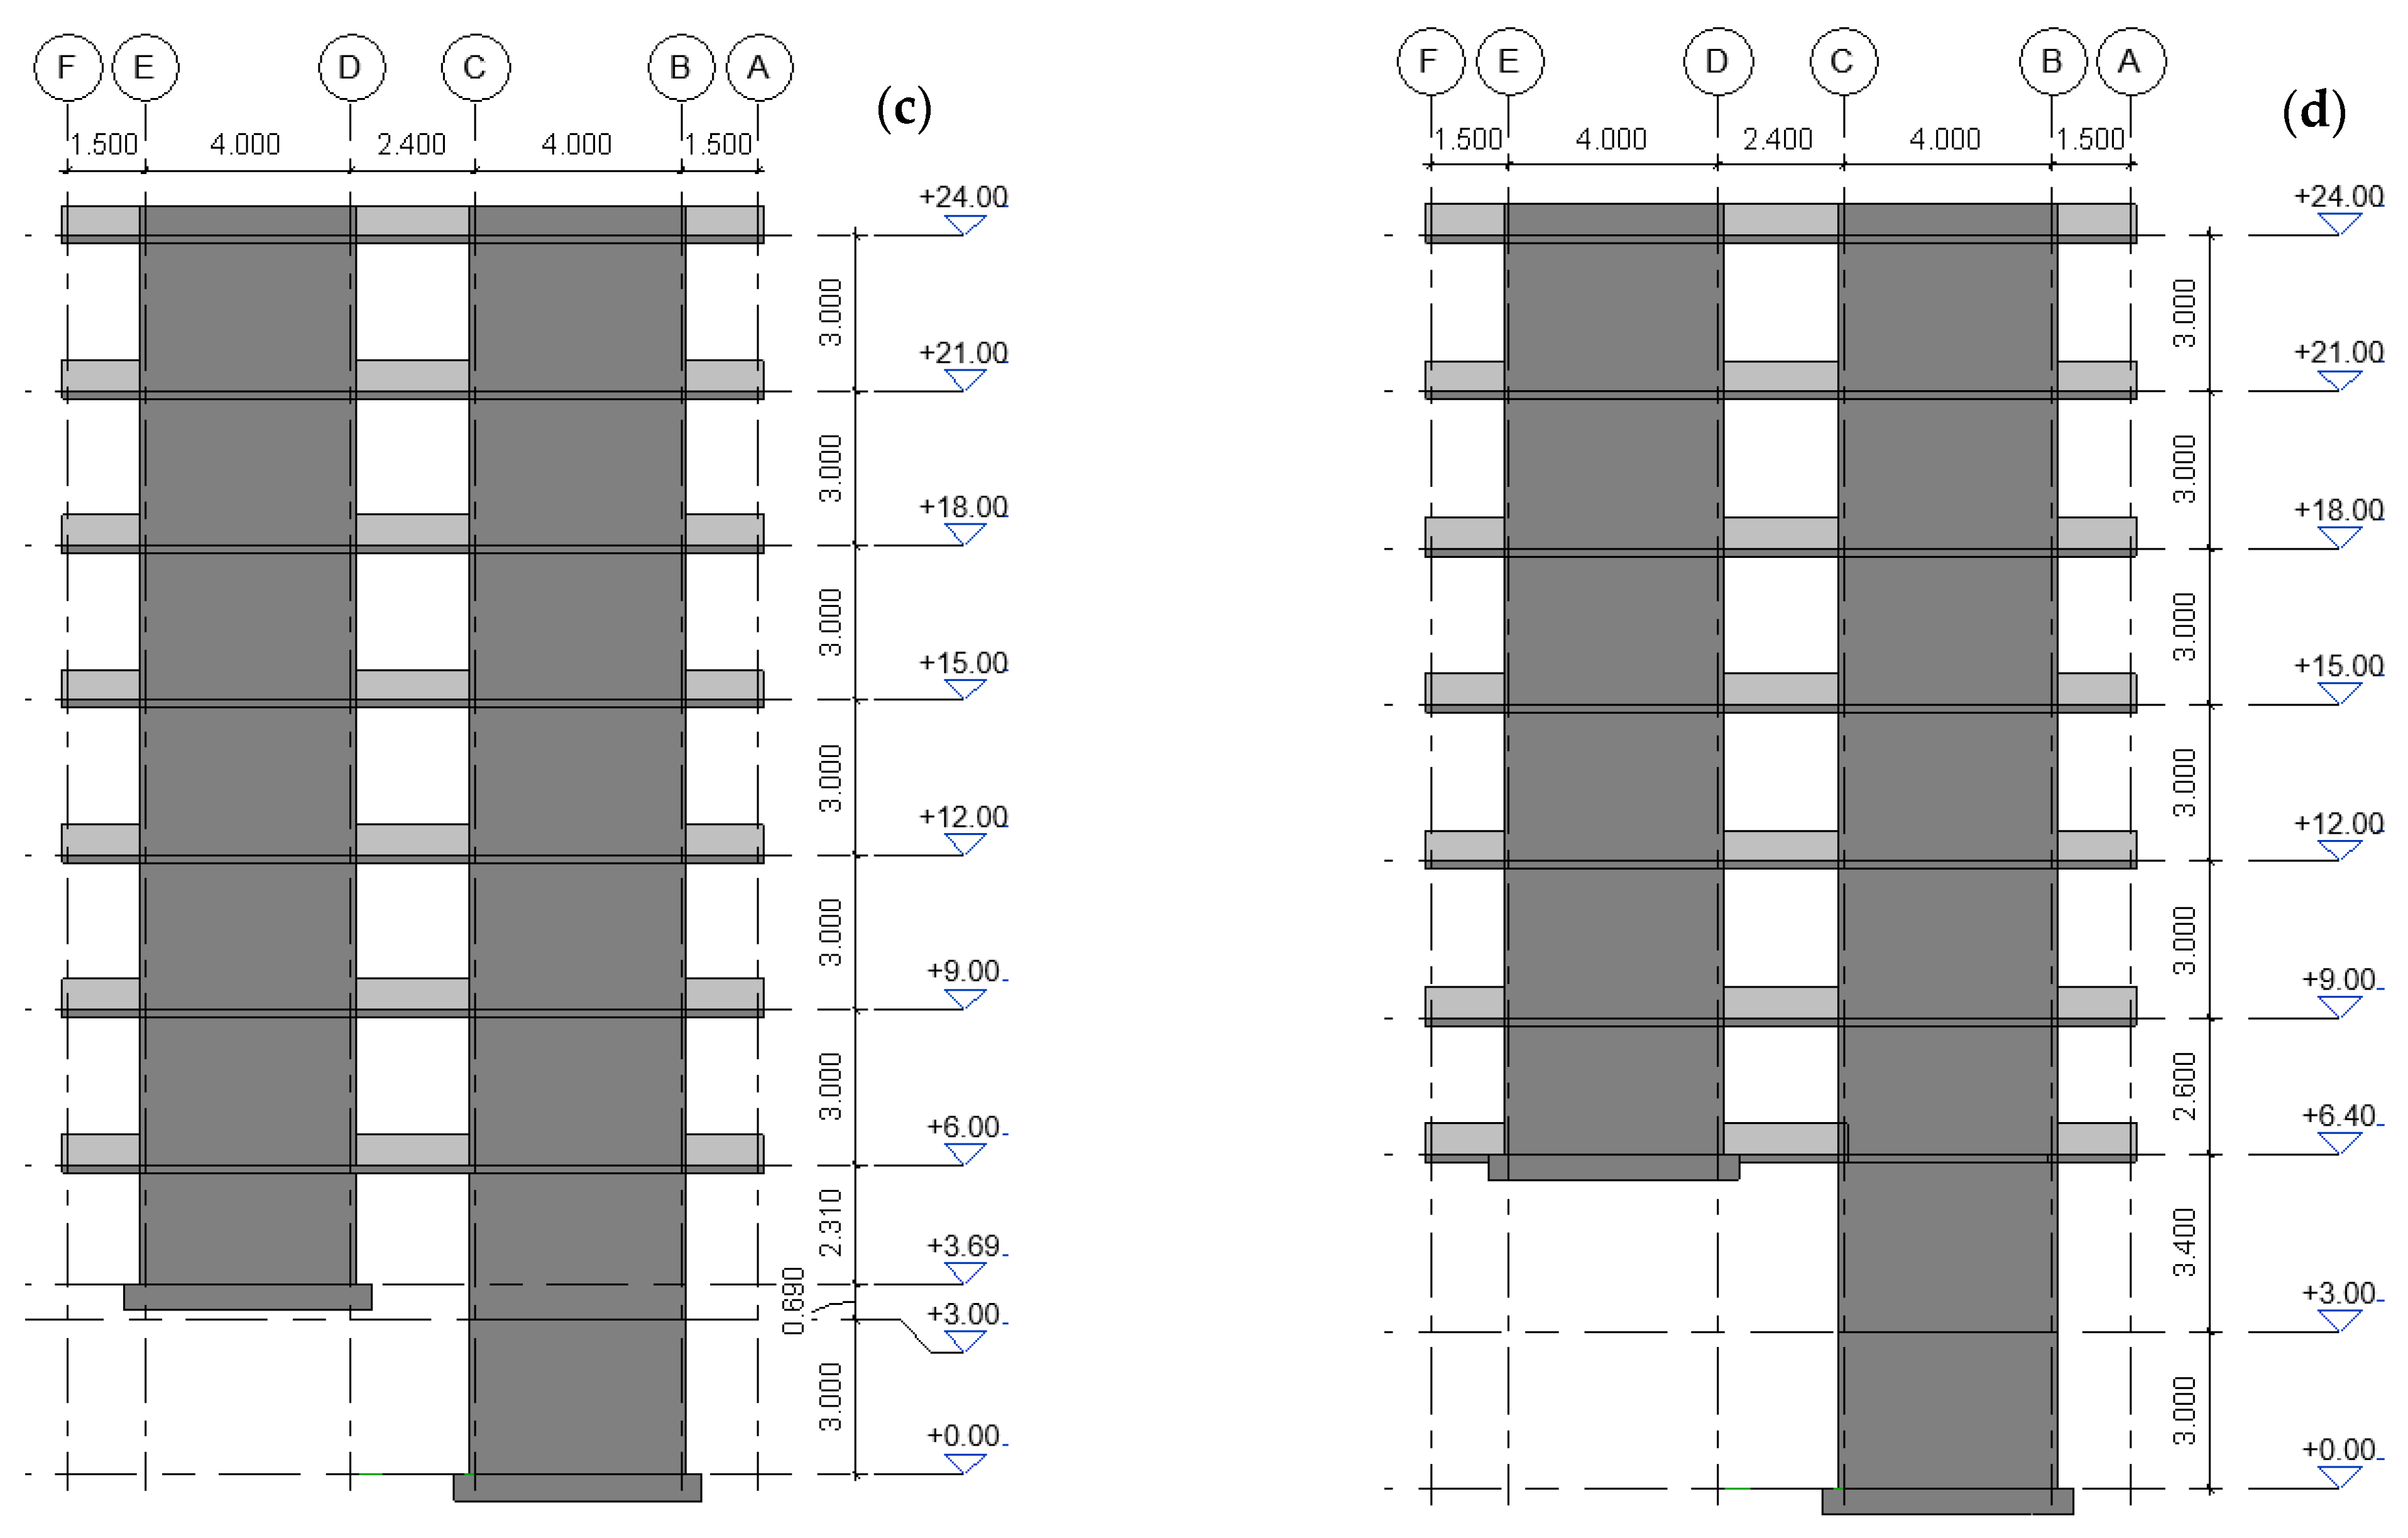
It should be noted that the slope of the terrain induced significant modifications in the geometry of the structures. To better illustrate how the terrain inclination affected the configuration of the archetypes,
Figure 4 shows the elevation views of the four models. As seen in
Figure 4b, the shear walls in the last bay of the archetype, founded on a 15° slope, were reduced to adapt to the terrain. A similar situation occurred for the archetype on a 30° slope, though the modifications were more severe, as the slab at the first level had to be reduced due to the removal of the supporting shear walls at the rear of the building.
A comparable scenario was observed in the archetype placed on a 45° slope, where the geometric adjustments were even more substantial, not only due to the elimination of wall segments at certain levels but also because of the consequent reduction in slab areas that could no longer rely on those walls for support.
2.2. Analysis and Design of Archetypes
Once the geometries of the archetypes were defined, a structural analysis was carried out. The material properties used for the analysis and subsequent design are presented in
Table 1. The loads considered in the models were derived from Chilean standards NCh433 [
55] and NCh1537 [
56], which govern seismic and gravitational loads, respectively, for residential buildings. The gravitational loads were divided into dead and live loads, with dead loads including partition walls and topping slabs, and live loads defined based on the typical usage for residential occupancy. The values used are summarized in
Table 2.
The structural analysis was performed using a linear analytical model developed with the commercial software ETABS [
57], in which the modeling included the following considerations:
Walls and slabs were modeled as four-node “Shell” elements.
Beams were modeled as two-node “Frame” elements.
Boundary conditions at the base were assumed to be simply supported.
The horizontal force-resisting system was explicitly modeled using the reinforced concrete slab, assuming a rigid diaphragm behavior.
Although the numerical models assumed fixed-base conditions for the buildings, aligned with common practice in FEMA-based evaluations, site classification was critical for defining the intensity and characteristics of ground motion input. Consequently, while soil–structure interaction (SSI) effects were not explicitly modeled in the structural simulations, the role of the soil was appropriately incorporated through ground motion selection, thereby ensuring consistency between the seismic hazard characterization and the structural performance evaluation framework.
Although the numerical models used in this study assumed fixed-base conditions—an approach commonly adopted in FEMA P695-based evaluations—this simplification was considered reasonable given the site’s classification as soil type C (with a Vs30 between 350 and 500 m/s), corresponding to relatively stiff deposits where soil–structure interaction (SSI) effects are typically less significant. However, it is acknowledged that in sloping terrain, especially where abrupt stiffness transitions or geotechnical variability exist, the SSI could influence the fundamental periods, reduce the effective stiffness of the system, and affect the collapse margin ratio (CMR), potentially impacting structural safety margins. In this study, SSI effects were not incorporated because their inclusion would have required a reformulation of the structural models through more complex couplings, which fell beyond the methodological scope applied. In future work, SSIs could be considered using simplified models with calibrated equivalent springs, or through fully coupled numerical schemes incorporating three-dimensional soil modeling, particularly in contexts where the dynamic behavior of the ground may significantly influence the structural response.
Regarding the stiffness of the mathematical model, the Chilean code does not prescribe the use of a stiffness modifier to consider cracking in the concrete, using gross section properties instead. However, the following structure design criteria consider the ACI-318-08 [
58] prescriptions in Section 8.8.2, which specify 50% of the gross section properties, which represent the effect of cracking under the effects of a seismic event.
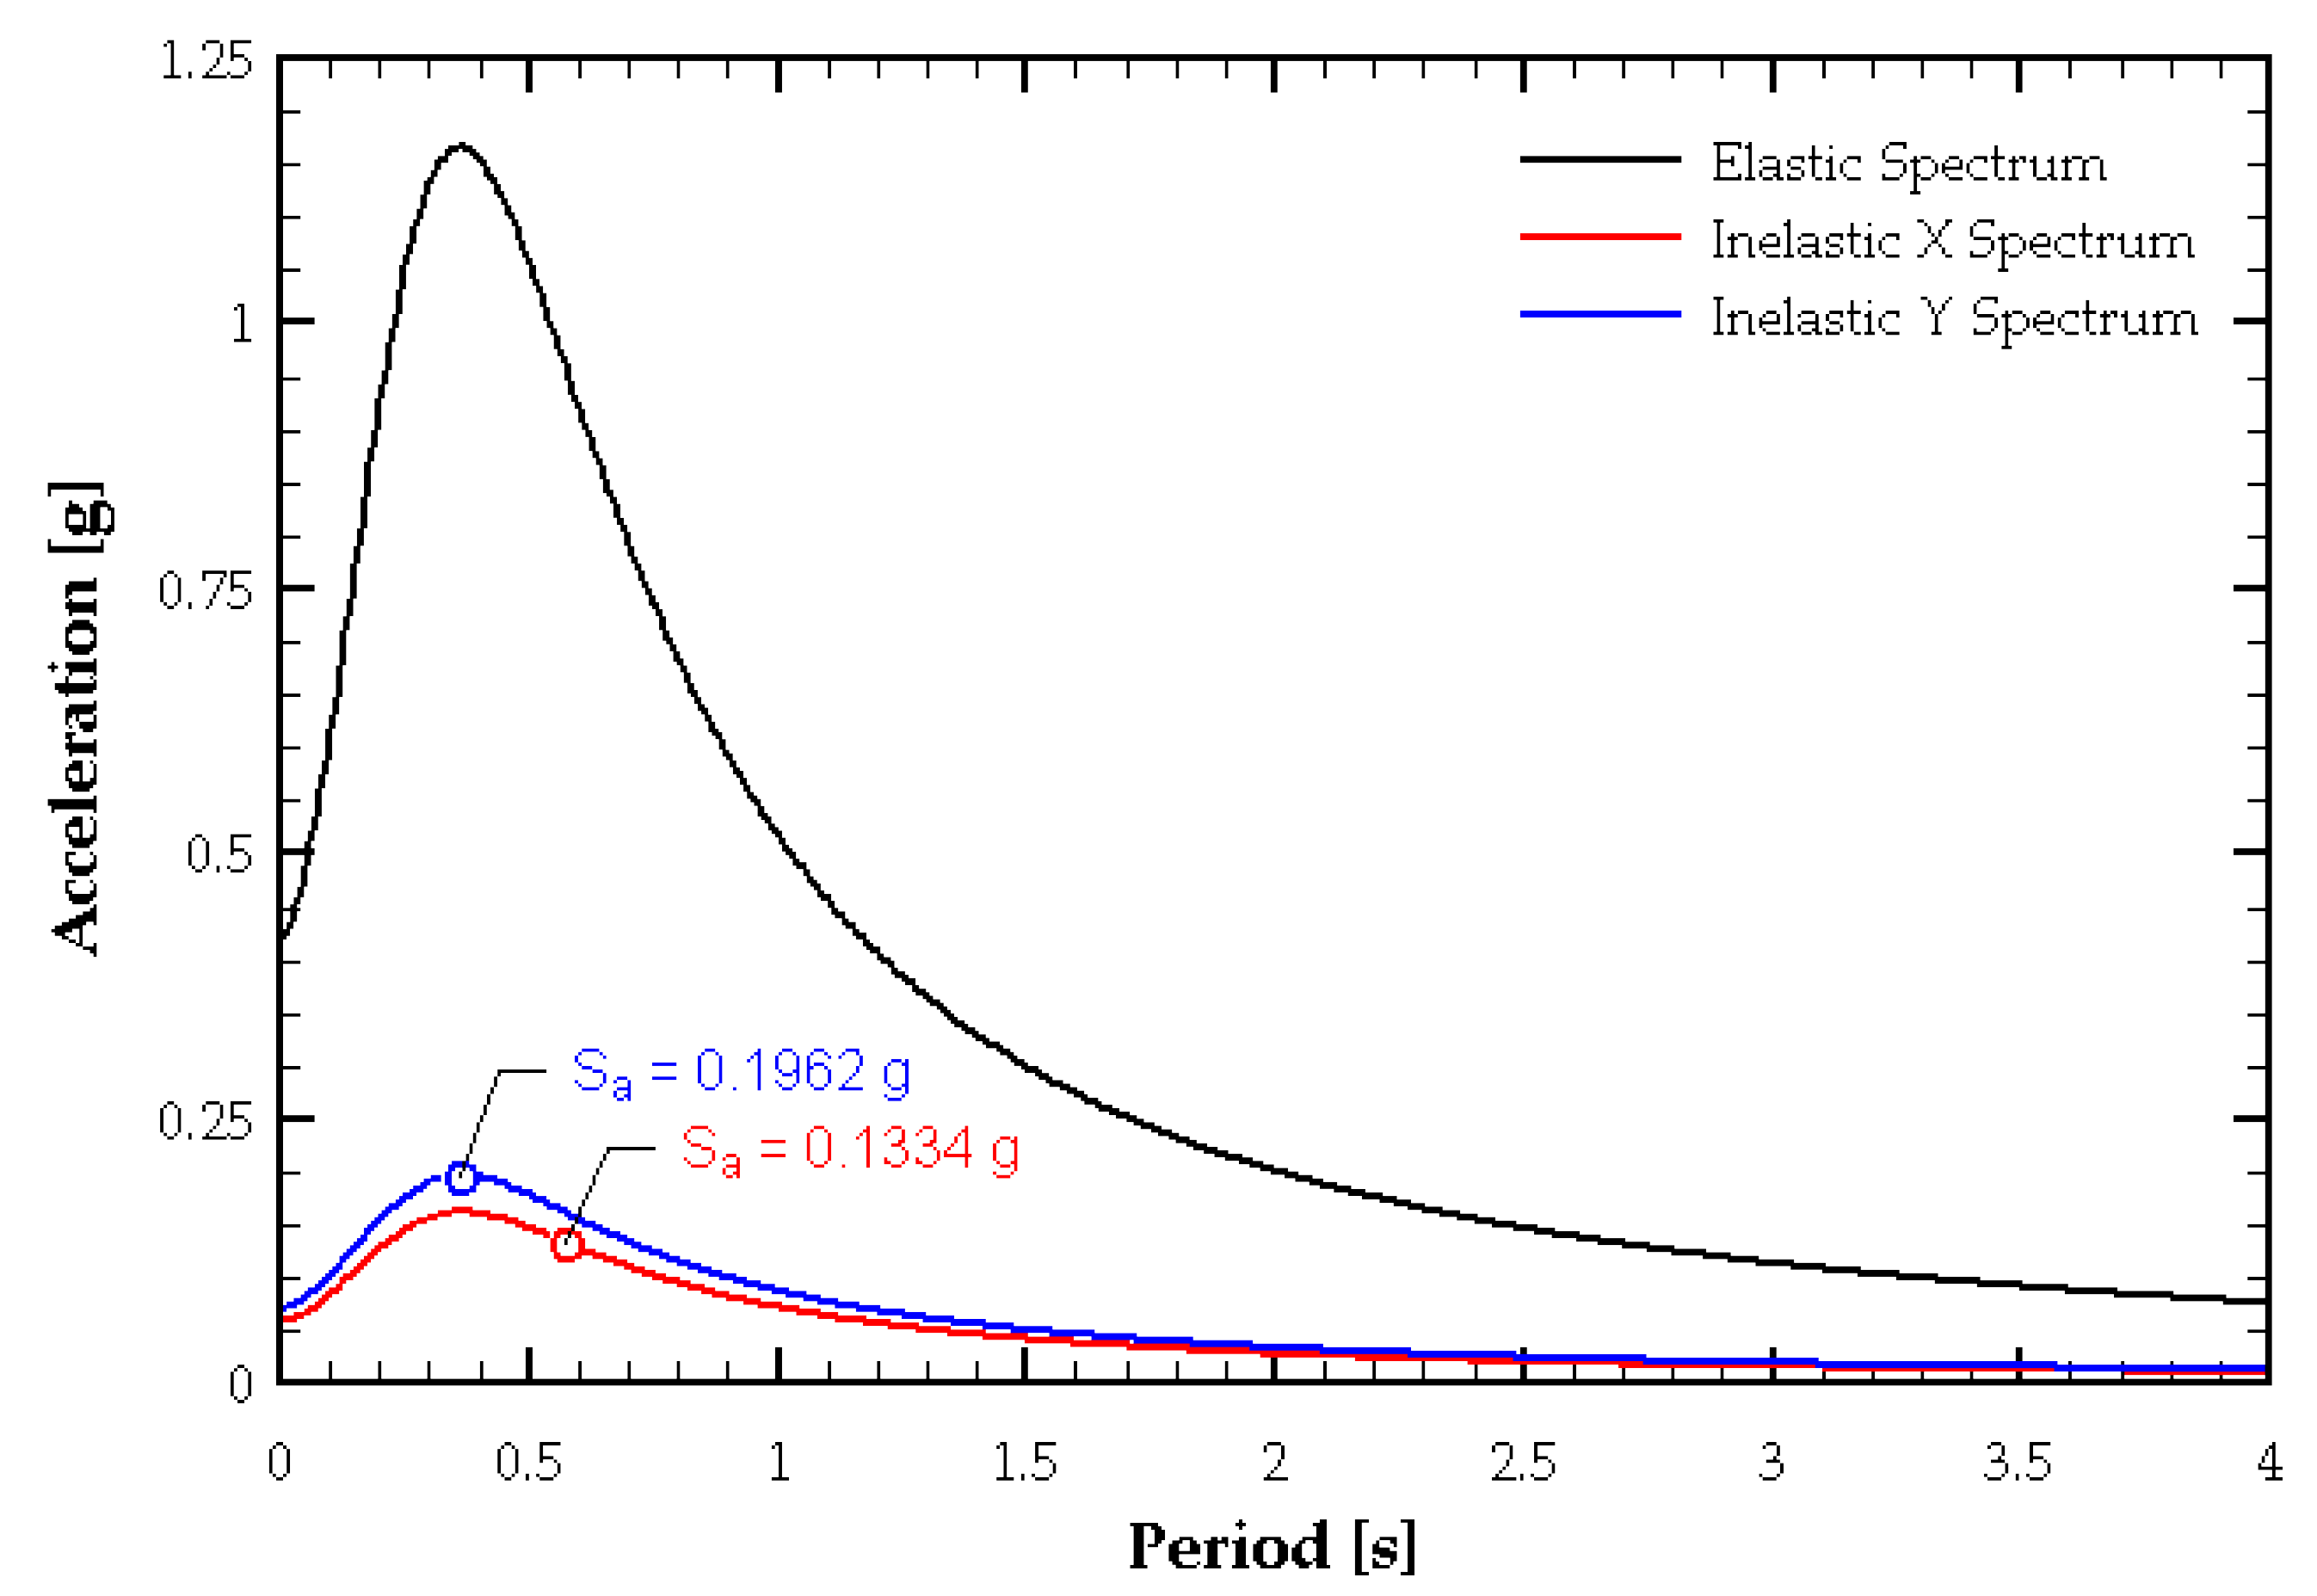
The seismic loads corresponded to structures located in seismic zone 3, with a characteristic seismic hazard level of 0.4 g, and soil classification of type C, as specified in the Chilean code. The main results from the modal response spectrum analysis conducted for each archetype and for each analysis direction are summarized as follows. The modal spectral analysis considered a design spectrum prescribed by the NCh433 [
55] section §6.3.5.1, reduced to obtain the inelastic spectral acceleration (
), by a response reduction factor
, which was calculated according to the section of §6.3.5.3, both dependent on the structure fundamental period and soil properties. This is illustrated in
Figure 5. A total of 11 modes were considered to comply with the 90% percentage of participating mass for the seismic action in both directions, as required by NCh433 [
55] section §6.3.3. The first five modes are shown in
Table 3. These modes were then combined under CQC to obtain the maximum values in each direction; however, it is important to note that the standard does not prescribe the combination of direction effects in the seismic action. Subsequently, the standard limits for the minimum (
) and maximum
) values of base shear, as prescribed in section §6.3.7, were not required to be adjusted for the structure under study. The design base shear (
) considered the response reduction factor and the standard limits. Another parameter of interest was the design roof displacement (
, which was calculated as 1.3 times the displacement spectra (
), as presented in the Supreme Decree DS61 [
59,
60], considering the stiffness modifier under the effects of cracking. Finally, the structure design was compliant with the NCh433 prescriptions §5.9.2 and §5.9.3, which limit the center-of-mass (CM) interstory drift to a value of 0.2% and the maximum interstory drift to a value of 0.1% (relative to the CM), as shown in
Table 4. This is required by the Chilean standard to ensure elevation and plan regularity.
It is worth noting that the structural layout was developed with the objective of achieving a regular seismic response, both in elevation and in plan, in accordance with the provisions of the Chilean design code, which establishes limits on interstory drifts. In this context, the code requires that the interstory drift at the center of mass () and the maximum interstory drift be limited to 0.2% and 0.1%, respectively.
Regarding the design of the elements comprising the seismic force-resisting system, the walls were designed as special shear walls, as defined in Chilean Supreme Decrees DS60 and DS61 [
59,
60], with the former being an adaptation of ACI 318-08 [
58]. These special shear walls are characterized by ductile behavior, subject to the following design provisions:
Limiting the wall slenderness by prescribing a minimum thickness (), where is the story height.
Limiting the maximum axial compression to , where is the specified compressive strength of the concrete, and is the gross cross-sectional area.
Requiring boundary element confinement (with ) when the compressive strain under the design roof displacement .
When confinement of the boundary element is required, limiting the maximum concrete compressive strain to 0.8% under the design roof displacement .
It should be emphasized that based on the aforementioned design provisions, none of the archetypes required boundary element confinement.
Another important aspect of the design was the application of the capacity design approach to both beams and walls, as introduced in ACI 318-19 [
61]. Under this design methodology, brittle failure modes are prevented by ensuring, in a deterministic manner, the development of a ductile failure mechanism, typically one controlled by flexural behavior [
62,
63].
2.3. Wall Design Example
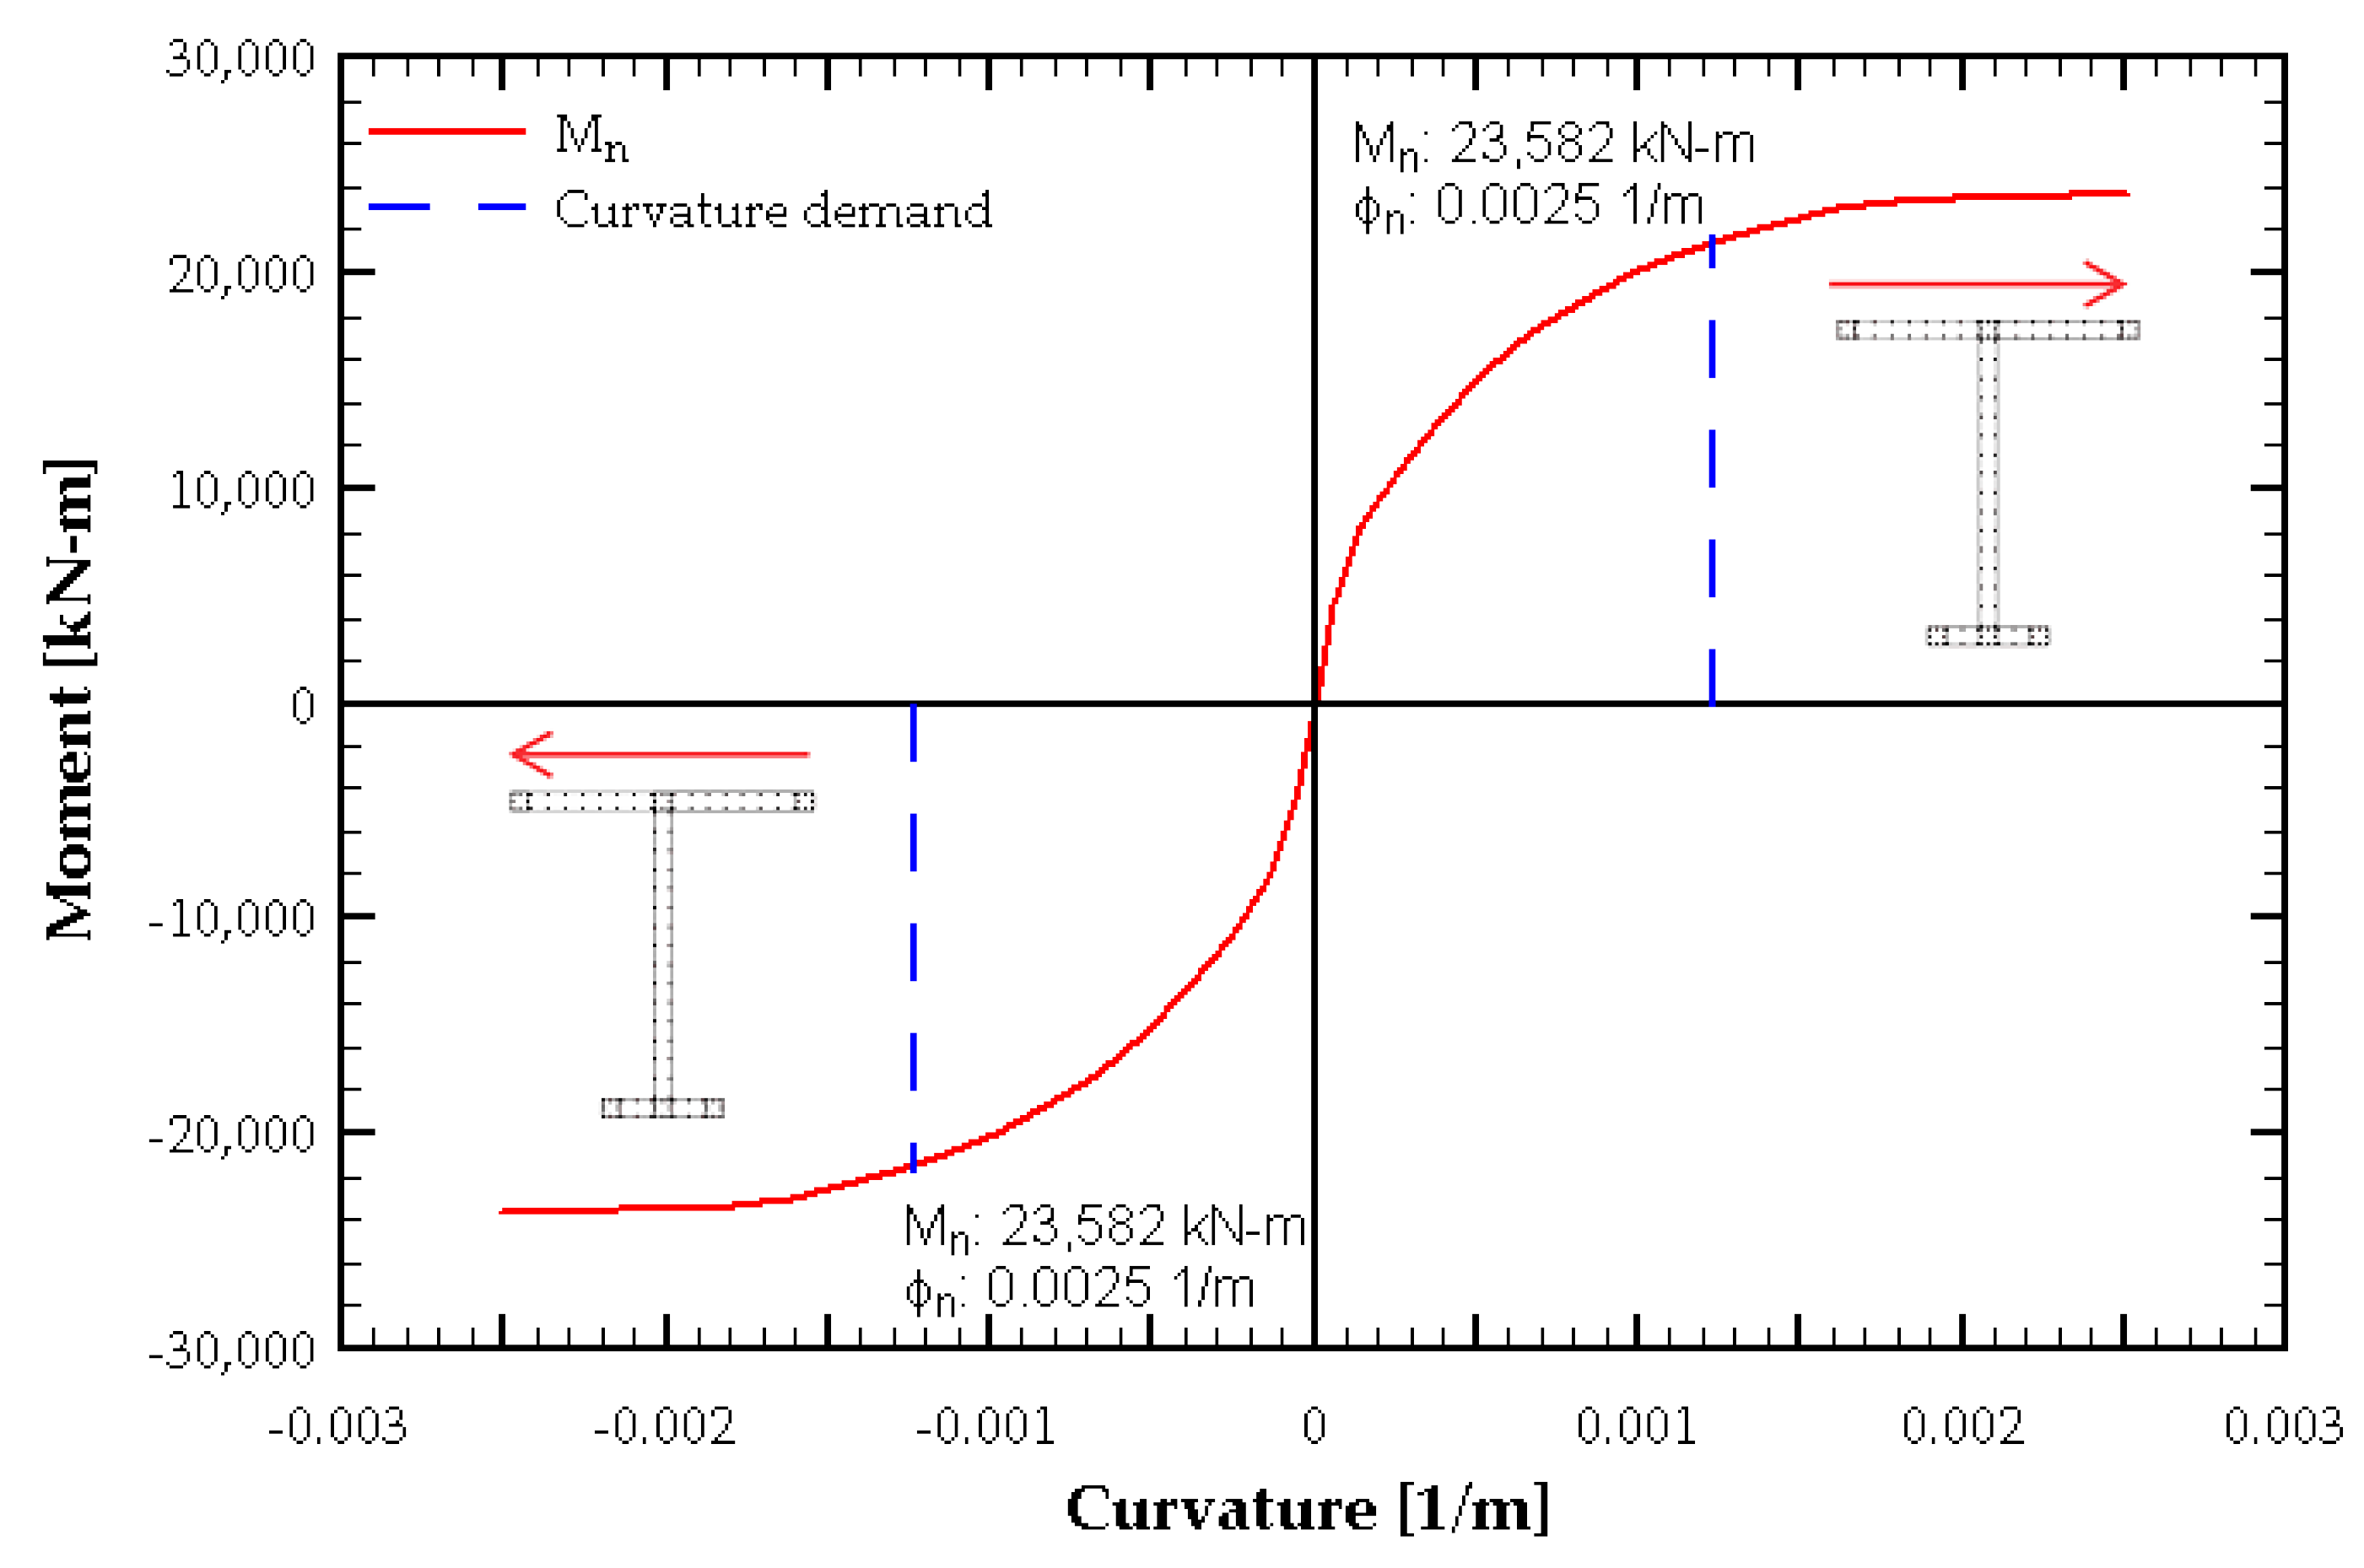
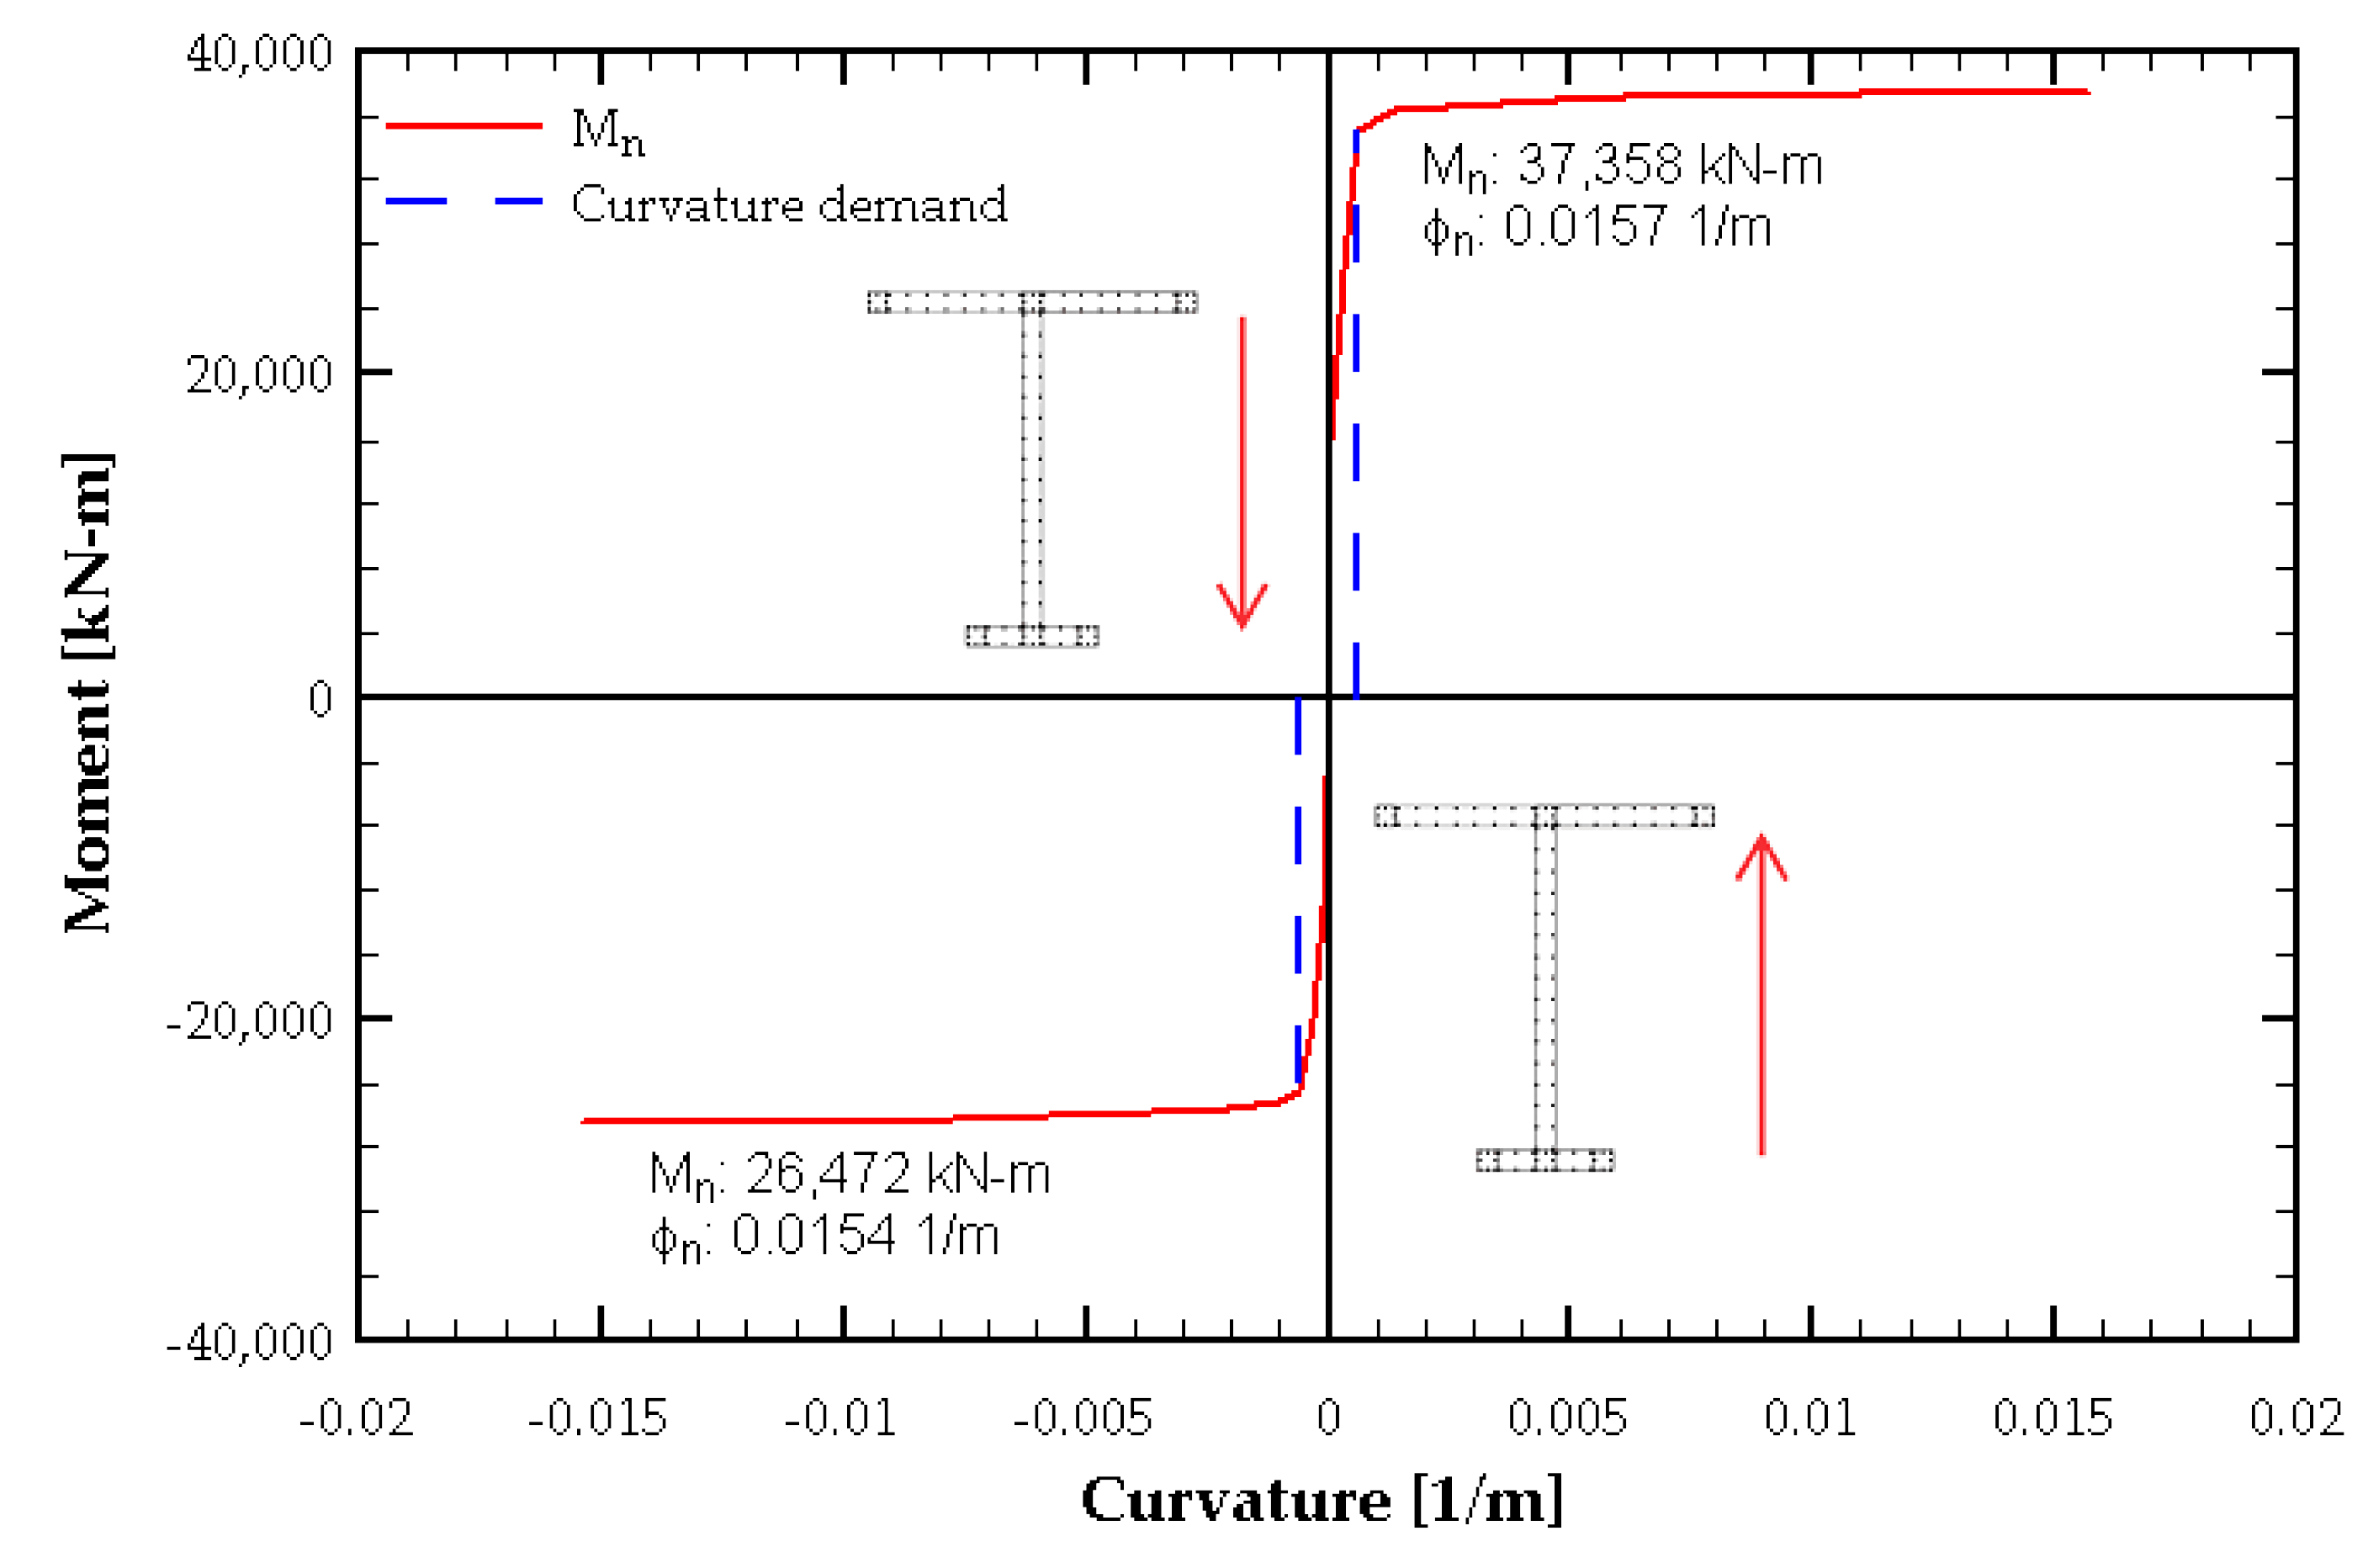
An example of the design of the structural wall is described in the following section, following the special shear wall design provisions.
Within this framework, the wall critical section was designed to consider the flexural and shear demands prescribed by the Chilean standard and the ultimate roof displacement (
) calculated previously and shown in
Table 3. As mentioned before, due to the building’s design characteristics—including its height, wall geometry, and seismic demand—it was found that was not necessary to incorporate special boundary elements (confinement).
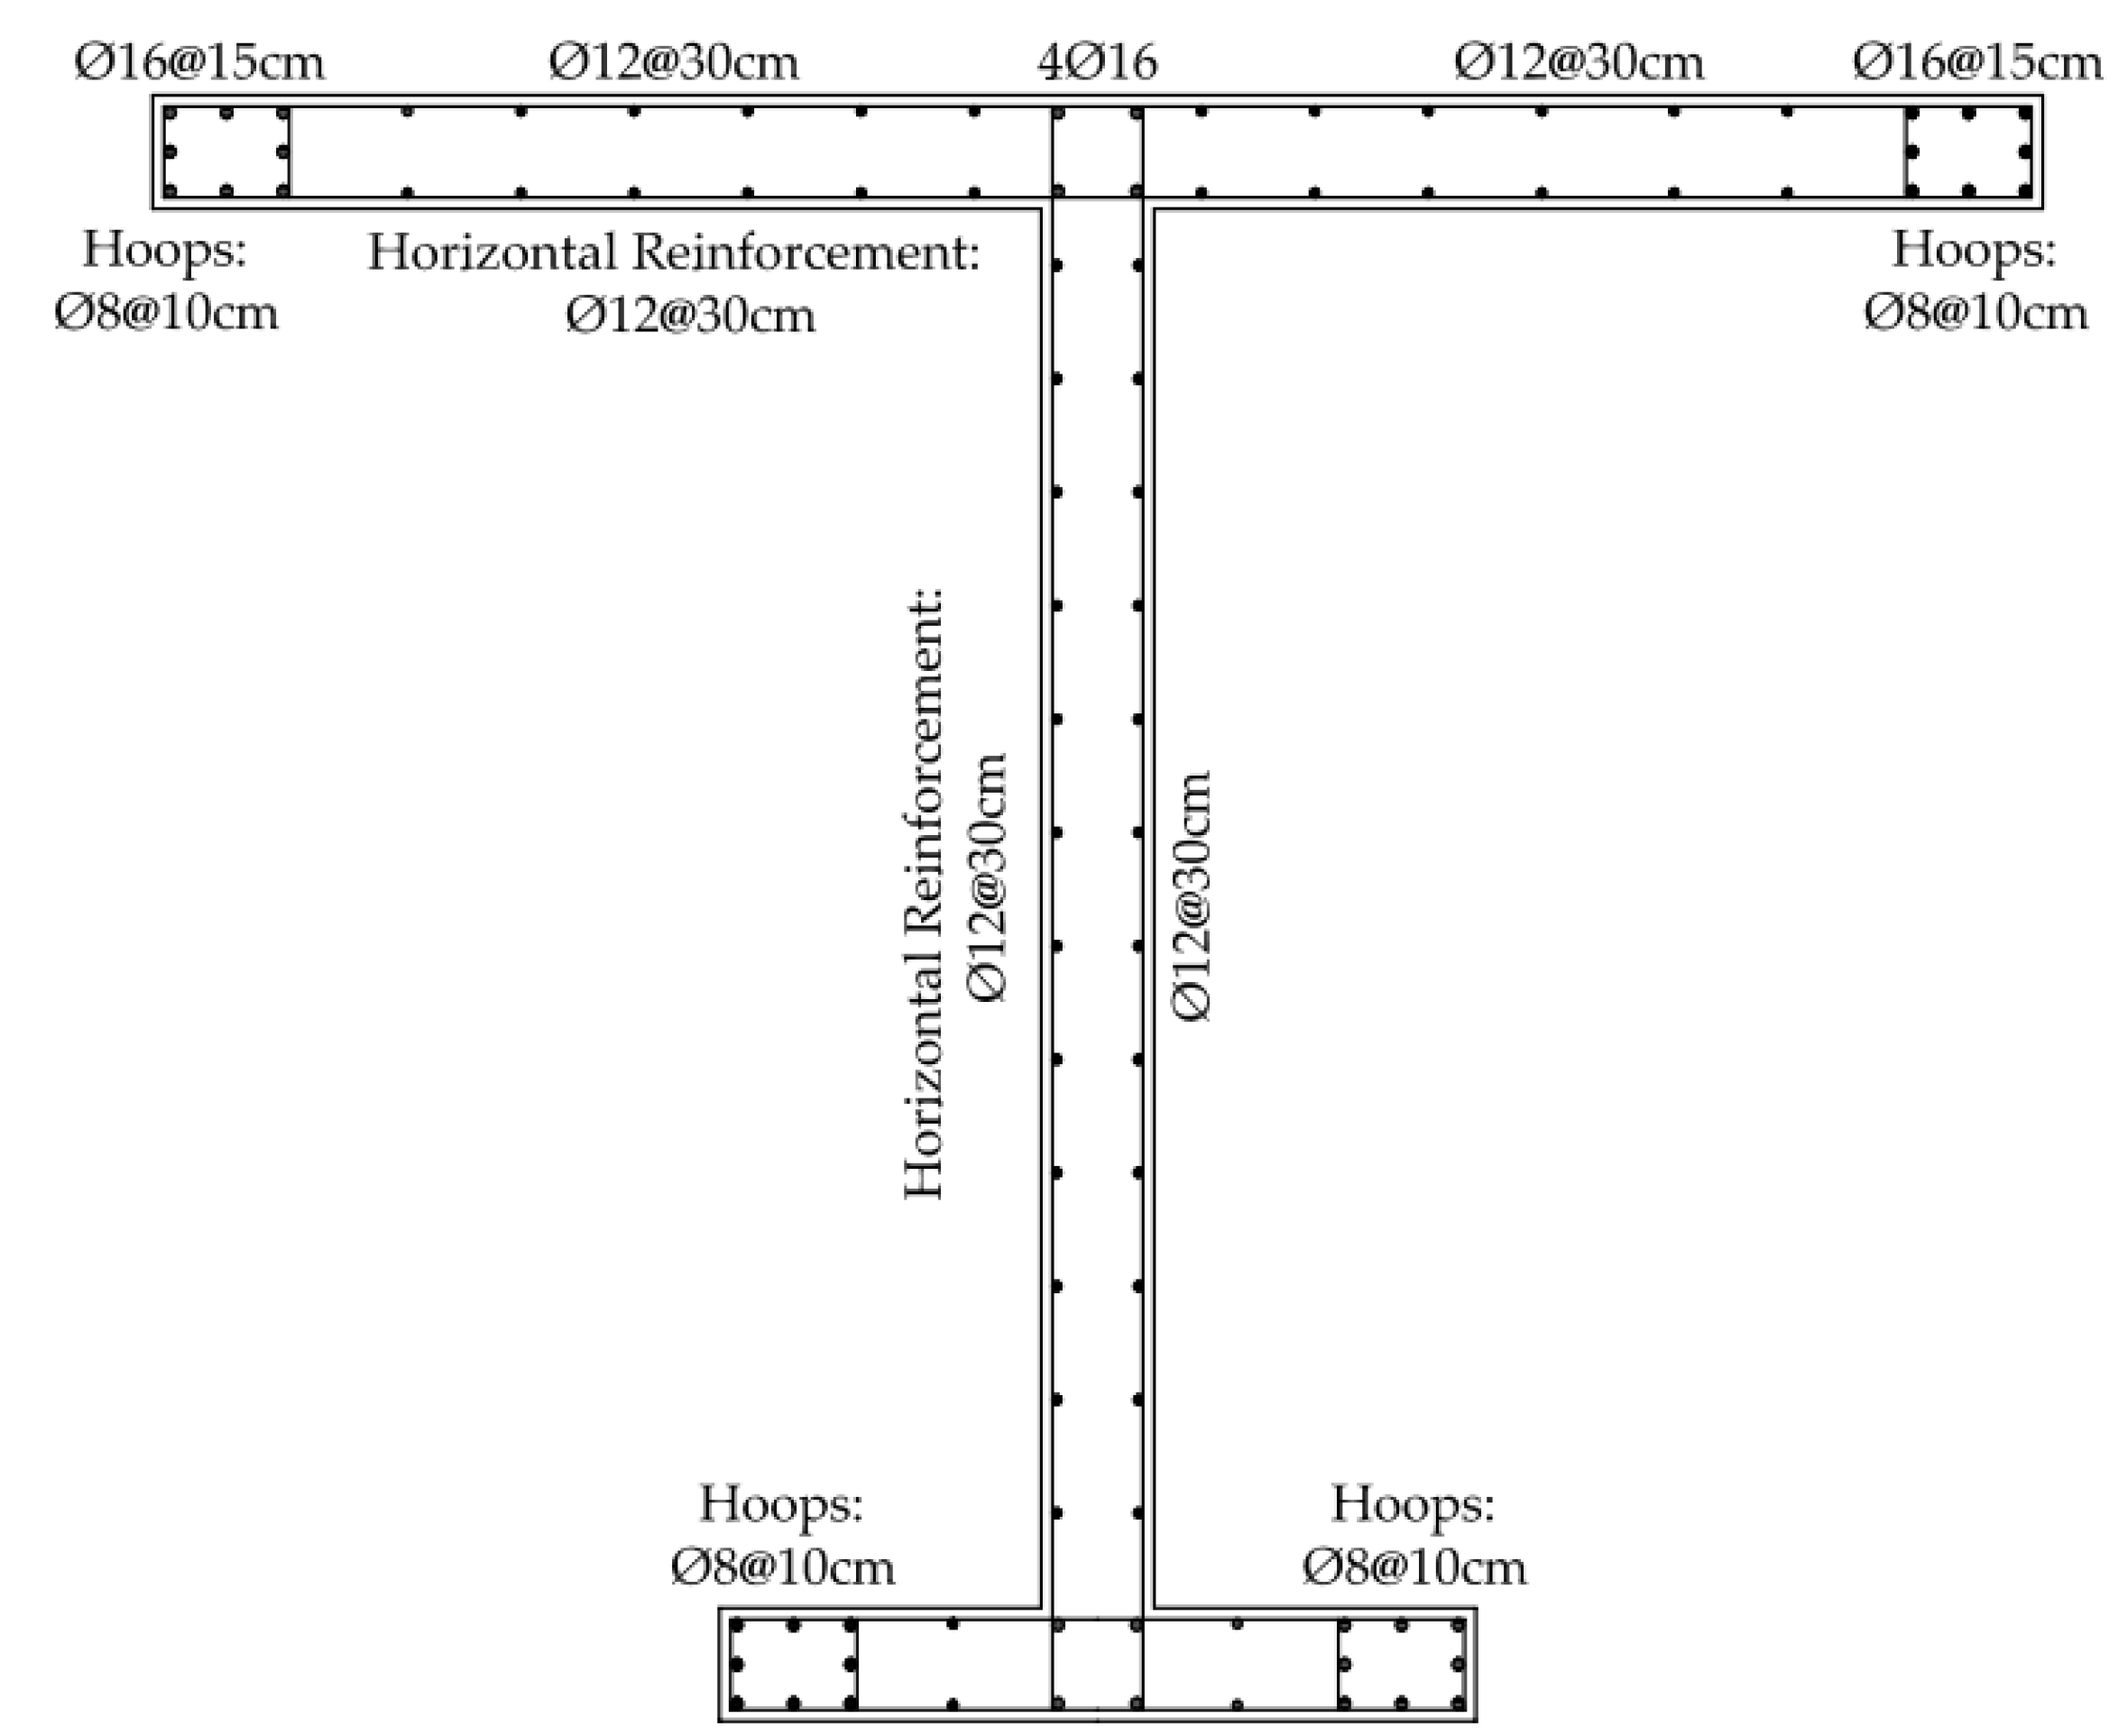
Figure 6 shows the wall steel reinforcement detail for the wall in the 1st story.
The moment–curvature curve of the wall is illustrated in
Figure 7 and
Figure 8, where the blue line represents the nominal moment (
)–curvature relationship of the wall, obtained from the section analysis. Additionally, the curvature demand according to the standard, determined from Equation (1), is also included. This demonstrates that the design is compliant with the code prescriptions, which ensures the wall has the capacity to resist the design roof displacement (
) without exceeding a critical value of concrete strain (
).
3. Analyses Used in the Methodology
The FEMA P695 methodology involves two fundamental types of analysis. The first is nonlinear static pushover analysis, which consists of applying incrementally increasing lateral loads following a predefined distribution pattern, typically one that resembles the first-mode lateral displacement shape. The second is incremental dynamic analysis (IDA) [
64], which requires the selection of a suite of ground motion records consistent with the seismogenic source that most significantly affects the archetypes. These records are applied incrementally until the maximum structural response reaches a level that enables the identification of collapse.
To perform these analyses, nonlinear models must be developed. For this purpose, the finite element software SeismoStruct V2024 [
65] was used. The nonlinear models required both the geometric and constitutive data derived from the design and details described in the previous section. The floor slabs were modeled as rigid diaphragms, an assumption justified by the adequate distribution of shear walls in both orthogonal directions of the structure. The structural members were modeled using fiber-based elements, and the material behavior was represented using the constitutive models of Mander et al. [
66] for concrete and Menegotto and Pinto [
67] for reinforcing steel. The parameters of these constitutive models are presented in
Table 5 and
Table 6.
The fiber section model, during the analysis, determined the element state by integrating the response of the different fibers composing the wall cross-section. In comparison with other models, the fiber section approach has the advantage of not requiring empirical calibration, which considers the wall’s behavior under the expected load condition, necessary for plastic hinge models. In addition, by considering the stress–strain curves and the integrated fiber response, this approach inherently captures the element’s axial and flexural behavior, updating the stiffness at each analysis step. Despite its benefits, this model has the following limitations:
Reinforcement buckling and the bond–slip effects are not considered.
It does not integrate the axial and flexural loads, with the effect of the shear forces (P-M-V interactions).
The previous phenomena can be implemented but require a highly complex modeling approach, beyond the scope of this study. However, the modeling definition and approach can adequately represent the response of the wall when compared with its tested specimens under cyclic loads [
68,
69].
Ground Motions Used
For this study, seismic records from the Chilean subduction zone were used. The set of acceleration records was obtained from the CESMD database [
70]. The records were applied using both horizontal components of the originating seismic events. The relevant characteristics of the original ground motions used are summarized in
Table 7.
In this study, a total of 14 pairs of ground motion records were used, obtained by rotating the horizontal components of seven original accelerograms. Although the FEMA P695 methodology recommends the use of a minimum of 22 pairs of records—particularly for studies aimed at evaluating seismic design factors for new structural systems or innovative materials—the objective of this research was to assess such factors for a well-established structural typology. However, this typology is subject to unique seismic demands dominated by subduction earthquakes, which are the primary seismogenic source in the study region. Moreover, the prevailing geotechnical conditions correspond to stiff soils, classified as site class C according to the Chilean seismic code. Consequently, the selection of ground motions was deliberately focused on strong subduction events recorded in Chile, ensuring that the seismic input was representative of the expected hazard scenario for this type of structure.
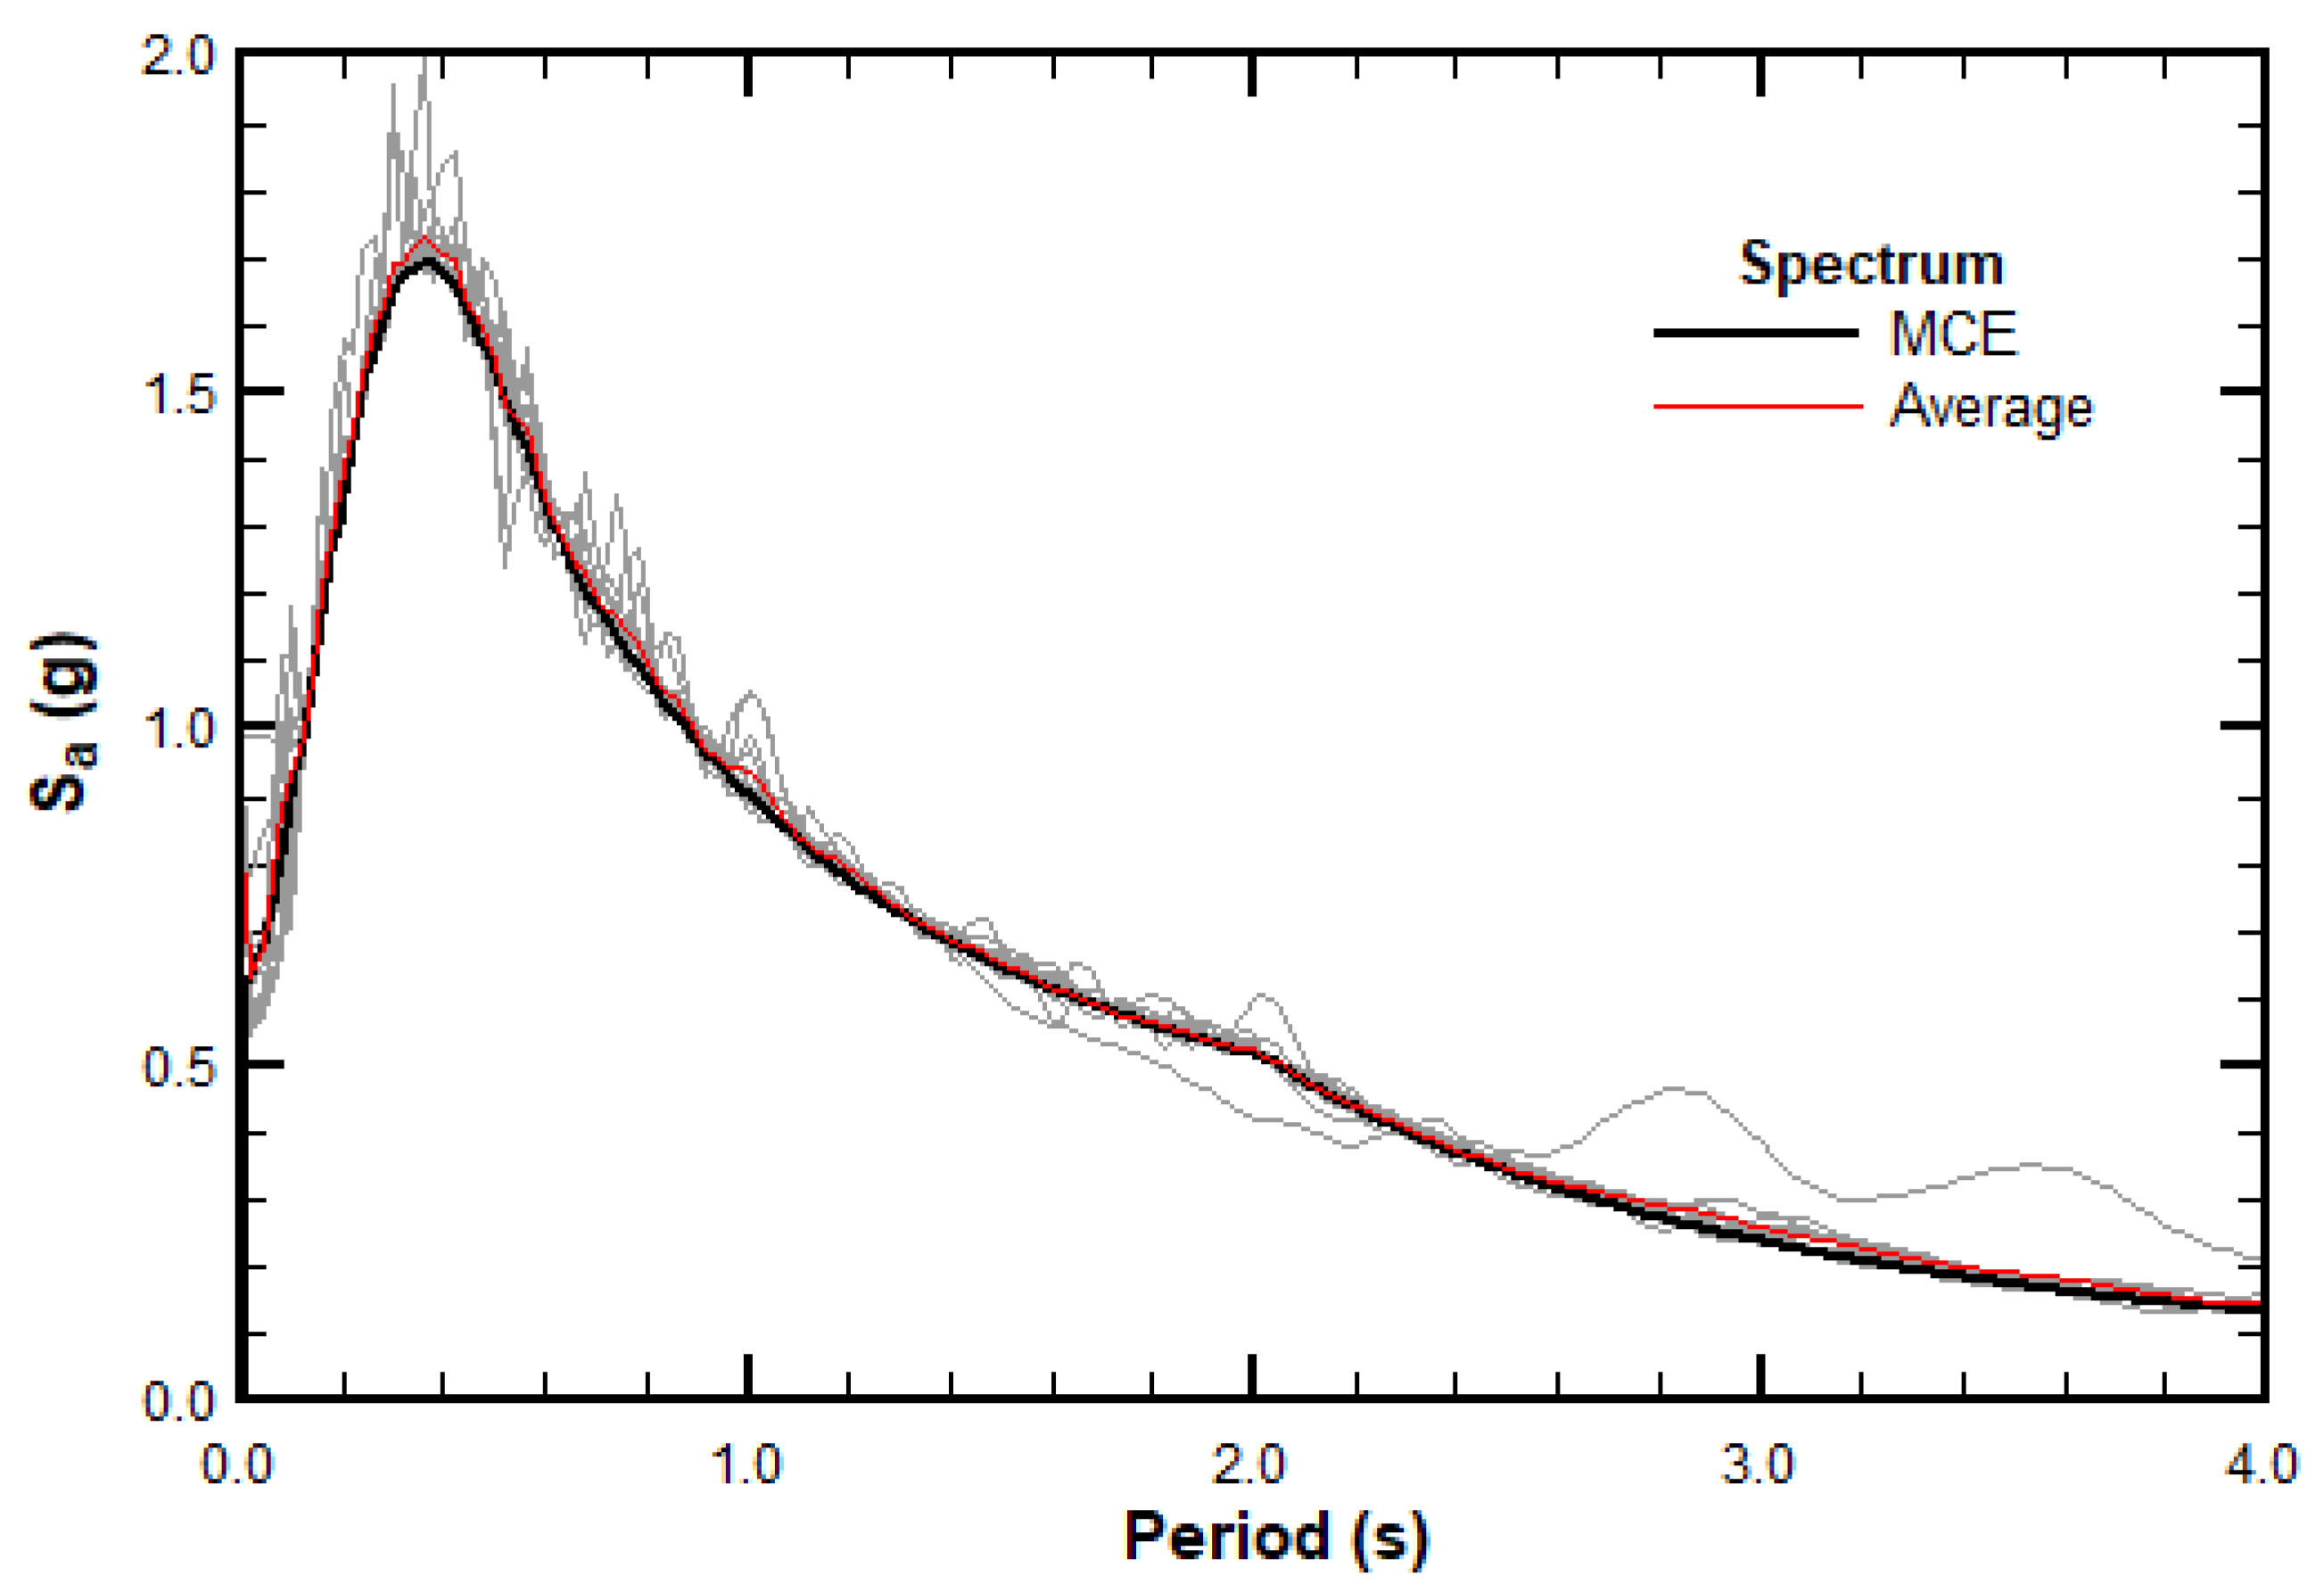
At this stage, a variation of the standard FEMA P695 methodology was introduced. Instead of using the original ground motion records, the records were modified in order to match the elastic spectrum corresponding to the maximum considered earthquake (MCE). According to the Chilean code, this spectrum was derived from the elastic displacement spectrum, which was first amplified by 17% to obtain the design-level elastic displacement spectrum and then further amplified by an additional 30% to obtain the MCE displacement spectrum (see
Figure 9). The spectrally matched ground motions corresponding to the MCE spectrum were used in the incremental dynamic analysis. Ground motion matching was performed using the software SeismoMatch [
71].
The acceleration records were matched following the procedure described in the
Achisina Manual [
72], which defines the seismic hazard in Chile based on the elastic displacement spectrum derived from the Mw 8.8 earthquake that occurred on 27 February 2010. The software used requires the definition of the design spectrum in terms of the spectral acceleration
. This spectrum can be obtained by applying the following conversion equation:
In the above equation, and represent the structural frequency and period, respectively. The spectral displacement ordinates () were increased by 17%, as established in the aforementioned Achisina Manual, to define the design-level spectrum. This resulting spectrum was then further amplified by an additional 30% to represent the seismic demand associated with the maximum considered earthquake (MCE). The matching process was carried out using this target spectrum, considering periods ranging from to , which adequately covered the vibration periods that may develop in the archetypes, especially under the elongation effects caused by damage progression during nonlinear analysis.
4. Results and Discussion
The results of the analyses conducted on the previously described archetypes are presented below. First, the outcomes of the elastic analysis are briefly discussed, followed by the results of the nonlinear analyses.
4.1. Results of Elastic Analysis
As previously discussed in
Section 2.1, the presence of a slope altered the geometry of the archetype structures. As the slope became steeper, its effect on the structure became increasingly significant. From a dynamic response perspective, this was reflected in a comparison of the fundamental periods of the archetypes founded on sloping ground with those of the archetype on flat terrain.
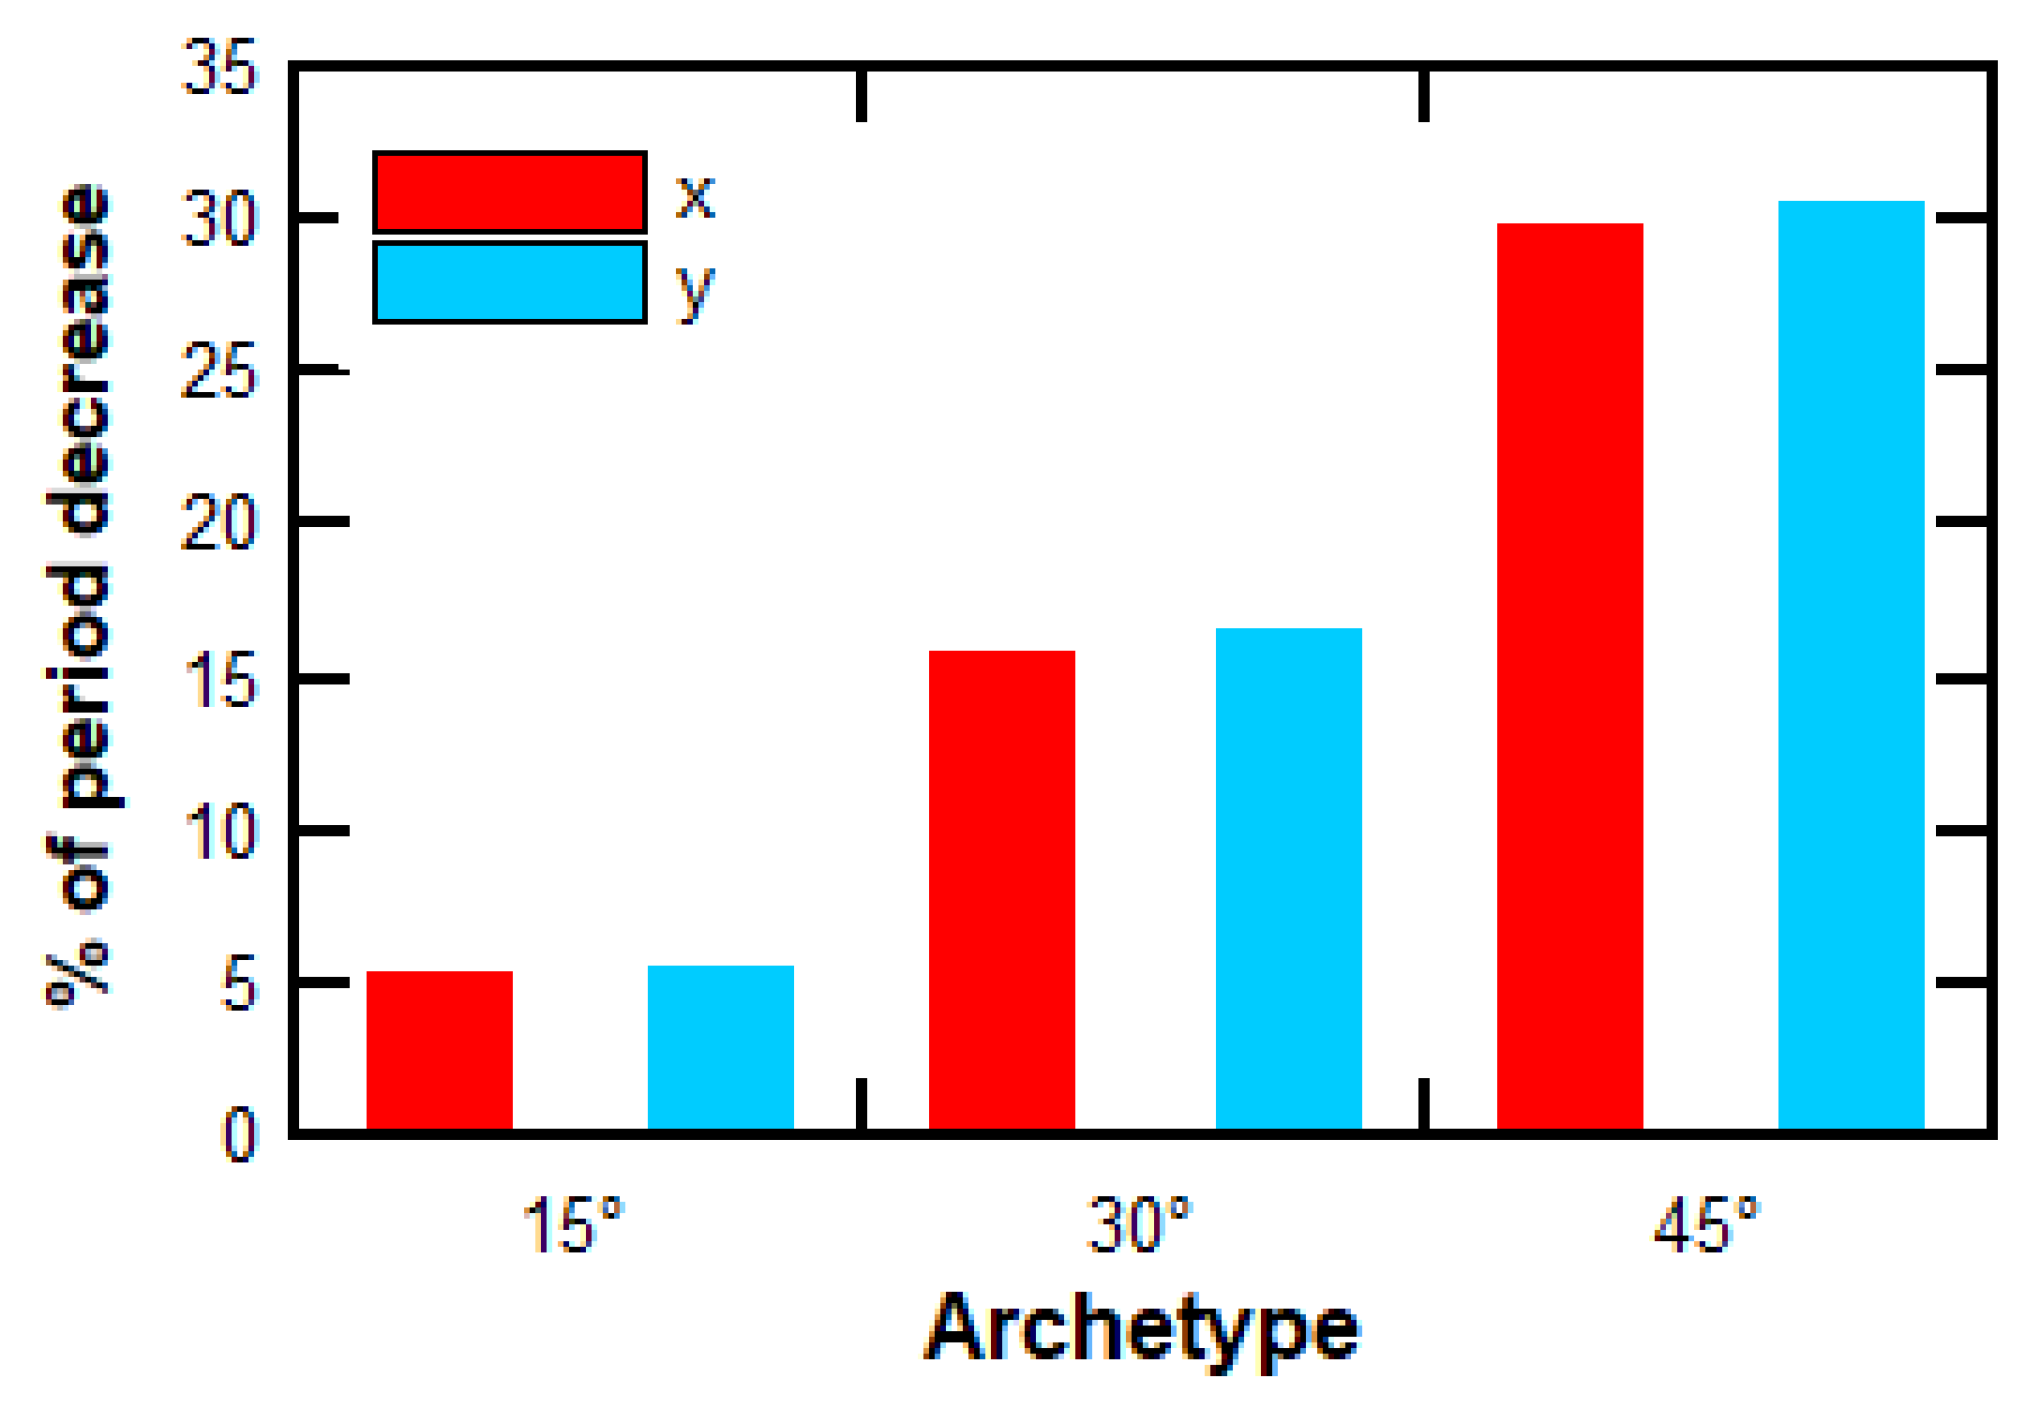
Figure 10 shows the percentage reduction in the fundamental period for both analysis directions of each sloped archetype relative to the flat-ground archetype. It is evident that the slope had a stiffening effect on the structure, which increased with the slope inclination. Moreover, although the geometric effect of the slope was notably different in the direction parallel to the slope plane compared with the orthogonal direction, the variation in the fundamental periods was relatively uniform in both directions.
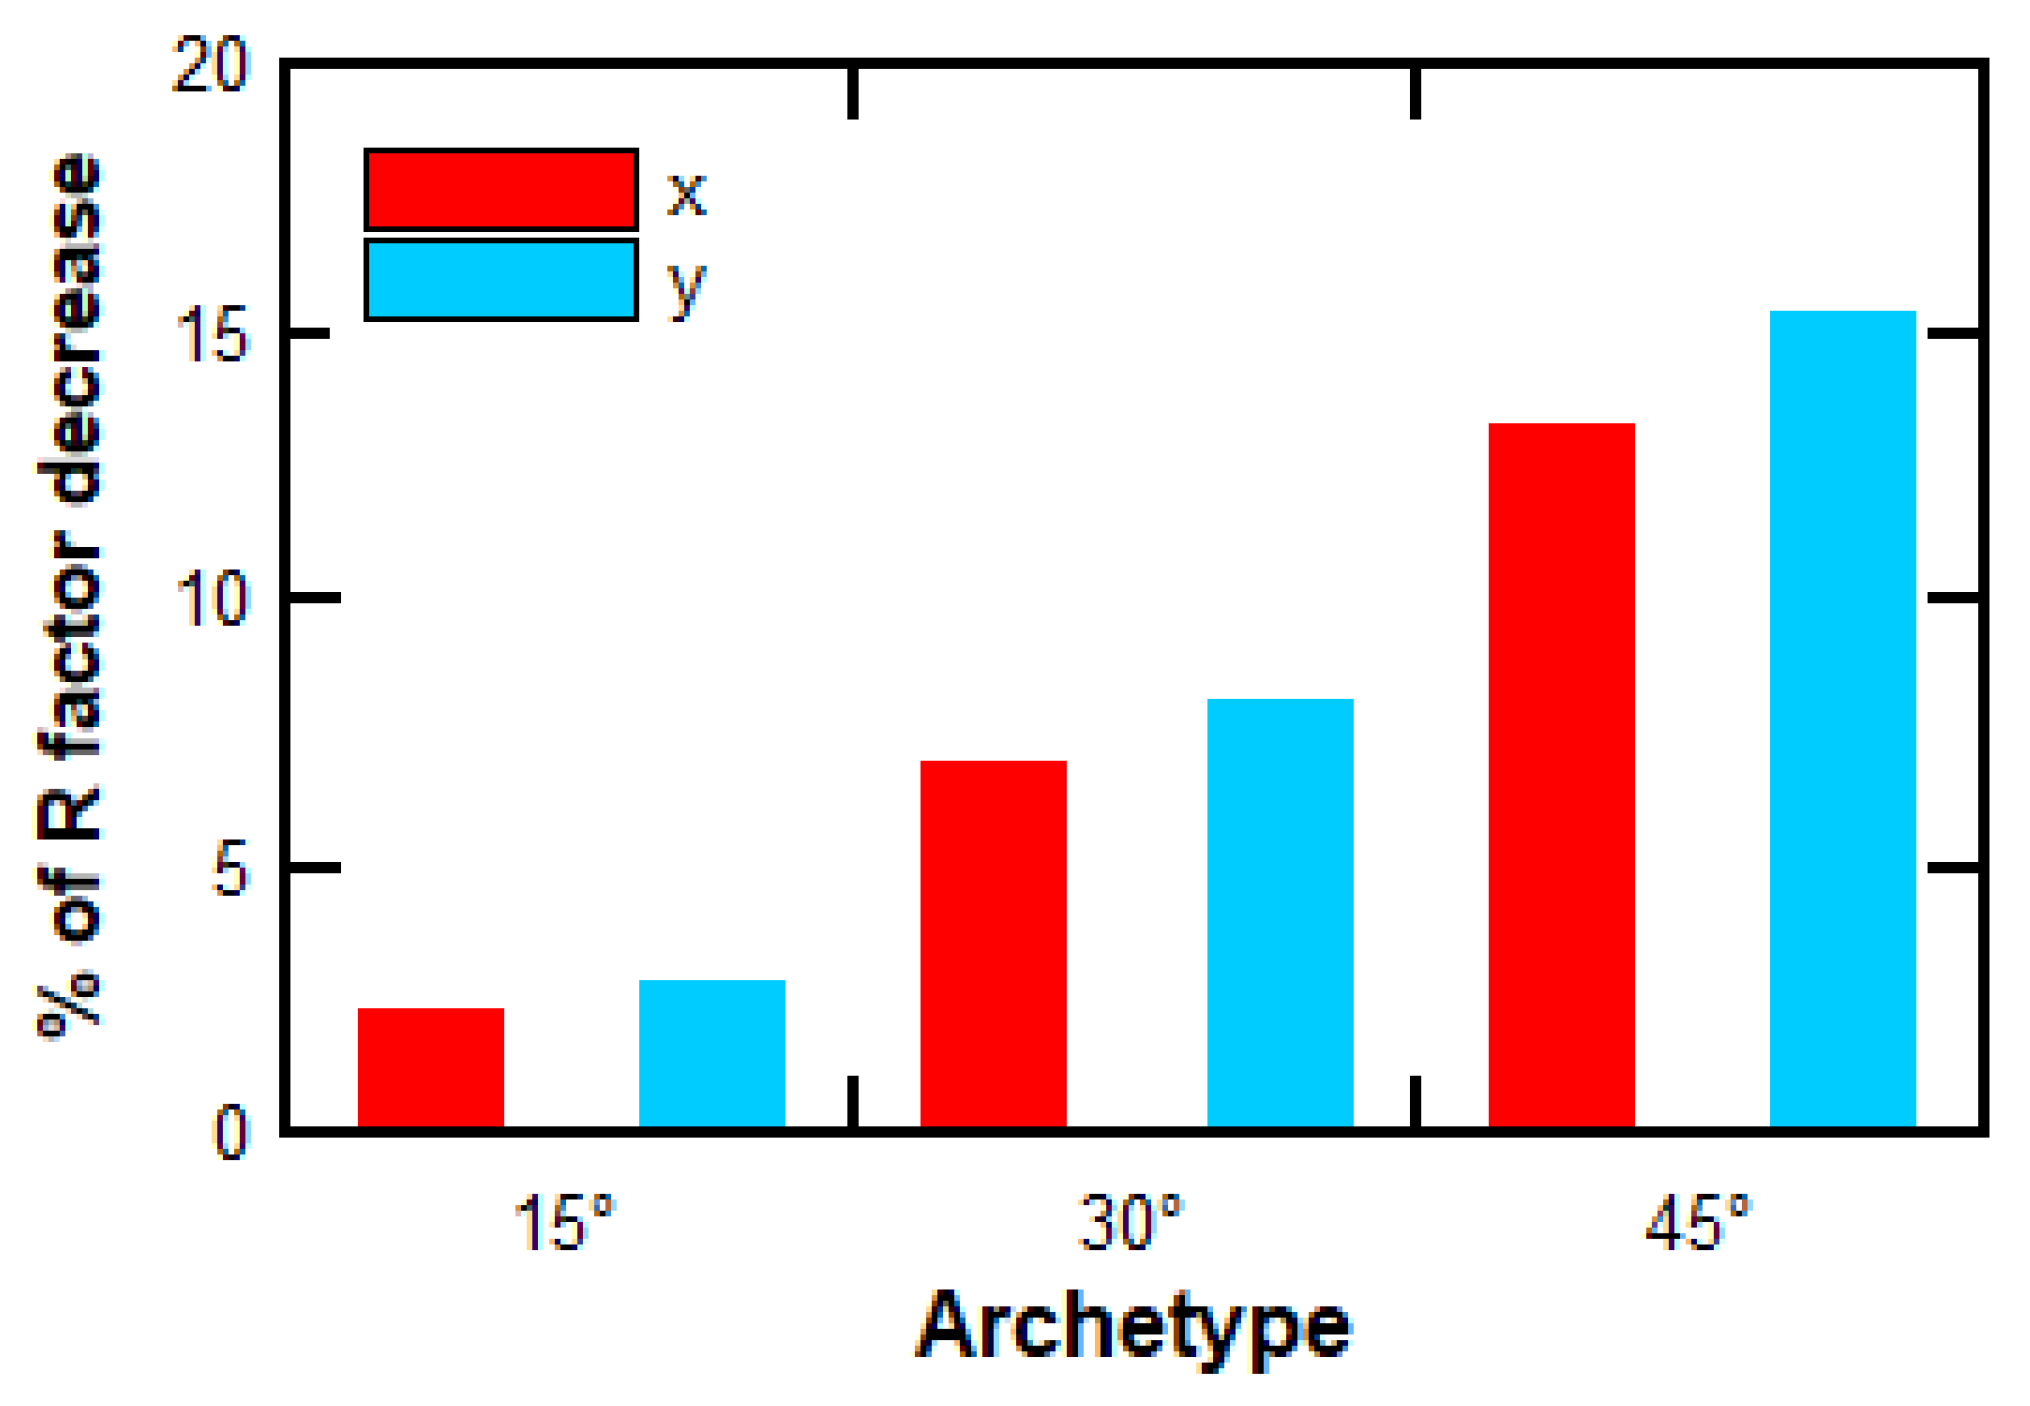
This modification of the fundamental period has a significant impact on the design process, as the estimation of the base shear force used in design depends directly on the fundamental periods. The Chilean seismic code employs response reduction factors (
) that are period-dependent. Therefore, changes in the fundamental period result in a reduction in the
factor, as shown in
Figure 11.
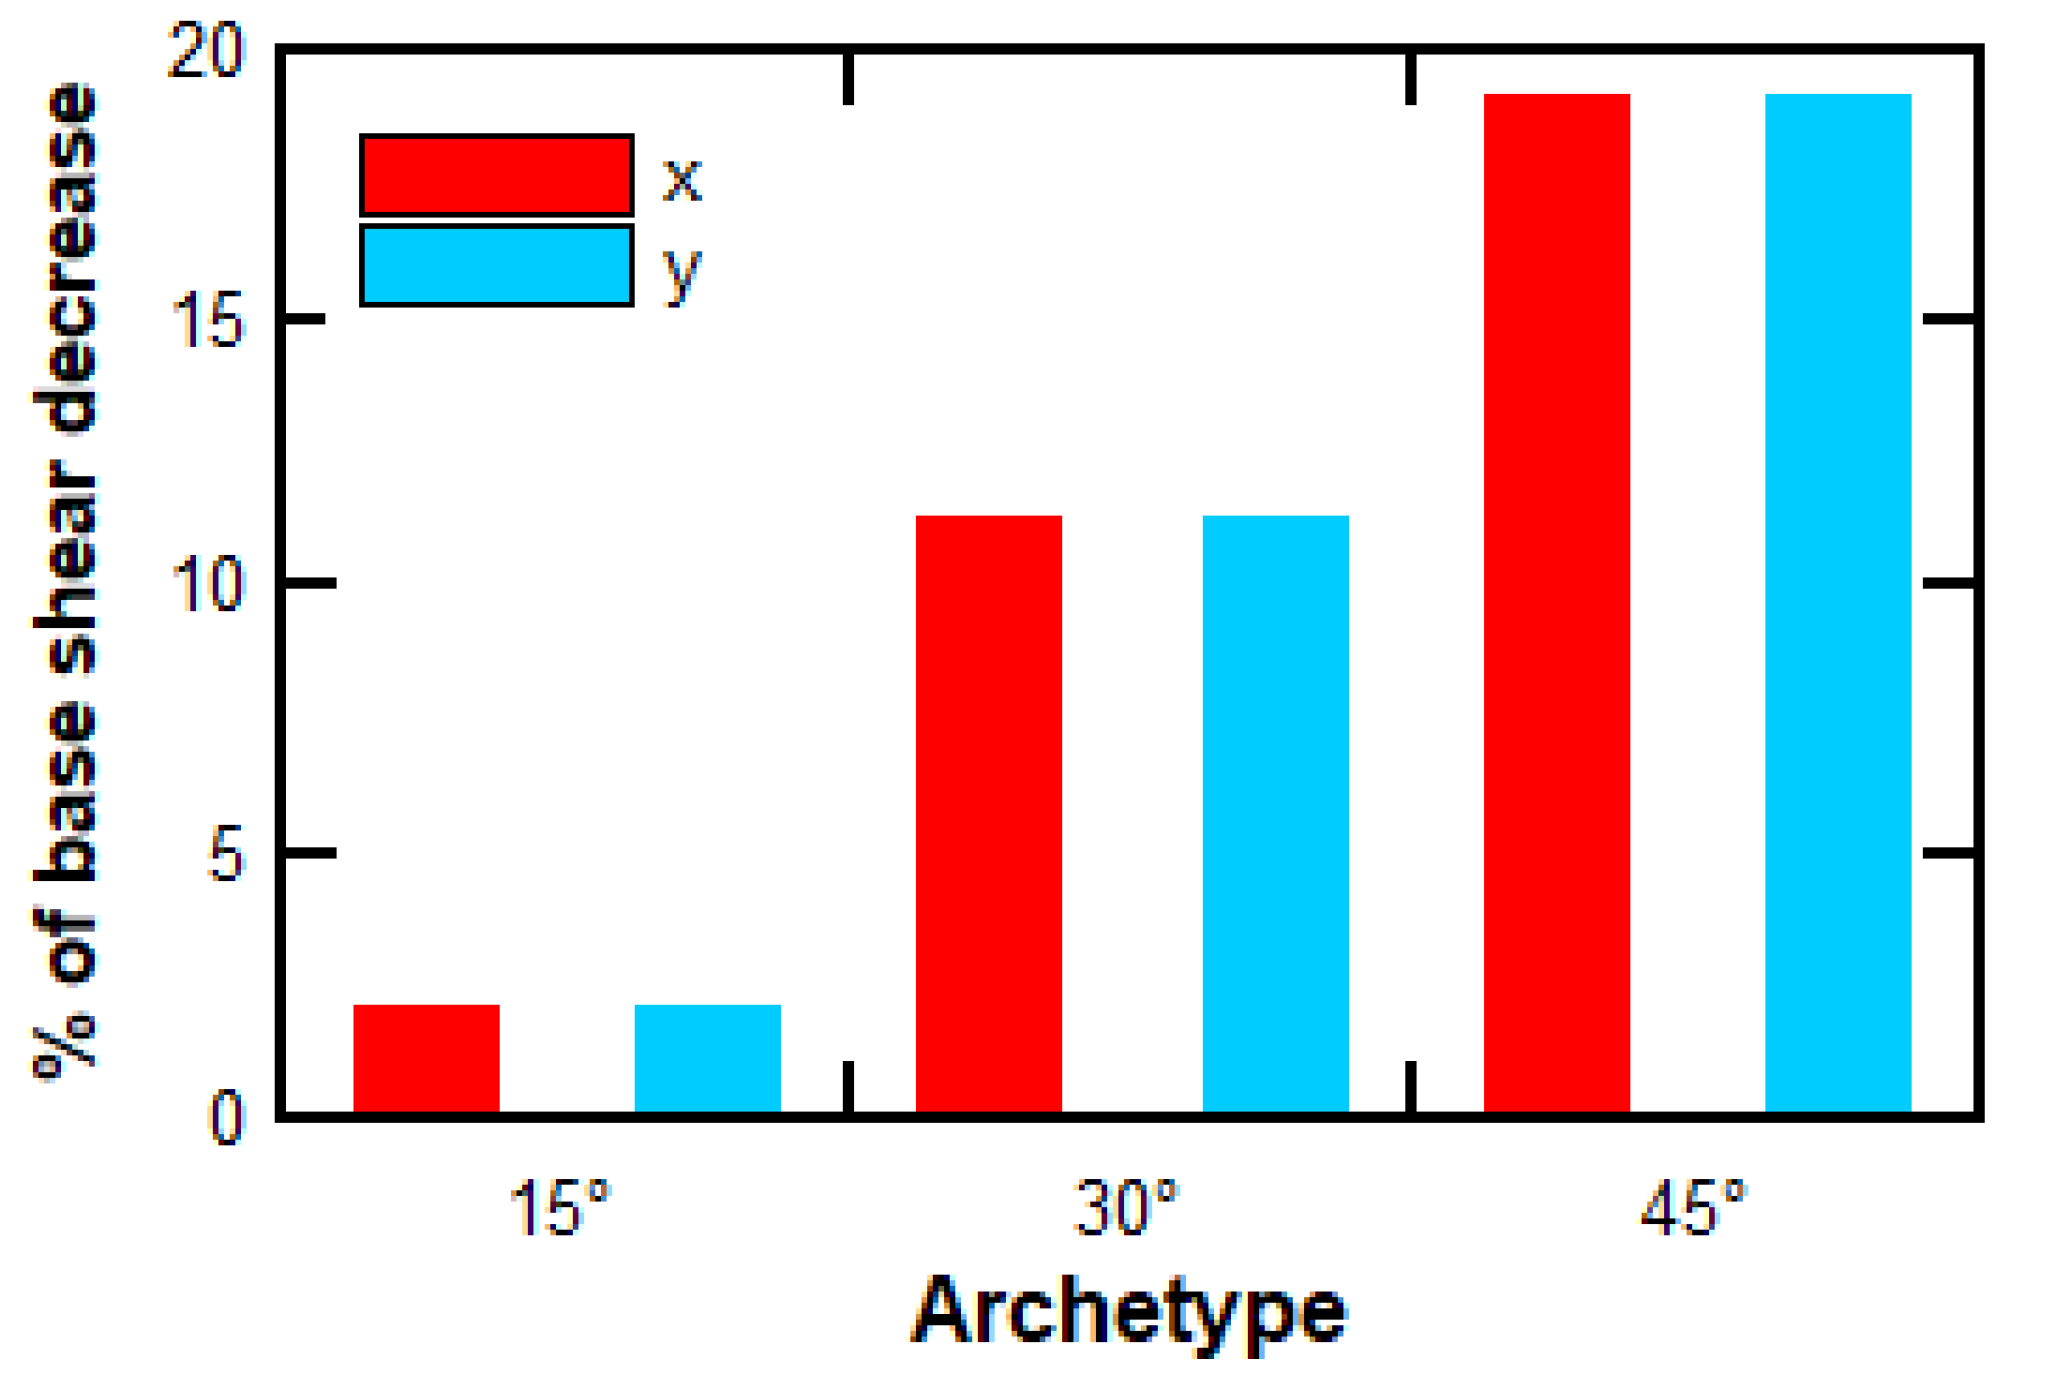
The geometric modification of the structure directly affected its seismic weight, which, in turn, influenced the design base shear force. This relationship is illustrated in
Figure 12.
The structural periods of the archetypes decreased as the slope inclination increased. This reduction was primarily due to two factors. First, the archetypes became progressively stiffer as the structural axes closer to the hillside experienced a decrease in elevation, effectively reducing the total height of the structure along those axes. The most pronounced reduction was observed in the archetype located on a 45° slope, where axis F exhibited up to two fewer stories than axis A. Second, for the archetypes founded on inclined terrain, there was a progressive loss of structural elements, including portions of the floor slabs. This effect was particularly evident in the archetypes on slopes of 30° and 45°.
To validate the computed structural periods, expressions from ASCE 7-22 were used to estimate the approximate period of the archetype located on flat ground. It is important to note that these formulas do not include specific considerations for structural systems founded on sloped terrain.
The general expression applied was
where
is the approximate period of the structure,
and
x are coefficients depending on the structural system, and
hn is the total height of the structure. Applying this equation yielded
, which was very close to the fundamental vibration period computed for the archetype on flat ground.
A second expression for estimating
is
where
is a coefficient specified according to the unit system used. In imperial units,
, while in SI units,
. Notably, this latter value produced results approximately one order of magnitude lower than expected when used directly with SI units. The
parameter is defined as
where
is the total floor area of the building,
is the web area of the shear wall
i,
is the length of the shear wall
i, and
x is the number of shear walls effective in resisting lateral forces in the direction of analysis. Applying these expressions resulted in an approximate period of
, which was 18% lower than the predominant period of the archetype on horizontal ground.
Finally, it is noteworthy that although an increase in the slope inclination progressively reduced the response reduction factor (
), thereby increasing the design accelerations applied to the archetypes, and, in addition, shifting the fundamental periods toward the region of maximum spectral demand, the impact of the reduced seismic weight proved to be far more decisive in determining the base shear forces, as reported in
Table 3.
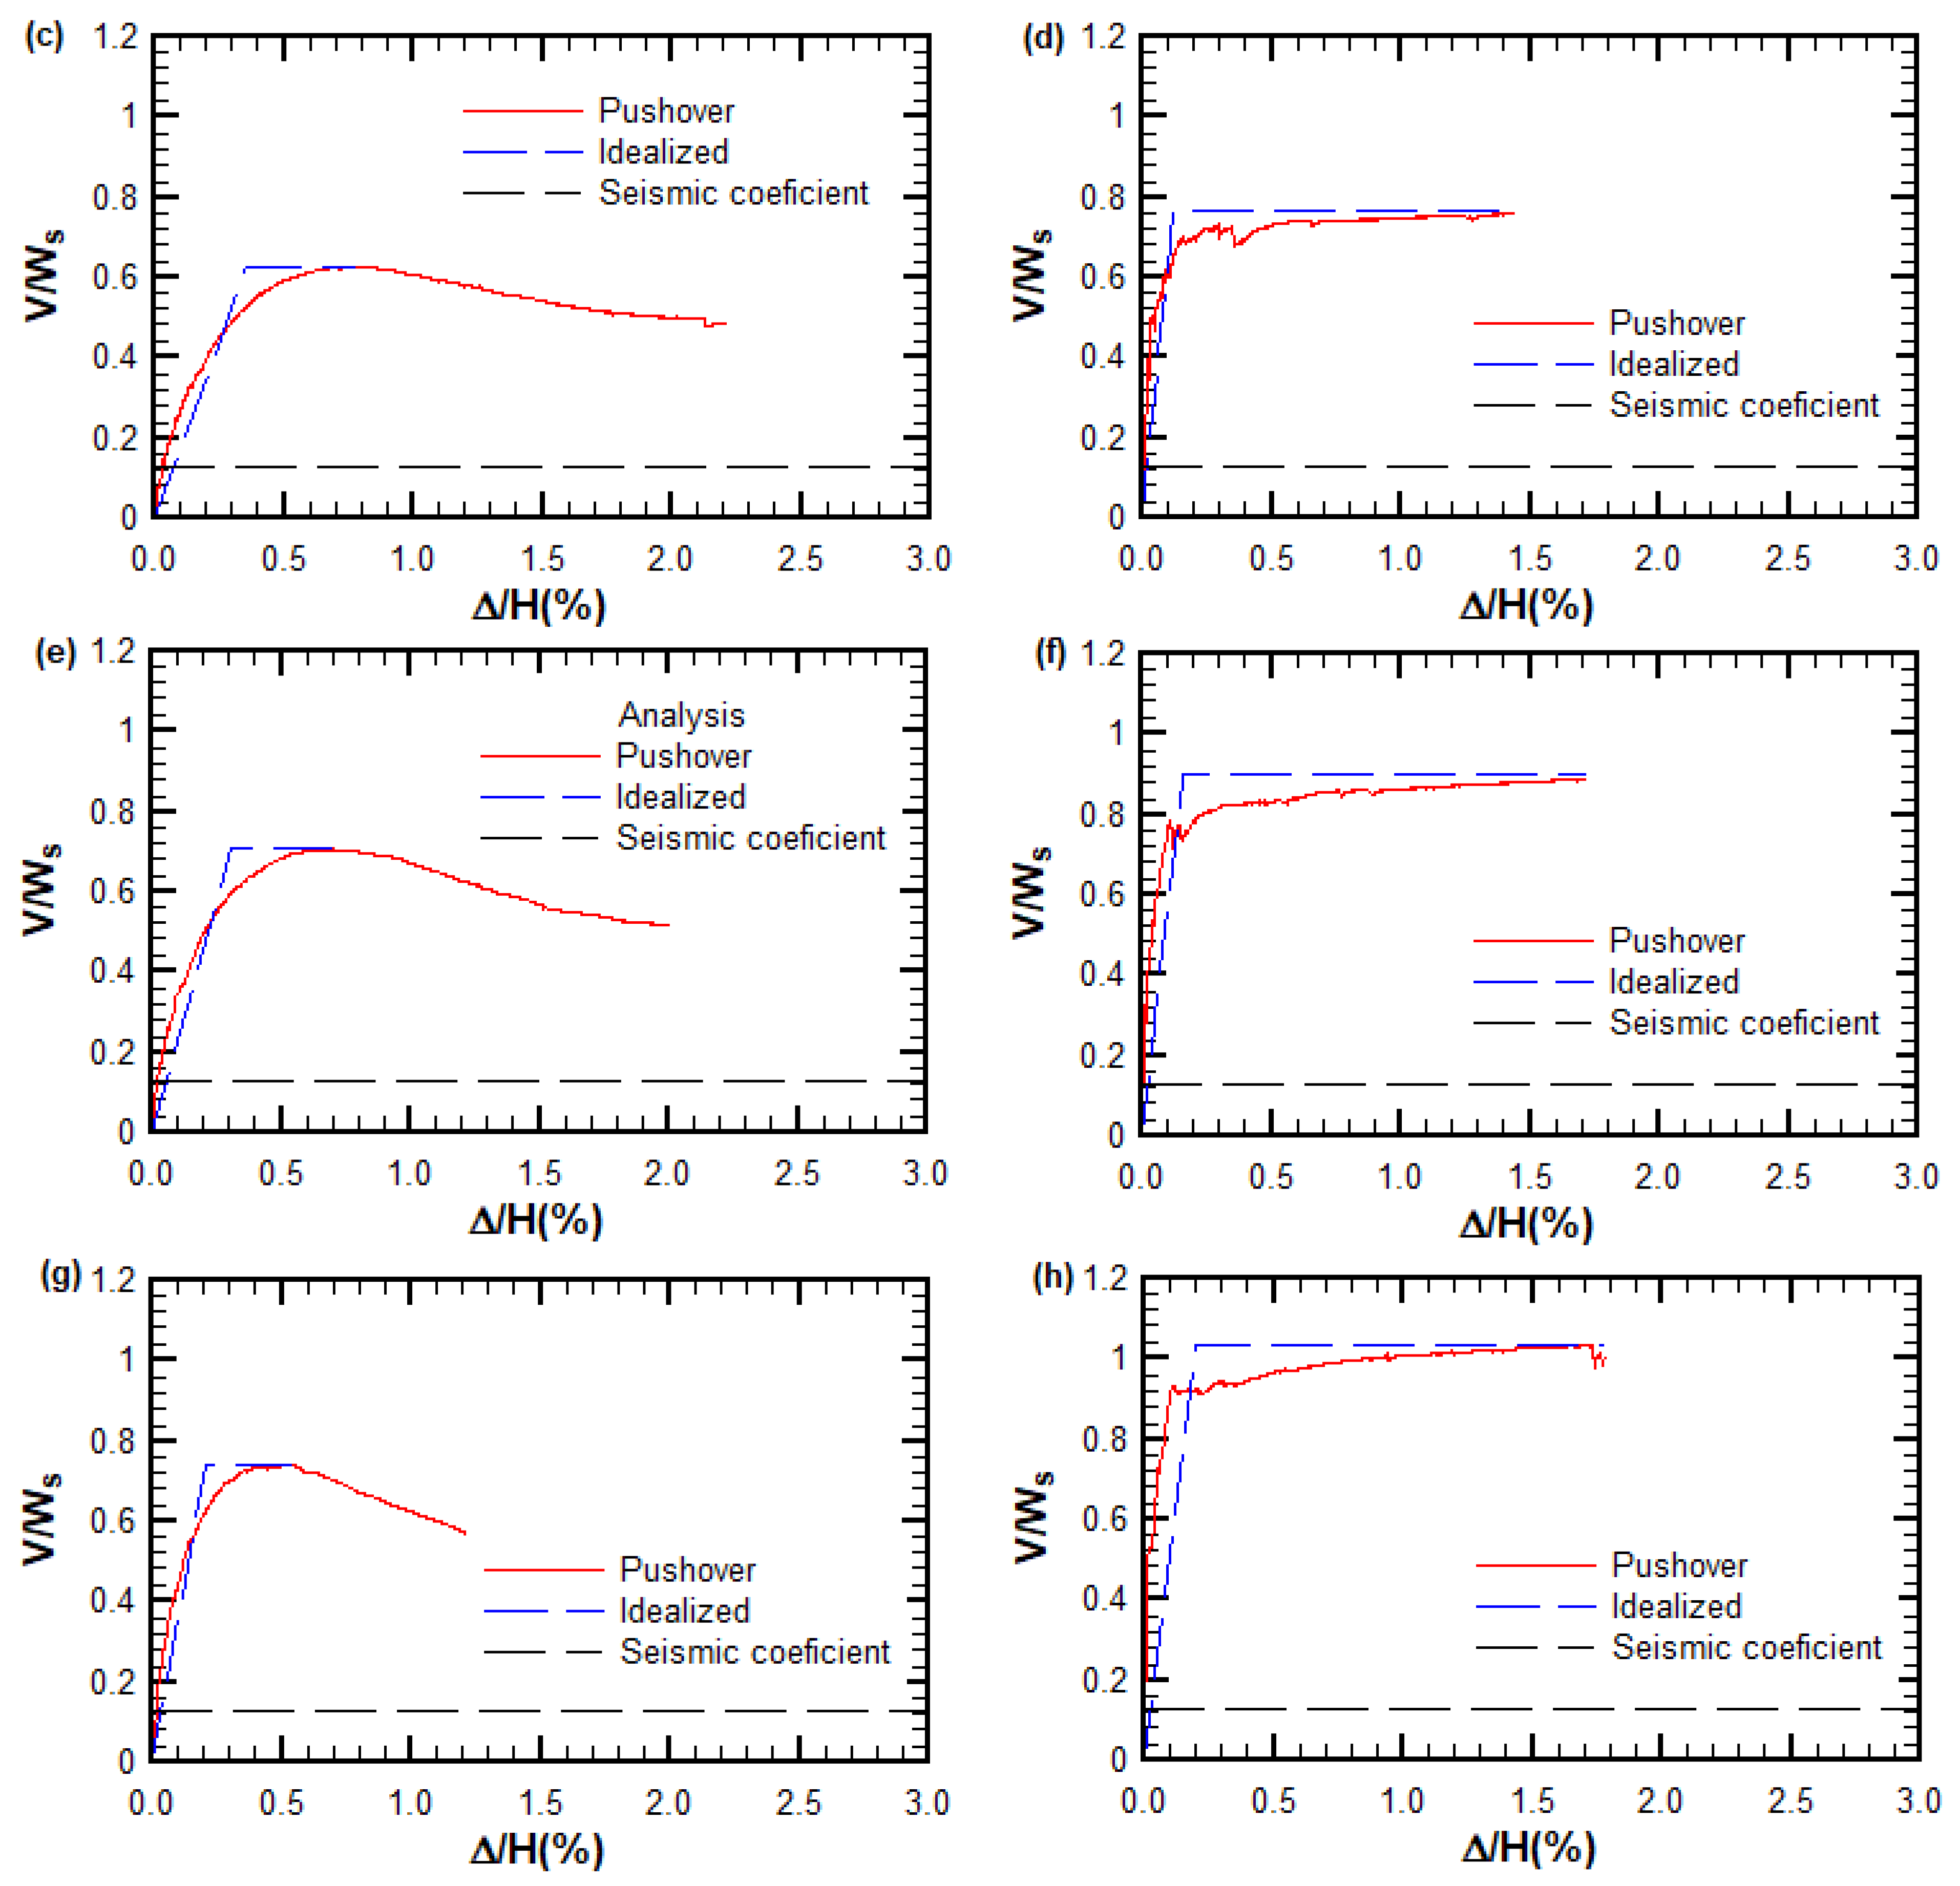
4.2. Results of Nonlinear Static (Pushover) Analysis
From the results of the nonlinear pushover analysis, two key parameters can be highlighted: the displacement ductility and the overstrength, both calculated from the capacity curve of each archetype in the two orthogonal directions. The displacement ductility was objectively determined using the area equivalence method proposed by Park [
73], applied to the segment of the capacity curve up to the point of maximum base shear. Additionally, the capacity curves were normalized with respect to the seismic weight and the height of each archetype in order to enable a direct comparison between them (see
Figure 13) [
74].
From the capacity curves, it was possible to determine several relevant coefficients that provided insight into the seismic performance of the structure. These included the displacement ductility
and the overstrength factor
, which were calculated according to the following equations:
The values obtained from the nonlinear pushover analysis for the displacement ductility and overstrength are summarized in
Table 8 and
Table 9, for the x- and y-directions, respectively.
The displacement ductility values revealed a marked difference between the x-direction (longitudinal) and the y-direction (transverse) responses of the building. This difference was largely attributed to the geometric adaptation of the structural configuration to the slope, which more significantly affected the transverse direction. Nonetheless, the overall displacement ductility behavior exhibited trends consistent with those reported in previous nonlinear analyses of buildings with similar structural typologies, particularly shear wall systems. Comparable ductility patterns have been identified in studies that applied performance-based methodologies and nonlinear time-history analyses to reinforced concrete buildings with complex wall configurations [
63,
75,
76].
Using the calculated overstrength values for each performance group (x- and y-directions), the average values were determined to be 6.5 and 6.2 for the x- and y-directions, respectively.
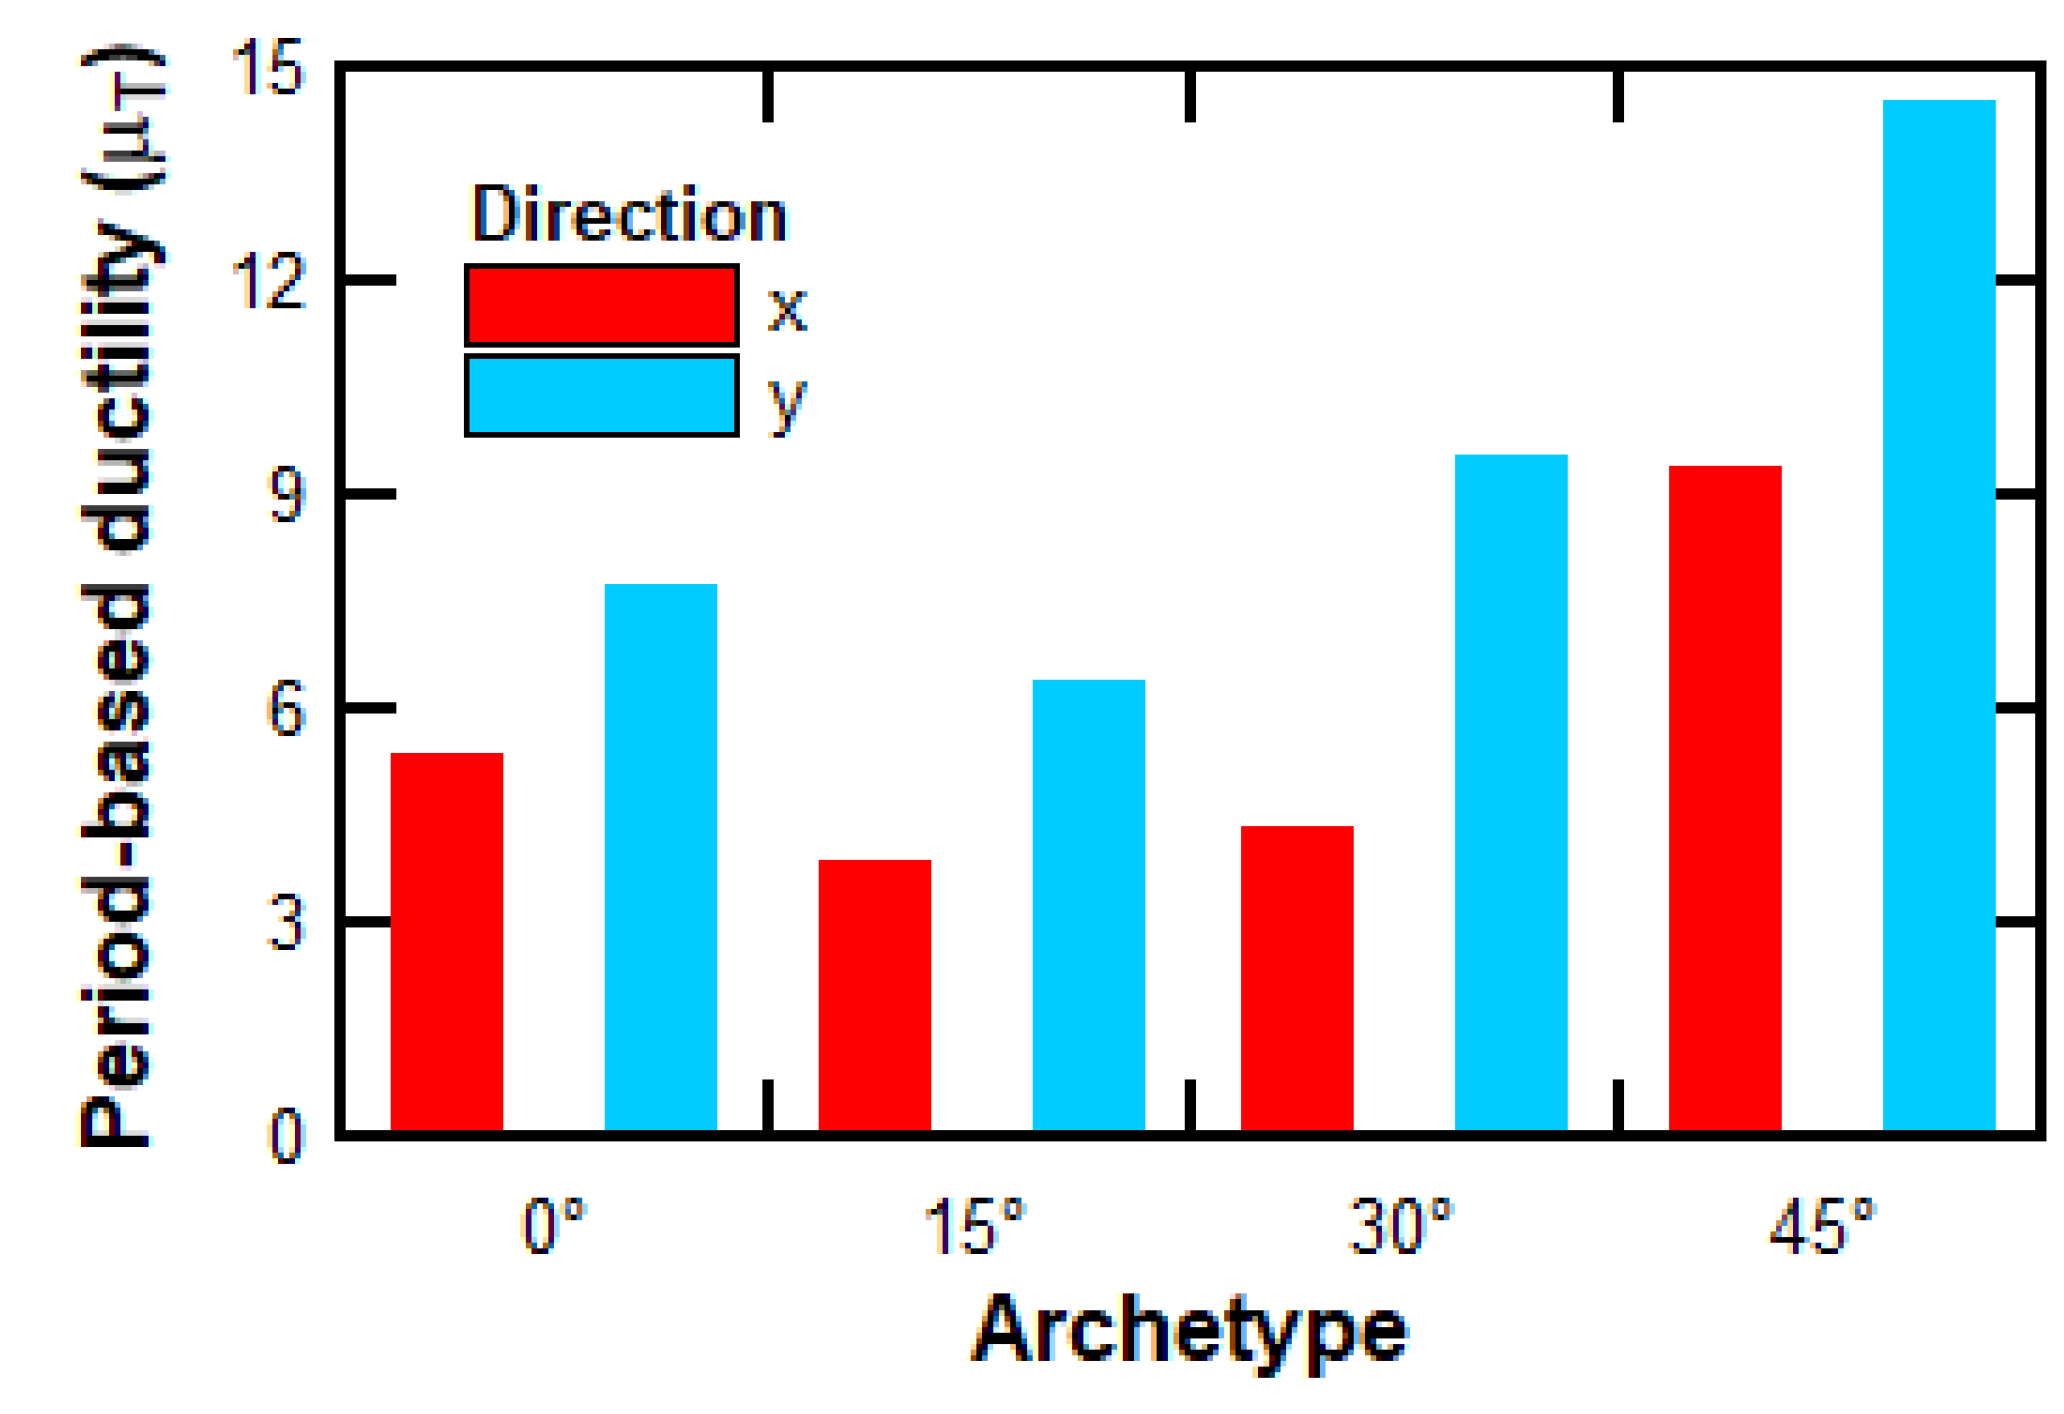
To proceed with the methodology, it was essential to calculate the period-based ductility. This calculation was carried out by defining the global yield displacement of the structural system, based on the following equation:
where
is a coefficient that correlates the roof displacement of a single-degree-of-freedom (SDOF) system,
is the ratio of the maximum base shear to the seismic weight,
is the acceleration due to gravity,
is the fundamental period calculated using the prescribed expression, and
is the first-mode period obtained from an eigenvalue analysis.
Figure 14 presents the period-based ductility values for each archetype, calculated in both analysis directions.
4.3. Results of Incremental Dynamic Analysis
The results of the incremental dynamic analysis (IDA) were obtained by applying seven pairs of ground motion records to each archetype in both analysis directions. This resulted in 14 curves per archetype for each direction. The FEMA P695 methodology recommends using a larger number of ground motions, including a variety of records representing different seismogenic sources and soil types. In the present study, a reduced number of records was employed, as all records were selected from subduction-zone events recorded on stiff soils (soil type C according to the Chilean seismic code NCh 433 [
1]). This soil type corresponds to dense soil deposits with an average shear wave velocity in the upper 30 m (
) ranging from 350 m/s to 500 m/s, which represents relatively stiff ground conditions.
While the selected ground motions corresponded to recordings on stiff soils (soil type C) with relatively uniform conditions, it should be noted that the effects of topographic amplification, such as wave trapping, focusing, or reflection due to terrain geometry, were not explicitly included. This omission was a methodological decision, as its inclusion would have required advanced 2D or 3D seismic ground response modeling coupled with the structural system analysis, which was beyond the scope of this study. Consequently, potential increases in the seismic demand associated with topography-induced amplification were not directly considered, although the geometric effects of slope on the structural configuration and performance were explicitly addressed.
It should be noted that the use of ground motions matched to the MCE spectrum represented a deviation from the standard FEMA P695 procedure, which typically relies on unmodified real records to preserve record-to-record variability. Nonetheless, this decision was based on findings from a previous study by Alarcón et al. [
77], in which incremental dynamic analysis was applied to reinforced concrete shear wall buildings using Chilean subduction records. The study reported two main challenges: high dispersion in the IDA curves and difficulties in achieving convergence during nonlinear analyses. By applying spectrum matching, both the dispersion of the response curves and the numerical convergence were slightly improved. Therefore, although the approach used in this study deviated from the FEMA’s original formulation, it enhanced the numerical stability and consistency under site-specific seismic demand conditions.
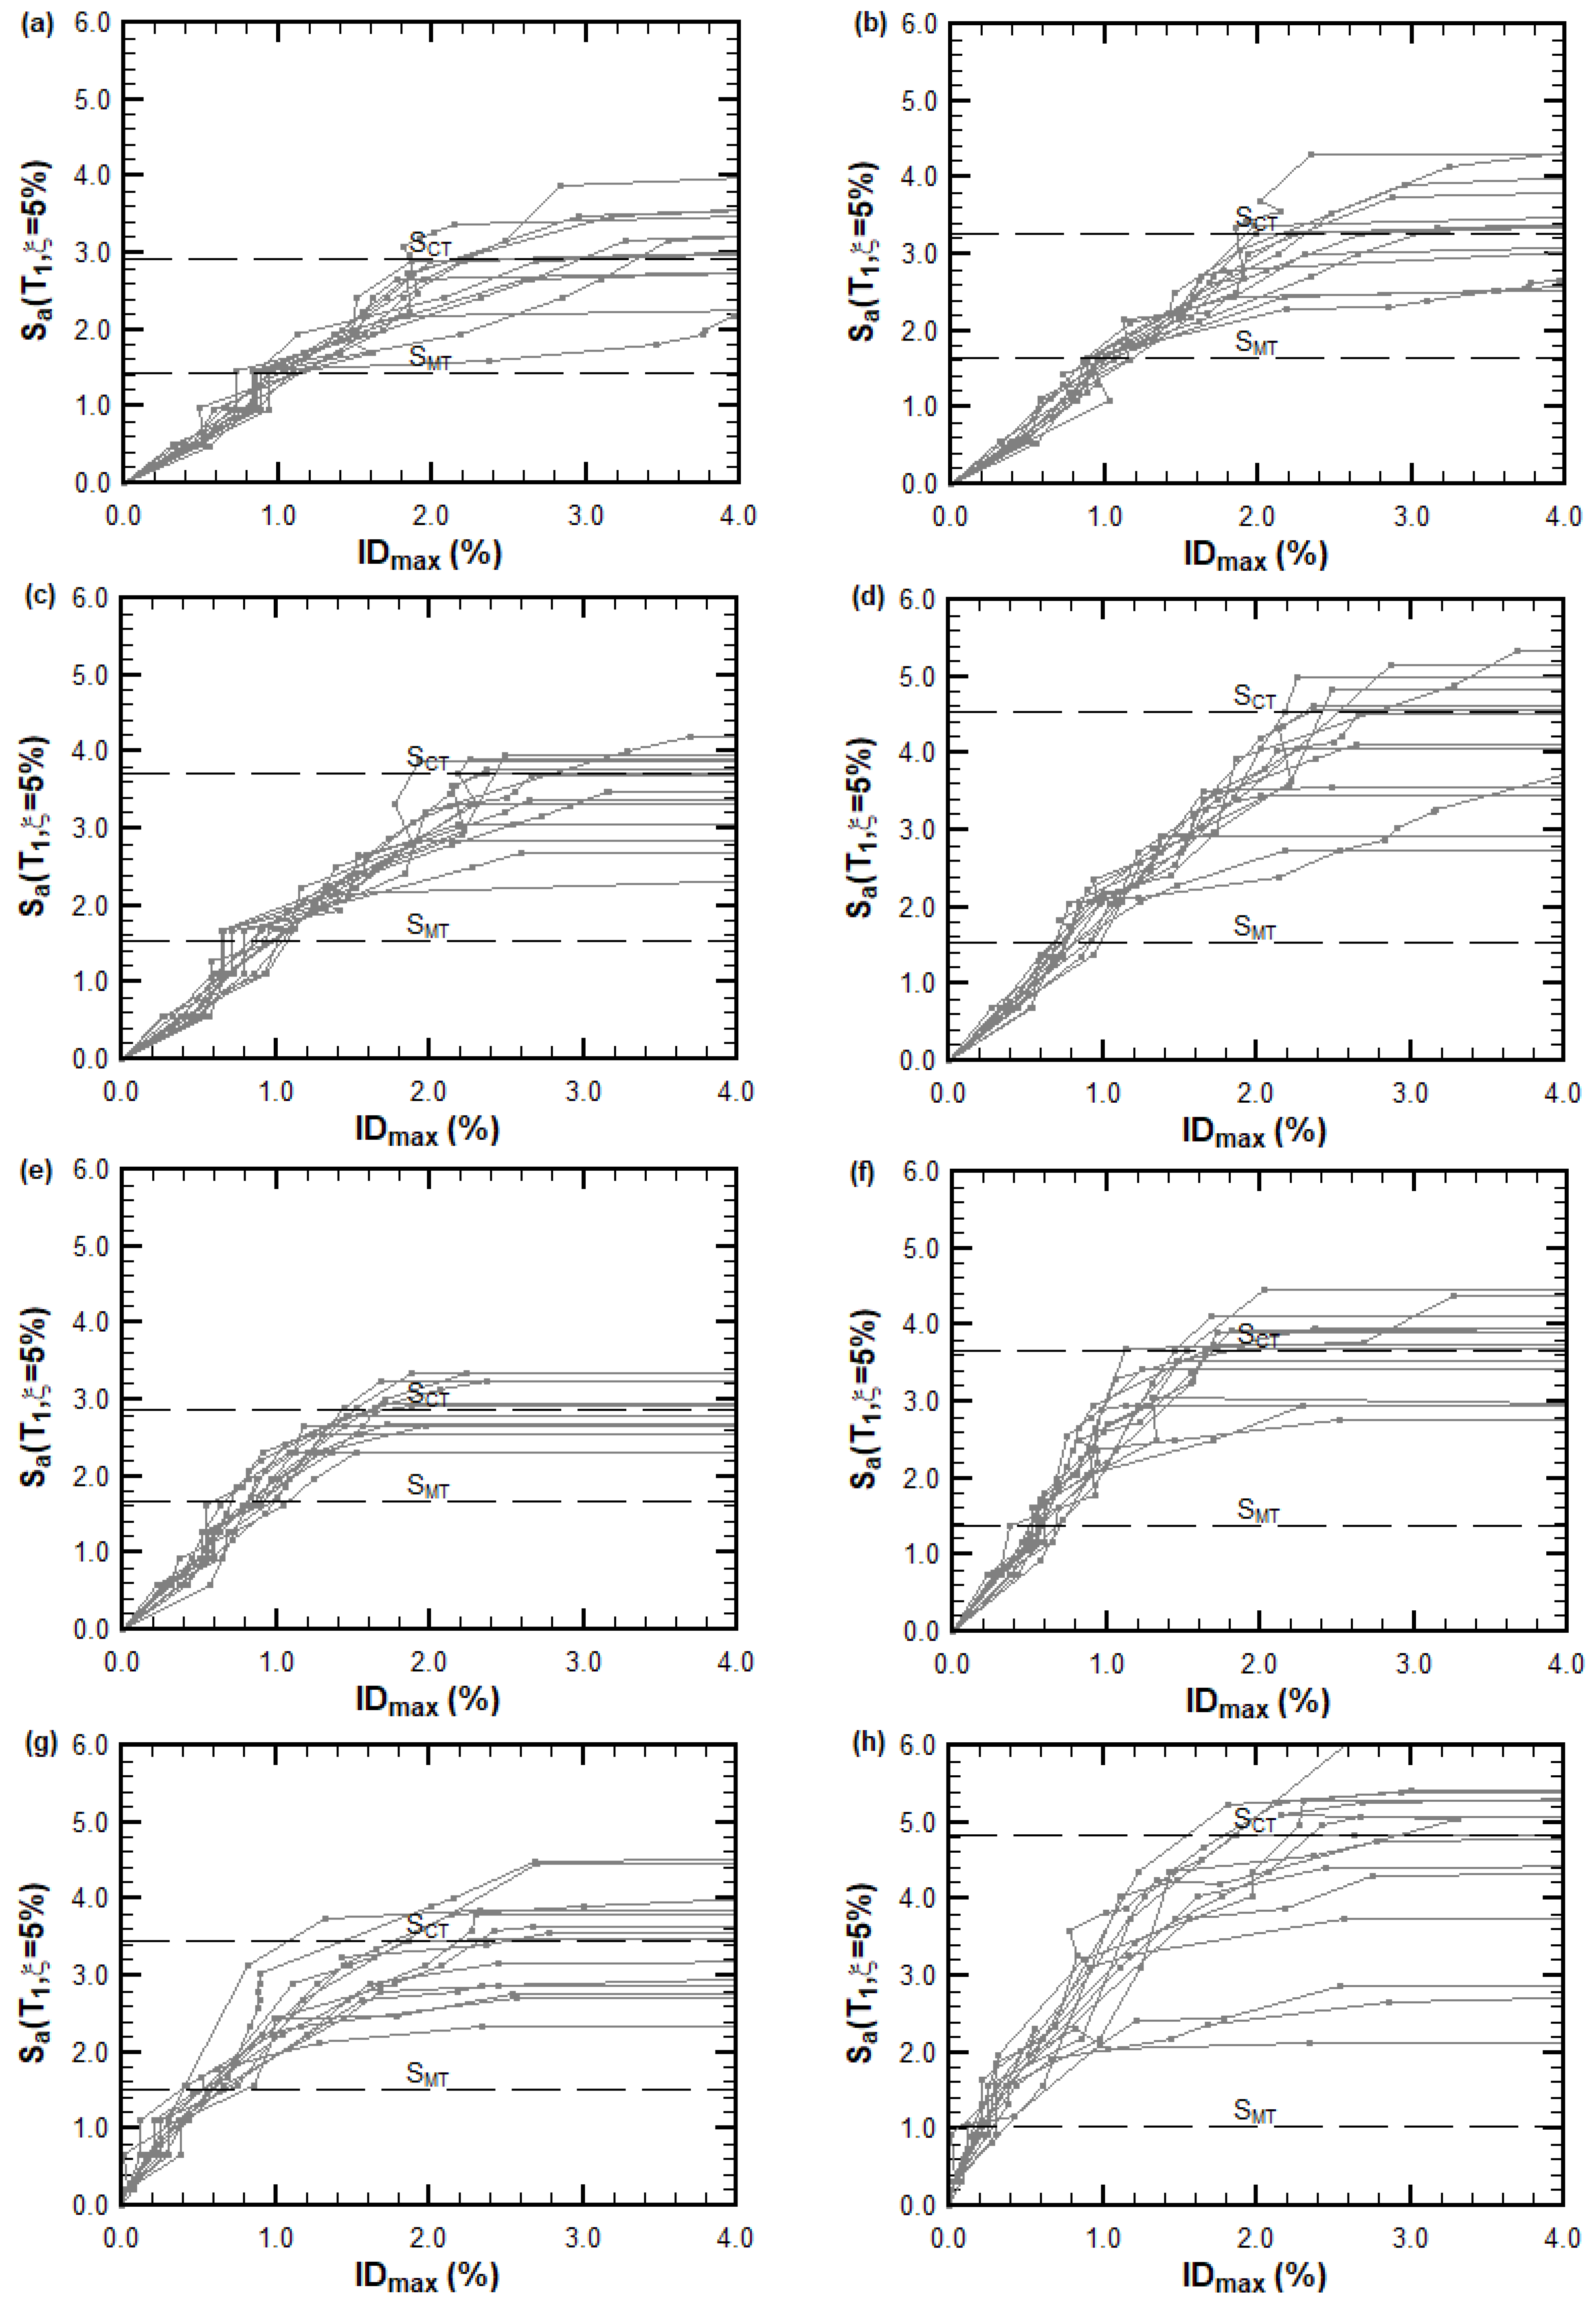
From the IDA curves shown in
Figure 15, the collapse point was identified as the point at which the slope of the curve was equal to or less than 20% of its initial slope. Once the collapse points were established, the value of the collapse safety target (
) was determined as the ground motion intensity at which more than half of the curves (i.e., the median plus one) had reached collapse.
Among all the results obtained from the IDA curves, the methodology required only the identification of the median collapse intensity . An efficient way to determine this was by scaling all selected ground motion records relative to the maximum considered earthquake (), whose intensity is denoted as , and initiating the analyses from this intensity level until at least half of the scaled ground motions produced collapse.
The lowest intensity level at which half of the ground motions caused collapse was considered the median collapse intensity . This approach to adjusting the intensity of the records significantly reduced the number of dynamic analyses required, compared with a standard IDA procedure.
Next, the intensity of the maximum considered earthquake
was calculated directly from the design spectrum for a given fundamental period
. The ratio between the median collapse intensity and the
intensity provided the value of the collapse margin ratio (
):
Table 10 summarizes the results extracted from the IDA curves, as well as the calculated values of the collapse margin ratio (
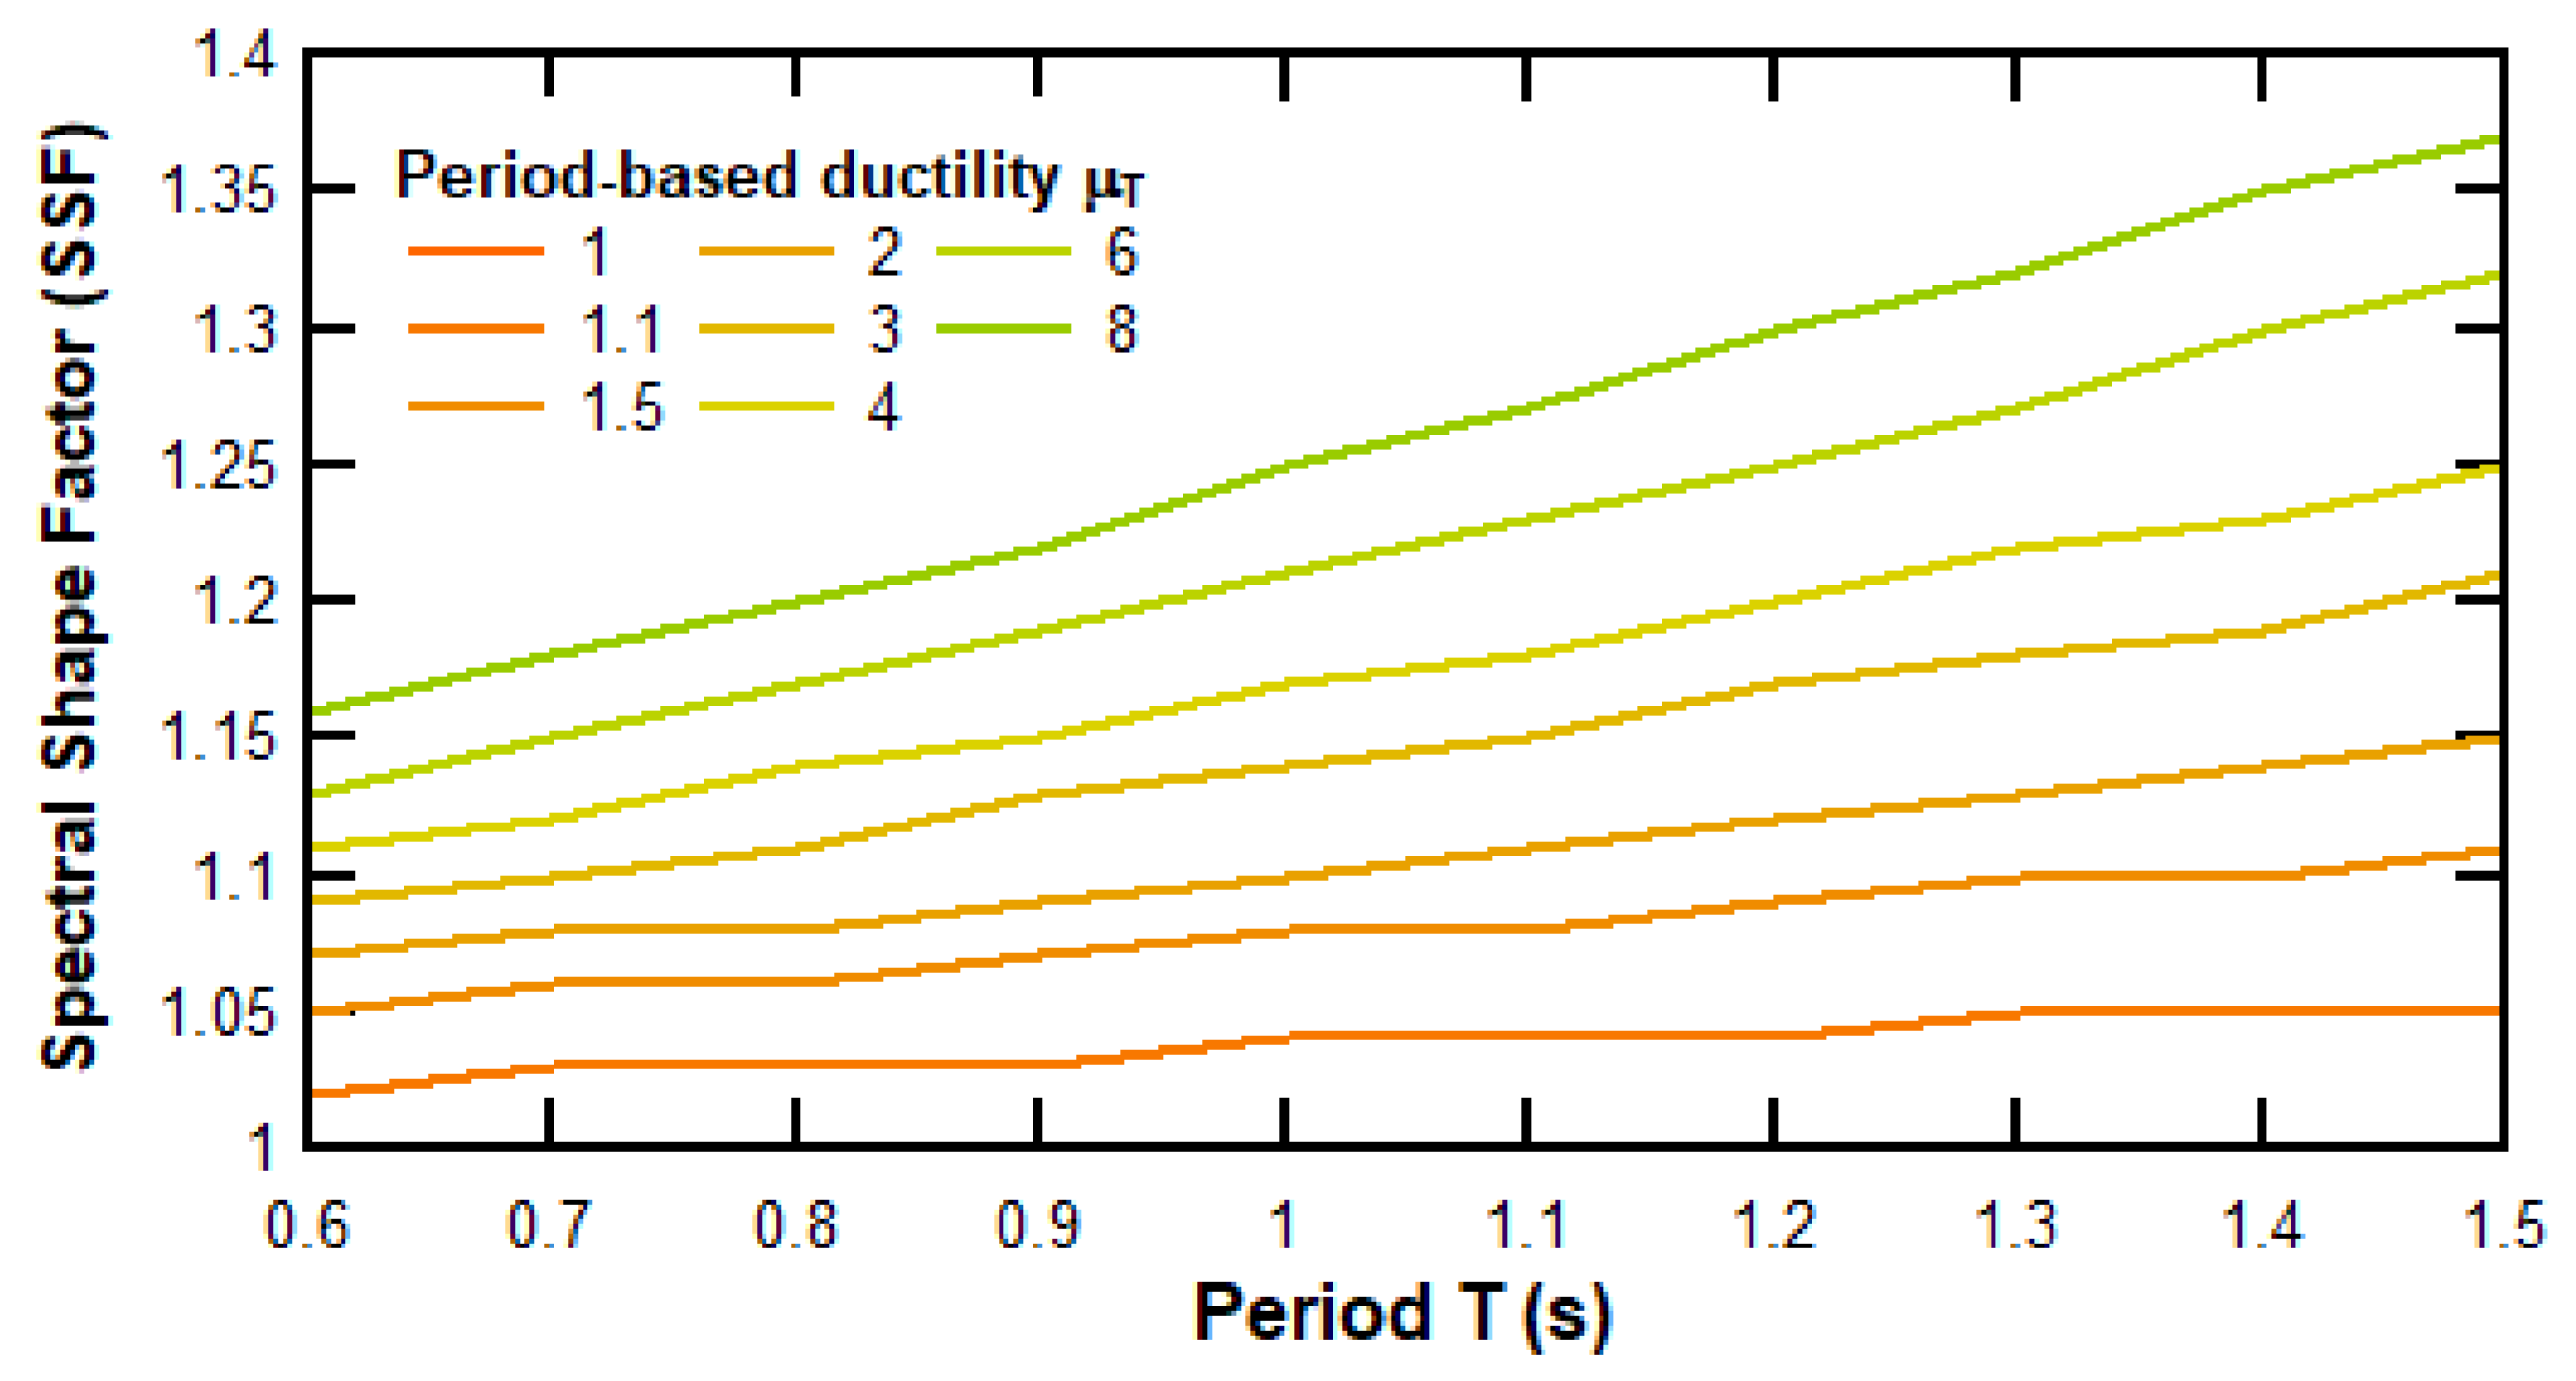
) for each analysis direction. The values of the spectral shape factors (
) were interpolated from the curves in
Figure 16, using the displacement-based ductility values calculated for each archetype and analysis direction, in conjunction with their predominant periods.
4.4. Total System Uncertainty
The total system uncertainty was determined using the following expression:
where
: the total system uncertainty (bounded between 0.275 and 0.950);
: the record-to-record uncertainty (0.20–0.40) (calculated value = 0.4);
: the design requirements uncertainty (0.10–0.50) (assumed value = 0.2);
: the test data uncertainty (0.10–0.50) (assumed value = 0.2);
: the modeling uncertainty (0.10–0.50) (assumed value = 0.2).
FEMA P695 explicitly links uncertainty parameters to the quality of design provisions, experimental data, and nonlinear modeling. These are categorized as superior (β = 0.10), good (β = 0.20), fair (β = 0.35), and poor (β = 0.50). When combined with record-to-record (RTR) uncertainty—dependent on the period-based ductility—this approach yields a total system collapse uncertainty ranging from = 0.275 for high-certainty systems to = 0.950 for low-certainty systems. The values used in this study fell within that range and reflected both the structural typology considered and the quality of the available data and modeling tools.
The record-to-record uncertainty reached its maximum value for all the analyzed archetypes, as the period-based ductility exceeded a value of 3 in every case (see the results in
Figure 14). Based on the values used, the total uncertainty was calculated as
= 0.53. This value was used to determine the adjusted acceptable collapse margin values for target collapse probabilities of 10% and 20%. These values were obtained by interpolating the reference data provided in FEMA P695, according to the procedure used in [
78].
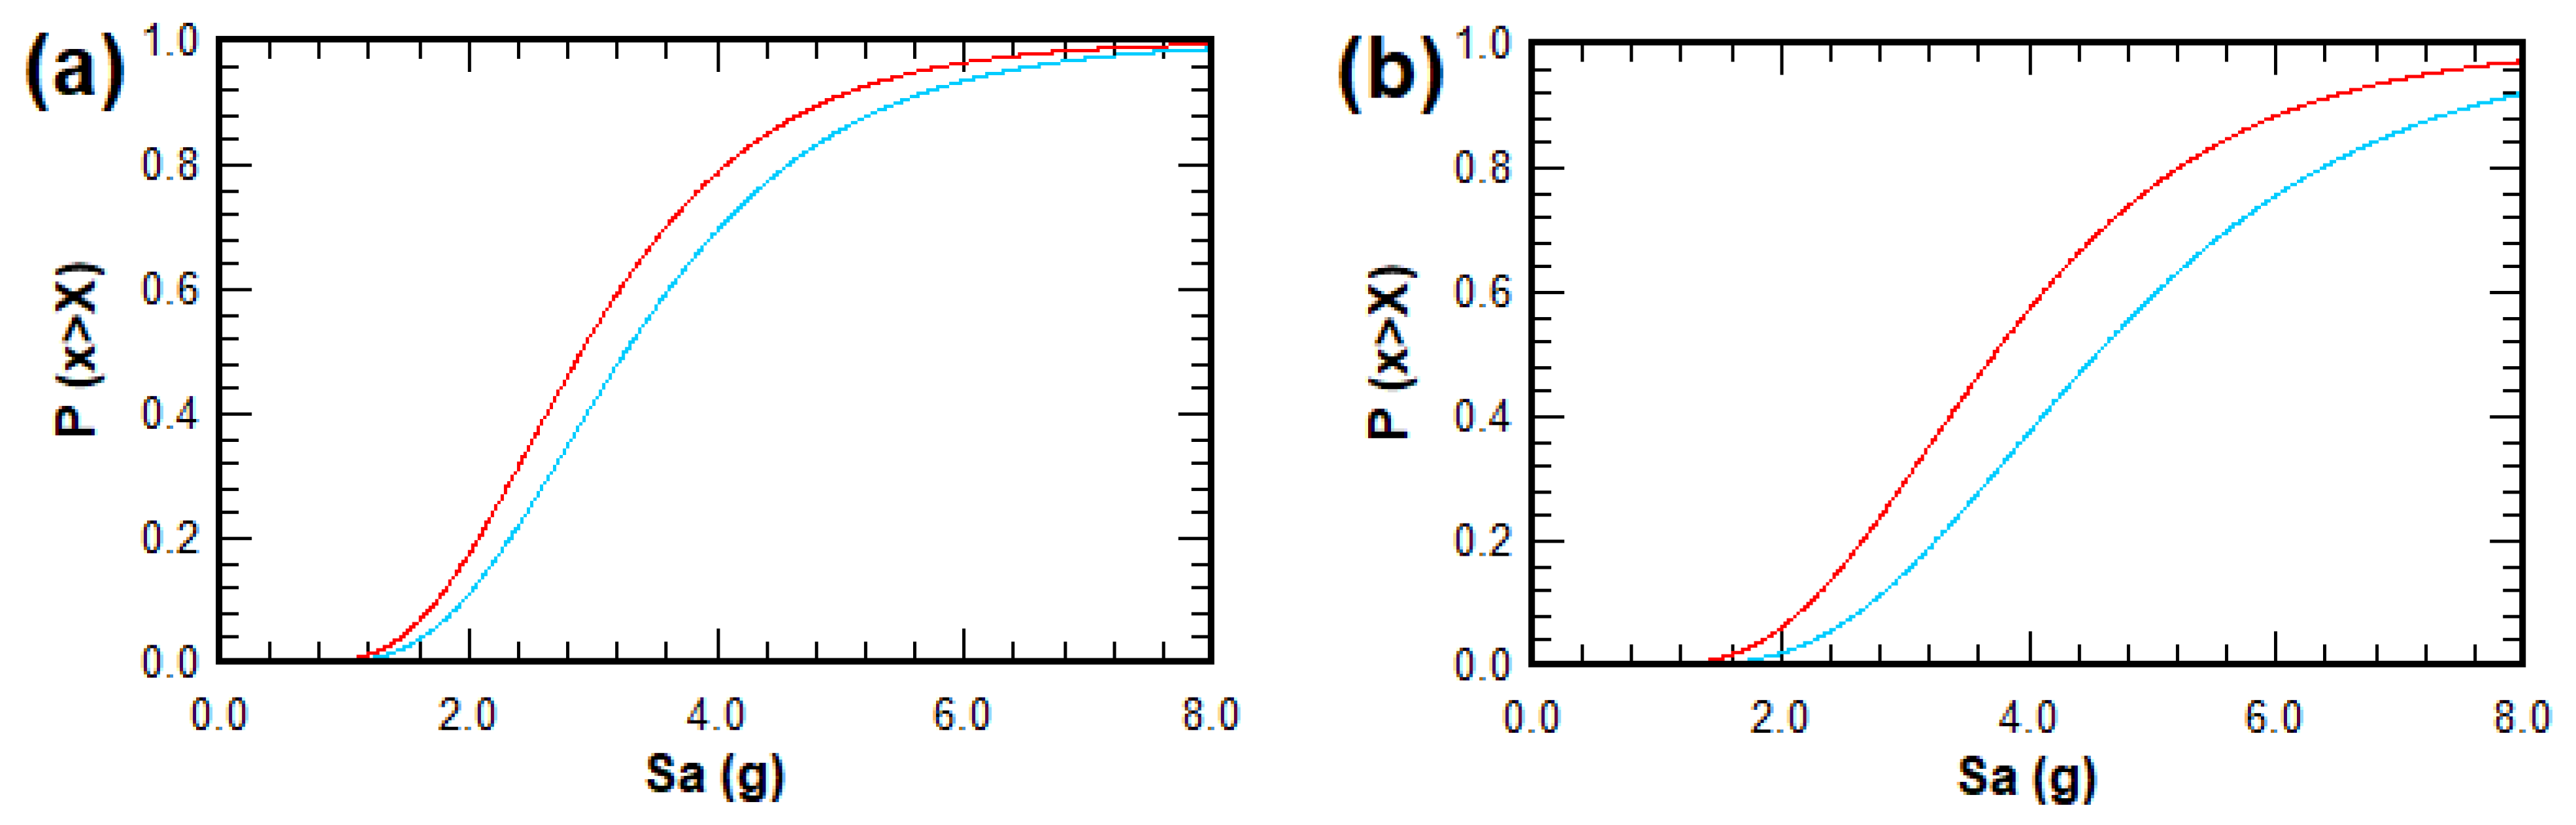
Using the obtained values of
and the associated record-to-record uncertainty, fragility curves were developed for the studied archetypes. The resulting fragility curves are shown in
Figure 17, where paired curves for each analysis direction can be observed. It is important to note that the fragility curves for all archetypes exhibit higher values of
in the y-direction than in the x-direction, indicating that the archetypes are less likely to collapse under a given seismic demand, expressed as the spectral acceleration
in the y-direction compared with the x-direction.
Using the values of
, interpolation was performed on the fragility curves to obtain the probability of collapse in each analysis direction under the seismic demand corresponding to the maximum considered earthquake (
). The resulting values are presented in
Table 11, detailing the probability of collapse (%) for
-level demand.
According to these results, the probabilities of collapse for the archetypes—except for the 30° archetype in the x-direction—were very low. It is also worth noting that, with the exception of the 0° archetype, the collapse probabilities in the y-direction were consistently lower than those in the x-direction. This highlights that the structural stiffening effect induced by the slope reduced the lateral displacements and, consequently, the extent of damage experienced by the structures.
For the 30° archetype, the collapse probability remained below 10% in both principal directions; however, a noticeably higher value was observed in the x-direction. This outcome was attributed to the combination of two factors: the lowest collapse capacity (SCT) and the highest seismic demand (SMT) among all archetypes in that direction. This condition was further explained by the fact that the fundamental period of this archetype aligned with the peak of the MCE response spectrum, as illustrated in
Figure 5 (the elastic and inelastic spectra for the 0° building archetype). This finding suggests that a structural redesign may be necessary to reduce the vulnerability of the 30° archetype in the x-direction.
A comparative analysis of the collapse probabilities revealed consistently lower values in the y-direction across all archetypes. This outcome was directly associated with higher SCT values in the y-direction, which represented a greater structural capacity to resist collapse. This increased capacity was attributed to the greater stiffness of the buildings in this direction, requiring higher seismic acceleration levels to reach the median collapse threshold (SMT). The percentage differences in the SCT between the y- and x-directions were calculated as 12%, 22%, 27%, and 39% for the archetypes with slope inclinations of 0°, 15°, 30°, and 45°, respectively. These findings suggest a clear trend: as the slope became steeper, the geometric adaptation of the structure led to increased rigidity in the y-direction, thereby enhancing its ability to withstand collapse.
4.5. Acceptable Collapse Margin Ratio Values
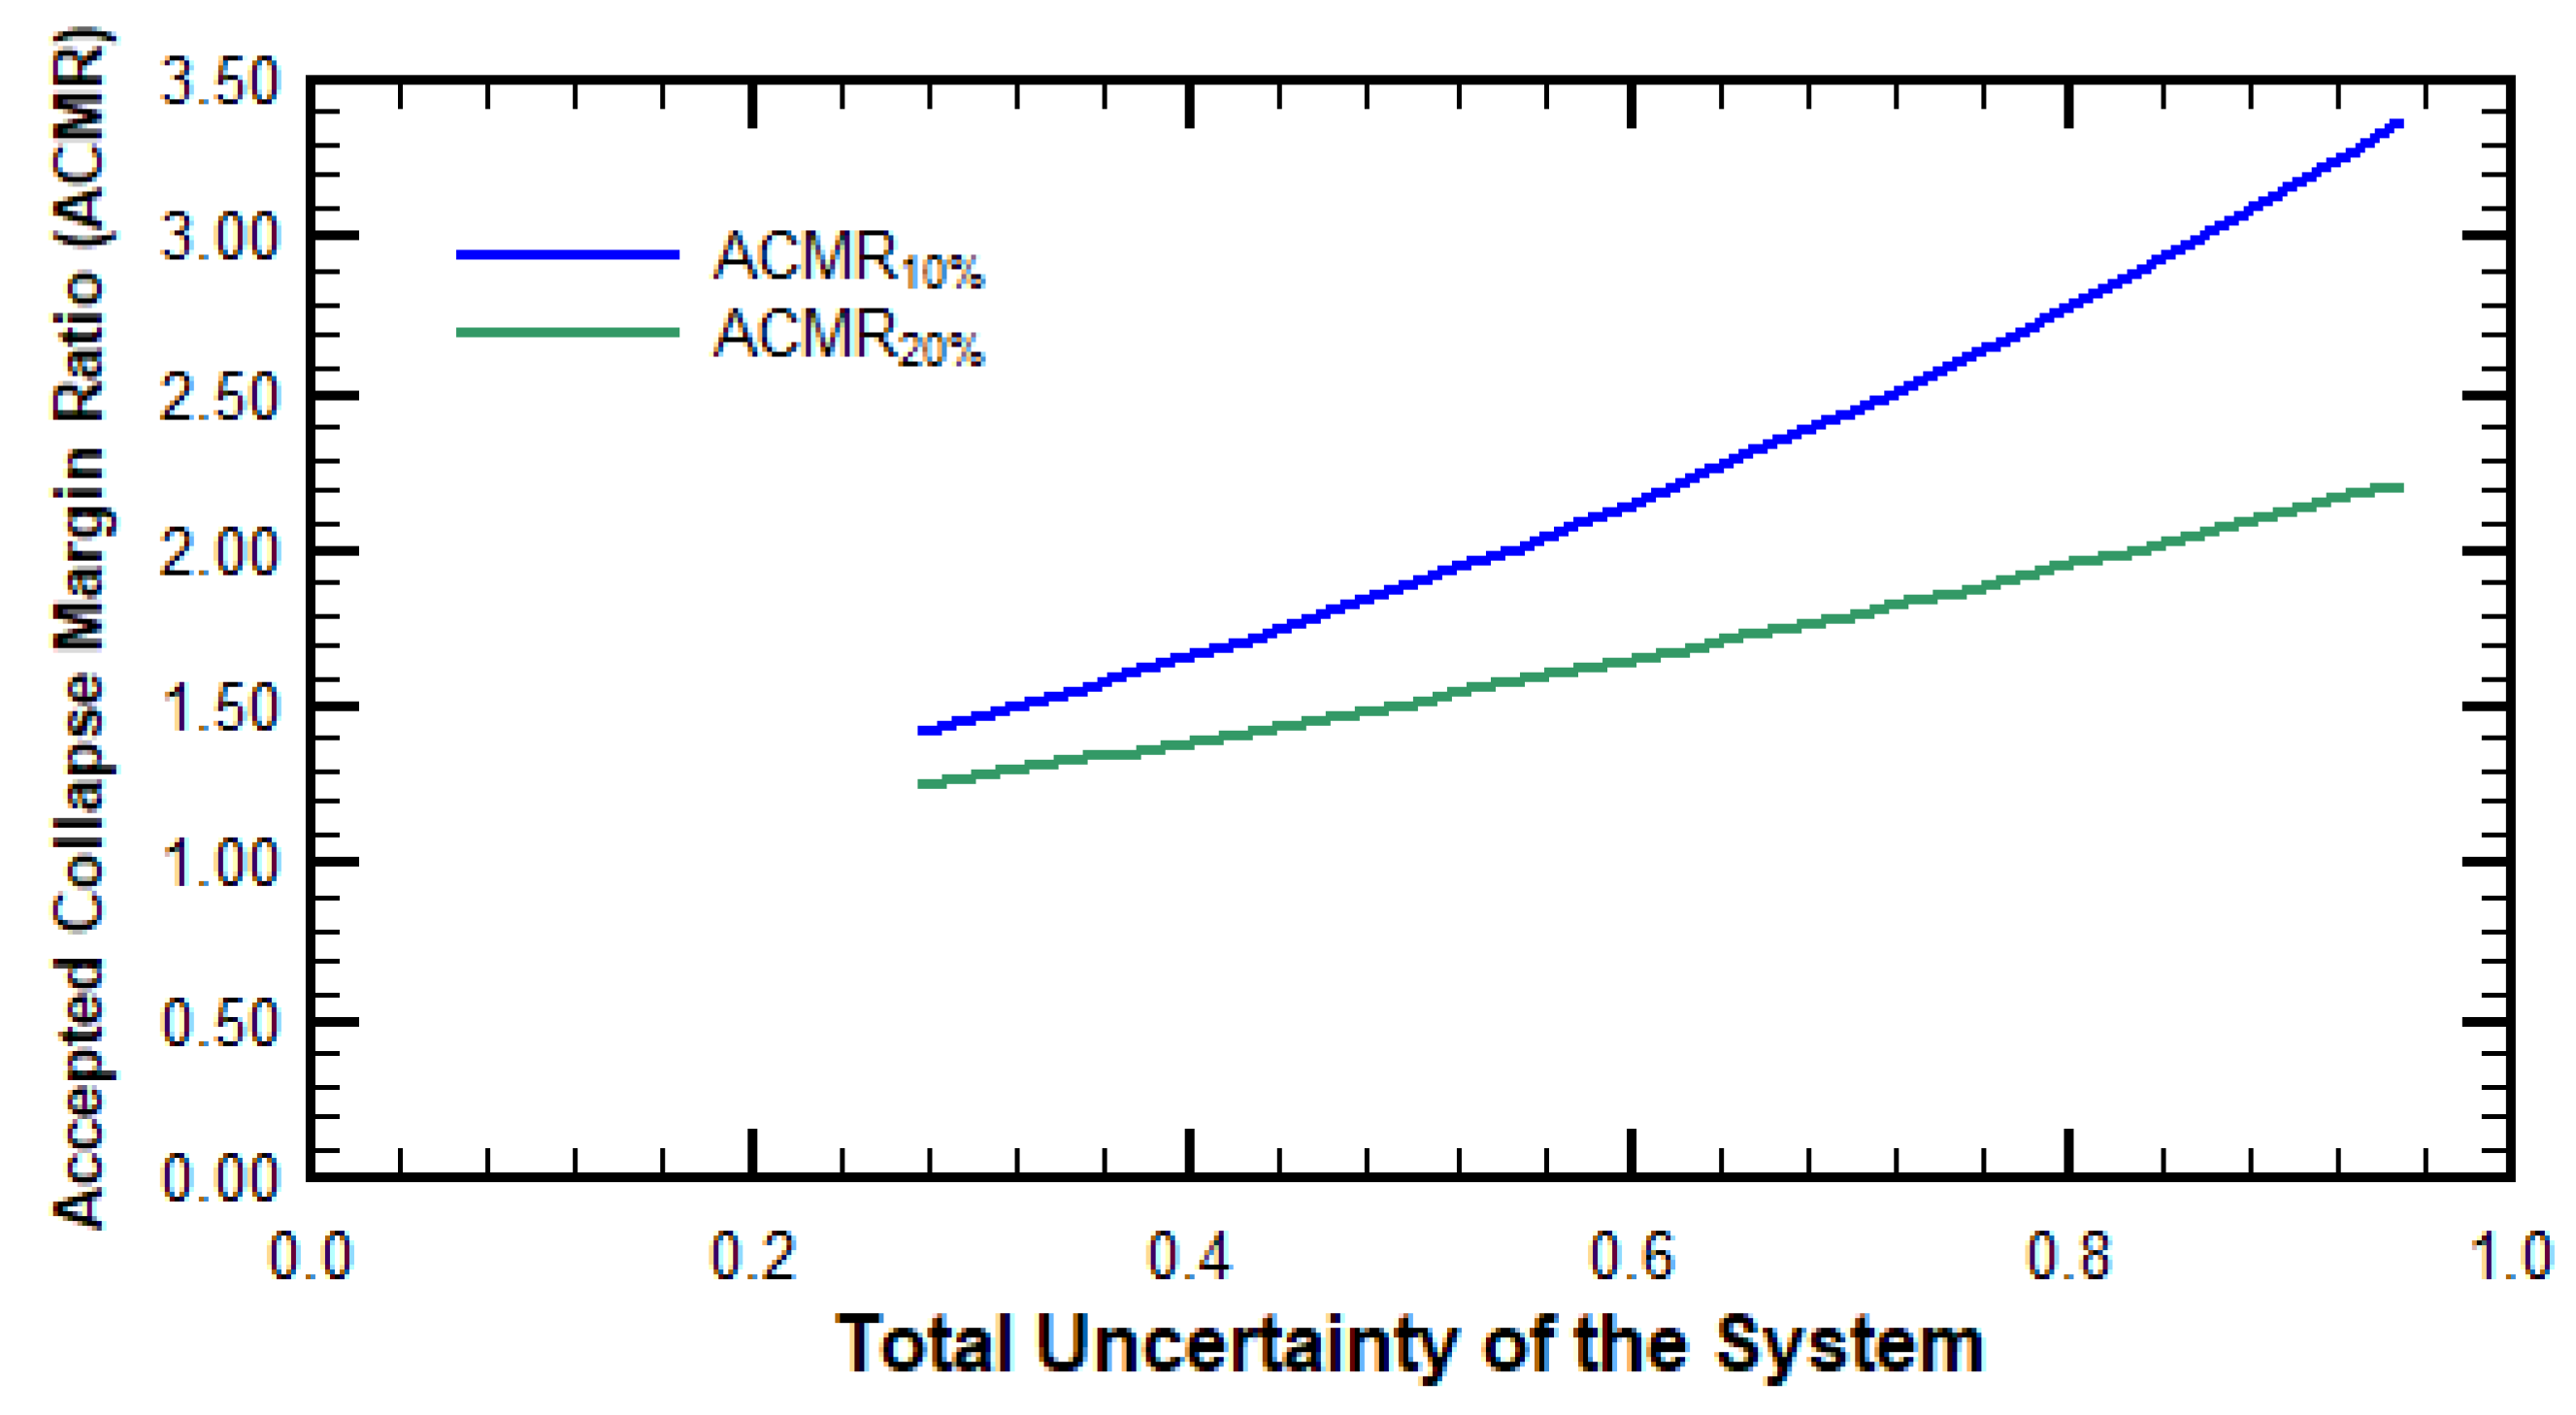
Given the known values of the total system uncertainty and the established acceptable probabilities of collapse, it was possible to determine the acceptable collapse margin ratios.
Figure 18 presents the values of the acceptable collapse margin ratio
and
, which were based on the total collapse uncertainty and the target collapse probabilities of 10% and 20%, respectively.
By interpolating with
in the curves shown in
Figure 18, the following values were obtained:
and
.
4.6. Evaluation of Response Reduction Factor
The response reduction factor () used in the design is presented in the corresponding table for each archetype and in both analysis directions. An acceptable performance according to FEMA P695 is achieved when the following two conditions are satisfied:
The probability of collapse for ground motions is approximately or less, on average across a performance group.
The probability of collapse for ground motions is approximately or less for each index archetype within a performance group.
Figure 19 summarizes the calculated values for the four archetypes used in this study, as well as the average values across the group of archetypes for each analysis direction. It is observed that the individual values for all archetypes exceeded
, while the average values in each direction exceeded
. Therefore, the response reduction factors (
) employed in the analysis and design process can be considered safe with respect to collapse for the studied shear wall buildings founded on sloping ground.
4.7. Evaluation of System Overstrength Factor
The FEMA P695 methodology stipulates that the system overstrength factor must not be less than the highest average overstrength value calculated among the archetypes. Referring back to the values presented in
Section 4.2, the overstrength factor for the considered system was determined to be
. This value was calculated as the greater of the average overstrength values in the x- and y-directions (6.47 and 6.23, respectively) and then rounded to the nearest multiple of
.
This selected value satisfied the assumptions established by the methodology: it was a multiple of
and did not exceed by more than
of the value of the response reduction factor (
) used in the structural design (see
Table 8 and
Table 9), which was validated in the preceding steps.
4.8. Evaluation of Displacement Amplification Factor
Regarding the displacement amplification factor, although the current version of the Chilean seismic design code does not consider the amplification of displacements obtained from the modal response spectrum analysis to account for the effect of reducing the elastic design spectrum through the response reduction factor (
), the displacement amplification factor
was calculated using the following expression:
In this equation,
is the response reduction factor and
is the damping coefficient, which depends on the effective damping and the structural period, as obtained according to ASCE 7-05 [
79]. To determine the value of the damping coefficient, a reference period
was considered, based on the corresponding empirical expression provided in ASCE 7-05.
Since the fundamental periods of all archetypes in both analysis directions exceeded this value, and considering that the Chilean seismic code assumes a damping ratio of 5% for reinforced concrete buildings, the value of
was equal to
. Applying this coefficient, the displacement amplification factors that may be used for estimating the seismic displacement and drift demands for the analyzed archetypes are those shown in
Figure 20.
Although displacement amplification factors are not currently used in the Chilean seismic code [
1] for the estimation of inelastic displacements, they were applied in this study to align with the output requirements of the FEMA P695 methodology. This allowed for consistency with international practices, such as those adopted in ASCE 7 and Eurocode 8. The results obtained may provide a useful reference for potential future revisions of the Chilean code. Additionally, a sensitivity analysis is recommended to assess the impact of varying the critical damping ratio from the standard 5%, in line with the provisions of ASCE 7 for adjusting the
factor.
5. Conclusions
In this study, the seismic response of reinforced concrete shear wall buildings located on sloping terrain was evaluated using the FEMA P695 methodology. Structural archetypes were designed and analyzed for ground inclinations ranging from 0° to 45°, incorporating nonlinear analyses of both pushover and incremental dynamic analysis (IDA) types. Based on the results obtained, the seismic design factors were validated and adjusted, including the response reduction factor, overstrength factor, and displacement amplification factor.
The main findings of this study can be summarized as follows.
Influence of slope on seismic response:
It was found that the terrain inclination introduced significant modifications to the structural response of buildings. In particular, in the direction orthogonal to the slope, a reduction in system flexibility and an increase in lateral stiffness were observed, leading to reduced lateral displacements and an altered internal force distribution within the structure.
Additionally, it was determined that the slope affected the base shear force. Although it resulted in a reduction in the response reduction factor () of up to in the most extreme case—and, consequently, an increase in the seismic acceleration demand—the accompanying decrease in seismic weight led to an overall reduction in the design base shear force.
Structural safety and adjustment of seismic factors:
While the current design approach in Chile, based on standard R-values, provides an adequate safety margin, the results indicate the need to differentiate seismic design parameters between the directions parallel and orthogonal to the slope. This would allow for the optimization of the structural response and help avoid both overdesign and underperformance.
Collapse probability and safety margin:
The estimated probability of collapse for the archetypes was below the threshold recommended by FEMA P695 in most cases, with a maximum value of . This maximum was observed in the archetype founded on a slope in the direction parallel to the incline, highlighting the need to reinforce certain design criteria in such configurations.
Effect of overstrength factor:
The calculated overstrength values met the requirements of the FEMA P695 methodology. However, increases in overstrength of up to compared with the flat-ground archetype were observed for cases with slopes greater than in the direction orthogonal to the slope. This indicated a less efficient energy dissipation mechanism, likely due to the reduction in structural elements at the lower levels caused by the terrain geometry.
Displacement amplification factor:
The current Chilean seismic code does not explicitly account for the amplification of displacements induced by the use of the response reduction factor () to reduce the design spectrum. The results of this study suggest that for buildings located on sloping terrain, consideration of this factor may improve the estimation of drifts and displacements during design. These findings are consistent with the provisions in EC-8, where the displacement amplification factor is set equal to the response reduction factor used in the analysis.
The effect of topography on the seismic response of buildings:
Although this study focused on the structural evaluation of seismic design parameters through archetypes located on sloping terrain and founded on stiff soils, the results highlight the importance of site conditions in defining the seismic demand. In this context, future developments in seismic design codes could benefit from complementary geotechnical assessments, such as 2D and 3D seismic response analyses that consider slope-induced amplification. While these aspects are beyond the scope of this research, their integration with methodologies such as FEMA P695 would support the development of more comprehensive seismic design strategies for buildings located on hillsides.
This study confirms that increased structural stiffness in the y-direction—resulting from the geometric adaptation of buildings to sloped terrain—leads to a higher collapse capacity and, consequently, a lower probability of collapse. This effect becomes more pronounced as the slope angle increases, highlighting the importance of considering directional stiffness variations in the seismic design of hillside structures.
Future work could incorporate the direct modeling of topographic amplification effects through two- or three-dimensional numerical techniques that couple geotechnical and structural responses. For example, the use of finite element methods (FEM) or finite difference methods (FDMs), incorporating nonlinear soil behavior and the soil–structure interaction (SSI), would allow the simulation of ground motion modifications induced by site-specific topographic conditions. Additionally, the development of response spectra that account for potential topographic influences, derived from parametric studies or a calibrated numerical model, could serve as a practical tool for the performance-based seismic design of hillside structures. While the implementation of such models requires advanced expertise and significant computational effort, pilot studies focusing on simplified slope geometries or critical structural typologies could serve as an effective starting point.
In future studies, it is also recommended to use acceleration records obtained from other soil types that are consistent with the corresponding code-based classifications, and to increase the number of records to reach the 22 pairs recommended in FEMA P-695. It is also advisable to conduct sensitivity studies to properly assess the minimum number of ground motions required.


