
Chemical Safety Risk Identification and Analysis Based on Improved LDA Topic Model and Bayesian Networks


Abstract
1. Introduction
2. Materials and Methods
2.1. Dataset and Data Preprocessing
- (1)
- Domain Dictionary: Although the Jieba system comes with a dictionary for splitting words that contain the most common words (e.g., reactor, piping, etc.), current natural language processing systems exhibit significant limitations in recognizing domain-specific terminology, particularly technical terms such as ‘distillation tower’, ‘intermediate chamber’, ‘steam valve’, and ‘gas detector’ that are essential for accurate process industry documentation analysis. When these words are encountered, the Jieba segmentation system may split the entire proprietary word into two or more words, thereby destroying words that would otherwise be highly indicative of safety risk factors. The implementation necessitates constructing a domain-specific lexicon incorporating these industry terms and subsequently integrating this customized dictionary into the segmentation system to the Jieba word-splitting system.
- (2)
- Dictionary of synonyms: The prevalence of synonymous expressions in accident investigation reports introduces lexical variation that adversely affects tokenization consistency, resulting in fragmented segmentation outputs, leading to a significant increase in the difficulty of cluster analysis. Therefore, all the synonyms can be replaced with a word, such as pipeline or steam pipe, which can be substituted with pipeline.
- (3)
- The accident reports contain significant noise elements including non-informative tokens, uncontextualized numerals, and extraneous punctuation marks that require filtration, for instance, yes, 3, “!” etc. The terms demonstrate no statistically significant relevance to the analytical framework and should be incorporated into deactivated word dictionary of the Jieba participle system to be eliminated.
2.2. Keyword Extraction
2.3. LDA Subject Modeling
- (1)
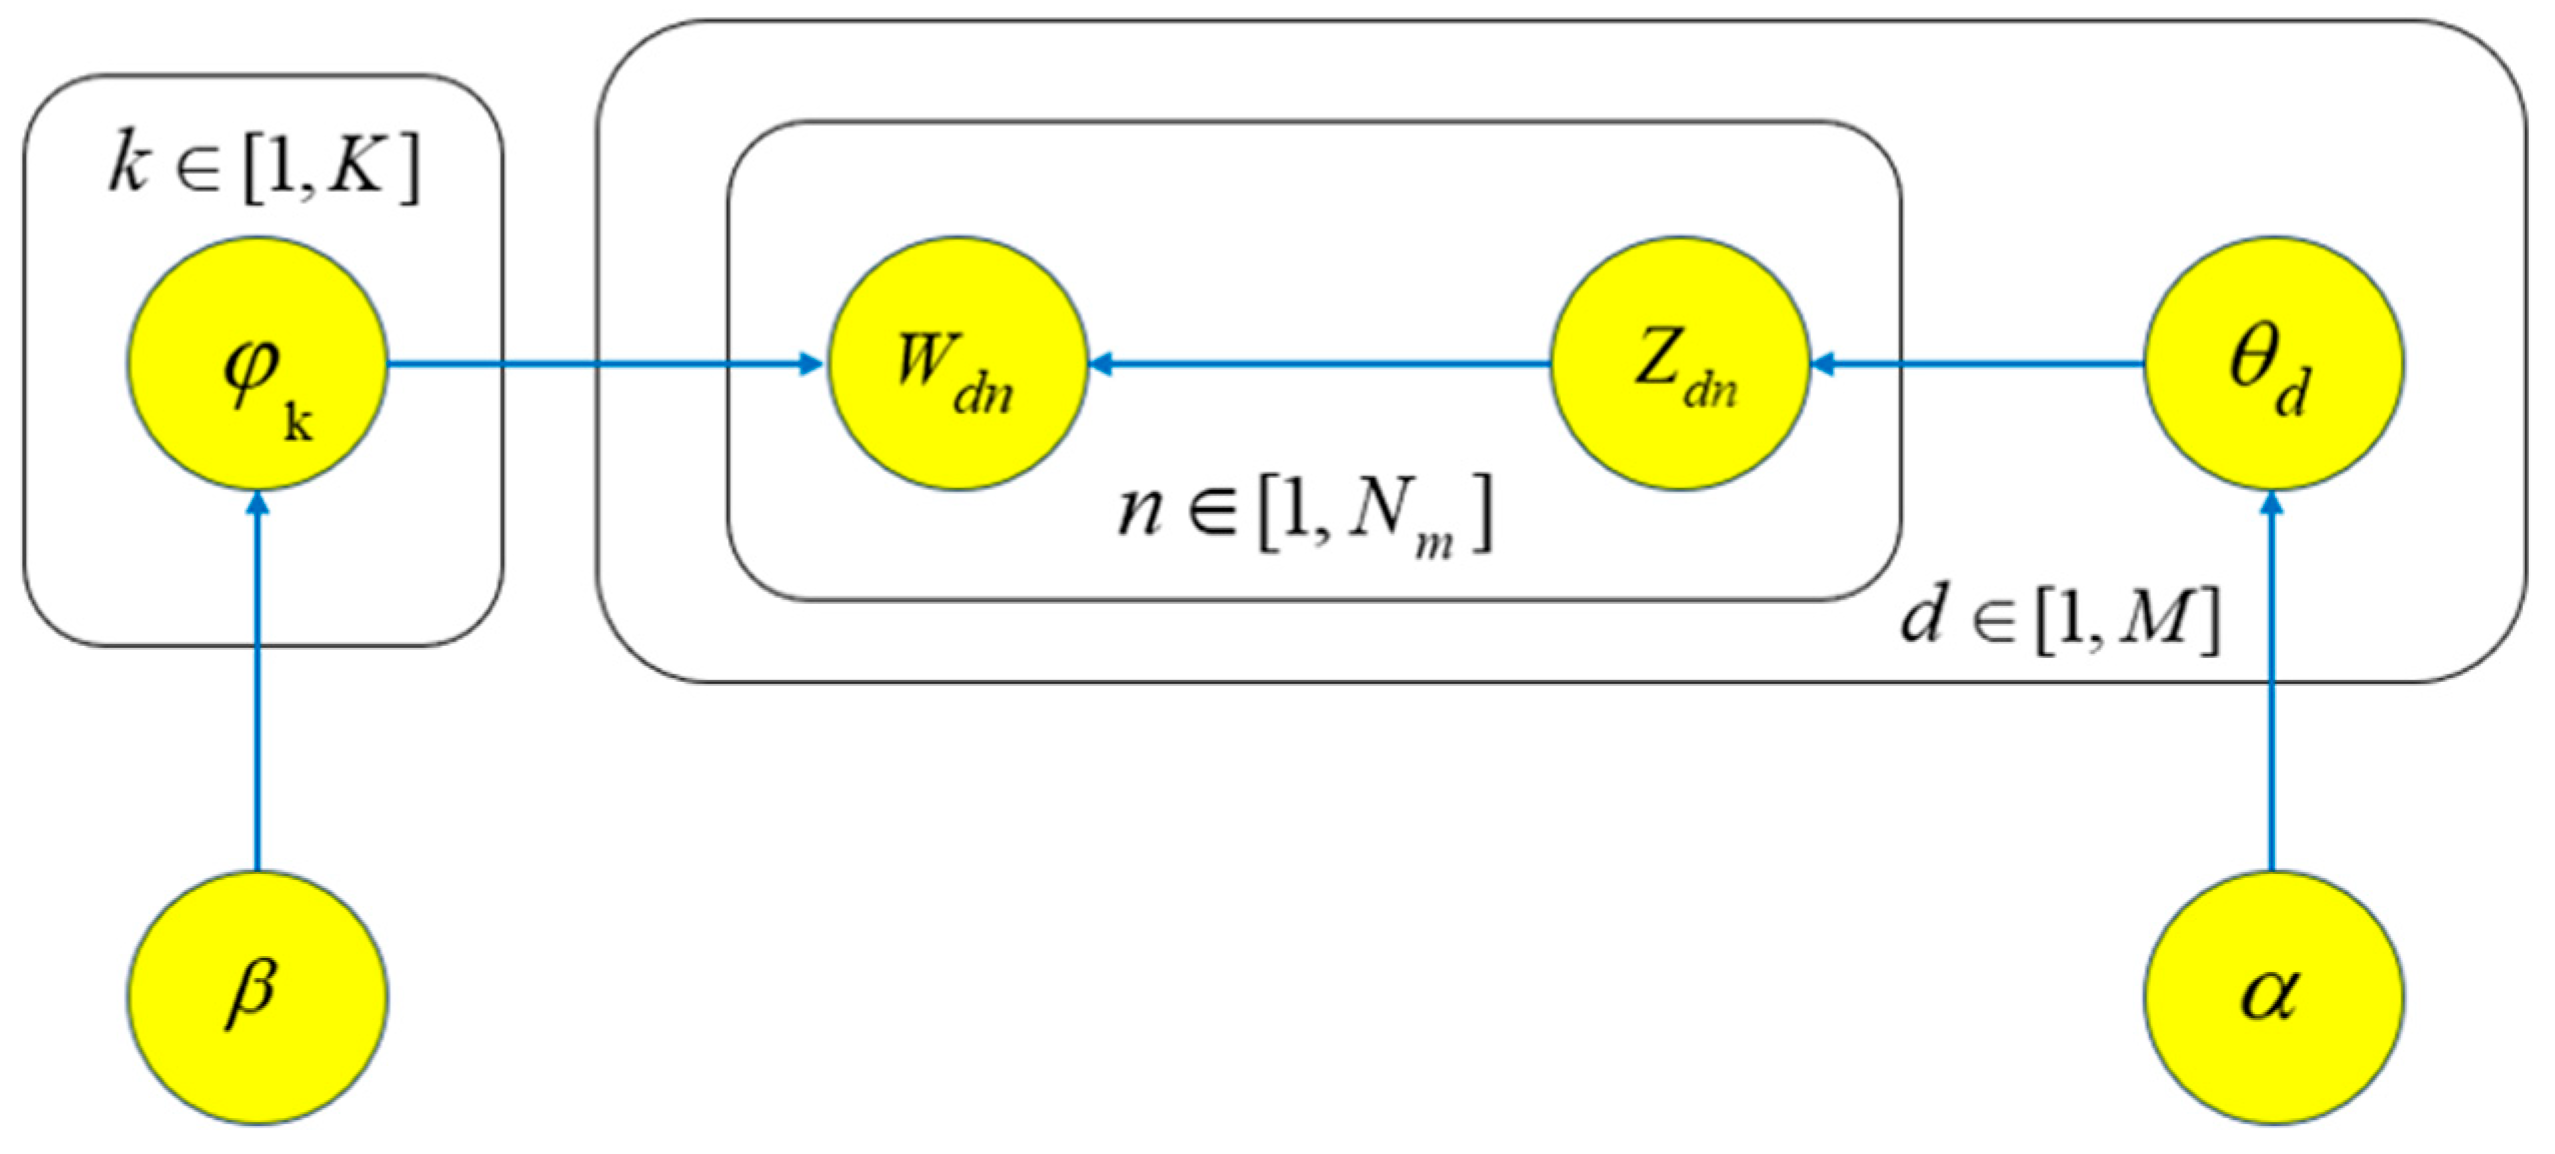
- : In the LDA model, this process describes the generation process of the th word in document . First, the topic distribution of document is extracted from the Dirichlet distribution based on the hyperparameter , which represents the mixture of document topics. Then, the th word in document is assigned its attributable topic based on . This process synthesizes the distribution of document topics and the distribution of vocabulary under each topic to ensure the appropriate matching of vocabulary and topic.
- (2)
- : In the LDA model, this process describes the generation of the th word in a document . First, topic-word distributions are obtained by sampling from the Dirichlet distribution based on the hyperparameter . Subsequently, the topic of the th word in document is determined, and the appropriate vocabulary is generated for the word based on the corresponding topic-word distribution . This process effectively captures the association between vocabulary and topic and realizes the topic modeling of textual data. The key point is to determine the topic for each word in the document through the topic-word distribution and then generate the corresponding words.
2.4. Association Rule Analysis
2.5. Bayesian Network Analysis
3. Results
3.1. Data Preprocessing and Keyword Extraction
3.2. LDA Topic Model Analysis
3.2.1. Estimation of the Optimal Number of Topics
3.2.2. Thematic Analysis
3.3. Association Rule Analysis
4. Discussion
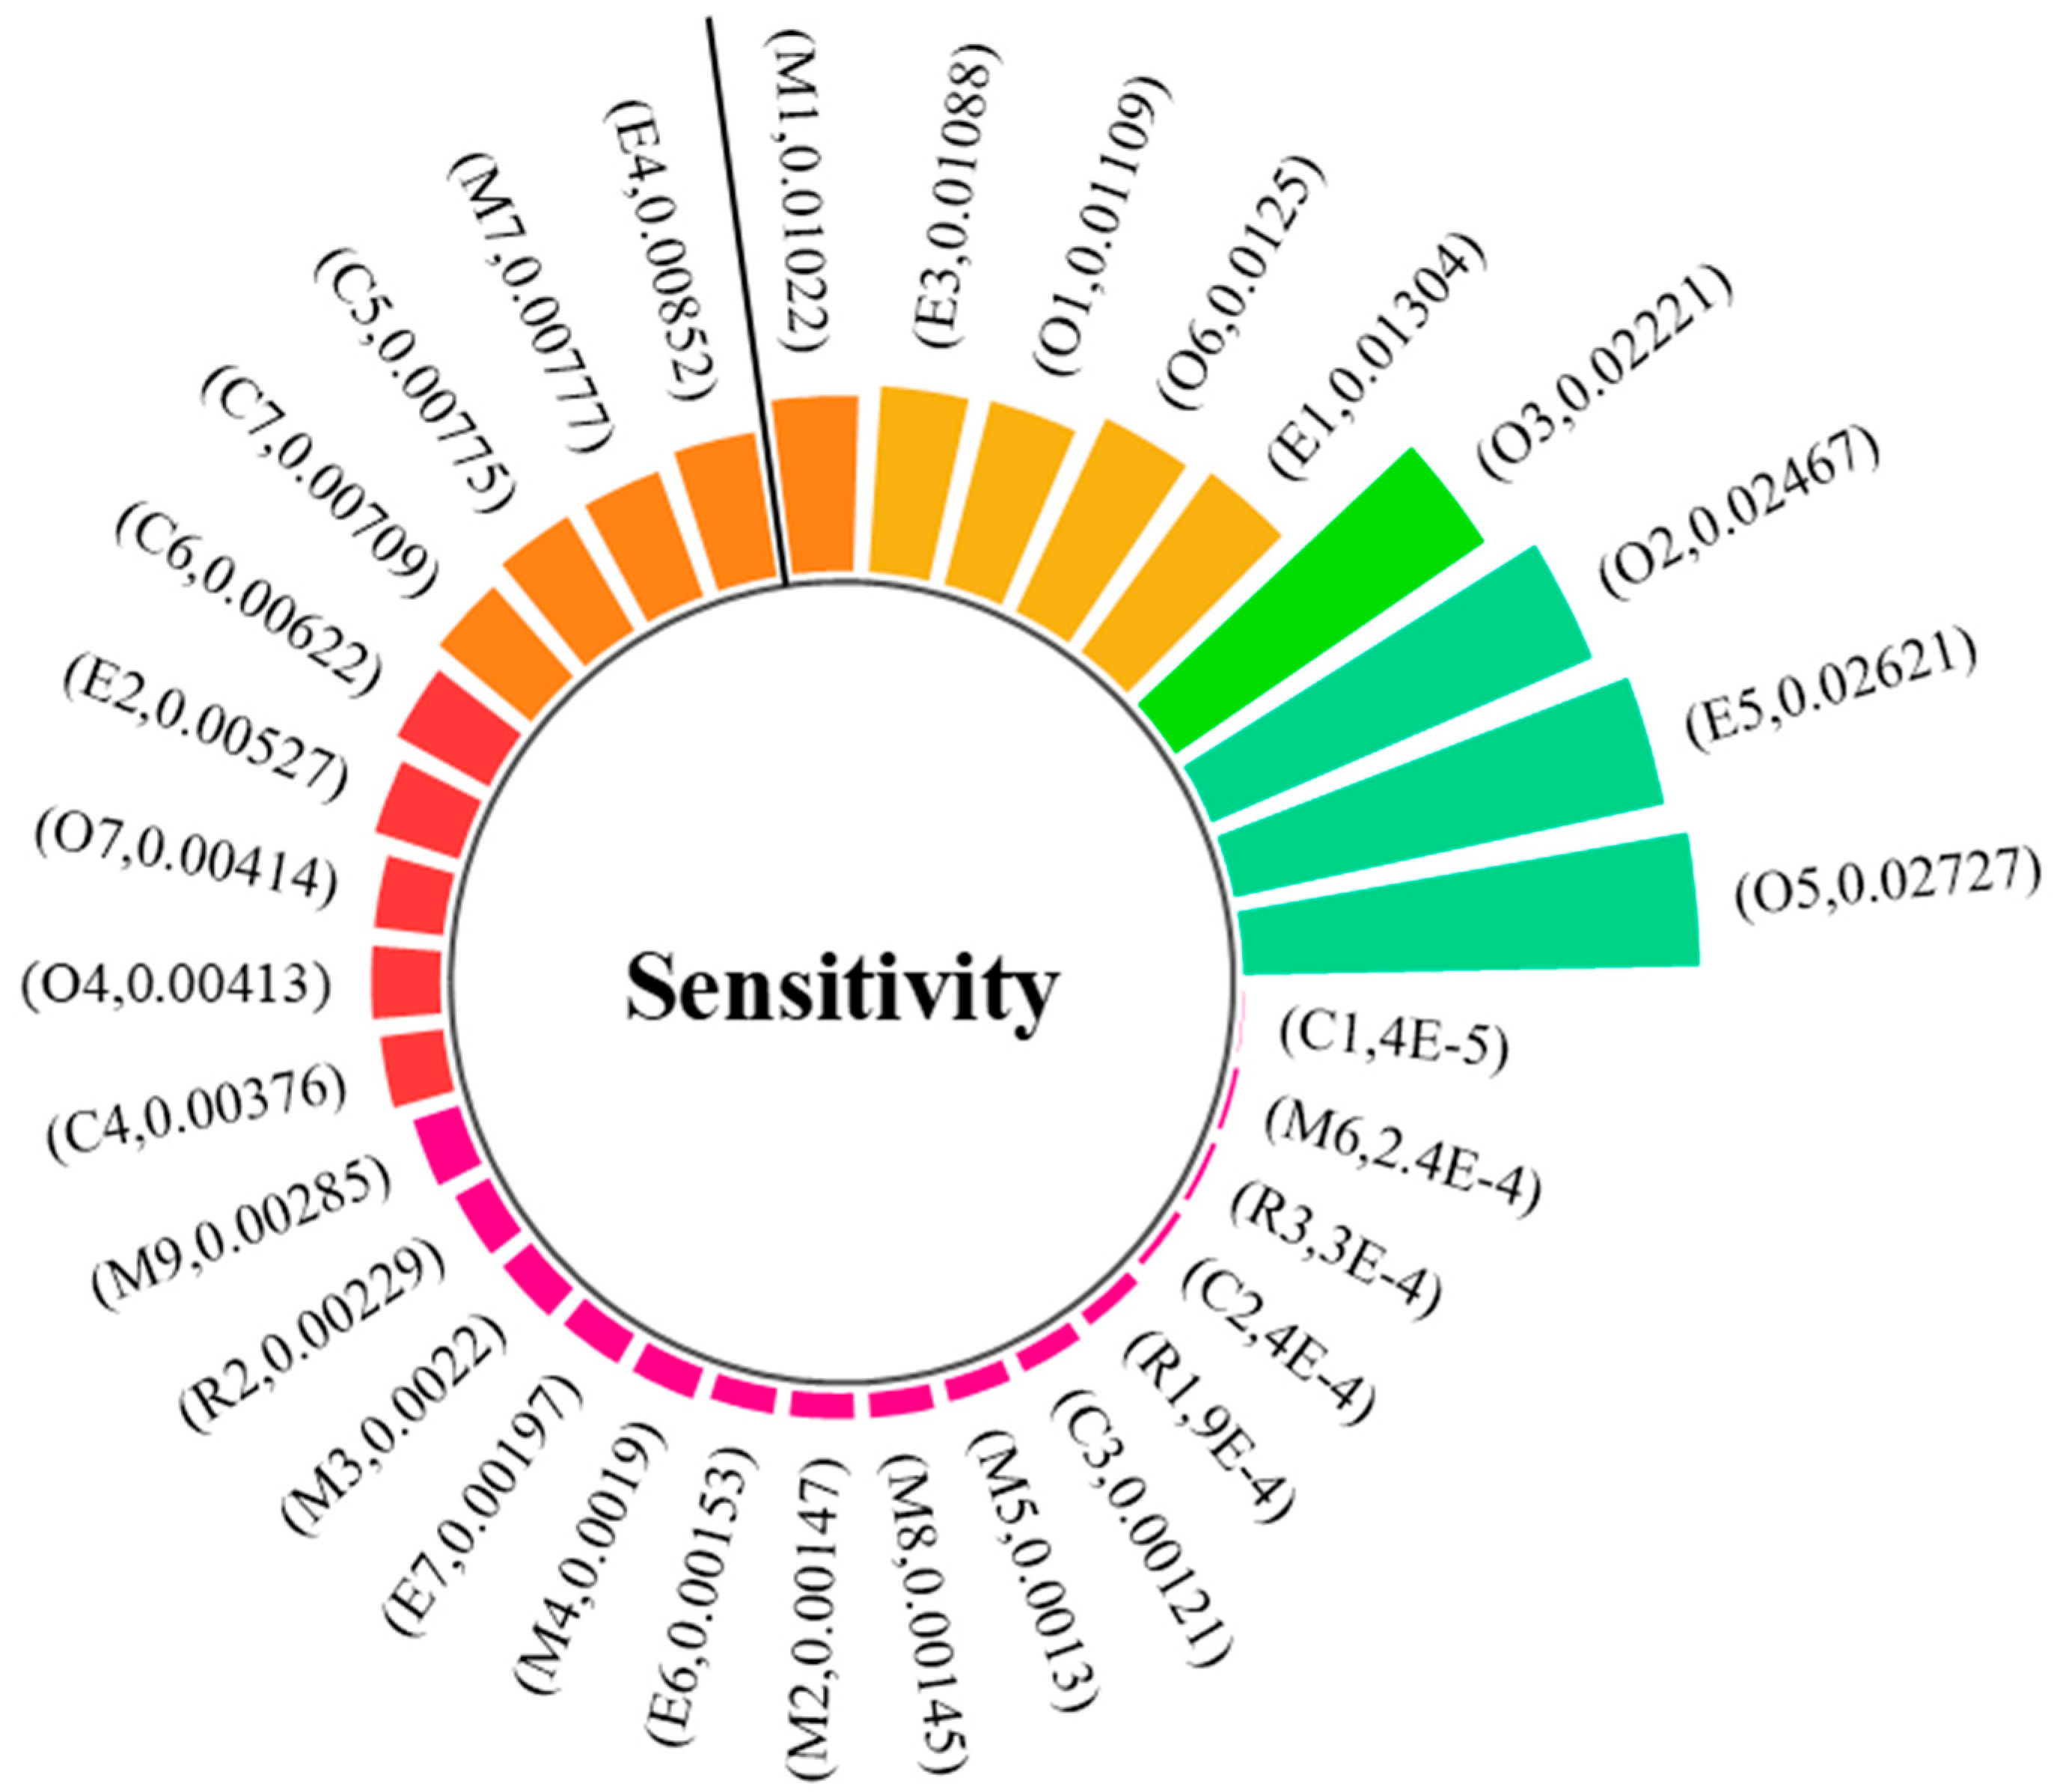
4.1. Sensitive Risk Factor Analysis
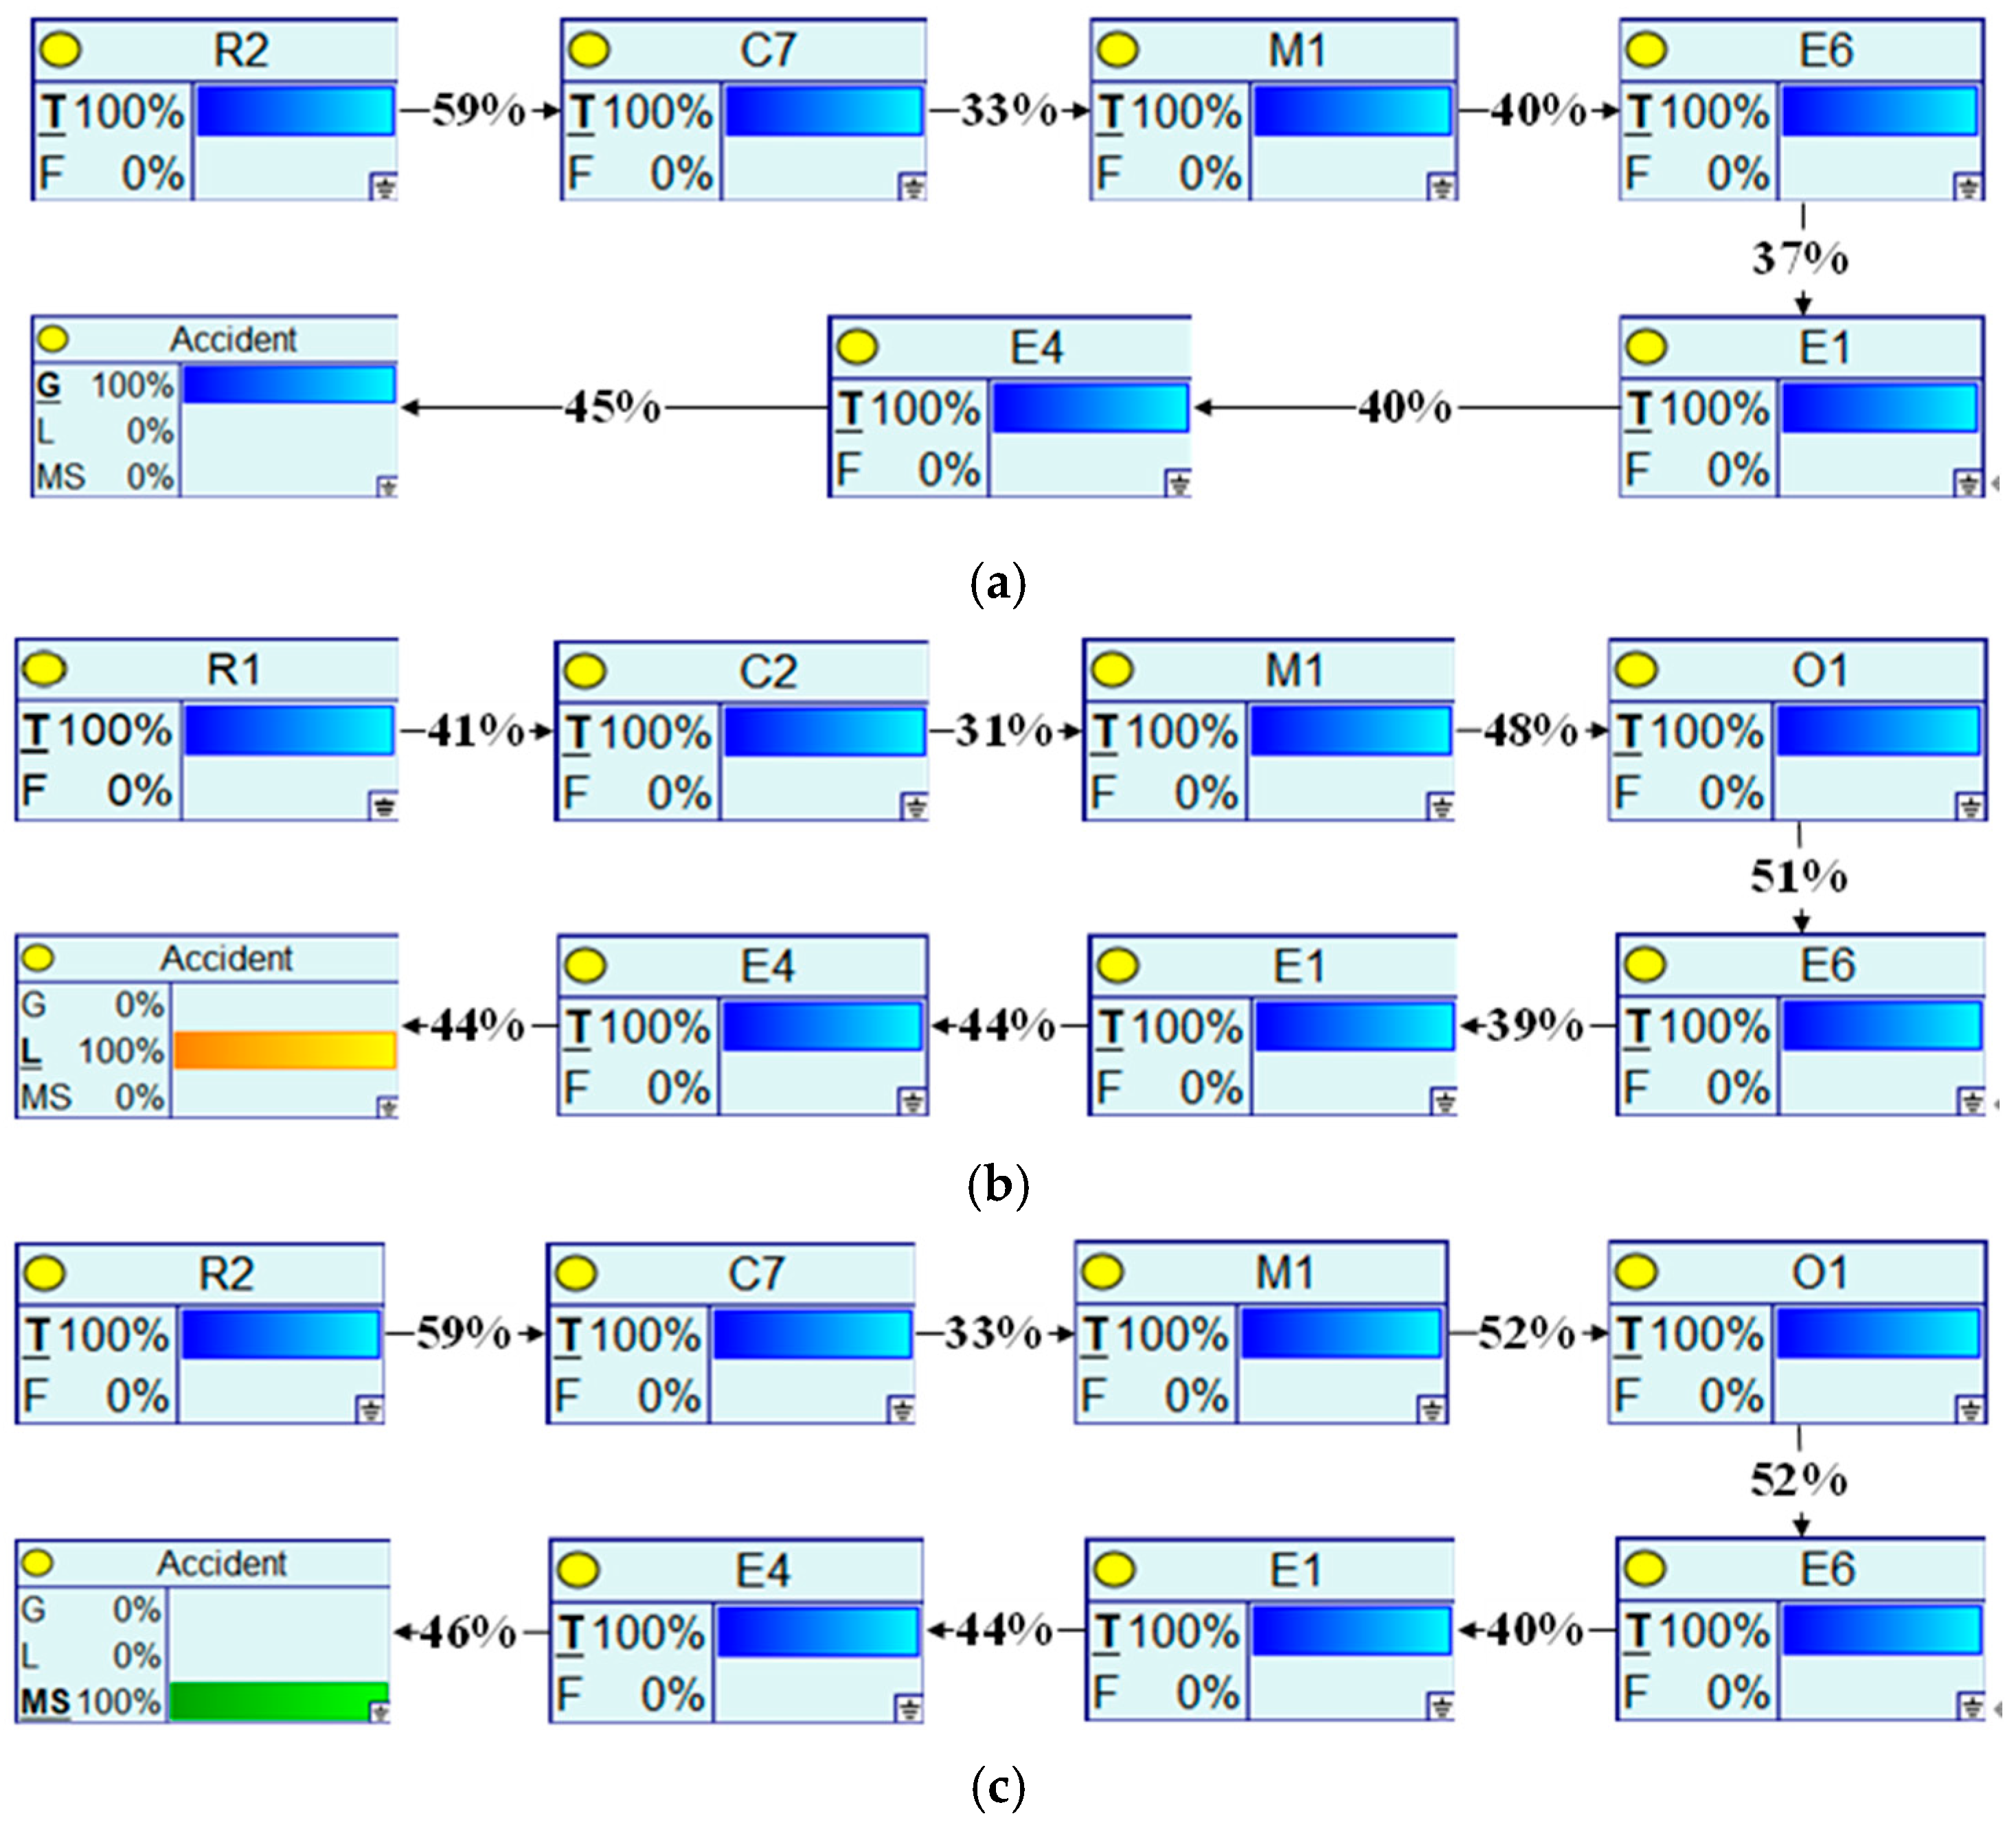
4.2. Critical Causal Path Analysis
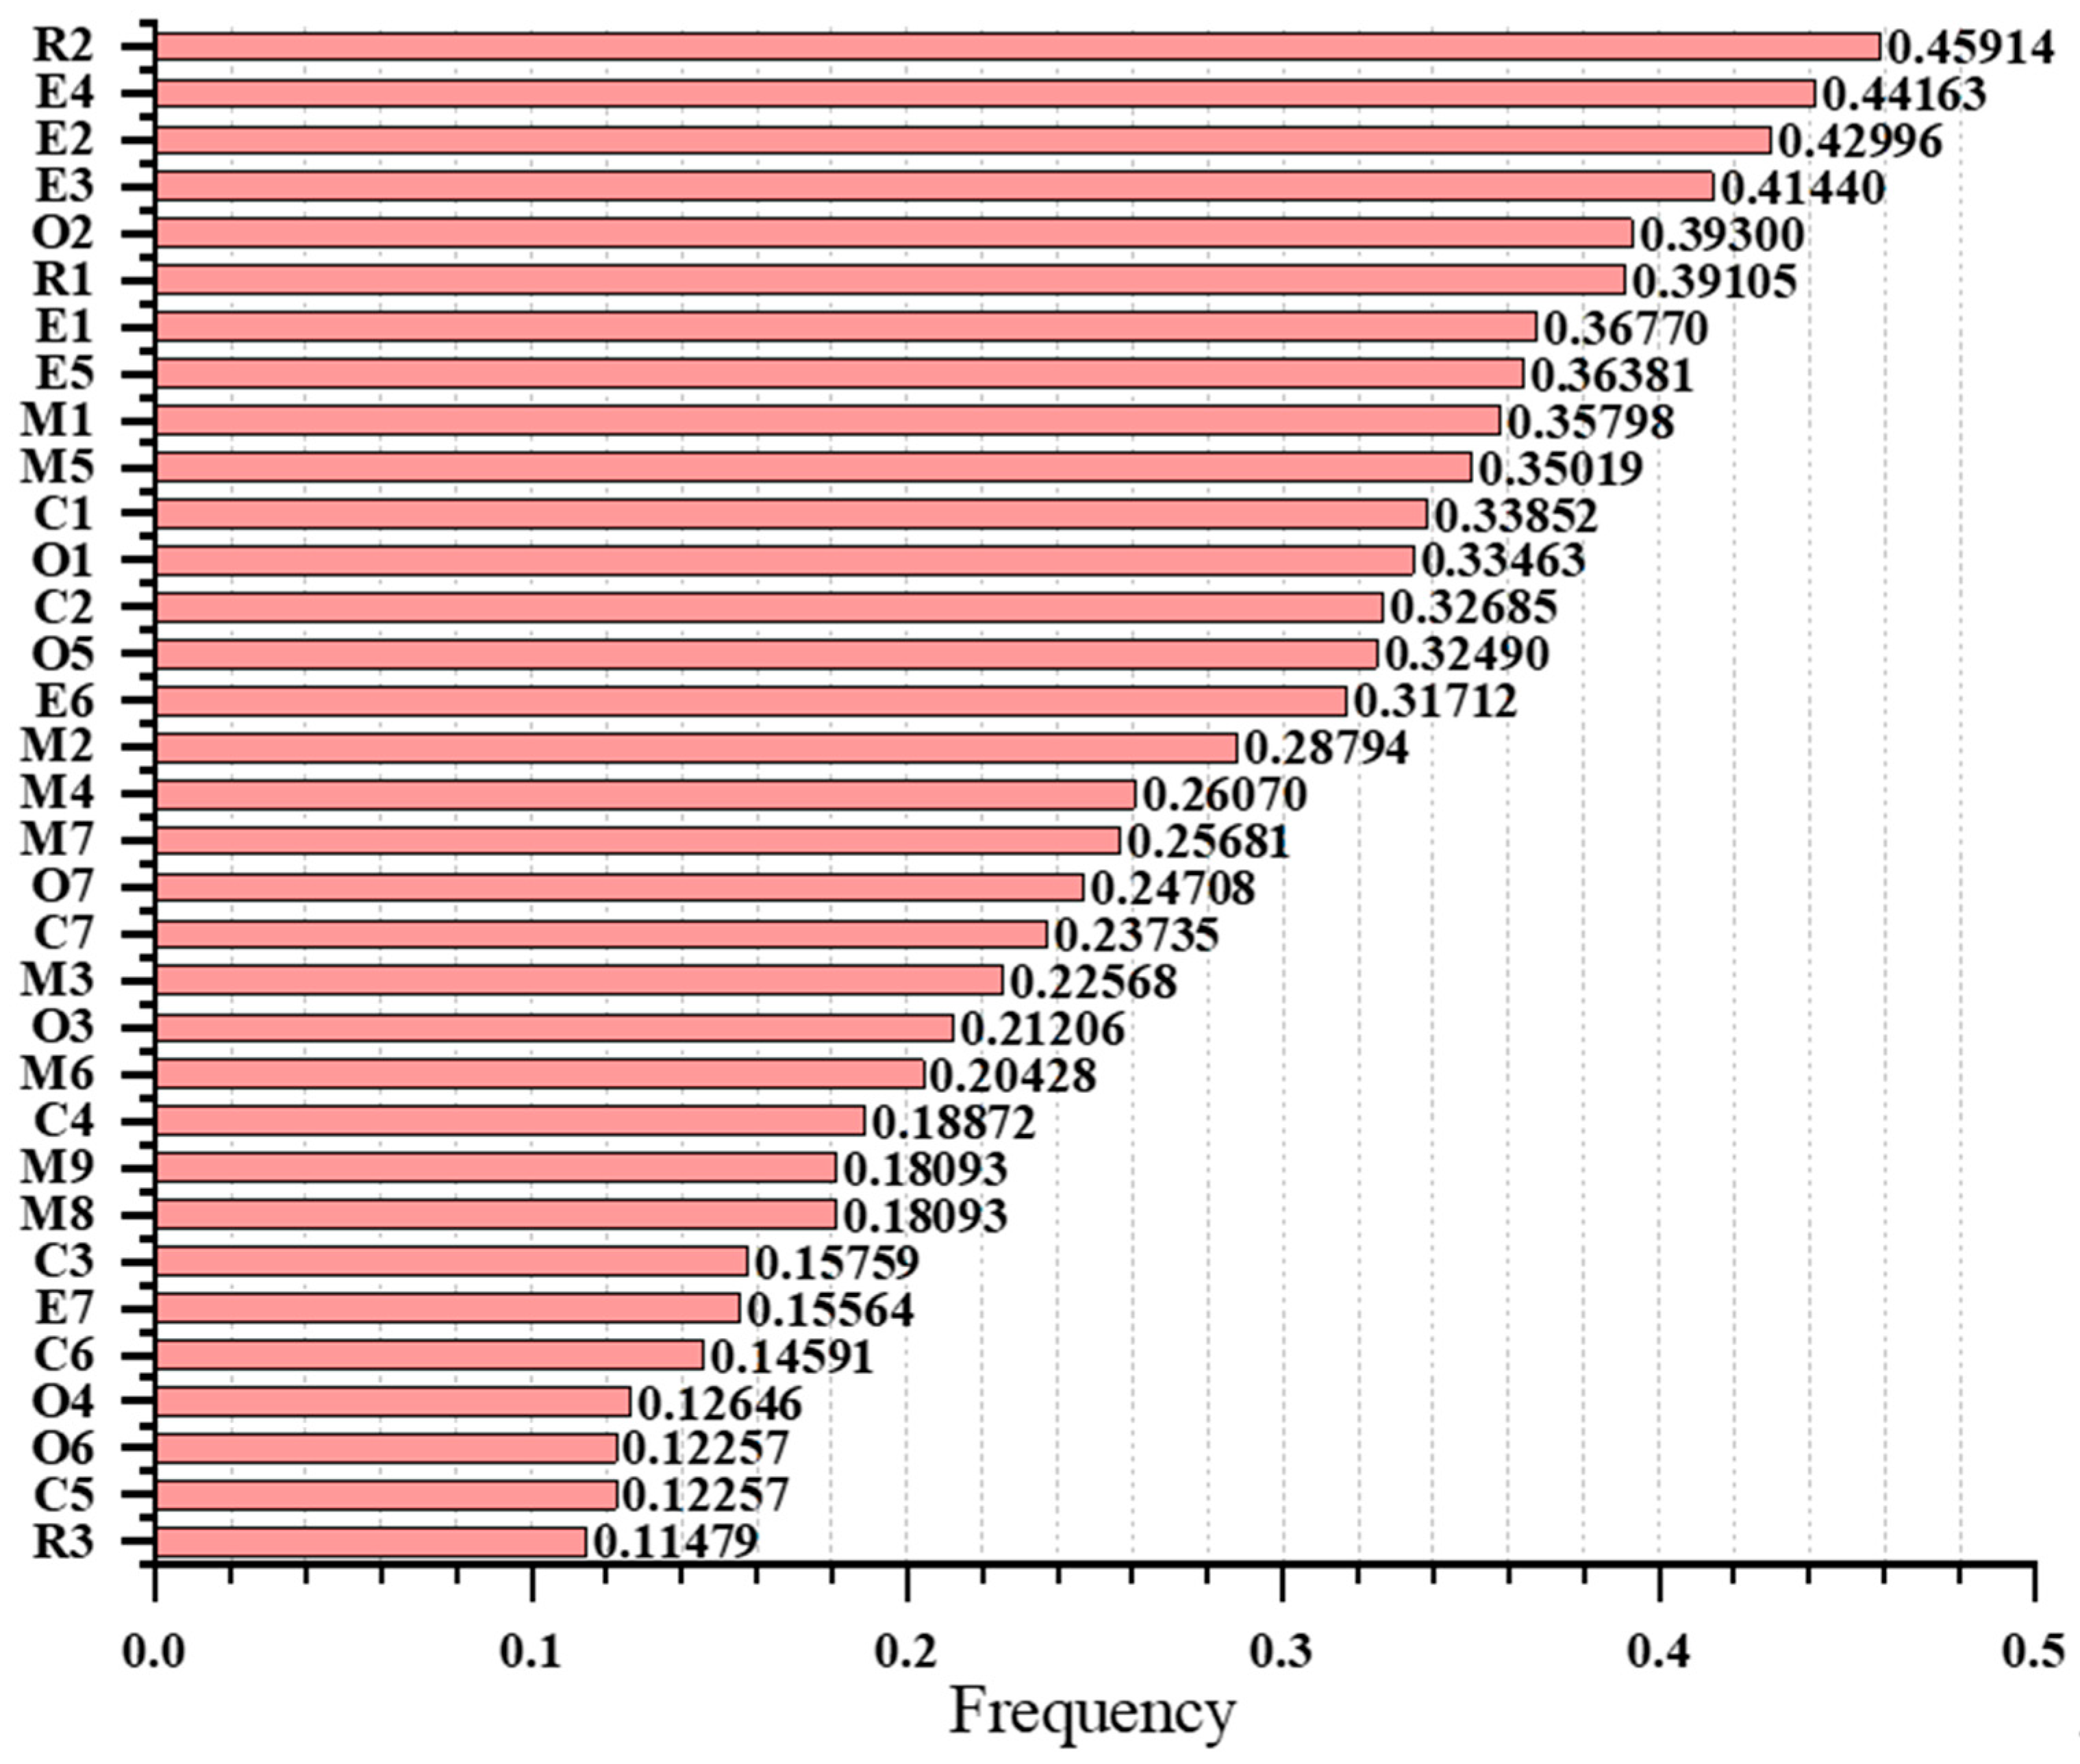
4.3. Statistical Analysis of Frequency
5. Conclusions
Author Contributions
Funding
Institutional Review Board Statement
Informed Consent Statement
Data Availability Statement
Conflicts of Interest
Abbreviations
| CGS | Collapsing Gibbs Sampling |
| LDA | Latent Dirichlet Allocation |
| MCMC | Markov Chain Monte Carlo |
| HFE | Human Factors Engineering |
References
- Lassak, P.; Labovsky, J.; Jelemensky, L. Influence of parameter uncertainty on modeling of industrial ammonia reactor for safety and operability analysis. J. Loss Prev. Process Ind. 2010, 23, 280–288. [Google Scholar] [CrossRef]
- Rathnayaka, S.; Khan, F.; Amyotte, P. SHIPP methodology: Predictive accident modeling approach (Part I: Methodology and model description). Process Saf. Environ. Prot. 2011, 89, 151–164. [Google Scholar] [CrossRef]
- Jain, P.; Pasman, H.J.; Waldram, S.P.; Rogers, W.J.; Mannan, M.S. Did we learn about risk control since Seveso? Yes, we surely did, but is it enough? An historical brief and problem analysis. J. Loss Prev. Process Ind. 2017, 49, 5–17. [Google Scholar] [CrossRef]
- Tan, X.Q. Research on Evaluation Model for Safety Capacity of Chemical Industrial Park Based on Regional Risk and Its Application in Chemical Industrial Park. Master’s Thesis, South China University of Technology, Guangzhou, China, 2011. [Google Scholar]
- Senave, E.; Jans, M.J.; Srivastava, R.P. The application of text mining in accounting. Int. J. Account. Inf. Syst. 2023, 50, 100624. [Google Scholar] [CrossRef]
- Zhang, T.T.; Chen, K.; Li, B.Z. Document keyword extraction based on semantic hierarchical graph model. Scientometrics 2023, 128, 2623–2647. [Google Scholar] [CrossRef]
- Zhang, K. Web News Data Extraction Technology Based on Text Keywords. Complexity 2021, 2021, 5529447. [Google Scholar] [CrossRef]
- Zhao, F.Y.; Ren, X.B.; Yang, S.S. Latent Dirichlet Allocation Model Training With Differential Privacy. IEEE Trans. Inf. Forensics Secur. 2021, 16, 1290–1305. [Google Scholar] [CrossRef]
- Li, Z.X.; Nie, F.P.; Wang, R. A Revised Formation of Trace Ratio LDA for Small Sample Size Problem. IEEE Trans. Neural Netw. Learn. Syst. 2024, 36, 5803–5809. [Google Scholar] [CrossRef] [PubMed]
- Wu, D.; Yang, R.X.; Shen, C. Sentiment word co-occurrence and knowledge pair feature extraction based LDA short text clustering algorithm. J. Intell. Inf. Syst. 2021, 56, 1–23. [Google Scholar] [CrossRef]
- Jia, Y.R.; Pang, Y.C. Analysis of the Causes of Construction Safety Accidents Based on LDA Modelling. Eng. Constr. 2025, 57, 72–78. [Google Scholar] [CrossRef]
- Zhang, S.L.; Sun, H. Analysis of Knowledge Mapping and LDA Topic Modelling of Forestry Ecological Construction in China. China For. Spec. Prod. 2025, 80–82. [Google Scholar] [CrossRef]
- Yang, L. Causation Analysis and Risk Study of Rail Transportation Accidents Based on Text Data. Ph.D. Thesis, Beijing Jiaotong University, Beijing, China, 2021. [Google Scholar]
- Zhou, Z.Y.; Huang, J.H.; Lu, Y. A new text mining-Bayesian network approach for identifying chemical safety risk factors. Mathematics 2022, 10, 4815. [Google Scholar] [CrossRef]
- Blei, D.M.; Ng, A.Y.; Jordan, M.I. Latent dirichlet allocation. J. Mach. Learn. Res. 2003, 3, 993–1022. [Google Scholar]
- Wang, P.; Gao, C.; Chen, X.M. Text clustering study based on LDA model. Intell. Sci. 2015, 33, 63–68. [Google Scholar]
- Griffiths, T.L.; Steyvers, M. Finding scientific topics. Proc. Natl. Acad. Sci. USA 2004, 1, 5228–5235. [Google Scholar] [CrossRef] [PubMed]
- Ramesh, N.; William, C.; John, L. Parallelized Variational EM for Latent Dirichlet Allocation: An Experimental Evaluation of Speed and Scalability. In Proceedings of the Seventh IEEE International Conference on Data Mining Workshops (ICDMW 2007), Omaha, NE, USA, 28–31 October 2007; pp. 349–354. [Google Scholar]
- Brooks, S. Markov chain Monte Carlo method and its application. J. R. Stat. Soc. Ser. D (Stat.) 1998, 47, 69–100. [Google Scholar] [CrossRef]
- Agrawal, R.; Imielinski, T.; Swami, A. Mining association rules between sets of items in large databases. In Proceedings of the 1993 ACM SIGMOD International Conference on Management of Data, Washington, DC, USA, 25–28 May 1993; pp. 207–216. [Google Scholar]
- Chen, M.S.; Han, J.W.; Yu, P.S. Data mining: An overview from a database perspective. IEEE Trans. Knowl. Data Eng. 1996, 8, 866–883. [Google Scholar] [CrossRef]
- You, M.J. Research on Coal Mine Safety Risk Identification and Evaluation Based on Text Mining. Ph.D. Thesis, China University of Mining and Technology, Beijing, China, 2022. [Google Scholar]
- Roder, M.; Both, A.; Hinneburg, A. Exploring the Space of Topic Coherence Measures; Association for Computing Machinery: New York, NY, USA, 2015; pp. 399–408. [Google Scholar]
- Cao, J.; Xia, T.; Li, J.T. A density-based method for adaptive LDA model selection. Neurocomputing 2009, 72, 1775–1781. [Google Scholar] [CrossRef]
- Biggers, L.R.; Bocovich, C.; Capshaw, R. Configuring latent Dirichlet allocation based feature location. Empir. Softw. Eng. 2014, 19, 465–500. [Google Scholar] [CrossRef]
- Lv, L.C.; Zhou, J.; Wang, X.Z. A framework for analyzing technology evolution based on a two-layer thematic model and its application. Data Anal. Knowl. Discov. 2022, 6, 18–32. [Google Scholar]
- Xiang, Z.Y.; Wu, Y.; Chen, H. A Study on Discovery of Hot Topics in Microblogs Based on the Improved Algorithm of Burst Word to Topic Modeling. Intell. J. 2022, 41, 104–112. [Google Scholar]
- Sievert, C.; Shrley, K.E.; Davis, L. A method for visualizing and interpreting topics. In Proceedings of the Association for Computational Linguistics, Baltimore, MD, USA, 22–27 June 2014. [Google Scholar]
- Rasmussen, J. Risk management in a dynamic society: A modelling problem. Saf. Sci. 1997, 27, 183–213. [Google Scholar] [CrossRef]
- Nenonen, N. Analysing factors related to slipping, stumbling, and falling accidents at work: Application of data mining methods to Finnish occupational accidents and diseases statistics database. Appl. Ergon. 2012, 44, 215–224. [Google Scholar] [CrossRef] [PubMed]


| Serial Number of Corpus | Segmentation Results |
|---|---|
| 1 | Construction Site Responsible Person Construction Shop Demolition Fractionated Wastewater Distillation … Review Employee Qualifications |
| 2 | Record Shift Monitoring Tank Monitoring Transfer Record Monitoring Tank Monitoring … Safety Education and Training |
| 3 | Workshop personnel handover responsible for liquid chlorine workshop inspections … supervisory and management capabilities |
| 4 | Da Fang enterprise staff enterprise workshop pipe cutting operation safety technology submission … rectification responsible for |
| 5 | Enterprise production workshop vacuum work production epoxy resin production site … enterprise elimination |
| … | … |
| 513 | Tufa production responsible person government departments production employees personnel idle play … supervisory and management responsibilities |
| 514 | Enterprise flammable and explosive gas production process turnover personnel material suppliers … inspection and maintenance operations |
| Characteristic Word | BM25W Value |
|---|---|
| corporations | 3.7427 |
| worker | 2.7936 |
| safety education training | 2.6337 |
| officers | 2.5535 |
| equipment and facilities | 2.5319 |
| probe | 2.4833 |
| operation | 2.4556 |
| supervise and manage | 2.3683 |
| scene | 2.0720 |
| reporting | 1.7376 |
| blast | 1.7325 |
| illegal and irregular | 1.7306 |
| produce | 1.6001 |
| flammable and explosive gases | 0.9053 |
| toxic and hazardous gas | 0.8988 |
| special operation | 0.8837 |
| explosive mixture | 0.7736 |
| tank | 0.7735 |
| asphyxia due poisoning | 0.7690 |
| special equipment | 0.7471 |
| reaction kettle | 0.7407 |
| inflammable | 0.7284 |
| workplace | 0.7045 |
| pressure piping | 0.6980 |
| break apart | 0.6764 |
| safety management system | 0.6745 |
| dynamo | 0.6696 |
| occupation permit | 0.6586 |
| wear | 0.6375 |
| limited space | 0.6354 |
| Serial Number | Thematic Trait Words | Risk Factor Theme |
|---|---|---|
| 1 | Supervision and management of enterprises in violation of the law duties of government departments to supervise and guide the review and inspection of the corporate sector | Failure to conscientiously fulfill safety supervision responsibilities |
| 2 | Business Operations Operator On-Site Personnel Inspection Report Operations Site Responsible for False Reporting | Insufficiently detailed or misrepresented job site inspections |
| 3 | Production enterprise production process phase-out workshop compliance risk operation backward and old | Outdated and obsolete production processes |
| 4 | Lack of protection from limited space safety measures at the operating enterprise for rescuing poisoned and asphyxiated persons | Failure to wear protective equipment |
| 5 | Enterprise personnel safety education and training operating procedures for the development of post record system leads to | Inadequate safety education and training |
| 6 | Operations Operator Operations Ticket On-Site Supervisor License Equipment and Facilities Worksite Special Operations Safety Education and Training | Workers not licensed or not accompanied by a guardian on duty |
| 7 | Equipment and Facilities Inspection Hidden Hazards Leakage Supervision and Management Rectification Fracture Management Production Process Supervision | Inadequate tracking of hidden dangers and corrective actions |
| 8 | Enterprise equipment and facilities rupture agglomeration design leakage production process concentration old environment | Unreliable equipment and facilities |
| 9 | Explosive Gas Explosive Mixture Equipment Facility Air Ignition Source Damage Inspection Combustion Mixing | Unusual concentrations of hazardous gases |
| 10 | Vehicle Transportation Enterprises Driver Qualification Operator Tank Illegal Violations Monitoring Supervision | Inadequate transportation management |
| 11 | Pressure beyond the equipment and facilities valve operating procedures operating post alarm interlock site | Abnormal pressure/temperature values |
| 12 | Report the leakage of the shift supervisor in the central control room on duty to inspect the shift handover post site departure | Inadequate shift handovers or technical safety briefings |
| 13 | Dust Burning Fire Production Explosion Protection Illegal Violations Employee Equipment Facility Personnel | Inadequate fire and explosion prevention measures |
| 14 | Construction Workers Qualification Welding Outsourcing Supervision and Management Construction Unit Contractor Violation of Laws and Regulations Safety Technical Briefing | Non-compliance with contracting regulations |
| 15 | Field Operator Spill Personnel Reporting Business Inspection Equipment and Facilities Smoke Operating Procedures | Leakage problem |
| 16 | Special Operations Inspection Ventilation Development Rescue Application Safety Education Training Risk Identification Blind Workers | Inadequate risk identification for special operations |
| 17 | Illegal explosion in the workplace illegal operation of the operator employee production process illegal operation | Weak security awareness |
| 18 | Business Cutting Ignition Operator Pipeline Explosion Operation Ticket Unlicensed Employee Installation | Workers not licensed or not accompanied by a guardian on duty |
| 19 | Pressure pipeline valve leakage splash site flange removal operation shift supervisor inspection | leakage problem |
| 20 | Inspection and Maintenance Operations Inspection Personnel Reporting Programs Parking Responsible Measures System Failures | Inadequate management of equipment maintenance |
| 21 | Pipeline Leak Site Safety Measures Report Responsible Person Personnel Coordination Lack of Protection | Inadequate production safety system |
| 22 | Program Sampling Instrumentation Personnel Reporting Approval Analysis Manager Illegal Leaving | Reporting program approvals go through the motions |
| 23 | Production Process Recycling Workshop Pilot Run Cooling Raw Material Installation Equipment Facilities Shift Supervisor Technicians | Inadequate commissioning of production processes |
| 24 | Trial Production System Gas Stop Production Program Illegal and Illegal Equipment and Facility Reporting Supervision and Management | Organization of production in violation of the law |
| 25 | Warehouses clustered storage combustion explosion enterprise transportation ignition violations of the law negligence | Illegal storage |
| 26 | Flammable and explosive gases personnel inspection and maintenance concentration exceeds the inspection emission site operator return | Unusual concentrations of hazardous gases |
| 27 | Temperature Material Pressure Splash Rise Burnout Steam Control Heating Lack of | Abnormal pressure/temperature values |
| 28 | Storage Tank Demolition Ruptured Tank Connection Splash Leaves Pipeline Reported Leaking | Unreliable equipment and facilities |
| 29 | Fan Bolt Job Inspection and Repair Flange Inspection and Repair Removal Report Personnel Equipment and Facilities | Inadequate management of equipment maintenance |
| 30 | Flammables Hazardous Concentrations Pipe Falls Illegal Violations Ignition Rectification Ordinance System | Inadequate tracking of hidden dangers and corrective actions |
| 31 | Toxic and Hazardous Gas Risk Identification Emission Risk Disconnection Pipeline Monitoring Reporting Blind System | Failure of security monitoring and surveillance equipment |
| 32 | Cylinder Gas Inspection Oxygen Operator Safety Education and Training Operator Certificate Recorder | Weak security awareness |
| 33 | Plant violations mixtures inspections are responsible for installing inspections put into operation points lead to | Inadequate security inspections |
| 34 | Sewage clogging of protective equipment facilities overflowing pipeline discharge agglomeration regulation development | Illegal treatment of sewage and wastewater |
| 35 | Oil products illegal violations equipment and facilities explosion elimination tank operations main responsibility electrostatic fire protection devices | Risky organization of operations |
| 36 | Waste Wastewater Enterprise Mixed Production Process Sampling Equipment Facility Operators Show Clustering | Illegal treatment of sewage and wastewater |
| 37 | Fall Fracture Explosion Shock Wave Fire Protection Device Operation Impact Punch Out Risk Identification Explosion Prevention | Inadequate fire and explosion prevention measures |
| 38 | Monitoring Records Risk Identification Operational Instrumentation Risk Driving Failure System Programs | Failure of security monitoring and surveillance equipment |
| 39 | Special equipment commissioning central control room instruction specification information development technician feeding defects | lit. directing against the rules (idiom); directing against the rules |
| 40 | Charging and mixing commissioning illegal and irregular contact standard replacement operation laws and regulations operating procedures | non-compliance |
| 41 | Safety Measures Personnel Replacement Positions Valve Management Operating Procedures Illegal Changes Looking For | Inadequate production safety system |
| 42 | The main responsibility valve is responsible for operating procedures input development manager registration laws and regulations leadership | Failure to uphold paramount safety requirements |
| 43 | Corrosive substances are responsible for analyzing emergency drills return laws and regulations friction oxygen technology safety measures | Non-implementation of emergency relief management |
| 44 | Manufacturer Safety Measures Government Department Approval Compliance Equipment Facility Inspection Technician Qualification Blindness | Inadequate approval of safety management and technical measures |
| 45 | Cleaning Dismantling Operations Violators Tank Transportation Laws and Regulations Input Skills | non-compliance |
| 46 | Warning Signs Employee Leads to Heated Passage Warning Signs On Duty Opinion Procedures Opened | Failure of safety warning signs |
| Classification of Risk Factors | Security Risk Factors |
|---|---|
| R Regulatory authorities | R1 Hidden dangers rectification and tracking is not in place |
| R2 Failure to conscientiously fulfill the responsibility of safety supervision | |
| R3 Inadequate approval of safety management and technical measures | |
| C Chemical enterprises | C1 Inadequate safety education and training |
| C2 Inadequate safety system C3 Organizing production in violation of the law C4 Inadequate security inspections C5 Failure to implement the main responsibility for safety C6 Non-implementation of emergency relief management C7 Illegalized contracting | |
| M Site management | M1 Careless or misrepresentation of the work site inspection |
| M2 Backward and obsolete production processes | |
| M3 Inadequate transportation management M4 Inadequate handover or technical safety briefings M5 Inadequate fire and explosion prevention measures M6 Illegal storage M7 Illegal treatment of sewage wastewater M8 Inadequate commissioning of production processes M9 Reporting program approvals go through the motions | |
| O Operators | O1 Failure to wear protective equipment O2 Operators not licensed or not accompanied by supervisors O3 Inadequate risk identification for special operations O4 Unauthorized command O5 Non-compliant operation O6 Adventure organization operations O7 Weak security awareness |
| E Environment and equipment | E1 Unreliable equipment and facilities E2 Abnormal concentrations of hazardous gases E3 Abnormal pressure/temperature values E4 Leakage problems E5 Inadequate equipment maintenance and management E6 Failure of safety monitoring control equipment E7 Failure of safety warning signs |
| Serial Number | C1 | C2 | C3 | C4 | C5 | C6 | C7 | E1 | E2 | E3 | |
|---|---|---|---|---|---|---|---|---|---|---|---|
| 1 | 1 | 1 | 0 | 0 | 0 | 0 | 1 | 1 | 1 | 1 | |
| 2 | 0 | 1 | 0 | 0 | 1 | 0 | 0 | 0 | 0 | 1 | |
| 3 | 0 | 0 | 0 | 0 | 0 | 0 | 0 | 0 | 0 | 0 | |
| 4 | 0 | 0 | 0 | 0 | 0 | 0 | 0 | 0 | 1 | 0 | |
| 5 | 1 | 0 | 0 | 1 | 0 | 0 | 0 | 0 | 1 | 0 | |
| 6 | 1 | 0 | 0 | 0 | 0 | 0 | 1 | 1 | 1 | 0 | |
| 7 | 0 | 1 | 0 | 0 | 1 | 0 | 0 | 0 | 1 | 1 | |
| 8 | 1 | 1 | 0 | 1 | 0 | 0 | 0 | 0 | 1 | 1 | |
| 9 | 0 | 1 | 0 | 0 | 0 | 0 | 0 | 0 | 0 | 1 | |
| 10 | 0 | 0 | 0 | 1 | 0 | 1 | 0 | 0 | 0 | 0 | |
| 11 | 0 | 0 | 0 | 1 | 0 | 0 | 0 | 0 | 0 | 0 | … |
| 12 | 0 | 0 | 0 | 0 | 0 | 1 | 1 | 1 | 0 | 0 | |
| 13 | 0 | 0 | 0 | 0 | 0 | 0 | 0 | 0 | 0 | 0 | |
| 14 | 0 | 0 | 0 | 0 | 0 | 0 | 0 | 0 | 0 | 0 | |
| 15 | 0 | 1 | 0 | 0 | 0 | 0 | 0 | 0 | 0 | 0 | |
| 16 | 1 | 1 | 0 | 0 | 1 | 0 | 0 | 0 | 1 | 0 | |
| 17 | 0 | 0 | 0 | 0 | 0 | 1 | 0 | 0 | 0 | 1 | |
| 18 | 0 | 0 | 0 | 0 | 0 | 0 | 0 | 0 | 0 | 0 | |
| 19 | 1 | 0 | 0 | 0 | 0 | 0 | 1 | 0 | 1 | 0 | |
| 20 | 0 | 0 | 0 | 0 | 0 | 0 | 1 | 0 | 1 | 0 | |
| … |
| Serial Number | C1 | C2 | C3 | C4 | C5 | … | R2 | R3 | Accident Level |
|---|---|---|---|---|---|---|---|---|---|
| 1 | 1 | 1 | 0 | 0 | 0 | … | 1 | 0 | G |
| 2 | 0 | 1 | 0 | 0 | 1 | … | 0 | 0 | G |
| 3 | 0 | 0 | 0 | 0 | 0 | … | 1 | 0 | G |
| 4 | 0 | 0 | 0 | 0 | 0 | … | 1 | 0 | G |
| 5 | 1 | 0 | 0 | 1 | 0 | … | 0 | 0 | G |
| … | … | … | … | … | … | … | … | … | … |
| 513 | 0 | 1 | 0 | 1 | 0 | … | 1 | 0 | L |
| 514 | 0 | 1 | 0 | 0 | 0 | … | 0 | 0 | G |
| Serial Number | Preceding Item | After Item | Support | Confidence | Lift |
|---|---|---|---|---|---|
| 1 | C5 | M2 | 0.085603 | 0.698413 | 2.425568 |
| 2 | C5 | M8 | 0.052529 | 0.428571 | 2.368664 |
| 3 | M8 | E7 | 0.050584 | 0.279570 | 1.796237 |
| 4 | M1 | O3 | 0.126459 | 0.353261 | 1.665836 |
| 5 | O6 | E1 | 0.073930 | 0.603175 | 1.640380 |
| 6 | C4 | M6 | 0.060311 | 0.319588 | 1.564458 |
| 7 | M9 | E4 | 0.071984 | 0.397849 | 1.526079 |
| 8 | M9 | M4 | 0.071984 | 0.397849 | 1.526079 |
| 9 | M7 | O3 | 0.079767 | 0.310606 | 1.464693 |
| 10 | M1 | O1 | 0.175097 | 0.489130 | 1.461704 |
| 11 | O3 | O1 | 0.103113 | 0.486239 | 1.453062 |
| 12 | O2 | O3 | 0.120623 | 0.306931 | 1.447361 |
| 13 | C7 | O2 | 0.132296 | 0.557377 | 1.418276 |
| 14 | O3 | E6 | 0.095331 | 0.449541 | 1.417572 |
| 15 | C4 | M5 | 0.093385 | 0.494845 | 1.413058 |
| 16 | M7 | O1 | 0.120623 | 0.469697 | 1.403629 |
| 17 | M2 | E3 | 0.167315 | 0.581081 | 1.402233 |
| 18 | C6 | M7 | 0.052529 | 0.360000 | 1.401818 |
| 19 | M8 | E3 | 0.105058 | 0.580645 | 1.401181 |
| 20 | M9 | M2 | 0.071984 | 0.397849 | 1.381720 |
| 21 | C5 | O5 | 0.054475 | 0.444444 | 1.367931 |
| 22 | E7 | E3 | 0.087549 | 0.562500 | 1.357394 |
| 23 | C7 | O3 | 0.068093 | 0.286885 | 1.352835 |
| 24 | M6 | M5 | 0.095331 | 0.466667 | 1.332593 |
| 25 | C7 | O7 | 0.077821 | 0.327869 | 1.326965 |
| 26 | O6 | O5 | 0.052529 | 0.428571 | 1.319076 |
| 27 | M7 | E6 | 0.107004 | 0.416667 | 1.313906 |
| 28 | O4 | E6 | 0.052529 | 0.415385 | 1.309863 |
| 29 | C7 | M7 | 0.079767 | 0.336066 | 1.308619 |
| 30 | R2 | C7 | 0.142023 | 0.309322 | 1.303209 |
| 31 | M8 | M7 | 0.060311 | 0.333333 | 1.297980 |
| 32 | C6 | M2 | 0.054475 | 0.373333 | 1.296577 |
| 33 | C1 | M6 | 0.089494 | 0.264368 | 1.294143 |
| 34 | O6 | E2 | 0.068093 | 0.555556 | 1.292107 |
| 35 | C3 | M2 | 0.058366 | 0.370370 | 1.286286 |
| 36 | C2 | M8 | 0.075875 | 0.232143 | 1.283026 |
| 37 | C3 | M4 | 0.052529 | 0.333333 | 1.278607 |
| 38 | R2 | M3 | 0.132296 | 0.288136 | 1.276739 |
| 39 | M3 | E1 | 0.105058 | 0.465517 | 1.266010 |
| 40 | O2 | E5 | 0.180934 | 0.460396 | 1.265474 |
| 41 | O3 | E5 | 0.097276 | 0.458716 | 1.260855 |
| 42 | C7 | M1 | 0.107004 | 0.450820 | 1.259355 |
| 43 | O4 | E2 | 0.068093 | 0.538462 | 1.252349 |
| 44 | O6 | O2 | 0.060311 | 0.492063 | 1.252082 |
| 45 | R2 | C4 | 0.107004 | 0.233051 | 1.234929 |
| 46 | M2 | M8 | 0.064202 | 0.222973 | 1.232345 |
| 47 | M1 | O2 | 0.173152 | 0.483696 | 1.230790 |
| 48 | M5 | E2 | 0.184825 | 0.527778 | 1.227501 |
| 49 | O4 | E3 | 0.064202 | 0.507692 | 1.225135 |
| 50 | C2 | M9 | 0.071984 | 0.220238 | 1.217230 |
| 51 | M1 | E6 | 0.138132 | 0.385870 | 1.216791 |
| 52 | O4 | E1 | 0.056420 | 0.446154 | 1.213350 |
| 53 | E6 | E1 | 0.140078 | 0.441718 | 1.201285 |
| Sensitive Factor | Causal Pathway Factors | High Frequency Factors | Critical Factor | Important Factor | General Factors |
|---|---|---|---|---|---|
| O5 | R1 | R2 | E1 | O5 | M7 |
| E5 | R2 | E4 | O1 | E5 | C5 |
| O2 | C2 | E2 | M1 | O2 | C6 |
| O3 | C7 | E3 | O3 | O7 | |
| E1 | M1 | O2 | O6 | O4 | |
| O6 | O1 | R1 | E3 | C4 | |
| O1 | E1 | E1 | E4 | M9 | |
| E3 | E4 | E5 | R2 | M3 | |
| M1 | E6 | M1 | E2 | E7 | |
| M5 | R1 | M4 | |||
| C1 | M5 | M2 | |||
| O1 | C1 | M8 | |||
| C2 | C2 | C3 | |||
| O5 | E6 | R3 | |||
| E6 | C7 | M6 |
Disclaimer/Publisher’s Note: The statements, opinions and data contained in all publications are solely those of the individual author(s) and contributor(s) and not of MDPI and/or the editor(s). MDPI and/or the editor(s) disclaim responsibility for any injury to people or property resulting from any ideas, methods, instructions or products referred to in the content. |
© 2025 by the authors. Licensee MDPI, Basel, Switzerland. This article is an open access article distributed under the terms and conditions of the Creative Commons Attribution (CC BY) license (https://creativecommons.org/licenses/by/4.0/).
Share and Cite
Zhou, Z.; Guo, J.; Huang, J. Chemical Safety Risk Identification and Analysis Based on Improved LDA Topic Model and Bayesian Networks. Appl. Sci. 2025, 15, 6197. https://doi.org/10.3390/app15116197
Zhou Z, Guo J, Huang J. Chemical Safety Risk Identification and Analysis Based on Improved LDA Topic Model and Bayesian Networks. Applied Sciences. 2025; 15(11):6197. https://doi.org/10.3390/app15116197
Chicago/Turabian StyleZhou, Zhiyong, Jiahang Guo, and Jianhui Huang. 2025. "Chemical Safety Risk Identification and Analysis Based on Improved LDA Topic Model and Bayesian Networks" Applied Sciences 15, no. 11: 6197. https://doi.org/10.3390/app15116197
APA StyleZhou, Z., Guo, J., & Huang, J. (2025). Chemical Safety Risk Identification and Analysis Based on Improved LDA Topic Model and Bayesian Networks. Applied Sciences, 15(11), 6197. https://doi.org/10.3390/app15116197