1. Introduction
Climate change represents one of the greatest challenges of our time, primarily driven by the intensive use of fossil fuels, which increase greenhouse gas concentrations and, consequently, global temperatures [
1]. To mitigate this issue, transitioning to renewable energy sources has become a global priority. In this context, the European Green Deal aims to achieve climate neutrality by 2050, in alignment with the Paris Agreement [
2]. This commitment has prompted European Union countries to adopt significant measures to reduce carbon emissions. For instance, in Spain, renewable energy accounted for 51% of total electricity generation by 2022. However, this figure remains below the target established in the National Integrated Energy and Climate Plan (PNIEC) 2021–2030, which sets a goal for 78% renewable electricity production by 2030. Achieving this goal will require the installation of 78 GW of wind power, 39 GW of photovoltaic power, and 18 GW of solar thermal power [
3,
4].
Among renewable energy technologies, solar energy has been identified as one of the most promising options, particularly in its shortwave photovoltaic (PV) and longwave concentrated solar power (CSP) modalities [
5,
6]. Notably, CSP technology stands out as a key option due to its ability to deliver clean and flexible energy, supported by efficient thermal energy storage systems [
7]. Thanks to its high levels of direct solar irradiation, Spain is positioned as a potential leader in the development and deployment of these technologies [
8,
9,
10], making the country a strategic location for CSP implementation.
Despite its inherent advantages, the LCOE for CSP remains higher than that of other renewable sources such as PV and wind power [
11]. Consequently, reducing these costs is a major focus for both the scientific community and industry. One of the most promising strategies to achieve this goal is increasing the operating temperature in solar thermal plants, as several studies have demonstrated its potential to enhance efficiency and lower operational costs [
12,
13].
On the other hand, the growing penetration of renewable energy has led to an increase in electricity surpluses due to the intermittent nature of some technologies [
14,
15]. It is estimated that, by 2030, electricity curtailment in Spain could range between 7.5 and 34 TWh
e [
16,
17]. This trend has spurred the development of various energy storage solutions, with batteries emerging as one of the most widely adopted options [
18,
19]. In this context, thermal energy storage using molten salts, as implemented in modern CSP plants, and solid particles, which stand out for their advantages in thermal efficiency and operational flexibility [
20,
21].
Beyond the technical analysis, the insights from this study hold direct relevance for energy policy and strategic planning in Spain. The National Integrated Energy and Climate Plan (PNIEC) emphasizes not only the massive deployment of renewable generation but also the need for flexible and dispatchable technologies to ensure system reliability. In this context, CSP plants equipped with thermal storage—especially when adapted to recover curtailed electricity—can provide both long-duration storage and valuable grid inertia. Moreover, the integration of Carnot batteries could support industrial electrification strategies by enabling the use of surplus renewable electricity for high-temperature thermal applications. These capabilities align with key policy priorities, making the proposed configurations potentially attractive for targeted investment incentives or capacity remuneration mechanisms.
This study aims to conduct a comparative analysis of molten salts and solid particles as storage media in solar thermal plants in Spain. The objective is to evaluate the technical and economic feasibility of these technologies, with a particular focus on their capacity to manage electricity surpluses and facilitate the integration of renewable energy into the power grid.
2. Technical Solution
2.1. Analysis of Surplus Electricity Availability
The methodology proposed in [
22,
23], aimed at identifying and quantifying real-time technical constraints in the Spanish electricity system using data published by the Transmission System Operator (REE), was followed. In particular, data from the I3DIA08 files for the period 2016–2021 were used [
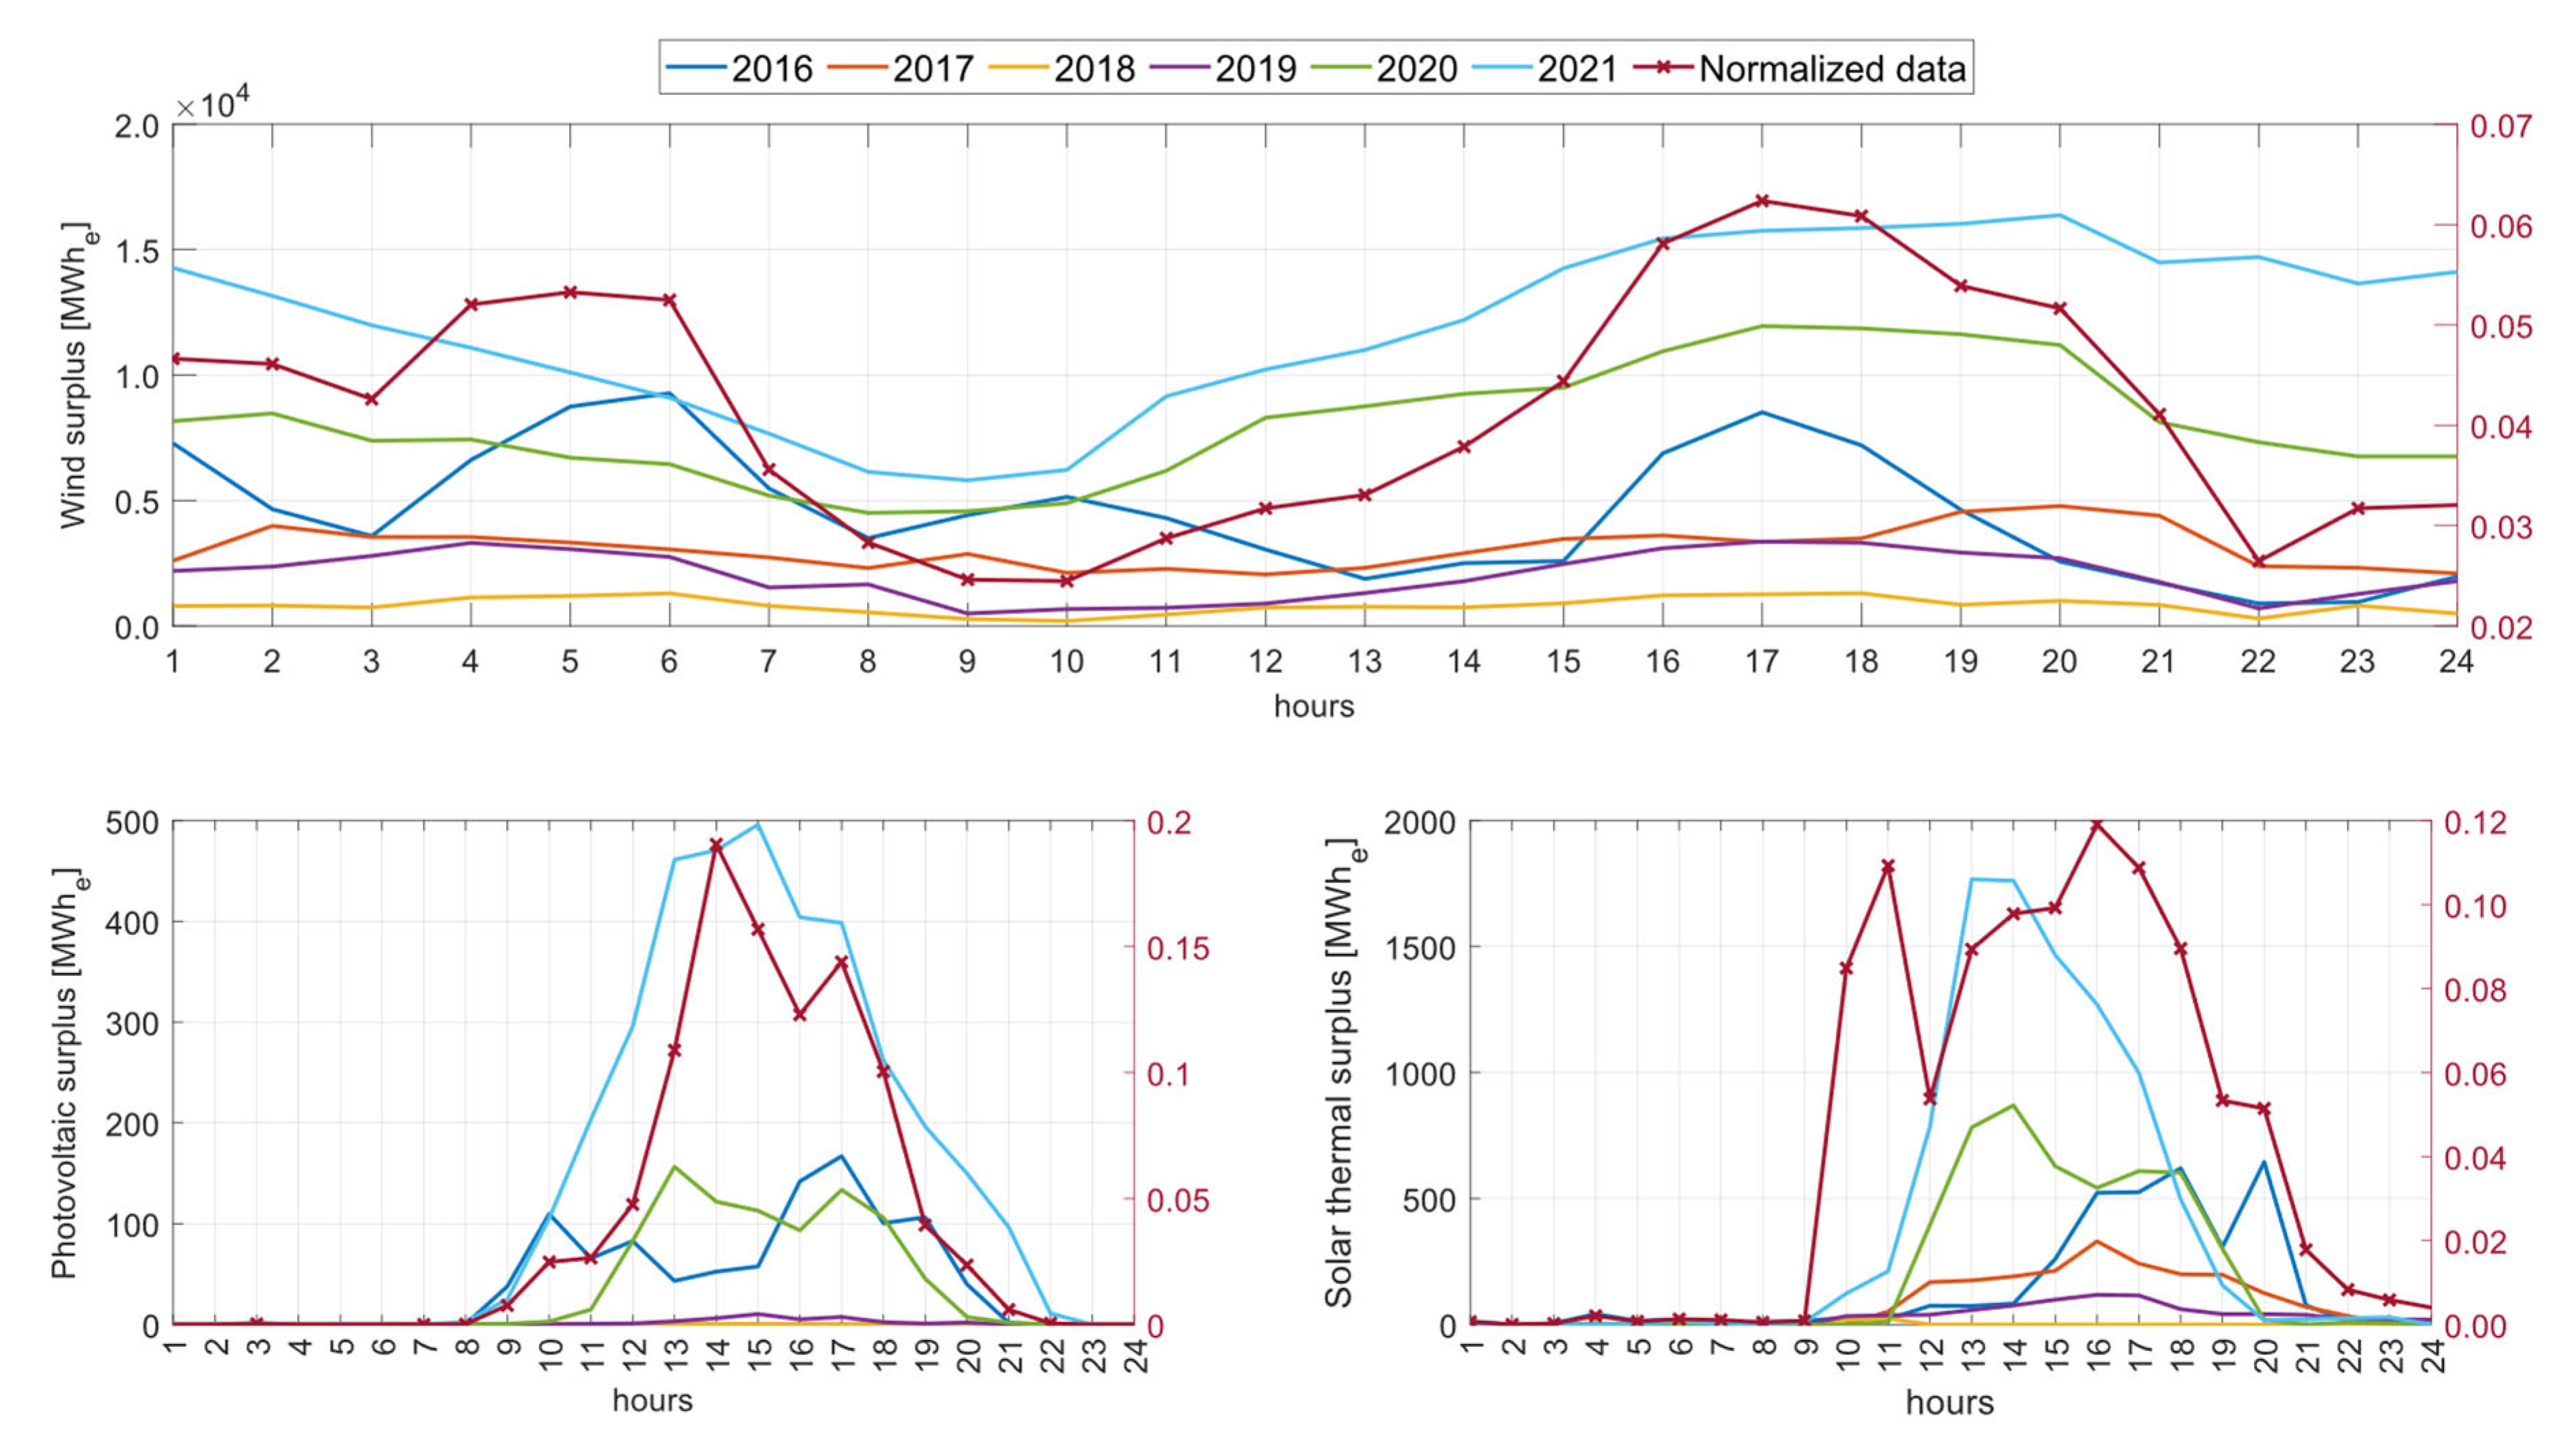
24], which report hourly real-time constraint resolutions. This methodology was adapted by focusing on downward redispatch events associated with electrical surpluses—specifically UPLTROR, UPLMER, and UPLTRT—and by selecting only those cases classified as transport network (RTT) or distribution network (RTD) constraints.
Technical constraints are defined as any circumstance or incident arising from the state of the electricity system that, due to its impact on security, quality, and reliability conditions established by regulation and operational procedures, requires the system operator’s (SO) technical decision to modify energy schedules [
25].
Figure 1 presents the hourly resolution of electricity surpluses attributed to technical constraints associated with renewable technologies, including wind power, photovoltaic solar power, and solar thermal power, for the analyzed period. Additionally, the normalized average hourly distribution considering the entire study period is included, representing the fractional contribution of each hour to the total annual surplus generation. This normalization allows for a clear visualization of the typical hourly distribution pattern of surplus electricity throughout the year.
2.2. Definition of Scenarios
In the technical solution, the definition of two tower solar thermal power plants with storage has been considered: one using molten salts and the other using dense particle suspension (DPS). The same solar field has been employed for both plants, using identical incident irradiation, corresponding to the Gemasolar power plant.
Additionally, the integration of surplus electrical energy storage in each plant has been analyzed, resulting in four different scenarios, which are represented in
Table 1.
2.2.1. Baseline Configuration: Scenario I
The Gemasolar power plant, located in the municipality of Fuentes de Andalucía, Sevilla (37°33′ N, 5°19′ W [
26]), is the first commercial-scale solar thermal power plant to utilize a central tower and molten salt thermal storage system [
27]. This facility has been selected as the basis for designing Scenario I in this study. The main characteristics of the plant are summarized in
Table 2.
The selection of Gemasolar is justified by its recognition as a standard reference for tower solar thermal plants with molten salt storage [
13] and its extensive use in various studies where it has been considered a benchmark facility [
28,
29,
30].
In this plant, a field of mirrors, known as heliostats, reflects sunlight onto a receiver located at the top of a central tower. In the receiver, the concentrated heat is absorbed by a heat transfer fluid, which in this case is a molten salt mixture of 60% NaNO
3 and 40% KNO
3. This fluid is stored at high temperature in a dedicated tank. When required, the fluid transfers part of its heat—reducing its temperature—to a working fluid, specifically liquid water, which is converted into superheated steam. The generated steam is then used to produce electricity through a subcritical Rankine cycle [
13,
31].
These solar thermal power plants offer numerous advantages in electricity production, particularly their ability to generate dispatchable energy. This capability arises from the potential to store excess solar energy during the day, extending electricity production even during periods without solar irradiation, such as cloudy days or nighttime.
However, one of the main challenges of these plants is the need to maintain the heat transfer fluid above 220 °C [
31,
32,
33,
34] to prevent solidification, which necessitates the incorporation of an electric tracing system.
Table 3 outlines the primary characteristics of the solar salt.
A summary of the typical efficiencies achieved in each section of the plant, as reported in the literature, is presented in
Table 4. This table includes the primary zones, excluding the heliostat field, as it is pre-simulated using SAM with a model specifically developed for the Gemasolar plant [
35]. These efficiencies will be subsequently used in
Section 3 for the plant simulation.
2.2.2. Enhanced Configuration with Solid Particles: Scenario III
Despite its advantages, CSP remains more expensive than alternatives such as wind or PV technologies. To enhance its competitiveness, increasing operating temperatures in the power cycle is estimated to reduce costs by improving conversion efficiency and increasing energy storage densities. For instance, this could lead to a reduction in the size of the solar field, which can account for up to 50% of the total plant cost [
13].
To address these challenges, the use of DPS has been identified as a viable alternative. Key features of solid particles include the following [
20]:
The ability to function as both a heat absorber and a thermal energy storage medium.
Low heat transfer medium (HTM) costs.
High stability at elevated temperatures.
Due to these advantages, solid particles were considered to replace molten salts in the previously described power plant in Scenario I. For this study, an upflow receiver featuring a fluidized bed circulating through tubes was selected, generating a dense suspension of particles. This choice is justified for several reasons:
The gas–solid fluidized bed technology has been extensively used in industries such as chemical, petrochemical, metallurgical, and coal-based power generation, making it a mature technology [
41].
Fluidization enables the gas–solid mixture to behave like a gas, facilitating its transport and allowing particles to be easily separated from the gas. This process is particularly advantageous for energy storage, as it allows for the use of hot particles with high density [
13].
In comparison with other energy storage alternatives under investigation, this technology has been demonstrated in several large-scale projects, reaching capacities in the megawatt range [
21], such as the experimental study conducted in France [
42].
To enable comparison, Scenario III adopts the same primary characteristics outlined in
Table 2, except for those exclusive to this scenario, such as the receiver power, the thermal storage mass, and the annual electricity production.
For this study, silicon carbide particles were selected. This choice is based on their size and density characteristics, which facilitate fluidization, as they belong to Group A of the Geldart scale [
43]. Additionally, due to their ceramic nature, these particles can withstand temperatures up to 1000 °C, with the primary limitation being the material of the absorber tubes. Being chemically inert and non-explosive, they eliminate the challenges associated with solidification and the need for electric tracing, as is the case with molten salts. The main properties of these particles are summarized in
Table 5.
In this case, higher operating temperatures allow the adoption of a power block configuration typical of advanced supercritical fossil power plants, thereby increasing the power block efficiency [
13]. A summary of the main conditions of the different states of this power block configuration is presented in
Table 6.
Similarly to the previous case,
Table 7 presents the typical efficiencies for each section of the power plant in Scenario III, as reported in the literature. These efficiencies will be subsequently used in
Section 3 for the plant simulation.
2.3. Carnot Battery Integration
2.3.1. Carnot Battery with Baseline: Scenario II
To leverage the excess electricity described earlier, a Carnot battery has been selected due to its natural compatibility with the solar thermal power plants previously detailed.
Carnot batteries enable the conversion of electrical energy into thermal energy during the charging phase using electric heaters. Subsequently, when the stored energy is required, the reverse conversion from thermal to electrical energy is performed through the power block turbine. This process relies on creating a temperature gradient between two heat reservoirs, effectively utilizing surplus electricity [
47].
In this case, a system has been selected in which surplus electricity from the grid is used to generate a hot reservoir via the Joule effect. This can be achieved using heat pumps or electric resistances, for example [
47,
48]. For this study, an electric resistance has been chosen due to several factors:
High efficiency: Electric resistances with molten salts can achieve efficiencies of up to 100% [
49].
Preference for large-scale projects: Electric resistances are commonly used in large-capacity demonstration or pre-commercial projects [
48,
50].
Simplicity and cost-effectiveness: Electric resistances require less investment compared to alternatives like heat pumps [
49], which also cannot reach temperatures beyond 130–150 °C [
50,
51].
For this work, the electric resistance will heat the molten salts up to 568 °C [
2] and will be installed in parallel with the solar field and the storage system, as suggested in other studies [
52,
53,
54]. This configuration allows the electric resistance to operate alongside the heliostat field, enabling, for instance, the transfer of molten salts from the cold tank to the hot tank during nighttime without relying on the tower. Additionally, this bypass installation provides extra temperature control in the cold tank and prevents issues related to salt solidification [
54].
Furthermore, the parallel configuration allows for managing the amount of surplus electricity the plant can accept, prioritizing energy from the solar field. For example, during periods of solar irradiation when storage is at capacity, the plant can reject surplus electricity, optimizing the energy flows.
The charging system for this setup follows the approach developed in [
2]. It consists of a shell-and-tube heat exchanger, where the tubes themselves act as the electric resistance. This design ensures that, whenever the plant can absorb surplus electricity, the electric resistance is activated to heat the molten salts passing through the exchanger. These heated salts are then stored in the thermal reservoirs of the previously described solar thermal plant.
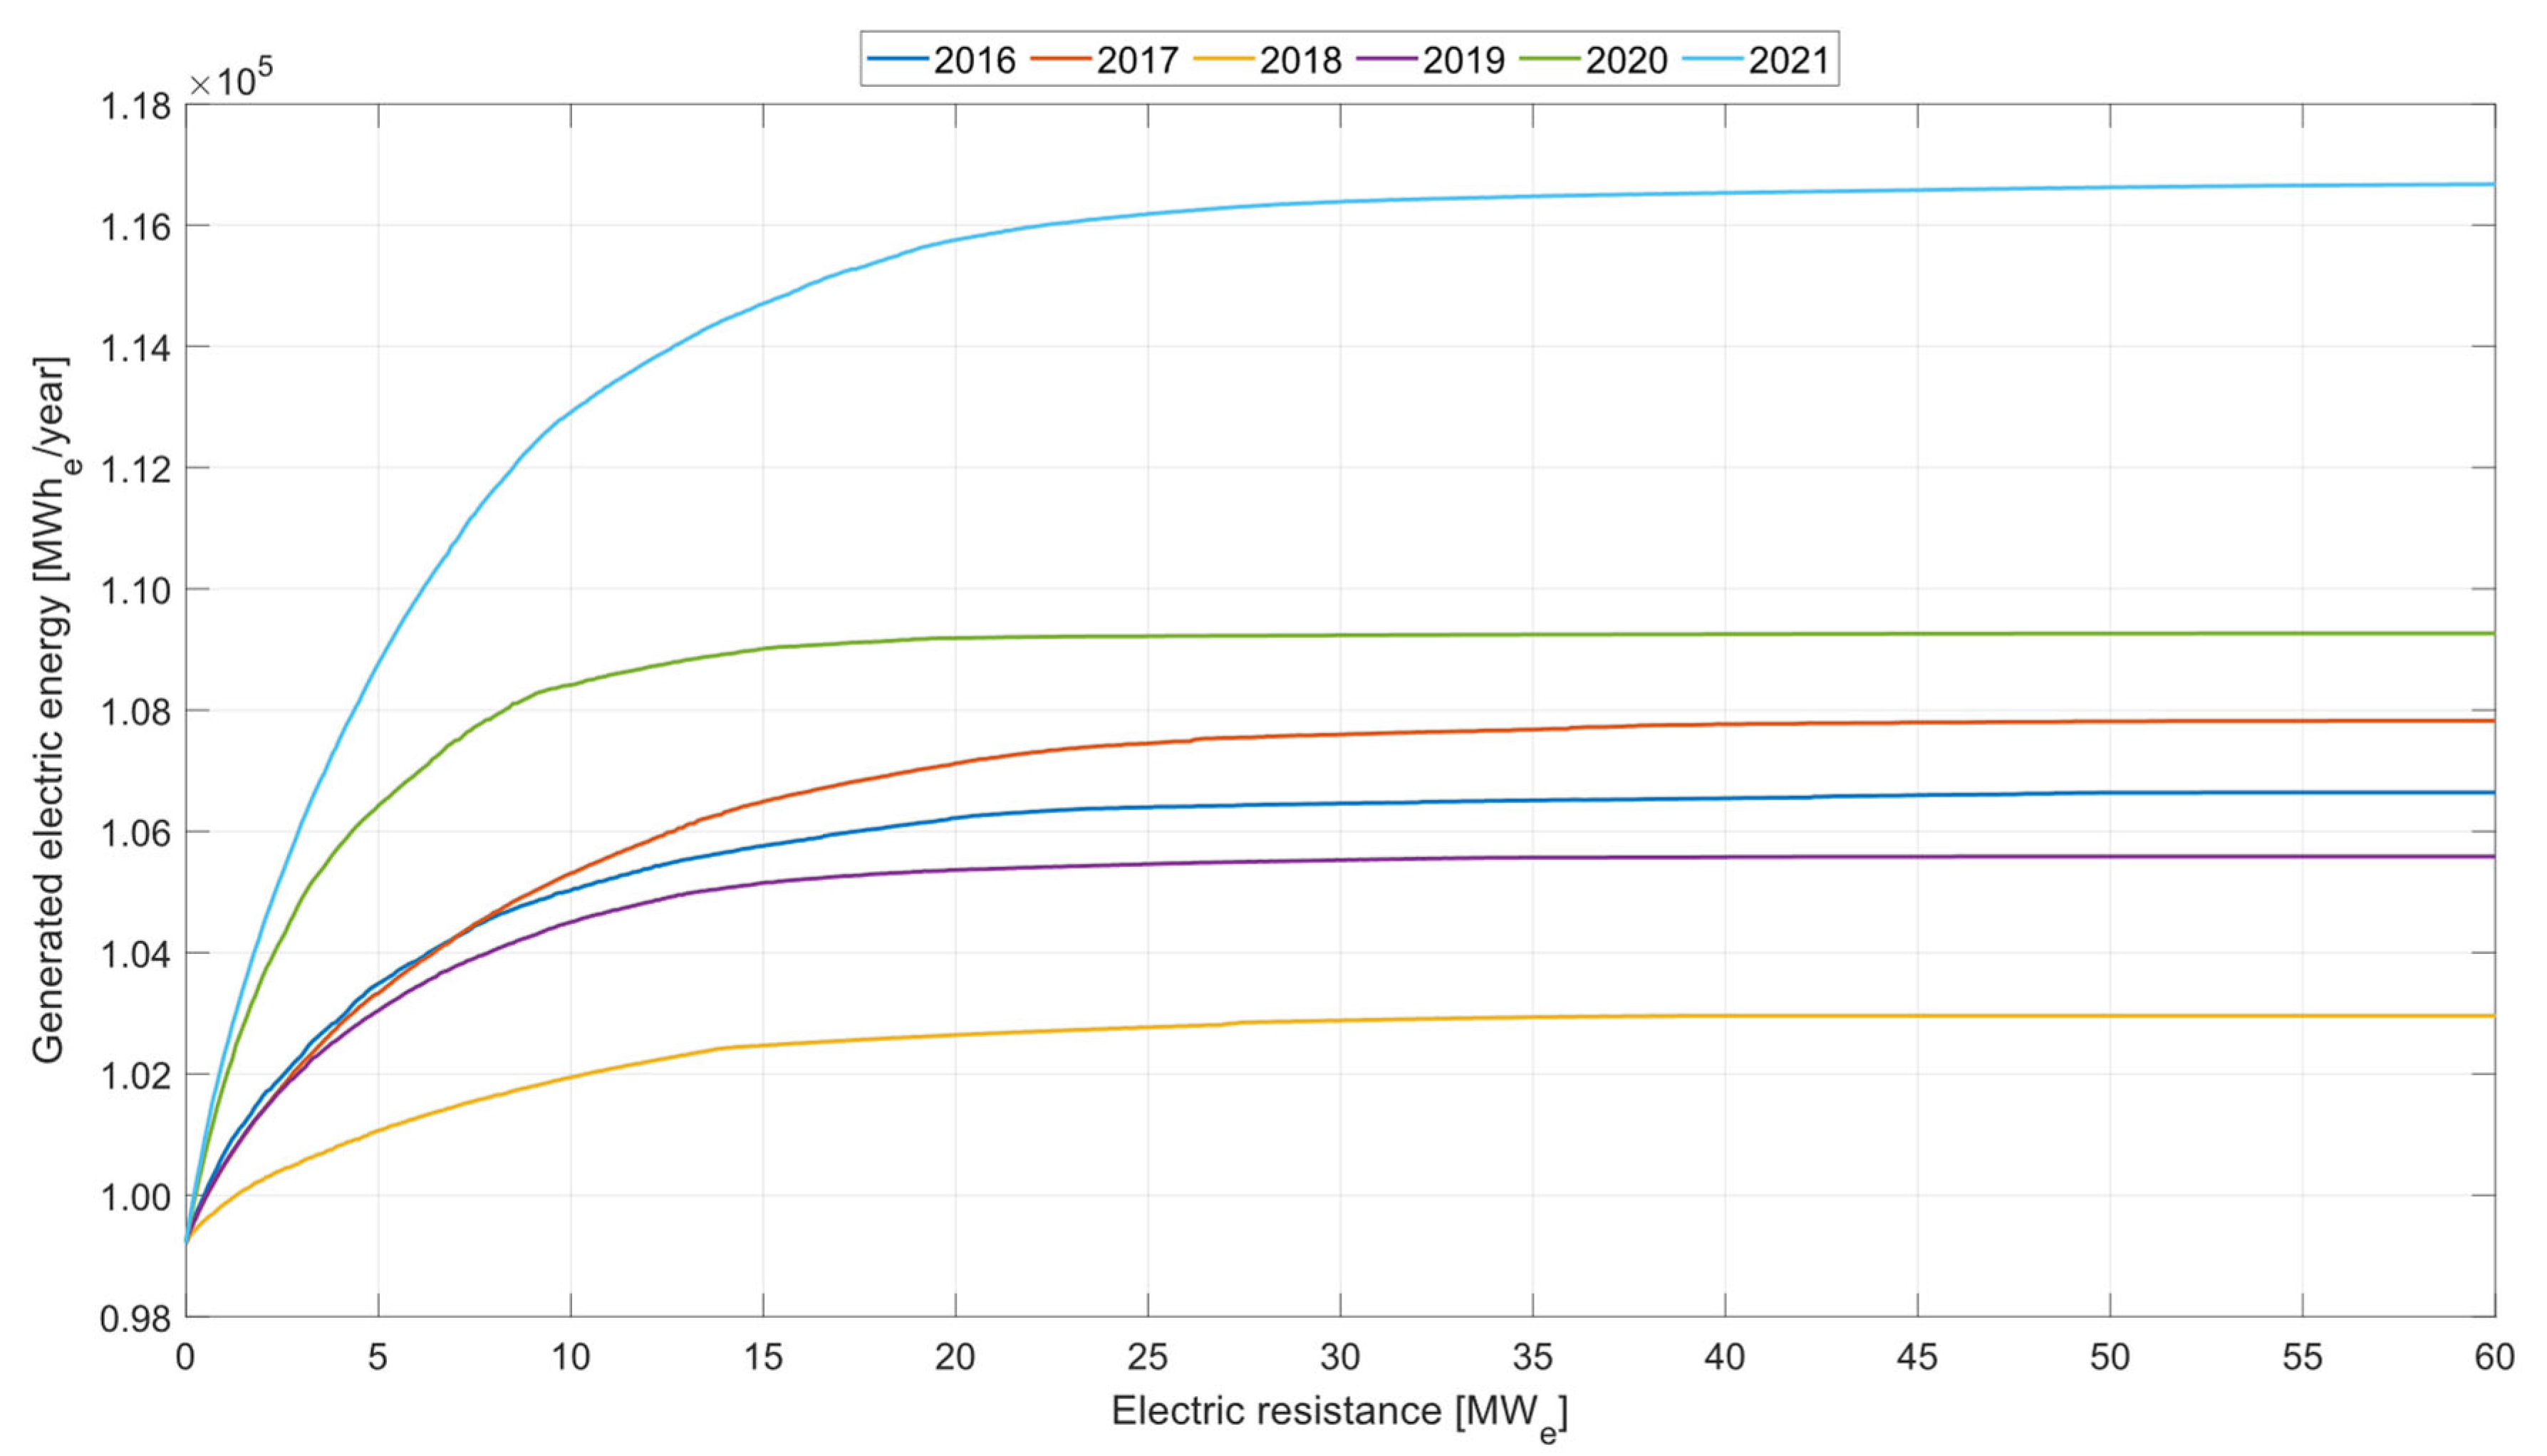
The power of the electric resistance was determined through a sensitivity study, which analyzed the variation in annual electricity production of the solar thermal plant integrated with the Carnot battery as a function of the resistance’s power. As shown in
Figure 2, annual energy production increases with resistance power, but at higher power levels the energy gain becomes negligible due to the limited availability of surplus electricity from the grid. Based on this analysis, an intermediate resistance power of 15 MW
e was selected.
The Rankine cycle of the solar thermal plant has been selected for the discharging process due to its widespread industrial use and technical compatibility with the Joule-based charging cycle, making it the most suitable option [
48,
50].
It is essential to consider the efficiencies involved throughout the Carnot battery charging process. These include the transformer efficiency, resistance efficiency, and the overall conversion efficiency from electricity to heat. A summary of these efficiencies is presented in
Table 8.
2.3.2. Carnot Battery with Solid Particles: Scenario IV
For this scenario, a fluidized bed storage system was developed, aligning with the technical solution implemented in the solar thermal plant. As in the previous case, surplus electricity will power an electric resistance, which in this instance will heat an air stream. The selection of the electric resistance is based on the aspects discussed in the previous section, as well as the high efficiency of the resistance-air system, which can reach up to 100% [
55].
Once the air reaches the desired temperature, it will pass through the tubes of a heat exchanger, transferring most of its heat to the particles in a fluidized bed surrounding the tubes. This process reduces the air temperature. To improve the system’s efficiency, the exiting air, which remains at a relatively high temperature, will be recovered and used both to fluidize and preheat the particles [
56]. This heat exchange system is similar to the one used in [
57].
The power of the electric resistance responsible for heating the air was determined using the same methodology as in the previous section, resulting in a resistance of 15 MWe.
Next, the required air flow rate for both propulsion and particle fluidization was calculated. For this calculation, a target air temperature of 670 °C was set, and the following energy balance equation was applied:
where P
EH is the selected resistance power; η
EH is the efficiency of the selected resistance, fixed at 97.5% according to
Table 9; ṁ
air is the air mass flow rate; Cp is the average specific heat of air [
58]; and ΔT is the temperature difference the air experiences during heating.
After calculating the required flow rate and considering that pressure loss in such beds is low [
21,
59], a pressure drop of 0.3 bar was assumed. It was determined that the air propulsion element must be a centrifugal compressor, based on the required pressure and flow rate [
60].
The compressor power was calculated using (2), assuming air as an ideal gas and an adiabatic compressor [
61]:
where P is the resulting compressor power in kW; T
1 is the air temperature at the compressor inlet, 943 K in this case; γ is the specific heat ratio; R is the gas constant for air; η is the compressor’s isentropic efficiency, assuming an average value of 81% [
60]; and P
1 and P
2 are the inlet and outlet pressures at the compressor, respectively. It is assumed that air enters at atmospheric pressure (1 bar) and exits at 1.3 bar due to the pressure drop.
Using these values, the final compressor power was calculated to be 1.9 MW.
Efficiencies involved in the entire charging process are critical. These include transformer efficiency, resistance efficiency, and overall conversion efficiency from electricity to heat. A summary of these efficiencies is presented in
Table 9.
3. Methodology
As previously mentioned, SAM was used to simulate the solar field and the irradiation received by the receiver. This simulation employed the model developed by [
35], which was validated using annual production data from the Gemasolar plant [
62].
The data on incident irradiation at the receiver were subsequently processed to serve as input for the design of the remaining sections of the solar thermal power plant. These sections included the receiver, thermal energy storage system, steam generation, and power production. For this design, intermediate efficiency values from
Table 4 and
Table 7 were applied. A summary of the assumed efficiencies is provided in
Table 10.
The control strategy and operational framework of plant production is based on the system’s technical limitations and the previously described constraints. The objective is to determine the amount of energy produced during a typical meteorological year (TMY).
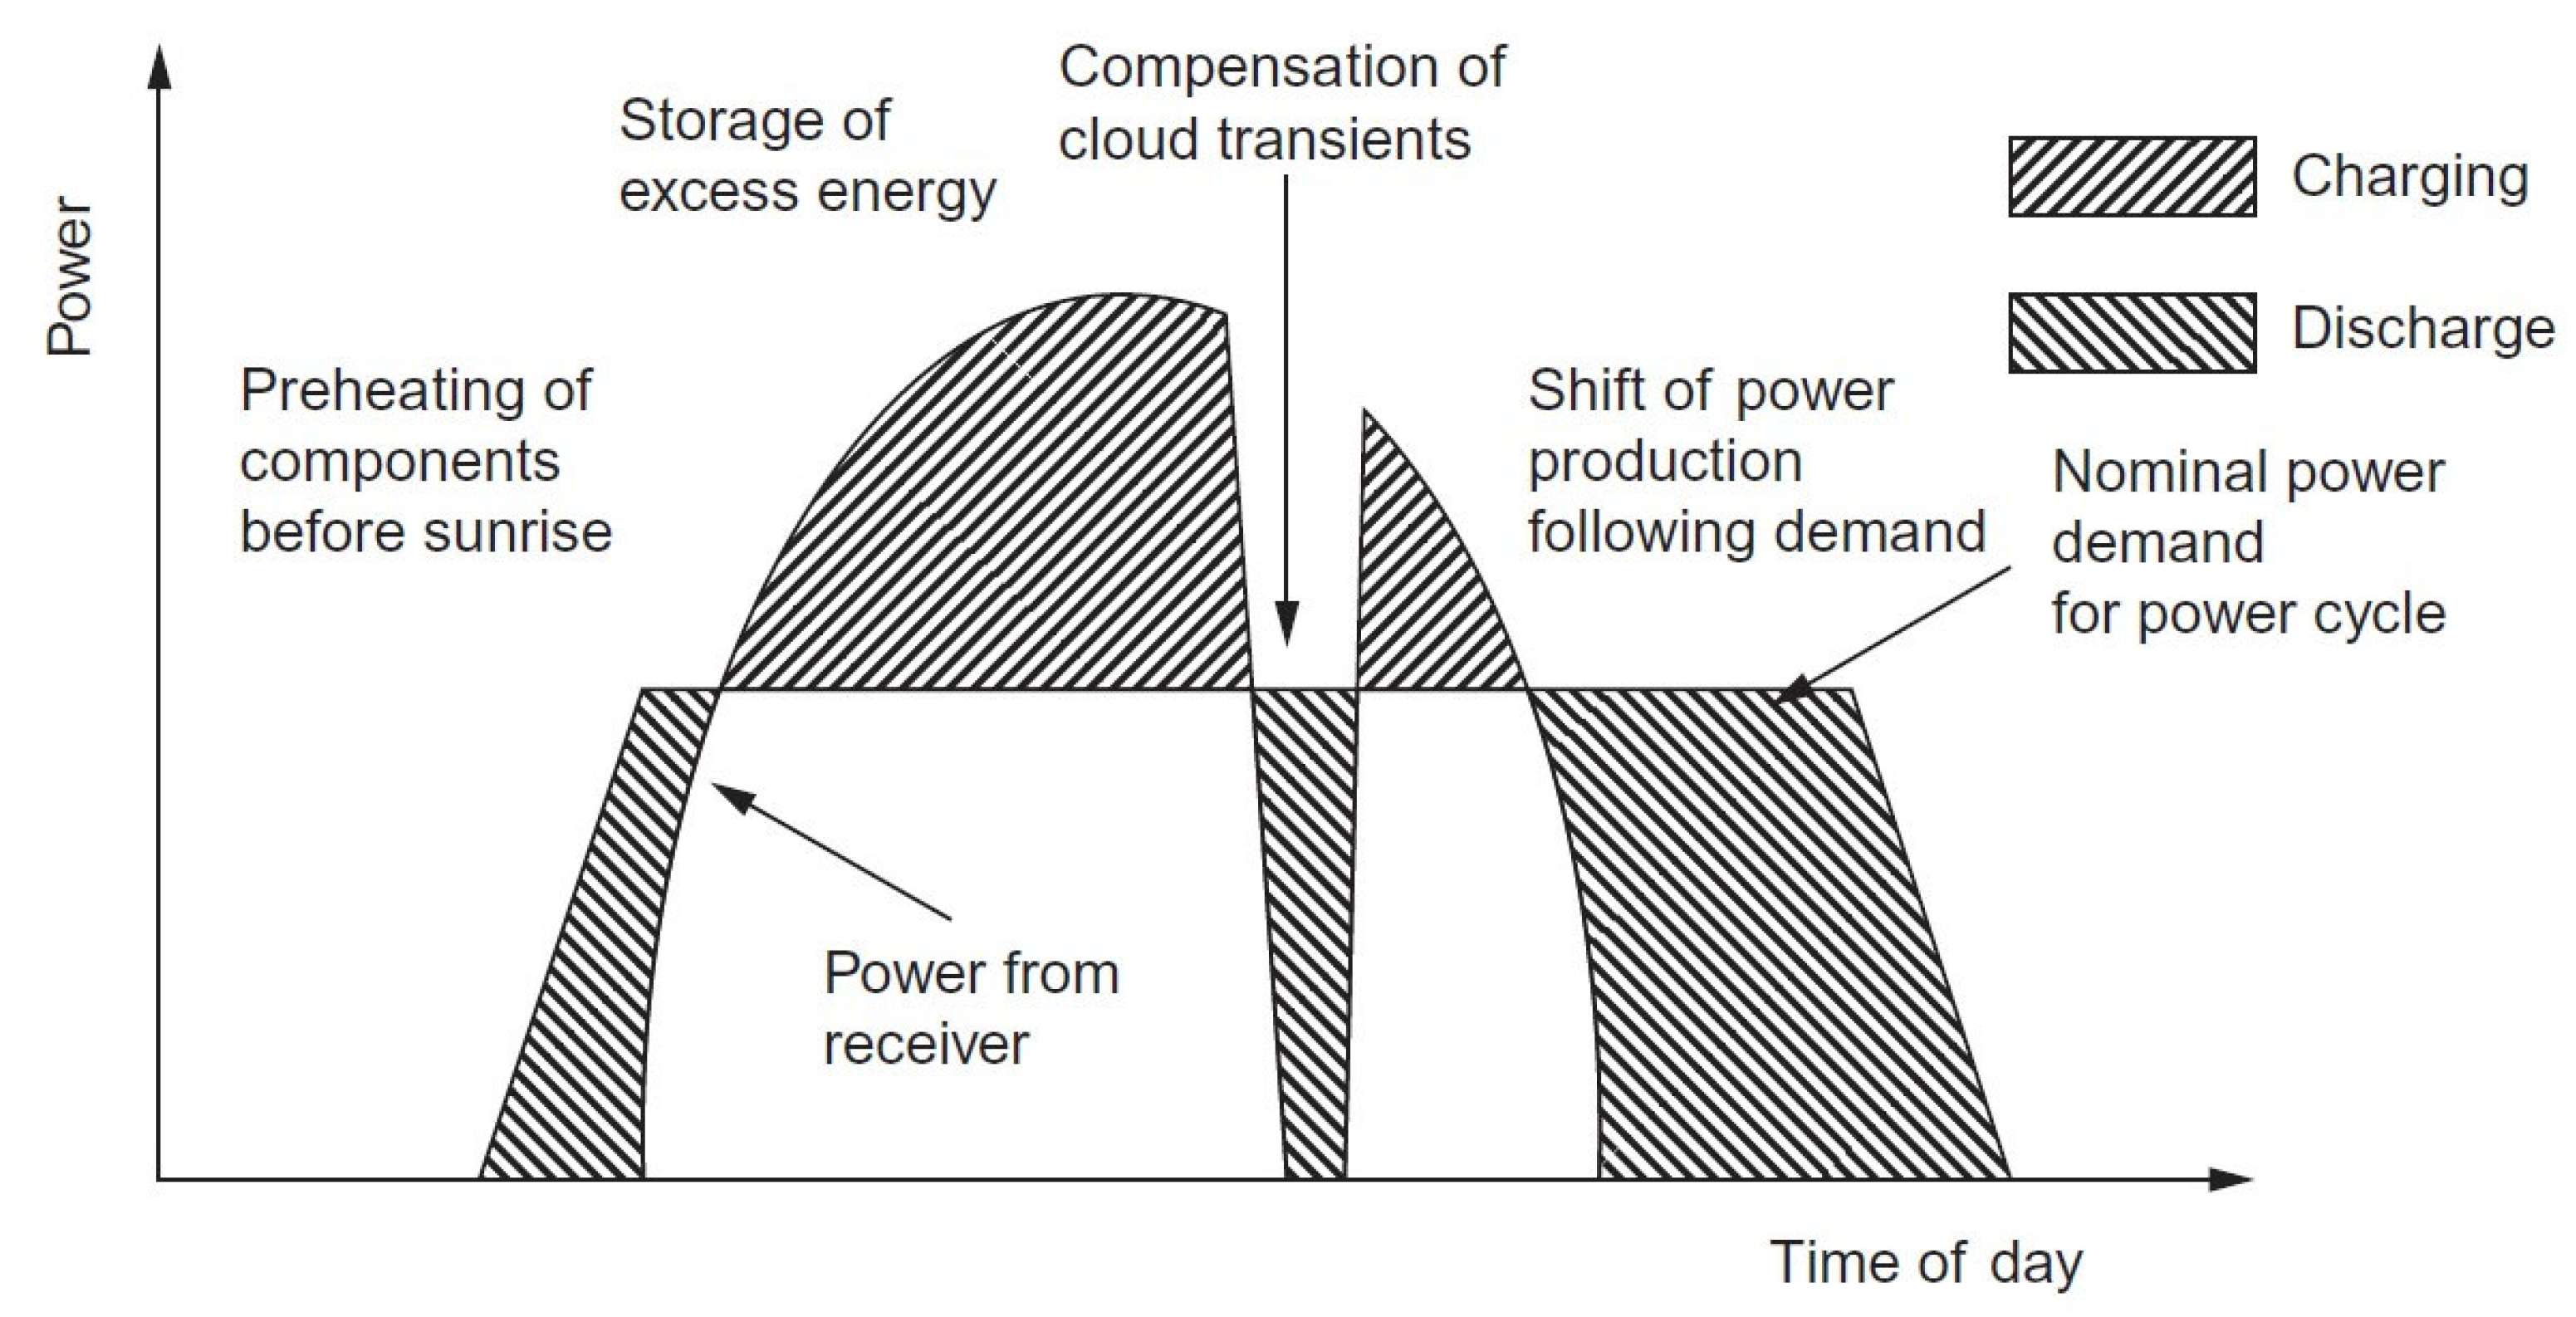
The plant’s production strategy follows the operational modes commonly employed in commercial CSP tower plants, as described in [
29,
63].
Figure 3 illustrates a typical operational diagram for this type of plant:
Storage Mode: The Rankine cycle is powered, and the thermal storage system is charged when the storage level is between the defined minimum and maximum.
Non-Storage Mode: The solar field only supplies energy to operate the Rankine cycle at nominal capacity, without charging storage, as it is already full.
Discharge Mode: During periods without irradiation (nighttime or cloudy weather), stored thermal energy powers the Rankine cycle, provided storage exceeds the minimum threshold.
Disconnected Mode: No energy is produced or stored due to lack of irradiation or operational decisions by the plant.
The strategy was implemented using three operational states. A flowchart illustrating the general operation of the plant is presented in
Figure 4.
Plant Offline: When the plant is offline, the control algorithm evaluates the storage system’s charge level. If feasible, it initiates the progressive startup sequence.
Plant Starting/Shutting Down: The algorithm assesses whether the charge level is sufficient to continue the startup sequence and, if so, the system progressively increases power until the nominal level is reached, simulating a warm start within one hour. If the system is in the process of shutting down, it also checks whether this can be reversed under the same condition. If the charge level is insufficient, the shutdown proceeds as planned.
Plant Online: Depending on the charge level, the control algorithm decides to maintain nominal power production or initiate shutdown with a gradual reduction in power.
The thermal storage system is modeled with the following equations:
where SUN represents the incident irradiation on the receiver, as defined by the SAM simulation based on the model in [
35]; LOSS is a fixed value accounting for tank dimensions (
Table 2) and experimental area-specific heat losses determined by [
65]; and SURP denotes the electrical surpluses, defined as follows:
where η
carnot is the efficiency for electricity-to-heat energy conversion, with values provided in
Table 8 and
Table 9. When SURP(k) ≥ 15 MW, it is capped at 15 MW, while for SURP(k) < 15 MW, the equation above applies.
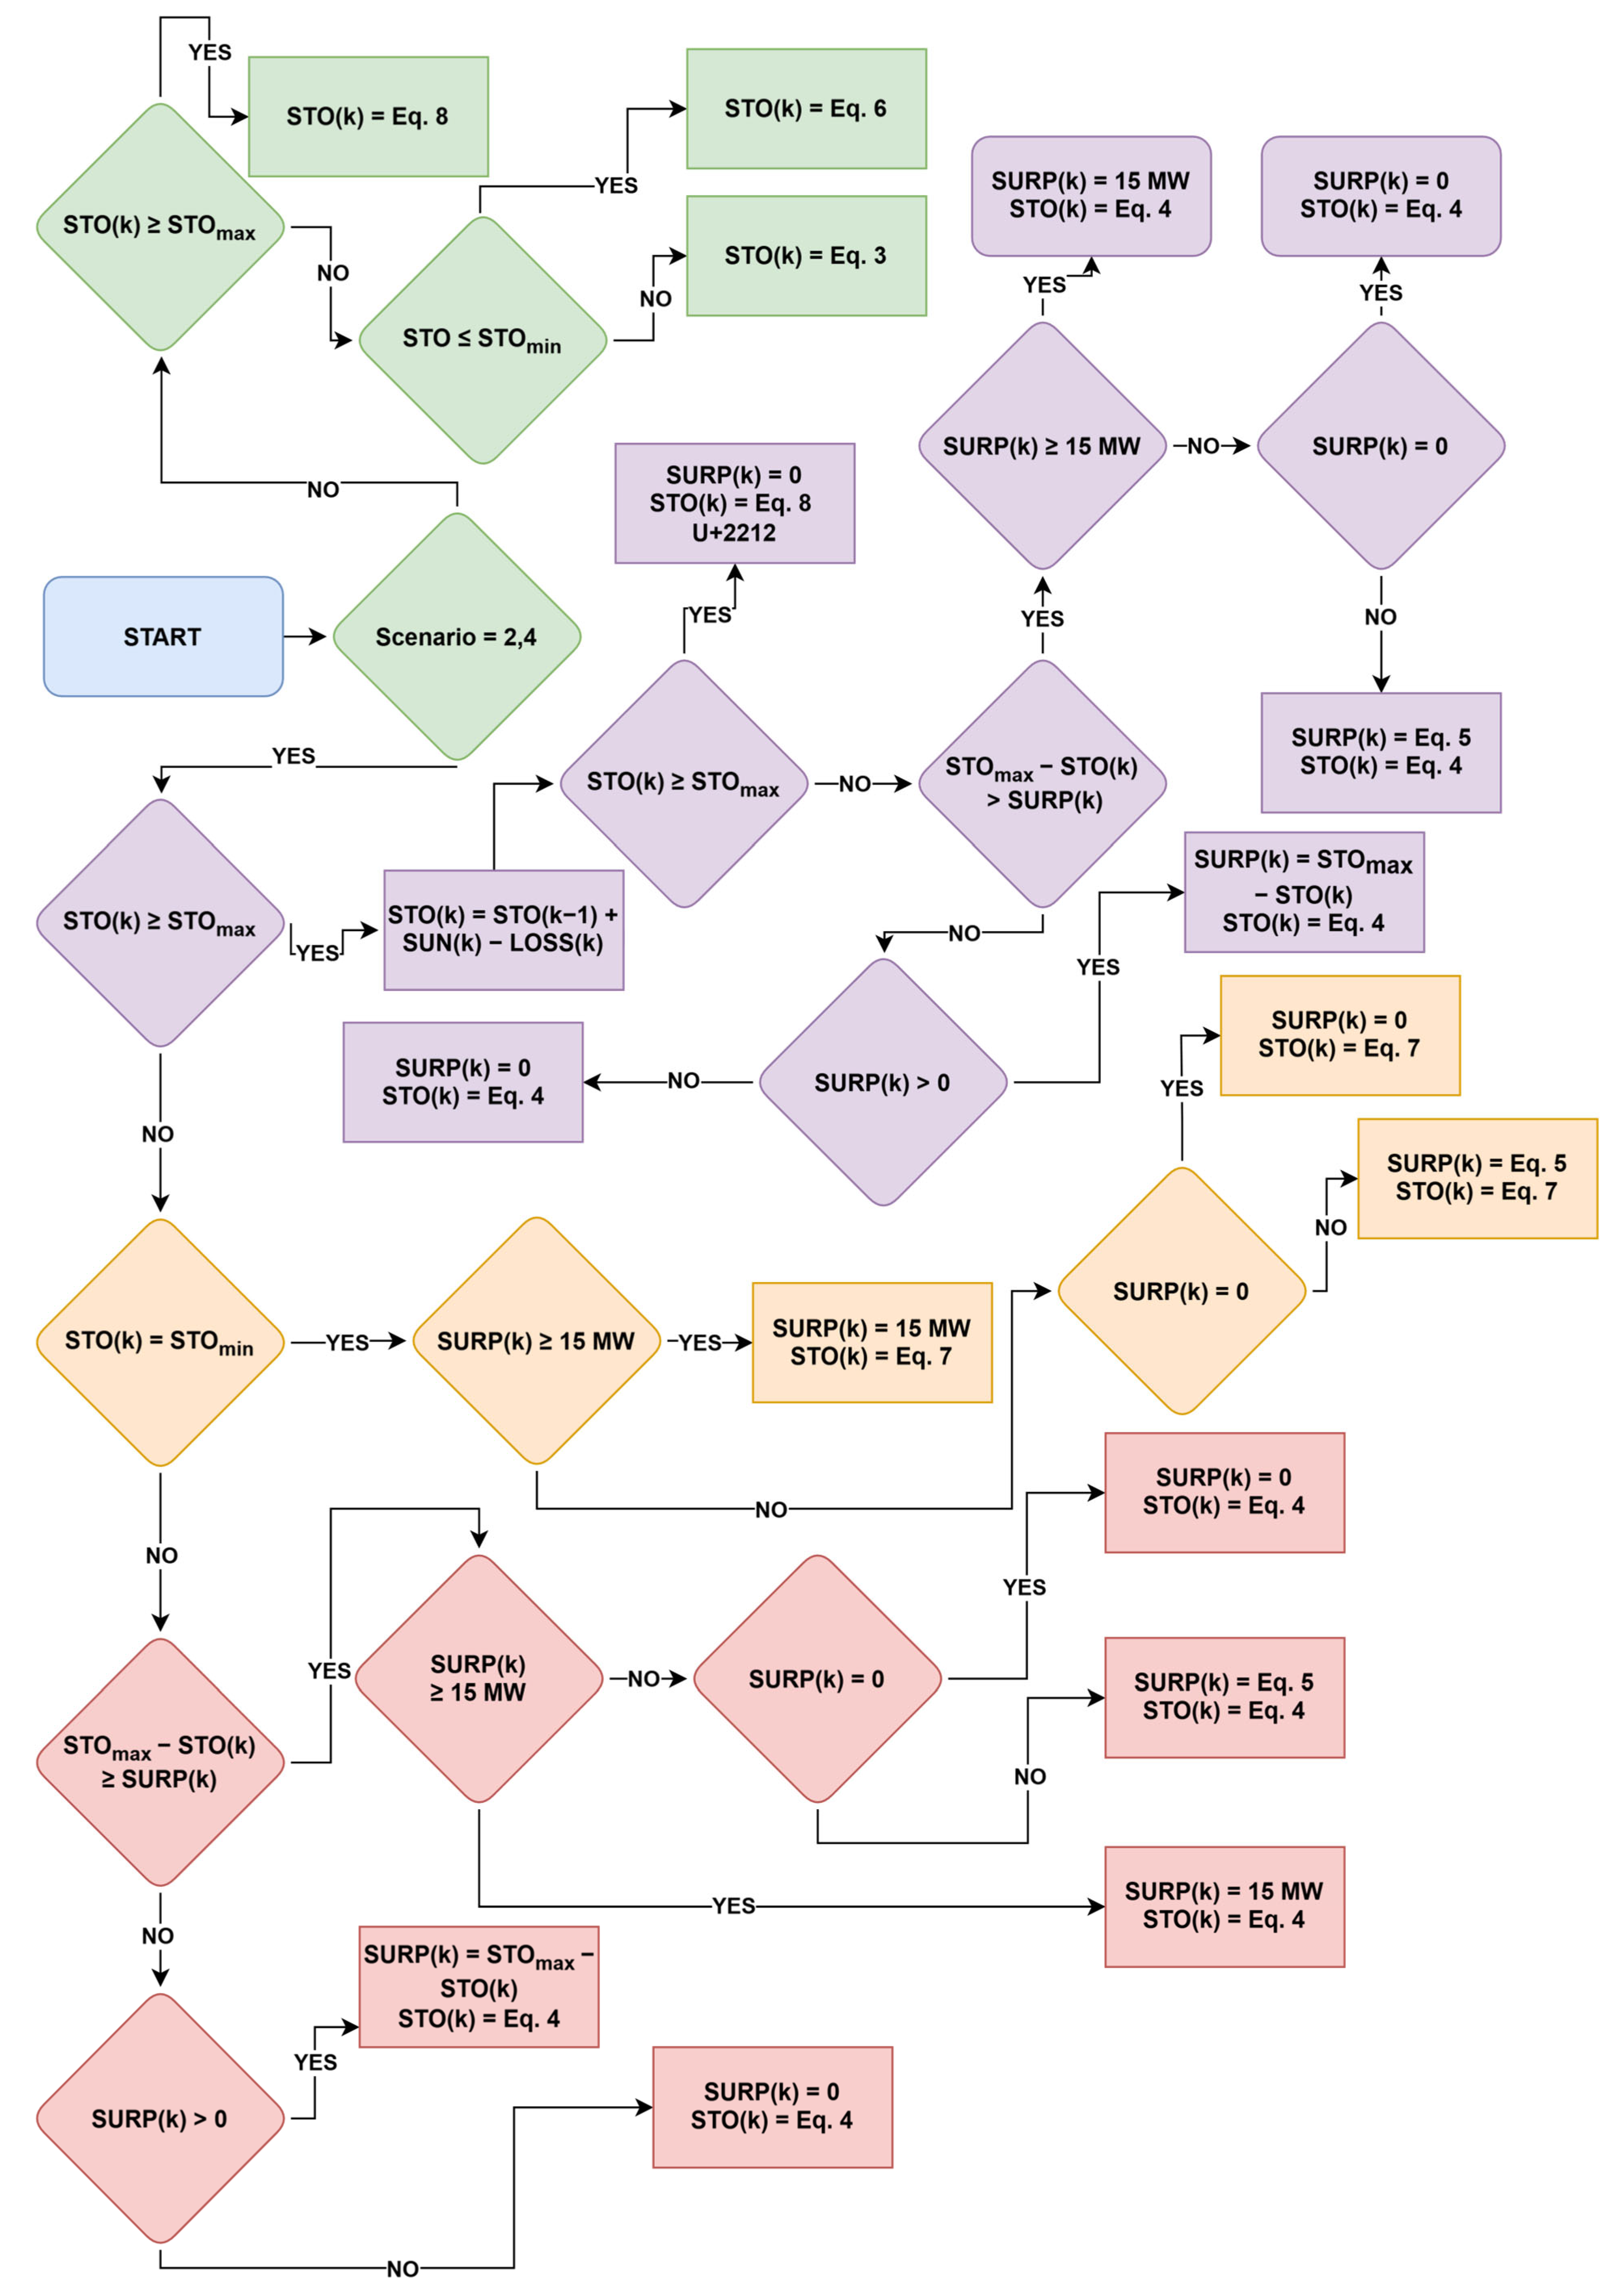
Several predefined states are established to ensure efficient and adaptive control of power production and surplus management. These states are defined based on the thermal level of the hot tank, assuming—by symmetry and for simplification purposes—that the cold tank exhibits inverse behavior.
Figure 5 presents a flow diagram illustrating the control strategy applied to manage the different storage states throughout system operation.
Minimum Storage: Defined as 5% of the maximum storage capacity and set as a safety threshold. If storage drops below this level, the hot tank’s electric resistance activates to maintain the required minimum level. In this state, thermal loss components are excluded from the equations, simulating that this energy is provided by the tank’s electric resistances. Storage at this minimum level is expressed as:
Maximum Storage: Defined as the nominal production capacity for 15 h plus the minimum storage level. With this configuration, the plant ranks among the CSP facilities with the highest storage durations, exceeding the 10 h of Crescent Dunes [
66,
67] while remaining slightly below the 17.5 h offered by Cerro Dominador [
68,
69]. If storage reaches this maximum due to higher irradiation or electrical surpluses, it is capped at this level. Only the energy necessary to maintain the system’s nominal capacity while supplying the power cycle is accepted. Maximum storage is calculated as follows:
When surpluses occur and storage is at maximum capacity, solar energy is prioritized to maintain the system within nominal limits without exceeding capacity.
4. Limitations of the Study
While the presented methodology offers a comprehensive framework to evaluate the integration of thermal storage and curtailed electricity in CSP plants, several limitations inherent to the modeling assumptions and data availability must be acknowledged. These constraints affect the generalizability and applicability of the results and are detailed below.
Firstly, the simulation results for DPS rely exclusively on experimental data and literature models, as there are currently no commercial-scale facilities in operation providing validated performance data. Consequently, all efficiencies for receivers, heat exchangers, and storage components in the DPS configuration are theoretical and may differ from actual long-term behavior under industrial conditions.
Secondly, component efficiencies were treated as fixed values across all simulations, regardless of variations in temperature, part-load operation, or system aging. While this approach simplifies the modeling, it limits the ability to capture performance degradation, dynamic behavior, or off-design scenarios.
Economic estimations—including CAPEX and O&M—were derived from literature sources and adjusted to current price levels using consumer price indices. However, given the novelty of some components, especially in Scenario IV, the associated costs remain indicative rather than definitive.
Regarding operational strategy, the control algorithm prioritizes thermal optimization over cost minimization or grid-oriented dispatch. This idealized dispatch mode does not incorporate constraints such as maintenance downtime, partial load inefficiencies, or real-time grid interactions. Additionally, parasitic consumptions (e.g., for fluid transport, heliostat actuation, or anti-freezing systems) were only partially included in the energy balance, and other losses were assumed negligible.
Finally, the modeling of curtailed electricity availability is based on historical REE data from 2016 to 2021, without considering regulatory evolution, market mechanisms, or dynamic pricing schemes that could affect future surplus patterns.
Despite these limitations, the comparative approach remains valid for understanding the relative advantages of different storage media and integration strategies. However, future work should incorporate real operational data, dynamic component modeling, and techno-economic optimization to enhance the accuracy and applicability of the conclusions.
5. Results and Discussion
5.1. Technical Performance
5.1.1. Performance of Scenarios I and III
The application of the methodology in Scenarios I and III, without utilizing excess electricity, demonstrates that particles can generate 7.4% more annual electricity compared to molten salts. This improvement in mainly due to the ability to operate at higher temperatures than those allowed by molten salt constraints, enabling the use of a supercritical Rankine cycle with enhanced thermal efficiency. The results are consistent with those reported in [
13].
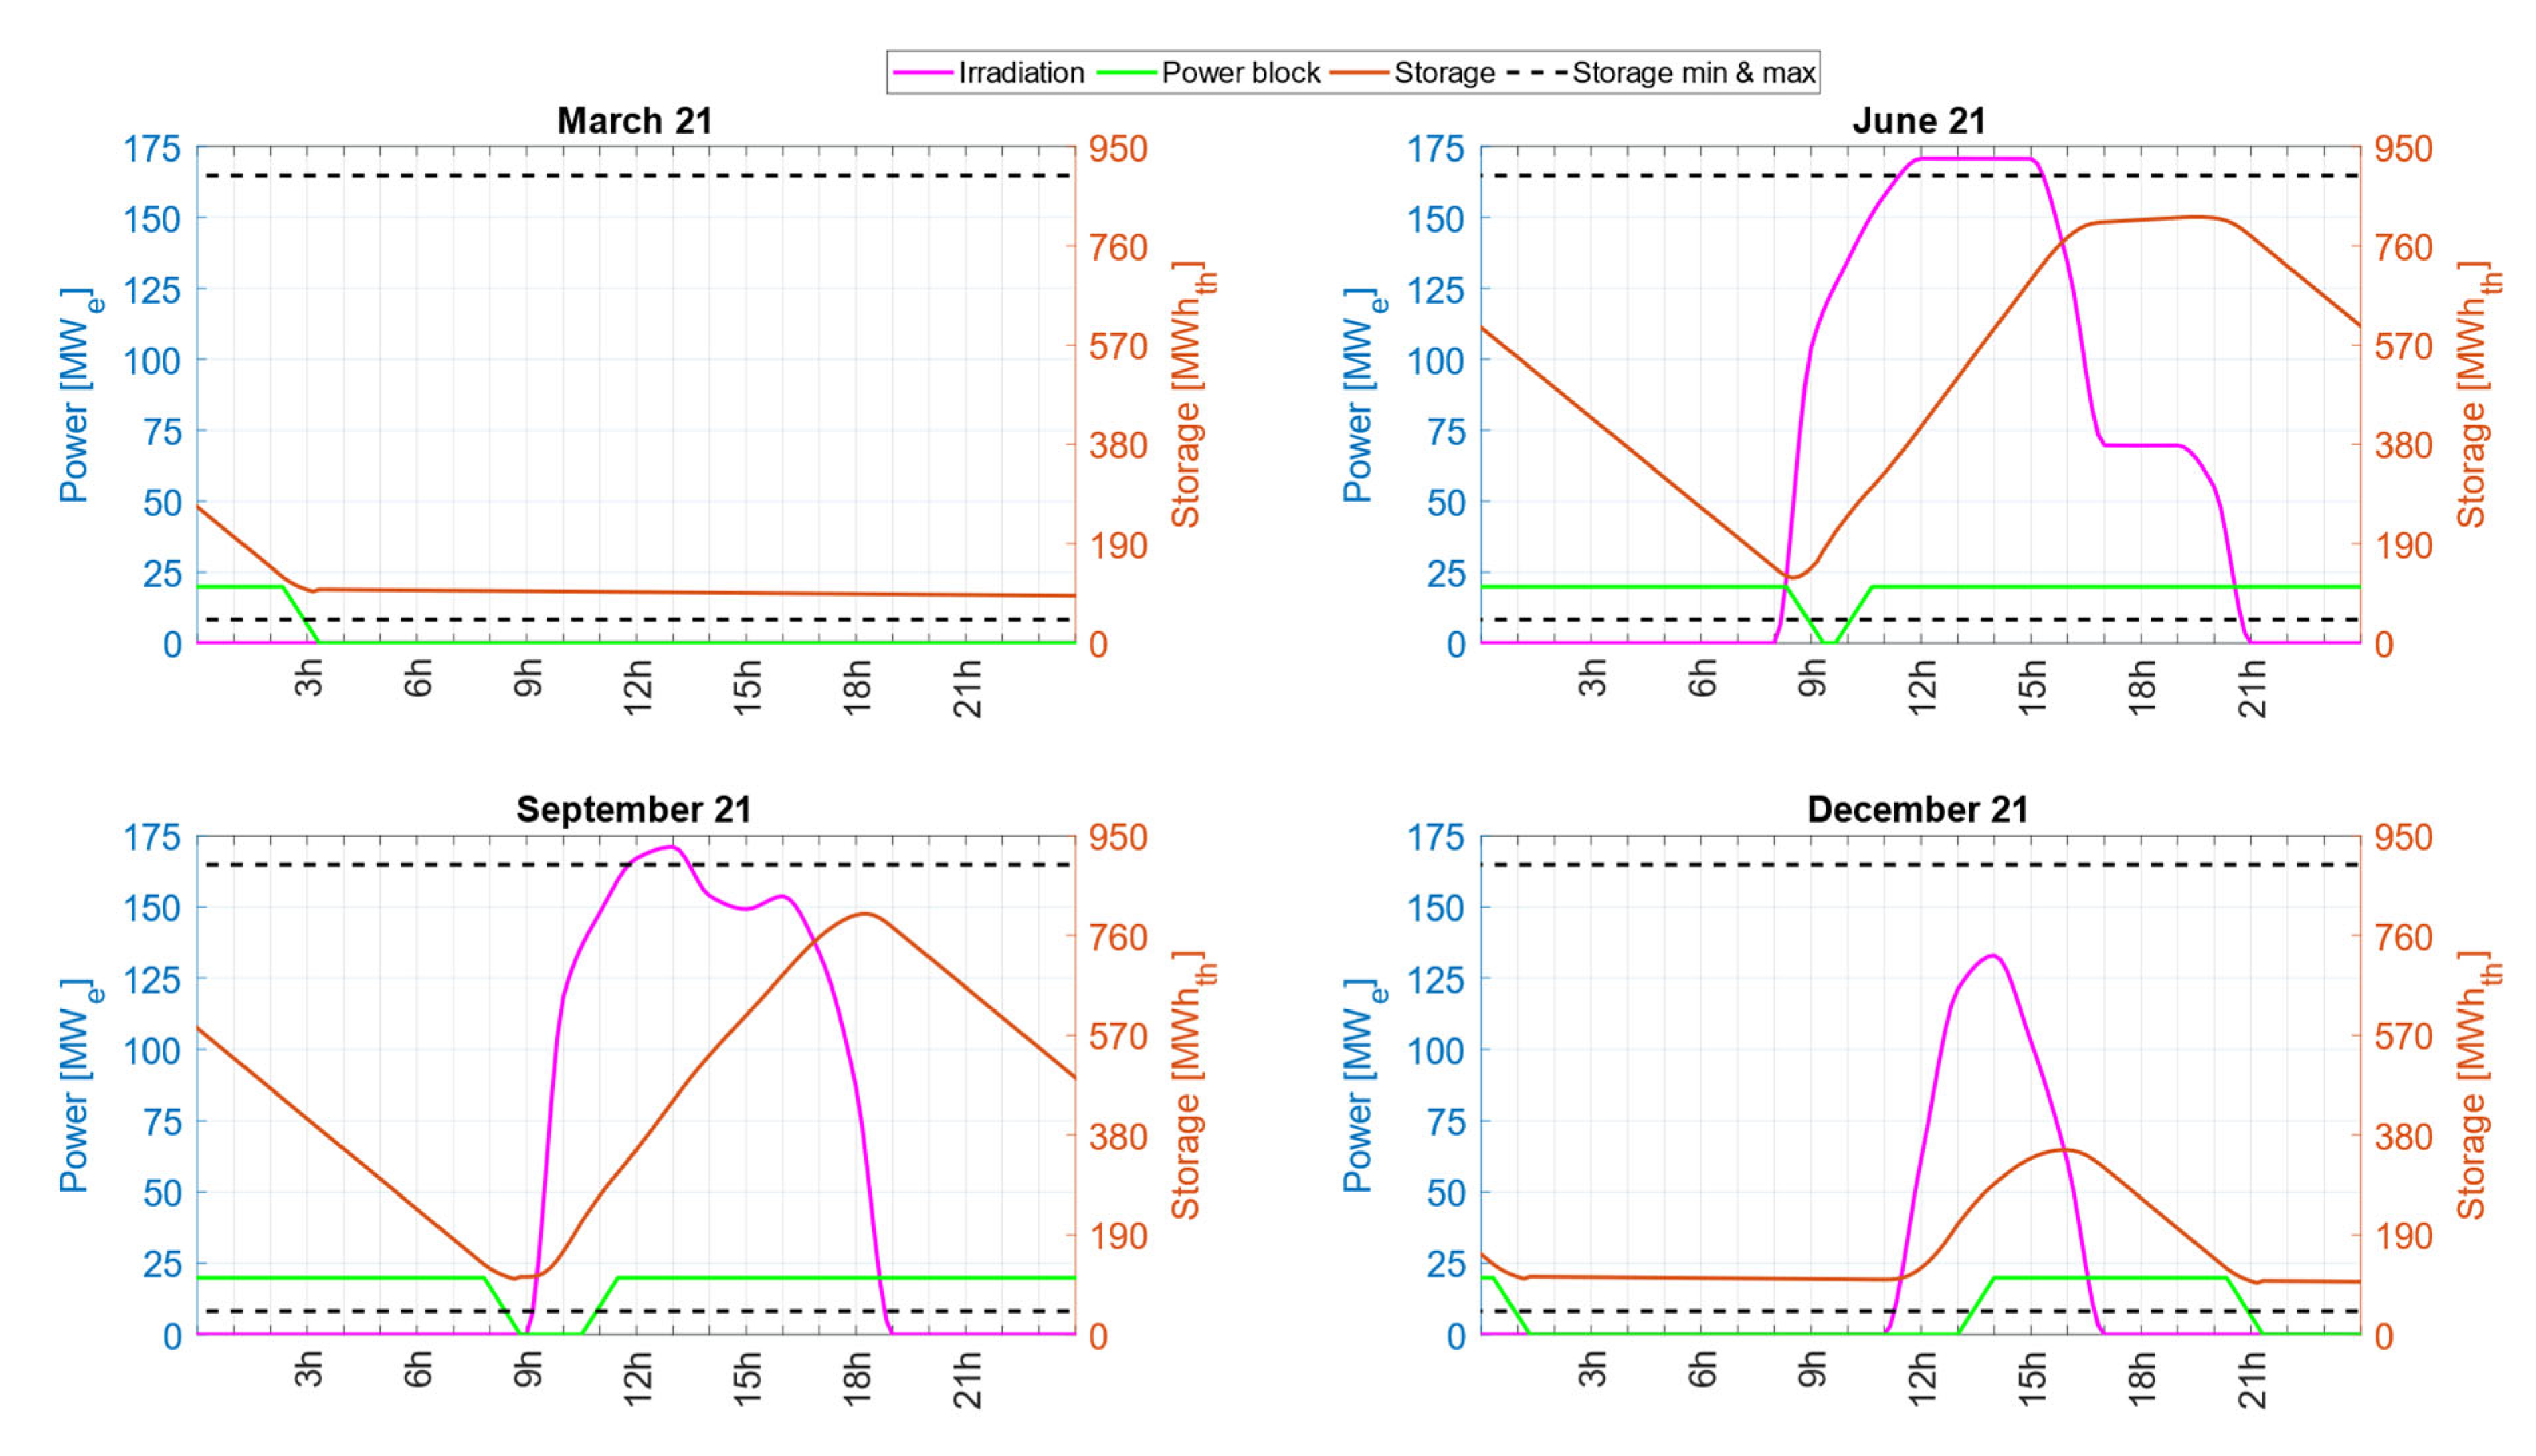
Figure 6 exemplifies the electricity production for Scenario I over a four-day period, using dates corresponding to the solstices and equinoxes in the Northern Hemisphere as reference points. In the figure, the left vertical axis displays both the irradiance power and the power block output, while the right vertical axis shows the variation in storage levels. The dashed horizontal lines indicate the previously described upper and lower storage capacity limits.
For a comprehensive comparison with other cases,
Figure 7 illustrates the variation in electricity generation using Scenario I as the baseline.
There are additional areas where plant efficiency could be improved. For instance, in both scenarios, the heliostat field size was kept constant. However, by reducing the field size in Scenario III—given that the plant is more efficient and produces more electricity—field efficiency could be increased by up to an additional 2% [
13].
Considering the overall plant performance in terms of sun-to-electricity efficiency (η) and capacity factor (CF), Scenario I achieves values of 15.5% and 56.9%, respectively—figures that align well with those reported in the literature for similar CSP systems [
7]. Scenario III, in contrast, exhibits improvements of 1 and 4 percentage points in efficiency and CF, respectively, attributable to a more effective utilization of the available energy. A summary of these performance indicators is provided in
Table 11, which also includes a comparative analysis of Scenarios II and IV.
The energy density of thermal storage was calculated using the maximum storage capacity for each scenario and the material properties provided in
Table 3 and
Table 5. The calculation follows Equation (9):
where E
sto represents the energy stored in each scenario;
CP, is the specific heat capacity of the material; and ΔT is the temperature difference occurring in each scenario.
Applying (9) yields results of 115 Wh/kg for Scenario I and 160 Wh/kg for Scenario III. These values are within the range reported in the literature for thermal batteries; however, they fall short of the maximum energy densities for this type of storage, which are set at 250 Wh/kg [
70].
To compare thermal efficiency between the two scenarios, the average annual state of charge (SOC) was determined using (10). This calculation provides an indirect measure of the time the salts spend in the cold tank, which keeps electric resistances active to prevent salt solidification throughout the year. This analysis assumes that the cold tank exhibits behavior perfectly inverse to that of the hot tank.
It is important to note that this is not a measure of actual energy efficiency, as other consumptions—such as electrical tracing in pipelines, pumps, or heliostat movement—are not considered. Nevertheless, it serves as an approximation to quantify the reduction or increase in parasitic electricity consumption in the plant.
The average annual state of charge is 28.8% in Scenario I and 35.8% in Scenario III. This indicates reduced use of electric resistances in the cold tank when particles are used, thereby lowering parasitic consumption.
5.1.2. Impact of Surplus Electricity: Scenarios II and IV
The inclusion of electrical surpluses in Scenarios II and IV increases electricity production. Moreover, this integration would prevent a significant amount of CO
2-equivalent emissions that would otherwise be generated by the non-renewable share of the Spanish electricity mix from being released into the atmosphere. Assuming an average emission factor of 0.21 tCO
2-eq/MWh
e for the period 2016–2021 [
71], it is estimated that between 687 and 3153 tonnes of CO
2-eq could be avoided through the effective use of surplus electricity. Even in years with minimal surpluses, such as 2018, the use of particles enhances electricity generation by up to 3 percentage points compared to scenarios without surpluses.
Figure 7 provides a detailed comparison with other cases, illustrating the variation in electricity production relative to Scenario I, as well as the quantity of electrical surpluses stored in each scenario.
In terms of overall conversion efficiency (sun-to-electricity) and CF, the highest values are observed in Scenario II for the year 2021, reaching 18.8% and 65.8%, respectively. Scenario IV, however, surpasses these figures in the same year, with gains of 1 and 4 percentage points in efficiency and CF, respectively, highlighting its enhanced energy recovery strategy.
Table 11 provides a consolidated overview of these metrics, along with a side-by-side comparison of Scenarios I and III.
Regarding energy density, no changes were observed as the values remain consistent with those reported at the end of previous section.
One of the key performance indicators for battery systems is round-trip efficiency [
72]. This metric is defined as the ratio between the energy produced using the battery and the electricity absorbed during charging. In this study, as a CSP plant is also included, the efficiency is adjusted using the following equations:
where E
II/IV refers to the total energy produced in Scenarios II/IV, which account for electrical surpluses, and E
I/III refers to the energy produced in Scenarios I/III, which exclude electrical surpluses.
Applying (12), an average round-trip efficiency of 25.56% is obtained for the period 2016–2021, while Scenario IV achieves a slightly higher efficiency of 27.27%.
These values fall below the range reported in the literature for this type of storage system, typically between 45 and 65% [
72]. However, in real-world projects, these values often decrease to 25–40% [
48]. The lower efficiency observed in this study is primarily due to the storage strategy being optimized for solar irradiation rather than for electrical surplus storage. In addition, the lack of temporal alignment between surplus availability and storage demand further limits the overall conversion efficiency. Future improvements could involve dynamic dispatch strategies that better match surplus profiles.
Lastly, regarding the plant’s energy efficiency, as discussed in the previous section, an increase is observed for all years in the study period, ranging from 1% to 9%. This improvement is more pronounced in scenarios using particles compared to molten salts, aligning with the observations made at the end of previous section.
5.2. Economic Analysis
5.2.1. Cost Evaluation for Scenarios I and III
To evaluate the economic feasibility of both CSP plants and compare them, the LCOE was calculated using the following equation:
where I
t represents the initial investment in year t; M
t corresponds to the operation and maintenance (O&M) expenses in year t; C
t are electricity consumption costs in year t (if applicable); E
t is the energy produced in year t; R is the discount rate, set at 5% [
11]; and N is the system’s lifespan, set at 25 years [
11].
To calculate the investment costs, reference values from [
13] were used, accounting for the fact that these values are based on 2015 prices.
Using (14), the different costs in
Table 12 were updated to reflect their 2023 values:
where C
2023 represents the updated cost for 2023, and C
i is the cost for any given year i. The cost indices were derived from the average Consumer Price Index (CPI) for Spain [
73].
Table 13 presents the total costs for the plant. Additional costs, such as installation or contingencies, were taken as a reference from [
13].
For Scenarios I and III, the annual fixed O&M costs are USD 4.8 M per year and USD 4.7 M per year, respectively [
13]. By applying (13), the LCOE for Scenario I is calculated as 211 USD/MWh, while for Scenario III, it is 192 USD/MWh, representing a 9% reduction for the scenario using DPS.
These values are slightly higher than those reported in the literature [
11], which can be attributed to the current hyperinflationary context. However, the technical improvements of the DPS system significantly reduce production costs, offsetting the higher technological expenses.
5.2.2. Cost Evaluation for Scenarios II and IV
As with the previous cases,
Table 14 presents the costs for the various components of the CSP plants, indicating the reference year for each value. In this table, P
EH refers to the selected power for the electric heater and P
COMP refers to the power of the centrifugal compressor. Both power values are expressed in MW
e.
For the components in Scenario IV, it is important to note that, due to the novelty of this type of solution, some costs had to be estimated approximately. For instance,
The cost of the electric heater was based on the price of a standard molten salt heater [
74].
The heat exchanger cost was selected as a future target value for this type of component [
75].
For other equipment, such as the compressor, the cost is straightforwardly calculable based on the existing literature [
76].
For transformers and the electric heater in both scenarios, the costs were sourced from [
2].
Using (14) to adjust prices to 2023, the final values for 2023 are represented in
Table 15.
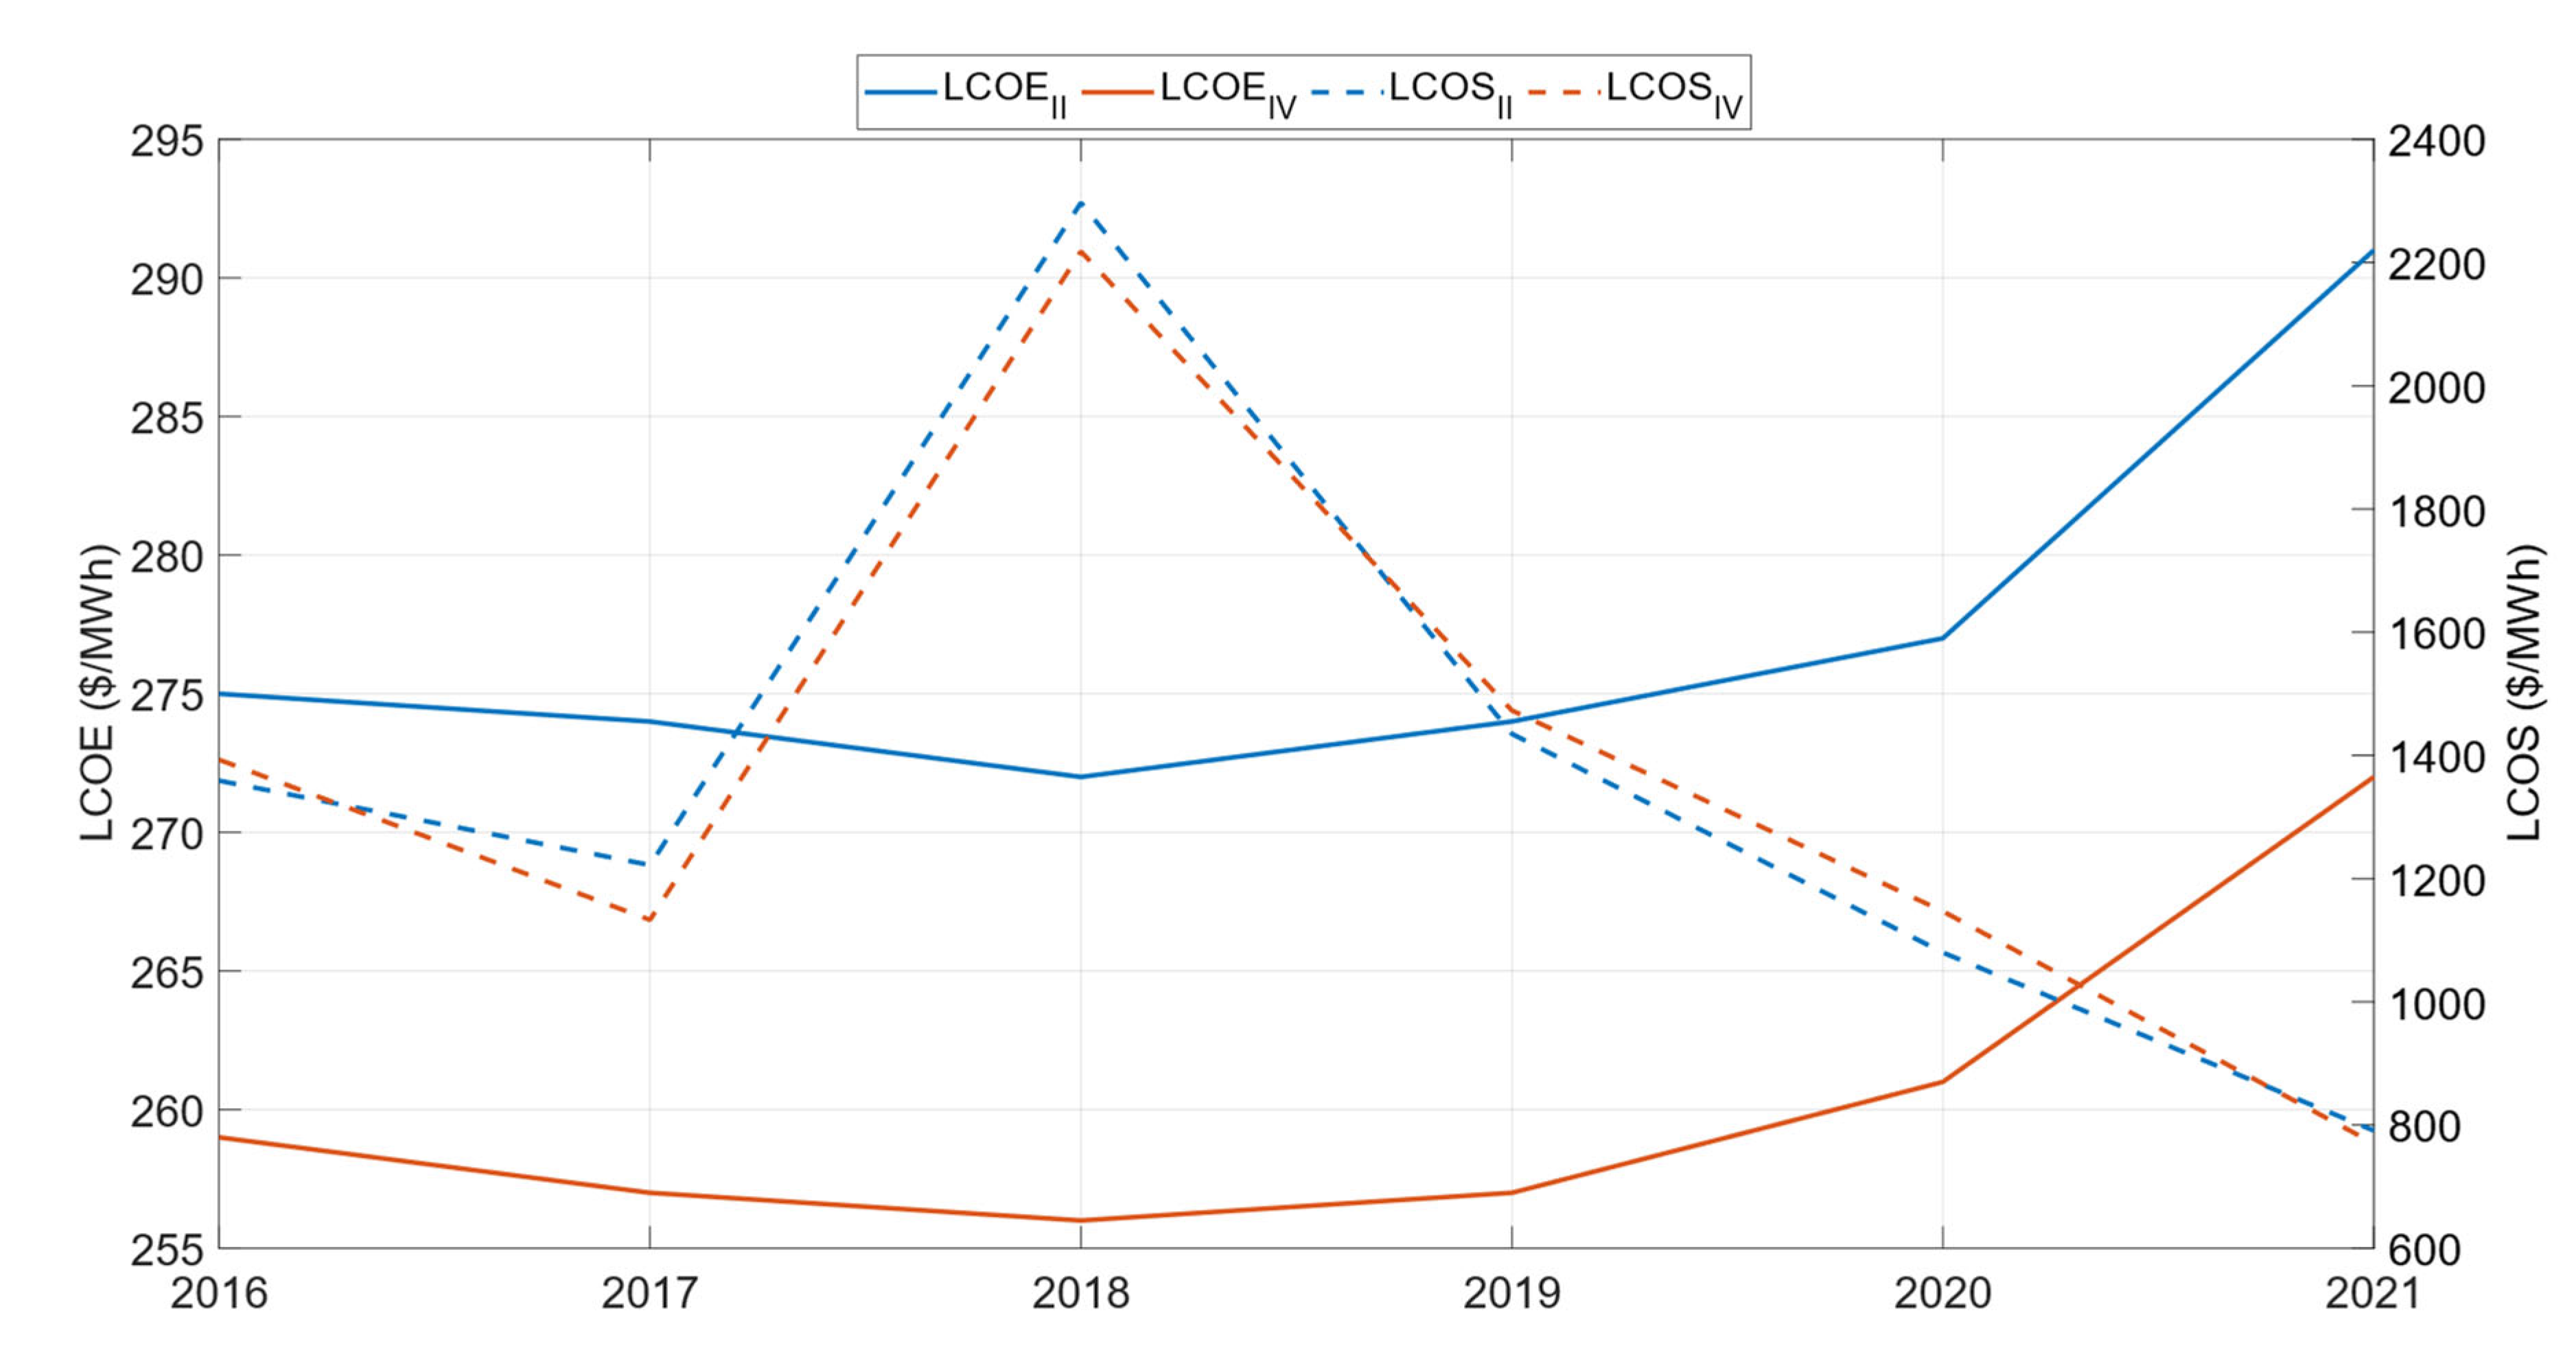
Figure 8 shows the LCOE values for different years during the 2016–2021 period. As observed, these values are higher than those reported for Scenarios I/III, despite the higher electricity production. Additionally, the more surplus electricity stored thermally from the grid, the higher the LCOE. These increases are attributed to the following:
The high cost of the electricity received, with no consideration given to scenarios where electricity might be subsidized (e.g., to balance the grid).
The high costs of the plant components, which result from the novelty of such systems.
The optimization of the plant for thermal energy production rather than cost minimization.
To compare the cost of energy storage installation, the levelized cost of storage (LCOS) was calculated using (15).
where M
t is operating and maintenance costs in year t, based on [
77]; C
t is electricity consumption costs in year t, calculated using the average electricity price for each year [
78]; R is the discount rate (5%); N is the system lifespan (25 years); and E
t is the energy produced solely with the Carnot battery, defined as the difference between energy produced with and without the Carnot battery, expressed in (11).
The LCOS results for 2016–2021 are higher than those reported in the literature [
79,
80]. This is primarily due to the oversizing of components such as the electric heater, which is not optimized for minimizing overall costs. Consequently, other elements dependent on the heater’s size, such as the compressor and heat exchanger, are also oversized.
It is worth noting that, in real-world conditions, curtailment electricity is often available at very low or even negative prices during periods of grid congestion. Therefore, the economic feasibility of the proposed configurations—particularly in terms of LCOS—could be significantly enhanced under such market conditions.
Complete LCOS results are displayed in
Figure 8.
6. Conclusions
Based on the comparative analysis conducted in this study, the following key conclusions can be drawn:
Superior Performance of Solid Particles: Solar tower power plants utilizing solid particles as the thermal energy storage (Scenario III) exhibit significantly enhanced technical performance compared to traditional molten salt systems (Scenario I). This includes a 7.4% increase in annual electricity generation, higher sun-to-electricity efficiency (16.7% vs. 15.5%), an improved CF (61.1% vs. 56.9%), and greater thermal storage energy density (160 Wh/kg vs. 115 Wh/kg).
Economic Advantage of Solid Particles: The improved technical performance translates into better economics, with the solid particle configuration showing a 9% lower LCOE (192 USD/MWh) compared to the molten salt baseline (211 USD/MWh), despite potentially higher costs for some next-generation components.
Potential of Carnot Battery Integration: Incorporating a Carnot battery system to store surplus grid electricity (curtailment) successfully increases the overall annual electricity output and boosts the plant’s CF and efficiency in both molten salt (Scenario II) and solid particle (Scenario IV) configurations. The improvements are more pronounced when coupled with the more efficient solid particle system.
Economic Challenges of Curtailment Storage: Despite increasing energy output, the integration of the analyzed Carnot battery system leads to a higher overall LCOE and a high LCOS. This is primarily attributed to the current costs of the additional equipment (electric heater, heat exchangers, compressor) and the cost of the curtailed electricity absorbed, combined with a system operation strategy optimized for solar energy rather than curtailment storage (resulting in round-trip efficiencies of ~25–27%).
Reduced Parasitic Consumption Potential: Solid particle systems show potential for lower parasitic energy consumption associated with storage maintenance compared to molten salts, indicated by a higher average annual SOC in the thermal storage.
Need for Further Optimization: To realize the full potential of integrating curtailment storage in CSP plants via Carnot batteries, further research and development are necessary. This should focus on reducing the capital costs of the required components and developing advanced control and operational strategies that co-optimize the use of direct solar energy and stored grid curtailment to improve round-trip efficiency and overall economic viability. Looking ahead, the role of solid particle systems is expected to strengthen as technological maturation and economies of scale reduce capital costs, enhancing their competitiveness. Similarly, Carnot batteries could play a strategic role in future electricity systems with high renewable penetration, where increasing curtailment levels demand flexible, long-duration storage solutions.
Author Contributions
Conceptualization, methodology, software, S.G.-B.; validation, S.G.-B. and M.Á.R.-B.; formal analysis, investigation, data curation, writing—original draft preparation, S.G.-B.; writing—review and editing, S.G.-B. and M.Á.R.-B.; visualization, S.G.-B.; supervision, M.Á.R.-B. All authors have read and agreed to the published version of the manuscript.
Funding
This research received no external funding.
Institutional Review Board Statement
Not applicable.
Informed Consent Statement
Not applicable.
Data Availability Statement
The original contributions presented in the study are included in the article, further inquiries can be directed to the corresponding author.
Conflicts of Interest
The authors declare no conflicts of interest.
Abbreviations
The following abbreviations are used in this manuscript:
| CF | Capacity factor |
| COMP | Compressor |
| CPI | Consumer price index |
| CSP | Concentrated solar power |
| DPS | Dense particle suspension |
| EH | Electric heater |
| HTM | Heat transfer medium |
| LCOE | Levelized cost of energy |
| LCOS | Levelized cost of storage |
| O&M | Operation and Maintenance |
| PB | Power block |
| PNIEC | National Integrated Energy and Climate Plan |
| PV | Photovoltaic |
| REE | Transmission System Operator—Spain |
| RTD | Distribution network constraint |
| RTT | Transport network constraint |
| SAM | System Advisor Model |
| SG | Steam generator |
| SO | System Operator |
| SOC | State of charge |
| TES | Thermal energy storage |
| TMY | Typical meteorological year |
References
- Al-Ghussain, L. Global Warming: Review on Driving Forces and Mitigation. Environ. Prog. Sustain. Energy 2019, 38, 13–21. [Google Scholar] [CrossRef]
- Pardillos-Pobo, D.; González-Gómez, P.A.; Laporte-Azcué, M.; Santana, D. Thermo-Economic Design of an Electric Heater to Store Renewable Curtailment in Solar Power Tower Plants. Energy Convers. Manag. 2023, 297, 117710. [Google Scholar] [CrossRef]
- MITECO Plan Nacional Integrado de Energía y Clima (PNIEC) 2021–2030. Available online: https://www.miteco.gob.es/es/prensa/pniec.html (accessed on 25 May 2025).
- Red Eléctrica REData—Potencia Instalada. Available online: https://www.ree.es/es/datos/generacion/potencia-instalada (accessed on 25 May 2025).
- Kost, C.; Mayer, J.N.; Thomsen, J.; Hartmann, N.; Senkpiel, C.; Philipps, S.; Nold, S.; Lude, S.; Saad, N.; Schlegl, T. Levelized Cost of Electricity—Renewable Energy Technologies; Fraunhofer ISE: Freiburg im Breisgau, Germany, 2013. [Google Scholar] [CrossRef]
- Palacios, A.; Barreneche, C.; Navarro, M.E.; Ding, Y. Thermal Energy Storage Technologies for Concentrated Solar Power—A Review from a Materials Perspective. Renew. Energy 2020, 156, 1244–1265. [Google Scholar] [CrossRef]
- IRENA Concentrated Solar Power: Technology Brief. Available online: https://www.irena.org/publications/2013/Jan/Concentrated-Solar-Power (accessed on 25 May 2025).
- Carrión, J.A.; Espín Estrella, A.; Aznar Dols, F.; Ridao, A.R. The Electricity Production Capacity of Photovoltaic Power Plants and the Selection of Solar Energy Sites in Andalusia (Spain). Renew. Energy 2008, 33, 545–552. [Google Scholar] [CrossRef]
- Frolova, M.; Prados, M.-J.; Nadaï, A. (Eds.) Renewable Energies and European Landscapes: Lessons from Southern European Cases; SpringerLink Bücher; Springer: Dordrecht, The Netherlands, 2015; ISBN 978-94-017-9842-6. [Google Scholar]
- Guaita-Pradas, I.; Marques-Perez, I.; Gallego, A.; Segura, B. Analyzing Territory for the Sustainable Development of Solar Photovoltaic Power Using GIS Databases. Environ. Monit. Assess. 2019, 191, 764. [Google Scholar] [CrossRef]
- IRENA Renewable Power Generation Costs in 2022. Available online: https://www.irena.org/Publications/2023/Aug/Renewable-Power-Generation-Costs-in-2022 (accessed on 25 May 2025).
- Ho, C.K.; Iverson, B.D. Review of High-Temperature Central Receiver Designs for Concentrating Solar Power. Renew. Sustain. Energy Rev. 2014, 29, 835–846. [Google Scholar] [CrossRef]
- Spelling, J.; Gallo, A.; Romero, M.; González-Aguilar, J. A High-Efficiency Solar Thermal Power Plant Using a Dense Particle Suspension as the Heat Transfer Fluid. Energy Procedia 2015, 69, 1160–1170. [Google Scholar] [CrossRef]
- Schermeyer, H.; Vergara, C.; Fichtner, W. Renewable Energy Curtailment: A Case Study on Today’s and Tomorrow’s Congestion Management. Energy Policy 2018, 112, 427–436. [Google Scholar] [CrossRef]
- Frew, B.; Sergi, B.; Denholm, P.; Cole, W.; Gates, N.; Levie, D.; Margolis, R. The Curtailment Paradox in the Transition to High Solar Power Systems. Joule 2021, 5, 1143–1167. [Google Scholar] [CrossRef]
- Victoria, M.; Gallego-Castillo, C. Hourly-Resolution Analysis of Electricity Decarbonization in Spain (2017–2030). Appl. Energy 2019, 233–234, 674–690. [Google Scholar] [CrossRef]
- Guerra, K.; Haro, P.; Gutiérrez, R.E.; Gómez-Barea, A. Facing the High Share of Variable Renewable Energy in the Power System: Flexibility and Stability Requirements. Appl. Energy 2022, 310, 118561. [Google Scholar] [CrossRef]
- Padmanabhan, N.; Ahmed, M.; Bhattacharya, K. Battery Energy Storage Systems in Energy and Reserve Markets. IEEE Trans. Power Syst. 2020, 35, 215–226. [Google Scholar] [CrossRef]
- Yang, Y.; Bremner, S.; Menictas, C.; Kay, M. Modelling and Optimal Energy Management for Battery Energy Storage Systems in Renewable Energy Systems: A Review. Renew. Sustain. Energy Rev. 2022, 167, 112671. [Google Scholar] [CrossRef]
- Jiang, K.; Du, X.; Kong, Y.; Xu, C.; Ju, X. A Comprehensive Review on Solid Particle Receivers of Concentrated Solar Power. Renew. Sustain. Energy Rev. 2019, 116, 109463. [Google Scholar] [CrossRef]
- Flamant, G.; Grange, B.; Wheeldon, J.; Siros, F.; Valentin, B.; Bataille, F.; Zhang, H.; Deng, Y.; Baeyens, J. Opportunities and Challenges in Using Particle Circulation Loops for Concentrated Solar Power Applications. Prog. Energy Combust. Sci. 2023, 94, 101056. [Google Scholar] [CrossRef]
- Martínez, S.M.; Lázaro, E.G.; Escribano, A.H.; Carretón, M.C.; Molina-Garcia, A. Wind Power Curtailment Analysis under Generation Flexibility Requirements: The Spanish Case Study. In Proceedings of the 2015 IEEE Power & Energy Society General Meeting, Denver, CO, USA, 26–30 July 2015; pp. 1–5. [Google Scholar]
- Yasuda, Y.; Bird, L.; Carlini, E.M.; Eriksen, P.B.; Estanqueiro, A.; Flynn, D.; Fraile, D.; Gómez Lázaro, E.; Martín-Martínez, S.; Hayashi, D.; et al. C-E (Curtailment—Energy Share) Map: An Objective and Quantitative Measure to Evaluate Wind and Solar Curtailment. Renew. Sustain. Energy Rev. 2022, 160, 112212. [Google Scholar] [CrossRef]
- Red Eléctrica de España Descargas|ESIOS. Available online: https://www.esios.ree.es/es/descargas (accessed on 2 May 2025).
- Boletín Oficial del Estado. Resolución de 17 de Marzo de 2022, de La Comisión Nacional de Los Mercados y La Competencia, Por La Que Se Aprueban Los Procedimientos de Operación Adaptados a La Programación Cuarto-Horaria de La Operación Del Sistema Eléctrico Peninsular Español; Boletín Oficial del Estado: Madrid, Spain, 2022; pp. 41169–41351. [Google Scholar]
- NREL Gemasolar Thermosolar Plant/Solar TRES|Concentrating Solar Power Projects|NREL. Available online: https://solarpaces.nrel.gov/project/gemasolar-thermosolar-plant-solar-tres (accessed on 25 May 2025).
- Burgaleta, J.I.; Arias, S.; Ramirez, D. Gemasolar, the first tower thermosolar commercial plant with molten salt storage. In Proceedings of the SolarPACES, Granada, Spain, 20–23 September 2011; pp. 20–23. [Google Scholar]
- Amadei, C.A.; Allesina, G.; Tartarini, P.; Yuting, W. Simulation of GEMASOLAR-Based Solar Tower Plants for the Chinese Energy Market: Influence of Plant Downsizing and Location Change. Renew. Energy 2013, 55, 366–373. [Google Scholar] [CrossRef]
- Mostafavi Tehrani, S.S.; Taylor, R.A.; Nithyanandam, K.; Shafiei Ghazani, A. Annual Comparative Performance and Cost Analysis of High Temperature, Sensible Thermal Energy Storage Systems Integrated with a Concentrated Solar Power Plant. Sol. Energy 2017, 153, 153–172. [Google Scholar] [CrossRef]
- Boukelia, T.E.; Arslan, O.; Bouraoui, A. Thermodynamic Performance Assessment of a New Solar Tower-Geothermal Combined Power Plant Compared to the Conventional Solar Tower Power Plant. Energy 2021, 232, 121109. [Google Scholar] [CrossRef]
- González-Roubaud, E.; Pérez-Osorio, D.; Prieto, C. Review of Commercial Thermal Energy Storage in Concentrated Solar Power Plants: Steam vs. Molten Salts. Renew. Sustain. Energy Rev. 2017, 80, 133–148. [Google Scholar] [CrossRef]
- Liu, M.; Steven Tay, N.H.; Bell, S.; Belusko, M.; Jacob, R.; Will, G.; Saman, W.; Bruno, F. Review on Concentrating Solar Power Plants and New Developments in High Temperature Thermal Energy Storage Technologies. Renew. Sustain. Energy Rev. 2016, 53, 1411–1432. [Google Scholar] [CrossRef]
- Serrano-López, R.; Fradera, J.; Cuesta-López, S. Molten Salts Database for Energy Applications. Chem. Eng. Process. Process Intensif. 2013, 73, 87–102. [Google Scholar] [CrossRef]
- Lantelme, F.; Groult, H. (Eds.) Molten Salts Chemistry: From Lab to Applications, 1st ed.; Elsevier: Amsterdam, The Netherlands, 2013; ISBN 978-0-12-398538-5. [Google Scholar]
- NREL CSP Validation 2013. Available online: https://sam.nrel.gov/concentrating-solar-power/csp-validation.html (accessed on 26 May 2025).
- Bradshaw, R.W.; Dawson, D.B.; De La Rosa, W.; Gilbert, R.; Goods, S.H.; Hale, M.J.; Jacobs, P.; Jones, S.A.; Kolb, G.J.; Pacheco, J.E.; et al. Final Test and Evaluation Results from the Solar Two Project; Sandia National Lab. (SNL-NM): Albuquerque, NM, USA; Sandia National Lab. (SNL-CA): Livermore, CA, USA, 2002. [Google Scholar]
- He, C.; Lu, J.; Ding, J.; Wang, W.; Yuan, Y. Heat Transfer and Thermal Performance of Two-Stage Molten Salt Steam Generation System. Appl. Energy 2017, 204, 1231–1239. [Google Scholar] [CrossRef]
- Zou, Y.; Ding, J.; Wang, W.; Lee, D.; Lu, J. Heat Transfer Performance of U-Tube Molten Salt Steam Generator. Int. J. Heat Mass Transf. 2020, 160, 120200. [Google Scholar] [CrossRef]
- Reilly, H.E.; Kolb, G.J. An Evaluation of Molten-Salt Power Towers Including Results of the Solar Two Project; Sandia National Lab. (SNL-NM): Albuquerque, NM, USA; Sandia National Lab. (SNL-CA): Livermore, CA, USA, 2001. [Google Scholar]
- Herrmann, U.; Kelly, B.; Price, H. Two-Tank Molten Salt Storage for Parabolic Trough Solar Power Plants. Energy 2004, 29, 883–893. [Google Scholar] [CrossRef]
- Jiang, K.; Du, X.; Zhang, Q.; Kong, Y.; Xu, C.; Ju, X. Review on Gas-Solid Fluidized Bed Particle Solar Receivers Applied in Concentrated Solar Applications: Materials, Configurations and Methodologies. Renew. Sustain. Energy Rev. 2021, 150, 111479. [Google Scholar] [CrossRef]
- Le Gal, A.; Grange, B.; Casanova, M.; Perez, A.; Baltus, W.; Tessonneaud, M.; Flamant, G. Experimental Results for a MW-Scale Fluidized Particle-in-Tube Solar Receiver in Its First Test Campaign. Sol. Energy 2023, 262, 111907. [Google Scholar] [CrossRef]
- Reyes-Belmonte, M.A.; Sebastián, A.; Spelling, J.; Romero, M.; González-Aguilar, J. Annual Performance of Subcritical Rankine Cycle Coupled to an Innovative Particle Receiver Solar Power Plant. Renew. Energy 2019, 130, 786–795. [Google Scholar] [CrossRef]
- Reyes-Belmonte, M.A.; Gómez-García, F.; González-Aguilar, J.; Romero, M.; Benoit, H.; Flamant, G. Heat Exchanger Modelling in Central Receiver Solar Power Plant Using Dense Particle Suspension. AIP Conf. Proc. 2017, 1850, 030042. [Google Scholar] [CrossRef]
- Ma, Z.; Davenport, P.; Zhang, R. Design Analysis of a Particle-Based Thermal Energy Storage System for Concentrating Solar Power or Grid Energy Storage. J. Energy Storage 2020, 29, 101382. [Google Scholar] [CrossRef]
- Sment, J.N.; Harvey, T.; Albrecht, K.J.; Ho, C.K.; Davidson, M.; Lambert, M.; Bateman, B. Design Considerations for Commercial Scale Particle-Based Thermal Energy Storage Systems. AIP Conf. Proc. 2022, 2445, 160016. [Google Scholar] [CrossRef]
- Steinmann, W.-D. Thermo-Mechanical Concepts for Bulk Energy Storage. Renew. Sustain. Energy Rev. 2017, 75, 205–219. [Google Scholar] [CrossRef]
- Novotny, V.; Basta, V.; Smola, P.; Spale, J. Review of Carnot Battery Technology Commercial Development. Energies 2022, 15, 647. [Google Scholar] [CrossRef]
- Redelinghuys, L.G.; McGregor, C. Carnot Battery Application in a Parabolic Trough Concentrating Solar Power Plant: System Modelling, Validation and Analyses on the Interplay between Stored Energies. J. Energy Storage 2023, 60, 106545. [Google Scholar] [CrossRef]
- Dumont, O.; Frate, G.F.; Pillai, A.; Lecompte, S.; De paepe, M.; Lemort, V. Carnot Battery Technology: A State-of-the-Art Review. J. Energy Storage 2020, 32, 101756. [Google Scholar] [CrossRef]
- Hassan, A.H.; Corberán, J.M.; Ramirez, M.; Trebilcock-Kelly, F.; Payá, J. A High-Temperature Heat Pump for Compressed Heat Energy Storage Applications: Design, Modeling, and Performance. Energy Rep. 2022, 8, 10833–10848. [Google Scholar] [CrossRef]
- Richter, P.; Trimborn, T.; Aldenhoff, L. Predictive Storage Strategy for Optimal Design of Hybrid CSP-PV Plants with Immersion Heater. Sol. Energy 2021, 218, 237–250. [Google Scholar] [CrossRef]
- Iñigo-Labairu, J.; Dersch, J.; Schomaker, L. Integration of CSP and PV Power Plants: Investigations about Synergies by Close Coupling. Energies 2022, 15, 7103. [Google Scholar] [CrossRef]
- Pilotti, L.; Colombari, M.; Castelli, A.F.; Binotti, M.; Giaconia, A.; Martelli, E. Simultaneous Design and Operational Optimization of Hybrid CSP-PV Plants. Appl. Energy 2023, 331, 120369. [Google Scholar] [CrossRef]
- Forsberg, C.W.; McDaniel, P.J.; Zohuri, B. Nuclear Air-Brayton Power Cycles with Thermodynamic Topping Cycles, Assured Peaking Capacity, and Heat Storage for Variable Electricity and Heat. Nucl. Technol. 2021, 207, 543–557. [Google Scholar] [CrossRef]
- Schwaiger, K.; Haider, M.; Hämmerle, M.; Wünsch, D.; Obermaier, M.; Beck, M.; Niederer, A.; Bachinger, S.; Radler, D.; Mahr, C.; et al. sandTES—An Active Thermal Energy Storage System Based on the Fluidization of Powders. Energy Procedia 2014, 49, 983–992. [Google Scholar] [CrossRef]
- Rovense, F.; Reyes-Belmonte, M.A.; González-Aguilar, J.; Amelio, M.; Bova, S.; Romero, M. Flexible Electricity Dispatch for CSP Plant Using Un-Fired Closed Air Brayton Cycle with Particles Based Thermal Energy Storage System. Energy 2019, 173, 971–984. [Google Scholar] [CrossRef]
- Lemmon, E.W.; Jacobsen, R.T.; Penoncello, S.G.; Friend, D.G. Thermodynamic Properties of Air and Mixtures of Nitrogen, Argon, and Oxygen From 60 to 2000 K at Pressures to 2000 MPa. J. Phys. Chem. Ref. Data 2000, 29, 331–385. [Google Scholar] [CrossRef]
- Maruyama, S.; Aihara, T.; Tanaka, Y.; Kasahara, K. Heat Transfer and Pressure Loss of a Very Shallow Fluidized-Bed Heat Exchanger Part 2. Experiment with Multirow Tube Banks. Exp. Therm. Fluid Sci. 1988, 1, 325–333. [Google Scholar] [CrossRef]
- Towler, G.P.; Sinnott, R.K. Chemical Engineering Design: Principles, Practice and Economics of Plant and Process Design, 3rd ed.; Butterworth-Heinemann: Oxford, UK; Cambridge, MA, USA, 2022; ISBN 978-0-12-821179-3. [Google Scholar]
- Perry, J.H.; Green, D.W.; Southard, M.Z. (Eds.) Perry’s Chemical Engineers’ Handbook, 9th ed.; McGraw-Hill Education: New York, NY, USA, 2019; ISBN 978-0-07-183408-7. [Google Scholar]
- NREL System Advisor Model (SAM) Case Study: Gemasolar 2013. Available online: https://sam.nrel.gov/images/web_page_files/sam_case_csp_salt_tower_gemasolar_2013-1-15.pdf (accessed on 26 May 2025).
- Mostafavi Tehrani, S.S.; Taylor, R.A. Off-Design Simulation and Performance of Molten Salt Cavity Receivers in Solar Tower Plants under Realistic Operational Modes and Control Strategies. Appl. Energy 2016, 179, 698–715. [Google Scholar] [CrossRef]
- Lovegrove, K.; Stein, W. Concentrating Solar Power Technology: Principles, Developments and Applications; Woodhead: Oxford, UK, 2020; ISBN 978-0-12-819970-1. [Google Scholar]
- Prieto, C.; Miró, L.; Peiró, G.; Oró, E.; Gil, A.; Cabeza, L.F. Temperature Distribution and Heat Losses in Molten Salts Tanks for CSP Plants. Sol. Energy 2016, 135, 518–526. [Google Scholar] [CrossRef]
- Alonso-Montesinos, J.; Polo, J.; Ballestrín, J.; Batlles, F.J.; Portillo, C. Impact of DNI Forecasting on CSP Tower Plant Power Production. Renew. Energy 2019, 138, 368–377. [Google Scholar] [CrossRef]
- Crescent Dunes Solar Energy Project|Concentrating Solar Power Projects|NREL. Available online: https://solarpaces.nrel.gov/project/crescent-dunes-solar-energy-project (accessed on 2 May 2025).
- Atacama I/Cerro Dominador 110MW CSP + 100MW PV|Concentrating Solar Power Projects|NREL. Available online: https://solarpaces.nrel.gov/project/atacama-i-cerro-dominador-110mw-csp-100mw-pv (accessed on 2 May 2025).
- Avila-Marin, A.; Fernández-Reche, J.; Monterreal, R.; Ballestrin, J.; Gallego, J.F.; Casanova, M.; Escorza, S.; Mutuberria, A.; Kämpgen, A.; Macke, A.; et al. Testing and Validation of Innovative On-Site Solar Field Measurement Techniques to Increase Power Tower Plant Performance: The LEIA Project. In Proceedings of the SolarPACES 2023, 29th International Conference on Concentrating Solar Power, Thermal, and Chemical Energy Systems, Sydney, Australia, 8–13 October 2013; Volume 2. [Google Scholar] [CrossRef]
- Hameer, S.; van Niekerk, J.L. A Review of Large-Scale Electrical Energy Storage. Int. J. Energy Res. 2015, 39, 1179–1195. [Google Scholar] [CrossRef]
- Redeia Non Renewable Detail CO2 Emissions. Available online: https://www.ree.es/en/datos/generation/non-renewable-detail-CO2-emissions?end_date=2021-12-31T23:59&start_date=2016-01-01T00:00&systemElectric=nacional&time_trunc=year_2 (accessed on 25 May 2025).
- Vecchi, A.; Knobloch, K.; Liang, T.; Kildahl, H.; Sciacovelli, A.; Engelbrecht, K.; Li, Y.; Ding, Y. Carnot Battery Development: A Review on System Performance, Applications and Commercial State-of-the-Art. J. Energy Storage 2022, 55, 105782. [Google Scholar] [CrossRef]
- Eurostat HICP—Annual Data (Average Index and Rate of Change). Available online: https://ec.europa.eu/eurostat/databrowser/product/page/PRC_HICP_AIND (accessed on 25 May 2025).
- Trevisan, S.; Buchbjerg, B.; Guedez, R. Power-to-Heat for the Industrial Sector: Techno-Economic Assessment of a Molten Salt-Based Solution. Energy Convers. Manag. 2022, 272, 116362. [Google Scholar] [CrossRef]
- Arthur-Arhin, W.J.; Fosheim, J.R.; Brewster, K.J.; Madden, D.A.; Albrecht, K.J.; Jackson, G.S. Demonstration of a Multi-Channel Fluidized Bed Particle–Supercritical Carbon Dioxide Heat Exchanger for Concentrating Solar Applications. Appl. Therm. Eng. 2024, 248, 123242. [Google Scholar] [CrossRef]
- Stenberg, V.; Spallina, V.; Mattisson, T.; Rydén, M. Techno-Economic Analysis of H2 Production Processes Using Fluidized Bed Heat Exchangers with Steam Reforming—Part 1: Oxygen Carrier Aided Combustion. Int. J. Hydrogen Energy 2020, 45, 6059–6081. [Google Scholar] [CrossRef]
- Georgiou, S.; Shah, N.; Markides, C.N. A Thermo-Economic Analysis and Comparison of Pumped-Thermal and Liquid-Air Electricity Storage Systems. Appl. Energy 2018, 226, 1119–1133. [Google Scholar] [CrossRef]
- Eurostat Electricity Prices for Non-Household Consumers—Bi-Annual Data (from 2007 Onwards). Available online: https://ec.europa.eu/eurostat/databrowser/product/page/NRG_PC_205 (accessed on 25 May 2025).
- Zhang, Y.; Xu, L.; Li, J.; Zhang, L.; Yuan, Z. Technical and Economic Evaluation, Comparison and Optimization of a Carnot Battery with Two Different Layouts. J. Energy Storage 2022, 55, 105583. [Google Scholar] [CrossRef]
- Niu, J.; Wang, J.; Liu, X.; Dong, L. Optimal Integration of Solar Collectors to Carnot Battery System with Regenerators. Energy Convers. Manag. 2023, 277, 116625. [Google Scholar] [CrossRef]
| Disclaimer/Publisher’s Note: The statements, opinions and data contained in all publications are solely those of the individual author(s) and contributor(s) and not of MDPI and/or the editor(s). MDPI and/or the editor(s) disclaim responsibility for any injury to people or property resulting from any ideas, methods, instructions or products referred to in the content. |
© 2025 by the authors. Licensee MDPI, Basel, Switzerland. This article is an open access article distributed under the terms and conditions of the Creative Commons Attribution (CC BY) license (https://creativecommons.org/licenses/by/4.0/).


