
The Role of Digital Transformation in Manufacturing: Discrete Event Simulation to Reshape Industrial Landscapes


 ,
,  ,
, 
Abstract
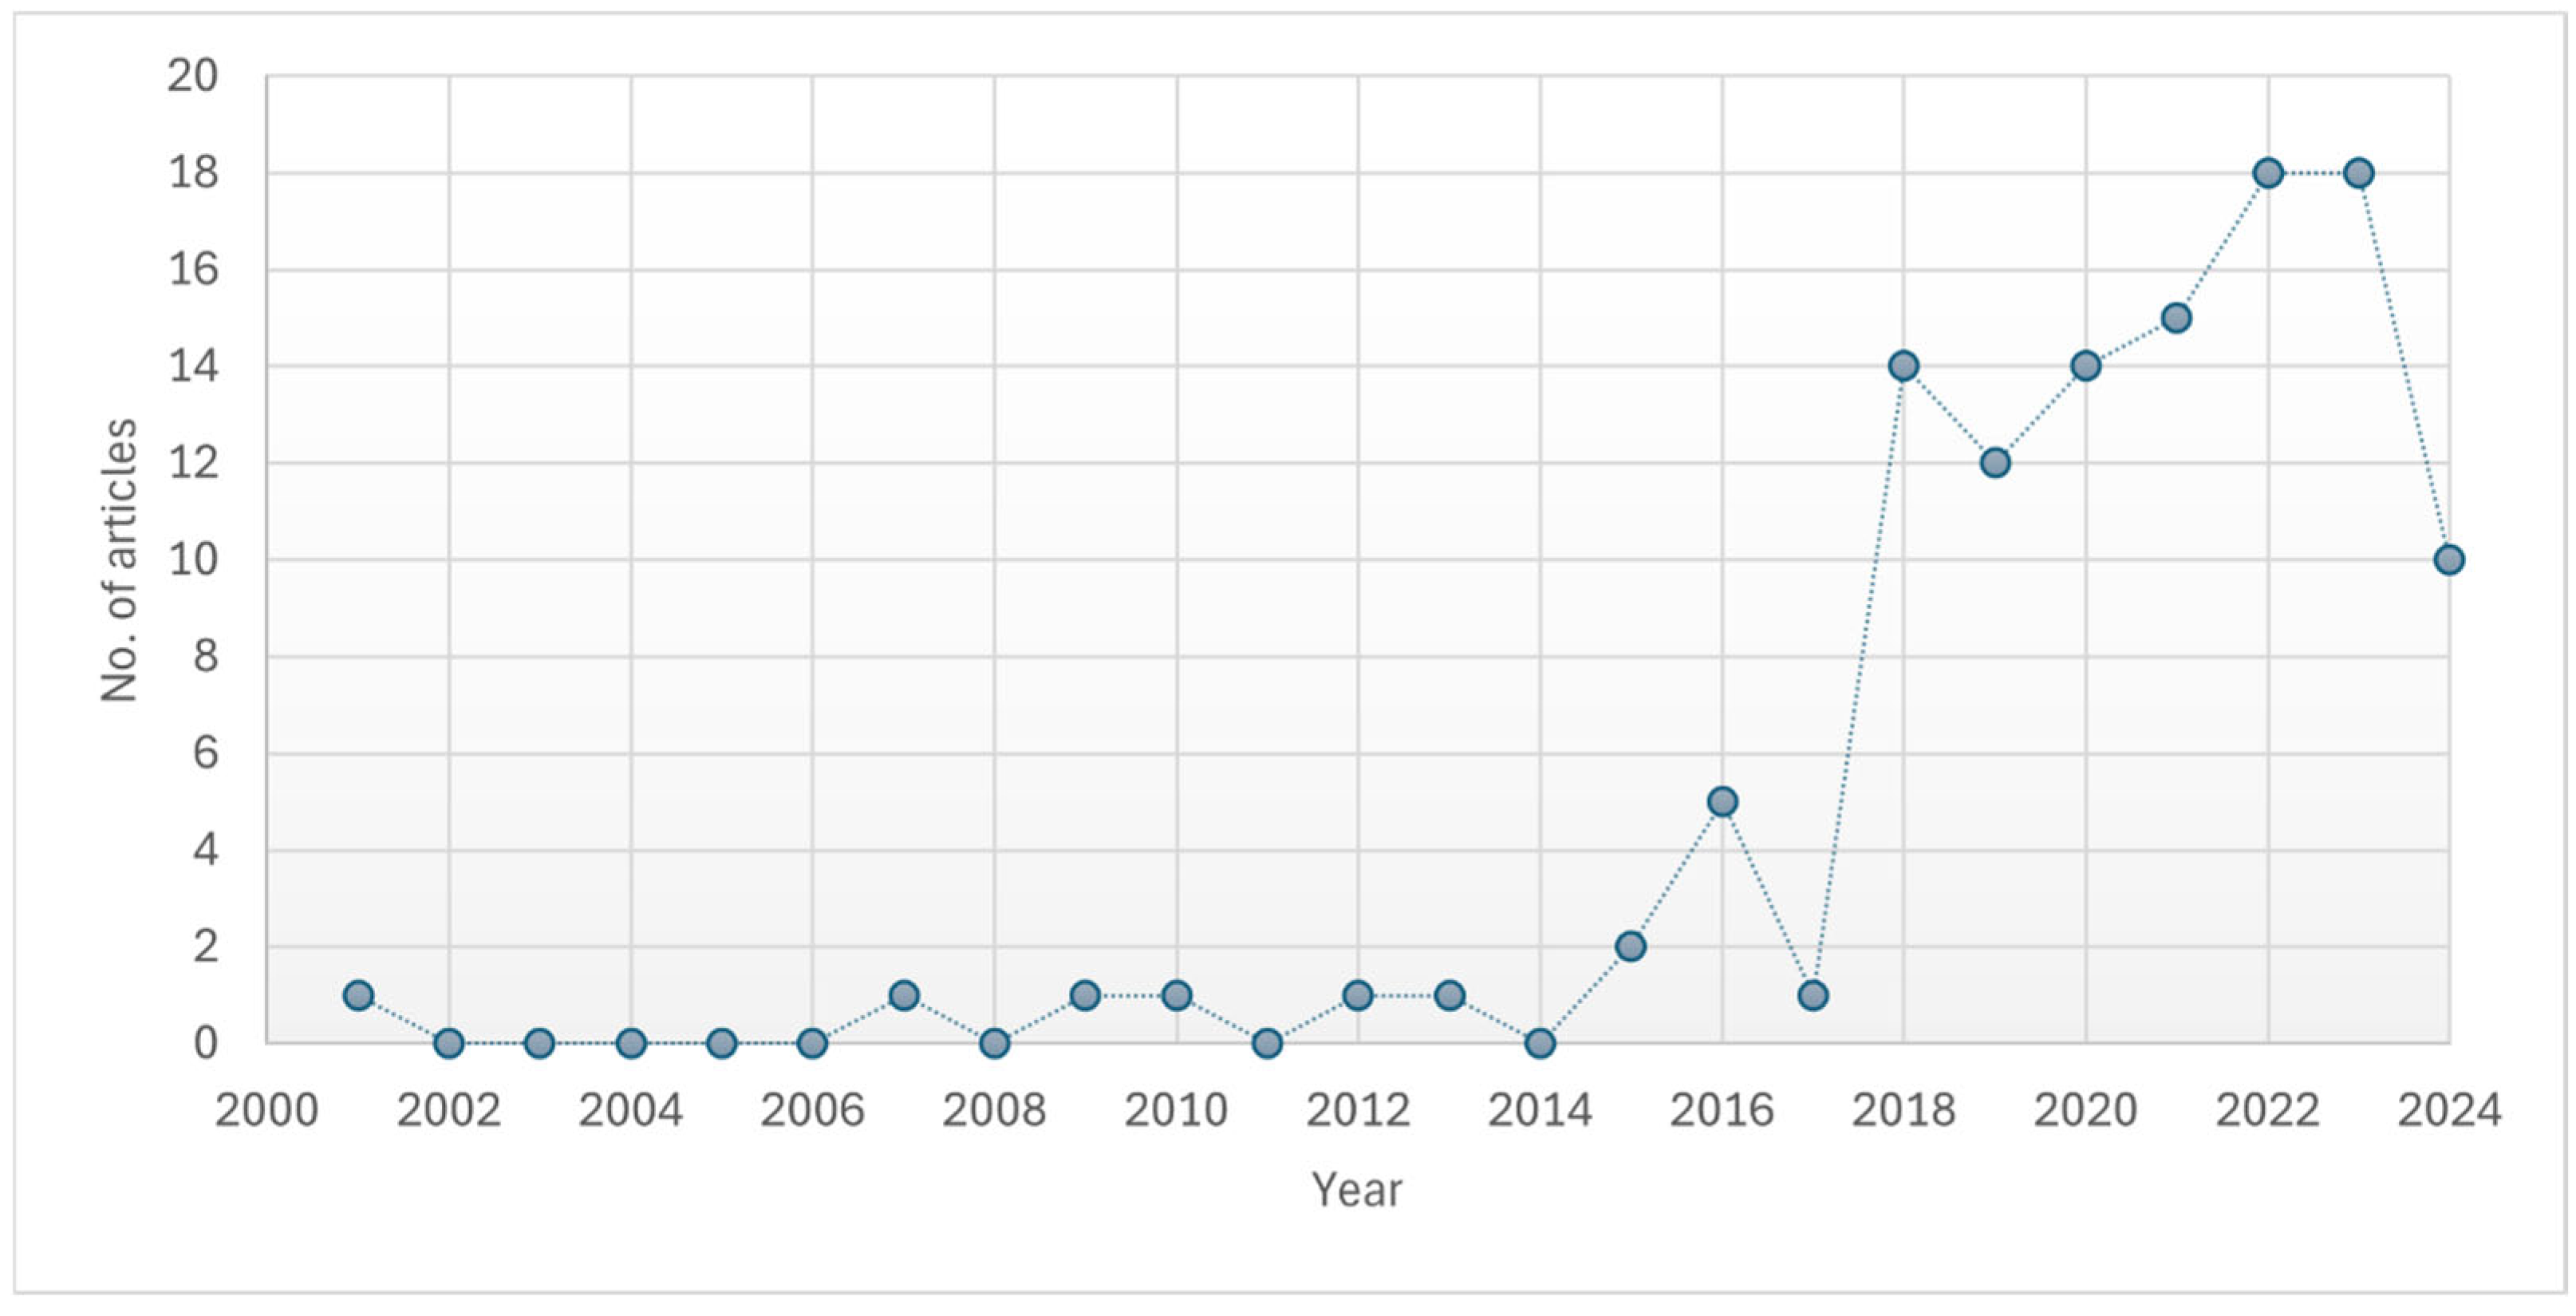
1. Introduction
- Q1: What is the evolutionary scenario and current status of DES becoming a Key Enabling Technology (KET) for Industry 4.0.?
- Q2: What are the distinguishing features of DES that offer significant benefits to manufacturing companies in terms of operational efficiency, cost reduction, and product quality improvement?
- Q3: How can DES effectively drive digital transformation in processes, facilitating the adoption of emerging technologies and optimizing the entire production chain?
2. Background and Research Gaps

| Field of Application | Main Benefits | Main Challenges | Main References |
|---|---|---|---|
| 1. Manufacturing and Production | DES is extensively used in manufacturing to optimize production processes, manage resources, reduce bottlenecks, and improve overall efficiency. It helps in the design and layout of production facilities, scheduling, and quality control. | Complex system dynamics, high variability in processes, need for detailed data | [23,33,34] |
| 2. Logistics and Supply Chain Management | DES is essential for modeling and analyzing supply chain operations, including inventory management, order processing, transportation, and distribution. It aids in optimizing logistics networks and improving delivery schedules. | Dynamic and uncertain environment, complex interaction of factors, need for real-time data | [35,36,37] |
| 3. Healthcare | DES is employed to model patient flow, hospital operations, and emergency department scenarios. It helps in optimizing healthcare system designs, resource allocation, and patient throughput | Sensitive data handling, complex patient pathways, staff scheduling complexities | [38,39,40] |
| 4. Transportation and Traffic Management | DES is used to simulate traffic flow, public transportation systems, and logistics networks. It aids in designing efficient traffic management systems, evaluating congestion scenarios, and optimizing transportation schedules. | Complex urban layouts, unpredictable traffic patterns, coordination with multiple agencies | [41,42,43] |
| 5. Aerospace and Defense | The aerospace and defense industries use DES to model complex systems, such as air traffic control, military operations, and logistics. It helps in optimizing resource allocation and decision-making in these critical sectors. | Highly complex systems, security concerns, regulatory compliance | [44,45,46] |
| 6. Retail and Customer Service | DES is employed in retail and customer service to model customer queues, store layouts, and service operations. It assists in improving customer experiences and optimizing staff allocation. | Demand variability, inventory management complexities, customer behavior prediction | [47,48,49] |
| 7. Energy and Utilities | DES is used to model power generation and distribution systems, allowing for analysis of energy demand, reliability, and potential issues. | Complex infrastructure, regulatory challenges, fluctuating demand | [50,51,52] |
| 8. Environmental and Ecological Modeling | DES can be used to model ecological systems and environmental processes, such as water management, ecosystem dynamics, and pollution control. | Complex interactions, long-term data requirements, unpredictability of natural systems | [53,54,55] |
| 9. Financial Services | DES is applied in financial services for modeling trading systems, portfolio management, and risk assessment. It helps with understanding the impact of different trading strategies and market conditions. | High market volatility, reliance on predictive models, regulatory constraints | [56,57,58] |
| 10. Simulation Gaming and Entertainment | DES is employed in the development of video games, serious games, and simulations for entertainment and training purposes. It provides a realistic and dynamic environment for users. | High demand for realism, computational intensity, rapidly evolving technology | [47,59,60] |
| 11. Education and Training | Educational institutions and organizations use DES for training purposes, such as simulating business processes, medical procedures, and military training exercises. | Diverse educational needs, resource constraints, evolving educational methods | [61,62,63] |
| 12. Urban Planning and Smart Cities | DES helps urban planners simulate the impact of various city development scenarios, traffic management, and infrastructure changes to optimize city designs and services. | Complex social dynamics, integrating diverse systems, long-term planning challenges | [64,65,66,67,68,69,70,71,72,73,74,75,76] |
| 13. Telecommunications | DES assists in modeling network traffic, call centers, and communication systems to optimize resource allocation and improve service quality. | Rapid technological changes, high data traffic, complex network management | [67,68,69] |
| 14. Pharmaceuticals and Drug Development | DES is employed for modeling drug manufacturing processes, clinical trial designs, and supply chain management. | Regulatory compliance, high accuracy requirement, complex biological systems | [70,71,72] |
| 15. Space Exploration | NASA and other space agencies use DES for mission planning, spacecraft operations, and exploration simulations. | Extreme environmental conditions, limited data, high risk and cost | [73,74,75] |
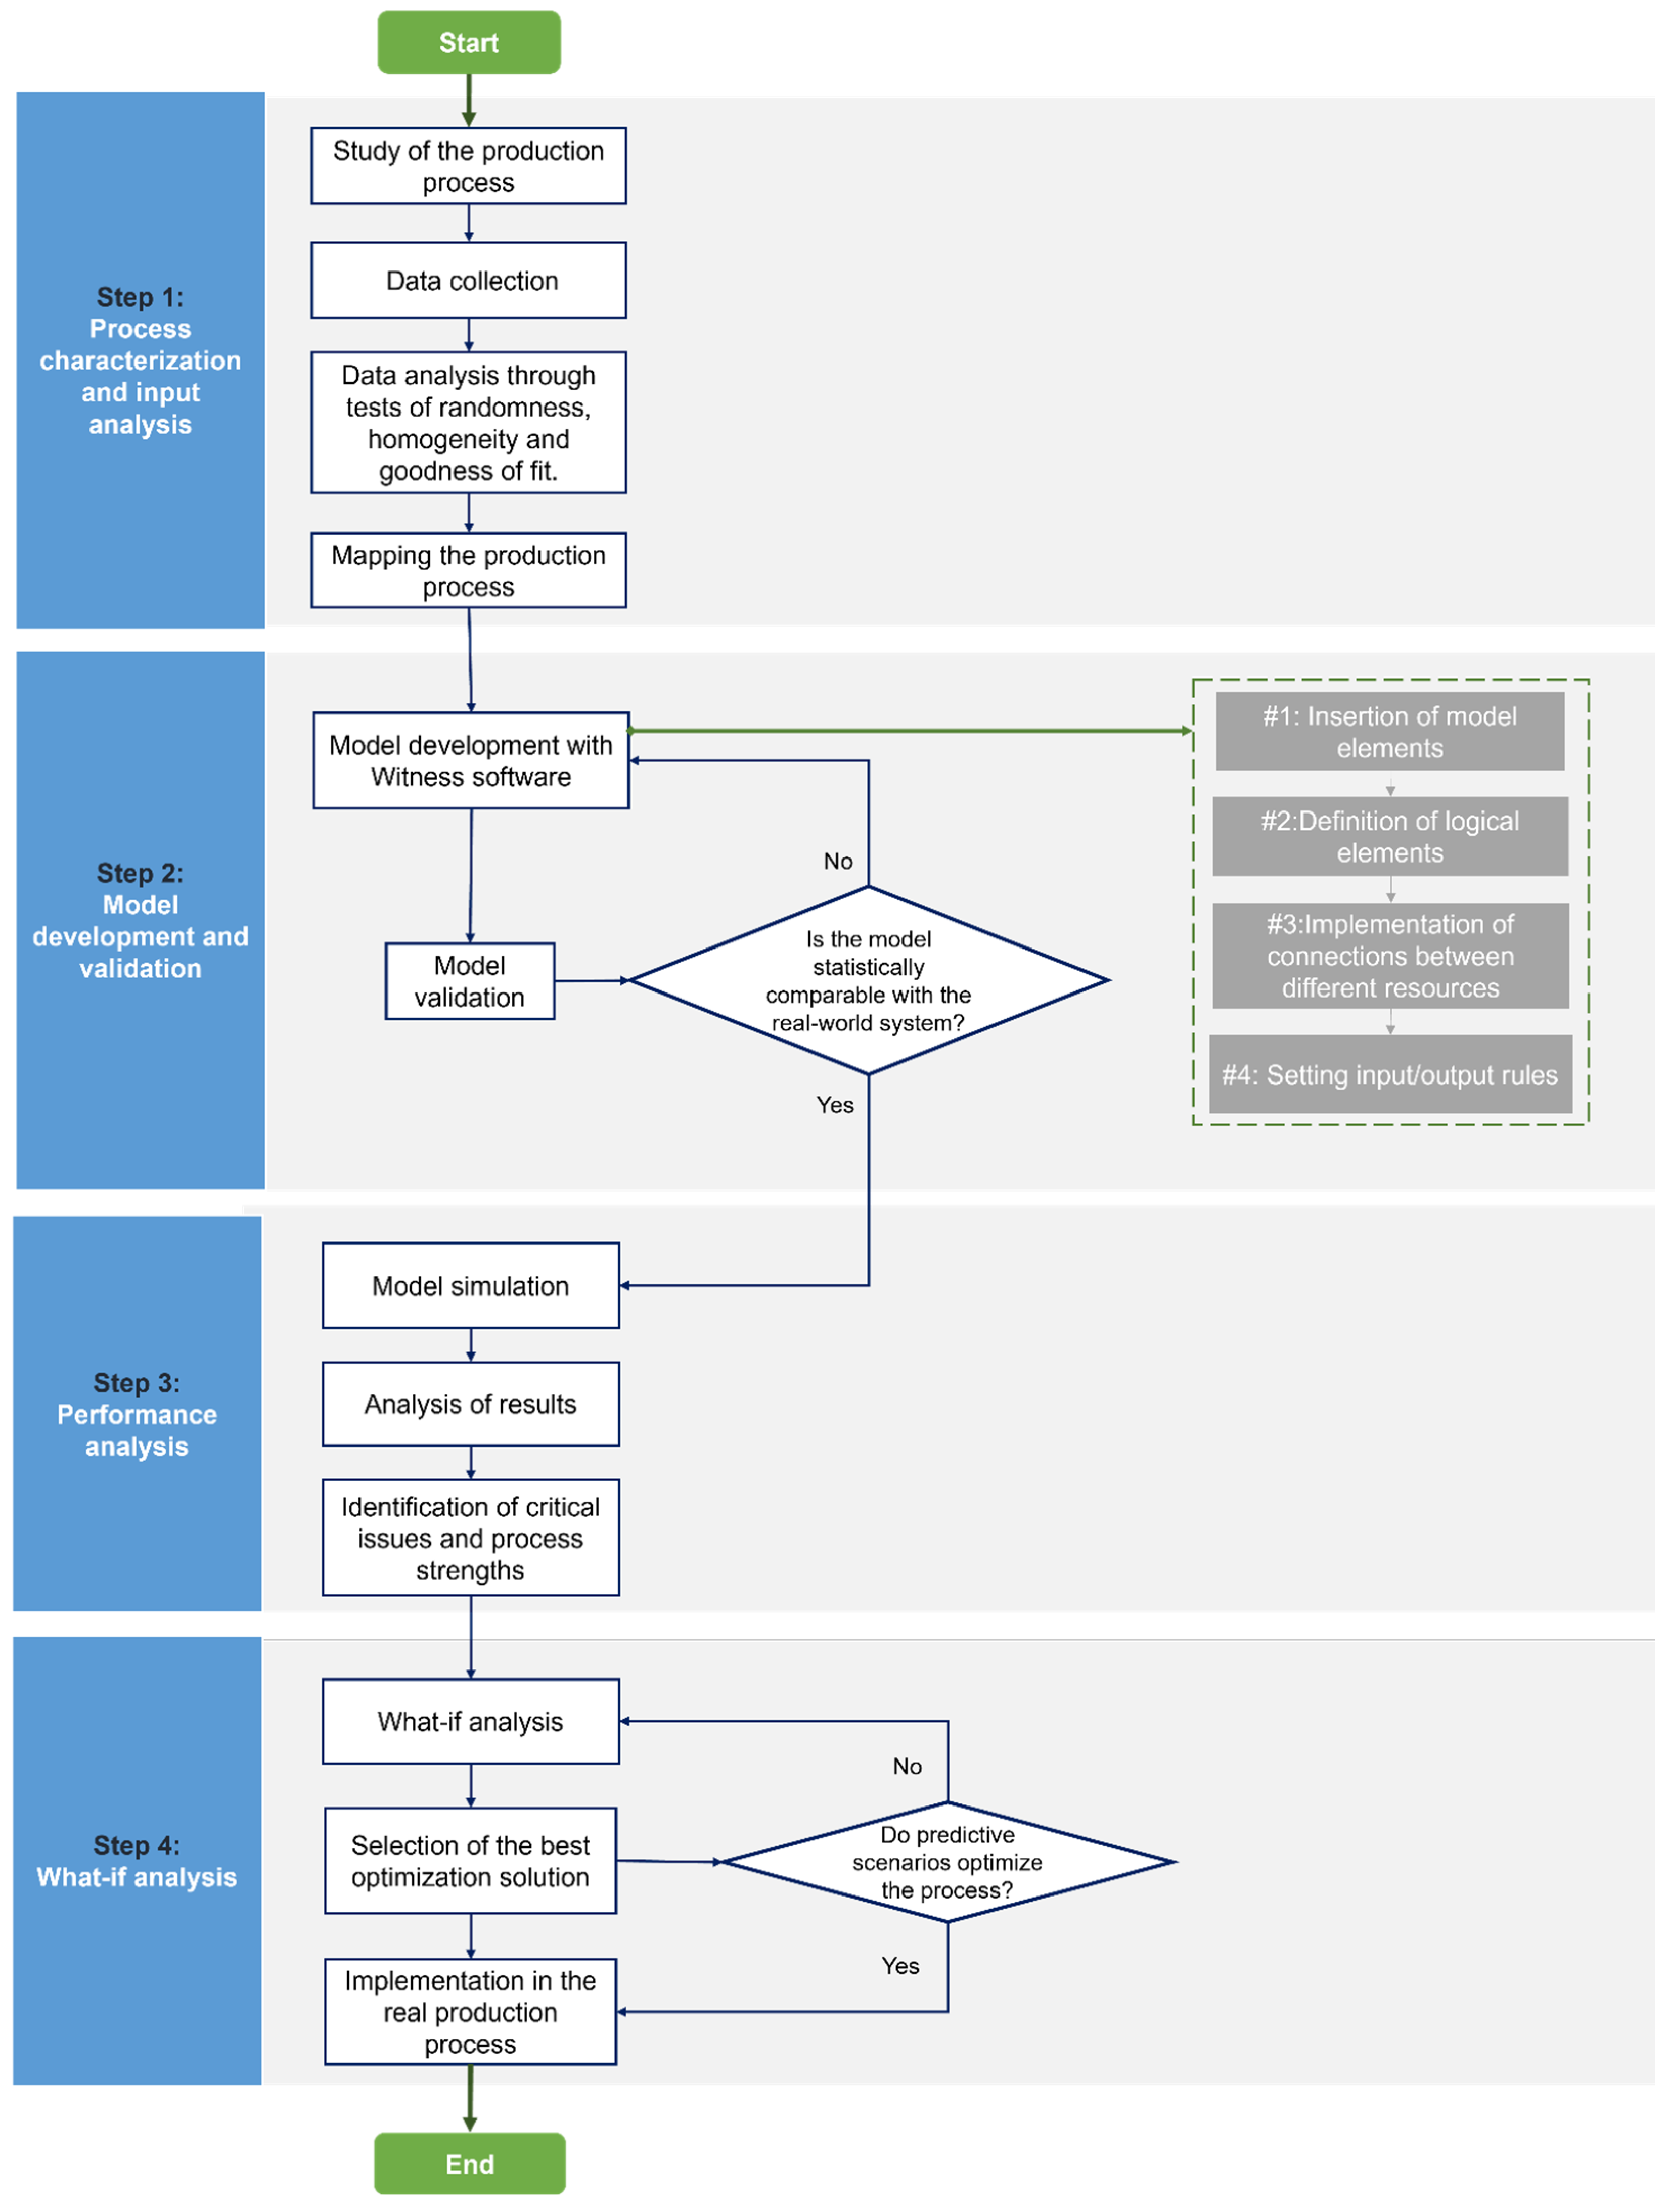
3. Materials and Methods
- Step 1: Process characterization and input analysis
- Operation cycle times: Precise measurements of the time taken to complete each stage of the production process.
- Material and product flows: Monitoring the movement of materials through the various workstations.
- Scrap levels and rework: Collecting data on quantities of defective products and rework rates.
- Resource utilization: Analysis of the use of machines, operators, and buffers along the process.
- Randomness: Randomness in the input data is essential to ensure that simulations are not affected by unanticipated patterns or correlations. In a discrete-event simulation, events should occur independently, reflecting the stochastic nature of the real system. To analyze randomness, statistical tests such as Pearson’s test for independence are used, which tests whether two variables are independent of each other [90]. If the variables show strong dependence, it could indicate the presence of a pattern that must be eliminated to obtain a correct simulation. Another method is the runs test, which examines the sequence of the data to detect the presence of patterns. Finally, the autocorrelation test helps identify any temporal dependencies between successive data points, ensuring that the inputs are not influenced by previous events [91].
- Homogeneity: Homogeneity of input data is crucial to ensure that all data come from the same population or that their variances are equivalent. This is especially important when modeling complex systems with multiple components or operational steps. To check for homogeneity, statistical tests such as Bartlett’s test, which assess whether multiple samples come from populations with the same variance, are used. However, because this test can be sensitive to deviations from normality, Levene’s Test offers a more robust alternative [92]. Homogeneity is further analyzed using nonparametric tests such as the Kruskal–Wallis Test, which compares the averages of multiple groups without assuming a normal distribution. In addition, visual tools such as box plots and Q-Q plots make it possible to observe the distributions of the data and visually verify the equality of variances between groups [93].
- Goodness of fit: The goodness of fit of the input data refers to how well the observed data follow an expected theoretical distribution. This is critical to ensure that the models used in the simulation accurately represent the behavior of the real system. The chi-square test is commonly used to compare the observed distribution with an expected distribution, detecting significant discrepancies. The Kolmogorov–Smirnov test, on the other hand, compares a sample distribution with a reference distribution, checking their congruence over all points in the distribution [94]. A more sensitive test, the Anderson–Darling, places more emphasis on the tails of the distribution, where discrepancies can have a significant impact on simulation results. Using these goodness of fit tests helps ensure that the input data are well represented by the theoretical models used in the simulation [95].
- Step 2: Model development and validation
- •
- Insertion of physical elements: The first step is to insert physical elements representing the system’s resources into the model. These include the following:
- ▪
- Machines: Identification and modeling of the machines used in the process, with parameters such as capacity, utilization rate, and setup times.
- ▪
- Buffers: Definition of buffers between operations, specifying maximum capacity and material flow management policies.
- ▪
- Operators: Modeling the workforce, with the inclusion of parameters such as availability, work times, and movement between locations.
- •
- Defining logical elements: After modeling the physical elements, move on to configuring the logical elements, which are needed to simulate resource behavior:
- ▪
- Processing and waiting times: Specifying cycle times for each operation and waiting or transit times between operations.
- ▪
- Resource capacity and availability: Configuration of resource operating limits and their time availability.
- ▪
- Maintenance and failure parameters: Inclusion of variables to simulate scheduled maintenance events and sudden failures.
- •
- Implementation of connections among resources: Defining the paths between different resources, creating a network that allows simulating multiple flows and different operational sequences within the same model. This step is crucial to reproduce the complexity of real production processes.
- •
- Setting input/output rules: Finally, the rules governing the flow of materials and products within the system are established. These rules determine how product units move from one stage to another, what conditions must be met for transfer, and how to handle any bottlenecks.
- •
- Comparison with real data: The behavior of the model is compared with real data collected during the analysis phase. Matching cycle times, production rates, and resource utilization are checked.
- •
- Statistical analysis: Statistical tests are performed to ensure that the model results are statistically aligned with the real system, including analysis of variance and significance tests.
- Step 3: Performance analysis
- •
- Bottlenecks: Identification of areas where production flow stops or slows down, causing inefficiencies.
- •
- Strengths: Recognition of areas of the process that work optimally, to maintain and exploit these advantages.
- Step 4: What-if analysis
- •
- Testing alternative solutions: Simulation of specific changes to the process, such as changing buffer capacities, adding resources, or changing operating shifts.
- •
- Evaluating the impact of changes: Each change is evaluated in terms of its impact on productivity, operating costs, and product quality before implementation in the wild.
- •
- Implementation planning: Development of a detailed plan to introduce the necessary changes in the production system.
- •
- Post-implementation monitoring: Once implemented, the changes are monitored for effectiveness and to make any adjustments.
4. Reference Scenario
4.1. Company Background and Industrial Challenges
4.2. Strategic Use of DES in Production Systems
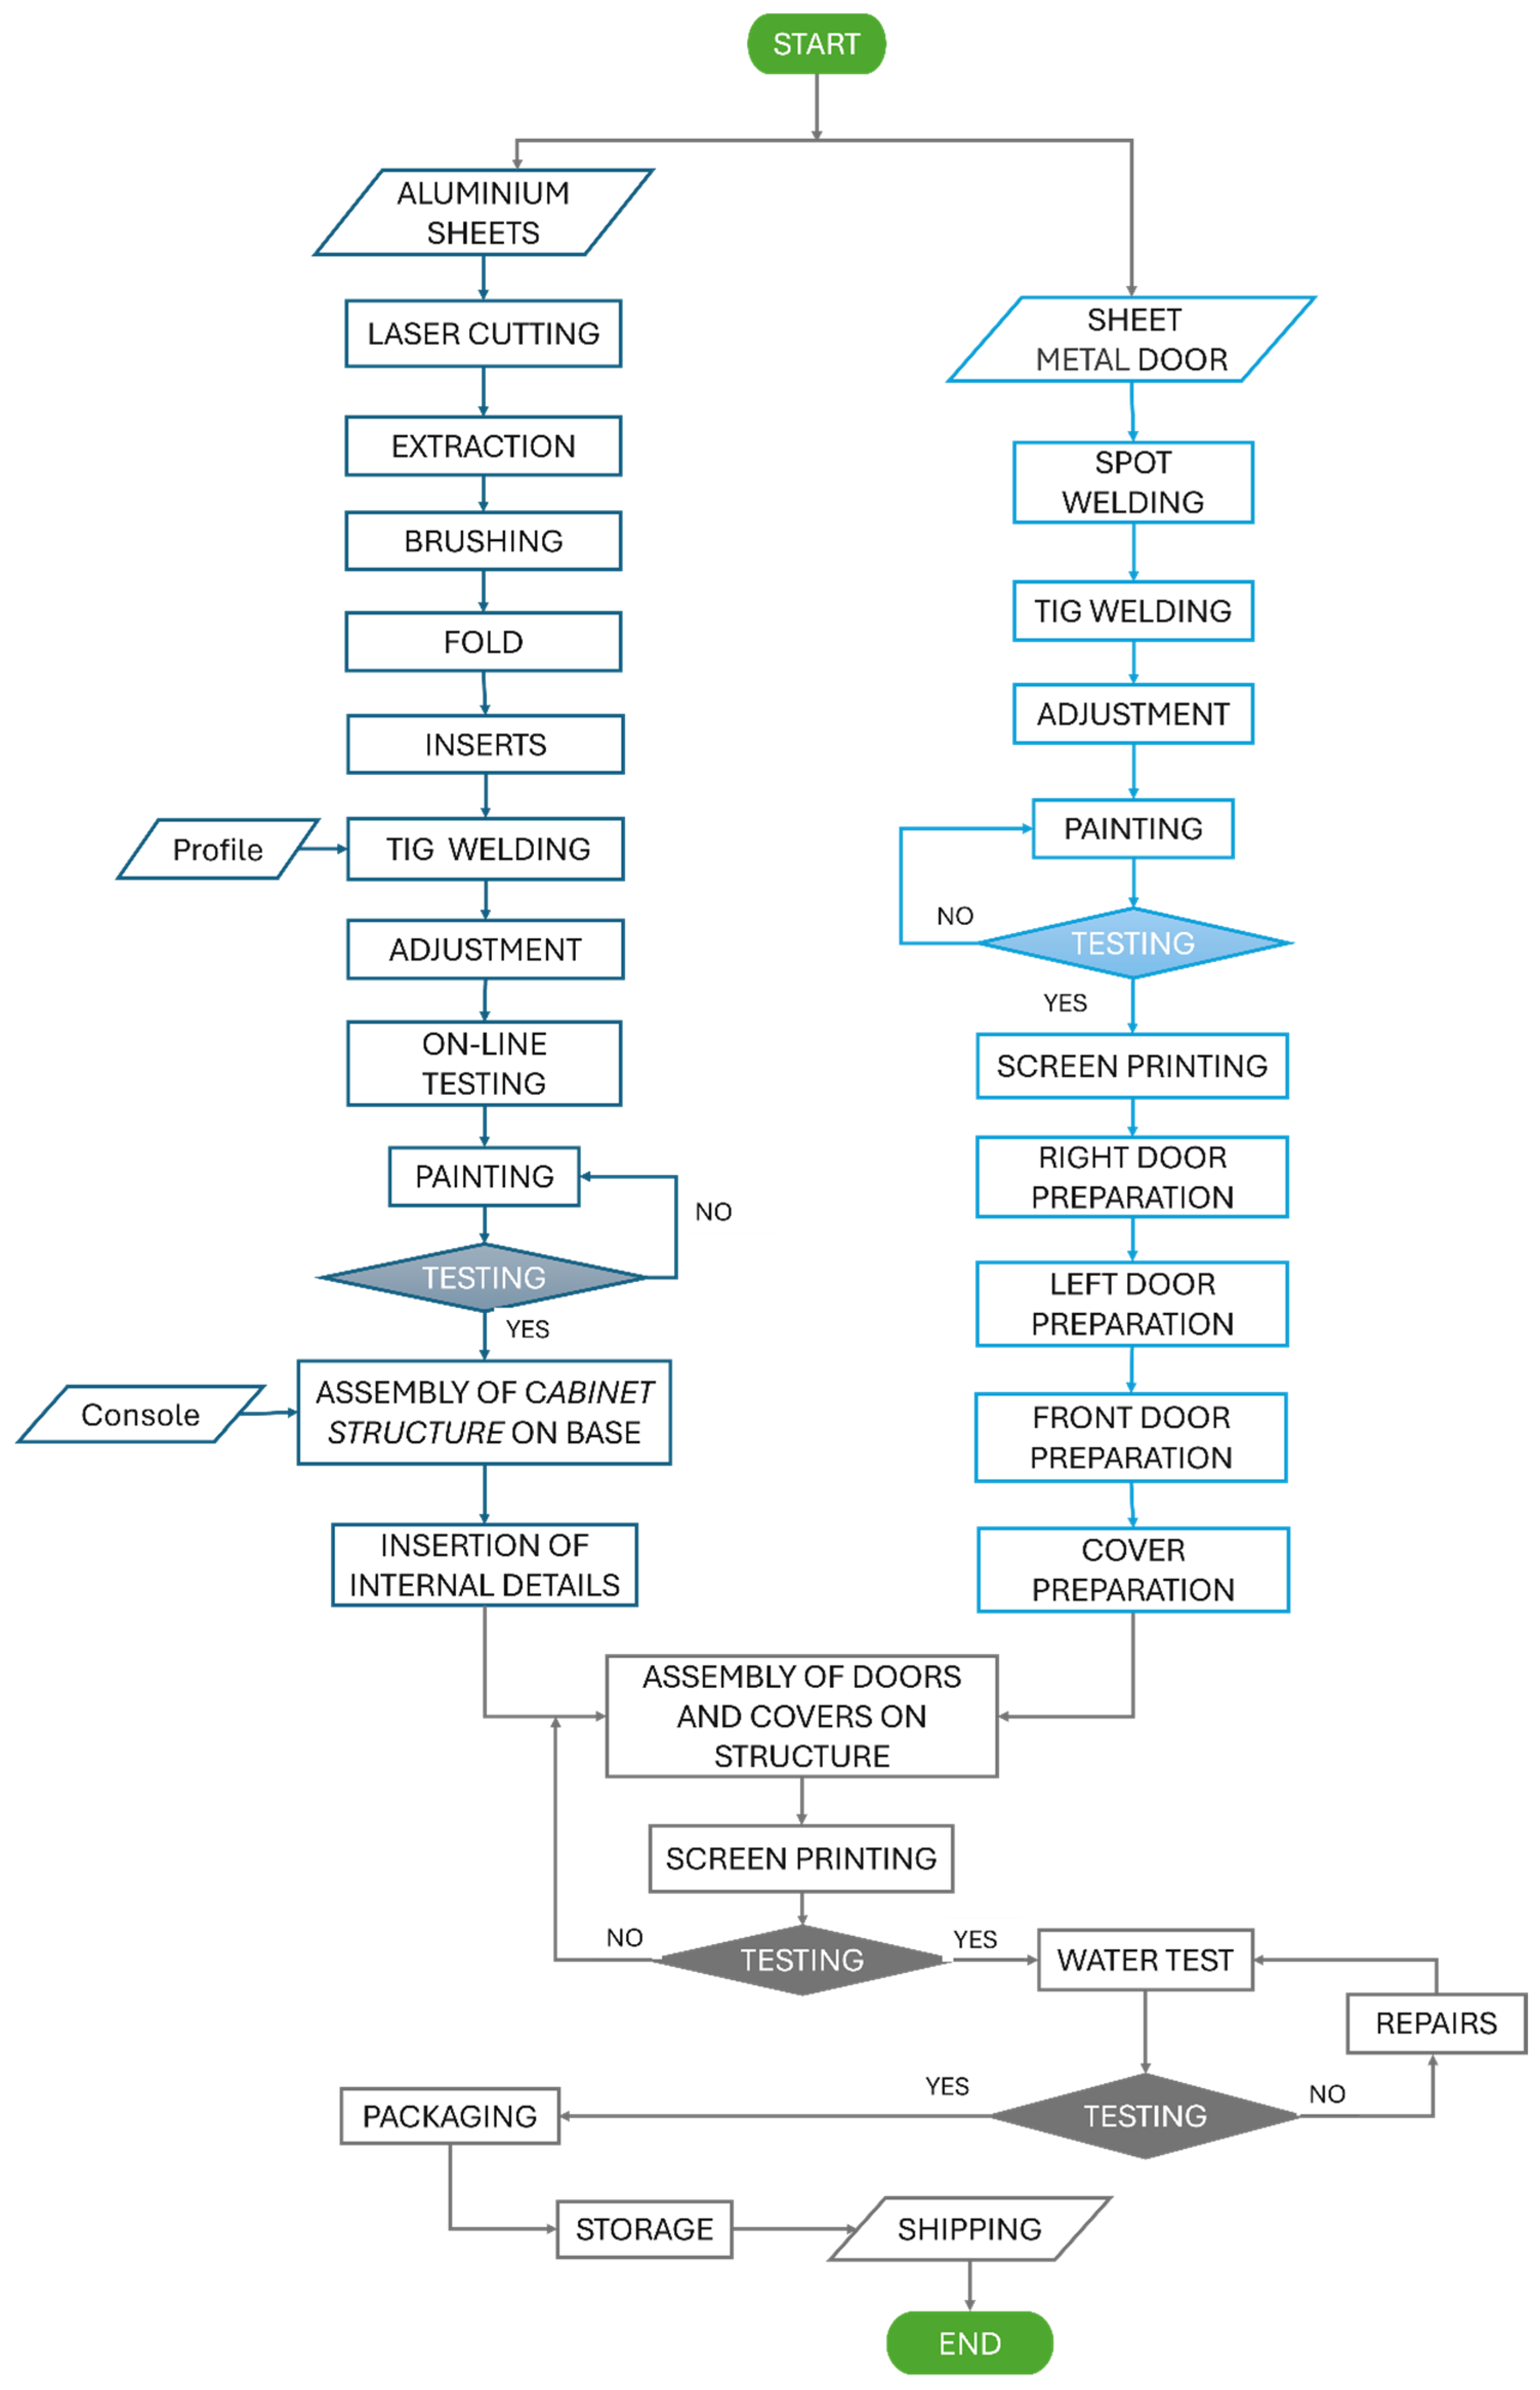
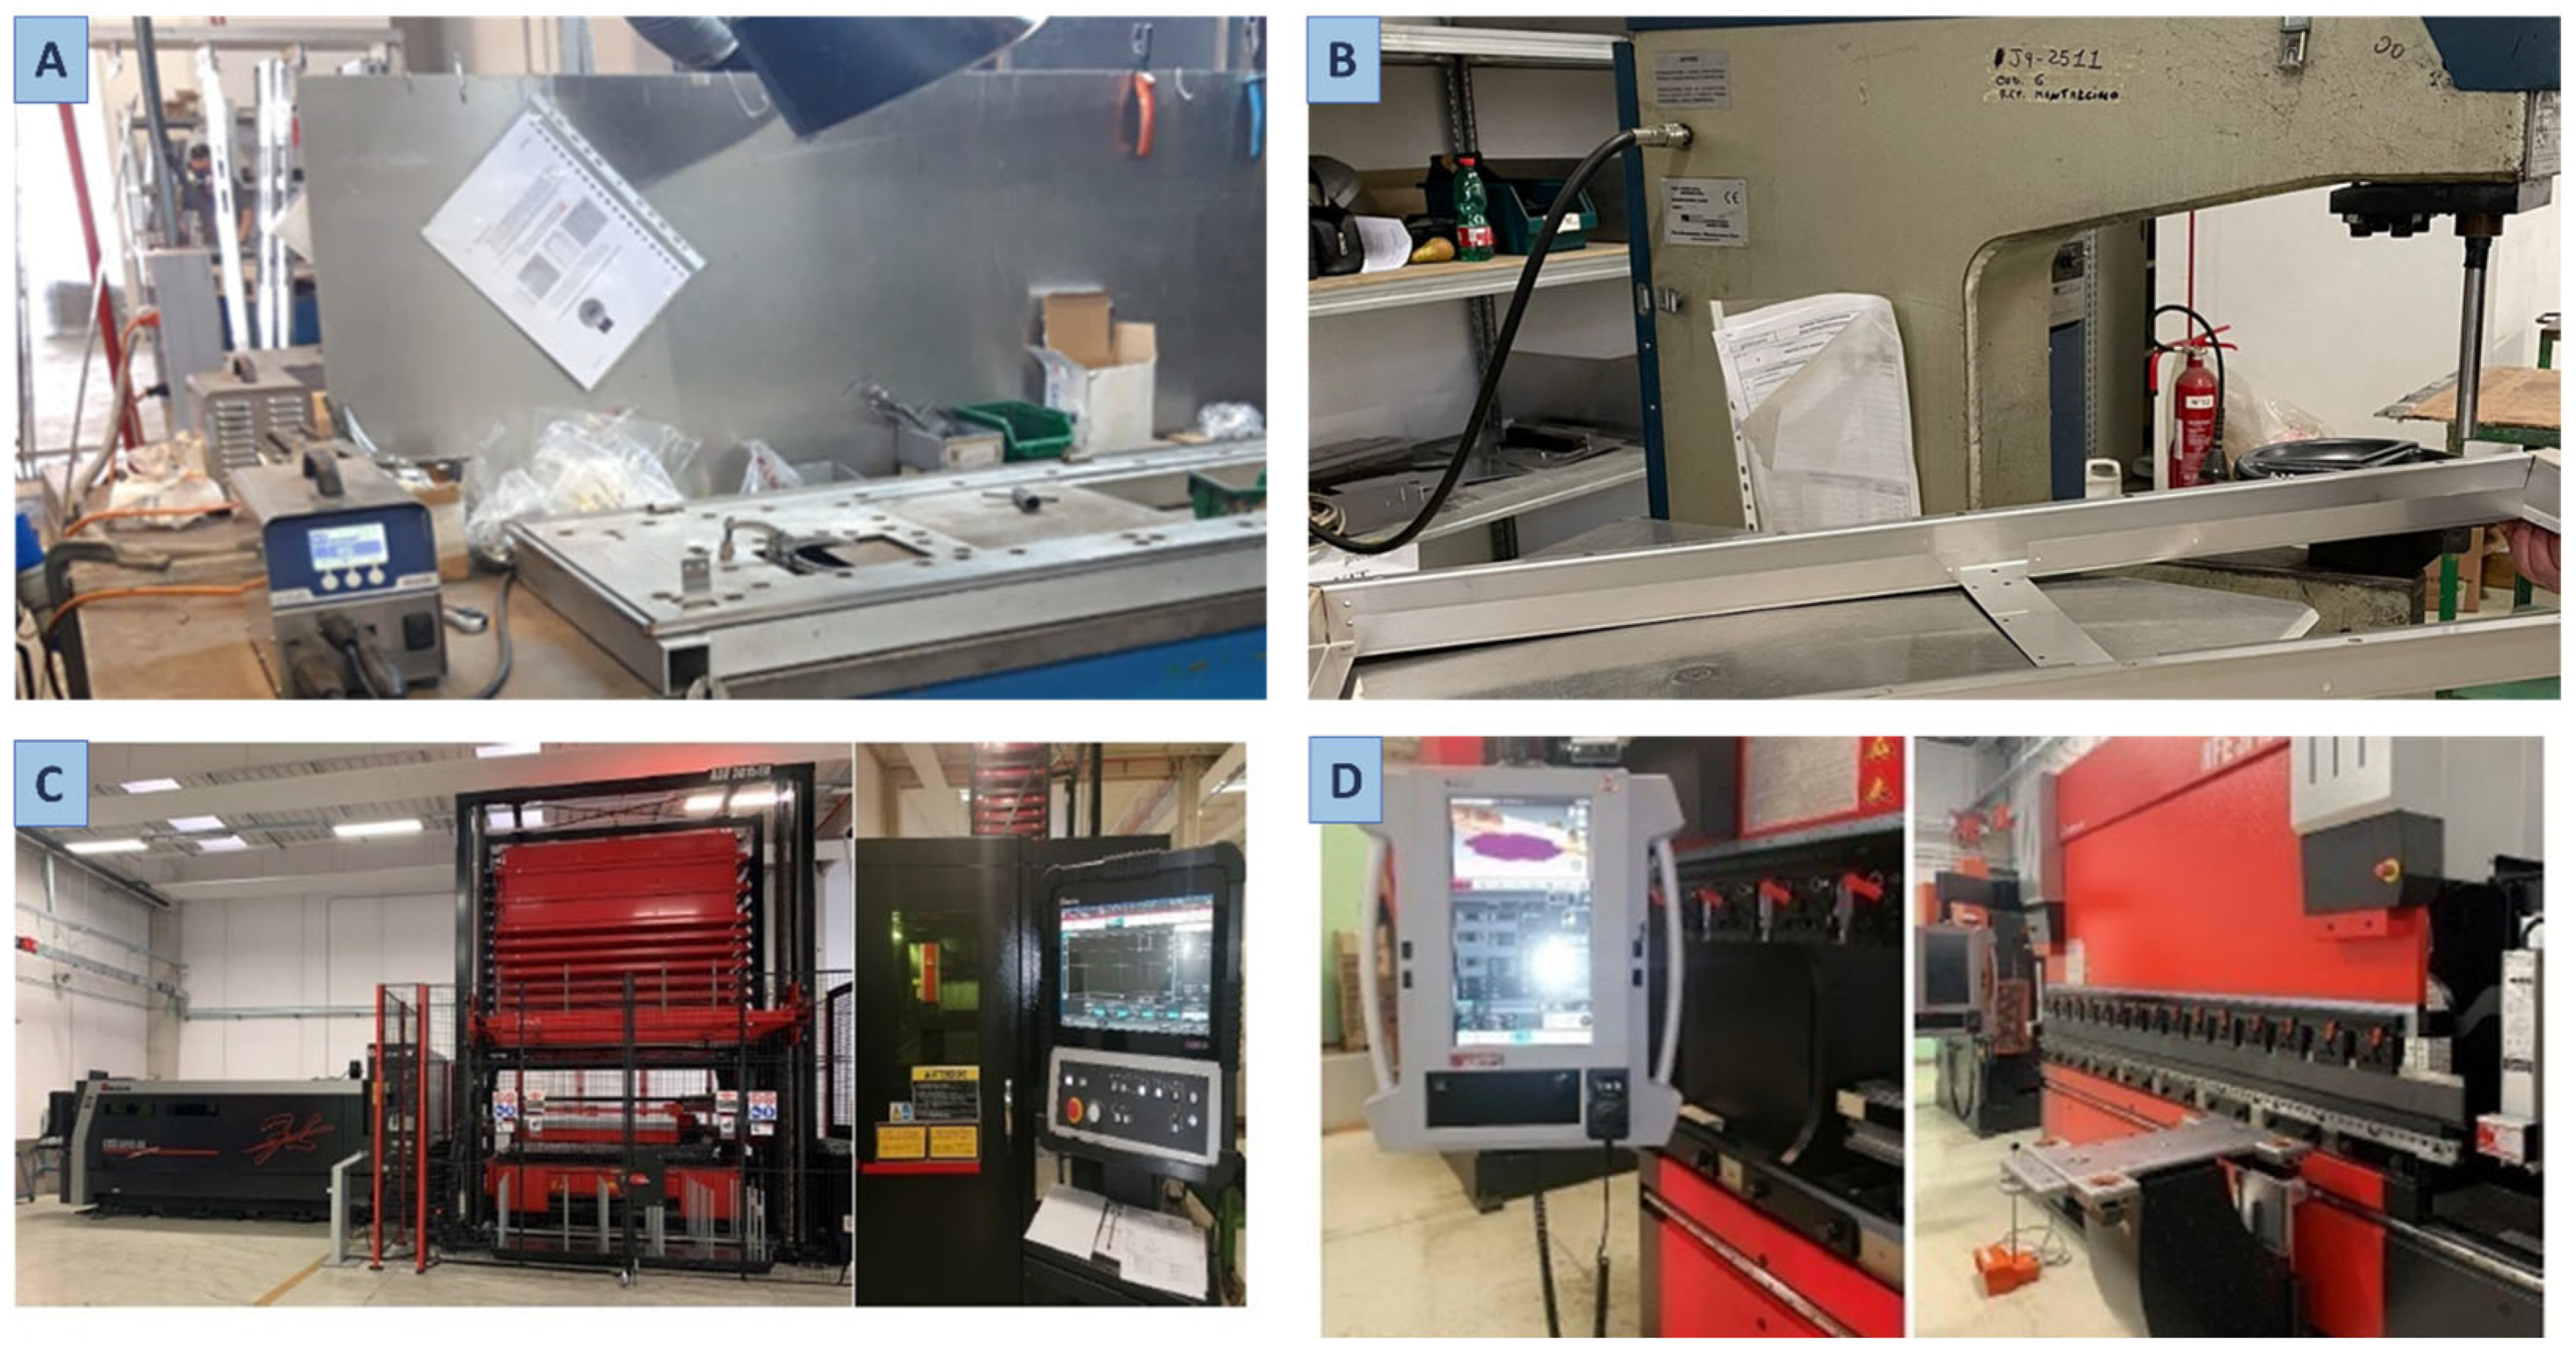
4.3. Production Process and Input Data Analysis
4.4. Data Analysis for Process Modeling Accuracy
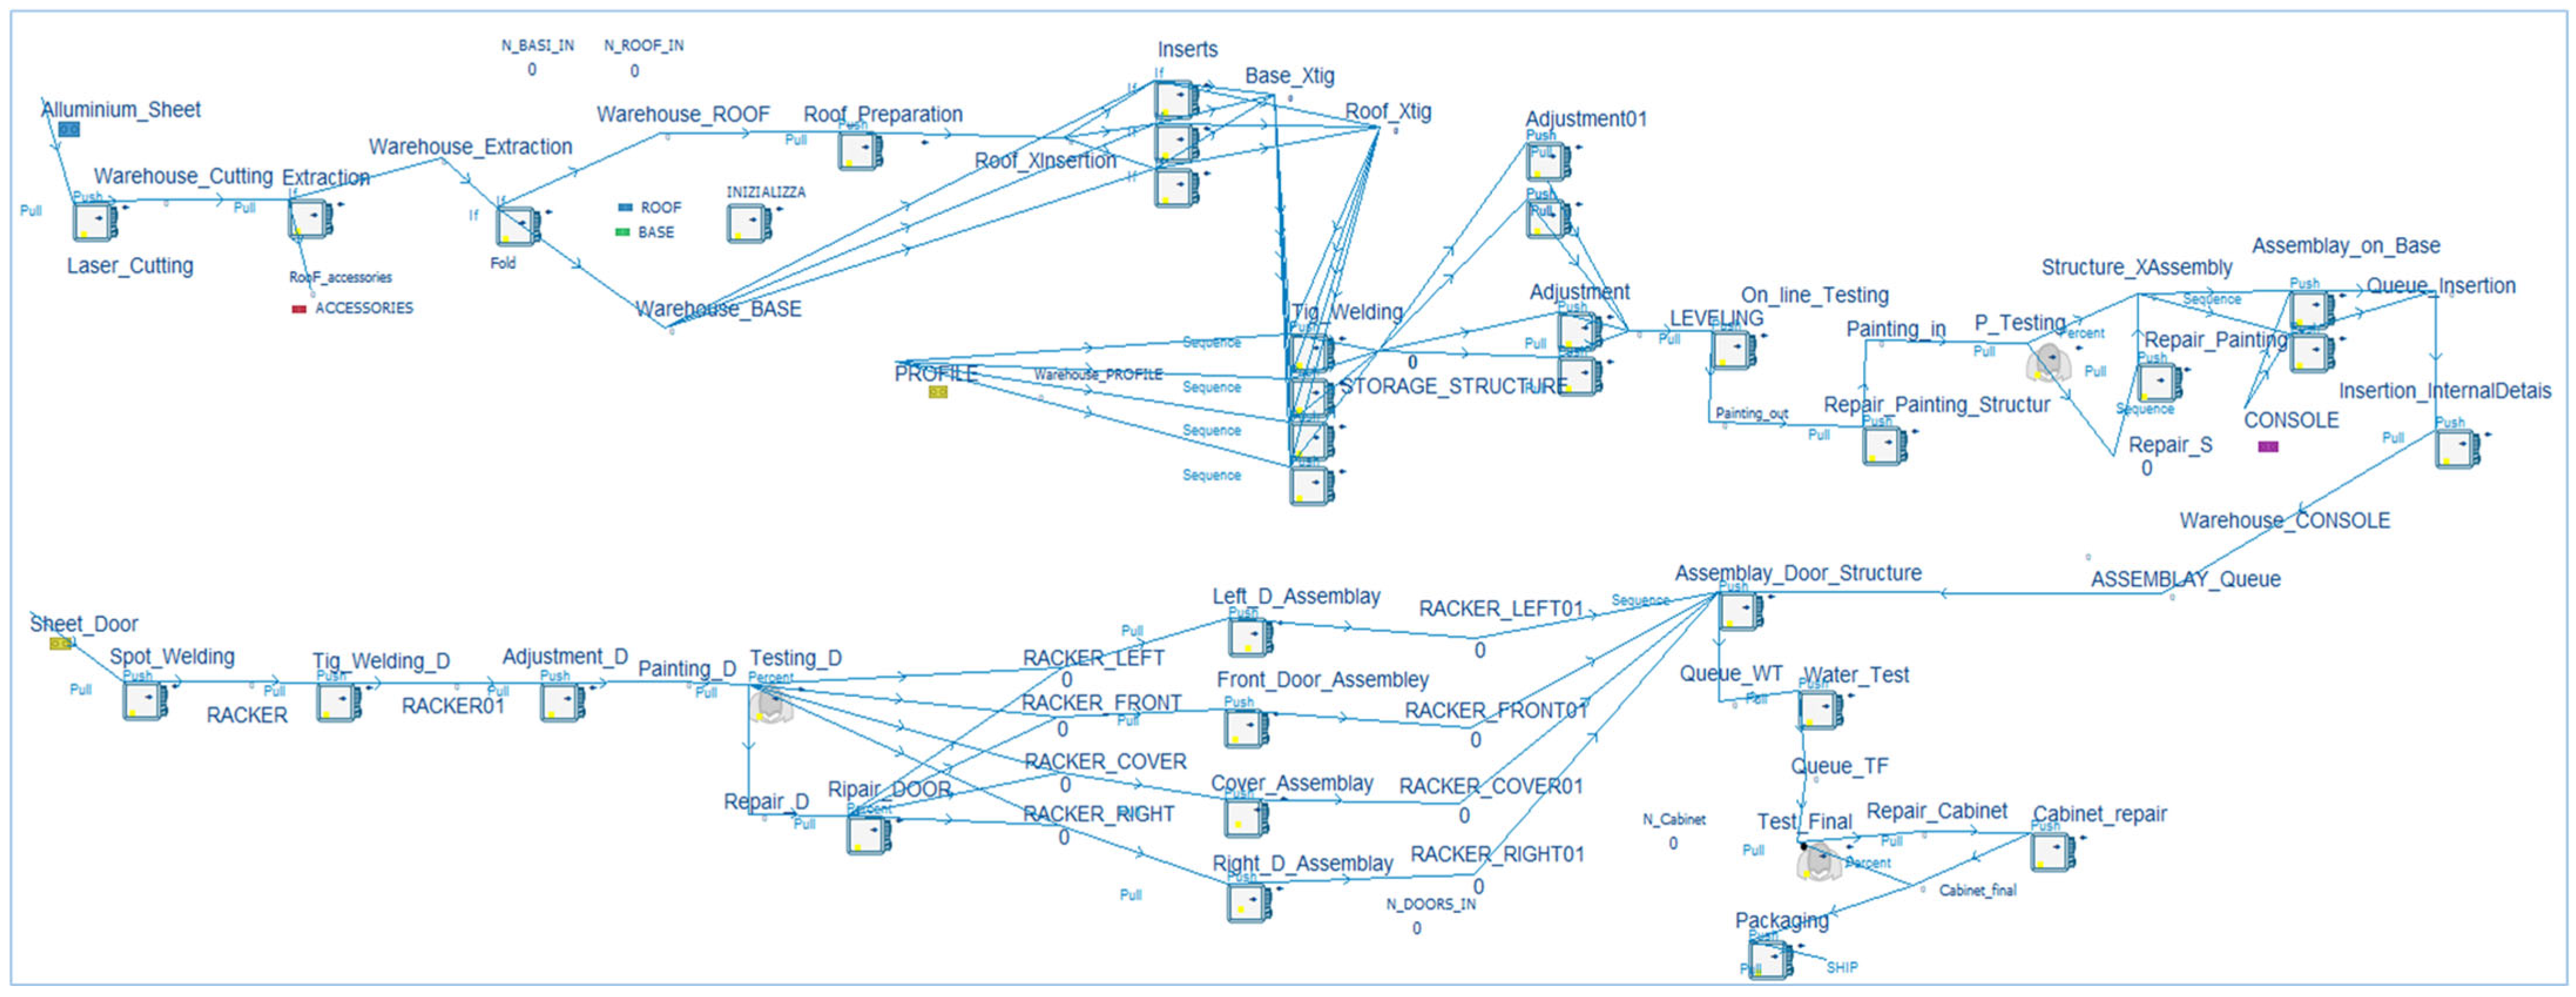
4.5. Digital Model: Development and Validation
- -
- Each machine represents a process activity that, based on the number of inputs and outputs of each, is distinguished into a single machine, an assembly machine, and a production machine.
- -
- Process inputs are modeled through parts. Some start the process; others are called precise process steps.
- -
- The time of each machine is equal to a uniform distribution between the maximum and minimum values measured by the timing activity.
- -
- Buffers, which represent accumulation systems, have a maximum capacity of 50 units.
- -
- In-process material handling times were not considered.
- -
- The screen-printing activity was not simulated in the process because of its short duration (less than one minute).
4.6. Analysis of Simulation Results
- Observed t value: −0.454
- p-value: 0.65
- Mean difference (đ): −4.33
- Standard deviation of differences: 33.03
- Degrees of freedom: 11
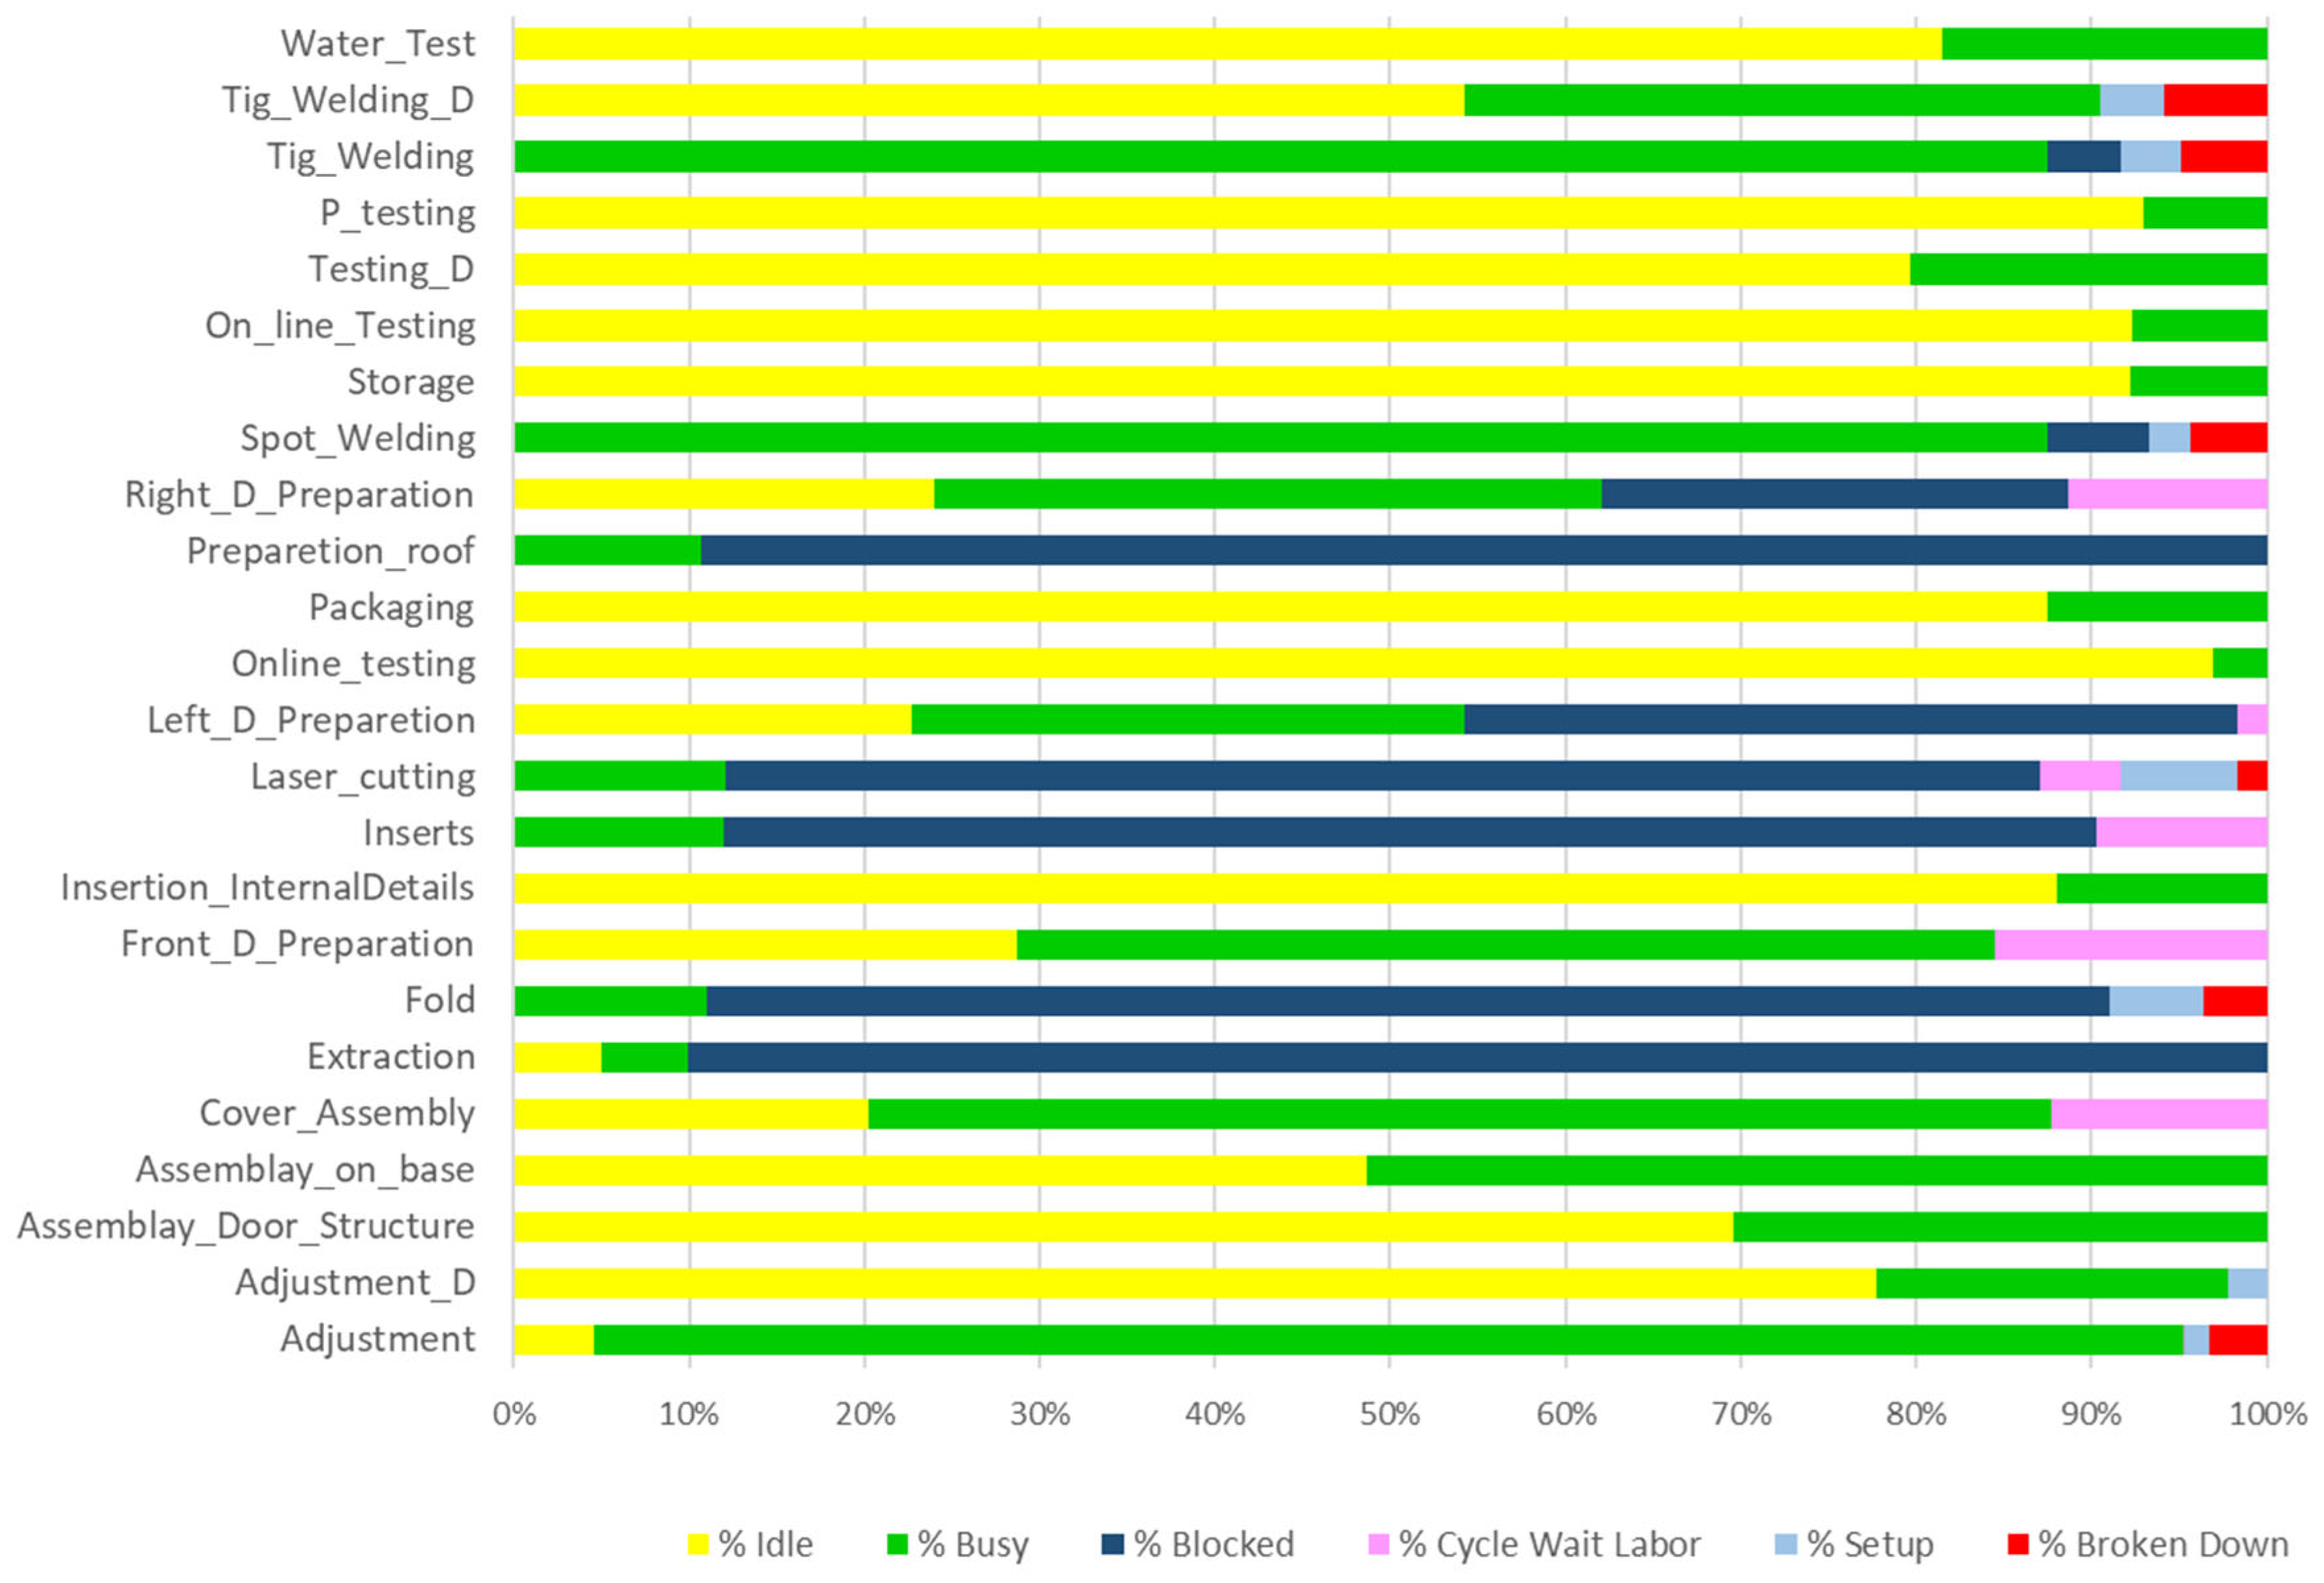
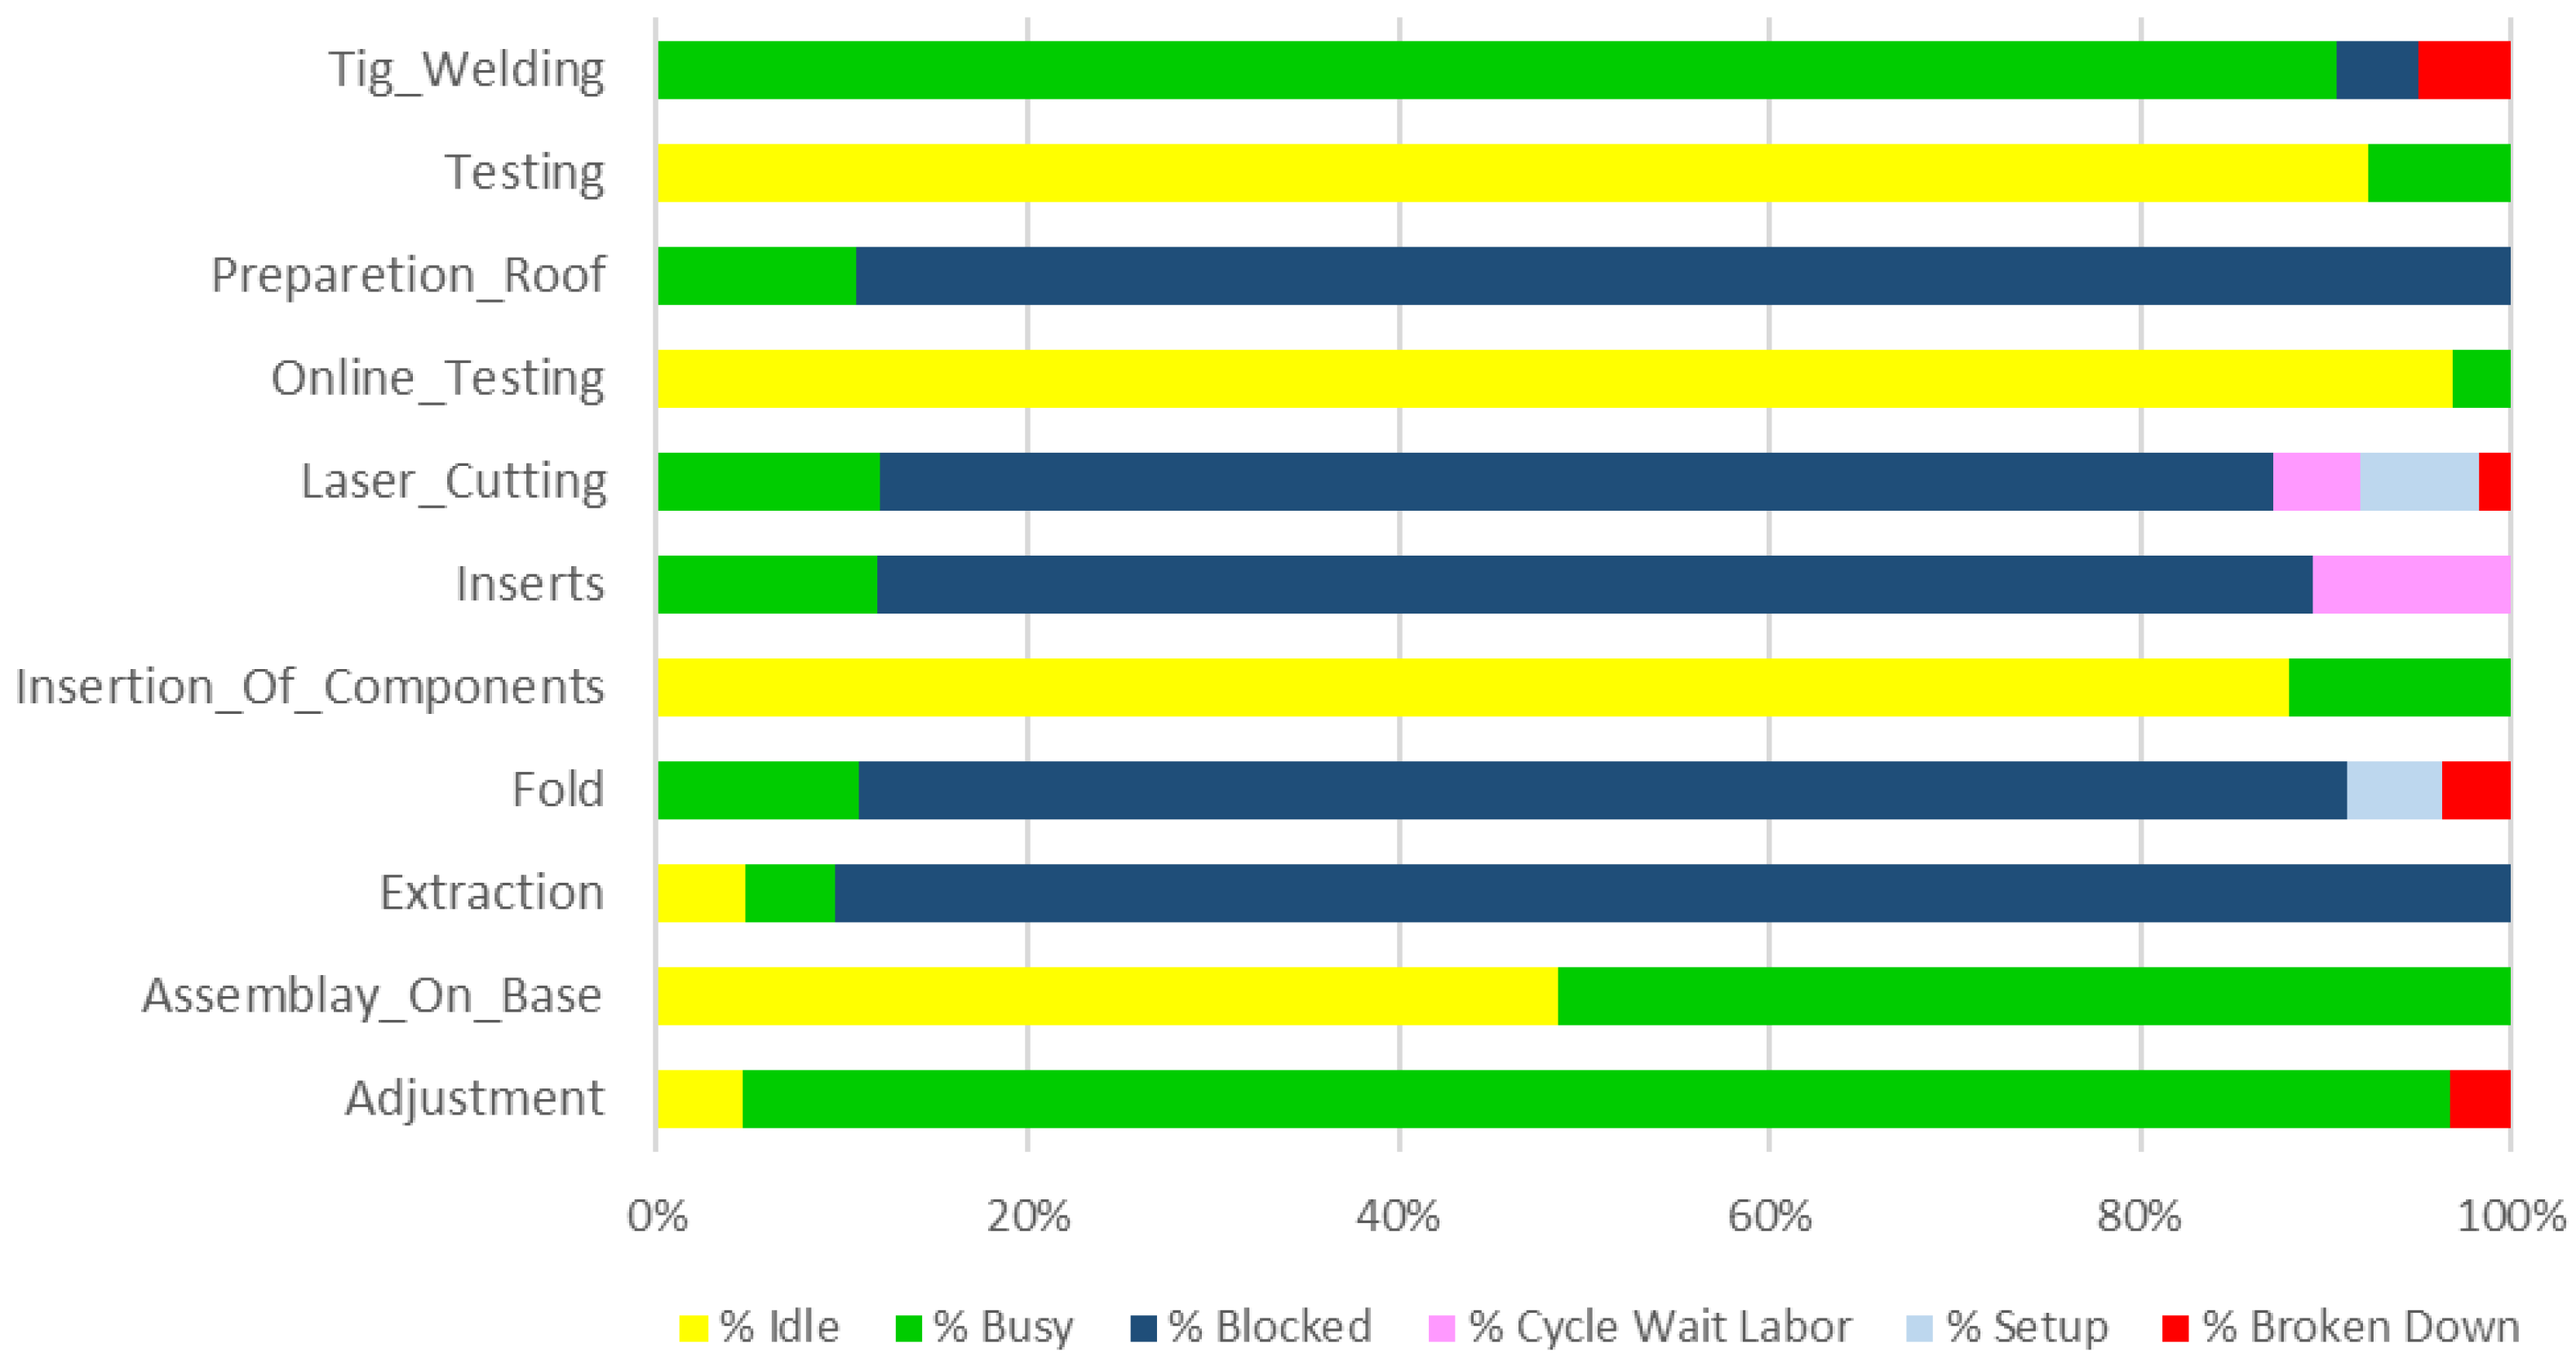
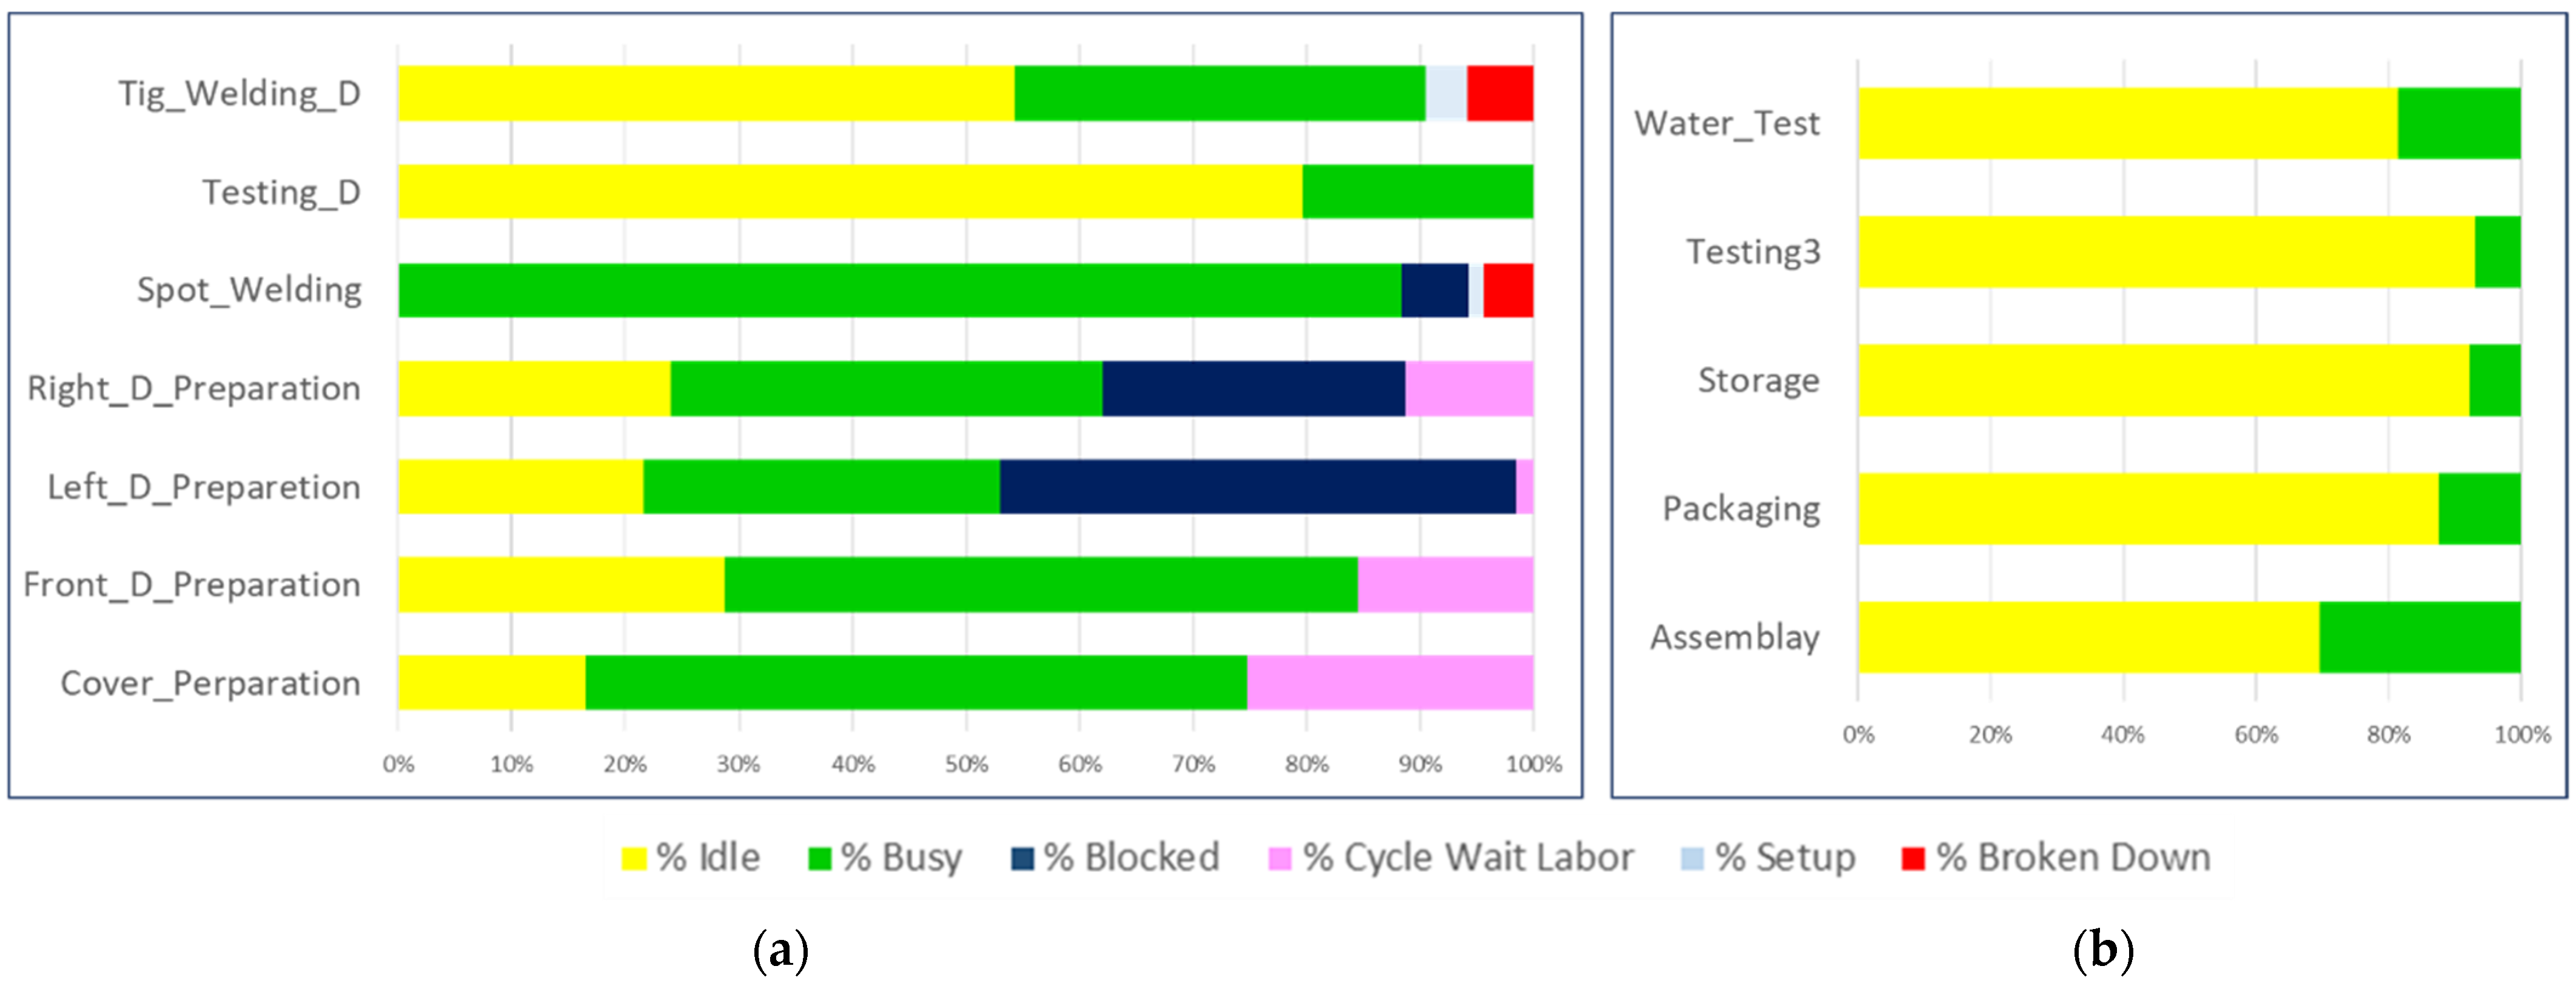
4.7. Results of Simulation: Performance Analysis
- -
- Need for significant setup time to reach maximum capacity: The daily production of 30 lockers, compared to the monthly production of 550 lockers, indicates a significant initial ramp-up period. Comparing the outputs obtained at different time intervals, the production process needs significant setup time to reach maximum capacity.
- -
- Inadequacy of storage systems compared to production capacity: Buffer saturation, as evidenced by parameters such as the difference between inputs-outputs and a maximum processing time, clearly shows that storage systems are undersized compared to production outputs.
- -
- Inefficiencies in the production process and bottle necks: The idle and blocked state of the machines shows the inefficiency of the process. In particular, the significant percentage of blocking of the machines preceding the welding and adjusting machines, which instead turn out to be 80% busy in the simulation, identify these as bottlenecks in the process. In fact, a study of the model input data shows that these take about an hour to run, a significant amount of time compared to the rest of the process activities, which are around 20 min.
4.8. What-If Analysis
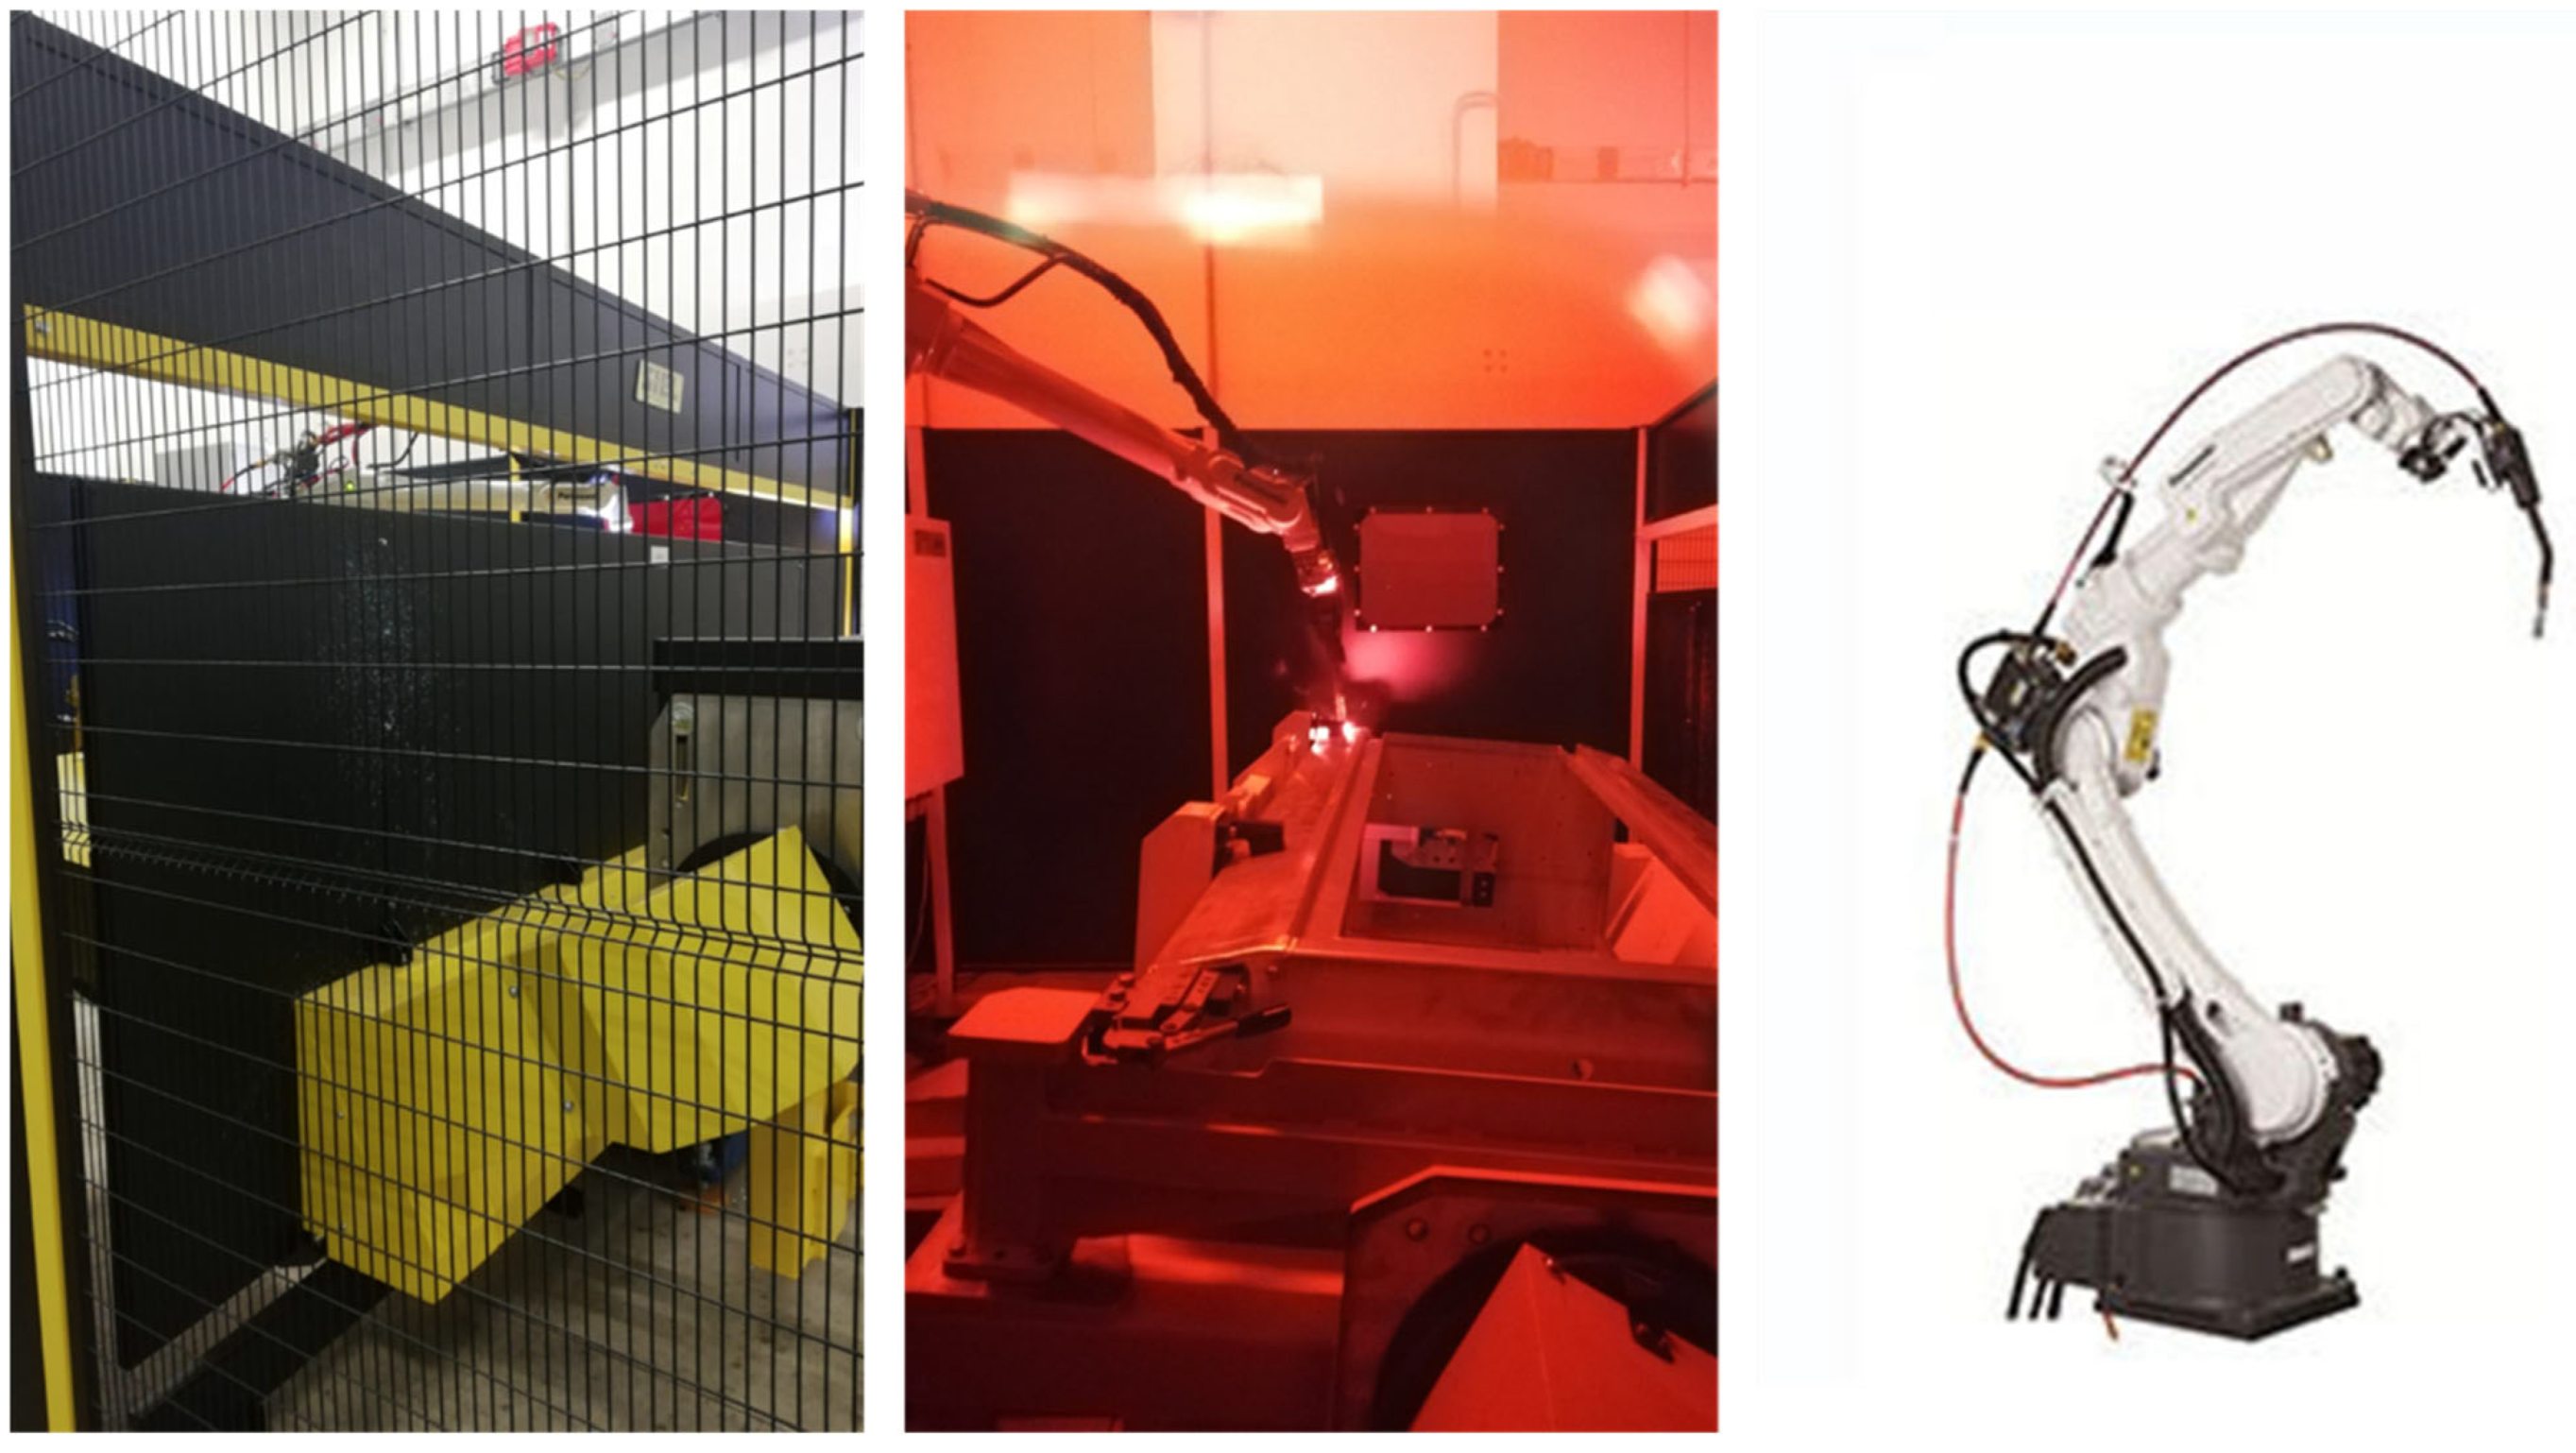
- SCENARIO 1 (S1): 30% increase in accumulation systems, implementation of an automated welding robot with a 12 min run time and an adjustment system with a 15 min run time.
- SCENARIO 2 (S2): There was a 40% increase in accumulation systems, implementation of an automated welding robot with an execution time of 12 min and an adjustment system with an execution time of 15 min.
5. Future Developments
6. Conclusions
- Theoretical contribution
- Enterprise contribution
- Limitations of the study
- Future Perspectives
Author Contributions
Funding
Data Availability Statement
Conflicts of Interest
Abbreviations
| DES | Discrete event simulation |
| KET | Key Enabling Technology |
| CAGR | Compound Annual Growth Rate |
| DEDS | Discrete Event Dynamic System |
| GPSS | General Purpose Simulation System |
| IoT | Internet of Things |
| KPIs | Key Performance Indicators |
| PCBA | Printed Circuit Board Manufacturing |
| TA | Throughput Accounting |
| DM | Decision-making |
| AI | Artificial intelligence |
| DT | Digital Twin |
| LM | Lean Manufacturing |
| KPIs | Key Performance Indicators |
| WIP | Work in Process |
| AM | Additive Production |
| XAI | Explainable Artificial Intelligence |
| CLD | Chord Length Distribution |
References
- Erkan, E.F.; Uygun, Ö.; Kiraz, A.; Canpolat, O. An integrated Fuzzy DEMATEL and Fuzzy Cognitive Maps approach for the assessing of the Industry 4.0 Model. J. Eng. Res. 2023, 11, 236–251. [Google Scholar] [CrossRef]
- Wang, H.; Jiao, S.; Bu, K.; Wang, Y.; Wang, Y. Digital Transformation and Manufacturing Companies’ ESG Responsibility Performance. Financ. Res. Lett. 2023, 58, 104370. [Google Scholar] [CrossRef]
- Llopis-Albert, C.; Rubio, F.; Valero, F. Impact of digital transformation on the automotive industry. Technol. Forecast. Soc. Chang. 2021, 162, 120343. [Google Scholar] [CrossRef] [PubMed]
- Chinnathai, M.K.; Alkan, B. A digital life-cycle management framework for sustainable smart manufacturing in energy intensive industries. J. Clean. Prod. 2023, 419, 138259. [Google Scholar] [CrossRef]
- Narula, S.; Kumar, A.; Prakash, S.; Dwivedy, M.; Puppala, H.; Talwar, V. Modelling and Analysis of Challenges for Industry 4.0 Implementation in Medical Device Industry to Post COVID-19 Scenario. Int. J. Supply Oper. Manag. 2023, 10, 117–135. [Google Scholar]
- Jena, A.; Patel, S.K. A hybrid fuzzy based approach for industry 4.0 framework implementation strategy and its sustainability in Indian automotive industry. J. Clean. Prod. 2023, 420, 138369. [Google Scholar] [CrossRef]
- De Felice, F.; De Luca, C.; Baffo, I.; Travaglioni, M.; Forcina, A.; Petrillo, A. Simulation Optimization for a Flexible Production Process Under Uncertain Factors. XXVII Summer School Francesco Turco. Proceedings. 2022. Available online: https://www.summerschool-aidi.it/images/papers/session_8_2022/ID_054.pdf (accessed on 20 May 2025).
- Uygun, Ö.; Aydin, M.E. Digital transformation: Industry 4.0 for future minds and future society. Comput. Ind. Eng. 2021, 157, 107362. [Google Scholar] [CrossRef]
- Ghobakhloo, M.; Iranmanesh, M. Digital transformation success under Industry 4.0: A strategic guideline for manufacturing SMEs. J. Manuf. Technol. Manag. 2021, 32, 1533–1556. [Google Scholar] [CrossRef]
- Rocha, C.; Quandt, C.; Deschamps, F.; Philbin, S.; Cruzara, G. Collaborations for digital transformation: Case studies of industry 4.0 in Brazil. IEEE Trans. Eng. Manag. 2021, 70, 2404–2418. [Google Scholar] [CrossRef]
- Mantravadi, S.; Srai, J.S.; Møller, C. Application of MES/MOM for Industry 4.0 supply chains: A cross-case analysis. Comput. Ind. 2023, 148, 103907. [Google Scholar] [CrossRef]
- Pour, P.D.; Ahmed, A.A.; Nazzal, M.A.; Darras, B.M. An Industry 4.0 Technology Selection Framework for Manufacturing Systems and Firms Using Fuzzy AHP and Fuzzy TOPSIS Methods. Systems 2023, 11, 192. [Google Scholar] [CrossRef]
- De Felice, F.; De Luca, C.; Guadalupi, E.; Petrillo, A. Towards a Smart Factory: An integrated approach based on Simulation and AHP. In Proceedings of the 21st International Conference on Modelling and Applied Simulation, Rome, Italy, 19–21 September 2022. [Google Scholar]
- Lissassi, K.C.; Dossou, P.E.; Sabourin, C. Using Computer Vision to Improve SME Performance. In International Conference on Flexible Automation and Intelligent Manufacturing; Springer Nature: Cham, Switzerland, 2023; pp. 107–116. [Google Scholar]
- Caiza, G.; Sanz, R. Digital Twin to Control and Monitor an Industrial Cyber-Physical Environment Supported by Augmented Reality. Appl. Sci. 2023, 13, 7503. [Google Scholar] [CrossRef]
- Honorato, C.; de Melo FC, L. Industry 4.0: The case-study of a global supply chain company. J. Ind. Integr. Manag. 2023, 8, 131–148. [Google Scholar] [CrossRef]
- Scrivano, S.; Tan, B.; Tolio, T. Continuous-flow simulation of manufacturing systems with assembly/disassembly machines, multiple loops and general layout. J. Manuf. Syst. 2023, 69, 103–118. [Google Scholar] [CrossRef]
- Adane, T.F.; Bianchi, M.F.; Archenti, A.; Nicolescu, M. Application of system dynamics for analysis of performance of manufacturing systems. J. Manuf. Syst. 2019, 53, 212–233. [Google Scholar] [CrossRef]
- Zúñiga, E.R.; Yasue, N.; Hirose, T.; Nomoto, H.; Sawaragi, T. An Integrated discrete-event simulation with functional resonance analysis and work domain analysis methods for industry 4.0 implementation. Decis. Anal. J. 2023, 9, 100323. [Google Scholar] [CrossRef]
- Smith, Z.B. Digital Twin: Factory Discrete Event Simulation. Ph.D. Thesis, Purdue University, West Lafayette, IN, USA, 2019. [Google Scholar]
- Agalianos, K.; Ponis, S.T.; Aretoulaki, E.; Plakas, G.; Efthymiou, O. Discrete event simulation and digital twins: Review and challenges for logistics. Procedia Manuf. 2020, 51, 1636–1641. [Google Scholar] [CrossRef]
- Banks, J. Discrete Event System Simulation. Pearson Education India. 2005. Available online: https://www.amazon.com/Discrete-Event-System-Simulation-Jerry-Banks/dp/0131446797# (accessed on 20 May 2025).
- Monek, G.D.; Fischer, S. DES and IIoT fusion approach towards real-time synchronization of physical and digital components in manufacturing processes. Rep. Mech. Eng. 2023, 4, 161–174. [Google Scholar] [CrossRef]
- Knapčíková, L.; Behúnová, A.; Behún, M. Using a discrete event simulation as an effective method applied in the production of recycled material. Adv. Prod. Eng. Manag. 2020, 15, 431–440. [Google Scholar]
- de Oliveira, A.B.; Micosky, A.L.; dos Santos, C.F.; de Freitas Rocha Loures, E.; Santos, E.A.P. A Hybrid Model to Support Decision Making in Manufacturing. In International Conference on Flexible Automation and Intelligent Manufacturing; Springer Nature: Cham, Switzerland, 2023; pp. 651–658. [Google Scholar]
- Lafortune, S.; Lin, F.; Hadjicostis, C.N. On the history of diagnosability and opacity in discrete event systems. Annu. Rev. Control 2018, 45, 257–266. [Google Scholar] [CrossRef]
- Van Volsem, S.; Dullaert, W.; Van Landeghem, H. An evolutionary algorithm and discrete event simulation for optimizing inspection strategies for multi-stage processes. Eur. J. Oper. Res. 2007, 179, 621–633. [Google Scholar] [CrossRef]
- Babulak, E.; Wang, M. Discrete event simulation. In Aitor Goti (Hg.): Discrete Event Simulations; Sciyo: Rijeka, Kroatien, 2010; p. 1. [Google Scholar]
- Wonham, W.M.; Cai, K.; Rudie, K. Supervisory control of discrete-event systems: A brief history. Annu. Rev. Control 2018, 45, 250–256. [Google Scholar] [CrossRef]
- Cai, K.; Zhang, R.; Wonham, W.M. On relative observability of discrete-event systems. In Proceedings of the 52nd IEEE Conference on Decision and Control, Firenze, Italy, 10–13 December 2013; IEEE: Piscataway, NJ, USA, 2013; pp. 7285–7290. [Google Scholar]
- Ortíz, M.A.; Betancourt, L.E.; Negrete, K.P.; De Felice, F.; Petrillo, A. Dispatching algorithm for production programming of flexible job-shop systems in the smart factory industry. Ann. Oper. Res. 2018, 264, 409–433. [Google Scholar] [CrossRef]
- Goodall, P.; Sharpe, R.; West, A. A data-driven simulation to support remanufacturing operations. Comput. Ind. 2019, 105, 48–60. [Google Scholar] [CrossRef]
- Geraldes, C.A.; Setti, F.K.; Almeida, J.P. Improving the Production Process of a Bakery: A Simulation Approach. In International Conference on Flexible Automation and Intelligent Manufacturing; Springer Nature: Cham, Switzerland, 2023; pp. 128–135. [Google Scholar]
- Ata, M.; Corum, A. The Impact of Return Disposal on Order Variance in a Hybrid Manufacturing and Remanufacturing System. IEEE Trans. Eng. Manag. 2021, 70, 2574–2583. [Google Scholar] [CrossRef]
- Leon, J.F.; Li, Y.; Peyman, M.; Calvet, L.; Juan, A.A. A Discrete-Event Simheuristic for Solving a Realistic Storage Location Assignment Problem. Mathematics 2023, 11, 1577. [Google Scholar] [CrossRef]
- Amico, C.; Cigolini, R. Improving port supply chain through blockchain-based bills of lading: A quantitative approach and a case study. Marit. Econ. Logist. 2023, 26, 74–104. [Google Scholar] [CrossRef]
- Nogueira, G.P.M.; de Assis Rangel, J.J.; Croce, P.R.; Peixoto, T.A. The environmental impact of fast delivery B2C e-commerce in outbound logistics operations: A simulation approach. Clean. Logist. Supply Chain. 2022, 5, 100070. [Google Scholar] [CrossRef]
- Qureshi, S.M.; Greig, M.A.; Bookey-Bassett, S.; Purdy, N.; Kelly, H.; Neumann, W.P. Computer simulation as a macroergonomic approach to assessing nurse workload and biomechanics related to COVID19patient care. Appl. Ergon. 2024, 114, 104124. [Google Scholar] [CrossRef]
- Ortiz-Barrios, M.; Alfaro-Saiz, J.J. An integrated approach for designing in-time and economically sustainable emergency care networks: A case study in the public sector. PLoS ONE 2020, 15, e0234984. [Google Scholar] [CrossRef]
- Bera, S.; Kumar, P.; Bhattacharya, S. A study on how to achieve flexibility in healthcare process: A simulation-based approach. Int. J. Product. Perform. Manag. 2022, 72, 2292–2316. [Google Scholar] [CrossRef]
- Belcore, O.M.; Di Gangi, M.; Polimeni, A. Connected Vehicles and Digital Infrastructures: A Framework for Assessing the Port Efficiency. Sustainability 2023, 15, 8168. [Google Scholar] [CrossRef]
- Neagoe, M.; Hvolby, H.H.; Taskhiri, M.S.; Turner, P. Using discrete-event simulation to compare congestion management initiatives at a port terminal. Simul. Model. Pract. Theory 2021, 112, 102362. [Google Scholar] [CrossRef]
- Gaied, M.; Lefebvre, D.; M’halla, A.; Othmen, K.B. Modelling and performance evaluation of railway transport systems using P-timed petri nets. In Proceedings of the 2018 5th International Conference on Control, Decision and Information Technologies (Codit), Thessaloniki, Greece, 10–13 April 2018; IEEE: Piscataway, NJ, USA, 2018; pp. 841–846. [Google Scholar]
- Mittal, S.; Martín, J.L.R. Netcentric System of Systems Engineering with DEVS Unified Process; CRC Press: Boca Raton, FL, USA, 2013. [Google Scholar]
- Wirthlin, J.R.; Houston, D.X.; Madachy, R.J. Defense acquisition system simulation studies. In Proceedings of the 2011 International Conference on Software and Systems Process, Honolulu, HI, USA, 21–22 May 2011; pp. 189–193. [Google Scholar]
- Eswaran, S.; Misra, A.; La Porta, T.; Leung, K. Addressing practical challenges in utility optimization of mobile wireless sensor networks. In Defense Transformation and Net-Centric Systems; SPIE: St Bellingham, WA, USA, 2008; Volume 6981, pp. 83–93. [Google Scholar]
- Collins, A.J.; Sabz Ali Pour, F.; Jordan, C.A. Past challenges and the future of discrete event simulation. J. Def. Model. Simul. 2023, 20, 351–369. [Google Scholar] [CrossRef]
- Robinson, S. Modelling without queues: Adapting discrete-event simulation for service operations. J. Simul. 2015, 9, 195–205. [Google Scholar] [CrossRef]
- Chackelson, C.; Errasti, A.; Ciprés, D.; Lahoz, F. Evaluating order picking performance trade-offs by configuring main operating strategies in a retail distributor: A Design of Experiments approach. Int. J. Prod. Res. 2013, 51, 6097–6109. [Google Scholar] [CrossRef]
- Dupont, A.; Hayel, Y.; Jiménez, T.; Beaude, O.; Breal, J.B. A loss queueing game for electric vehicle charging performance evaluation. Perform. Eval. 2023, 161, 102350. [Google Scholar] [CrossRef]
- Wallander, E.; Frank, B.; Alaküla, M.; Márquez-Fernández, F.J. Electric off-road mobile machinery systems with portable energy supply and local energy generation. In Proceedings of the 2023 IEEE Belgrade PowerTech, Belgrade, Serbia, 25–29 June 2023; IEEE: Piscataway, NJ, USA, 2023; pp. 1–6. [Google Scholar]
- Manohar, P.; Atla, C.R. Development of predictive reliability model of solar photovoltaic system using stochastic diffusion process for distribution system. IEEE J. Emerg. Sel. Top. Circuits Syst. 2022, 12, 279–289. [Google Scholar] [CrossRef]
- Sarremejane, R.; Stubbington, R.; England, J.; Sefton, C.E.; Eastman, M.; Parry, S.; Ruhi, A. Drought effects on invertebrate metapopulation dynamics and quasi- extinction risk in an intermittent river network. Glob. Change Biol. 2021, 27, 4024–4039. [Google Scholar] [CrossRef]
- Tao, J.; Yu, S. Product life cycle design for sustainable value creation: Methods of sustainable product development in the context of high value engineering. Procedia CIRP 2018, 69, 25–30. [Google Scholar] [CrossRef]
- Quesnel, G.; Akplogan, M.; Bonneau, M.; Martin-Clouaire, R.; Peyrard, N.; Rellier, J.P.; Sabbadin, R.; Trépos, R. Decision in agroecosystems advanced modelling techniques studying global changes in environmental sciences. In Developments in Environmental Modelling; Elsevier: Amsterdam, The Netherlands, 2015; Volume 27, pp. 217–245. [Google Scholar]
- Roci, M.; Salehi, N.; Amir, S.; Shoaib-ul-Hasan, S.; Asif, F.M.; Mihelič, A.; Rashid, A. Towards circular manufacturing systems implementation: A complex adaptive systems perspective using modelling and simulation as a quantitative analysis tool. Sustain. Prod. Consum. 2022, 31, 97–112. [Google Scholar] [CrossRef]
- Adeoti, A.O.; Demir, E.; Adeyemi, S.; Yakutcan, U.; Kengne, A.P.; Kayode, G.; Aliyu, A.; Idika, N.; Isichei, C. Impact of pre-exposure and post-exposure prophylaxes prevention programme on HIV burden and services in a low-resource setting: A simulation modelling approach. Pan Afr. Med. J. 2021, 40, 40–57. [Google Scholar] [CrossRef] [PubMed]
- Lee, Y.M.; An, L.; Bagchi, S.; Connors, D.; Kapoor, S.; Katircioglu, K.; Wang, W.; Xu, J. Discrete event simulation modeling of resource planning and service order execution for service businesses. In Proceedings of the 2007 Winter Simulation Conference, Washington, DC, USA, 9–12 December 2007; IEEE: Piscataway, NJ, USA, 2007; pp. 2227–2233. [Google Scholar]
- Padilla, J.J.; Lynch, C.J.; Diallo, S.Y.; Gore, R.J.; Barraco, A.; Kavak, H.; Jenkins, B. Using simulation games for teaching and learning discrete-event simulation. In Proceedings of the 2016 Winter Simulation Conference (WSC), Washington, DC, USA, 11–14 December 2016; IEEE: Piscataway, NJ, USA, 2016; pp. 3375–3384. [Google Scholar]
- Swain, J.J. ‘Gaming’ reality: Biennial survey of discrete-event simulation software tools. OR/MS Today 2005, 32, 44–56. [Google Scholar]
- Sarker, I.H. Deep learning: A comprehensive overview on techniques, taxonomy, applications and research directions. SN Comput. Sci. 2021, 2, 420. [Google Scholar] [CrossRef] [PubMed]
- Furterer, S.L.; Schneider, K.; Key, M.B.; Zalewski, D.; Laudenberger, M. Implementing lean six sigma and discrete-event simulation for tutoring operations in higher education institutions. Int. J. Lean Six Sigma 2019, 10, 909–927. [Google Scholar] [CrossRef]
- Qureshi, S.M.; Purdy, N.; Mohani, A.; Neumann, W.P. Predicting the effect of nurse–patient ratio on nurse workload and care quality using discrete event simulation. J. Nurs. Manag. 2019, 27, 971–980. [Google Scholar] [CrossRef]
- Kumar, D.T.S. Data mining based marketing decision support system using hybrid machine learning algorithm. J. Artif. Intell. Capsul. Netw. 2020, 2, 185–193. [Google Scholar]
- Pourzolfaghar, Z.; Bastidas, V.; Helfert, M. Standardisation of enterprise architecture development for smart cities. J. Knowl. Econ. 2020, 11, 1336–1357. [Google Scholar] [CrossRef]
- Brambilla, G.; Picone, M.; Cirani, S.; Amoretti, M.; Zanichelli, F. A simulation platform for large-scale internet of things scenarios in urban environments. In Proceedings of the First International Conference on IoT in Urban Space, Rome, Italy, 27–28 October 2014; pp. 50–55. [Google Scholar]
- Xu, W.; Liu, X.; Wang, H.; Zhou, Y. Event-triggered adaptive NN tracking control for MIMO nonlinear discrete-time systems. IEEE Trans. Neural Netw. Learn. Syst. 2021, 33, 7414–7424. [Google Scholar] [CrossRef]
- Lyubchenko, A.A.; Kopytov, E.Y.; Bogdanov, A.A.; Maystrenko, V.A. Discrete-event simulation of operation and maintenance of telecommunication equipment using AnyLogic-based multi-state models. J. Phys. Conf. Ser. 2020, 1441, 012046. [Google Scholar] [CrossRef]
- Alves, M.V.; Basilio, J.C. State estimation and detectability of networked discrete event systems with multi-channel communication networks. In Proceedings of the 2019 American control conference (ACC), Philadelphia, PA, USA, 10–12 July 2019; IEEE: Piscataway, NJ, USA, 2019; pp. 5602–5607. [Google Scholar]
- Abideen, A.; Mohamad, F.B. Improving the performance of a Malaysian pharmaceutical warehouse supply chain by integrating value stream mapping and discrete event simulation. J. Model. Manag. 2021, 16, 70–102. [Google Scholar] [CrossRef]
- Mortier, S.T.F.; Gernaey, K.V.; De Beer, T.; Nopens, I. Development of a population balance model of a pharmaceutical drying process and testing of solution methods. Comput. Chem. Eng. 2013, 50, 39–53. [Google Scholar] [CrossRef]
- Kim, S.H.; Jackson, A.J.; Hur, R.; Hunt, C.A. Individualized, discrete event, simulations provide insight into inter- and intra-subject variability of extended-release, drug products. Theor. Biol. Med. Model. 2012, 9, 39. [Google Scholar] [CrossRef]
- Massaro Tieze, S.; Liddell, L.C.; Santa Maria, S.R.; Bhattacharya, S. BioSentinel: A biological CubeSat for deep space exploration. Astrobiology 2023, 23, 631–636. [Google Scholar] [CrossRef] [PubMed]
- Cerro, J.A.; Latorella, K.; Simon, M.A.; Watson, J.; Albertson, C.; Le Boffe, V. Development of Logistics for Building Radiation Storm Shelters and their Operational Evaluation. In Proceedings of the AIAA SPACE 2015 Conference and Exposition, Pasadena, CA, USA, 31 August–2 September 2015; American Institute of Aeronautics and Astronautics: Pasadena, CA, USA, 2015; p. 4402. [Google Scholar]
- Cates, G.; Stromgren, C.; Cirillo, W.; Goodliff, K. Launch and assembly reliability analysis for Mars human space exploration missions. In Proceedings of the 2013 IEEE Aerospace Conference, Big Sky, MT, USA, 2–9 March 2013; IEEE: Piscataway, NJ, USA, 2013; pp. 1–20. [Google Scholar]
- Canpolat, O.; Demir, H.I.; Erden, C. Integrated Process Planning, Scheduling, Due-Date Assignment and Delivery Using Simulated Annealing and Evolutionary Strategies. In International Symposium on Intelligent Manufacturing and Service Systems; Lecture Notes in Mechanical Engineering; Springer Nature: Singapore, 2024; pp. 388–401. [Google Scholar]
- Sakr, A.H.; Aboelhassan, A.; Yacout, S.; Bassetto, S. Simulation and deep reinforcement learning for adaptive dispatching in semiconductor manufacturing systems. J. Intell. Manuf. 2023, 34, 1311–1324. [Google Scholar] [CrossRef]
- Wolf, R.; Lepratti, R. (Eds.) Smart Digital Manufacturing: A Guide for Digital Transformation with Real Case Studies Across Industries; John Wiley & Sons: Hoboken, NJ, USA, 2020. [Google Scholar]
- Newton, M. A strategic Guide to Digital Transformation in Industrial Manufacturing; White Paper; AVEVA Group plc.: Cambridge, UK, 2018. [Google Scholar]
- Liere-Netheler, K.; Packmohr, S.; Vogelsang, K. Drivers of Digital Transformation in Manufacturing. 2018. Available online: https://www.researchgate.net/publication/323381114_Drivers_of_Digital_Transformation_in_Manufacturing (accessed on 20 May 2025).
- Matt, D.T.; Rauch, E. SME 4.0: The role of small-and medium-sized enterprises in the digital transformation. In Industry 4.0 for SMEs: Challenges, Opportunities and Requirements; Springer International Publishing: Cham, Switzerland, 2020; pp. 3–36. [Google Scholar]
- Palade, D.; Møller, C. Guiding Digital Transformation in SMEs. Manag. Prod. Eng. Rev. 2023, 14, 14–25. [Google Scholar] [CrossRef]
- Raoa, S. Assembly Cell Automation Selection: A Simulation-Based Exploratory Evaluation. In SPS2022: Proceedings of the 10th Swedish Production Symposium; IOS Press: Amsterdam, The Netherlands, 2022; Volume 21, p. 415. [Google Scholar]
- Amjath, M.; Kerbache, L.; Smith, J.M.; Elomri, A. Optimisation of Buffer Allocations in Manufacturing Systems: A Study on Intra and Outbound Logistics Systems Using Finite Queueing Networks. Appl. Sci. 2023, 13, 9525. [Google Scholar] [CrossRef]
- Jayabalan, L.; Mustapha, M.; Mokhtar, A.A. Discrete Event Simulation modelling as an improvement validation tool on Printed Circuit Board Mechanical Assembly process. ARPN J. Eng. Appl. Sci. 2023, 18, 1078–1088. [Google Scholar]
- Jurczyk-Bunkowska, M. Tactical manufacturing capacity planning based on discrete event simulation and throughput accounting: A case study of medium sized production enterprise. Adv. Prod. Eng. Manag. 2021, 16, 335–347. [Google Scholar] [CrossRef]
- Zhang, X. Application of discrete event simulation in health care: A systematic review. BMC Health Serv. Res. 2018, 18, 687. [Google Scholar] [CrossRef]
- Pattanaik, L.N. Simulation optimization of manufacturing takt time for a leagile supply chain with a de-coupling point. Int. J. Ind. Eng. Manag. 2021, 12, 102–114. [Google Scholar] [CrossRef]
- Doneda, M.; Yalçındağ, S.; Marques, I.; Lanzarone, E. A discrete-event simulation model for analysing and improving operations in a blood donation centre. Vox Sang. 2021, 116, 1060–1075. [Google Scholar] [CrossRef]
- Alzraiee, H.; Zayed, T.; Moselhi, O. Methodology for synchronizing discrete event simulation and system dynamics models. In Proceedings of the 2012 Winter Simulation Conference (WSC), Berlin, Germany, 9–12 December 2012; IEEE: Piscataway, NJ, USA, 2012; pp. 1–11. [Google Scholar]
- Van Ooteghem, J.; Verbrugge, S.; Casier, K.; Casier, G. Application of a Discrete Event Simulator for Healthcare Processes. In Proceedings of the BMSD 2015-Proceedings of the 5th International Symposium on Business Modeling and Software Design, Milan, Italy, 6–8 July 2015. [Google Scholar]
- Hoad, K.; Kunc, M. Teaching system dynamics and discrete event simulation together: A case study. J. Oper. Res. Soc. 2018, 69, 517–527. [Google Scholar] [CrossRef]
- Wainer, G.A. Discrete-Event Modeling and Simulation: A Practitioner’s Approach; CRC Press: Boca Raton, FL, USA, 2017. [Google Scholar]
- Alfieri, A.; Matta, A. Mathematical programming time-based decomposition algorithm for discrete event simulation. Eur. J. Oper. Res. 2013, 231, 557–566. [Google Scholar] [CrossRef]
- Castro, P.M.; Aguirre, A.M.; Zeballos, L.J.; Méndez, C.A. Hybrid mathematical programming discrete-event simulation approach for large-scale scheduling problems. Ind. Eng. Chem. Res. 2011, 50, 10665–10680. [Google Scholar] [CrossRef]
- Al-Aomar, R.; Williams, E.J.; Ulgen, O.M. Process Simulation Using Witness; John Wiley & Sons: Hoboken, NJ, USA, 2015. [Google Scholar]
- Prajapat, N.; Turner, C.; Tiwari, A.; Tiwari, D.; Hutabarat, W. Real-time discrete event simulation: A framework for an intelligent expert system approach utilising decision trees. Int. J. Adv. Manuf. Technol. 2020, 110, 2893–2911. [Google Scholar] [CrossRef]
- Corro Ramos, I.; Hoogendoorn, M.; Rutten-van Mölken, M.P. How to address uncertainty in health economic discrete-event simulation models: An illustration for chronic obstructive pulmonary disease. Med. Decis. Mak. 2020, 40, 619–632. [Google Scholar] [CrossRef]
- Durão, L.F.C.; Haag, S.; Anderl, R.; Schützer, K.; Zancul, E. Digital twin requirements in the context of industry 4.0. In Product Lifecycle Management to Support Industry 4.0: 15th IFIP WG 5.1 International Conference, PLM 2018, Turin, Italy, July 2–4, 2018, Proceedings 15; Springer International Publishing: Berlin/Heidelberg, Germany, 2018; pp. 204–214. [Google Scholar]
- Eriksson, K.; Hendberg, T. A case study initiating discrete event simulation as a tool for decision making in I4. 0 manufacturing. In Decision Support Systems XI: Decision Support Systems, Analytics and Technologies in Response to Global Crisis Management: 7th International Conference on Decision Support System Technology, ICDSST 2021, Loughborough, UK, May 26–28, 2021, Proceedings; Springer International Publishing: Berlin/Heidelberg, Germany, 2021; pp. 84–96. [Google Scholar]
- Jurczyk-Bunkowska, M. Using discrete event simulation for planning improvement in small batch size manufacturing system. In Sustainable Production: Novel Trends in Energy, Environment and Material Systems; Springer International Publishing: Cham, Switzerland, 2020; pp. 19–43. [Google Scholar]
- Rybicka, J.; Tiwari, A.; Enticott, S. Testing a flexible manufacturing system facility production capacity through discrete event simulation: Automotive case study. Int. J. Ind. Manuf. Eng. 2016, 10, 719–723. [Google Scholar]
- Zupan, H.; Herakovic, N. Production line balancing with discrete event simulation: A case study. IFAC-Pap. 2015, 48, 2305–2311. [Google Scholar] [CrossRef]
- Liang, J.; Qiu, Y.; Liu, P.; He, P.; Mauzerall, D.L. Effects of expanding electric vehicle charging stations in California on the housing market. Nat. Sustain. 2023, 6, 549–558. [Google Scholar] [CrossRef]
- Yu, Z.; Guindani, M.; Grieco, S.F.; Chen, L.; Holmes, T.C.; Xu, X. Beyond t test and ANOVA: Applications of mixed-effects models for more rigorous statistical analysis in neuroscience research. Neuron 2022, 110, 21–35. [Google Scholar] [CrossRef] [PubMed]
- Gronau, Q.F.; Ly, A.; Wagenmakers, E.J. Informed Bayesian t-tests. Am. Stat. 2020, 74, 137–143. [Google Scholar] [CrossRef]
- Yang, Y.; Yang, Y.; Yu, M.; Zhu, X.; Du, X. Simulation and optimal solution analysis of airport check-in system. Int. J. Front. Eng. Technol. 2023, 5, 6–10. [Google Scholar]
- Yusoof, M.Y.M.; Mohamed, N.M.Z.N.; Yasir, A.S.H.M. The Assessment of Man and Method Toward the Assembly Line Improvement in Automotive Manufacturing. J. Mod. Manuf. Syst. Technol. 2023, 7, 7–14. [Google Scholar]
- Wang, J.; Li, J.; Tussey, K.; Ross, K. Reducing length of stay in emergency department: A simulation study at a community hospital. IEEE Trans. Syst. Man Cybern. Part A Syst. Hum. 2012, 42, 1314–1322. [Google Scholar] [CrossRef]
- Cardoso, J.M.; Leitão, P.; Geraldes, C.A. Enhancing Inventory Management Decisions in a Bakery: A Case Study. In International Conference on Flexible Automation and Intelligent Manufacturing; Springer Nature: Cham, Switzerland, 2023; pp. 1049–1056. [Google Scholar]
- Gunreddy, N.; Gupta, I.; Poddar, I.; Menon, A.P.; Srivastava, R.; Saxena, A.K. Bottleneck analysis for gear manufacturing unit by using discrete event simulation using ARENA. In AIP Conference Proceedings; AIP Publishing: Melville, NY, USA, 2022; Volume 2653. [Google Scholar]
- Turner, C.J.; Garn, W. Next generation DES simulation: A research agenda for human centric manufacturing systems. J. Ind. Inf. Integr. 2022, 28, 100354. [Google Scholar] [CrossRef]
- Abdulnour, S.; Baril, C.; Abdulnour, G.; Gamache, S. Implementation of industry 4.0 principles and tools: Simulation and case study in a manufacturing SME. Sustainability 2022, 14, 6336. [Google Scholar] [CrossRef]
- Hussain, A.; Munive-Hernandez, J.E.; Campean, F. Lean Approach in a High Mix, Low Volume Manufacturing Environment-case Study. 2020. Available online: https://bradscholars.brad.ac.uk/entities/publication/34e7f5f9-9231-46d4-b18c-0b1e2ebdd2ac (accessed on 20 May 2025).
- Huynh, B.H.; Akhtar, H.; Li, W. Discrete event simulation for manufacturing performance management and optimization: A case study for model factory. In Proceedings of the 2020 9th International Conference on Industrial Technology and Management (ICITM), Oxford, UK, 11–13 February 2020; IEEE: Piscataway, NJ, USA, 2020; pp. 16–20. [Google Scholar]
- Florescu, A.; Barabas, S.A. Modeling and simulation of a flexible manufacturing system—A basic component of industry 4.0. Appl. Sci. 2020, 10, 8300. [Google Scholar] [CrossRef]
- Koulouris, A.; Misailidis, N.; Petrides, D. Applications of process and digital twin models for production simulation and scheduling in the manufacturing of food ingredients and products. Food Bioprod. Process. 2021, 126, 317–333. [Google Scholar] [CrossRef]
- Guzman-Moratto, H.; Uribe-Martes, C.; Neira-Rodado, D. Improving productivity using simulation: Case study of a mattress manufacturing process. Procedia Comput. Sci. 2022, 198, 650–655. [Google Scholar] [CrossRef]
- Glatt, M.; Sinnwell, C.; Yi, L.; Donohoe, S.; Ravani, B.; Aurich, J.C. Modeling and implementation of a digital twin of material flows based on physics simulation. J. Manuf. Syst. 2021, 58, 231–245. [Google Scholar] [CrossRef]
- Antonini, L.; Poletti, G.; Pennati, G.; Petrini, L. A review on the use of finite element simulations for structural analyses of coronary stenting: What can we do nowadays and what do we need to move forward? Eur. J. Mech. A/Solids 2023, 101, 105071. [Google Scholar] [CrossRef]
- Kumbhar, M.; Ng, A.H.; Bandaru, S. A digital twin based framework for detection, diagnosis, and improvement of throughput bottlenecks. J. Manuf. Syst. 2023, 66, 92–106. [Google Scholar] [CrossRef]
- Kumbhar, M.; Ng, A.H.; Bandaru, S. Bottleneck detection through data integration, process mining and factory physics-based analytics. In Proceedings of the 10th Swedish Production Symposium (SPS2022), Skövde, Sweden, 26–29 April 2022; IOS Press: Amsterdam, The Netherlands, 2022; pp. 737–748. [Google Scholar]
- Tsinarakis, G.; Sarantinoudis, N.; Arampatzis, G. A discrete process modelling and simulation methodology for industrial systems within the concept of digital twins. Appl. Sci. 2022, 12, 870. [Google Scholar] [CrossRef]
- Kipper, L.M.; Iepsen, S.; Dal Forno, A.J.; Frozza, R.; Furstenau, L.; Agnes, J.; Cossul, D. Scientific mapping to identify competencies required by industry 4.0. Technol. Soc. 2021, 64, 101454. [Google Scholar] [CrossRef]
- Sahal, R.; Breslin, J.G.; Ali, M.I. Big data and stream processing platforms for Industry 4.0 requirements mapping for a predictive maintenance use case. J. Manuf. Syst. 2020, 54, 138–151. [Google Scholar] [CrossRef]
- Alam, A.; Mohanty, A. From Bricks to Clicks: The Potential of Big Data Analytics for Revolutionizing the Information Landscape in Higher Education Sector. In International Conference on Data Management, Analytics & Innovation; Springer Nature: Singapore, 2023; pp. 721–732. [Google Scholar]
- Yu, W.; Wong, C.Y.; Chavez, R.; Jacobs, M.A. Integrating big data analytics into supply chain finance: The roles of information processing and data-driven culture. Int. J. Prod. Econ. 2021, 236, 108135. [Google Scholar] [CrossRef]
- Ortega-Gras, J.J.; Bueno-Delgado, M.V.; Cañavate-Cruzado, G.; Garrido-Lova, J. Twin transition through the implementation of industry 4.0 technologies: Desk-research analysis and practical use cases in Europe. Sustainability 2021, 13, 13601. [Google Scholar] [CrossRef]
- Bendowska, K.; Zawadzki, P. Development and Verification of a Simulation Model of an Automated Assembly Line. Appl. Sci. 2023, 13, 10142. [Google Scholar] [CrossRef]
- Eyring, A.; Hoyt, N.; Tenny, J.; Domike, R.; Hovanski, Y. Analysis of a closed-loop digital twin using discrete event simulation. Int. J. Adv. Manuf. Technol. 2022, 123, 245–258. [Google Scholar] [CrossRef]
- Ackermann, M.; Haase, C. Machine learning-based identification of interpretable process-structure linkages in metal additive manufacturing. Addit. Manuf. 2023, 71, 103585. [Google Scholar] [CrossRef]
- Haddad, Y.; Yuksek, Y.A.; Jagtap, S.; Jenkins, S.; Pagone, E.; Salonitis, K. Eco-social sustainability assessment of manufacturing systems: An LCA-based framework. Procedia CIRP 2023, 116, 312–317. [Google Scholar] [CrossRef]
- Baumer-Cardoso, M.I.; Campos, L.M.; Santos, P.P.P.; Frazzon, E.M. Simulation-based analysis of catalyzers and trade-offs in Lean & Green manufacturing. J. Clean. Prod. 2020, 242, 118411. [Google Scholar]
- Sakr, A.H.; Aboelhassan, A.; Yacout, S.; Bassetto, S. Building Discrete-Event Simulation for Digital Twin Applications in Production Systems. In Proceedings of the 2021 26th IEEE International Conference on Emerging Technologies and Factory Automation (ETFA), Vasteras, Sweden, 7–10 September 2021; IEEE: Piscataway, NJ, USA, 2021; pp. 01–08. [Google Scholar]

| Literature Gap | Goal of This Article | Impact on Industry 4.0 |
|---|---|---|
| Digital Transformation Framework | Develop a comprehensive framework guiding digital transformation in manufacturing, tailored to Industry 4.0. | Provides a roadmap for digital transition in line with emerging industrial standards. |
| Human-Centric Design Integration | Prioritize the integration of human factors in system design, enhancing the worker experience and ergonomic aspects. | Improves worker satisfaction and productivity, reducing risks of automation-related alienation. |
| Discrete-Event Simulation Application | Utilize DES to create a digital replica of the existing process, enabling detailed analysis and scenario testing. | Facilitates informed decision-making through accurate simulation and analysis. |
| Innovative Manufacturing Approaches | Design and validate innovative manufacturing approaches through what-if scenarios, leading to smart manufacturing solutions. | Enhances efficiency and adaptability in manufacturing processes. |
| Scalability Across Sectors | Demonstrate a scalable model that can be applied in various sectors, not limited to manufacturing. | Offers versatile solutions adaptable to different industries, increasing the reach of Industry 4.0 principles. |
| Balancing Technology and Humanity | Emphasize the importance of harmonizing technological advancements with human elements, ensuring a synergistic growth. | Ensures that technological progress supports and enhances human roles and experiences. |
| Test | Flow | K | p-Value | Conclusion |
|---|---|---|---|---|
| Runs Test (Randomness) | Structure | −0.573 | 0.567 | Random |
| Doors | −1.909 | 0.056 | Random | |
| Cover | −0.382 | 0.703 | Random | |
| Cabinet | −0.206 | 0.837 | Random |
| Test | Flow | F-Value | p-Value | Conclusion |
|---|---|---|---|---|
| Levene’s Test (Variance) | All Flow | 2.782 | 0.058 | Homogeneous variances |
| Kruskal–Wallis Test (Distribution) | All Flow | 7.564 | 0.056 | Homogeneous distributions |
| Test | Flow | Min Value | Max Value | p-Value | Conclusion |
|---|---|---|---|---|---|
| Kolmogorov–Smirnov Test (Uniformity) | Structure | 9 | 12 | 0.124 | Uniform |
| Doors | 5 | 10 | 0.212 | Uniform | |
| Cover | 8 | 11 | 0.748 | Uniform | |
| Cabinet | 10 | 13 | 0.424 | Uniform |
| Year 2022 | Output of Real Production | Output of Digital Model |
|---|---|---|
| January | 78 | 110 |
| February | 184 | 130 |
| March | 213 | 151 |
| April | 100 | 152 |
| May | 153 | 155 |
| June | 150 | 153 |
| July | 145 | 153 |
| August | 140 | 153 |
| September | 155 | 152 |
| October | 138 | 153 |
| November | 140 | 153 |
| December | 120 | 153 |
| Simulation Time | Output (Number of Cabinets) |
|---|---|
| One Working Day | 30 |
| One Working week | 120 |
| One Working month | 550 |
| Six Working months | 3450 |
| Name | No. Entered | No. Assembled | W.I.P. | Avg W.I.P. | Avg Time | Sigma Rating |
|---|---|---|---|---|---|---|
| Accessories | 50 | 0.000 | 50.000 | 49.971 | 457.224.350 | 0.000 |
| Alluminium_sheet | 339 | 262.000 | 77.000 | 76.866 | 103.732.245 | 6.000 |
| Base | 138 | 134.000 | 4.000 | 4.642 | 15.388.366 | 6.000 |
| Console | 184 | 134.000 | 50.000 | 50.007 | 124.335.138 | 6.000 |
| Profile | 552 | 536.000 | 16.000 | 15.965 | 13.231.583 | 6.000 |
| Roof | 134 | 134.000 | 0.000 | 0.317 | 1.081.590 | 6.000 |
| Sheet_door | 955 | 402.000 | 419.000 | 417.341 | 199.925.980 | 6.000 |
| Name | Total In | Total Out | Avg Size | Avg Time | Min Time | Max Time |
|---|---|---|---|---|---|---|
| Assemblay_Queue | 34 | 134 | 0.000 | 0.000 | 0.000 | 0.000 |
| Base_Xtig | 138 | 138 | 0.312 | 1.035.764 | 0.000 | 2.261.599 |
| Cabinet_Final | 134 | 134 | 0.000 | 0.143 | 0.000 | 5.885 |
| Leveling | 134 | 134 | 0.000 | 0.053 | 0.000 | 2.611 |
| Painting_D | 549 | 449 | 99.359 | 82.797.515 | 0.000 | 454.048.464 |
| Painting_In | 134 | 134 | 0.000 | 0.022 | 0.000 | 1.168 |
| Painting_Out | 134 | 134 | 0.000 | 1.000 | 1.000 | 1.000 |
| Queue_Insertion | 134 | 134 | 0.000 | 0.000 | 0.000 | 0.000 |
| Queue_Tf | 134 | 134 | 0.000 | 0.000 | 0.000 | 0.000 |
| Queue_Wt | 134 | 134 | 0.000 | 0.000 | 0.000 | 0.000 |
| Racker | 651 | 601 | 49.478 | 34.770.525 | 0.000 | 452.893.952 |
| Racker01 | 600 | 550 | 49.542 | 37.774.961 | 0.000 | 453.277.756 |
| Racker_Cover | 120 | 90 | 29.931 | 114.108.955 | 0.000 | 454.371.994 |
| Racker_Cover01 | 165 | 135 | 30.000 | 83.179.062 | 0.000 | 453.853.964 |
| Racker_Front | 111 | 90 | 20.976 | 86.452.493 | 0.000 | 454.294.951 |
| Racker_Front01 | 165 | 135 | 30.000 | 83.180.000 | 0.000 | 453.853.964 |
| Racker_Left | 105 | 91 | 14.024 | 61.103.115 | 0.000 | 453.889.478 |
| Racker_Left01 | 165 | 135 | 30.000 | 83.180.000 | 0.000 | 453.853.964 |
| Racker_Right | 112 | 91 | 21.020 | 85.861.002 | 0.000 | 454.098.632 |
| Racker_Right01 | 165 | 135 | 30.000 | 83.180.000 | 0.000 | 453.853.964 |
| Repair_Cabinet | 17 | 17 | 0.007 | 180.000 | 180.00 | 180.000 |
| Repair_D | 18 | 18 | 0.007 | 180.602 | 180.00 | 190.828 |
| Repair_S | 11 | 11 | 0.004 | 180.000 | 180.00 | 180.000 |
| Roof_Accessories | 50 | 0 | 49.971 | 457.224.350 | 0.000 | 457.479.370 |
| Roof_Xinsertion | 104 | 104 | 0.010 | 45.437 | 0.000 | 116.460 |
| Roof_Xtig | 134 | 134 | 0.259 | 885.210 | 0.000 | 2.231.831 |
| Storage_Structure | 134 | 134 | 0.126 | 428.535 | 0.000 | 540.141 |
| Structure_Xassembly | 134 | 134 | 0.137 | 468.667 | 0.000 | 962.199 |
| Warehouse_Base | 108 | 108 | 0.006 | 25.042 | 0.000 | 119.712 |
| Warehouse_Console | 184 | 134 | 49.99 | 124.310.91 | 121.198 | 454.590.00 |
| Warehouse_Cutting | 128 | 53 | 74.866 | 267.581.01 | 0.000 | 457.018.00 |
| Warehouse_Extraction | 212 | 212 | 0.035 | 76.160 | 0.000 | 135.026 |
| Warehouse_Profile | 0 | 0 | 0.000 | 0.000 | 0.000 | 0.000 |
| Warehouse_Roof | 104 | 104 | 0.007 | 30.619 | 0.000 | 82.941 |
| Process “as Is” | Scenario 1 | Scenario 2 | ||
|---|---|---|---|---|
| % Blocked | Preparation_Roof | 45% | 41% | 25% |
| Laser_Cutting | 56% | 41% | 23% | |
| Inserts | 57% | 45% | 28% | |
| Fold | 58% | 46% | 27% | |
| Extraction | 58% | 49% | 26% | |
| % Idle | Online_Testing | 43% | 36% | 33% |
| Insertion_of_componets | 45% | 39% | 31% | |
| Testing | 43% | 33% | 32% | |
| Testing3 | 45% | 35% | 28% | |
| Storage | 45% | 41% | 29% | |
| Packaging | 50% | 44% | 37% | |
| Assembly | 50% | 46% | 36% | |
| Number of cabinets manufactured | 130 | 158 | 220 |
| Technologies | Opportunities and Challenges | Main Reference | Application |
|---|---|---|---|
| IoT and Data analysis | The integration of simulation approaches with IoT devices enables the collection of real-time data from sensors and machines in an industrial context. These data are subsequently incorporated into a simulation model, with the aim of improving its accuracy and representativeness. | [130] | A comparison analysis, considering a production process as a case study, between a traditional DES model modeled on historical data and a digital DES model connected in real time to process activities through IoT systems. The results showed that the DES model with real-time data provides more accurate predictions of future performance, predicting significant changes where the correlation between input and output is not immediately apparent. |
| AI and Machine Learning | The combination of simulation approaches with AI algorithms and machine learning constitutes an advanced decision-making system. AI is used to analyze simulation results and suggest optimal changes in processes to meet ecological-environmental objectives. In parallel, machine learning models are continuously trained on simulation results and historical data to optimize process parameters and anticipate potential environmental impacts. | [131] | A data-driven framework to explore the vast design space of Additive Metal Manufacturing (AMM). The methodology provides the basis for predictively quantifying process-structure links using Machine Learning (ML) models. The application of the methodology effectively identified process-structure links in the AMM, including the scaling of microstructure data for rapid identification of process parameter combinations. |
| Life Cycle Assessment | The fusion of simulation approaches with Life Cycle Assessment (LCA) tools enable manufacturers to conduct an analysis of the environmental impact of their products throughout their lifetime. By simulating the production process and incorporating data from the life cycle assessment, industrial players can identify opportunities for eco-design, selection of alternative materials and development of strategies for recycling and proper disposal at the end of the product life cycle. | [132] | A sustainability assessment framework that combines life cycle analysis and DES to consider the perceived impact of stochastic processes and dynamic behavior in production systems, while also integrating social considerations. A study on the production of a metal component in the aerospace manufacturing sector is proposed. The research results highlight the usefulness of integrating LCA with tools that can capture and reveal the impact of the dynamic and stochastic behavior of production systems. |
| Renewable Energy Integration | Through the integration of simulation approaches with renewable energy forecasting and management tools, manufacturers can maximize the efficiency of their production schedules in accordance with the availability of clean energy sources. This synergy ensures that energy-intensive processes are planned in synchrony with periods of maximum renewable energy generation, reducing dependency on non-renewable resources and promoting environmental sustainability. | [133] | Implementing a Lean and Green (L&G) approach to assess the applicability of Lean Manufacturing (LM) tools and studying how Lean affects ecological performance in a real business case located in Brazil that manufactures PVC pipes and fittings. DES modeling is used to analyze L&G scenarios and performance. The results of the study emphasize the importance of integration with a DES model to test different scenarios, visualize results considering different levels of Kanban, and study which situation to apply, based on reality, particularly the number of acceptable configurations. |
| Digital Twin | The digital twin (DT) concept, which is a virtual replica of a physical object, can be synergistically integrated with simulation approaches to enable real-time monitoring and control of production processes. Such integration enables manufacturers to leverage digital twins to simulate the impact of process changes and respond promptly to changes in production parameters. This ensures increased operational efficiency and maintains a constant focus on ecological considerations. | [134] | A simulation model based on data and agents within a digital DT framework. The proposed approach is applied to a real semiconductor manufacturing system. Research results show that DTs go beyond traditional simulation with the help of real-time synchronization through industrial IoT technologies. Specifically, simulation supports off-line experimentation and planning, while DTs offer synchronous execution and modification. DTs help to understand “what can happen” and “what is happening” by allowing management methodologies to be thematically defined. |
Disclaimer/Publisher’s Note: The statements, opinions and data contained in all publications are solely those of the individual author(s) and contributor(s) and not of MDPI and/or the editor(s). MDPI and/or the editor(s) disclaim responsibility for any injury to people or property resulting from any ideas, methods, instructions or products referred to in the content. |
© 2025 by the authors. Licensee MDPI, Basel, Switzerland. This article is an open access article distributed under the terms and conditions of the Creative Commons Attribution (CC BY) license (https://creativecommons.org/licenses/by/4.0/).
Share and Cite
De Felice, F.; De Luca, C.; Petrillo, A.; Forcina, A.; Ortiz Barrios, M.A.; Baffo, I. The Role of Digital Transformation in Manufacturing: Discrete Event Simulation to Reshape Industrial Landscapes. Appl. Sci. 2025, 15, 6140. https://doi.org/10.3390/app15116140
De Felice F, De Luca C, Petrillo A, Forcina A, Ortiz Barrios MA, Baffo I. The Role of Digital Transformation in Manufacturing: Discrete Event Simulation to Reshape Industrial Landscapes. Applied Sciences. 2025; 15(11):6140. https://doi.org/10.3390/app15116140
Chicago/Turabian StyleDe Felice, Fabio, Cristina De Luca, Antonella Petrillo, Antonio Forcina, Miguel Angel Ortiz Barrios, and Ilaria Baffo. 2025. "The Role of Digital Transformation in Manufacturing: Discrete Event Simulation to Reshape Industrial Landscapes" Applied Sciences 15, no. 11: 6140. https://doi.org/10.3390/app15116140
APA StyleDe Felice, F., De Luca, C., Petrillo, A., Forcina, A., Ortiz Barrios, M. A., & Baffo, I. (2025). The Role of Digital Transformation in Manufacturing: Discrete Event Simulation to Reshape Industrial Landscapes. Applied Sciences, 15(11), 6140. https://doi.org/10.3390/app15116140