1. Introduction
Music plays a pivotal role in human life, transcending cultural boundaries and touching the very essence of our emotions. As such, the analysis of music theory and structure has long been a subject of intense interest for both academia and the music industry. With the rapid advancements in computer science, a new interdisciplinary field has emerged: music information retrieval (MIR). This innovative domain focuses on developing computational methods to extract meaningful information from music, bridging the gap between artistic expression and data-driven insights [
1,
2,
3,
4,
5,
6,
7].
The quest to understand the intricate structure of music has captivated scholars and musicians for centuries [
8,
9]. While human perception effortlessly navigates the layers of musical organization, deconstructing this hierarchical complexity into a quantifiable framework remains a formidable challenge [
10,
11,
12,
13]. The importance of addressing this challenge is becoming increasingly evident in the field of MIR as researchers strive to create algorithms that can analyze, interpret, and even generate music with a level of understanding that approaches human expertise.
Music structure analysis, a crucial aspect of MIR, aims to uncover the hierarchical organization of musical compositions, revealing the relationships between individual notes, phrases, sections, and the overall form [
14,
15,
16,
17]. Understanding this structure is essential for various applications, including feature extraction, data compression, and interpretation.
Structural analysis of music not only enhances our comprehension of musical compositions but also plays a vital role in preserving the continuity and integrity of music. By dissecting the architecture of a piece, we gain insights into how individual elements contribute to the whole, leading to a deeper appreciation and more effective interpretation. Symbolic music, represented through notations or sheet music, provides explicit information about the musical parameters, making it a rich resource for computational analysis [
7,
13,
18]. Our research concentrates on the structural analysis of symbolic music, particularly at the score level. We aim to develop a model that can effectively analyze the hierarchical organization of musical compositions, focusing on rhythmic patterns and their significance in shaping the overall structure, and the results can be visualized in a tree structure with layers of segmentations at different levels (e.g., phrases and segments). This approach allows for a more nuanced understanding of the relationships between different musical elements, facilitating a deeper exploration of the music’s structural intricacies.
Despite its potential, there is a relative scarcity of research focused on computer-based structural analysis of music scores. Existing studies predominantly revolve around audio signal processing or employ similarity measures to extract structural information [
19,
20,
21,
22]. Methods based on similarity measures often analyze patterns and repetitions within the music by comparing segments for melodic, harmonic, or rhythmic likeness. While these approaches have yielded valuable insights, they tend to focus on surface-level similarities and may not fully capture the hierarchical and functional relationships inherent in the musical score.
Audio signal-based analyses leverage features extracted directly from sound recordings, such as timbre, loudness, and pitch [
23,
24,
25]. These methods are effective in segmenting music into broad sections like verses and choruses but can struggle with the nuanced details present in complex compositions. The reliance on audio data also introduces challenges related to noise, recording quality, and performance variations, which can affect the accuracy of the analysis. In addition, symbolized data are more concise, better able to explore information about the nature of musical structures, and the results are more interpretable.
The limitations of current methods highlight a gap in the field: the need for robust computational models that can perform detailed structural analysis directly on symbolic music data. Such models would allow for a more precise examination of the musical hierarchy, capturing both macro and micro-level structures without the ambiguities introduced by audio signal processing. Addressing this gap is crucial for advancing applications in MIR that require an in-depth understanding of musical form and content, such as automated composition, music recommendation systems, and educational tools for music theory.
Considering this critical need, our study introduces a fractal-driven approach to hierarchical music analysis, enabling the structural segmentation of symbolic music into organizational units such as note combinations, phrases, and larger sections. Drawing from fractal theory, the mathematical framework characterizing self-similar patterns in natural and geometric systems, we establish three interlocking research objectives: (1) to develop a fractal-informed quantification model that decodes rhythmic hierarchy through noise characteristics and attentional periodicity; (2) to formalize musicological pattern operators (Iamb, Anapest, etc.) as convolution kernels bridging theoretical rhythm analysis with computational feature extraction; (3) to architect a recursive structural parser for parsing musical compositions into hierarchical tree structures, extracting information about each phrase of the music in a downstream task.
Fractal theory is a mathematical theory that describes the “self-similarity” found in nature and geometric structures. It was proposed by mathematician Benoît Mandelbrot in the 1970s [
26]. In simple terms, a fractal is a pattern or structure in which the whole and its parts exhibit similar characteristics, with structures or patterns that resemble the whole appearing at every scale. There is a subtle connection between fractal theory and music. Music, in essence, is a temporal art form structured in time, characterized by repetition, variation, and thematic development, features that reflect the self-similarity and recursion emphasized in fractal theory. Applying fractal theory to the analysis of musical structures and organizational forms can provide new perspectives for feature extraction and analysis of musical works.
Figure 1 shows a fractal dissection diagram of musical structure. The overall structure of a musical piece, especially from the perspective of psychological attention, can be viewed as a fractal process in which each part exhibits features similar to the whole (e.g., the alternating pattern of high and low attention attraction levels shown in the diagram). By conducting fractal analysis on musical works, it is possible to reveal their inherent hierarchical structures and organizational patterns, offering new insights into the understanding and creation of music.
To address these limitations in current music structural analysis methods, our research introduces a novel quantitative model that evaluates the “rhythmic attention” of individual notes within a musical piece. This model is grounded in fractal theory and incorporates the concept of noise to capture the multi-layered periodicity of rhythm and the varying strengths of different beat positions. By quantifying the significance of each note based on its rhythmic context, we aim to provide a more nuanced understanding of the hierarchical structure of music.
Furthermore, we integrate five common rhythmic patterns from musicology, i.e., Iamb, Anapest, Trochee, Dactyl, and Amphibrach, to construct detection operators that serve as convolution kernels for feature representation and extraction. These operators enable the model to identify and analyze fundamental rhythmic combinations within a composition, facilitating a deeper exploration of the music’s structural intricacies.
In addition to developing these operators, we define a data structure for musical hierarchy representation and formulate recursive detection tasks. Building upon the Mamba model, we develop a comprehensive detection framework that organizes the musical composition into a hierarchical tree structure. This approach allows for ordered layer traversal and highlights the multi-dimensional features of the piece, enhancing both the clarity and visualization of the musical information.
Our work realizes the hierarchical structuring of symbolic music and makes the following key contributions to the field of music structural analysis, including the quantitative modeling of rhythmic attention and the development of rhythmic pattern operators, hierarchical structural representation, and a new detection framework. These contributions address the existing gaps in computational music analysis by providing a robust model that operates directly on symbolic music data. Our approach overcomes the limitations of similarity-based and audio signal-based methods, offering a precise and detailed analysis of musical hierarchies. This work not only advances the quantitative analysis of music structure but also has potential applications in feature extraction, data compression, and the enhancement of music visualization techniques.
2. Related Works
2.1. Structure Retrieval in MIR
The field of MIR has witnessed a growing interest in understanding the structural organization of music. Numerous studies have explored different approaches for extracting structural information from music scores and audio recordings.
Early research focused on similarity-based methods to identify recurring patterns and repetitions within music. These approaches, often utilizing techniques like dynamic programming or hierarchical clustering, compared segments based on melodic, harmonic, or rhythmic similarities [
19,
21,
22]. While these methods provided valuable insights into music structure, they primarily focused on surface-level similarities and might not fully capture the intricate hierarchical relationships present in music.
More recently, researchers have explored symbolic music data as a more concise and interpretable source for structural analysis. This approach allows for a deeper examination of the musical hierarchy, capturing both macro and micro-level structures without the ambiguities introduced by audio signal processing. Notably, studies by Lerdahl and Jackendoff proposed a hierarchical model of music structure based on grouping principles and time-span reduction, laying the foundation for understanding the hierarchical organization of musical elements [
10]. Koelsch et al. further investigated the processing of hierarchical syntactic structure in music, highlighting the cognitive significance of hierarchical organization [
11].
Several research efforts have focused on developing computational models for extracting hierarchical music structures from symbolic data. Pesek et al. (2014) proposed a compositional hierarchical model for MIR [
14], while Buisson et al. (2022) explored multi-level representations for hierarchical music structure analysis [
17]. Dai et al. (2024) examined the interconnectedness of music structures with other musical elements like harmony, melody, and rhythm, emphasizing the importance of a holistic approach to structure analysis [
16].
These studies highlight the growing interest in developing robust computational models for detailed structural analysis directly on symbolic music data. This approach promises more precise insights into the musical hierarchy, paving the way for advancements in MIR applications like automated composition, music recommendation systems, and music theory education.
It is important to note that the field of music theory provides a rich theoretical framework for understanding music structure, with concepts like form, theme, and variation playing crucial roles in defining musical coherence. Flieder (2024) [
27] proposes a mathematical foundation for music theory and composition, exploring the concept of “structure” as a fundamental element in music analysis. Qian et al. (2025) [
28] proposed MusicAOG, an energy-based hierarchical and/or graph model that enables interpretable learning and controllable generation of symbolic music through Metropolis–Hastings sampling, though requiring expert annotations and simplified evaluations.
While significant progress has been made in the field of music structure retrieval, there is still a need for further research in developing accurate and efficient models that can effectively capture the intricate hierarchical relationships present in music. This research will contribute to a deeper understanding of music structure and enable the development of more sophisticated MIR applications.
In summary,
Table 1 summarizes the literature on music structure analysis, highlighting the methods employed and their limitations. The table illustrates the diversity of approaches in the field, ranging from dynamic programming and clustering to cognitive syntax analysis and compositional hierarchy. However, many studies face limitations such as surface-level similarity, non-computational frameworks, and genre-specific features. Our proposed model aims to address these limitations by providing a comprehensive framework for analyzing music structure through rhythmic patterns and hierarchical organization.
2.2. Psychological Studies on Rhythm and Attention
Research has shown that tempo and rhythm have a significant impact on attention, particularly highlighting that stronger beats in music tend to elicit greater attention values. However, there have been limited efforts to model these attention values systematically using rhythmic patterns.
Bolger (2013) found that rhythm can implicitly influence temporal attention across different sensory modalities. This suggests that the effect of rhythm on attention is a generalized mechanism independent of the specific modality. The study also noted that this effect might be linked to the anticipation of targets, with higher anticipation for targets appearing in positions corresponding to strong beats [
29]. Fitzroy (2015) discovered that strongly metered notes evoke more robust EEG responses than weakly metered notes at the early auditory processing stage (N1 component), lending support to the predictions of dynamic attention theory. The study also revealed that individuals are more likely to employ temporal selective attention in environments where information changes rapidly [
30]. Elbaz (2020) provided insights into the broader effects of rhythm on attention. Their research indicated that rhythm might have a generalized effect on overall alertness rather than selective attention to specific time points, offering new perspectives on the mechanisms of rhythm-induced attention [
31].
While these studies underscore the relationship between rhythm, tempo, and attention, they primarily focus on empirical observations without delving into the modeling of attention values in relation to rhythmic patterns. This gap underlines the need for a systematic approach to quantify and understand attention in the context of rhythmic structures, which our proposed model aims to address.
2.3. Fractal Theory in Rhythm Analysis of Music
Several related works have explored the fractal nature of music, particularly in the context of rhythm and structure, offering valuable insights that complement our proposed rhythm-based attention analysis. Bigerelle and Iost (2000) explored the fractal dimension of music in the time domain using statistical methods, aiming to quantify and classify different music genres based on their fractal properties [
32]. Su and Wu (2007) investigated the fractal properties of music by converting musical note sequences into “music walks” and analyzing them using Hurst exponents and Fourier spectral analysis. Their findings indicated that music exhibits fractal characteristics akin to fractional Brownian motion (fBm) [
33]. Levitin, Chordia, and Menon (2012) demonstrated that musical rhythm adheres to a
power law distribution. They confirmed the universality of fractal structures in rhythm and revealed unique
rhythm spectra across composers, pointing to both conscious and unconscious manipulation of rhythmic predictability [
34]. More recently, McDonough and Herczyński (2023) introduced the concept of “temporal scaling”, which examines the recurrence of melodic lines at various time scales and defines a corresponding fractal dimension, highlighting the multifaceted nature of fractal patterns in music [
35].
While these studies primarily focus on frequency and spectral analysis, they provide a critical foundation for understanding the complex fractal nature of music. Our paper’s contribution lies in exploring the fractal structure of music through a novel approach that emphasizes rhythmic patterns and their hierarchical organization. By focusing on rhythm-based attention analysis, we aim to reveal new dimensions of musical complexity and structure, advancing the field towards more sophisticated and comprehensive analytical methodologies.
2.4. Operators for Musical Rhythm Detection
In the realm of image processing, detection operators are essential tools designed to identify specific features within an image, such as edges, contours, and textures. These operators, which include methods like the Sobel, Canny, and Laplacian filters, rely on mathematical formulations to enhance relevant visual data while suppressing noise [
36]. This approach of feature extraction and enhancement through detection operators lays a foundational framework that can be adapted to different domains, including audio analysis.
Transitioning to music, several studies have utilized operators similar to those in image processing to analyze rhythm and dynamics. One notable example is the Teager–Kaiser energy operator (TKEO), a nonlinear method used in the beat tracking system by Istvanek (2020) [
37].
The analysis of symbolic music by integrating the length and attention value of each discrete note is an emerging field with limited existing research. Our approach leverages this nascent methodology by combining detection operators with rhythm-based analysis. By formulating a series of operators grounded in fundamental rhythmic combinations, we aim to deepen our understanding of the significance of quantized notes and their implications in music theory and practice.
2.5. Research Gaps and Hypotheses
Based on the research gaps and theoretical foundations identified in existing literature, we formulate the following research hypotheses to guide our investigation:
Hypothesis 1 (Hierarchical Structure Modeling)
. The hierarchical organization of musical elements in symbolic representations contains inherent fractal properties that can be systematically modeled through rhythm-based attention analysis. This hypothesis builds on Lerdahl and Jackendoff’s hierarchical model [10] and McDonough’s temporal scaling concept [35], proposing that multi-level rhythmic patterns exhibit self-similar structures across time scales. Hypothesis 2 (Rhythm-Attention Correlation)
. The significance of individual notes in a musical composition can be quantitatively modeled using a rhythm-based attention framework. Supported by Bolger’s findings on temporal attention [29] and Levitin’s 1/f rhythm spectra [34], this hypothesis posits that rhythmic regularity creates fractal-like attention distributions across hierarchical levels. Hypothesis 3 (Operator-Driven Pattern Detection)
. Detection operators based on fundamental rhythmic combinations can effectively capture the hierarchical organization of music, facilitating a deeper understanding of its structural complexity. Drawing from image processing operator theory [36] and symbolic music analysis, this hypothesis suggests that operator-based analysis surpasses traditional methods in capturing structural relationships. 3. Proposed Methods
In this section, we outline the methodologies employed to construct and validate our rhythm-based quantitative model for analyzing musical hierarchy. Our approach is structured into three main components: a quantization scheme for rhythmic attention, basic rhythmic grouping operators, and a recursive detection process using the Mamba model. Each component is crucial for understanding how our model interprets and organizes musical structures.
3.1. Quantization Scheme for Rhythmic Attention
In this subsection, an approach leveraging fractal and rhythmic structure theory to determine the significance of individual notes is introduced.
3.1.1. Attention Allocation for Basic Beats
Cooper (1963) explains that the primary meter in music tends to organize and be perceived at the lowest structural level where it shows regularity. He emphasizes that meter, like other musical elements, has an architectural nature. This means that the beats defined by the meter in the time signature can be broken down into equal units or combined into larger metric units, with certain beats being more accented than others. As a result, most musical compositions present a hierarchical structure of metric organizations [
38]. Inspired by pink noise (
noise) [
39], whose power spectral density (PSD) is inversely proportional to frequency, we derive principles for attention allocation over basic beat types. The relationship is provided by Equation (
1):
The value of alpha tends to vary with the genre of the music, as well as the composer’s preference [
34].
According to Mandelbrot’s theory of fractal time series and long-range correlation analysis, when
, the evolution of a system exhibits weak long-range memory effects [
40], which aligns with the long-range correlations found in music. Furthermore, Levitin’s research has shown that musical rhythms follow a
power law distribution when
is around 0.5 [
34].
To align our model with empirical observations in music theory and psychology, we set to 0.5. This specific value of reflects the balance between complexity and predictability in musical rhythms. A value of in the noise model captures the natural variability observed in rhythmic patterns while maintaining a structure that is perceptually appealing and cognitively manageable.
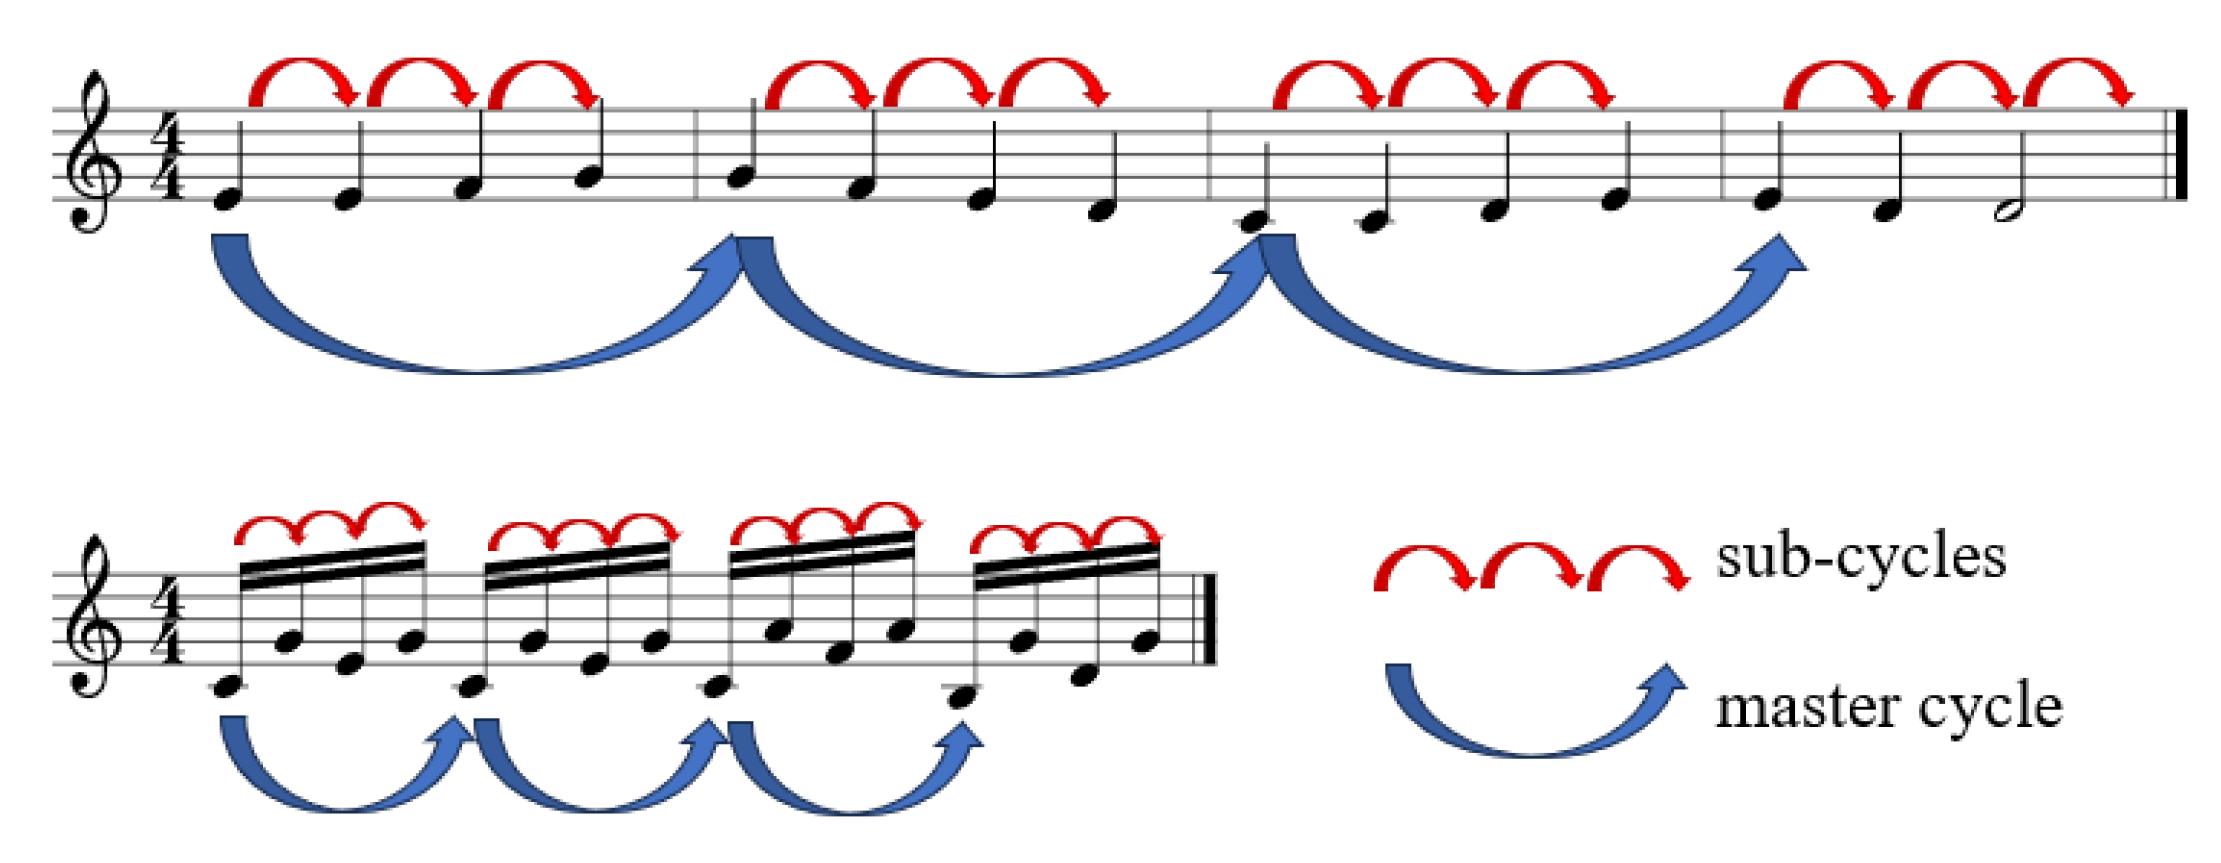
Considering a musical beat cycle, there is both a master cycle and its sub-cycles. For instance, in a measure of triple meter, the master cycle would be the entire measure, while the sub-cycles would consist of individual beats within that measure. Similarly, a beat might be subdivided into two half-beats.
The first note of the whole cycle will be dominated by the master cycle, while the other notes will be dominated by their sub-cycles.
The frequency of sub-cycles is typically an integer multiple of the master cycle’s frequency. Given the self-similarity across different scales for the
function, we can establish a multiplicative relationship between the power intensity of the master cycle and its sub-cycles. Specifically, if the frequency of the master cycle is
and the frequency of the sub-cycle is
, then the relative power intensities can be normalized to distribute the attentional intensity across the cycle.
Figure 2 will illustrate the master cycle and its sub-cycles both in the view of a measure and a beat.
For normalization, we consider the individual contributions of the master cycle and the sub-cycles maintaining their relative proportions to the total attention distribution, so we use the proportionate normalization method and set the sum to 1. The normalized value of attention for the master cycle can be expressed as Equation (
2):
Similarly, the proportional attention for each sub-cycle can be expressed as Equation (
3):
where
and
are the normalized attentional intensities for the master cycle and sub-cycles, respectively.
Since the fractal property (self-similarity across scales) of
S, only the value of integer
k is needed to calculate
and
, then we define
as the master cycle power intensities and
as sub-cycle power intensities.
Table 2 provides the attentional intensities for common scenarios of
k values. Simple meter signatures such as duple and triple meters are considered in this table, while compound meter is not mentioned because it is a combination of simple meters, which will be discussed later in this section.
3.1.2. Attention Allocation at the Compound and Hierarchical Level
After modeling attention allocation in musical basic beat types, we focus on the compound meter and allocation methods for each note in a composition.
For basic beat types, the process is equally divided and allocates an attention value to each interval, and the intervals, including strong beats, are allocated a higher value. When it comes to the compound meter and hierarchical level, the allocation process can be regarded as an integral process over temporal, which means we transform the idea of a “point” (a value assigned to each beat) into a “continuum” (a process of integrating the time assigned to the location and duration of notes, but the density (intensity) is not equalized, and is higher on the beat point or the beginning of a cycle).
While the density function for integration can be challenging to express directly due to its abstract nature and potentially infinite recursive allocation, we can utilize a practical approach based on a recursive division scheme. This approach draws inspiration from the basic beat types allocation scheme, using its duration as the initial integration value and then recursively dividing it. Here is a refined definition:
Let D be the integral value over a period of one beat cycle . Divide the interval into k equal sub-intervals , until , where k is a positive integer.
Drawing upon the attention allocation scheme for basic beats, we define as the power intensity of the master cycle and as the power intensity of the sub-cycles. We then assign integral values to these sub-intervals as follows:
The first sub-interval, corresponding to the master cycle, has an integral value of .
The remaining sub-intervals, corresponding to the sub-cycles, each have an integral value of .
According to Fitzroy’s [
30] study, the attentional intensity of a note is positively correlated with the rapidity of change. Recursively decomposing time implies an exponential increase in the rapidity. Therefore, when recursively dividing one interval, we will adjust the integral split ratio to
and
, where
d is the recursive depth and begins at 1.
Let
represent the integral value over the interval
. We divide this interval into
k parts, then the value of
I for
i-th sub-interval can be expressed as Equation (
4):
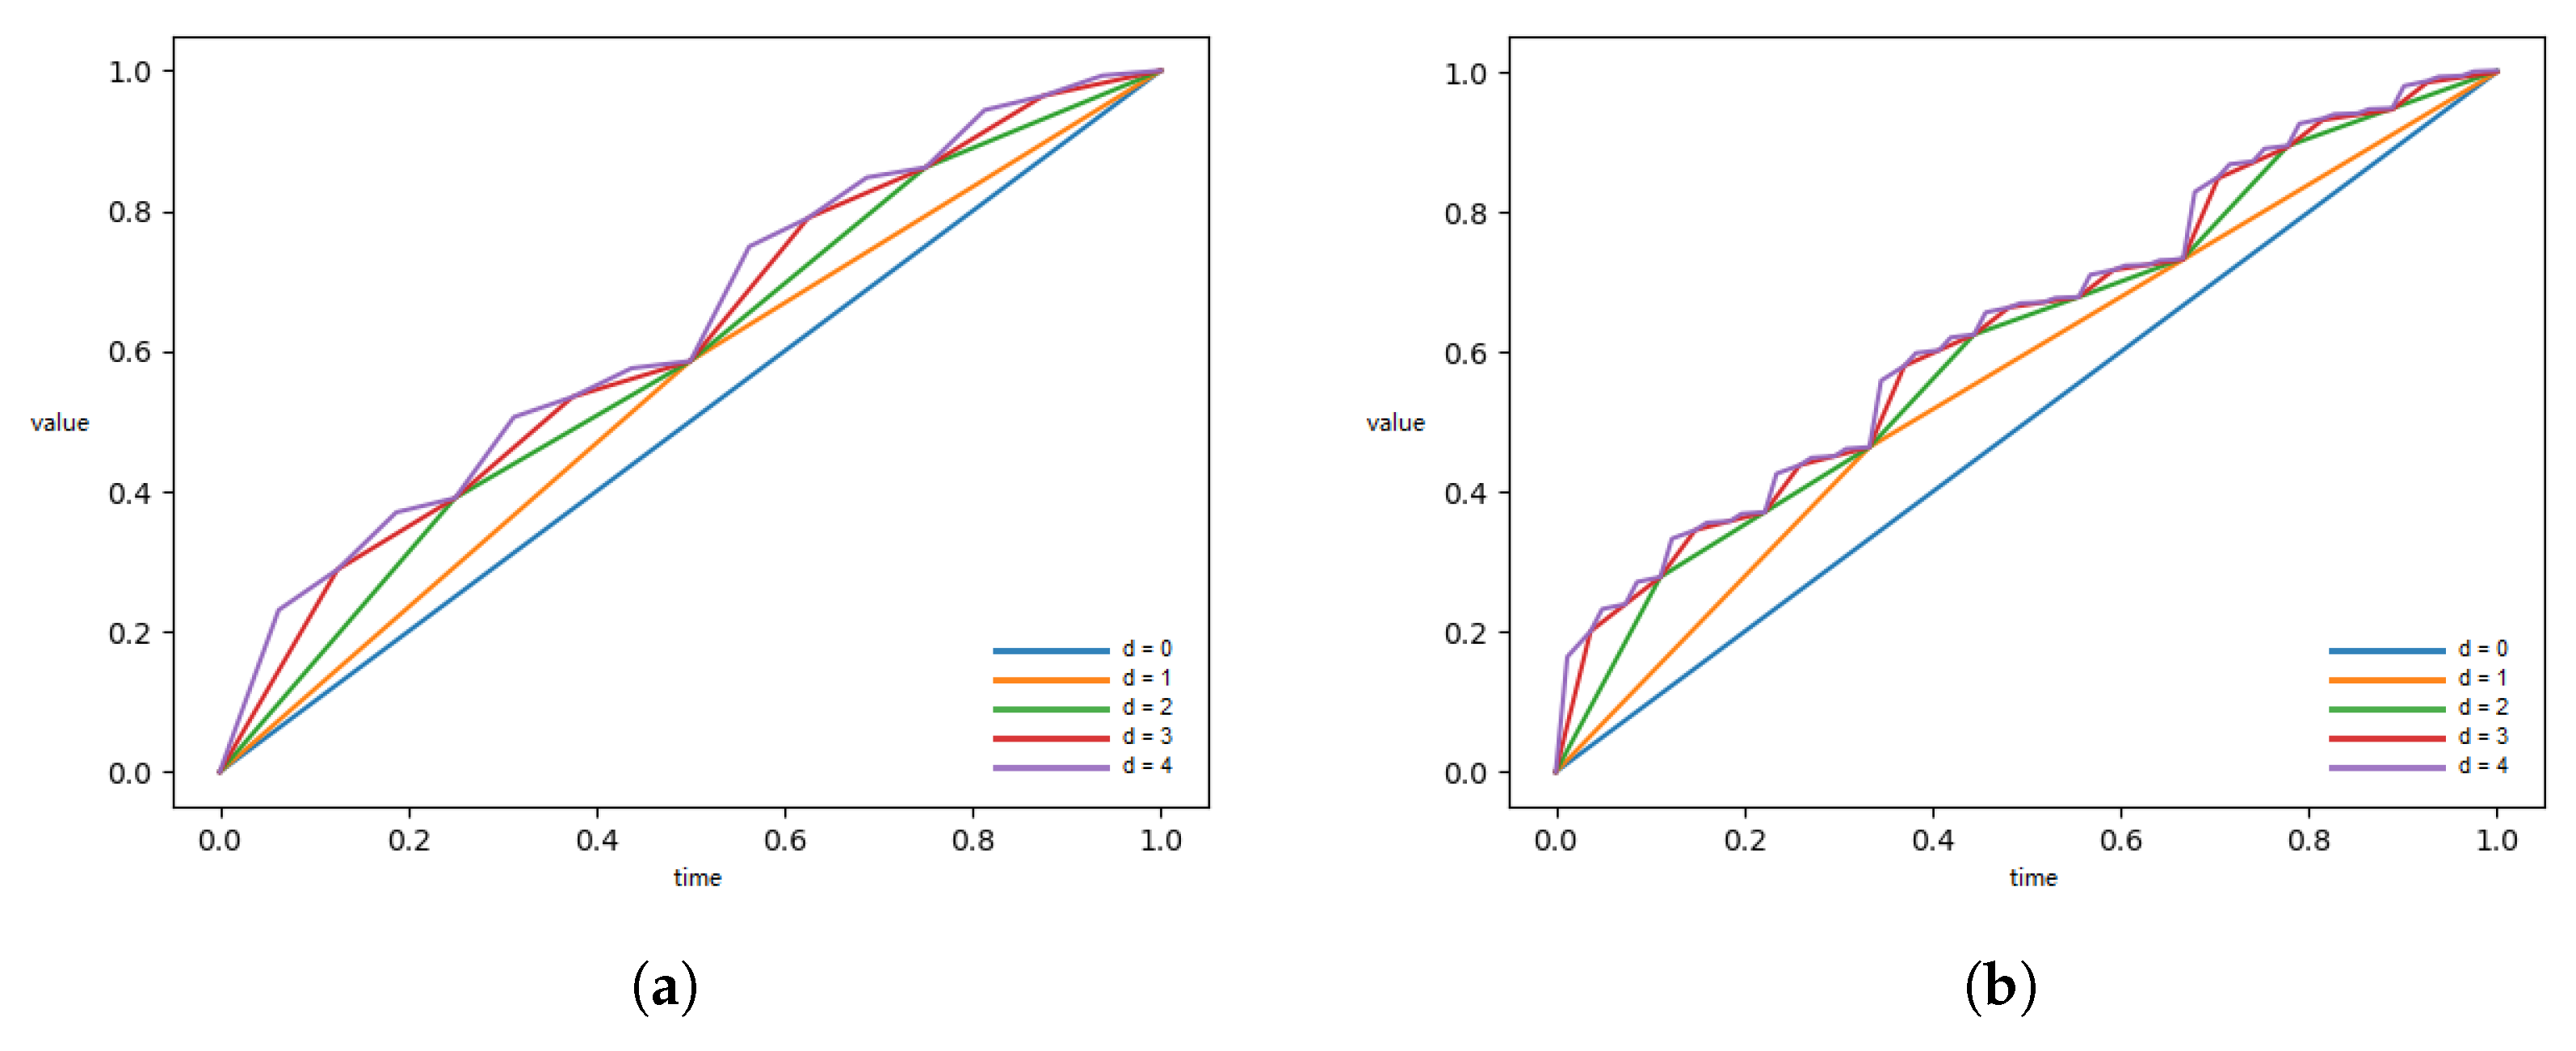
Figure 3 shows the process of transformation of the primitive function with increasing value
d from 0 to 4 for calculating
I when the value of
k is 2 or 3 throughout. The fractal structural characteristics can be clearly seen in the figure.
3.1.3. Algorithm for Detecting k Value
We regard note onsets as pulses of the s point process, and our purpose is to find a value of k such that the maximum number of points within a given interval fall on either the equally spaced points of the interval or on its boundaries. Given a series of event times within a specified interval, we aim to calculate the k value based on the following criteria:
For a sequence of events with a total duration, let represent the normalized time of each event, where the total duration is normalized to 1.
For each event time , check if can be expressed in the form , where a and b are integers and .
If , then increment the corresponding k value by .
The final k value is the maximum sum obtained through the increments.
Formally, let
be the set of event times. Define
as follows:
We aim to determine
k such that
For a musical piece, based on the theoretical length of each note and the relative starting positions, we can calculate each note’s quantified attention value.
This quantization scheme, based on fractal and rhythmic structure theories, provides a foundational metric for evaluating note attention within a musical piece. It sets the stage for subsequent analyses involving the identification of fundamental rhythmic patterns and hierarchical structuring.
Using this foundational metric, we can now proceed to develop basic rhythmic grouping operators, which further enhance our ability to discern and organize musical hierarchies.
3.1.4. Fractal Characteristics Analysis
Mathematically, we can adopt the MF-DFA algorithm [
41] to analyze the fractal dimension.
For a time duration
t and a time sequence
of length
N, where
, and
, the cumulative sum
is calculated as Equation (
7):
where
Then, is divided into non-overlapping windows of equal size s. Any remaining part of the series at the end that is shorter than s is disregarded. This division is carried out from both ends, resulting in segments.
In each segment, local trends are removed by fitting the data with a polynomial. For each segment
, we compute the detrended time series by Equation (
8):
where
is the fitted polynomial in segment
.
The fluctuation function
is then computed by Equation (
9) for each segment:
To obtain the overall fluctuation function, the results are averaged over all segments using Equation (
10):
where
q is a real parameter that characterizes different orders of the moments.
Finally, the scaling behavior of the fluctuation function is analyzed. If the time series exhibits multifractal properties, will follow a power-law scaling relation: Here, is the generalized Hurst exponent. In the case of the monofractal time series, is independent of q, whereas for the multifractal time series, varies with q.
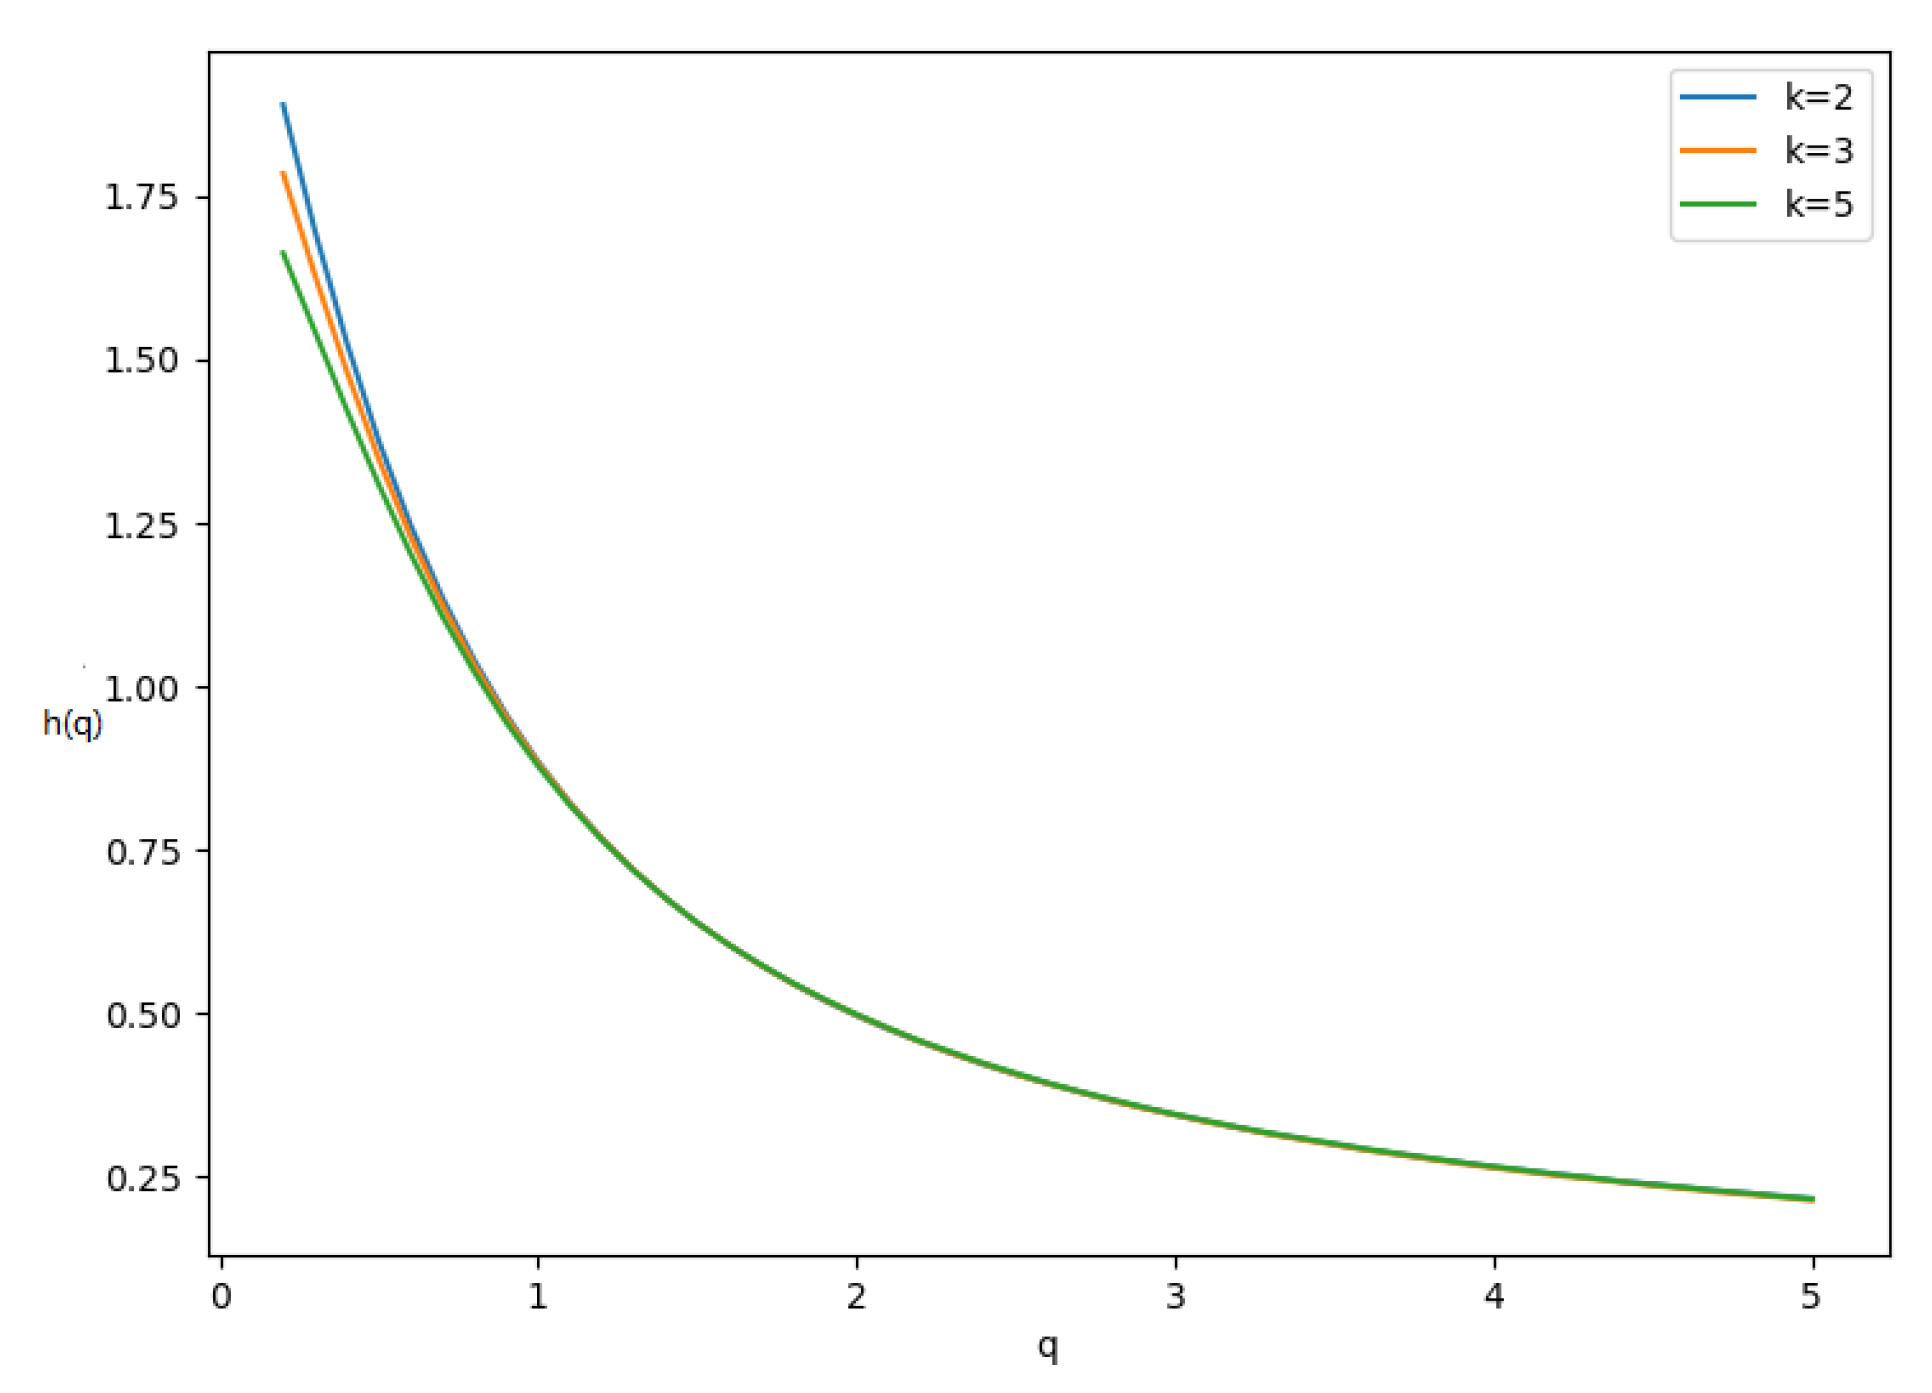
Figure 4 shows the curve of
for
k is 2, 3, and 5 throughout. The values of
decrease as
q increases. The curve of
is convex, which indicates that different segments of the time series have different scaling behaviors. This is typical of multifractal systems, where short-term fluctuations and long-term correlations vary across segments.
In addition, when
k is 2, 3, and 5, for
, the Hurst exponent
. The fractal dimension
can be approximated by Equation (
11):
So, the fractal dimension for our proposed quantization scheme for rhythmic attention. This value of the fractal dimension suggests a highly complex structure within the time series, lying between a one-dimensional line and a two-dimensional plane.
3.2. Basic Rhythmic Grouping Operators
Having calculated rhythmic attention using the fractal scheme, we now possess a list of attention values for each note in the musical sequence. This attention information allows us to delve deeper into the rhythmic structure of the piece.
Rhythm can be understood as the organization of unaccented beats around accented ones, forming distinct rhythmic patterns. These patterns are often characterized by terms borrowed from prosody, leading to the identification of five basic rhythmic groupings:
Building upon the success of convolution kernels in image processing, we propose adapting this technique to detect and identify these basic rhythmic groupings. By applying these kernels to the attention list, we can extract specific rhythmic patterns and quantify their presence within the musical sequence.
This section will delve into the specific design and implementation of these convolution kernels, demonstrating how they effectively detect the five basic rhythmic groupings. We will further explore the potential applications of these operators in analyzing and understanding the rhythmic structure of music.
To effectively detect and differentiate the five basic rhythmic groupings, the proposed convolution kernels are designed with the following principles:
Zero-Sum Constraint: Each kernel is constrained to have a zero sum, ensuring that the output values represent relative variations within the rhythmic pattern rather than absolute magnitudes. This normalization facilitates comparison between different operators and emphasizes the relative distribution of attention within the rhythmic group.
Output Range: The value of each kernel is constrained to the interval , and the absolute value summation of each kernel is also constrained to the same value. This standardization ensures that the output values are comparable across different musical sequences and facilitates the interpretation of the results.
Maximizing Contrast: The kernel weights are carefully chosen to maximize the difference between accented and unaccented values within each basic rhythmic grouping. This enhances the ability of the kernels to discriminate between different rhythmic patterns and improves the accuracy of the detection process.
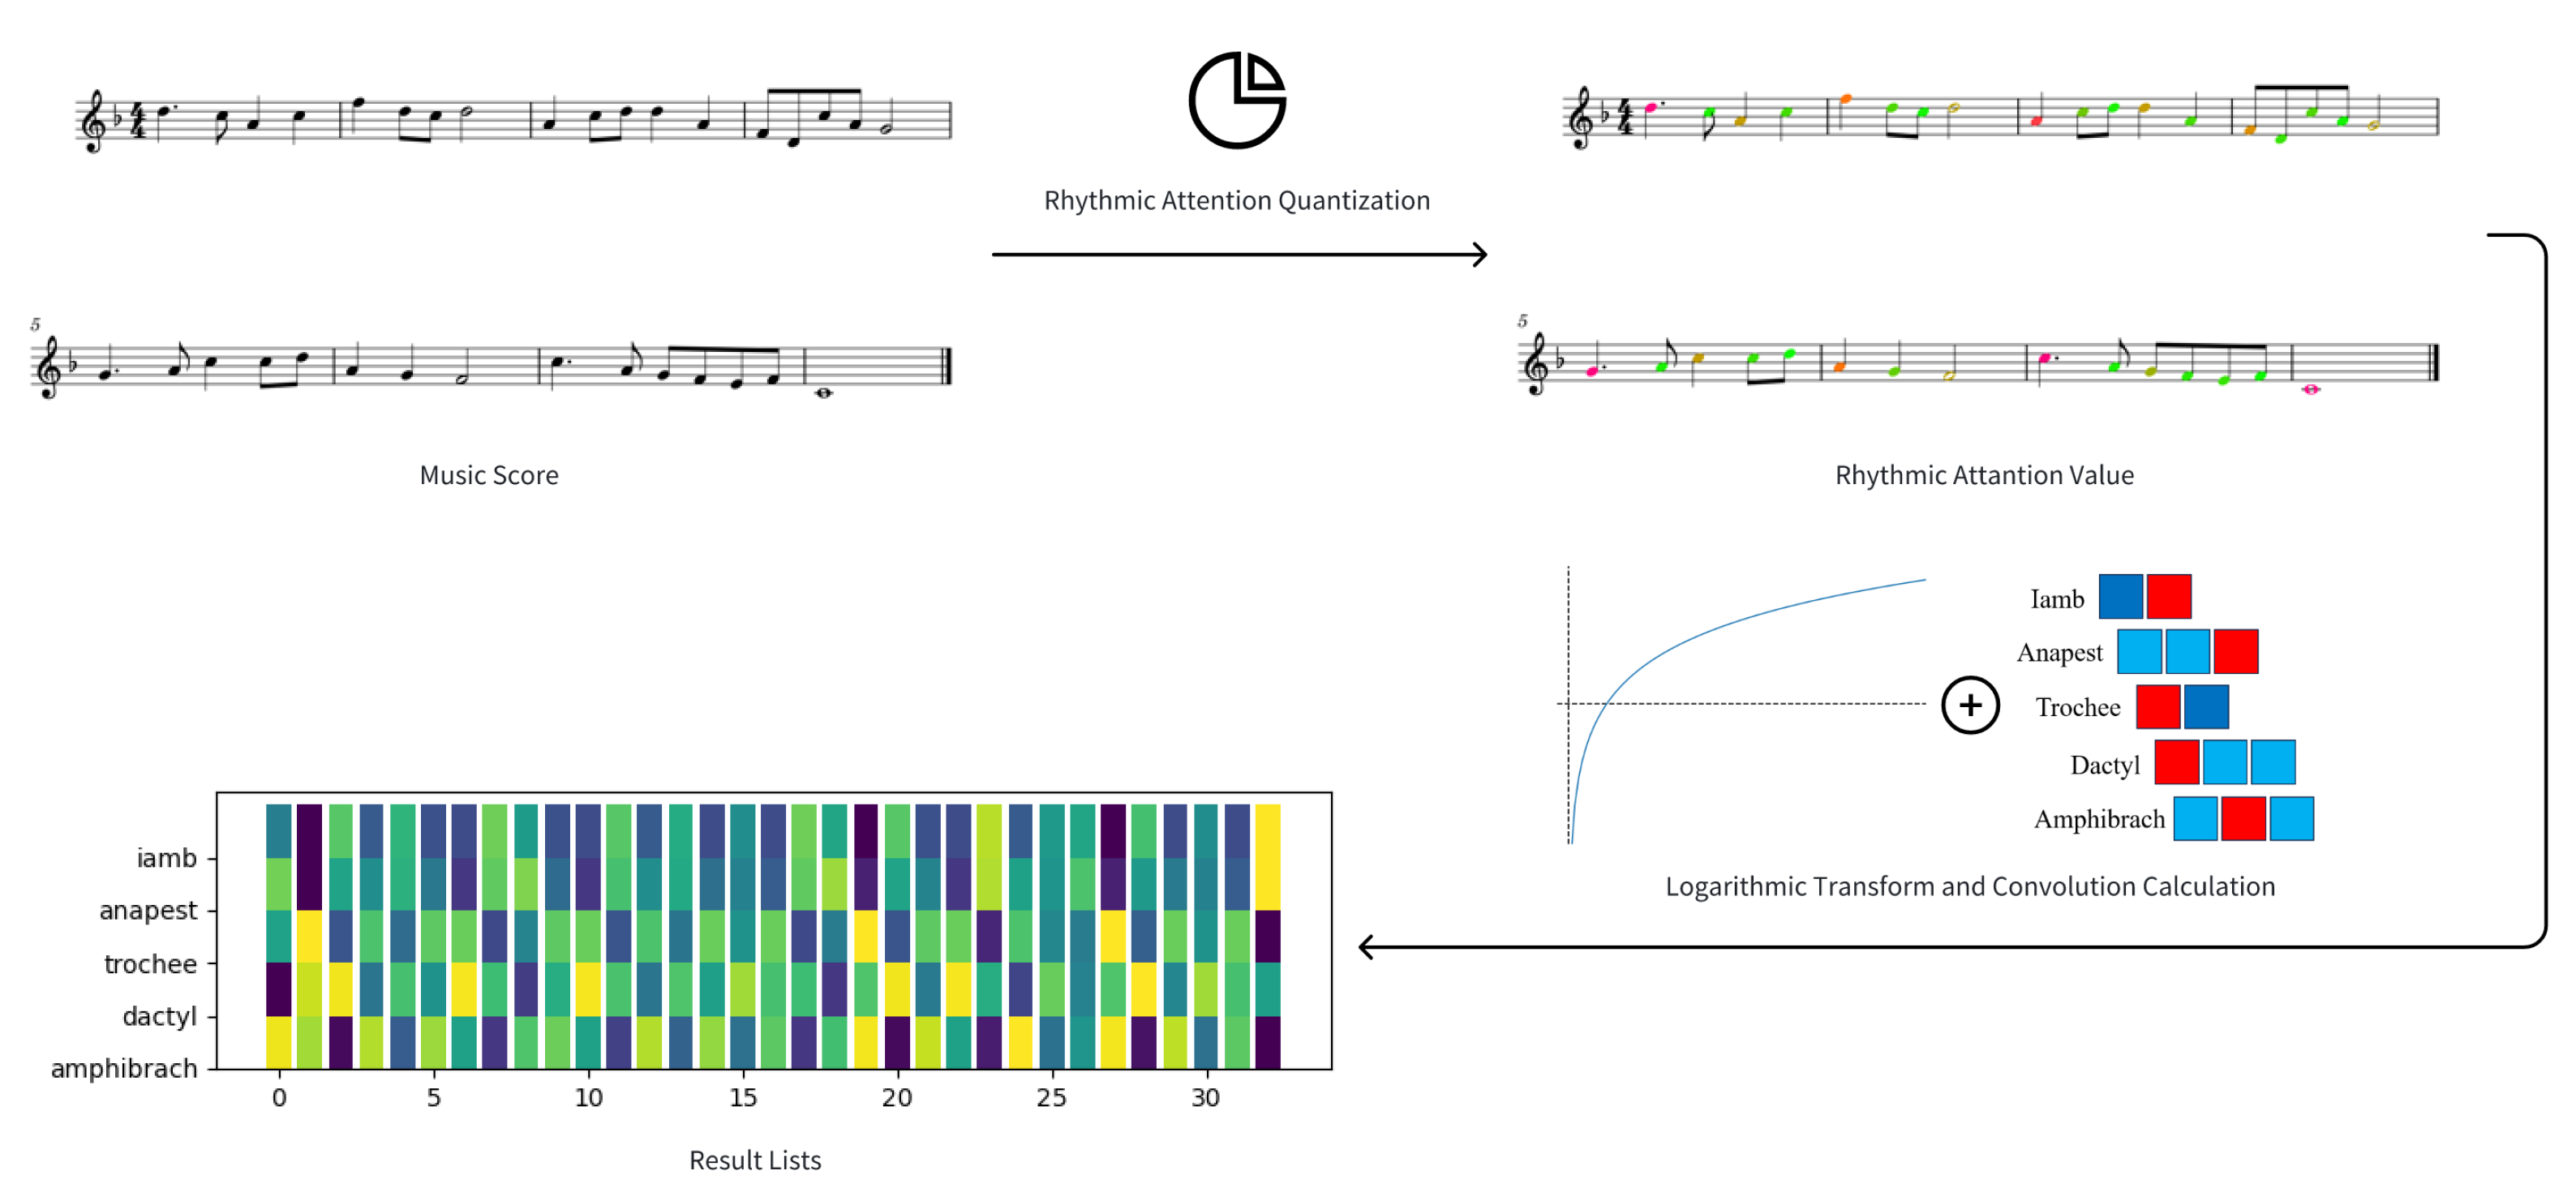
Emphasis on Proportional Relationships: Our detection operators prioritize the proportional relationships between elements in a rhythmic sequence. To achieve this, the original input sequence is processed using a logarithmic transformation before being fed into the kernel. This transformation allows the model to focus on the relative magnitudes of rhythmic events rather than their absolute values.
Following the design principles above, we carry out the value of convolution kernels as basic rhythmic grouping operators, as shown in
Table 3.
All inputs will be logarithmically transformed first before convolution calculation. These operators are used to detect the direction of signal strength change and are for time series analysis based on specific pattern matching. As a result, they are used without flipping the convolution kernel.
Figure 5 shows the process flow of basic rhythmic grouping calculation.
3.3. Recursive Detection Module
Based on the previous quantization scheme and rhythmic grouping convolution operations, we employ the Mamba model [
42,
43] as the backbone to execute recursive operations for hierarchical musical structure analysis.
3.3.1. Data Structure and the Definition of Recursive Detection Task
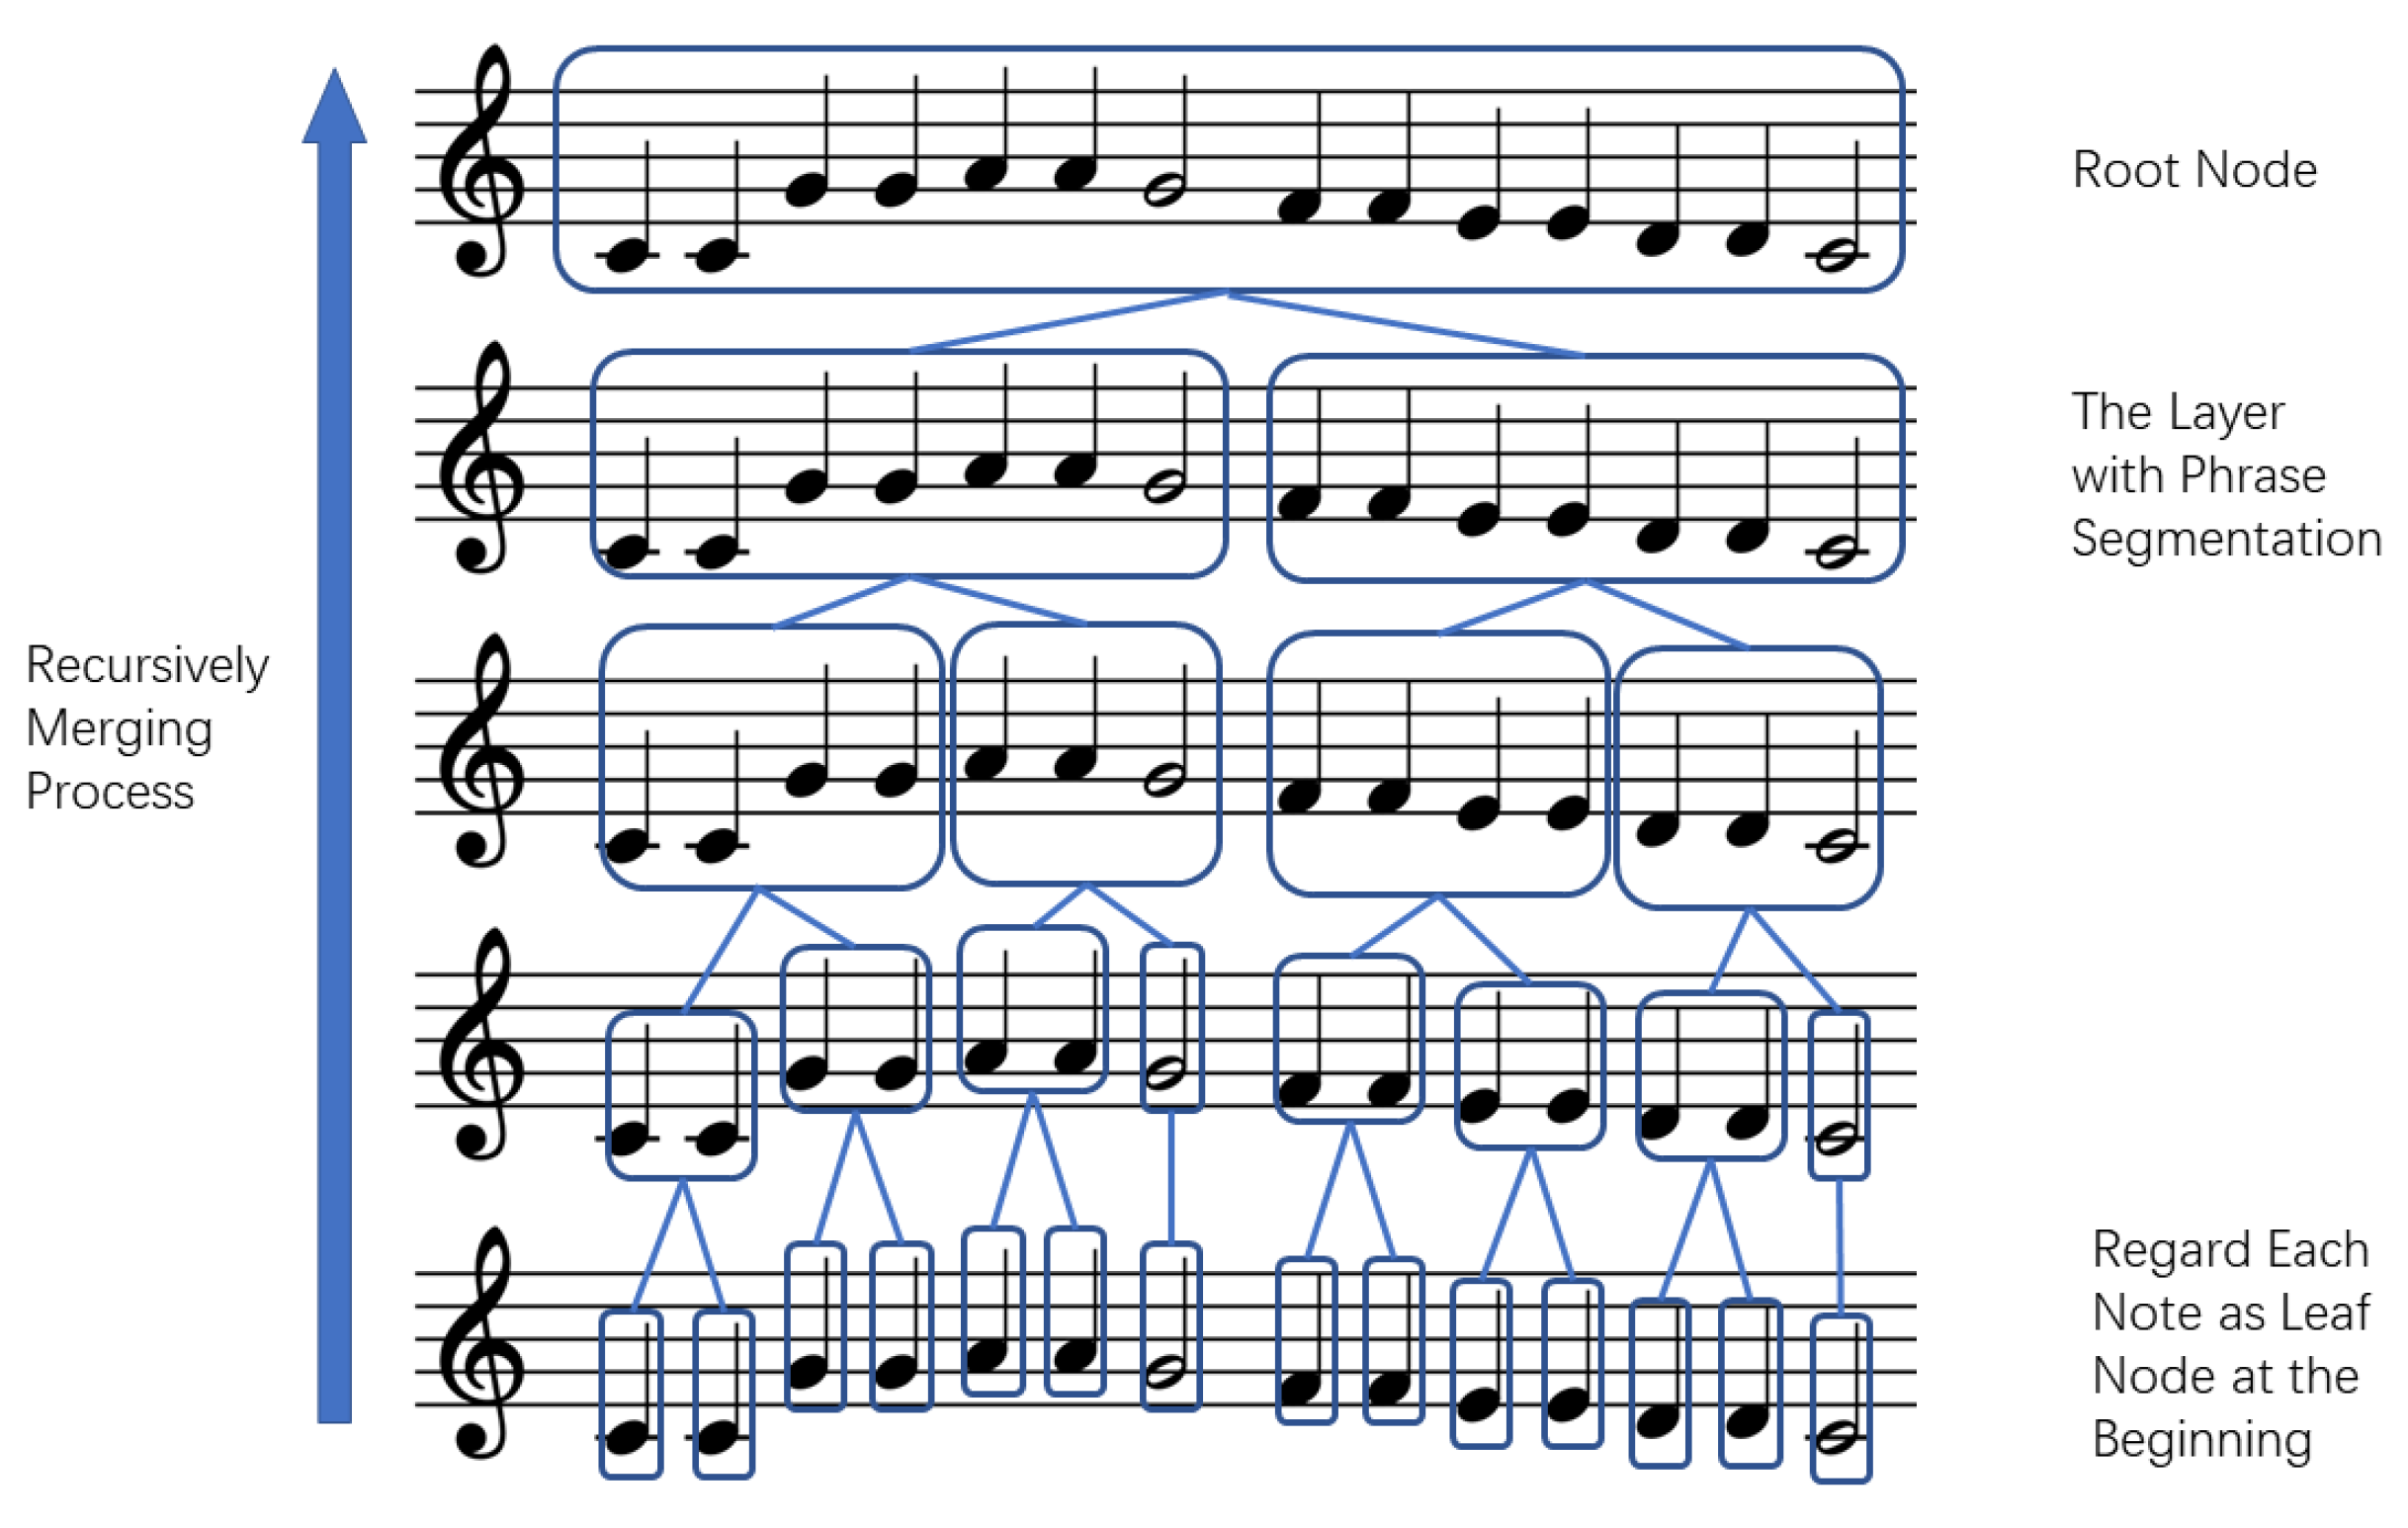
We employ a tree structure to represent the hierarchical organization of music. Each node corresponds to a musical unit, such as a note, phrase, or sentence. The root node represents the entire composition, while the leaf nodes are the fundamental musical units (notes). The edges signify the relationships between musical units and their sub-units, transitioning from segments to phrases and, ultimately, to notes.
Node attributes include a list of musical notes and the cumulative quantized attention score for each note, as previously introduced. Edge attributes encompass the rhythmic grouping type, identified through the basic rhythmic grouping operators proposed in this chapter.
Below is the definition of the recursive detection task. The recursive detection task begins with an input of a complete list of notes from a musical piece.
The process involves the following steps:
Node Initialization: Each note is first treated as an individual node.
Merging Process: Recursively iterate through all nodes. During this step:
Apply basic rhythmic grouping operators to calculate scores for patterns such as Iamb, Anapest, Trochee, Dactyl, and Amphibrach.
Traverse nodes from left to right, and according to patterns’ scores, the model will decide whether to merge the consecutive 2 or 3 nodes into a new node. All nodes that are not merged will also become independent new nodes.
Tree Structure Formation: Complete the traversal to form the upper layers of the tree structure. Continue the process until the tree is fully constructed, culminating in the root node.
Output Extraction: After the tree construction process is completed, the entire tree is passed into a downstream post-processing module: the musical phrase extraction module. This module estimates the boundaries of each phrase based on data density and segment length and aligns these with the level-order traversal results of the tree. Once the computation is complete, the layer that most closely matches the estimated results is selected to derive the output of musical sections and phrases.
Figure 6 shows the tree structure for recursive detection. This tree-based approach effectively captures the hierarchical nature of music, allowing for dynamic adjustments based on rhythmic patterns. By recursively merging nodes based on rhythmic grouping scores, the structure supports nuanced interpretations and outputs that align with initial musical segmentations. This method provides a robust framework for analyzing and processing complex musical compositions.
3.3.2. Model Architecture
In this section, the architectural design of a recursive music structure detection model proposed by us is presented. The model realizes an in-depth understanding and analysis of musical works by recursively analyzing the rhythmic patterns and overall information of musical sequences, and then organizes the symbolic music data into a tree data structure.
The architecture of our proposed model for a recursive musical structure detection is illustrated in
Figure 7. This hierarchical design processes musical input through multiple stages to identify and refine structural elements, with several key refinements and specifications noted.
Input and Initial Processing: The model ingests a music score as symbolic music input, the notes of input are extracted, and the initial length of the sequence is L. These data undergo two parallel initial processing steps:
Mamba2 Block: The outputs from the embedding () and rhythmic grouping convolution module () are concatenated to form a input to the Mamba2 block. This block, based on the Mamba architecture, efficiently processes sequential data to capture long-range dependencies in the musical structure.
Feature Projection and Combination: The Mamba2 Block output undergoes two projection operations:
One projection results in a dimensional output. This projection is then combined with the initial music score through addition, allowing for enhancing the ability to perceive and grasp the whole music piece.
Another projection receives the prior combined information and produces a dimensional output.
Combinatorial Operator: The combined projected features (with an dimension) are processed by a combinatorial operator, which maps these features to potential combinations for each note, including five basic rhythmic grouping types and a no-operation option. A softmax function is then applied to determine the group type. If any basic rhythmic grouping type is detected, the operator produces a node that contains all grouped nodes; if no operation is detected, the node is returned unchanged. This component identifies and combines the structural elements of the music.
Recursive Processing and Structure Building: The architecture incorporates a recursive element through the “Root Node” judging point:
If the output is not the root node, it passes through a “Node Summarizer”, where a note is selected as a representative from each node containing multiple notes using a sampling method, akin to a pooling operation. This is followed by a “Sum and Norm” operation applied to the rhythmic quantized scores. The resulting features (with an dimension) are then fed back into the rhythmic grouping convolution layer for further processing.
If the root node is reached, the final output yields the structure tree.
Non-root outputs are added as upper layers to the structure tree, building the hierarchical representation iteratively.
This recursive design enables the model to construct a multi-level representation of the musical structure, refining its analysis at each iteration. The resulting structure tree provides a comprehensive and detailed overview of the music’s rhythmic organization, facilitating further analysis and interpretation.
3.3.3. Loss Calculation and Evaluation Function
In this part, we will introduce the loss calculation and evaluation function for our proposed task.
Loss Function Integration: We design the loss function as two parts, including accuracy loss for the position of predicted boundaries and distributional loss for the internal distribution of structure trees.
Accuracy Loss: This component evaluates how accurately the model predicts the boundaries of phrases. Cross-entropy is used.
Cross-Entropy for Segment and Phrase Boundary Prediction: For the extracted layer for phrases from the structure tree, let
Then, the cross-entropy loss for phrases can be computed as follows:
Distributional Loss: This component aims to capture the similarity between the node content distribution of the structure tree and the ground truth distribution. We leverage the Kullback–Leibler (KL) divergence for this purpose.
KL Divergence for Node Distributions: In this component, we use the distribution of rhythmic attention quantization values for all elements among each node as what is measured by the KL dispersion. Let
Then, the KL divergence can be computed as follows:
Overall Loss Function: Finally, we combine the distributional and accuracy losses with another weight:
where
is a weight controlling the relative importance of the distributional and accuracy components.
5. Discussion
Our experimental results demonstrate that the fractal-driven approach to hierarchical music analysis achieves state-of-the-art performance in phrase segmentation tasks, outperforming both rule-based and machine learning baselines on the Essen Folksong Collection. The model’s superior F1-score (83%) and balanced precision–recall profile (83% precision and 84% recall) highlight its ability to reconcile the competing demands of boundary detection accuracy and structural coherence preservation.
A key strength of our fractal-driven approach is its capacity for transparent structural visualization, as exemplified in
Figure 8. This visualization demonstrates how our model parses a music piece into hierarchical segments while simultaneously quantifying the “rhythmic attention” contribution of individual notes. The figure displays the original score annotated with phrase boundaries (V in figure) and segment divisions (+ in figure), revealing the model’s ability to capture the underlying structure of the melody. The rhythmic attention values are represented as a color gradient, with red indicating higher attention. This visualization not only aids in understanding the model’s decision-making process but also provides a valuable tool for musicologists and composers to analyze and interpret musical structures.
Our experimental outcomes systematically validate the four research hypotheses. Hypothesis 1 is confirmed through the model’s consistent hierarchical segmentation across meters (
Table 5), where nested phrase boundaries exhibit self-similar rhythmic patterns aligning with Lerdahl’s hierarchical principles. Hypothesis 2 gains support from the fractal characteristics analysis, and we prove that the fractal dimension
for our proposed quantization scheme for rhythmic attention. The 7.75% F1-score drop when removing rhythmic grouping operators (
Table 6) corroborates Hypothesis 3, proving operator-driven detection surpasses conventional similarity measures.
The proposed model outperforms existing baseline models, demonstrating its potential for advancing music analysis and understanding. The integration of rhythmic grouping operators and the quantization scheme allows for a more nuanced representation of musical structure, paving the way for future research in this area.
The research questions posed at the beginning of this study have been addressed through the proposed model and its evaluation. The model’s ability to accurately segment musical phrases and capture hierarchical structures provides a solid foundation for further exploration of music analysis tasks. The findings suggest that the proposed approach can be extended to other aspects of music analysis, such as similarity detection and composition.
Our model adapts robustly to a wide spectrum of metrical types. When confronted with non-standard meters (e.g.,
), the
k-value detection algorithm introduced in
Section 3.1.3 dynamically selects the most appropriate subdivision value and partitioning pattern on the basis of the incoming note-level rhythmic features before passing control to the subsequent hierarchical parsing stages. In parallel, the KL-divergence-guided tree-construction heuristic steers the model toward a merger strategy that balances information compression with structural fidelity, ensuring that the resulting segmentation tree remains both parsimonious and musically plausible. Moreover, our work may aid socio-emotional music education, music–influence assessment, and speech-in-noise training [
48,
49,
50].
We contend that fractal characteristics of the musical structure are not confined to rhythmic organization; they also manifest in melodic contour and harmonic progression. Rhythm was chosen as our entry point because, in symbolic music, temporal information is explicitly encoded and, therefore, readily extracted, affording clear visualizability and interpretability. In future work, we will explore kernel-based and deep-learning techniques to derive complementary melodic and harmonic descriptors, and we will integrate them into the same fractal-driven framework for structure extraction. This will allow us to examine the interaction and mutual constraints among rhythm, melody, and harmony, ultimately testing whether a unified multi-parameter fractal representation can yield further gains in analytical accuracy and explanatory power.
6. Conclusions
This research presents a novel perspective on musical structure, moving beyond the traditional view of music as a mere sequential data stream. By recognizing music as a unique form of structured data, we delve deeper into its hierarchical organization, a concept often overlooked in previous studies. This understanding is crucial for various tasks in music analysis, such as content understanding, extraction, and long-term consistency analysis, especially in identifying latent themes.
Our research introduces the “Musical Rhythm Attention” model, a groundbreaking approach that leverages the aesthetic and psychological aspects of music combined with the mathematical concept of fractals. This model, with a fractal dimension of 1.504, captures the hierarchical nature of musical rhythm patterns. We further integrate musical theory and rhythm function theory by converting fundamental rhythmic patterns into convolution operators. These operators are designed to focus on relative relationships within each fractal, allowing the model to effectively utilize prior knowledge and process features in a more nuanced way.
The proposed model demonstrates its effectiveness in detecting music segments and phrases, achieving state-of-the-art results in music phrase boundary detection. This ability to decompose and process multi-layered structures surpasses previous models that were limited to single-layer boundary detection.
Beyond music structure analysis, our model holds significant potential for applications in music similarity detection and music composition. By focusing on rhythm as the primary feature dimension, we exploit a meaningful feature that is both visualizable and interpretable, offering simplicity and ease of extraction. Future research could explore additional features like pitch contours and harmony patterns, potentially enhancing the model’s understanding of the musical hierarchical structure.
This work represents a significant step towards a more comprehensive understanding of musical structure. By revealing the hidden layers within music, we pave the way for more sophisticated music analysis, content understanding, and creative applications. Future research will continue to explore the potential of this model in various music-related fields, enriching our understanding and appreciation of the art form.
While establishing fractal analysis in rhythm, our study has not yet addressed melody and harmony, dimensions whose implicit structural encoding in symbolic music contrasts with rhythm’s explicit temporal anchors. Our ongoing work develops computational descriptors (via kernel-based harmonic analysis and deep melodic contour modeling) for integration into the fractal framework. This cross-parametric extension will rigorously test whether fractal synergies among rhythm, melody, and harmony can enhance structural predictions while probing music cognition through the interpretability of unified fractal representations.


