
Information Diffusion Modeling in Social Networks: A Comparative Analysis of Delay Mechanisms Using Population Dynamics


 ,
,  , ,
, ,  and
and
Abstract
1. Introduction
1.1. Background and Motivation
1.2. Research Gaps and Challenges
1.3. Novel Contributions
1.4. Paper Organization
2. Related Work
2.1. Information Diffusion Models
2.2. Delay Mechanisms in Information Propagation
2.3. Network Structure and Diffusion Dynamics
2.4. Competing Information and Attention Dynamics
2.5. Research Gap
3. Dataset and Features
3.1. Social Network Dynamics and Dataset Features
- First, social networks exhibit user-specific engagement patterns where individuals interact with content at varying frequencies and intensities. This creates natural delays between exposure to information and subsequent sharing actions. On platforms like Reddit, these delays manifest as time gaps between viewing a post and commenting on or upvoting it.
- Second, social networks feature hierarchical thread structures where discussions branch into nested conversations. This structural element creates unique pathways for information flow which are not present in simpler network models. Our Reddit dataset captures these complex thread hierarchies, with parent–child relationships between comments forming directed information pathways.
- Third, social platforms implement algorithmic content prioritization that affects information visibility. These algorithmic factors create uneven exposure patterns that influence diffusion speed and coverage. Our modeling approach accounts for these visibility effects through parameterized transmission probabilities.
3.2. Real Data Collection
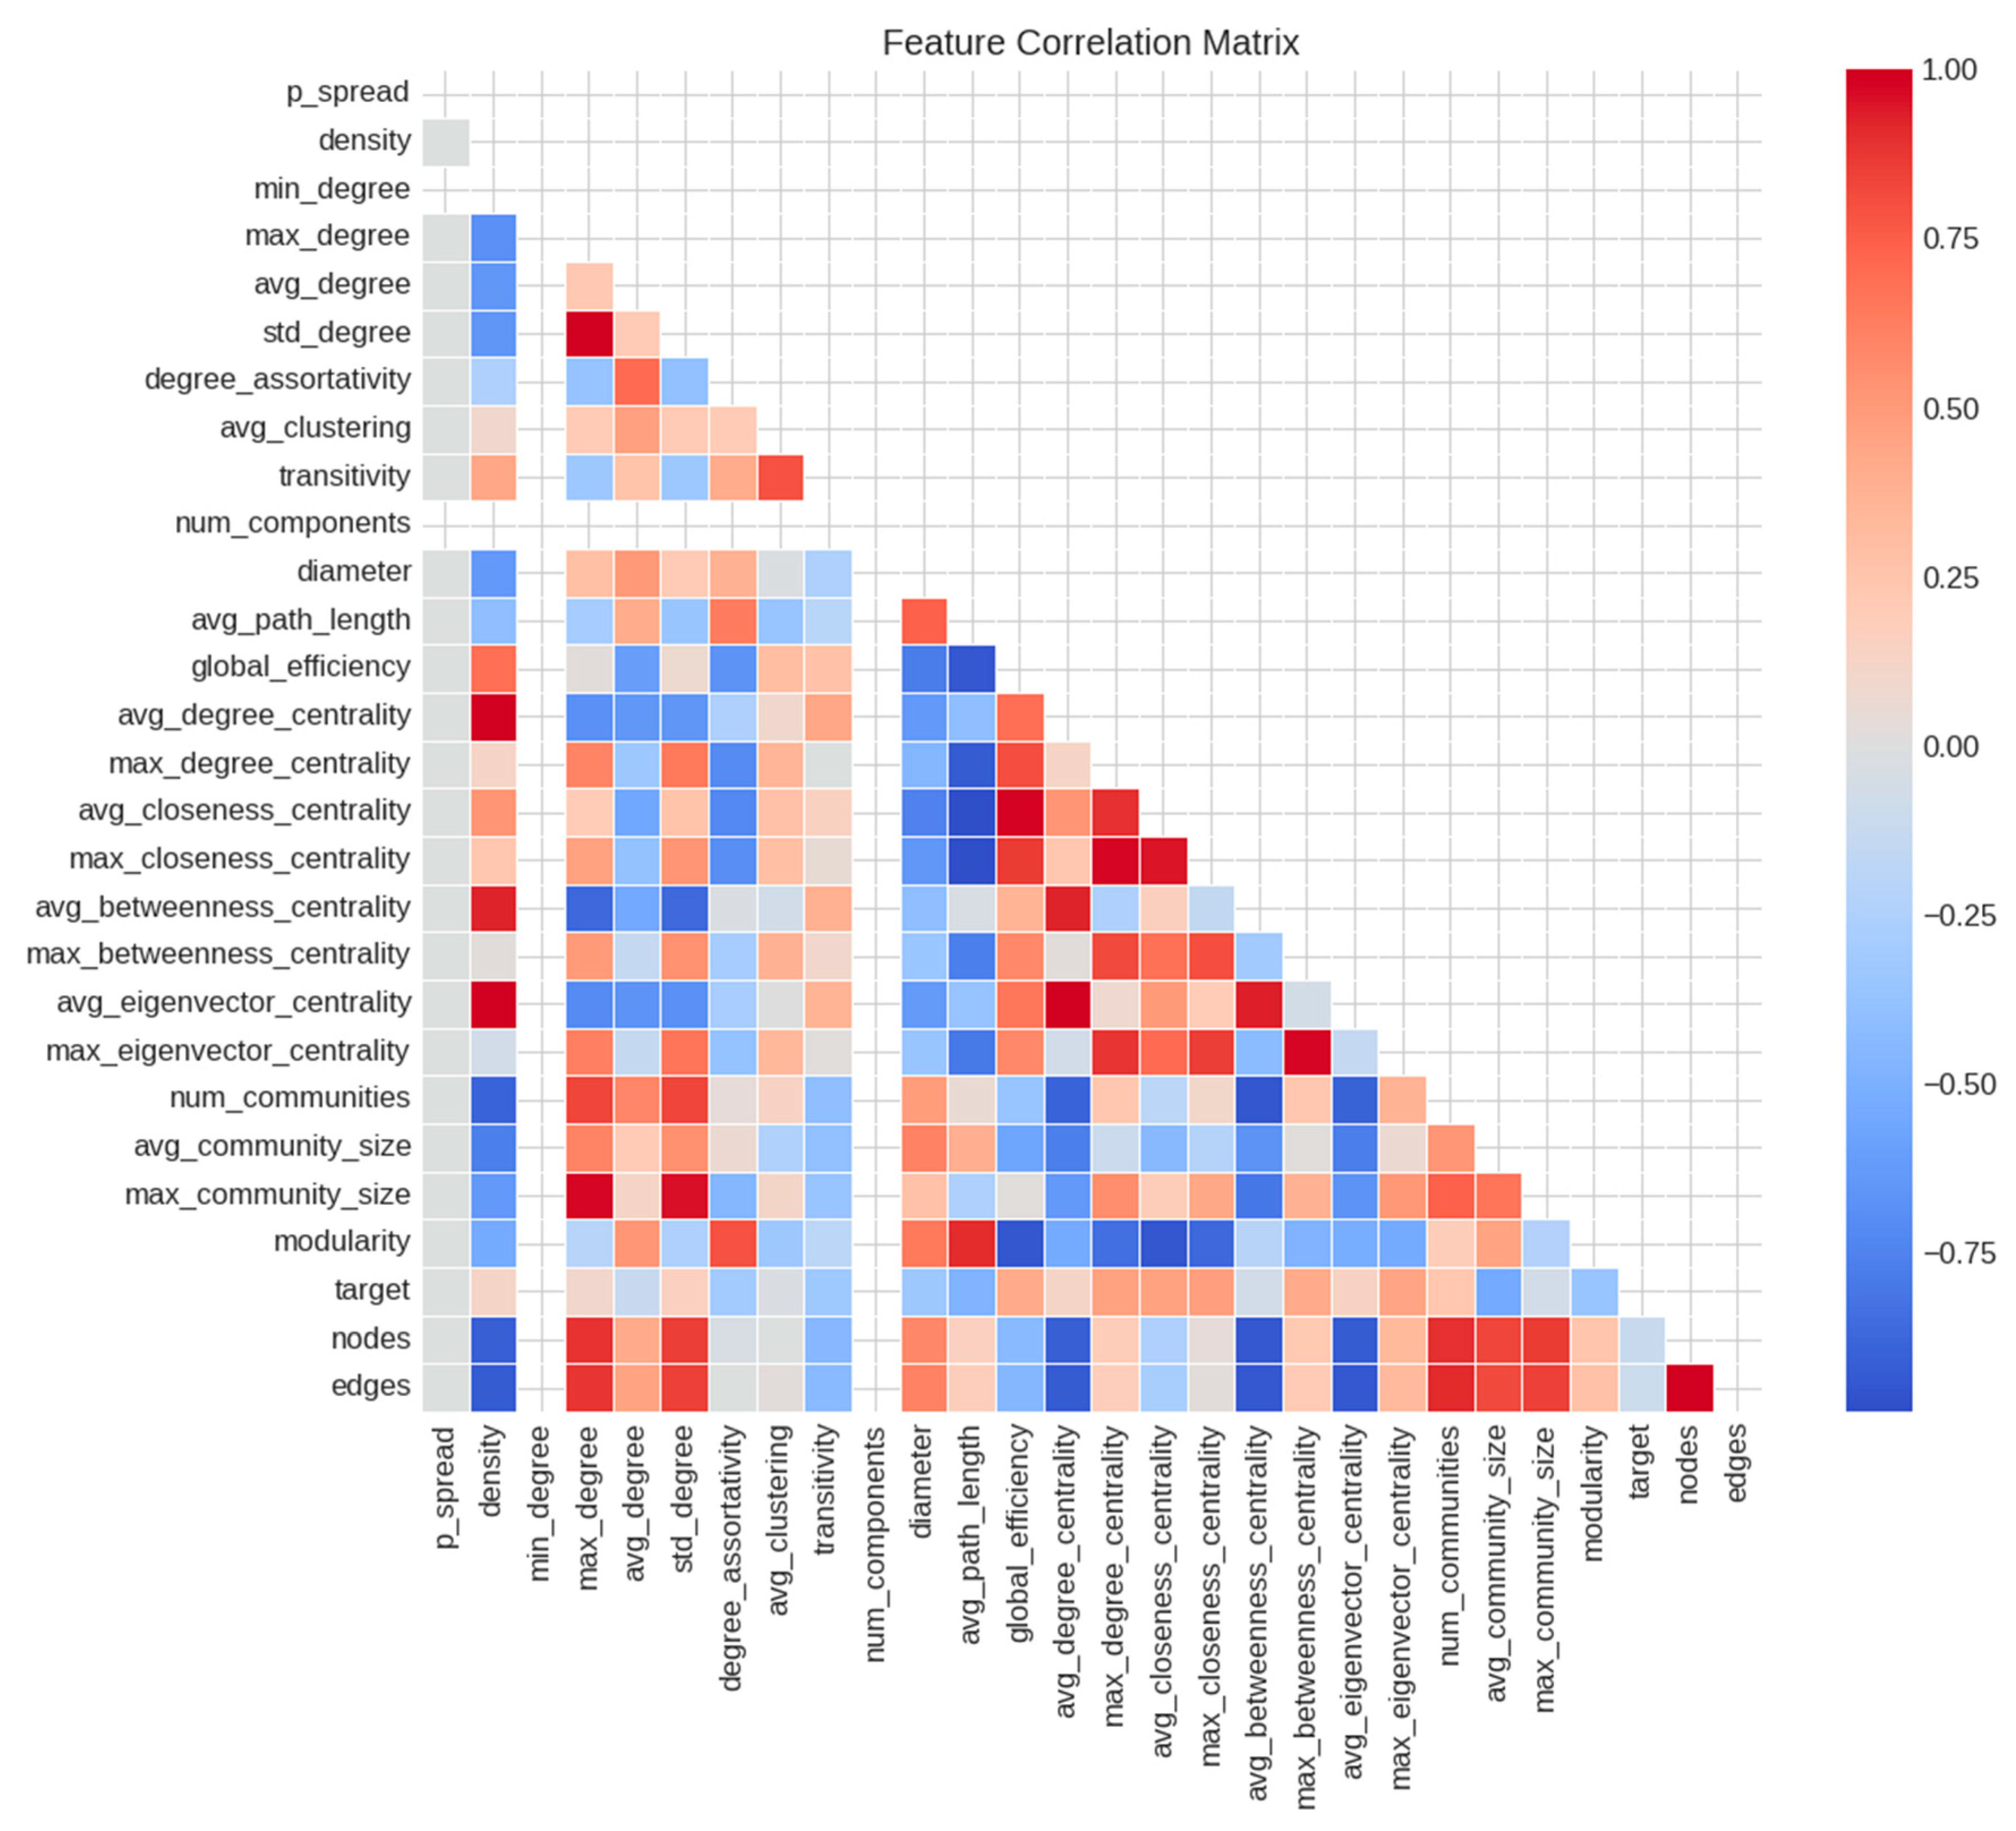
3.3. Feature Selection for Real Data
- density (r = 0.682);
- avg_degree_centrality (r = 0.682);
- avg_eigenvector_centrality (r = 0.668);
- edges (r = −0.605, negative correlation);
- nodes (r = −0.598, negative correlation).
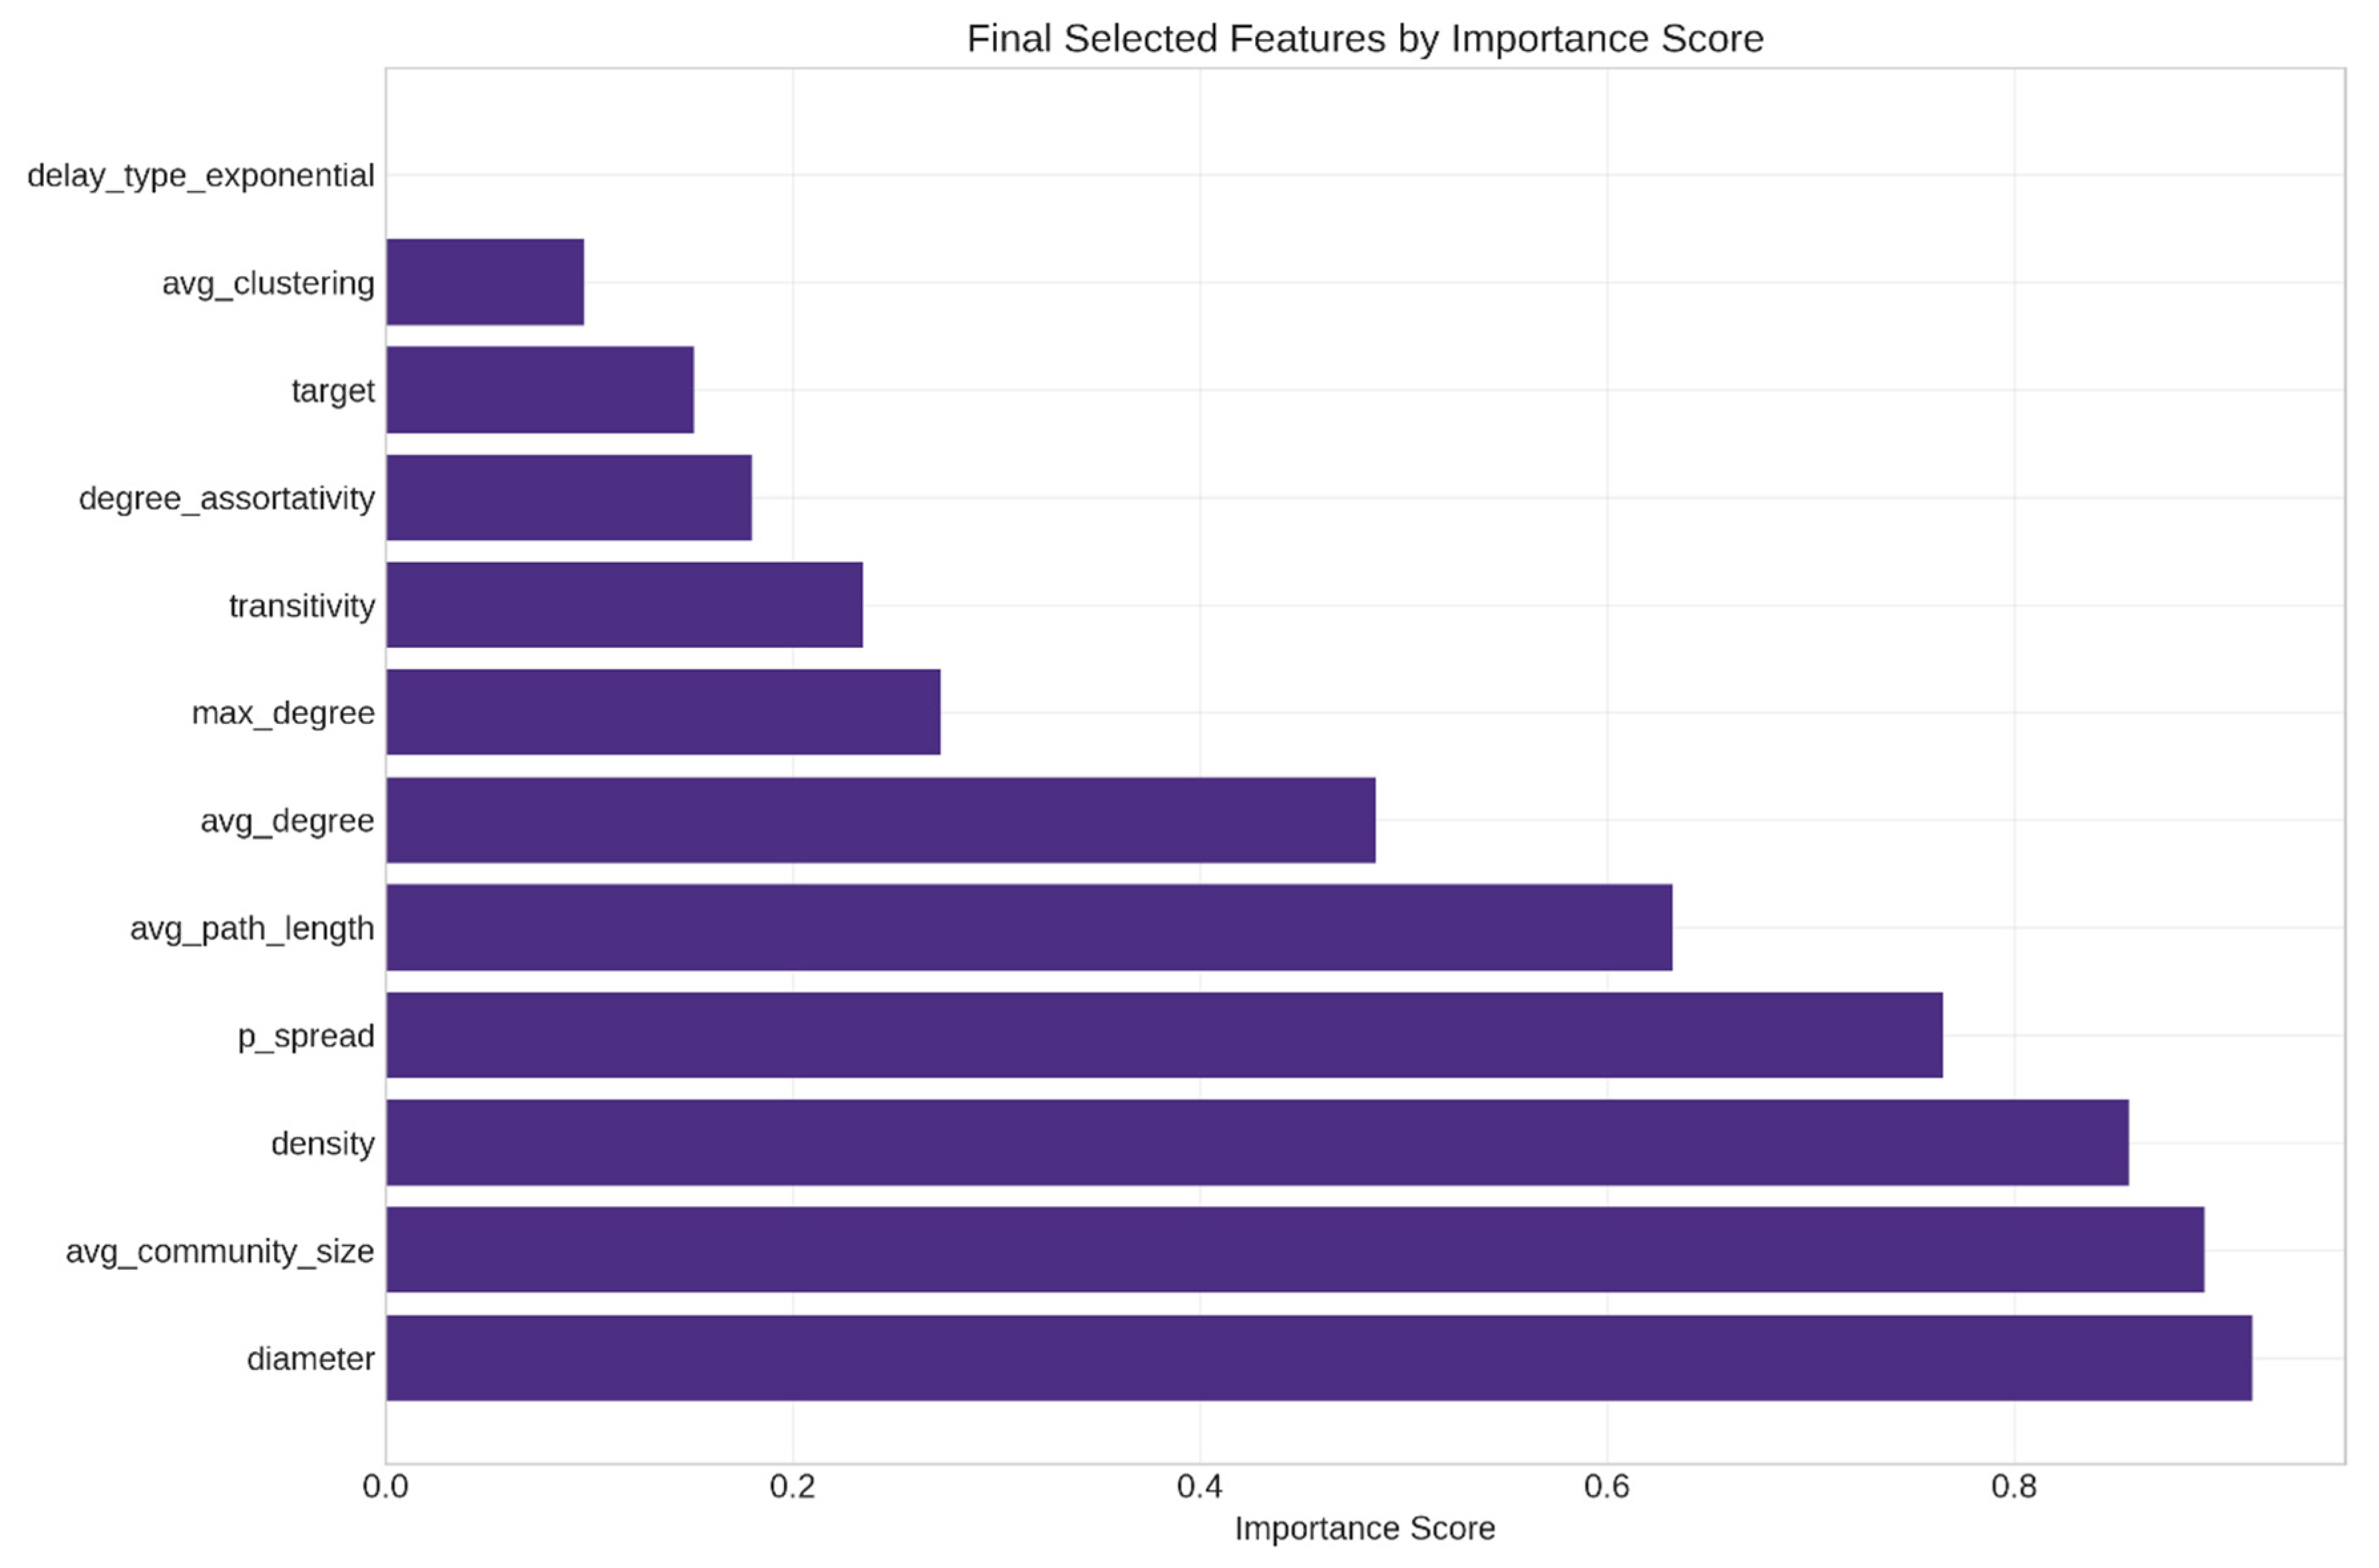
- min_degree;
- num_components;
- diameter;
- avg_community_size;
- density;
- p_spread;
- avg_path_length;
- avg_degree;
- max_degree;
- transitivity;
- degree_assortativity;
- target;
- avg_clustering;
- delay_type_exponential.
3.4. Synthetic Network Generation
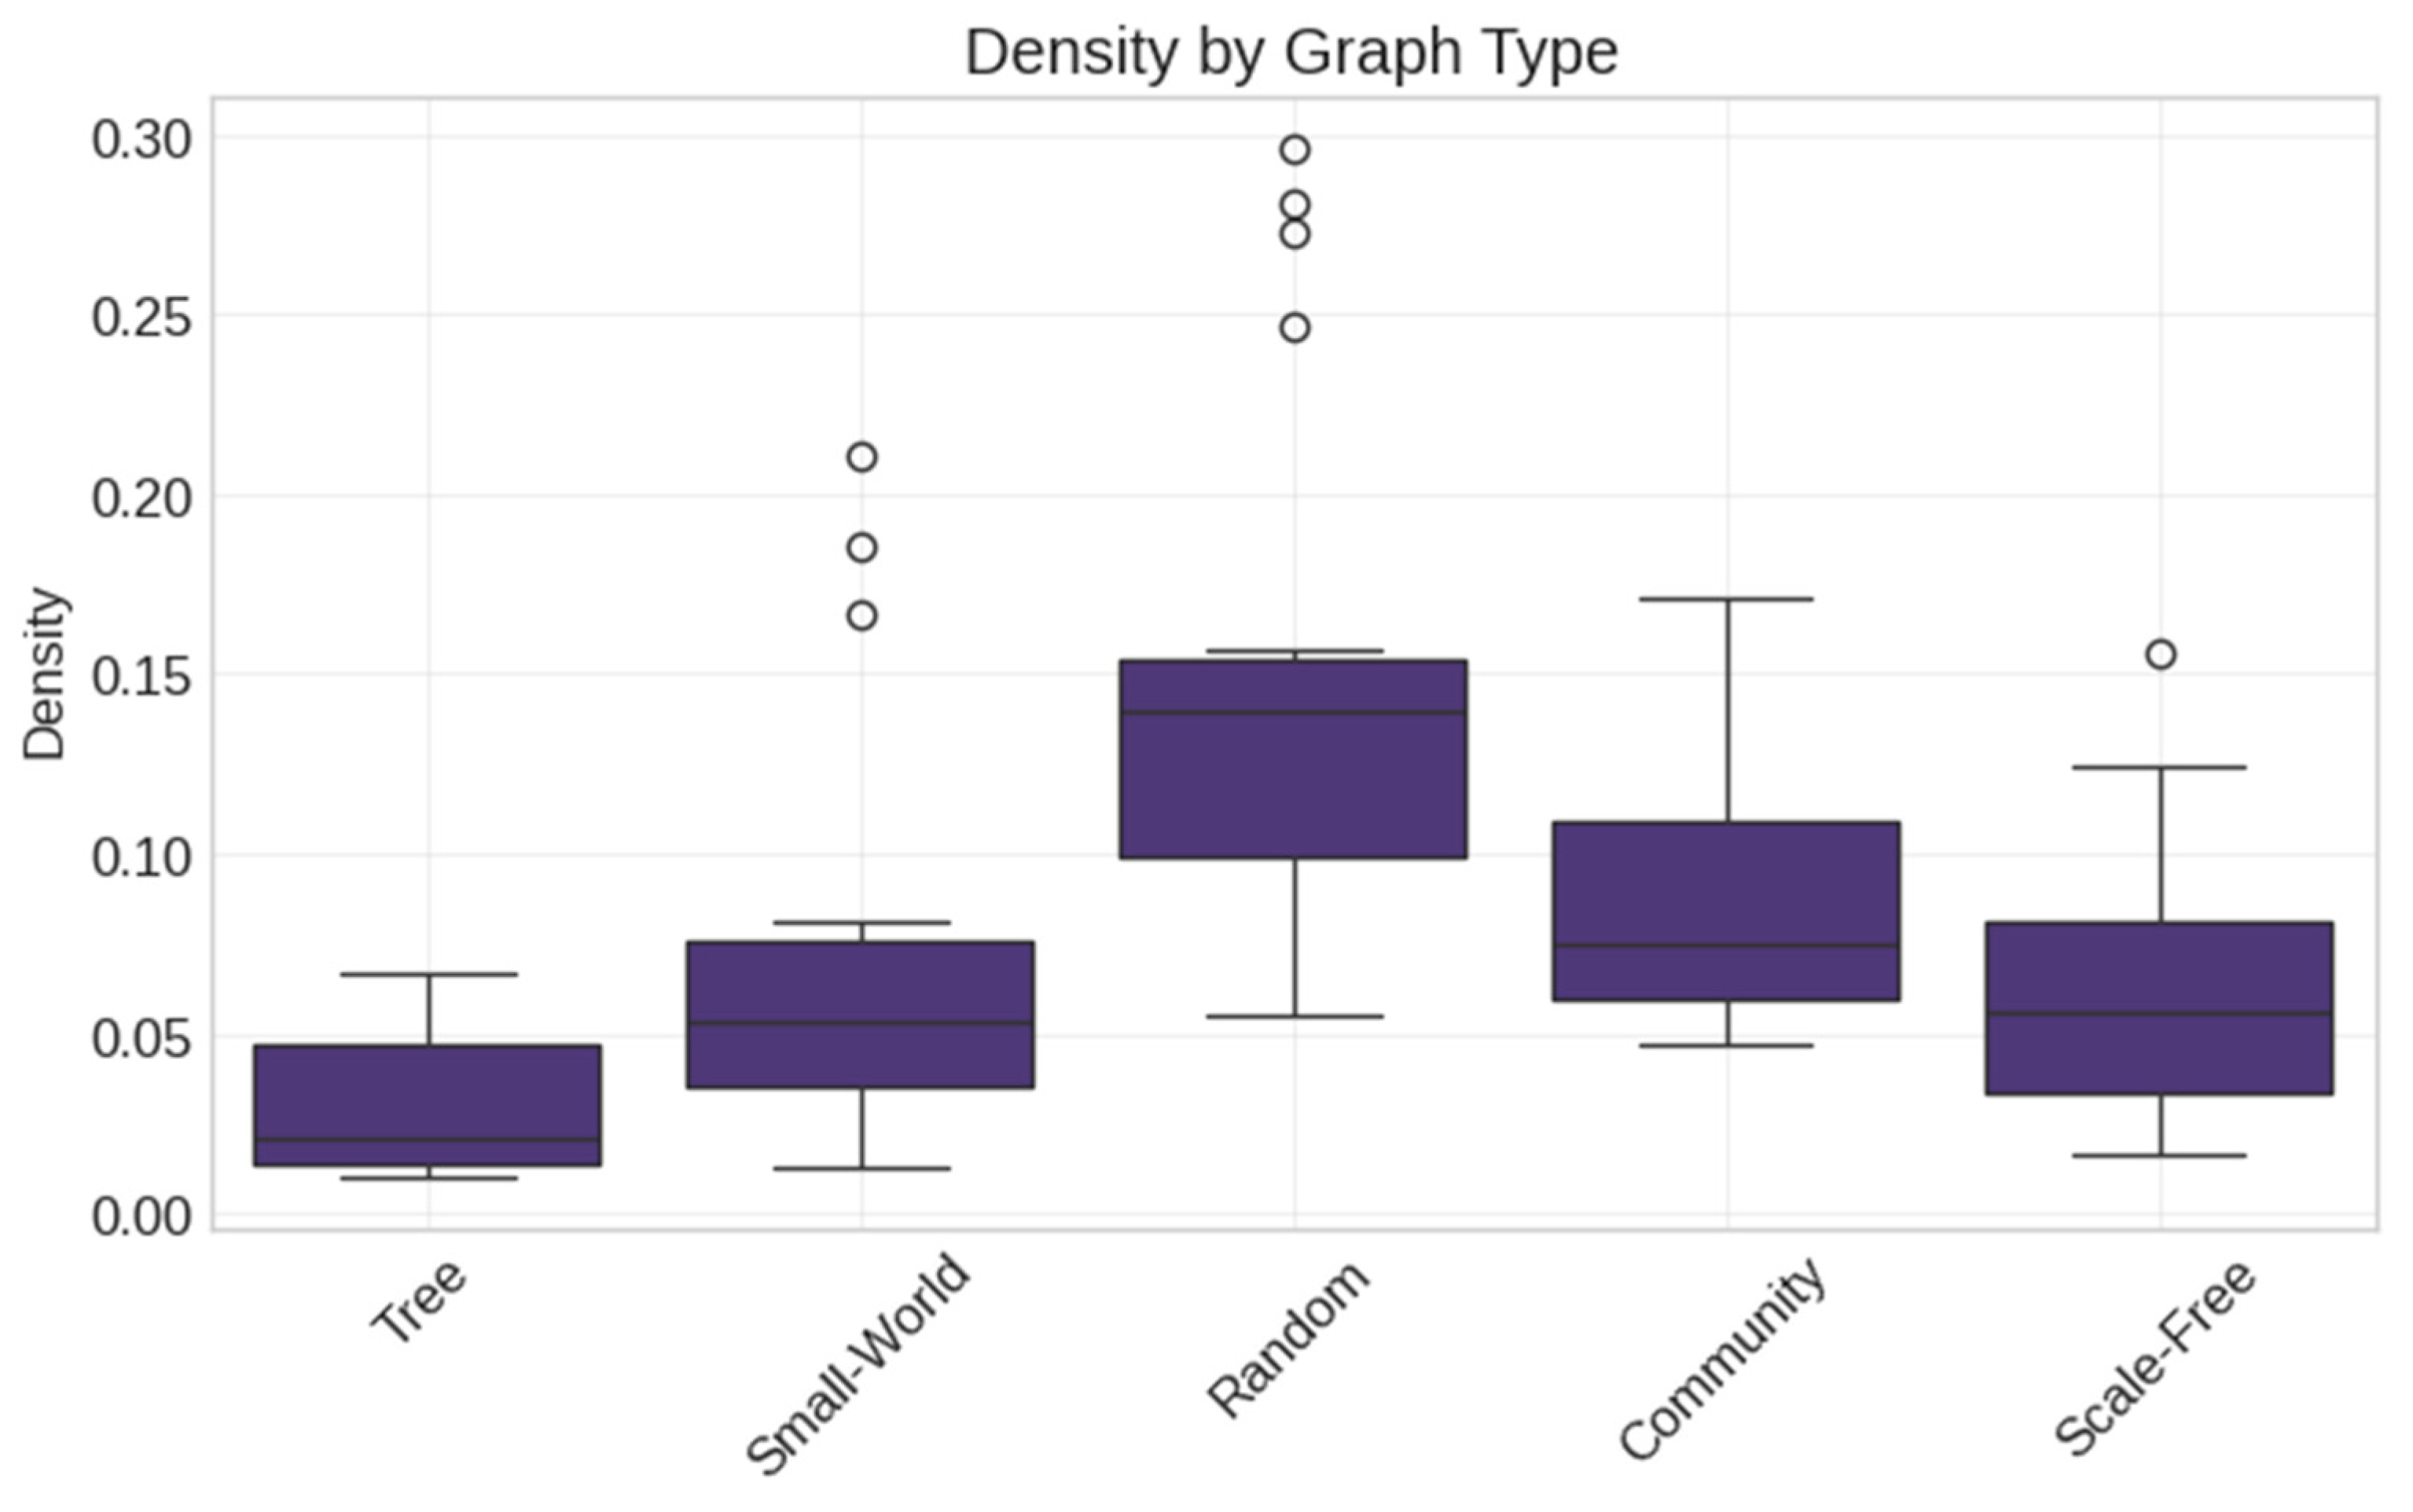
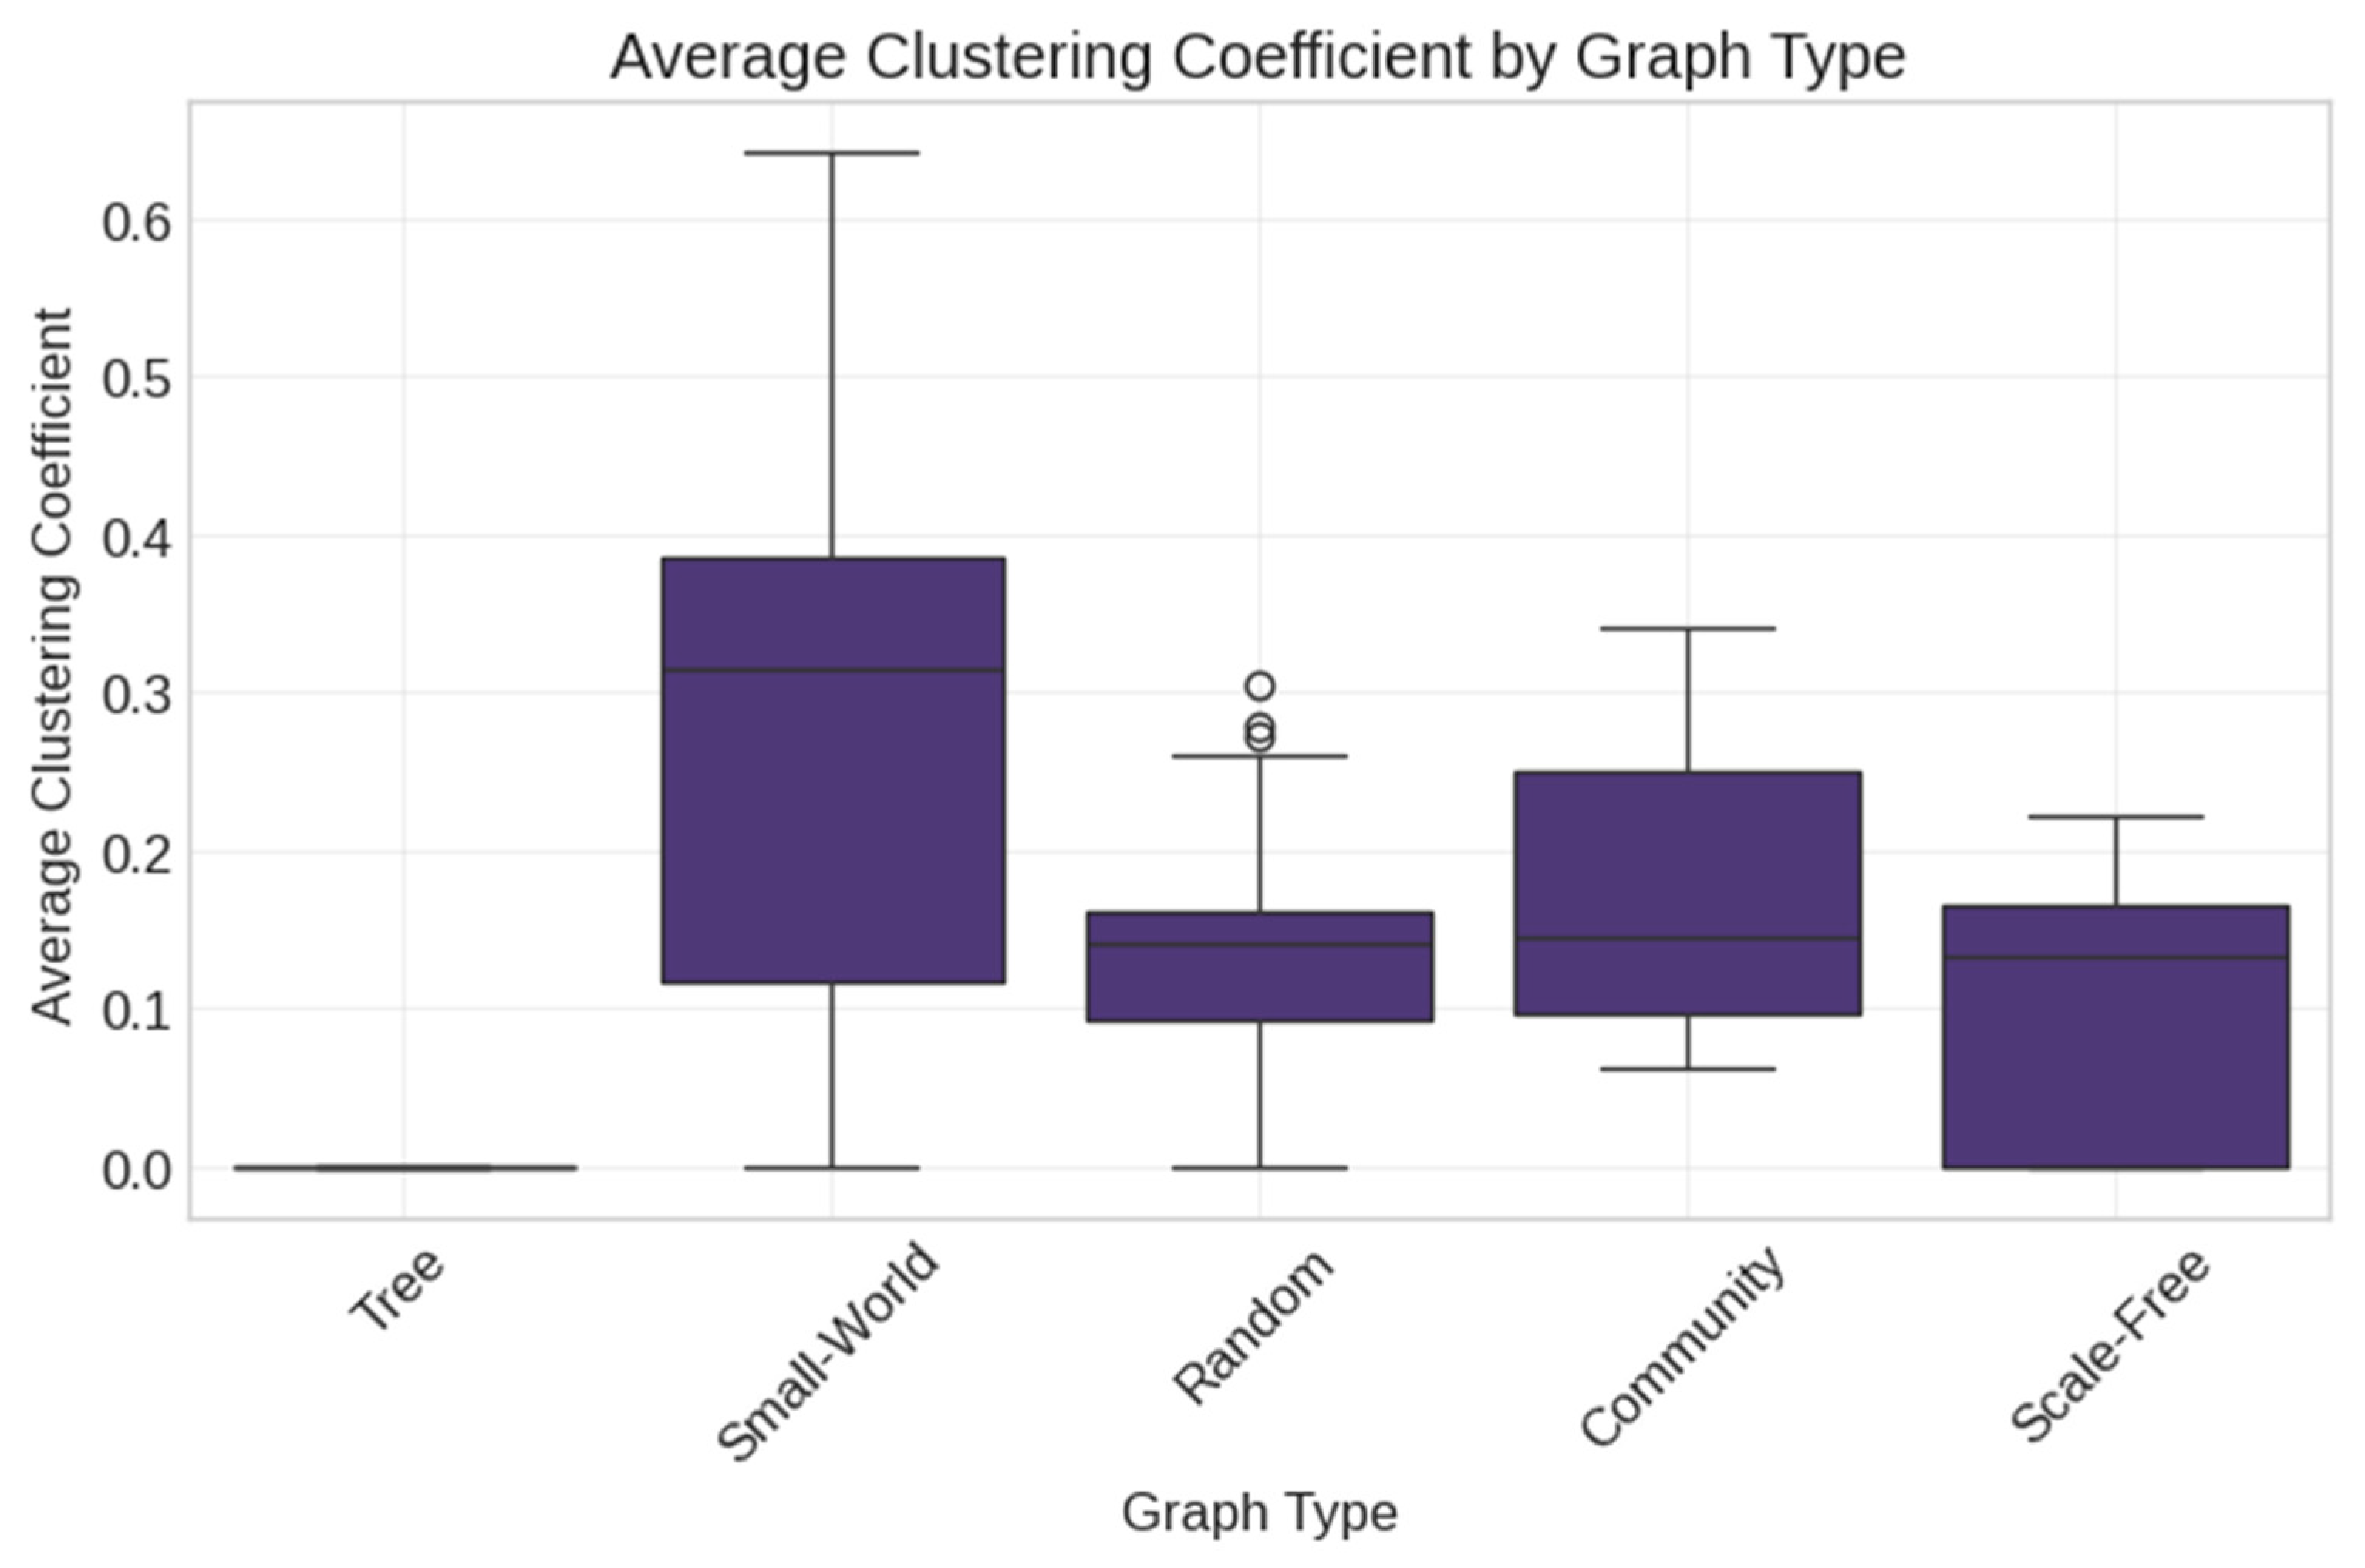
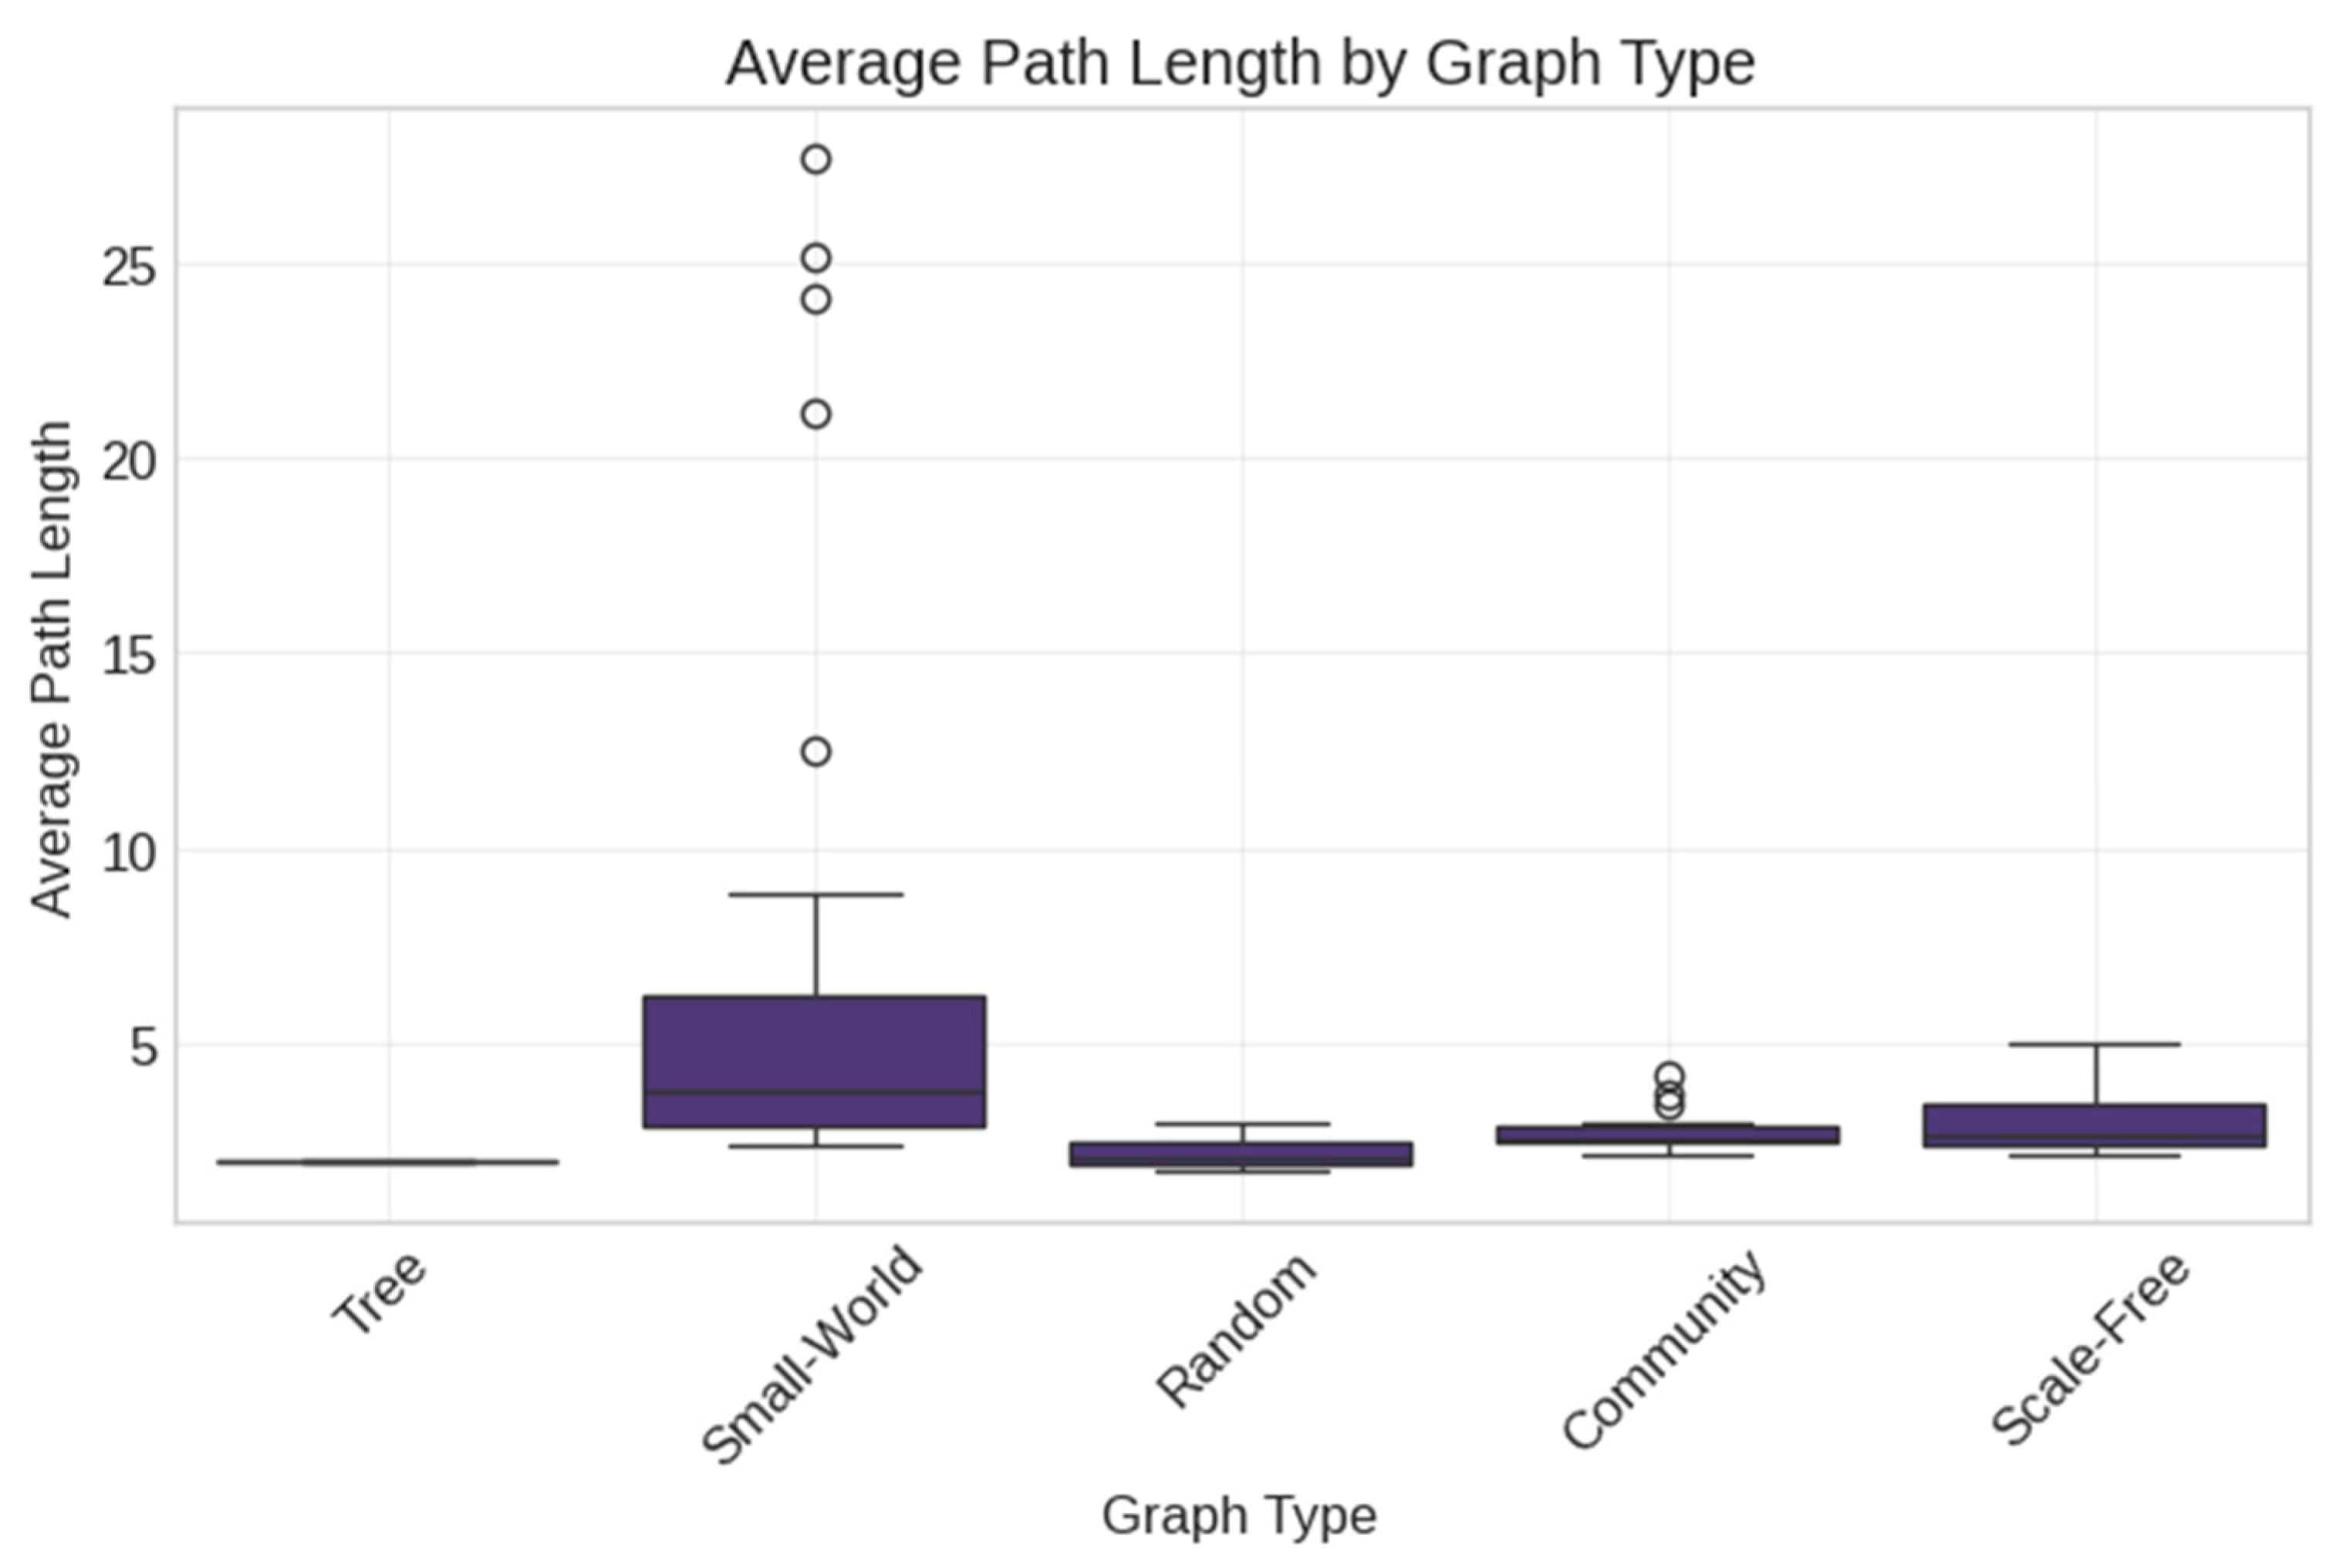
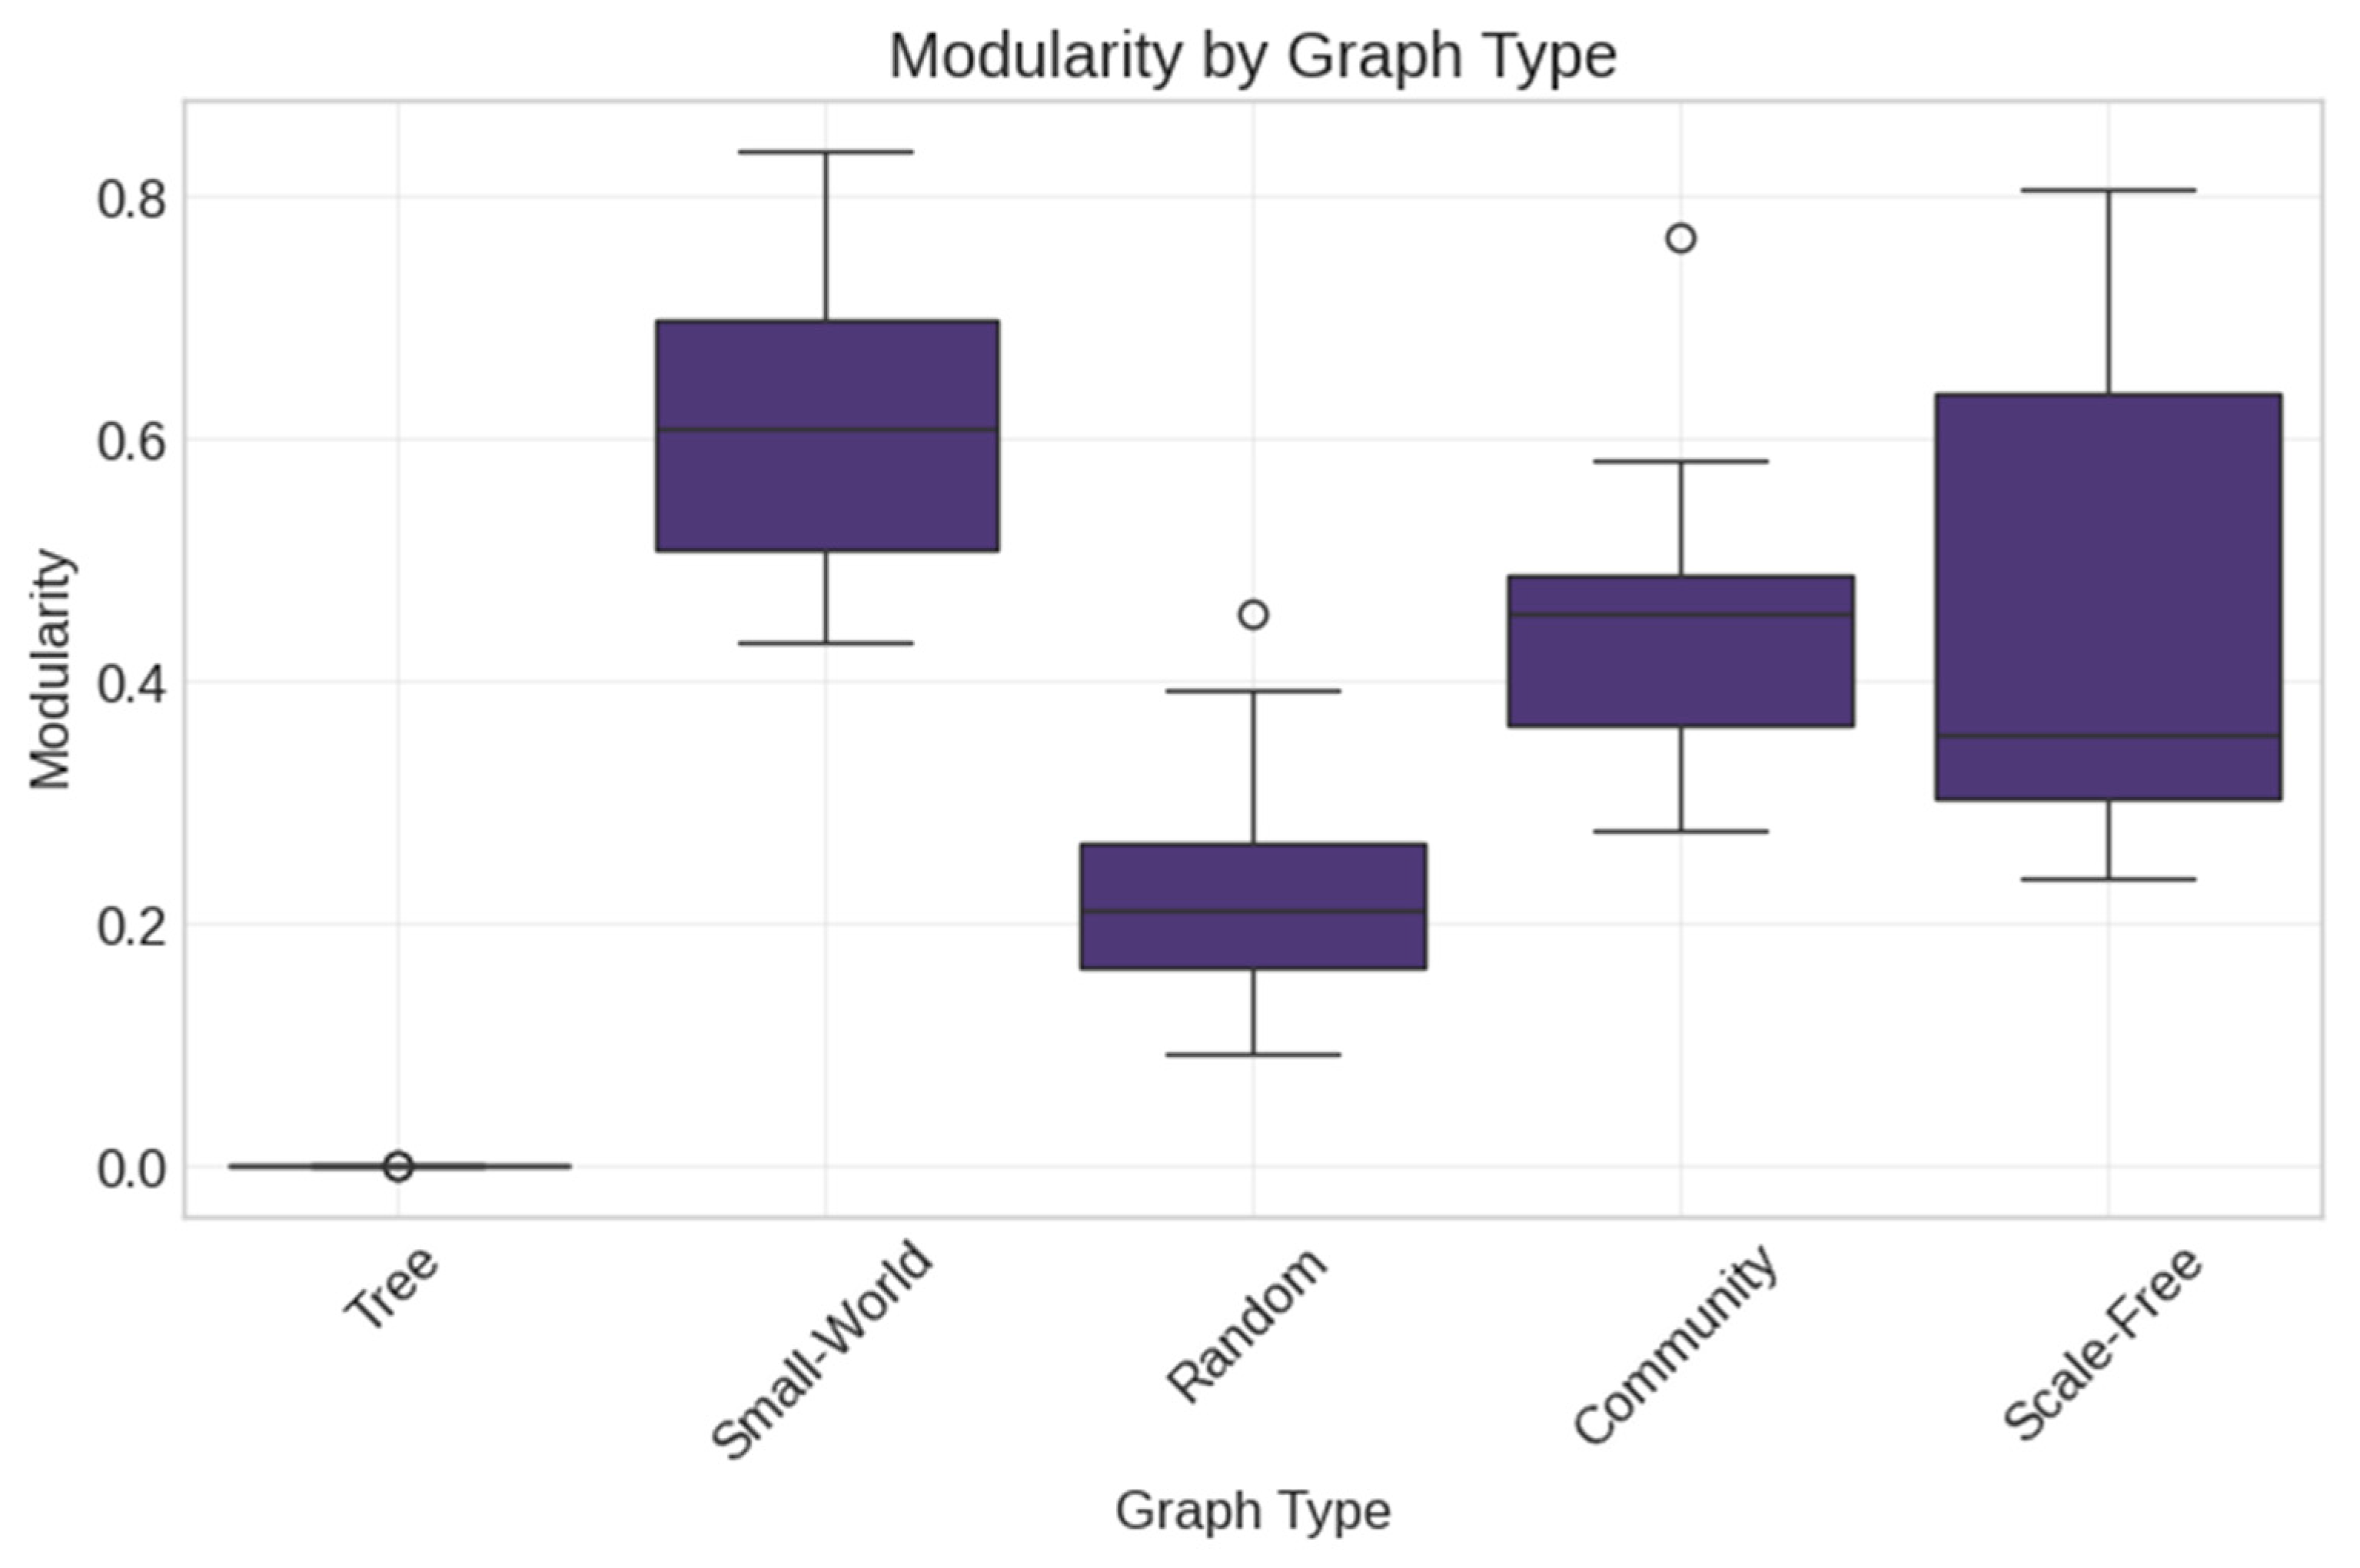
- Random (Erdős–Rényi) networks with varying density parameters;
- Scale-Free (Barabási–Albert) networks with preferential attachment;
- Small-World (Watts–Strogatz) networks with controlled clustering;
- Tree networks with hierarchical structures;
- Community networks with modular organization.
- Basic measures: nodes, edges, density;
- Degree statistics: min/max/avg degree, degree heterogeneity;
- Centralization metrics: various centrality measures;
- Connectivity metrics: diameter, average path length, components;
- Community structure: modularity, community size;
- Spectral properties: algebraic connectivity, spectral radius.
4. Methodology
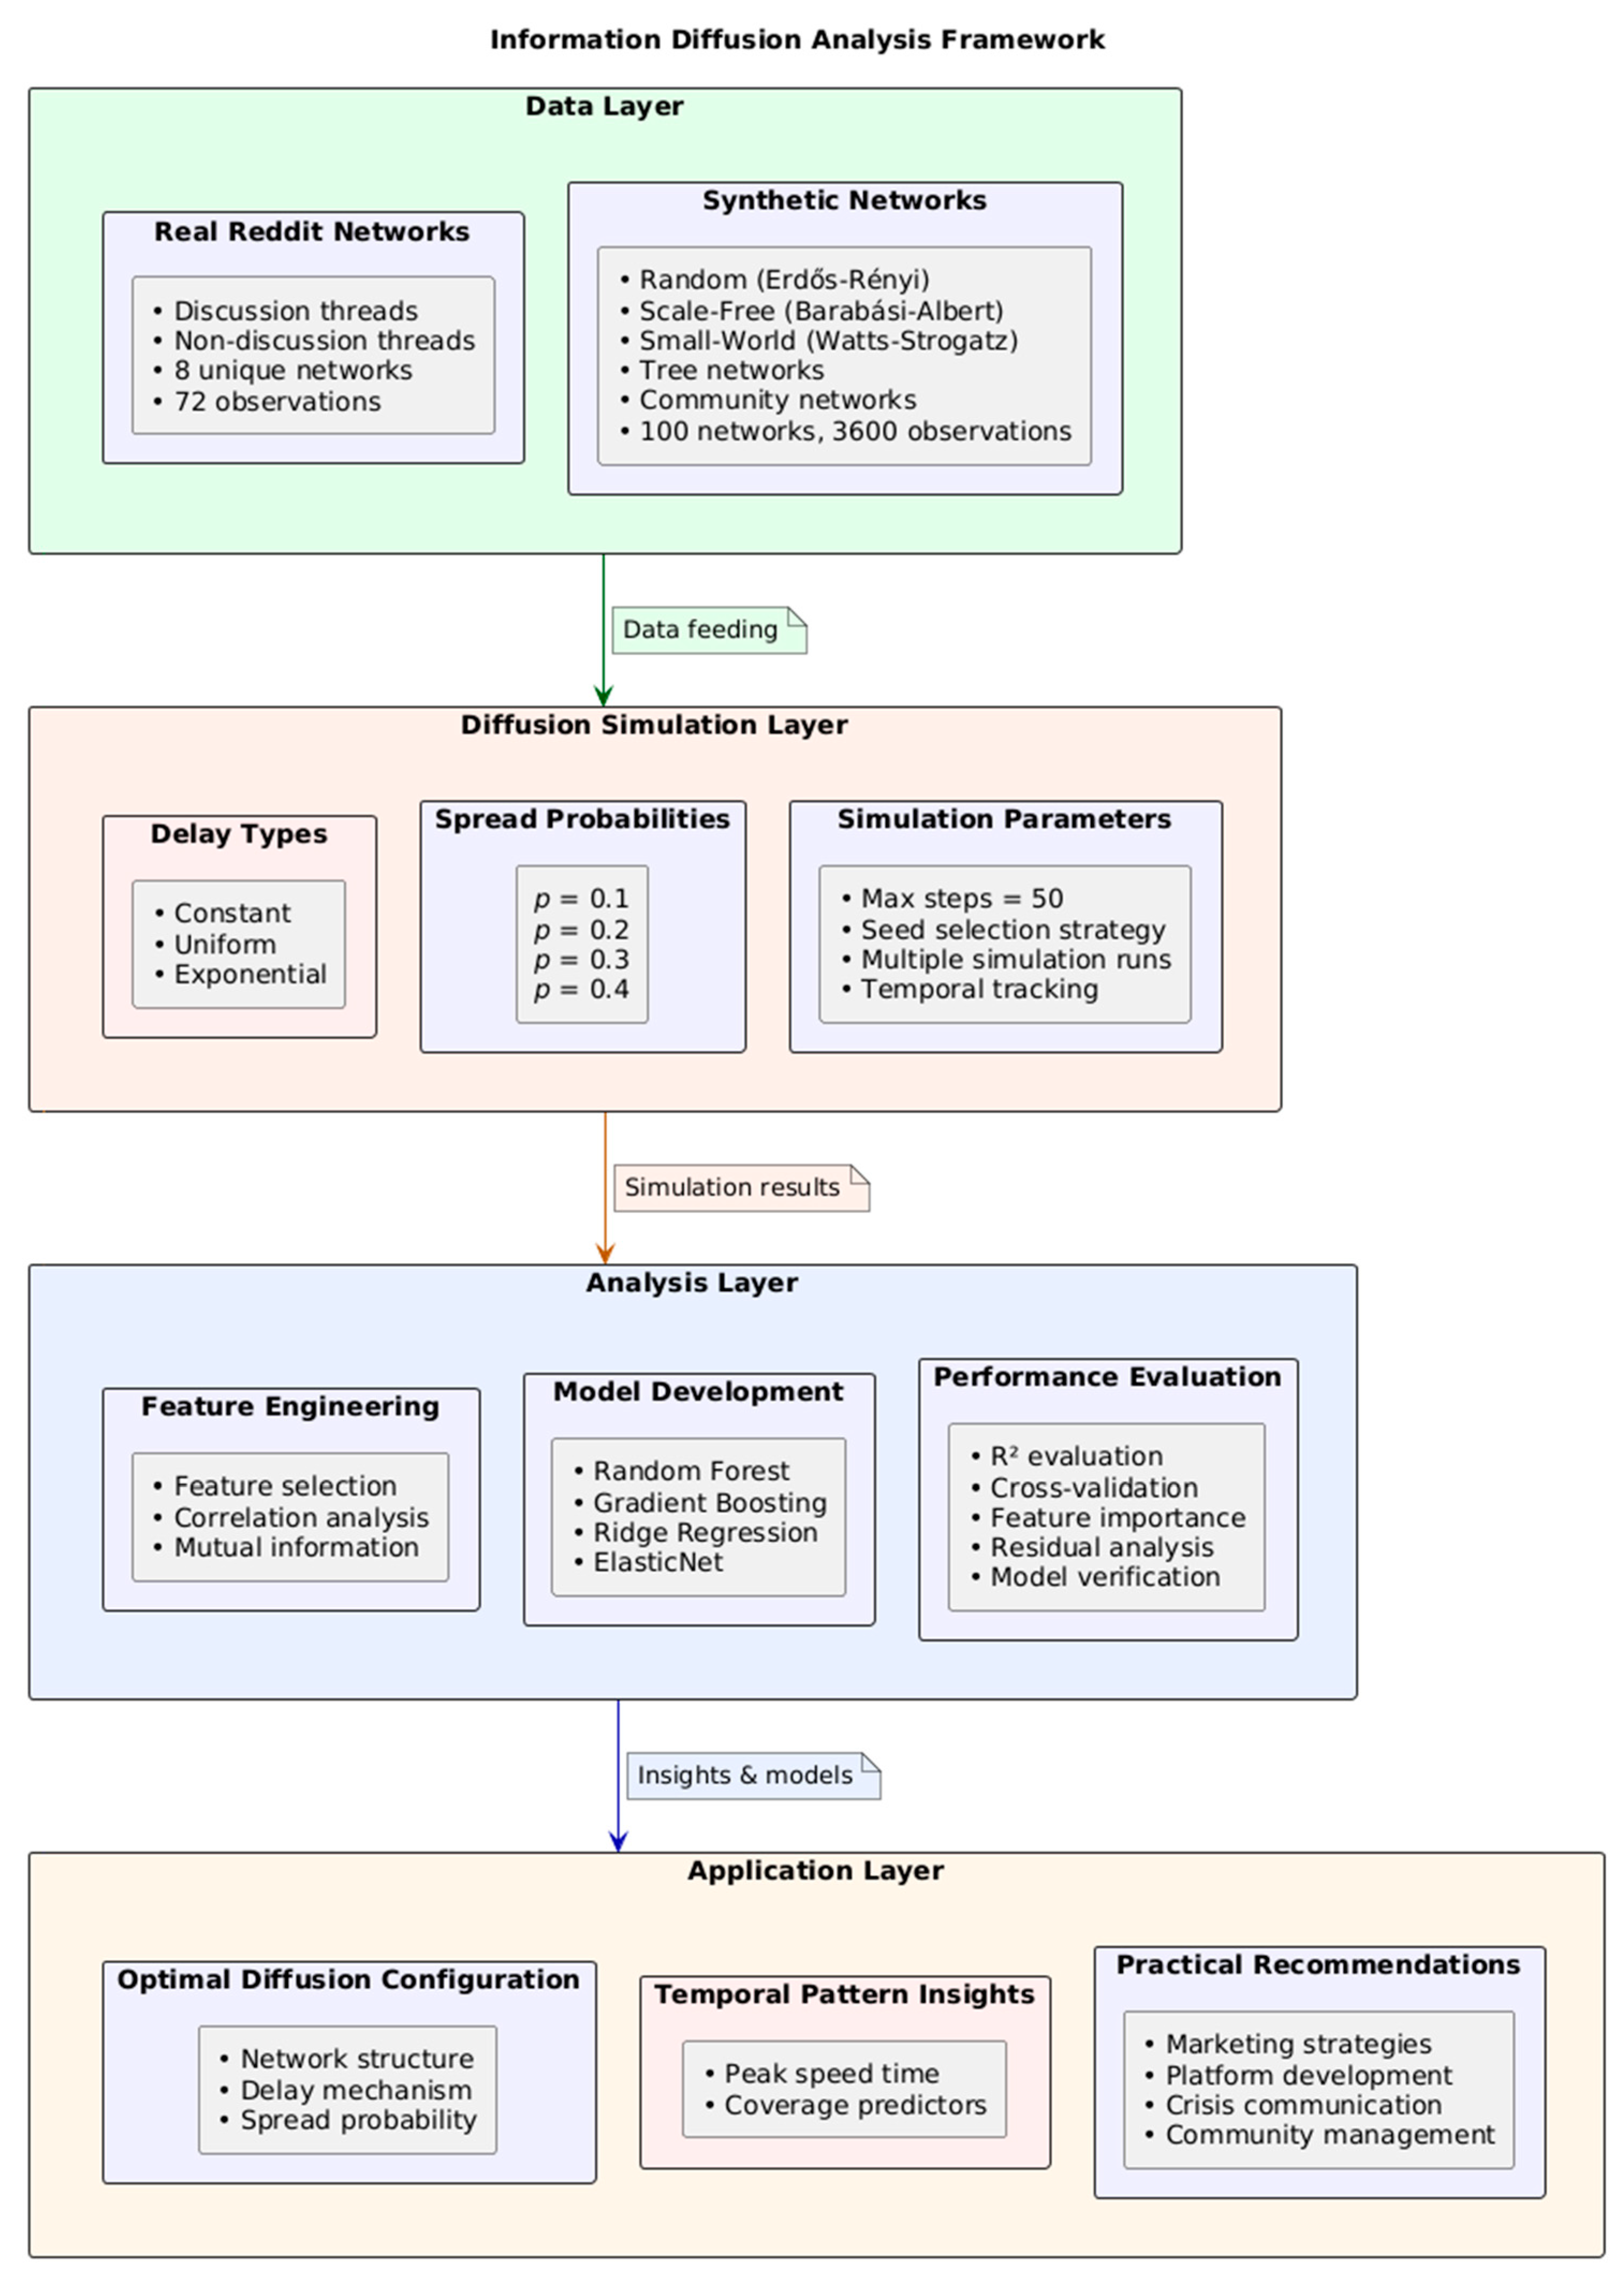
- Data Layer: This foundation includes both real Reddit thread networks (capturing authentic social interaction patterns) and synthetic networks (enabling controlled experimental conditions). The diversity of network types (Random, Scale-Free, Small-World, Tree, Community) allows for systematic comparison across topological variations representative of different social media interaction patterns.
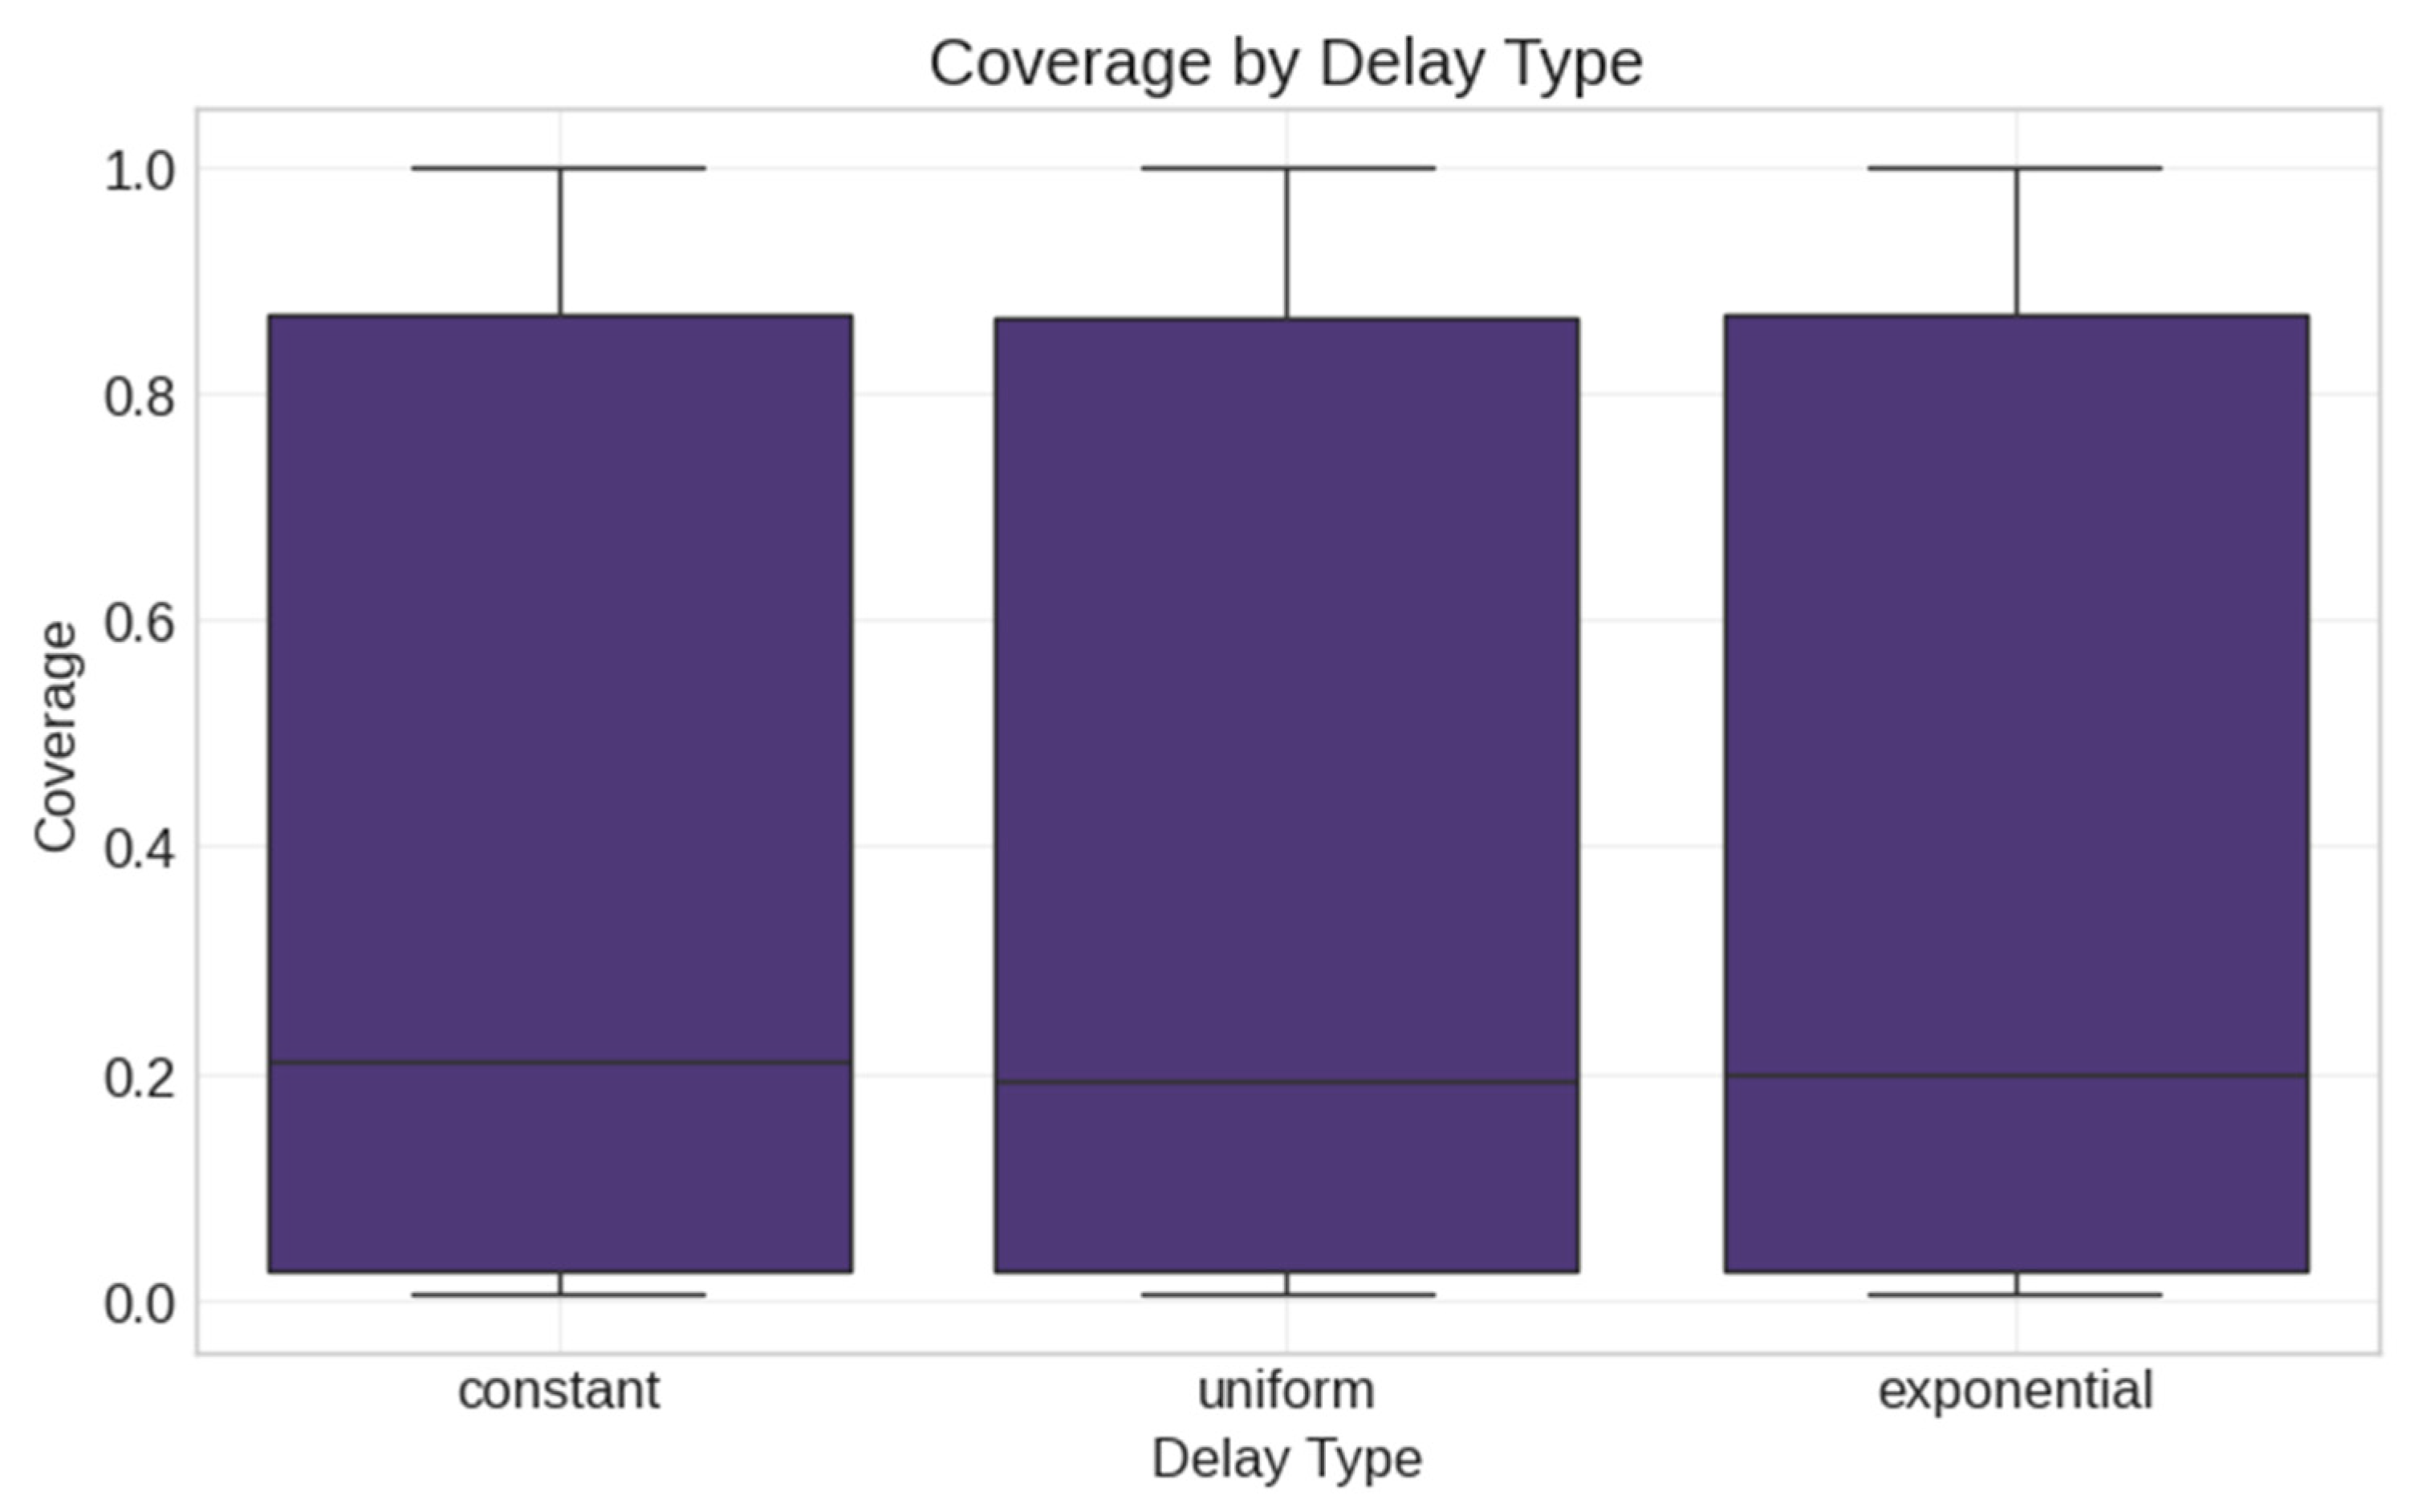
- Diffusion Simulation Layer: At this level, we implement three distinct delay mechanisms (constant, uniform, exponential) that model different patterns of user response timing in social networks. The simulation engine applies population dynamics principles to model how information spreads through network connections with parameterized transmission probabilities (0.1–0.4), representing different content engagement likelihoods.
- Analysis Layer: This component transforms simulation outputs into actionable insights through feature engineering, model training, and evaluation. The machine learning models (particularly Gradient Boosting and Random Forest) identify key predictive factors that determine information coverage across network types.
- Application Layer: Finally, our framework translates analytical findings into practical recommendations for social media stakeholders. These applications include optimizing information dissemination strategies, predicting viral content potential, and designing more effective network structures for specific communication goals.
- Each component addresses specific challenges in information diffusion modeling: the data layer provides ecological validity, the simulation layer captures temporal dynamics, the analysis layer identifies key predictors, and the application layer ensures practical relevance.
4.1. Information Diffusion Simulation
- At each time step, nodes that have reached their spreading time attempt to transmit information to their neighbors.
- Transmission succeeds with probability p_spread.
- Upon successful transmission, the neighbor node is activated.
- The newly activated node experiences a delay before it can spread information further.
- The delay duration depends on the specified delay mechanism.
- Constant delay—Every node experiences the same fixed delay (delay_param);
- Uniform delay—Delay is randomly selected from uniform distribution [1, delay_param];
- Exponential delay—Delay follows an exponential distribution with mean delay_param.
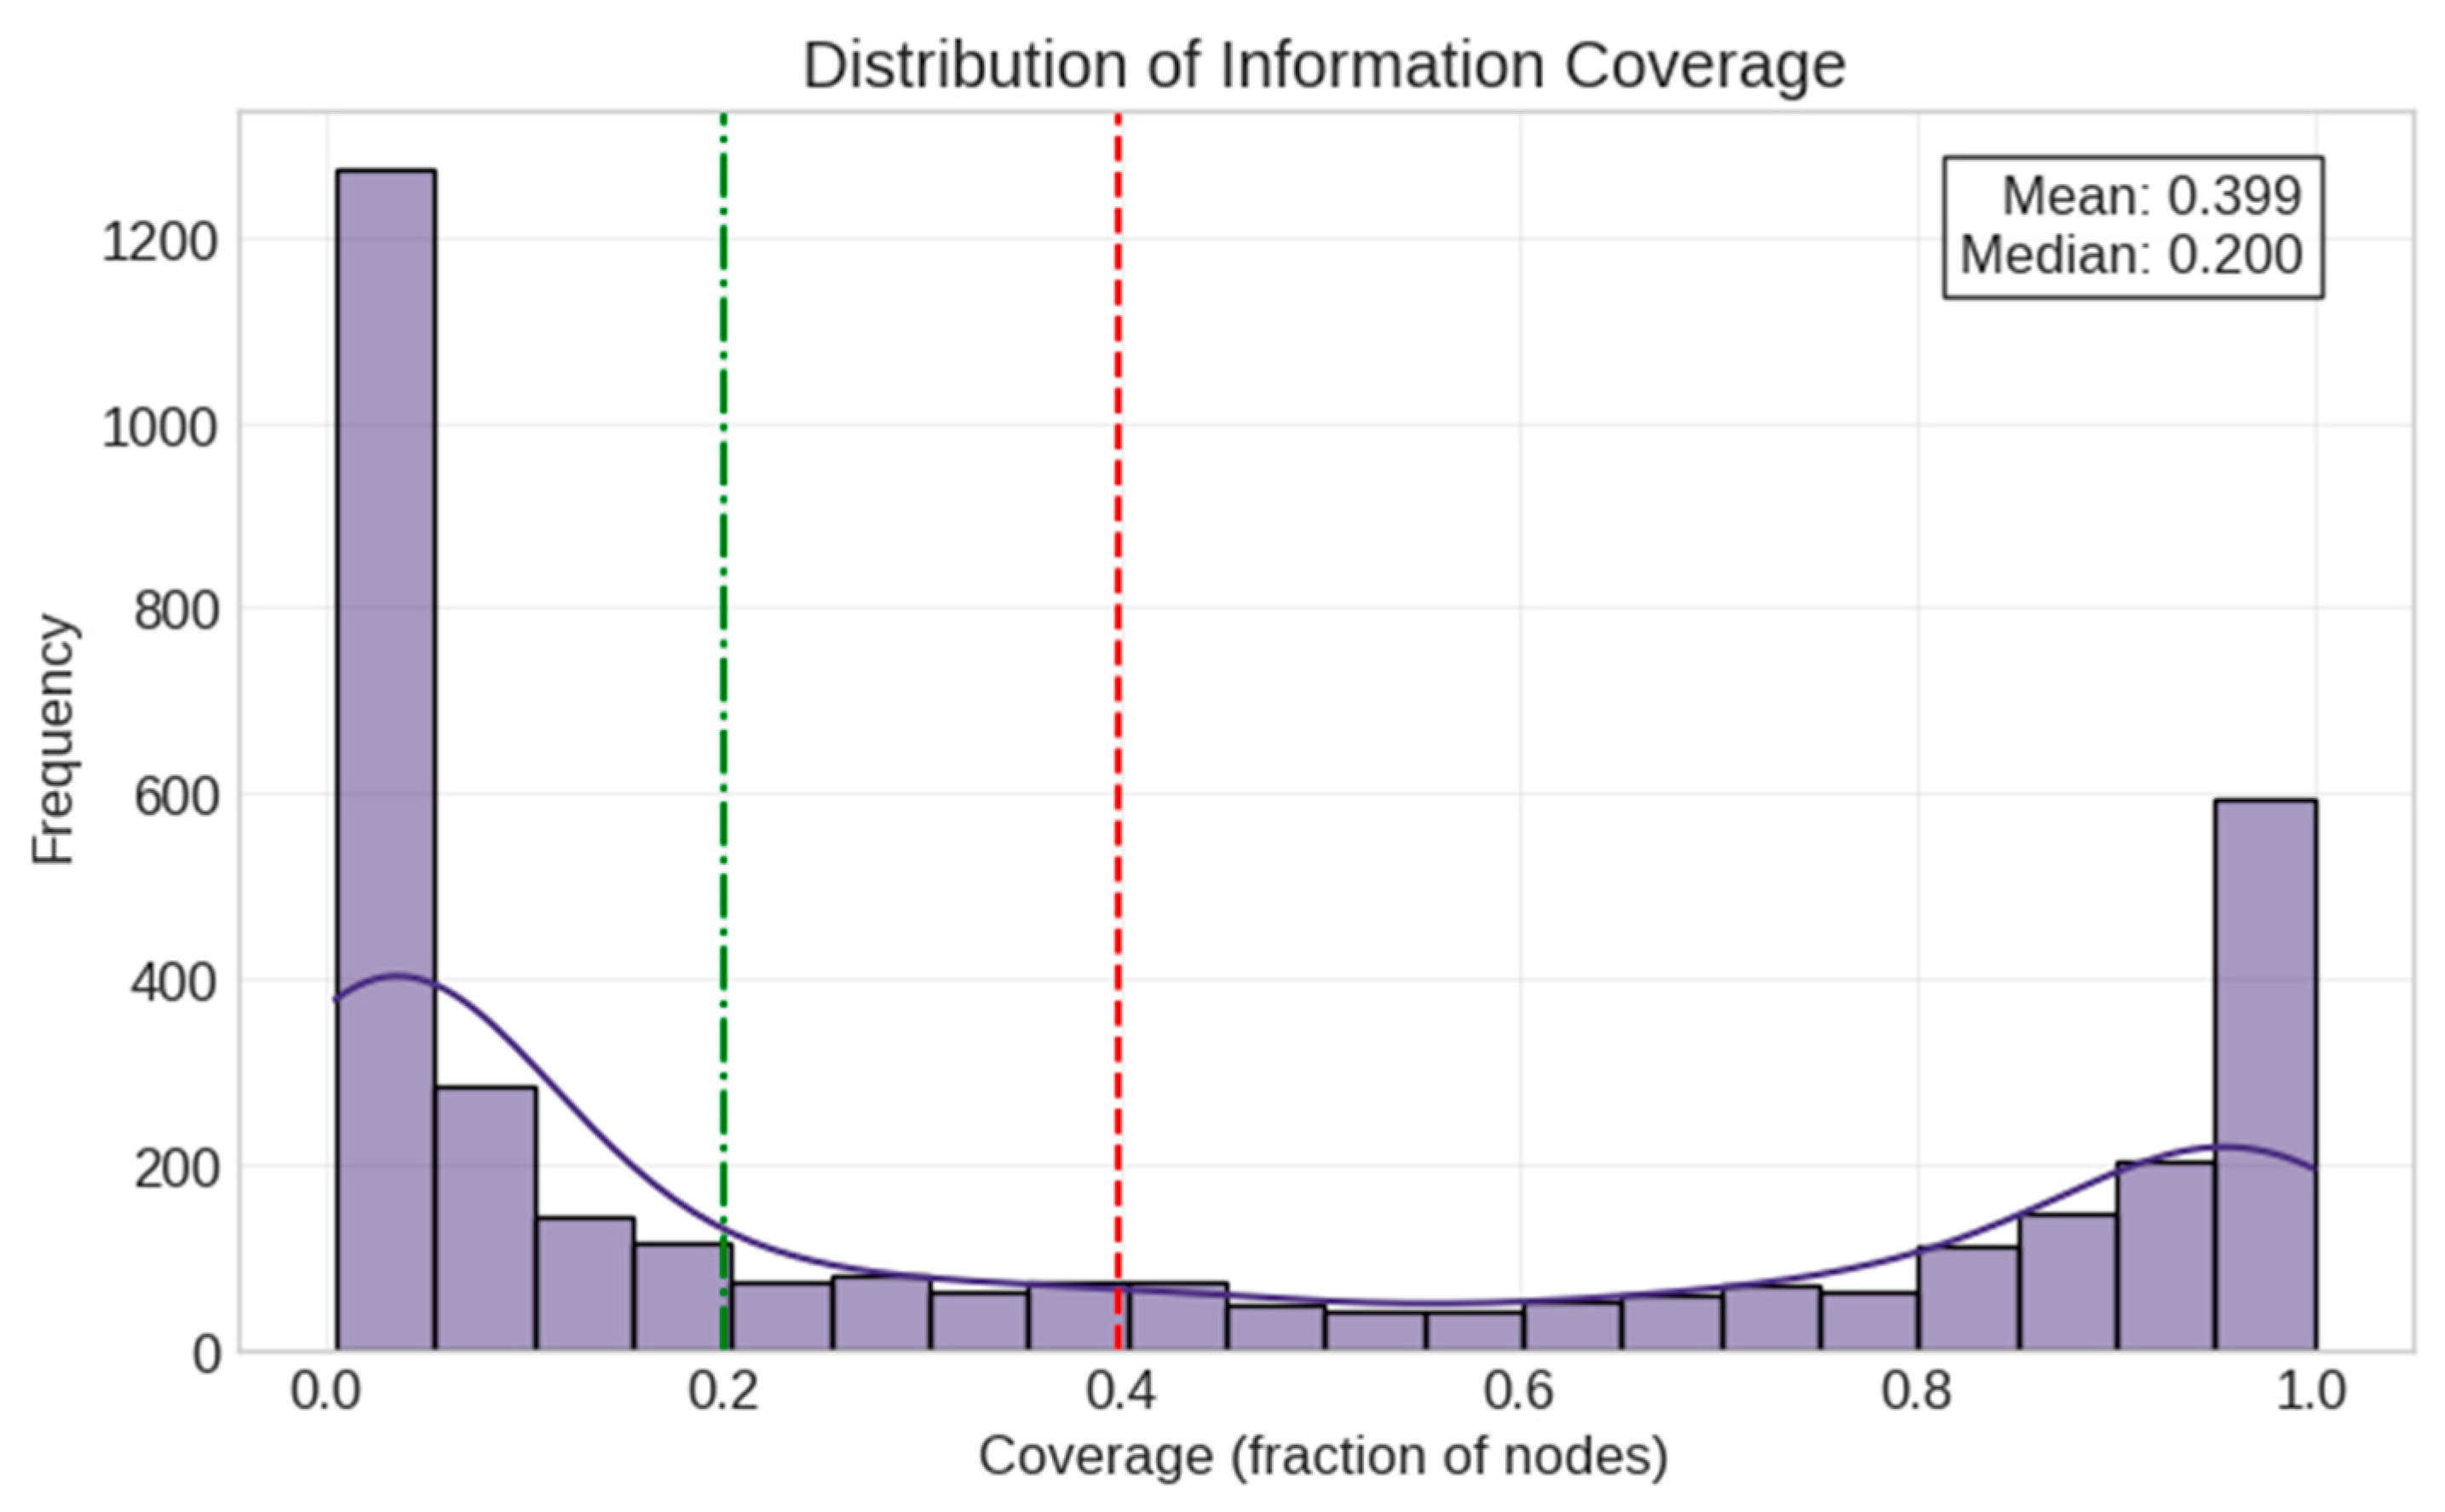
- Coverage (fraction of nodes that received information);
- Peak diffusion speed (maximum rate of new activations);
- Time to reach peak speed;
- Time to half coverage (when 50% of nodes are activated);
- Full activation history over time.
| Algorithm 1: Information diffusion with delay |
| Input: Graph G, seed_nodes (optional), p_spread, max_steps, delay_type, delay_param Output: Diffusion results (coverage, temporal dynamics) 1: // Initialize with seed nodes 2: if seed_nodes is None then 3: degrees ← Calculate node degrees in G 4: candidate_nodes ← Sort nodes by degree (descending) 5: seed_nodes ← Randomly select one high-degree node 6: end if 7: 8: // Initialize tracking dictionaries 9: activation_times ← {node: ∞ for all nodes in G} 10: spreading_times ← {node: ∞ for all nodes in G} 11: for seed in seed_nodes do 12: activation_times[seed] ← 0 13: spreading_times[seed] ← 0 14: end for 15: 16: // Run diffusion simulation 17: active_nodes ← seed_nodes 18: current_step ← 0 19: history ← {} 20: while current_step < max_steps AND active_nodes not empty do 21: new_activations ← {} 22: for node in active_nodes do 23: if spreading_times[node] ≤ current_step then 24: for neighbor in G.neighbors(node) do 25: if activation_times[neighbor] = ∞ AND random() < p_spread then 26: activation_times[neighbor] ← current_step 27: // Calculate delay based on specified mechanism 28: if delay_type = "constant" then 29: delay ← delay_param 30: else if delay_type = "uniform" then 31: delay ← random_uniform(1, delay_param) 32: else if delay_type = "exponential" then 33: delay ← random_exponential(delay_param) 34: end if 35: spreading_times[neighbor] ← current_step + delay 36: new_activations.add(neighbor) 37: end if 38: end for 39: end if 40: end for 41: active_nodes.update(new_activations) 42: history[current_step] ← count nodes with activation_time ≤ current_step 43: current_step ← current_step + 1 44: end while 45: 46: // Calculate metrics 47: coverage ← proportion of nodes with finite activation_time 48: active_counts ← differences between consecutive history values 49: peak_speed ← maximum value in active_counts 50: peak_speed_time ← time step of peak_speed 51: 52: return coverage, peak_speed, peak_speed_time, history |
- A total of 100 different network structures;
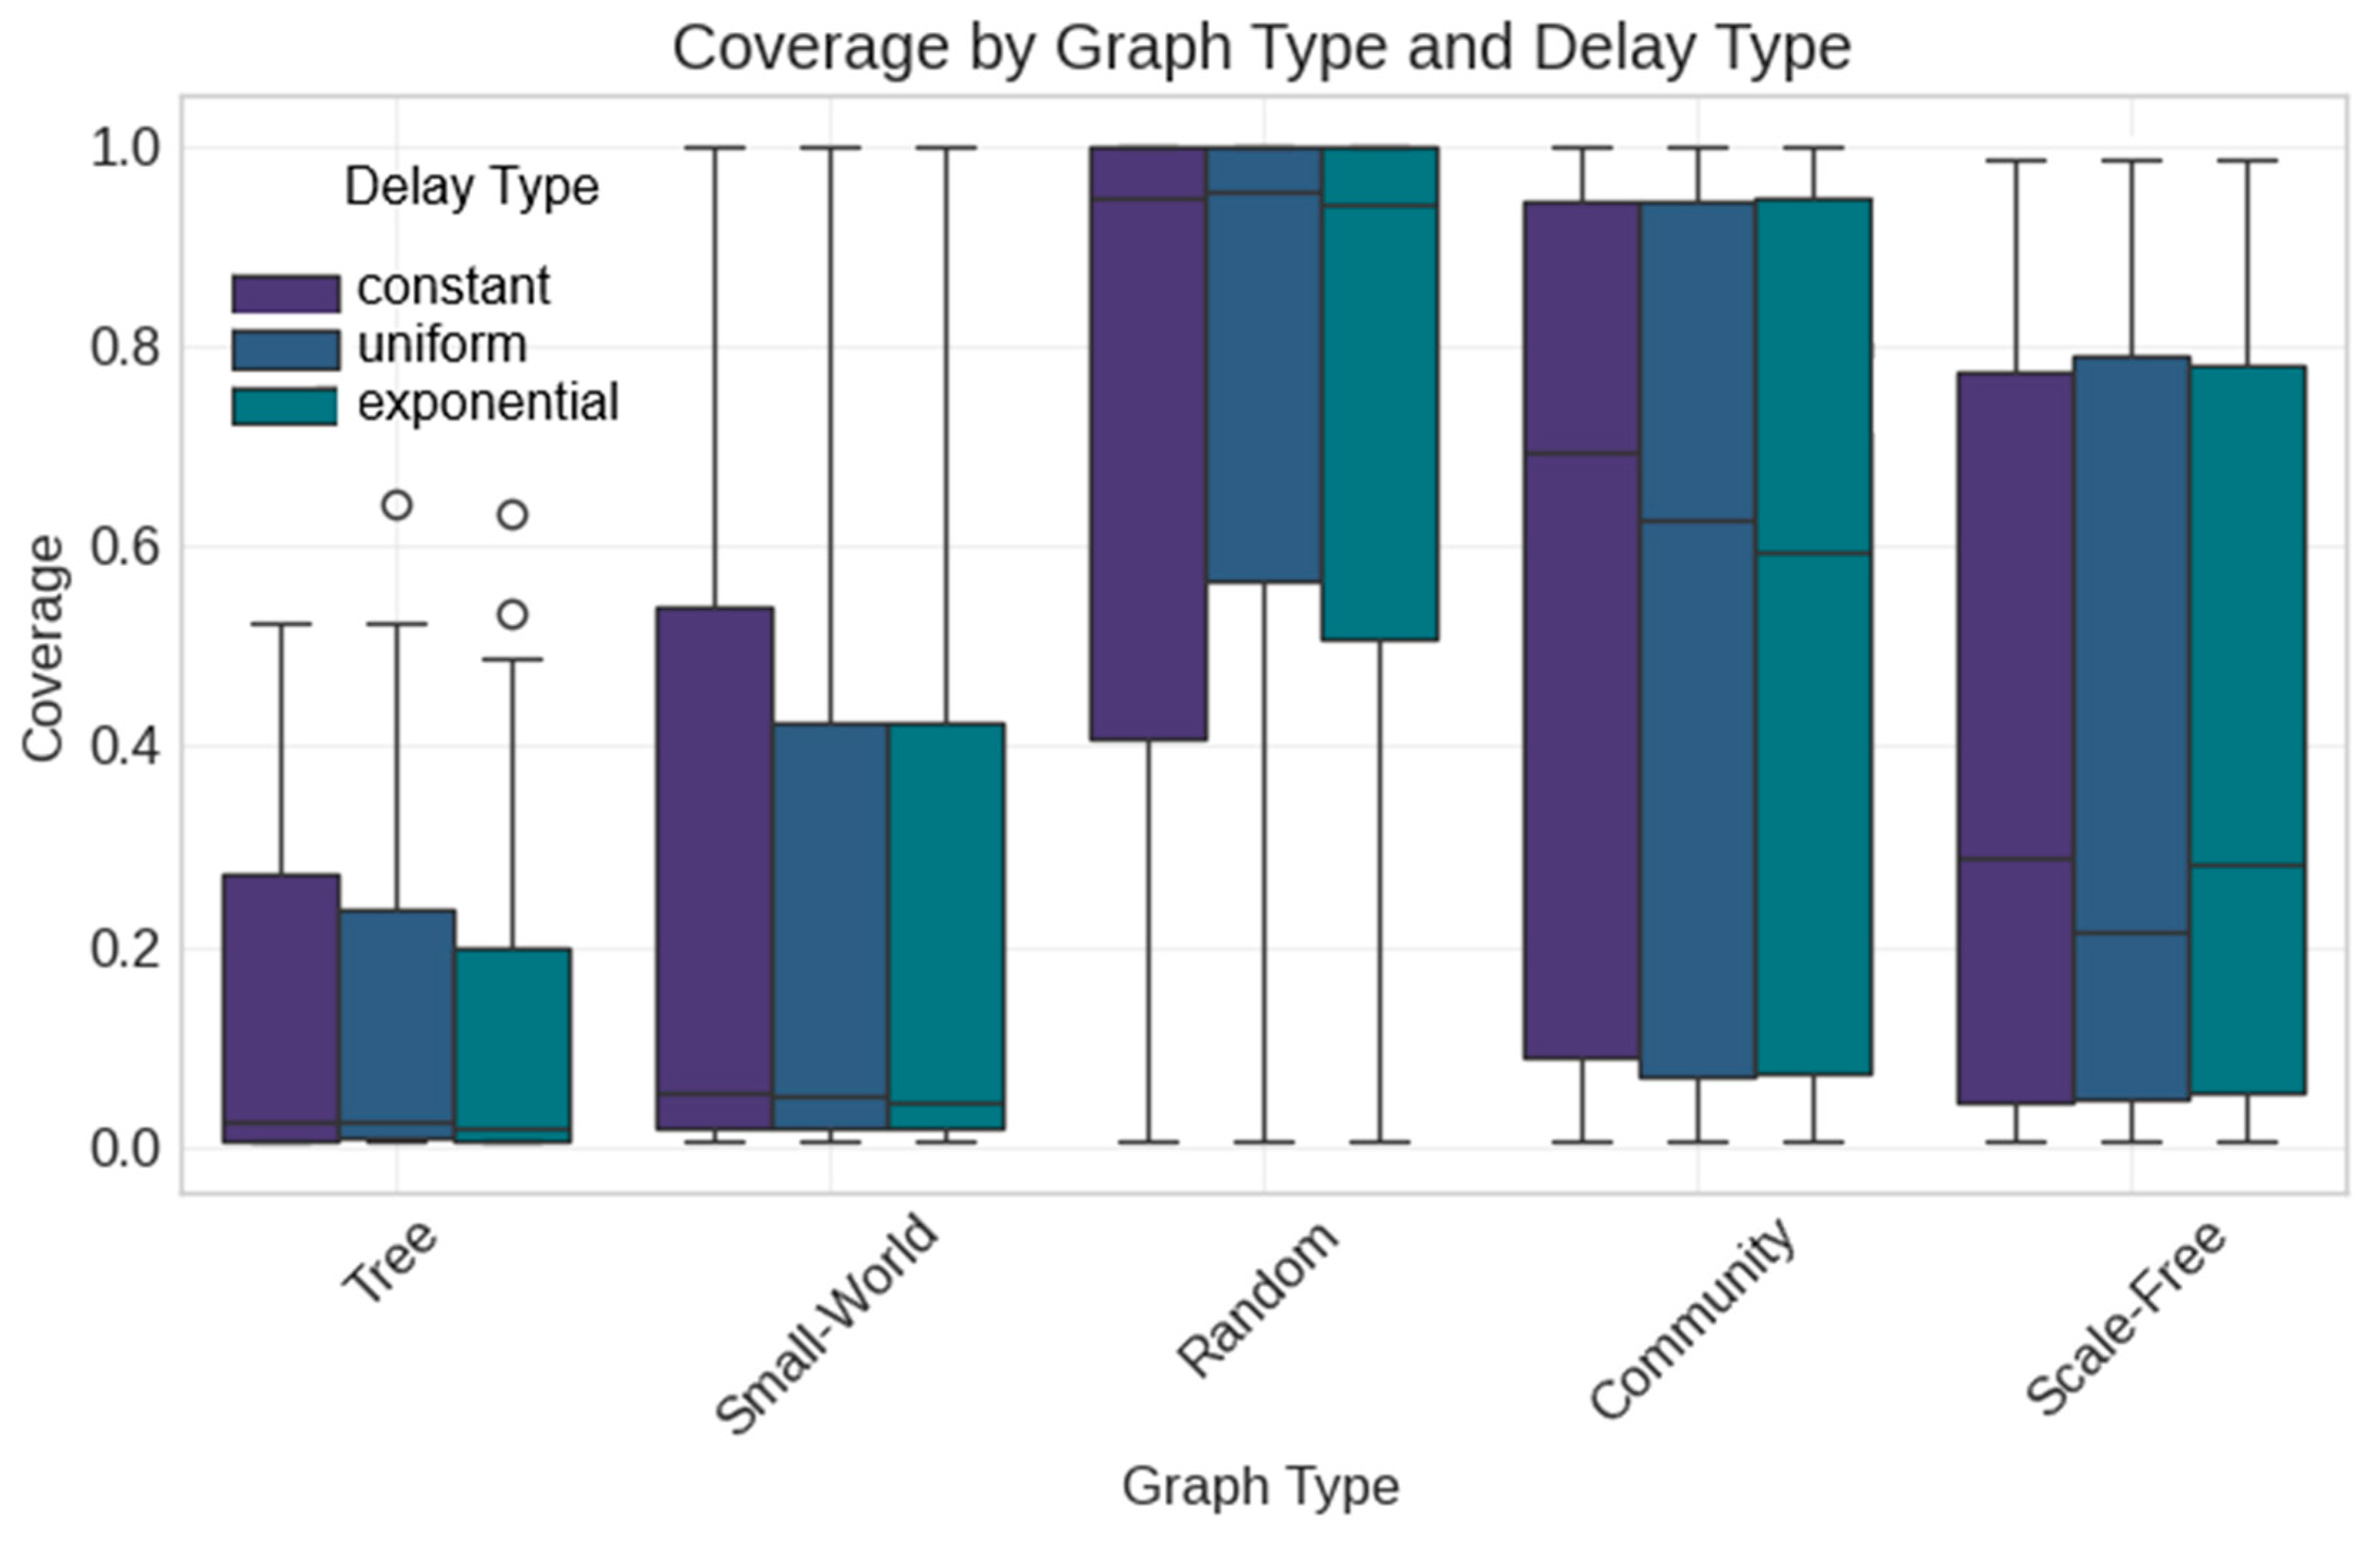
- Three delay types (constant, uniform, exponential);
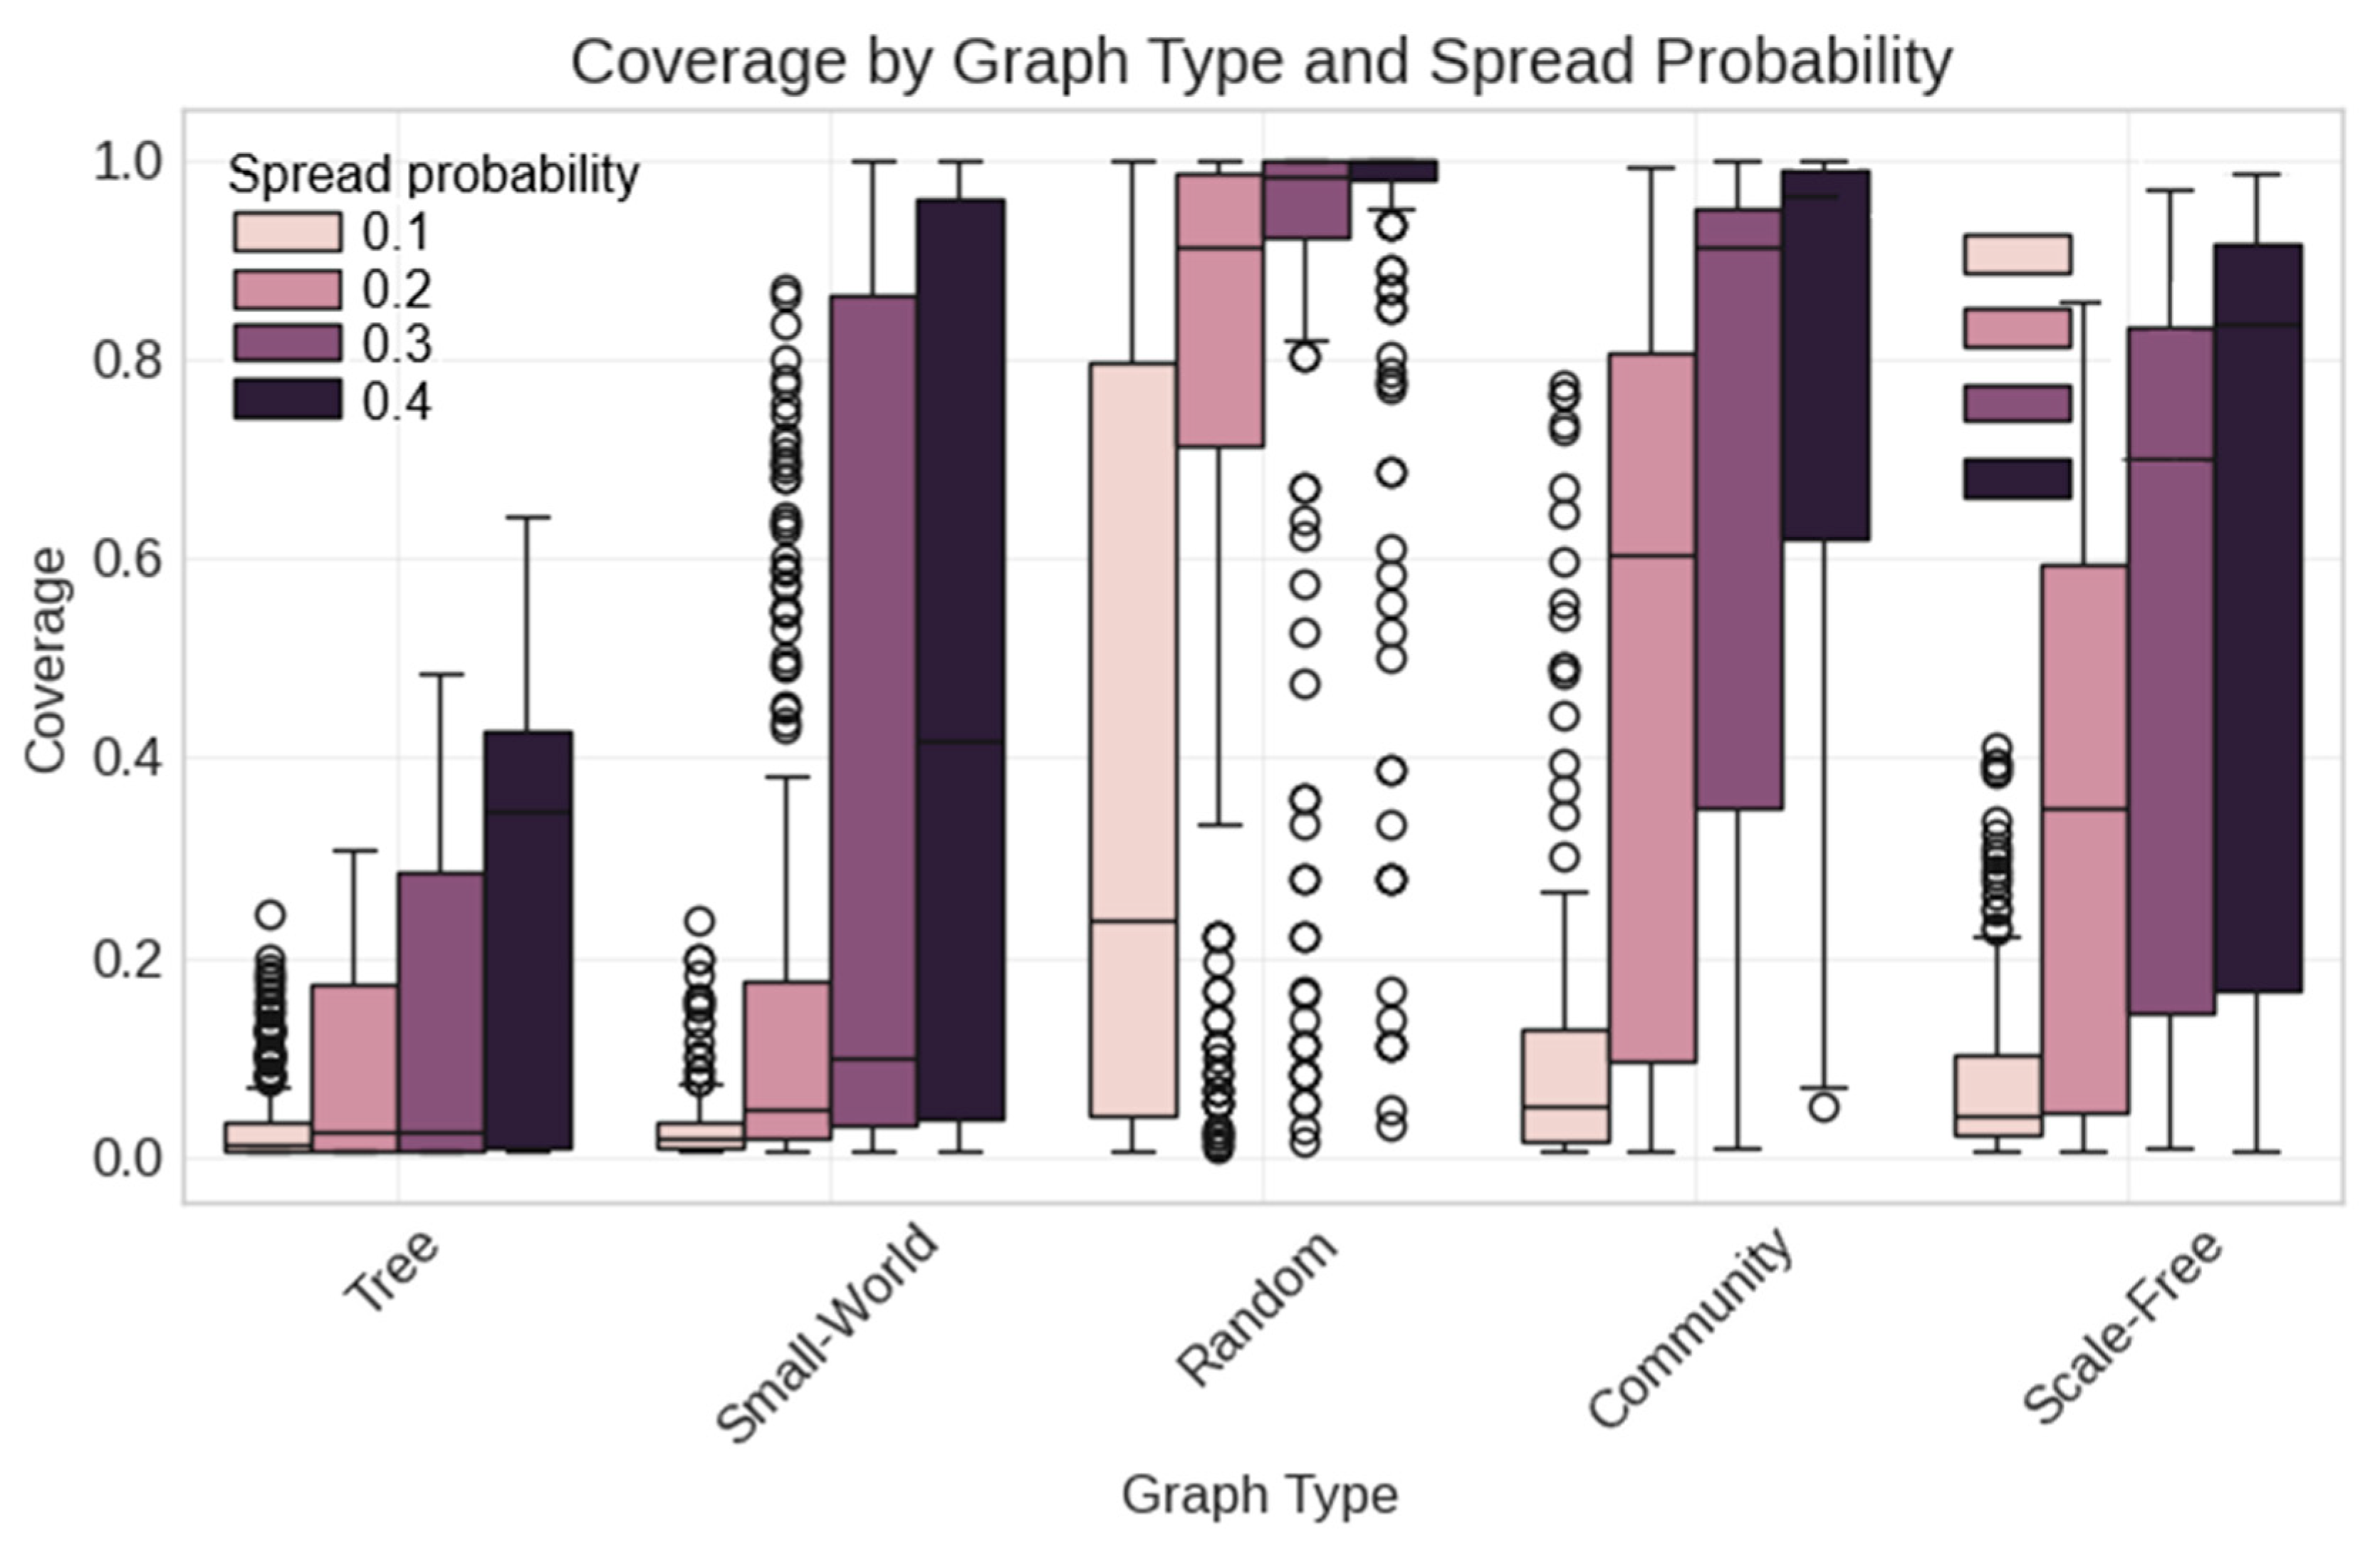
- Four spread probabilities (0.1, 0.2, 0.3, 0.4);
- Three simulation runs per configuration to account for stochasticity.

4.2. Feature Engineering and Selection
- High dimensionality relative to observations;
- Multicollinearity among structural features;
- Potential for overfitting due to feature redundancy.
- avg_degree (r = 0.628);
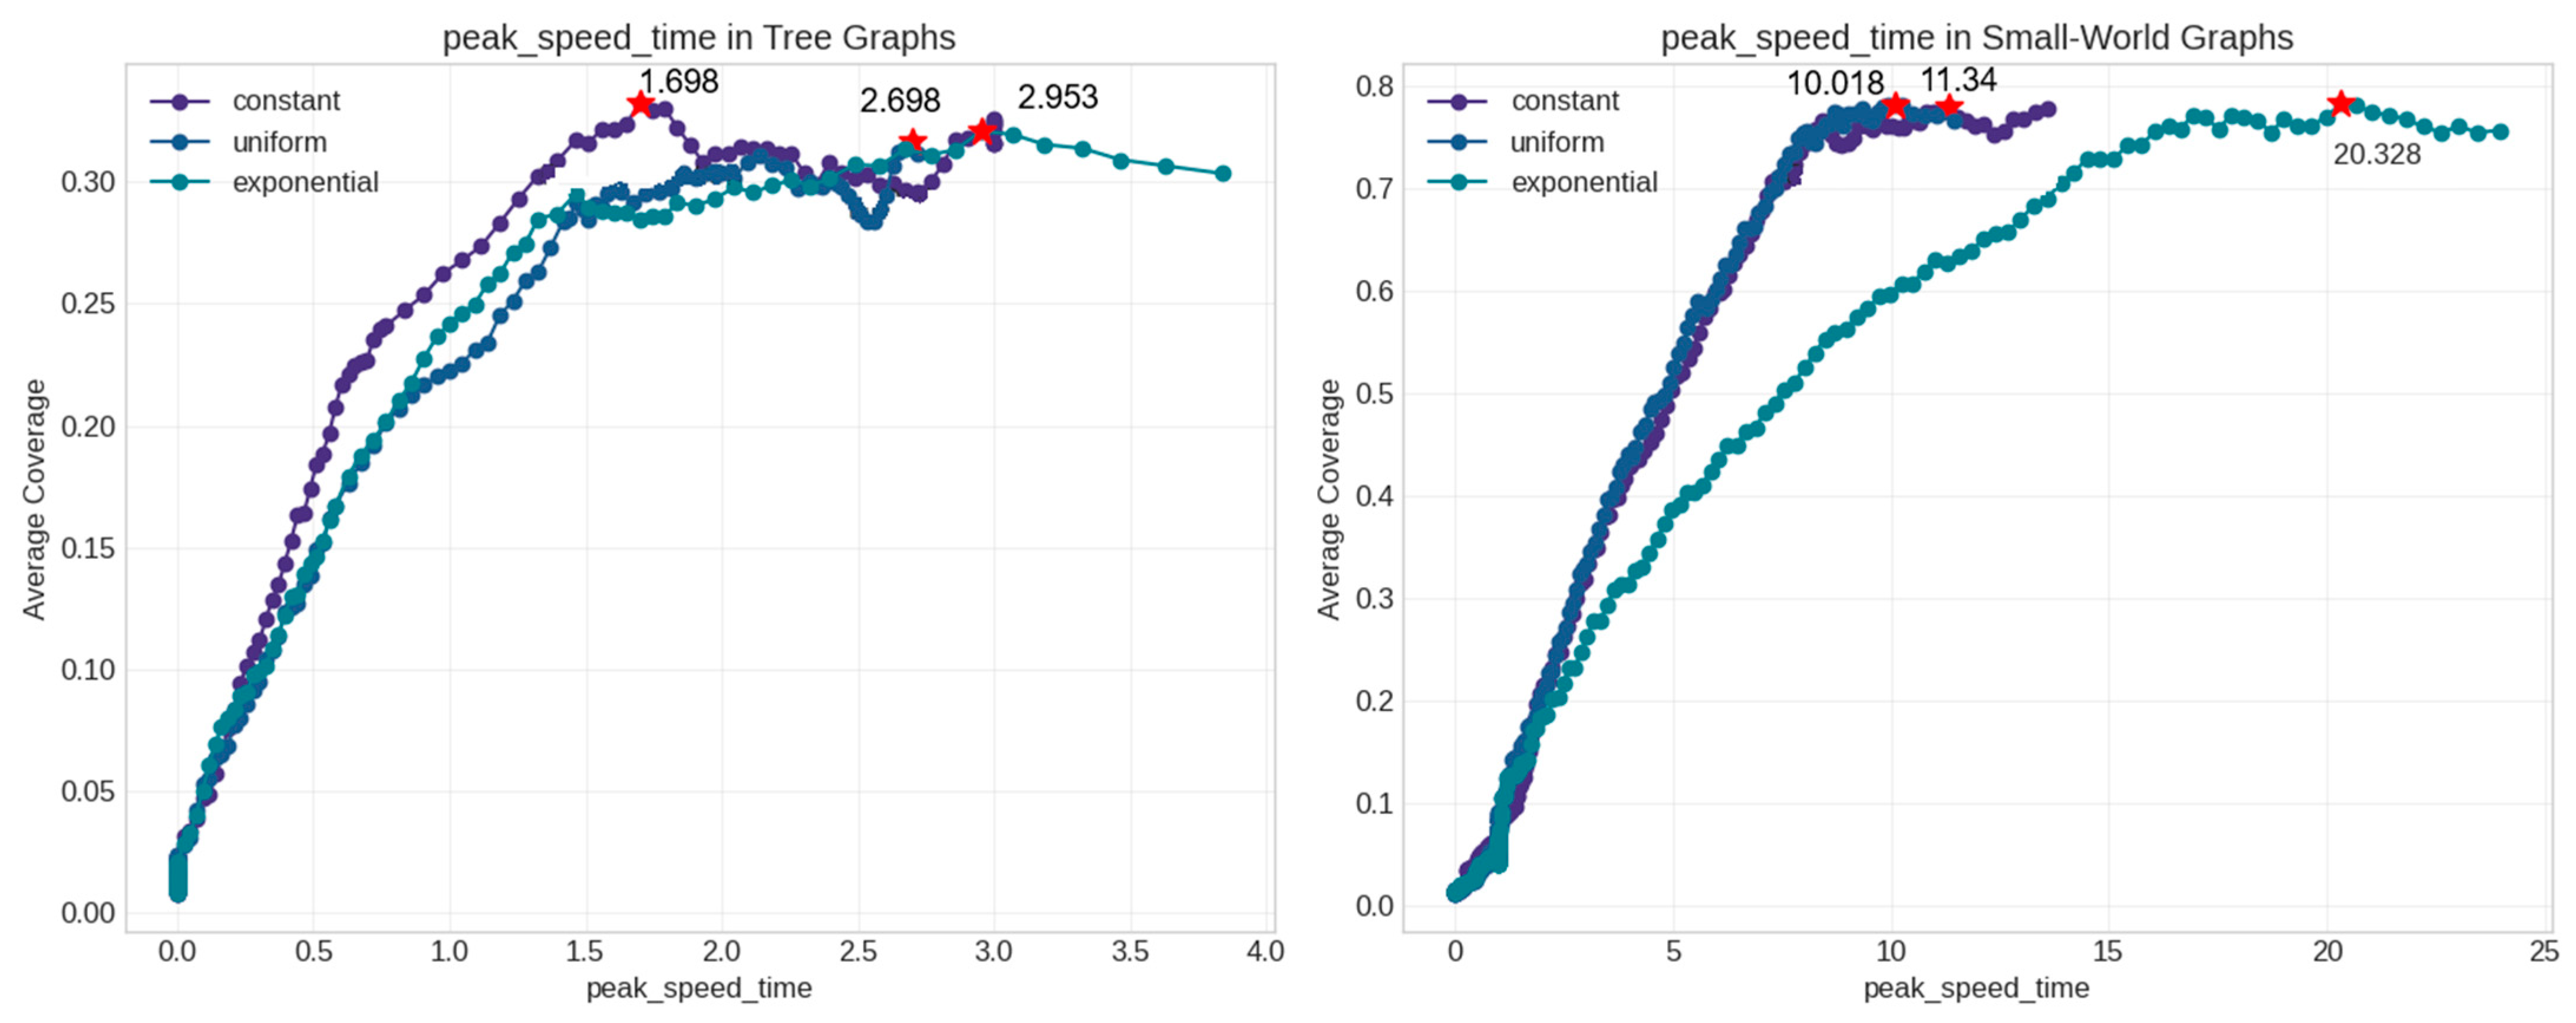
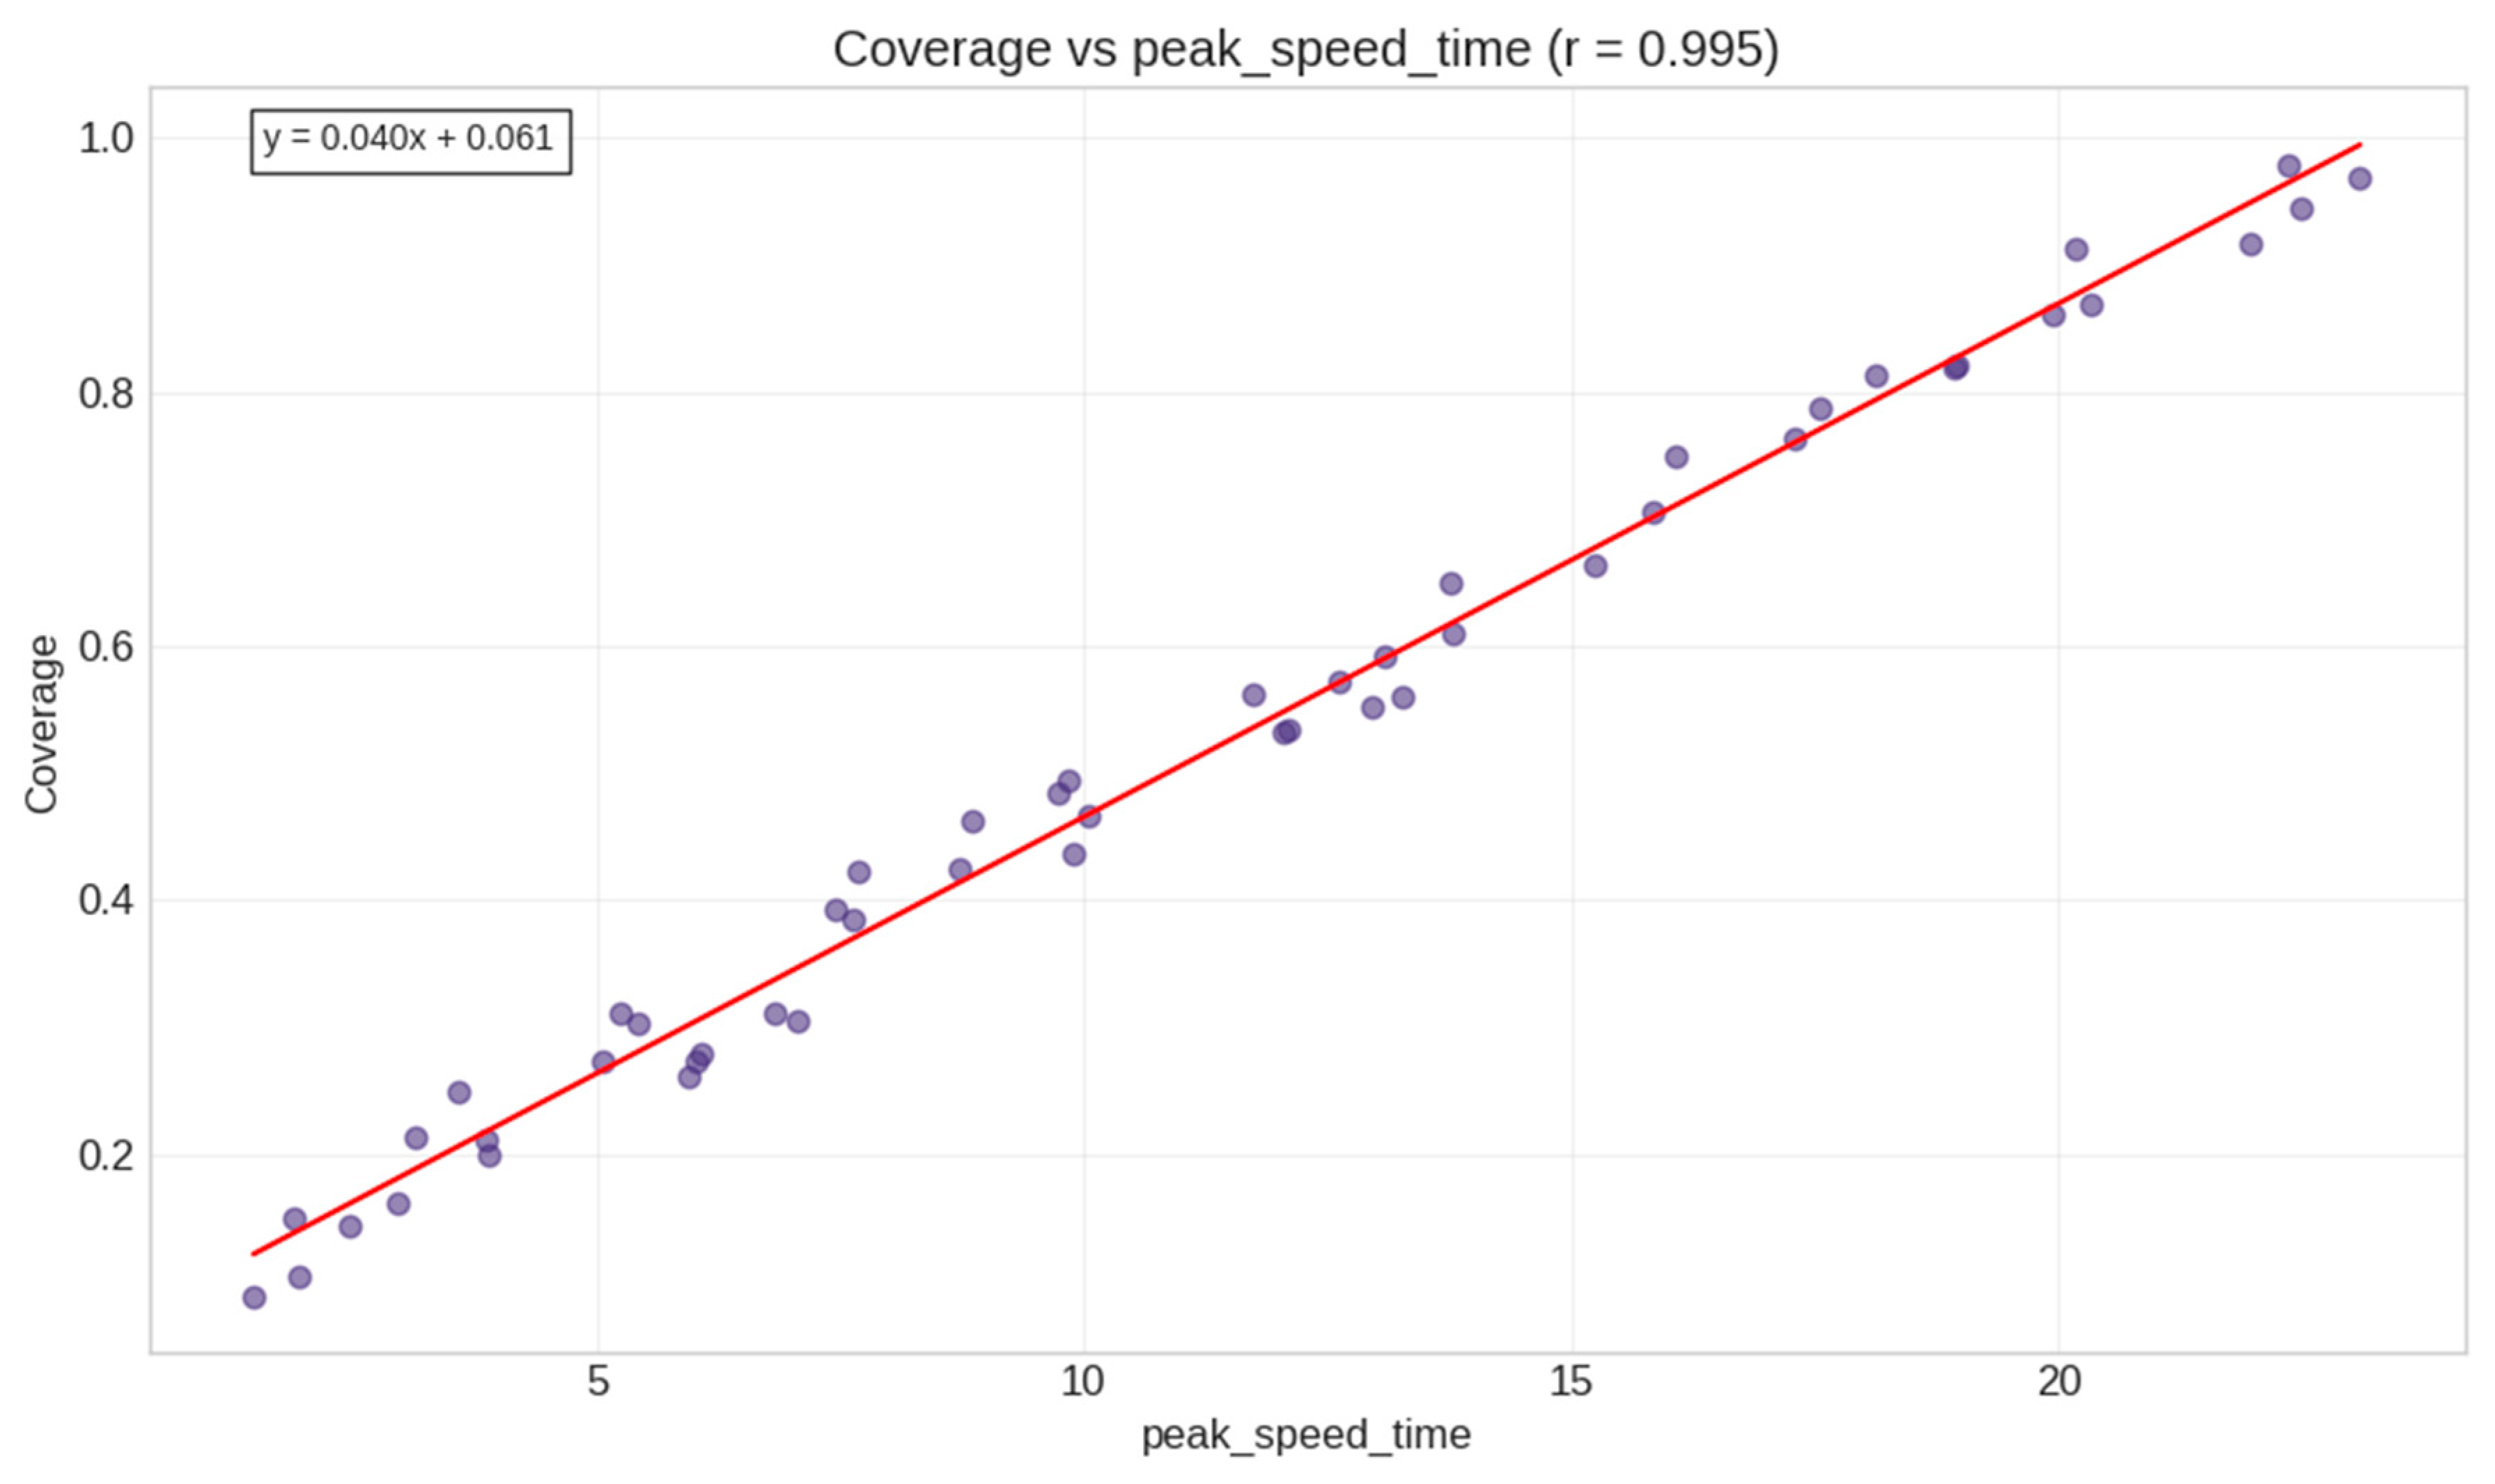
- peak_speed_time (r = 0.582);
- edges (r = 0.549);
- max_betweenness_centrality (r = −0.557);
- min_degree (r = 0.547).

- avg_degree (score = 0.946);
- edges (score = 0.928);
- spectral_radius (score = 0.932);
- max_betweenness_centrality (score = 0.915);
- avg_degree_centrality (score = 0.834).

4.3. Model Development and Evaluation
- Random Forest;
- Gradient Boosting;
- Ridge Regression;
- ElasticNet;
- Support Vector Regression (SVR);
- Huber Regression.
| # Create a pipeline that includes preprocessing def create_pipeline(model): return Pipeline([ (’scaler’, StandardScaler()), (’model’, model) ]) # Initialize GroupKFold for cross-validation group_kfold = GroupKFold(n_splits = 5) |
- R2 (coefficient of determination);
- Adjusted R2;
- Mean Squared Error (MSE);
- Mean Absolute Error (MAE).
4.4. Implementation and System Configuration
- -
- Processor: AMD Ryzen 7 7840HS w/Radeon 780 M Graphics (3.80 GHz);
- -
- Memory: 64 GB RAM (62.8 GB available);
- -
- Storage: 954 GB (513 GB used);
- -
- Graphics: AMD Radeon 780 M Graphics (879 MB);
- -
- Operating System: Windows 64-bit.
4.5. Technical Implementation Details
- Feature selection thresholds: The correlation threshold of 0.8 was selected based on the preliminary testing of thresholds between 0.75 and 0.85, with 0.8 providing the optimal balance between feature reduction (43% fewer features) and predictive power retention (95% of baseline R2).
- Overfitting prevention: We employed GroupKFold cross-validation to prevent data leakage between networks, along with standard regularization parameters in Tree-based models (max_depth = 10, min_samples_split = 5). The gap between training and validation performance was monitored and maintained below 0.05 for all reported models.
- Synthetic network parameters: Networks were generated with parameters reflecting real social media structures: Random networks (edge probability: 0.05–0.20), Scale-Free networks (preferential attachment: 2–5), Small-World networks (rewiring probability: 0.1–0.6, clustering coefficients: 0.02–0.42), Tree networks (branching factor: 2–5), and Community networks (communities: 3–8, inter-community connectivity: 0.01–0.05).
- The negative correlation between network size (edges: r = −0.605, nodes: r = −0.598) and coverage suggests that larger networks may experience information dilution, requiring targeted seeding strategies rather than relying solely on organic spread.
5. Results
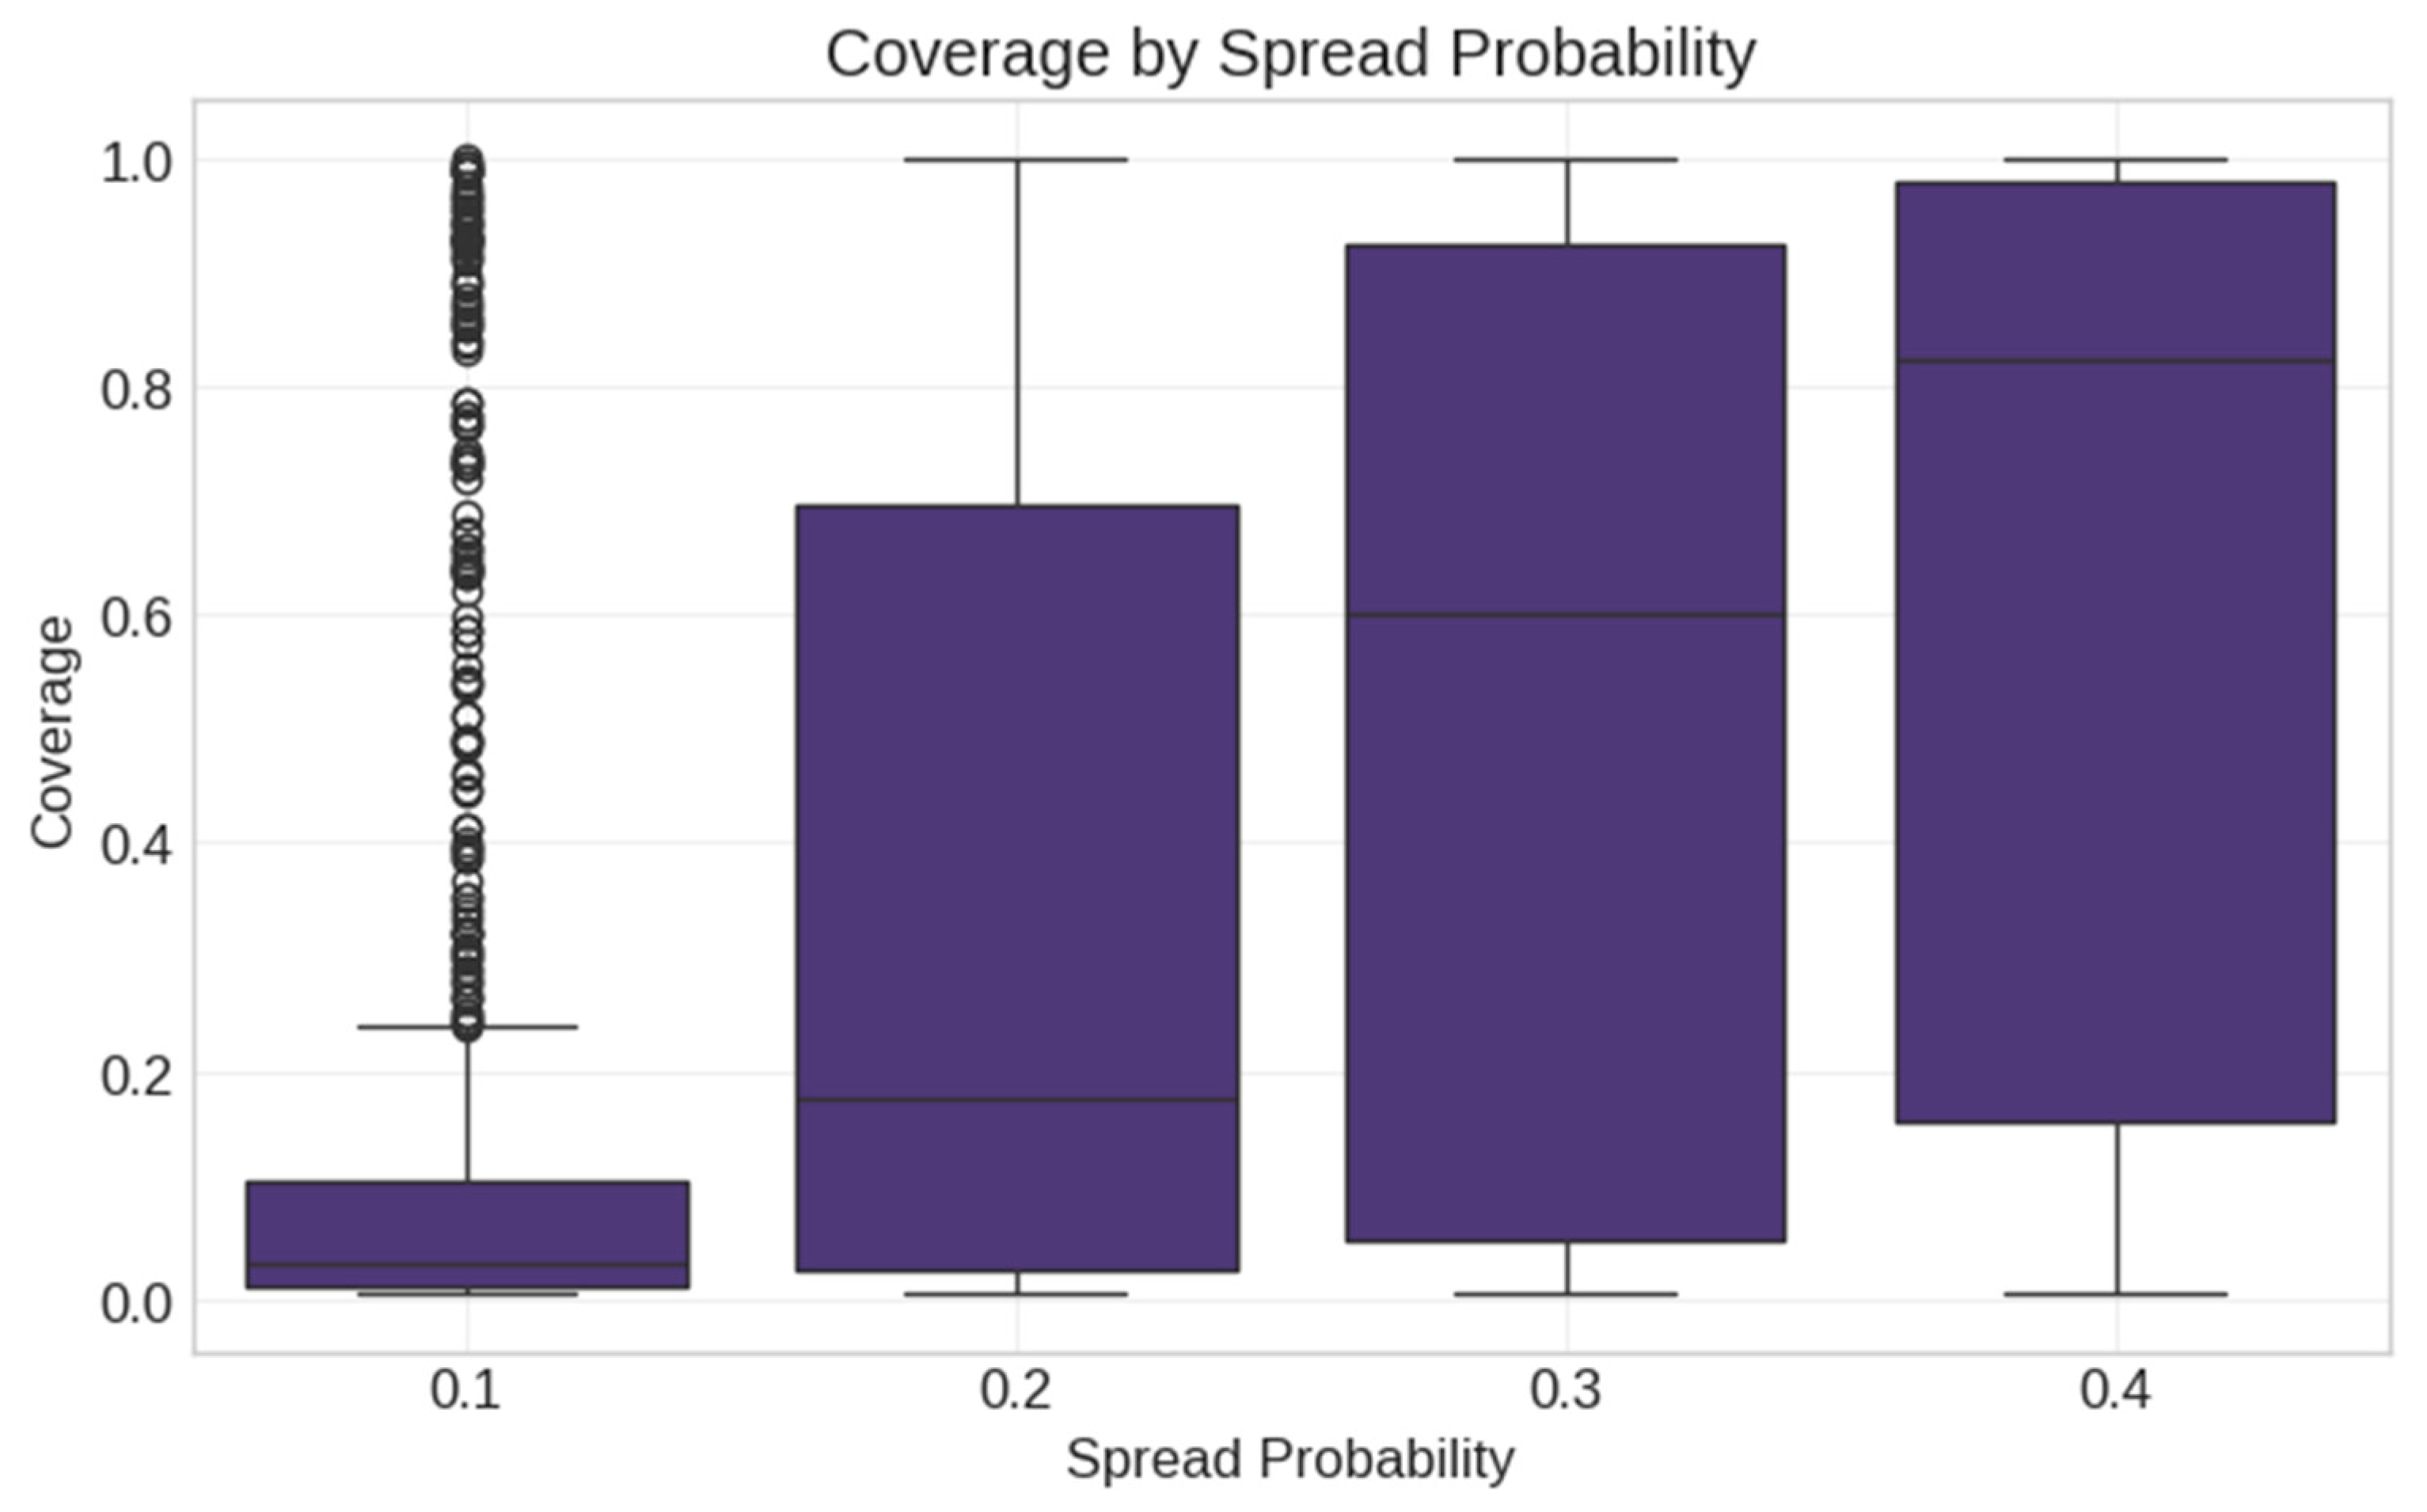
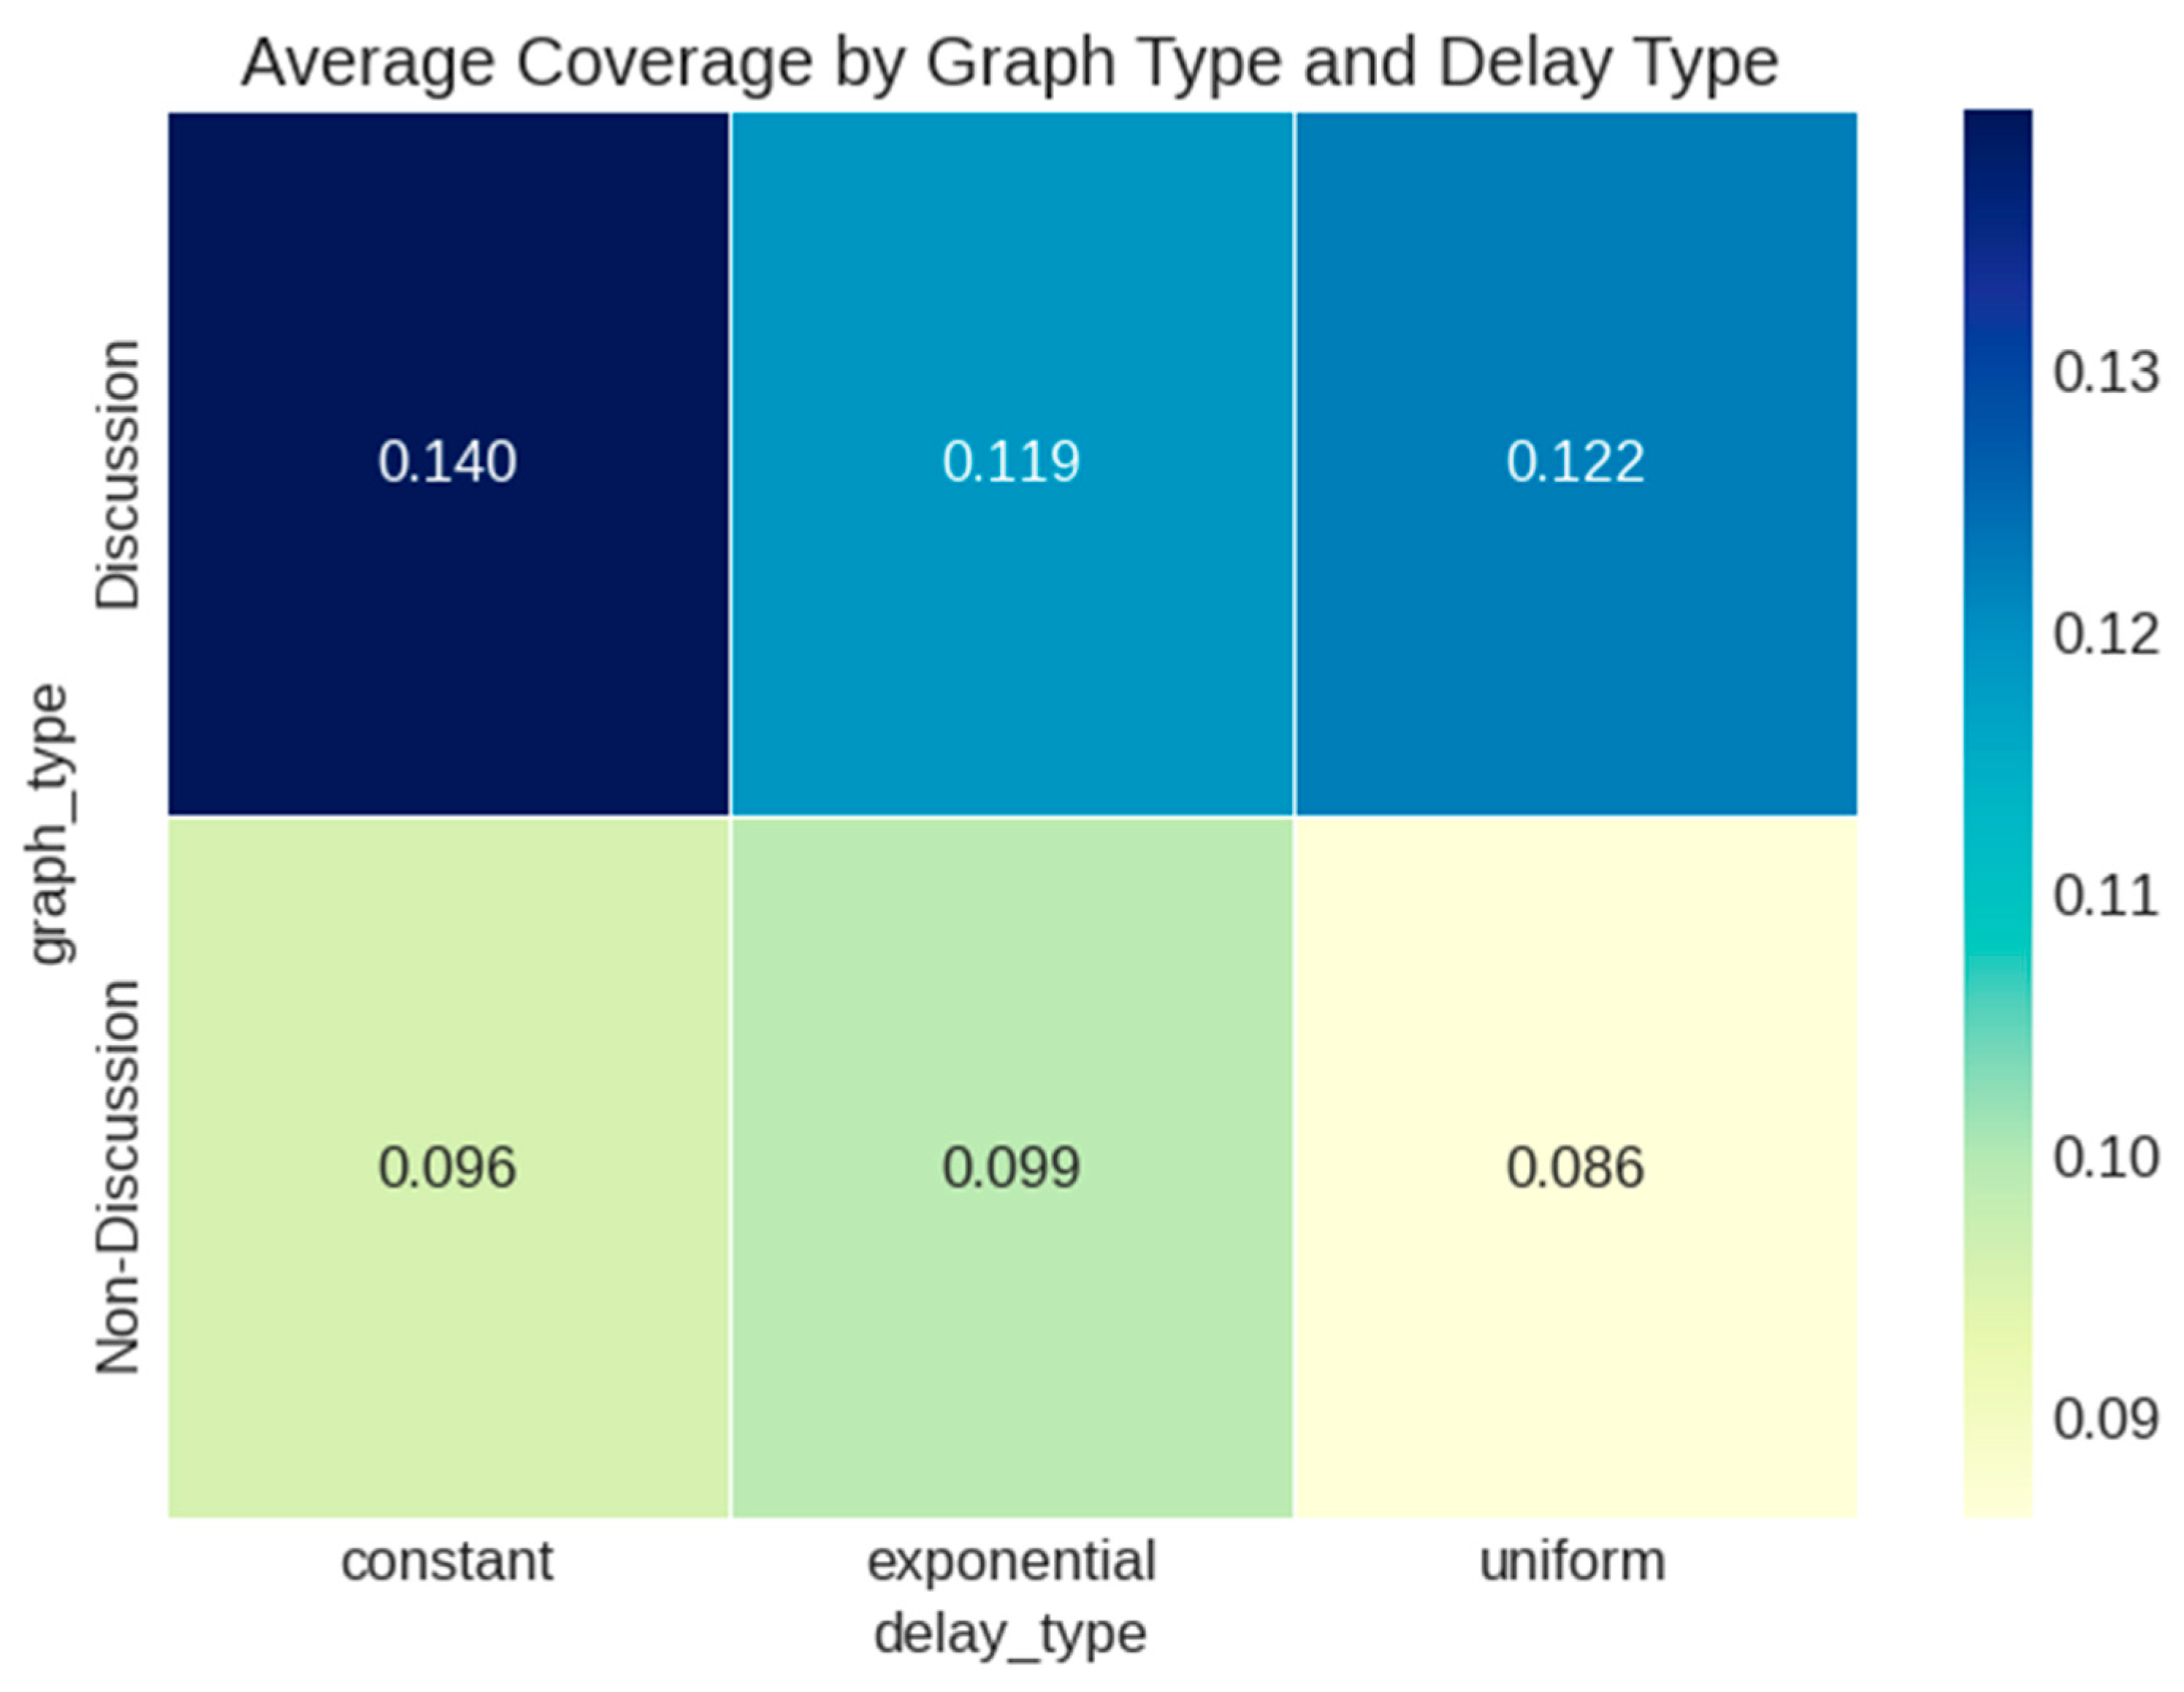
5.1. Real Data Analysis
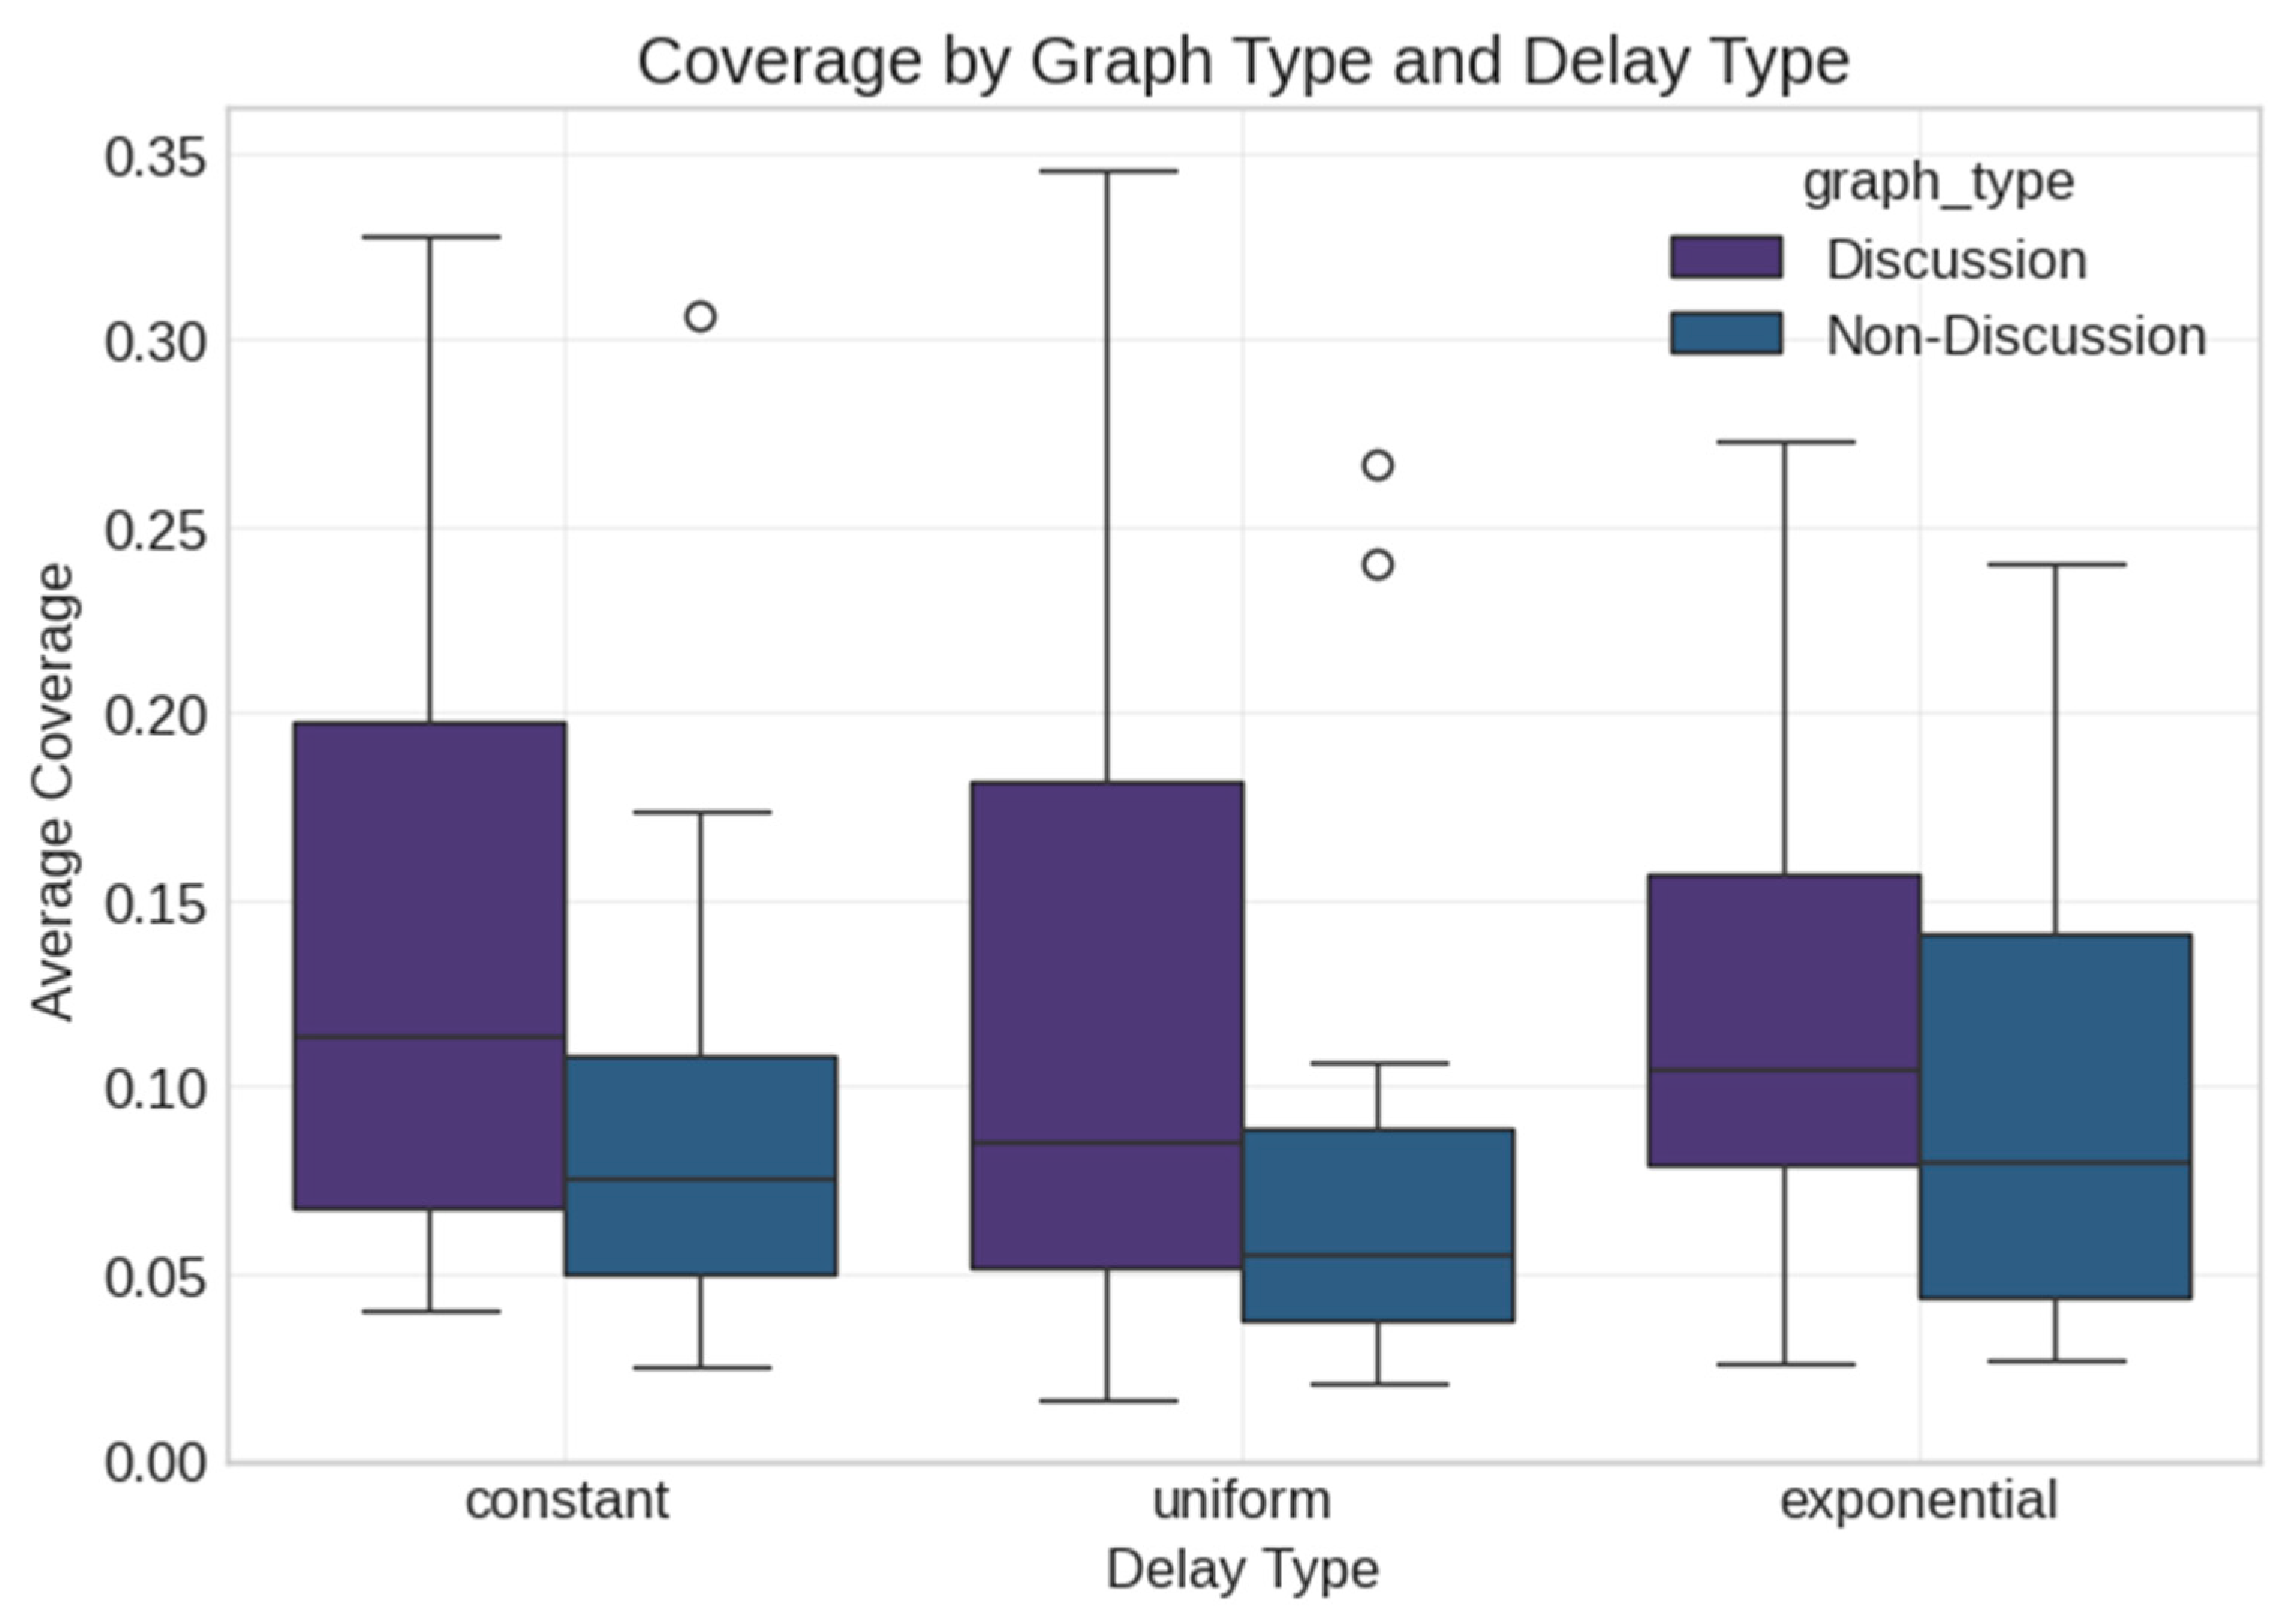
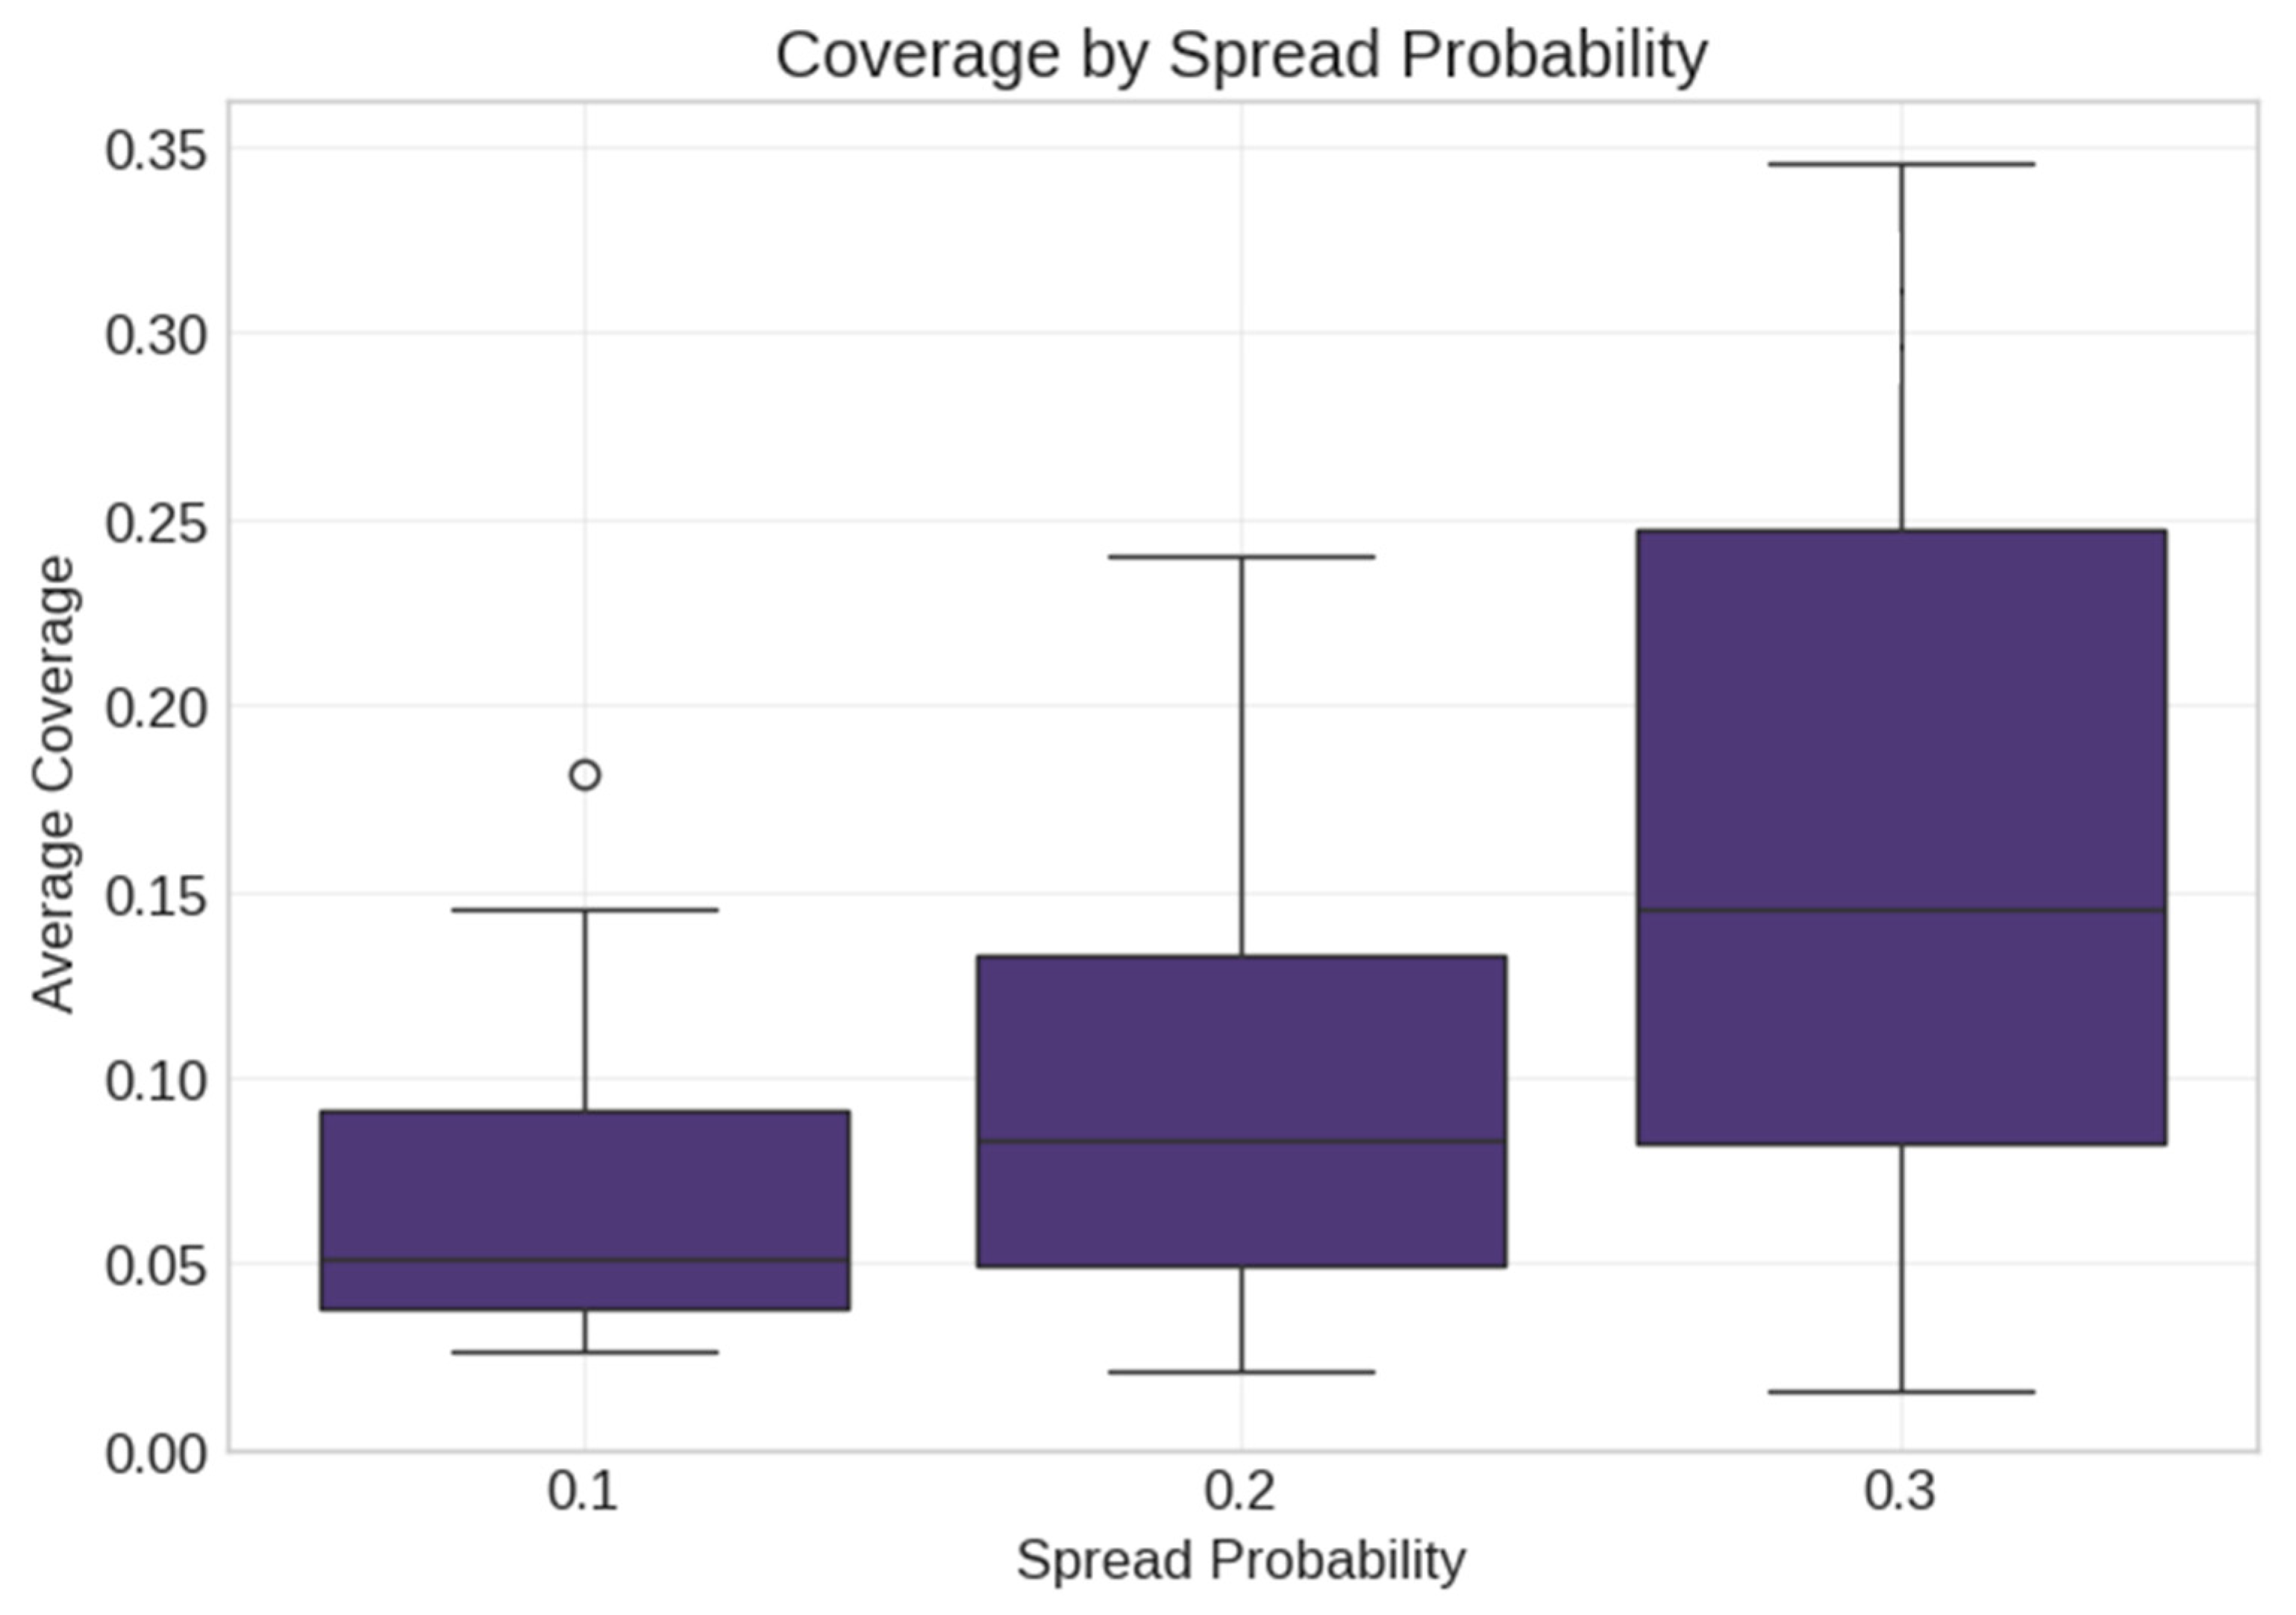
5.2. Synthetic Data Analysis
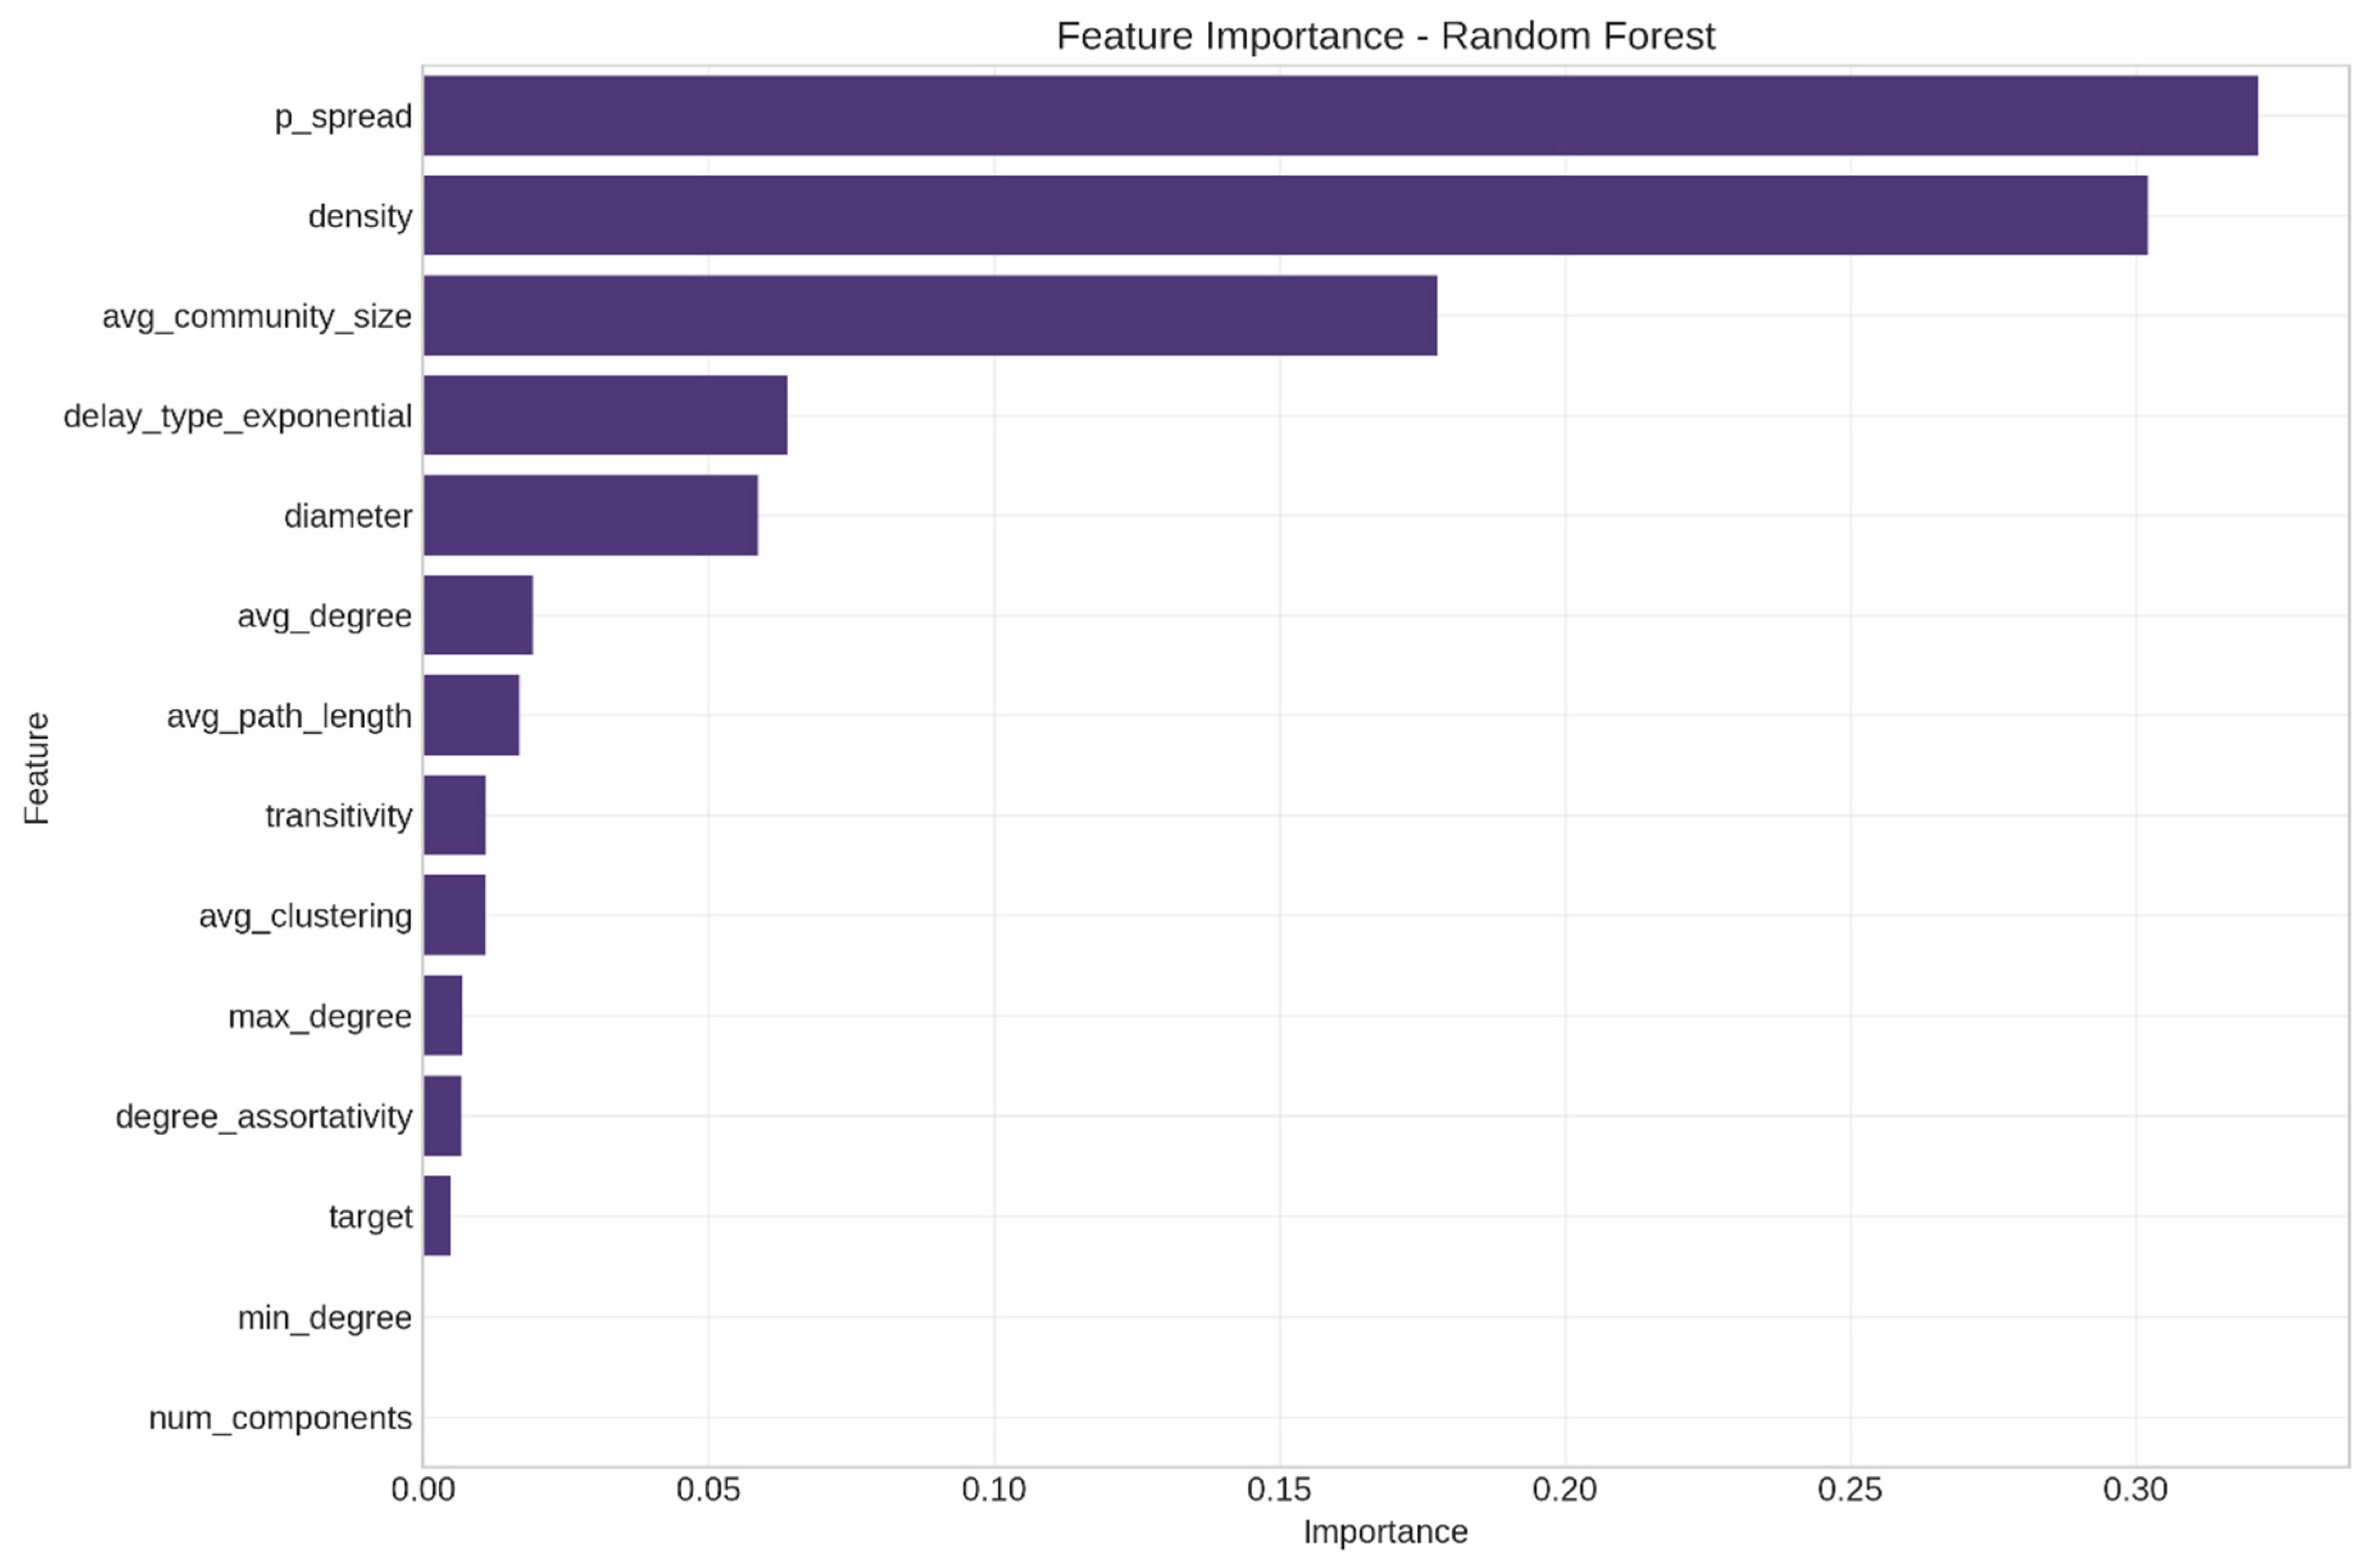
5.3. Model Verification and Feature Stability Analysis
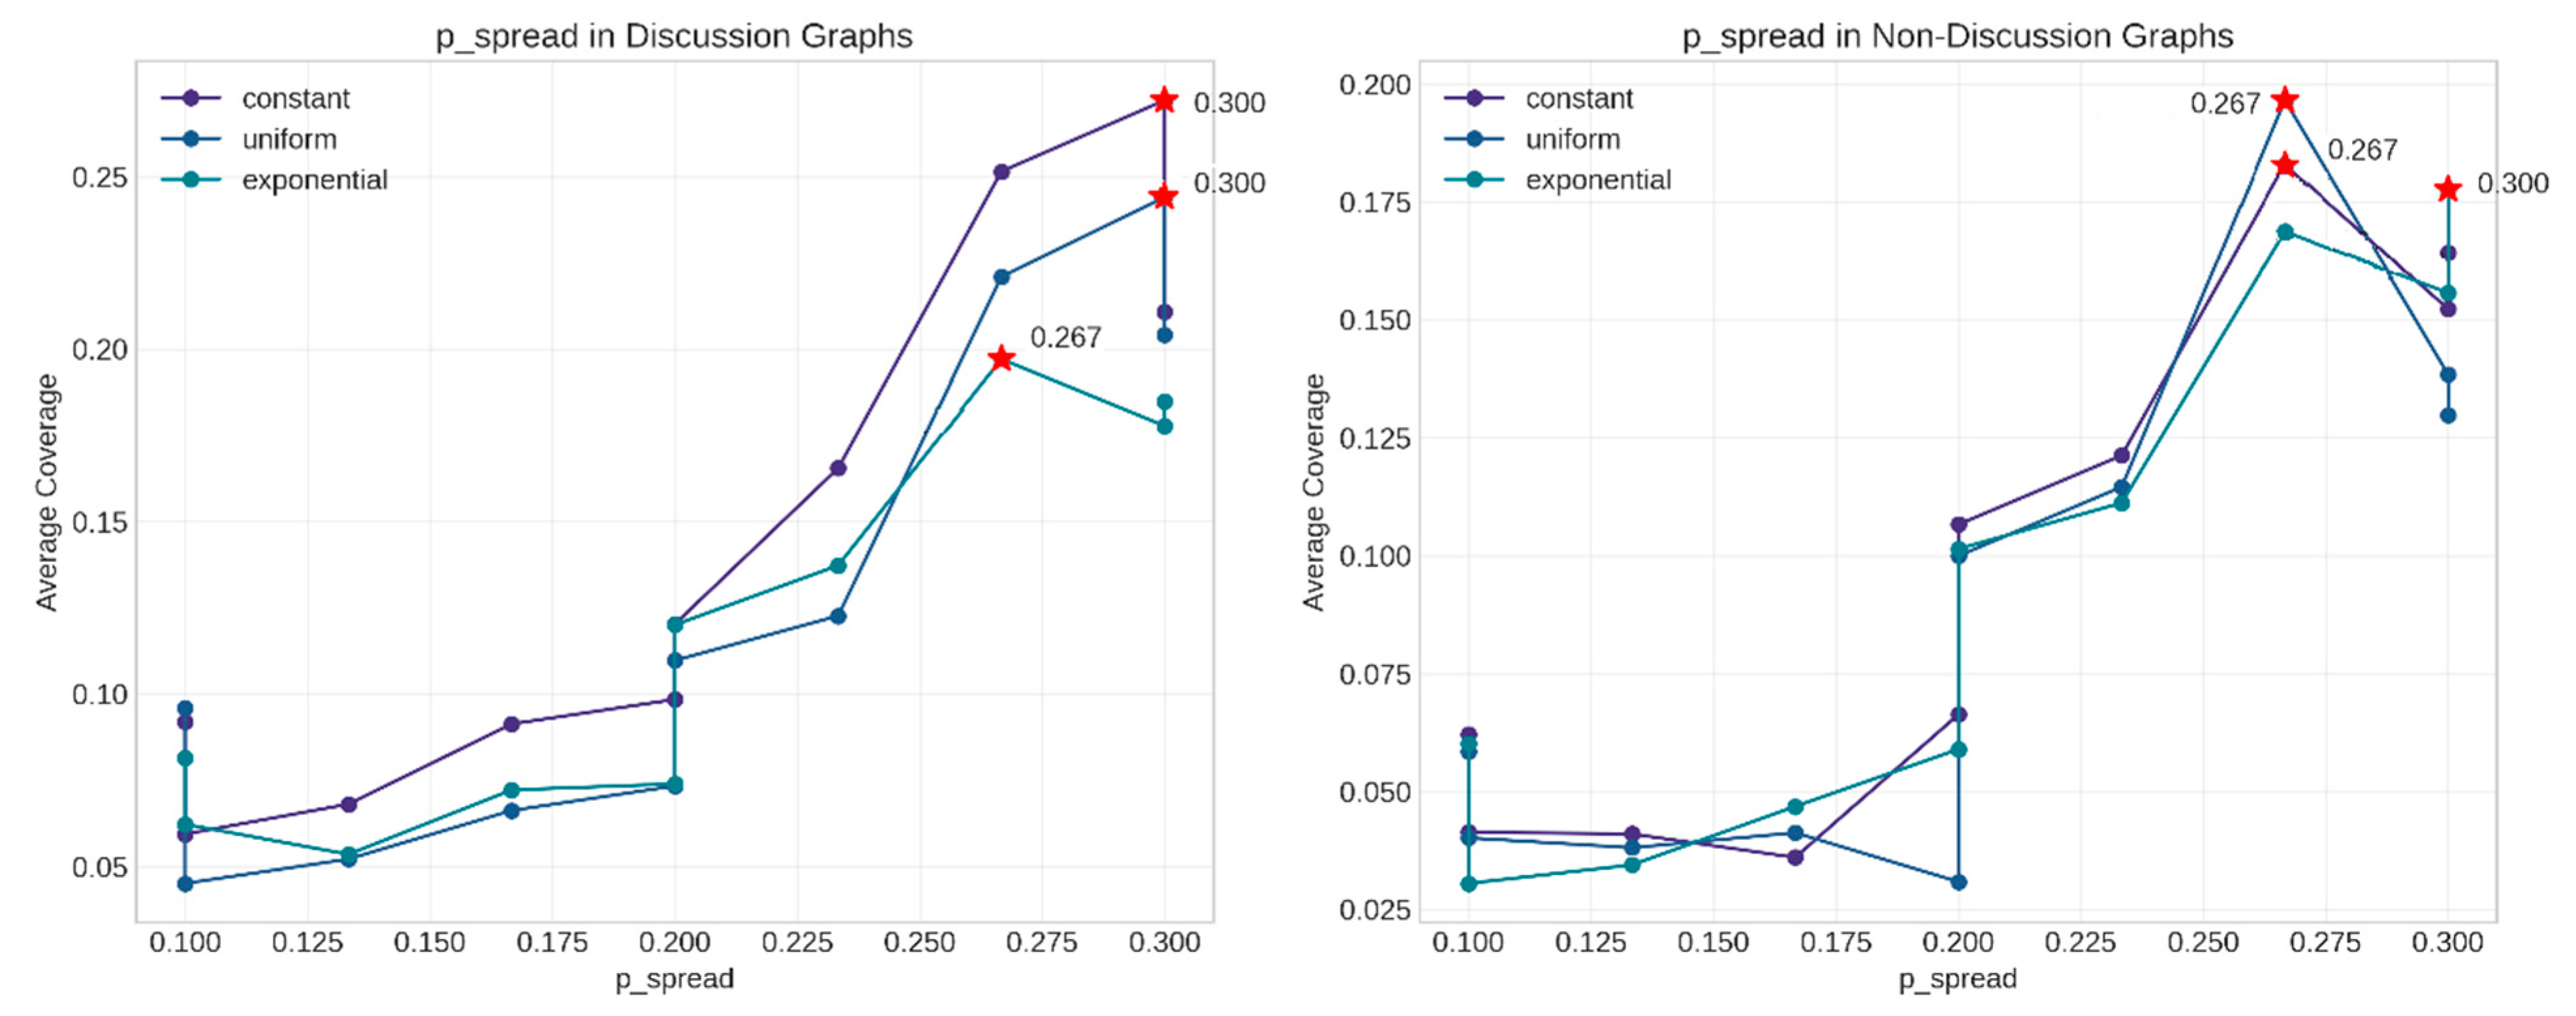
5.4. Comparative Analysis
- Random network structure (highest average coverage);
- Constant delay mechanism (slightly better than alternatives);
- High spread probability (0.4);
- High average degree (approximately 46 in synthetic networks).

6. Discussion
6.1. Comparison with Existing Models
6.2. Theoretical Implications
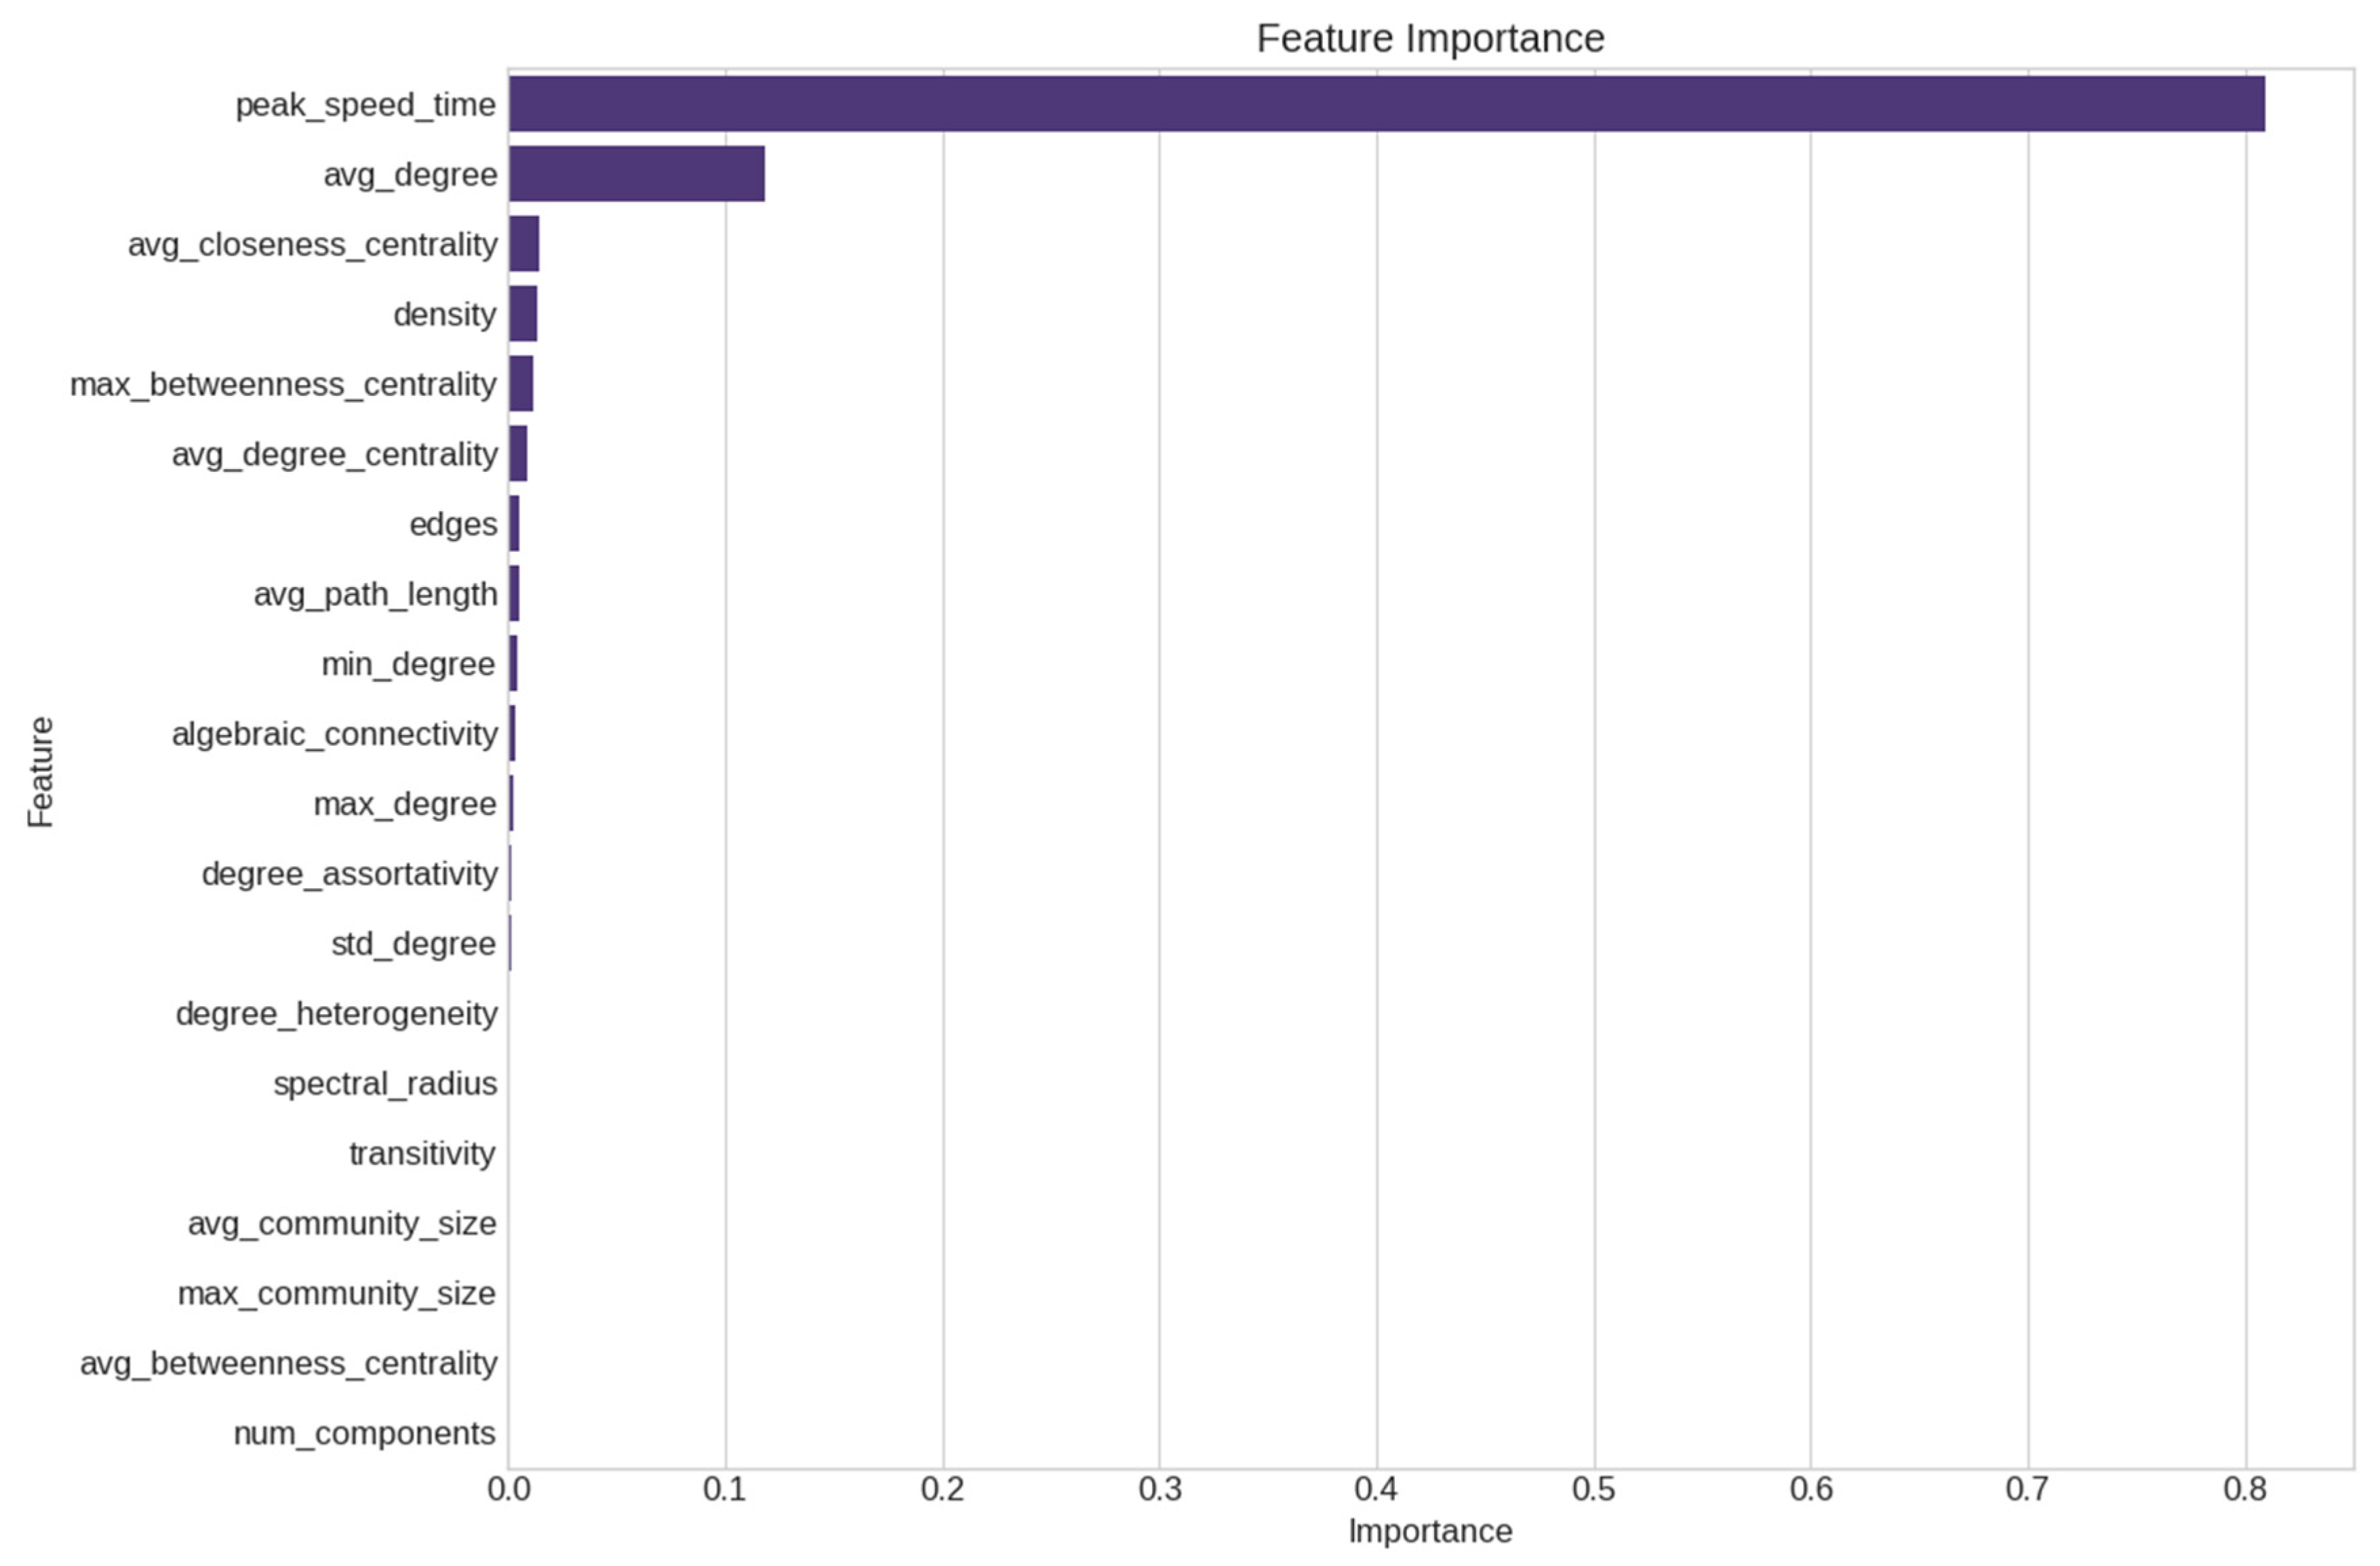
- First, the dominant role of peak_speed_time in our models suggests a “critical momentum” theory of information diffusion. This theory posits that the timing of the maximum diffusion speed, rather than static network properties, determines the ultimate information coverage. One question emerging from our research is whether competing information concepts could help explain differential success rates in diffusion processes across varied network structures.
- Second, the consistent significance of spread probability (p_spread) across all datasets supports transmission-centric rather than structure-centric diffusion theories. While network structure matters, the likelihood of information sharing between connected individuals appears to be more fundamental. This contrasts with structure-focused approaches like those of Xiao et al. (2019) [17], who emphasized the topological dimensions of networks.
- Third, our finding that the delay mechanism type (constant, uniform, exponential) has no statistically significant effect contradicts the assumptions in some existing models. For example, Sun et al. (2024) [14] developed elaborate state transitions in their SEIHR model, yet our results suggest that the specific delay distribution may be less important than previously thought. What matters more is the integration of some delay mechanisms rather than which specific type is used.
- Fourth, our verification analysis reveals challenges in transferring models between contexts, despite stability in feature importance rankings. This supports the contextual diffusion theory proposed by Wei et al. (2023) [13], who argued that diffusion patterns depend on specific community characteristics rather than universal laws.
6.3. Practical Applications
6.4. Limitations and Future Work
7. Conclusions
Author Contributions
Funding
Institutional Review Board Statement
Informed Consent Statement
Data Availability Statement
Conflicts of Interest
References
- Foroozani, A.; Ebrahimi, M. Nonlinear Anomalous Information Diffusion Model in Social Networks. Commun. Nonlinear Sci. Numer. Simul. 2021, 103, 106019. [Google Scholar] [CrossRef]
- Li, B.; Zhu, L. Turing Instability Analysis of a Reaction–Diffusion System for Rumor Propagation in Continuous Space and Complex Networks. Inf. Process. Manag. 2024, 61, 103621. [Google Scholar] [CrossRef]
- Razaque, A.; Rizvi, S.; Khan, M.J.; Almiani, M.; Rahayfeh, A.A. State-of-Art Review of Information Diffusion Models and Their Impact on Social Network Vulnerabilities. J. King Saud Univ. Comput. Inf. Sci. 2022, 34, 1275–1294. [Google Scholar] [CrossRef] [PubMed]
- Kempe, D.; Kleinberg, J.; Tardos, É. Maximizing the Spread of Influence through a Social Network. In Proceedings of the Ninth ACM SIGKDD International Conference on Knowledge Discovery and Data Mining, Washington, DC, USA, 24–27 August 2003; Association for Computing Machinery: New York, NY, USA, 2003; pp. 137–146. [Google Scholar]
- Leskovec, J.; McGlohon, M.; Faloutsos, C.; Glance, N.; Hurst, M. Patterns of Cascading Behavior in Large Blog Graphs. In Proceedings of the 2007 SIAM International Conference on Data Mining (SDM), Minneapolis, MN, USA, 26–28 April 2007; Society for Industrial and Applied Mathematics: Philadelphia, PA, USA, 2007; pp. 551–556, ISBN 978-0-89871-630-6. [Google Scholar]
- Saito, K.; Kimura, M.; Ohara, K.; Motoda, H. Selecting Information Diffusion Models over Social Networks for Behavioral Analysis. In Machine Learning and Knowledge Discovery in Databases, Proceedings of the European Conference, ECML PKDD 2010, Barcelona, Spain, 20–24 September 2010; Balcázar, J.L., Bonchi, F., Gionis, A., Sebag, M., Eds.; Springer: Berlin/Heidelberg, Germany, 2010; pp. 180–195. [Google Scholar]
- Myers, S.A.; Leskovec, J. Clash of the Contagions: Cooperation and Competition in Information Diffusion. In Proceedings of the 2012 IEEE 12th International Conference on Data Mining, Brussels, Belgium, 10–13 December 2012; pp. 539–548. [Google Scholar]
- Chen, A.; Ni, X.; Zhu, H.; Su, G. Model of Warning Information Diffusion on Online Social Networks Based on Population Dynamics. Phys. A Stat. Mech. Its Appl. 2021, 567, 125709. [Google Scholar] [CrossRef]
- Kumar, S.; Saini, M.; Goel, M.; Aggarwal, N. Modeling Information Diffusion in Online Social Networks Using SEI Epidemic Model. Procedia Comput. Sci. 2020, 171, 672–678. [Google Scholar] [CrossRef]
- Cai, X.; Xia, W.; Huang, W.; Yang, H. Dynamics of Momentum in Financial Markets Based on the Information Diffusion in Complex Social Networks. J. Behav. Exp. Financ. 2024, 41, 100897. [Google Scholar] [CrossRef]
- Chen, A.; Liu, H.; Su, G. Extracting the Diffusion Dynamics of Crisis Information on Online Social Networks: Model and Application. Int. J. Disaster Risk Reduct. 2024, 101, 104226. [Google Scholar] [CrossRef]
- Tu, H.T.; Phan, T.T.; Nguyen, K.P. Modeling Information Diffusion in Social Networks with Ordinary Linear Differential Equations. Inf. Sci. 2022, 593, 614–636. [Google Scholar] [CrossRef]
- Wei, X.; Gong, H.; Song, L. Product Diffusion in Dynamic Online Social Networks: A Multi-Agent Simulation Based on Gravity Theory. Expert Syst. Appl. 2023, 213, 119008. [Google Scholar] [CrossRef]
- Sun, X.; Wang, Y.; Chai, Y.; Liu, Y. Dynamic Analysis and Control Strategies of the SEIHR Rumor Diffusion Model in Online Social Networks. Appl. Math. Model. 2024, 134, 611–634. [Google Scholar] [CrossRef]
- Moscato, V.; Sperlì, G. A Novel Influence Diffusion Model under Temporal and Content Constraints on Business Social Network. Telemat. Inform. 2022, 68, 101768. [Google Scholar] [CrossRef]
- Binesh, N.; Ghatee, M. Distance-Aware Optimization Model for Influential Nodes Identification in Social Networks with Independent Cascade Diffusion. Inf. Sci. 2021, 581, 88–105. [Google Scholar] [CrossRef]
- Xiao, Y.; Wang, Z.; Li, Q.; Li, T. Dynamic Model of Information Diffusion Based on Multidimensional Complex Network Space and Social Game. Phys. A Stat. Mech. Its Appl. 2019, 521, 578–590. [Google Scholar] [CrossRef]
- Mohammadi, S.; Nadimi-Shahraki, M.H.; Beheshti, Z.; Zamanifar, K. Fuzzy Sign-Aware Diffusion Models for Influence Maximization in Signed Social Networks. Inf. Sci. 2023, 645, 119174. [Google Scholar] [CrossRef]
- Haralabopoulos, G.; Anagnostopoulos, I.; Zeadally, S. Lifespan and Propagation of Information in On-Line Social Networks: A Case Study Based on Reddit. J. Netw. Comput. Appl. 2015, 56, 88–100. [Google Scholar] [CrossRef]
- Curiskis, S.A.; Drake, B.; Osborn, T.R.; Kennedy, P.J. An Evaluation of Document Clustering and Topic Modelling in Two Online Social Networks: Twitter and Reddit. Inf. Process. Manag. 2020, 57, 102034. [Google Scholar] [CrossRef]
- Münster, M.; Reichenbach, F.; Walther, M. Robinhood, Reddit, and the News: The Impact of Traditional and Social Media on Retail Investor Trading. J. Financ. Mark. 2024, 71, 100929. [Google Scholar] [CrossRef]
- Liu, X.; Zhao, N.; Wei, W.; Abedin, M.Z. Diffusion Prediction of Competitive Information with Time-Varying Attractiveness in Social Networks. Inf. Process. Manag. 2024, 61, 103739. [Google Scholar] [CrossRef]
- Lin, T.; Luo, G.; Li, W.; Wang, W. Network Alignment in Multiplex Social Networks Using the Information Diffusion Dynamics. Chaos Solitons Fractals 2025, 190, 115792. [Google Scholar] [CrossRef]
- Singh, S.S.; Srivastva, D.; Kumar, A.; Srivastava, V. FLP-ID: Fuzzy-Based Link Prediction in Multiplex Social Networks Using Information Diffusion Perspective. Knowl.-Based Syst. 2022, 248, 108821. [Google Scholar] [CrossRef]
- He, S.; Zhang, W.; Luo, J.; Zhang, P.; Zhao, K.; Zeng, D.D. Modeling the Co-Diffusion of Competing Memes in Online Social Networks. Decis. Support Syst. 2024, 187, 114324. [Google Scholar] [CrossRef]
- Džanko, L.; Suitner, C.; Erseghe, T.; Nikadon, J.; Formanowicz, M. Linguistic Features Influencing Information Diffusion in Social Networks: A Systematic Review. Comput. Hum. Behav. Rep. 2025, 18, 100626. [Google Scholar] [CrossRef]
- Rozemberczki, B. Benedekrozemberczki/Karateclub 2025. Available online: https://github.com/benedekrozemberczki/karateclub (accessed on 10 April 2025).
- Rozemberczki, B.; Kiss, O.; Sarkar, R. Karate Club: An API Oriented Open-Source Python Framework for Unsupervised Learning on Graphs. In Proceedings of the 29th ACM International Conference on Information & Knowledge Management, Virtual, 19–23 October 2020; Association for Computing Machinery: New York, NY, USA, 2020; pp. 3125–3132. [Google Scholar]


| Reference | Model Type | Key Features | Application Domain |
|---|---|---|---|
| Kempe et al. (2003) [4] | Independent Cascade/Linear Threshold | Influence maximization, greedy algorithm | Social influence |
| Leskovec et al. (2007) [5] | Cascading behavior | Empirical analysis, cascade patterns | Blog networks |
| Saito et al. (2010) [6] | Delay-aware Independent Cascade | Parameter estimation, model selection | Behavioral analysis |
| Myers & Leskovec (2012) [7] | Continuous-time diffusion | Competing contagions, cooperation/competition | Multiple information streams |
| Chen et al. (2021, 2024) [8,11] | Population dynamics | Warning timeliness, crisis focus | Emergency alerting |
| Kumar et al. (2020) [9] | SEI (epidemiological) | Exposed state | General sharing |
| Foroozani & Ebrahimi (2021) [1] | Time-fractional | Super-/sub-diffusion | Twitter/Digg |
| Tu et al. (2022) [12] | ODE-based | Spatial–temporal | Digg |
| Li & Zhu (2024) [2] | Reaction–diffusion | Time delays, correction mechanisms | Rumor spreading |
| Mohammadi et al. (2023) [18] | Fuzzy sign-aware | Trust/distrust relationships | Bitcoin network |
| He et al. (2024) [25] | Competing memes | Finite attention modeling | Content virality |
| Sun et al. (2024) [14] | SEIHR model | Attitude complexity | Rumor propagation |
| Cai et al. (2024) [10] | Complex social networks | Network assortativity, degree distribution | Financial markets |
| Liu et al. (2024) [22] | Markov multi-information | Time-varying attractiveness | Competitive information |
| Lin et al. (2025) [23] | UIU diffusion model | Network alignment | Multiplex networks |
| Singh et al. (2022) [24] | Fuzzy-based prediction | Multiplex interaction | Link prediction |
| Džanko et al. (2025) [26] | Systematic review | Linguistic features | Social media content |
| Model | Key Features | Strengths | Limitations | Performance Metrics |
|---|---|---|---|---|
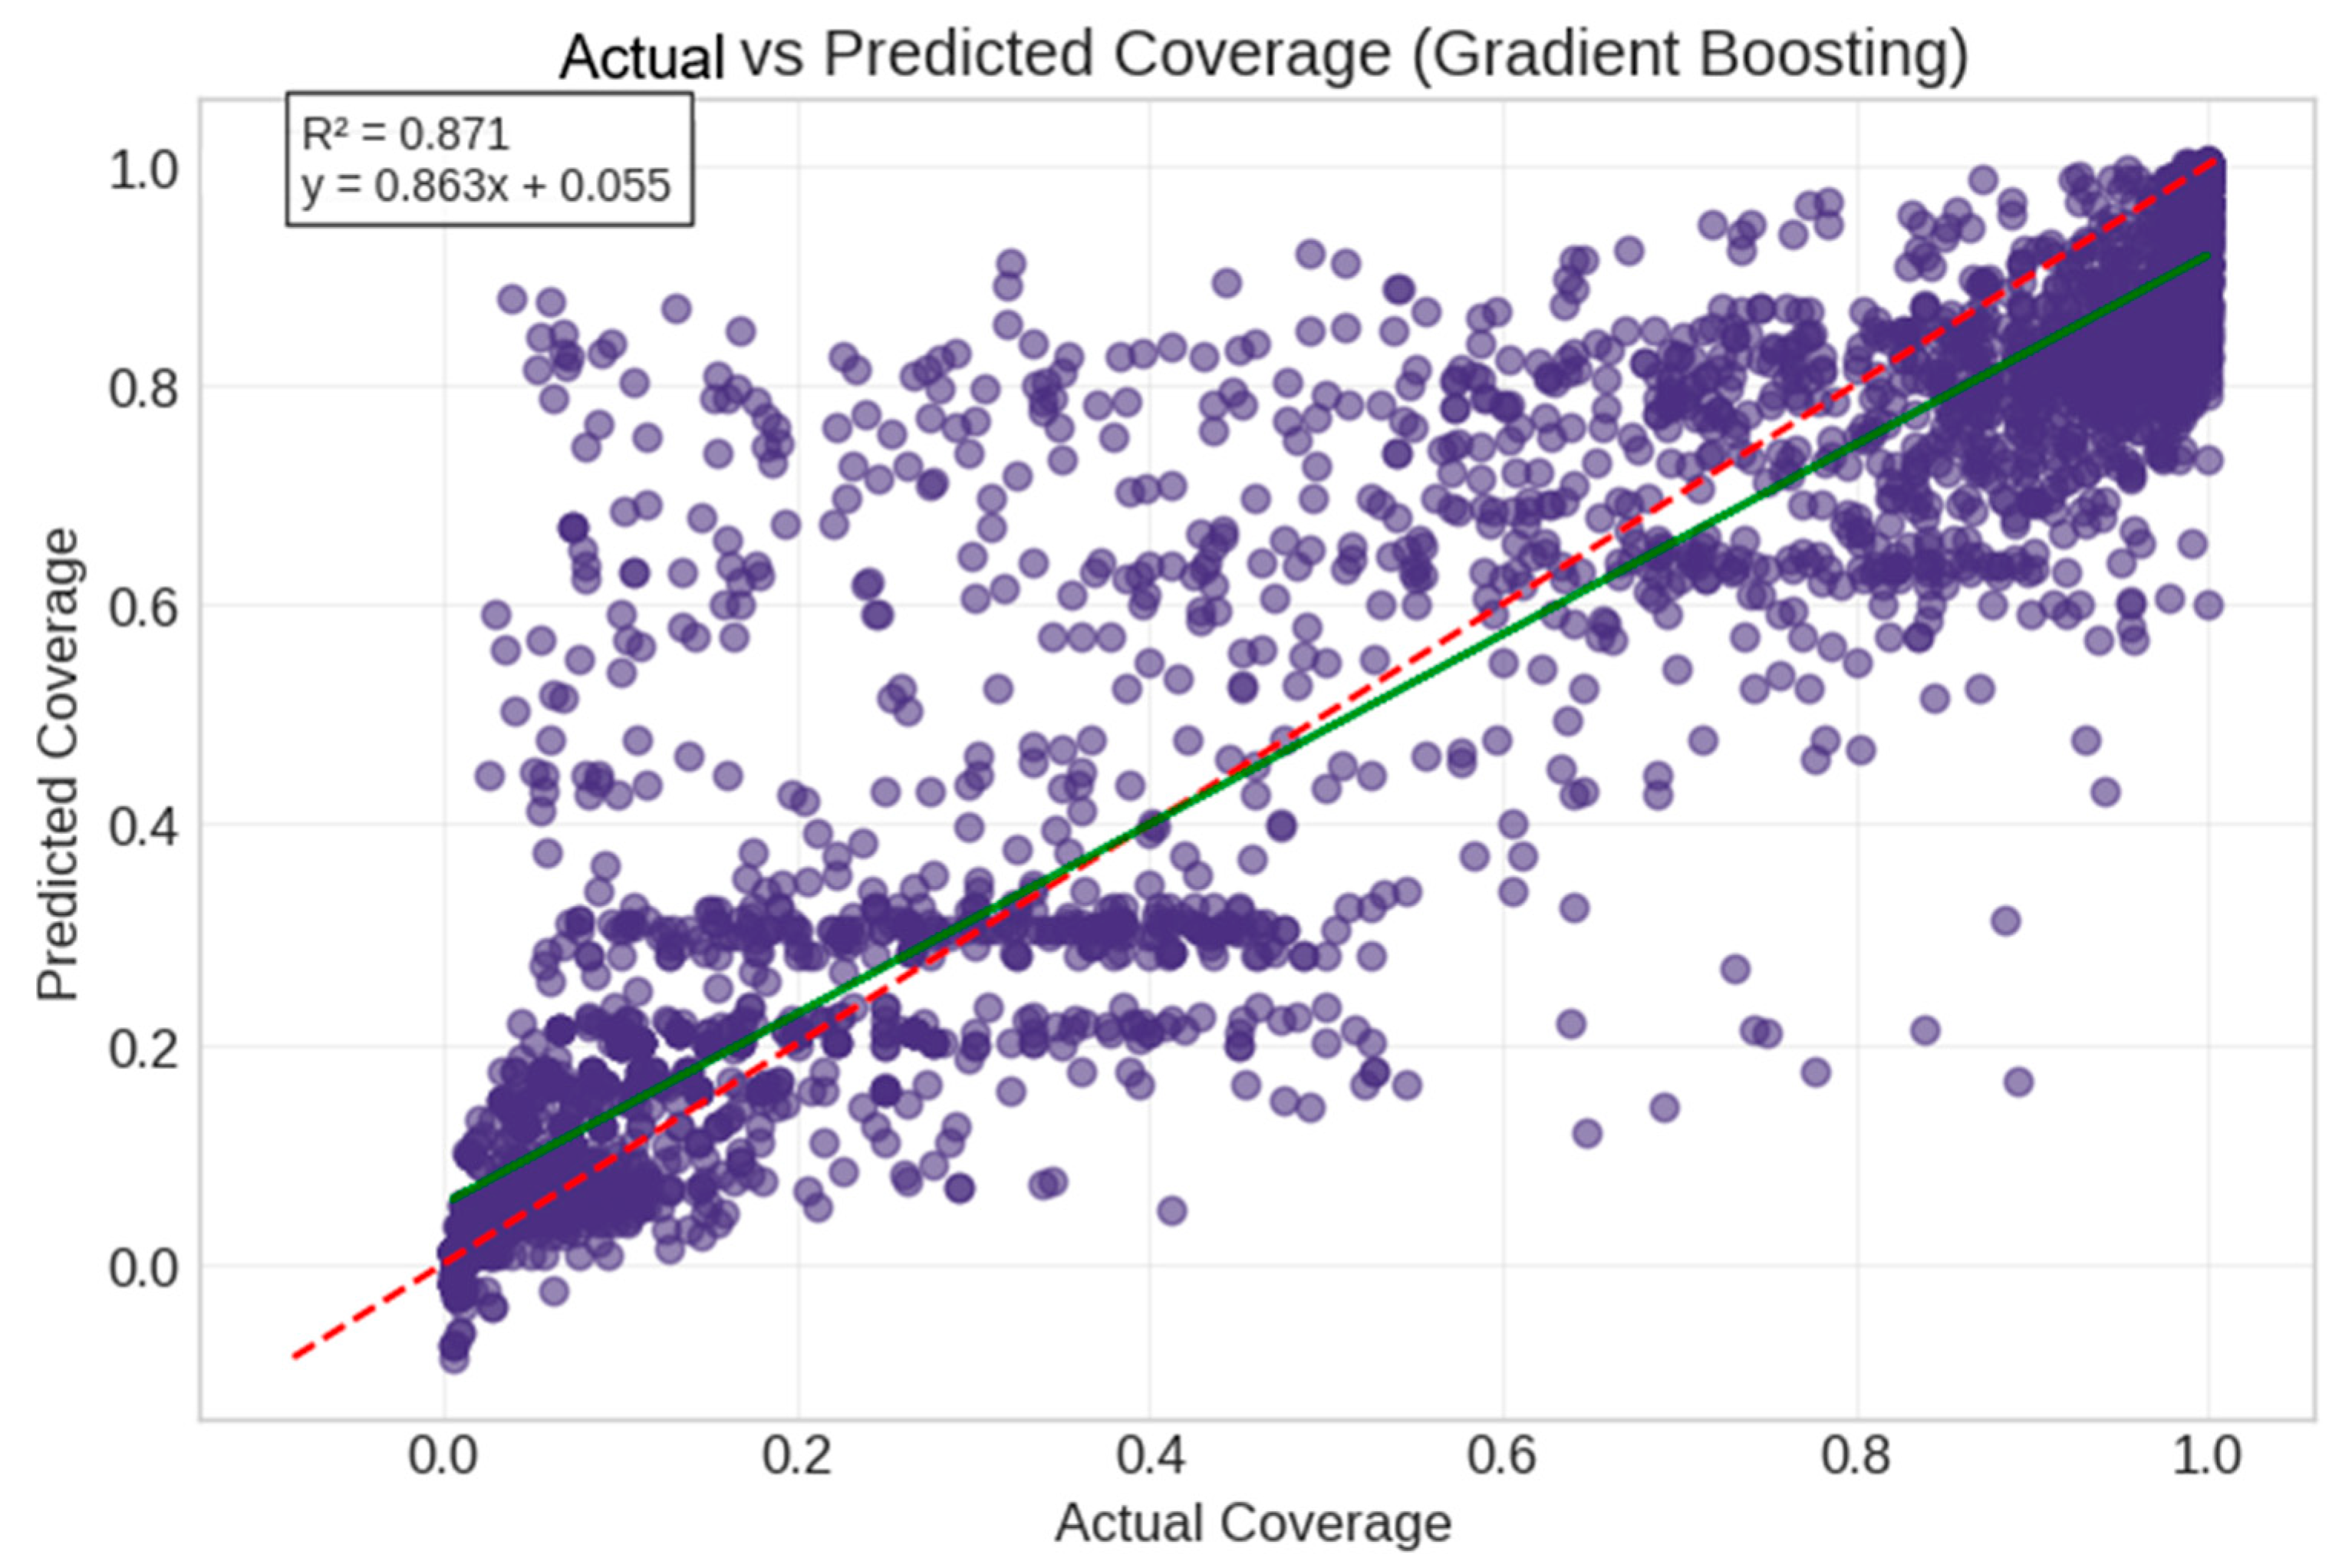
| Our Model | Multiple delay types, cross-validation on real and synthetic data, temporal dynamics focus | High predictive power (R2 = 0.847), rigorous feature selection, strong temporal insights | Limited generalizability in verification | Coverage prediction (R2), feature stability |
| Chen et al. (2021, 2024) [8,11] | Population dynamics with warning timeliness, real-world crisis applications | Good fit to Weibo data, prediction capability | Limited delay mechanism variety, no cross-network testing | Curve fitting accuracy |
| SEI Model (Kumar et al., 2020) [9] | Three-state transitions with exposed state | Captures pre-sharing exposure state, Twitter data validation | No delay variation analysis, limited feature importance | User state counts |
| Non-linear Anomalous (Foroozani & Ebrahimi, 2021) [1] | Time-fractional Fisher’s equation, continuous-time random walk | Models super-/sub-diffusion, high precision on Digg/Twitter | Complex implementation, no temporal feature analysis | Density prediction accuracy |
| ODID (Tu et al., 2022) [12] | Ordinary differential equations, friendship-based rather than geometric | A total 98.78% prediction accuracy, captures both temporal and spatial patterns | No delay mechanism comparison, limited network variety | Prediction accuracy vs. actual data |
| Fuzzy Sign-Aware (Mohammadi et al., 2023) [18] | Multi-trust relationships, fuzzy logic implementation | Handles trust/distrust relations, natural multi-level trust | Limited to signed networks, no temporal dynamics focus | Prediction accuracy, coverage |
Disclaimer/Publisher’s Note: The statements, opinions and data contained in all publications are solely those of the individual author(s) and contributor(s) and not of MDPI and/or the editor(s). MDPI and/or the editor(s) disclaim responsibility for any injury to people or property resulting from any ideas, methods, instructions or products referred to in the content. |
© 2025 by the authors. Licensee MDPI, Basel, Switzerland. This article is an open access article distributed under the terms and conditions of the Creative Commons Attribution (CC BY) license (https://creativecommons.org/licenses/by/4.0/).
Share and Cite
Bakenova, K.; Kuznetsov, O.; Artyshchuk, I.; Shaikhanova, A.; Shevchuk, R.; Orobchuk, O. Information Diffusion Modeling in Social Networks: A Comparative Analysis of Delay Mechanisms Using Population Dynamics. Appl. Sci. 2025, 15, 6092. https://doi.org/10.3390/app15116092
Bakenova K, Kuznetsov O, Artyshchuk I, Shaikhanova A, Shevchuk R, Orobchuk O. Information Diffusion Modeling in Social Networks: A Comparative Analysis of Delay Mechanisms Using Population Dynamics. Applied Sciences. 2025; 15(11):6092. https://doi.org/10.3390/app15116092
Chicago/Turabian StyleBakenova, Kamila, Oleksandr Kuznetsov, Iryna Artyshchuk, Aigul Shaikhanova, Ruslan Shevchuk, and Oleksandra Orobchuk. 2025. "Information Diffusion Modeling in Social Networks: A Comparative Analysis of Delay Mechanisms Using Population Dynamics" Applied Sciences 15, no. 11: 6092. https://doi.org/10.3390/app15116092
APA StyleBakenova, K., Kuznetsov, O., Artyshchuk, I., Shaikhanova, A., Shevchuk, R., & Orobchuk, O. (2025). Information Diffusion Modeling in Social Networks: A Comparative Analysis of Delay Mechanisms Using Population Dynamics. Applied Sciences, 15(11), 6092. https://doi.org/10.3390/app15116092