1. Introduction
The goals of carbon peak and carbon neutrality are essential for addressing climate change and are strategic objectives for China’s development, receiving strong attention both domestically and internationally [
1]. A new power system centered on new energy is imperative to meet these goals. The fault characteristics in systems with high PV integration are significantly more complex than in traditional systems. PV inverter fault currents are limited in amplitude, phase-controlled, rich in harmonics, and exhibit discrete, time-varying, nonlinear behavior. This fundamentally differs from traditional synchronous units, reducing the sensitivity of conventional fiber differential protection and increasing failure risk. Therefore, further advancement in fault analysis and the development of novel protection principles are crucial for enhancing fault identification accuracy in renewable-dominated power systems.
With further integration of technology, such as artificial intelligence [
2,
3], the internet of things, and digital twins [
4], with power systems, the power grid is undergoing a digital and intelligent transformation. The new power system must be a comprehensive energy system driven by massive data. Data acquisition and processing are performed to restore the operating state of power grids, and in-depth analysis is carried out to obtain relevant technical indicators [
5]. Although deep learning has not yet been widely adopted in power systems, research into relay protection based on deep learning presents promising and extensive application prospects.
In the past, the low penetration of photovoltaic (PV) systems meant that their fault currents were not considered in grid protection settings. However, with the increasing integration of PV systems and the implementation of Low Voltage Ride-Through (LVRT) requirements, new protection challenges have emerged. Under LVRT regulations, PV systems must remain connected for at least 1.5 s even during severe voltage drops, during which they actively inject fault currents into the grid. These fault currents, though limited in amplitude and duration, differ significantly from those of synchronous generators and cannot be treated as equivalent. Such imprecise modeling impairs protection coordination and reduces the sensitivity of traditional protection schemes. As a result, conventional current differential protection becomes inadequate in systems with high PV penetration, particularly under single-phase grounding, phase-to-phase, and external faults, where the failure to operate becomes more likely. Current research mainly focuses on improving differential protection through new decision criteria or deep learning-based identification methods.
The first type of method: The literature [
6] presents a pilot protection algorithm based on Tellegen’s second theorem, capable of distinguishing internal and external faults even under commutation failures, although its performance relies on accurate grid modeling. The literature [
7] introduces a sigmoid-based adaptive braking current to enhance sensitivity in near-90° phase-angle faults, though its computational complexity hinders applicability in real-time scenarios. The literature [
8] proposes a cross-compensation-based differential protection method that improves detection of phase-to-phase faults on renewable energy lines, but its applicability to other fault types remains limited. The literature [
9] presents a dual-criteria scheme that combines phase current differential protection with a negative-sequence current amplitude metric, improving sensitivity under asymmetric faults at the cost of increased data processing burden. The literature [
10] proposes an enhanced differential scheme with amplitude and phase corrections, suitable for MMC-HVDC rectifier mode and CT saturation, but its performance degrades when IBRs exist at both terminals. The literature [
11] proposes a time-domain pilot protection method based on two-dimensional projections of dual differential currents, constructing an internal fault index from trajectory features. While it accounts for CT saturation and fault resistance, it requires high-resolution sampling and added hardware. The literature [
12] presents a differential scheme for offshore wind farm collection lines with MMC-HVDC transmission, estimating fault-point negative-sequence voltage via open-circuit characteristics and applying torsion angle correction. The method is suited for low-fault-current conditions but involves considerable computational effort. The literature [
13] introduces a current variation-based technique for unipolar ground fault detection in DC networks, independent of fault current direction and effective for weak faults, though limited by system configuration. The literature [
14] proposes a unit protection strategy for zonal DC microgrids using superimposed impedance at both ends. It detects high-resistance and simultaneous faults but depends on precise thresholds and IEC 61850 communication. The literature [
15] improves high-impedance differential protection by analyzing voltage waveforms under CT saturation, enhancing low-current fault detection at the cost of higher signal processing complexity.
The second type of method utilizes deep learning techniques, which do not rely on predefined criteria or mathematical models but instead process raw data to extract fault features through intelligent learning. The literature [
16] combines Hilbert–Huang Transform with CNN to classify ten short-circuit fault types in small-current grounding systems using time-frequency energy images, achieving high accuracy but requiring complex preprocessing. In [
17], a DWT-CNN model extracts statistical features from wavelet coefficients for transformer differential protection, reaching 98% accuracy, though it may be sensitive to feature selection and data quality. The literature [
18] proposes a two-terminal fault location method based on adaptive CNN with pooling optimization, offering faster and more accurate diagnosis than DBN, but its performance under varying topology remains to be validated. The literature [
19] uses a 1D-CNN to map three-phase voltage/current signals to fault locations in distribution networks with distributed generation, but its scalability to large systems is limited. In [
20], a CNN-based classifier achieves over 99% accuracy for short-circuit and ground fault types, though its generality under CT saturation and complex scenarios remains unclear. The literature [
21] introduces an SVM regression model aided by CEEMDAN decomposition and active pulse injection for single-pole-to-ground fault location in MMC-HVDC systems, achieving good accuracy but requiring high-frequency data acquisition. In [
22], a CNN-based approach utilizing wavelet features detects and classifies faults in MMC-HVDC lines, with high accuracy but computational demands that may hinder real-time deployment. An improved deep belief network (IDBN) is proposed in [
23], using statistical features like standard deviation and entropy from DC, achieving rapid and accurate fault detection, though it depends on prior preprocessing. The literature [
24] presents a CA-CNN-based protection method using differential current trajectory images, integrating channel attention and adaptive learning to enhance internal/external fault discrimination, though a 5 ms delay may affect ultra-fast protection needs.
Traditional fiber differential protection (FDP) schemes face increasing reliability challenges in PV-connected transmission systems due to the low magnitude and variability of fault currents, brief fault durations, and nonlinear behavior of current transformers (CTs) under saturation. These factors can lead to misoperations or failure to trip during critical fault conditions.
To address these challenges, in this paper, deep learning is innovatively introduced into relay protection for transmission lines connecting PV stations, and a new time-domain protection algorithm based on two-dimensional spatial current trajectory and data-enhanced convolutional neural network (A-CNN) is proposed. It is not affected by factors such as power grid system strength, fault location, fault time, fault type, fault resistance, severe CT saturation, CT measurement errors, and outliers. It meets the four requirements of relay protection and is superior to existing protection methods.
The rest of the paper is organized as follows:
Section 2 analyzes FDP adaptability under various fault conditions.
Section 3 describes the current trajectory image reconstruction method and the proposed algorithm.
Section 4 presents simulation results, and
Section 5 discusses conclusions and future prospects.
2. Adaptability of FDP to PV Station Access
FDP is the main form of protection for high-voltage transmission lines above 220 kV in China. However, with the integration of new energy sources such as PV stations, the characteristics of fault currents have changed, making traditional FDP less applicable [
11]. This section analyzes the adaptability of FDP to PV station access and the impact of CT saturation on protection action.
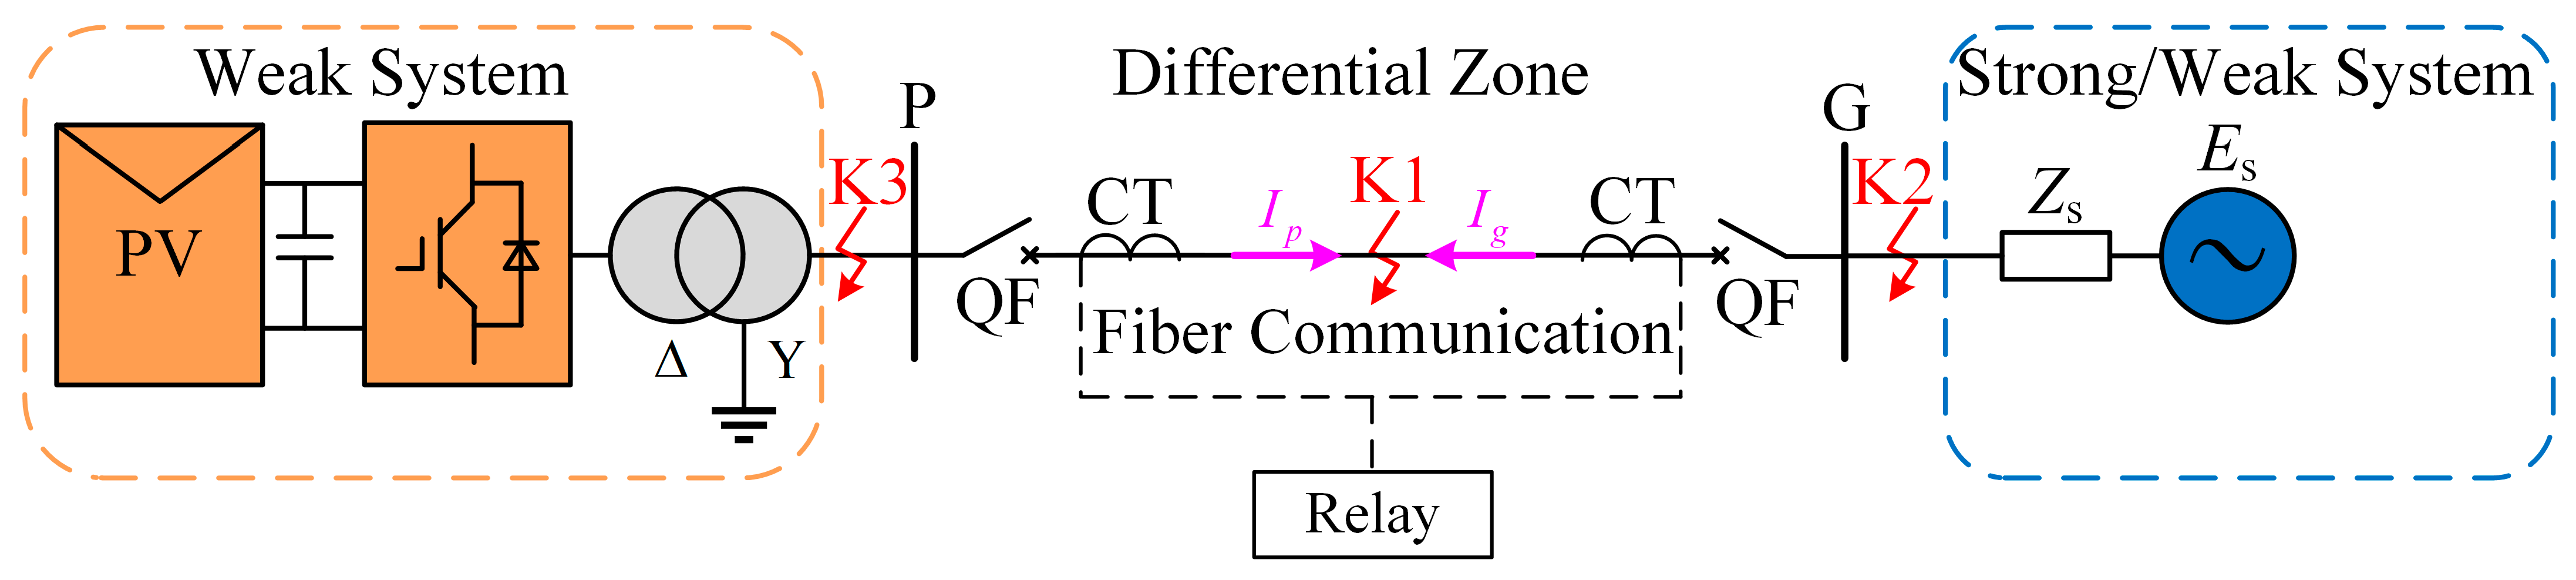
The model of FDP in transmission lines connecting PV stations is shown in
Figure 1. K1 is an internal fault, K2 is an external fault on the system side, and K3 is an external fault on the PV side. The fault current provided by PV stations is limited in amplitude, showing a weak feed effect, and the power grid side is divided into a strong power grid and a weak power grid according to the short-circuit capacity and voltage support capacity of the power grid. The transmission line is modeled in PSCAD with a length of 100 km and rated frequency of 50 Hz. Line impedance parameters (R, X, and B) are given in per-unit values, and distributed parameter modeling is adopted to preserve electromagnetic transient accuracy. A midpoint connection at 40% of the total length is used to emulate a typical PV connection scenario.
FDP generally adopts the ratio braking action criterion [
10], which compares the differential current to the braking current to determine the appropriate protection action.
In Formula (1), K is the braking coefficient, and the steady-state fault usually takes the value of 0.8 in engineering practice [
10]. I
on is the starting value of the protection action, which is the minimum action threshold.
is the differential current and
is the braking current. The fault current phase difference for internal faults is −90° to 90°, and the fault current phase difference for external faults is 180° to 270° [
25]. Formula (2) defines the control strategy of photovoltaic inverters under abnormal grid voltage conditions, which limits the amplitude and phase of fault currents to meet LVRT requirements and ensure safe inverter operation.
In Formula (2),
id* and
iq* are the reference active current and reactive current of the PV side, respectively. It is evident that the PV side operates at a unit power factor under the steady-state conditions of the power grid. When the inverter fails, the maximum current is limited to 1.2 times the nominal current
IN, which can be seen in the fact that the amplitude of the PV side current is limited and the phase is controlled.
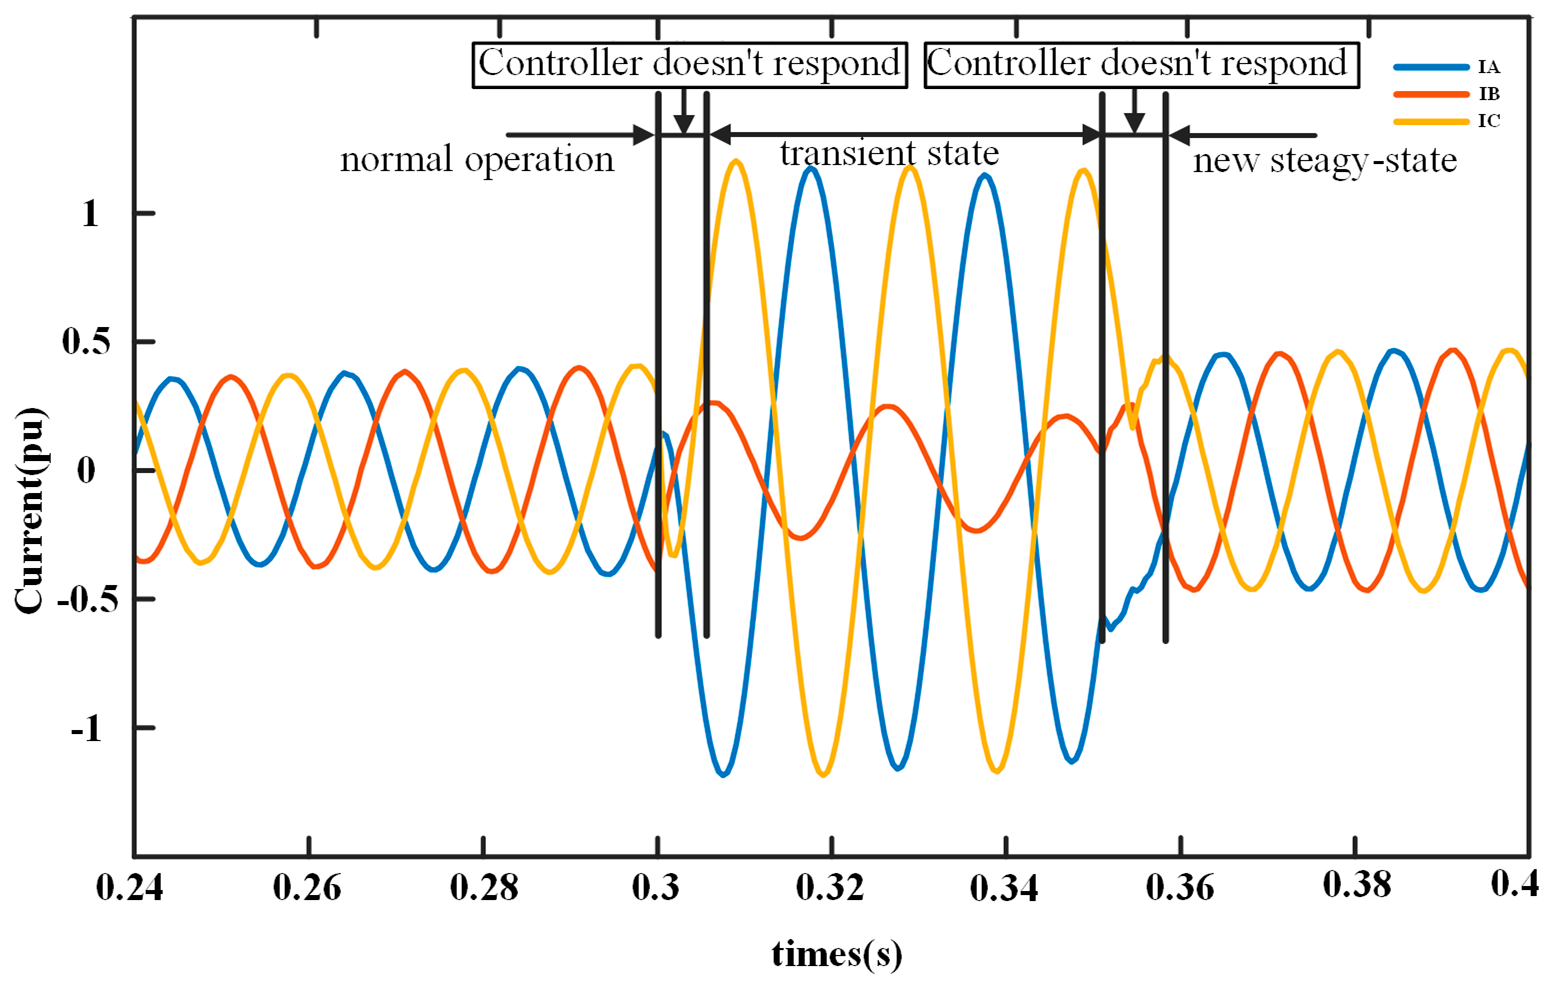
Figure 2 shows the current characteristics on the PV side during an AB-phase fault, with the fault current amplitude being limited.
Figure 2 shows the PV-side current waveforms during an AB-phase fault. Before 0.30 s, the system operates normally with balanced sinusoidal currents. After the fault occurs, a transient state appears due to the controller’s delayed response. Eventually, a new steady state is established with a limited fault current amplitude, demonstrating the effectiveness of the fault current limiting strategy.
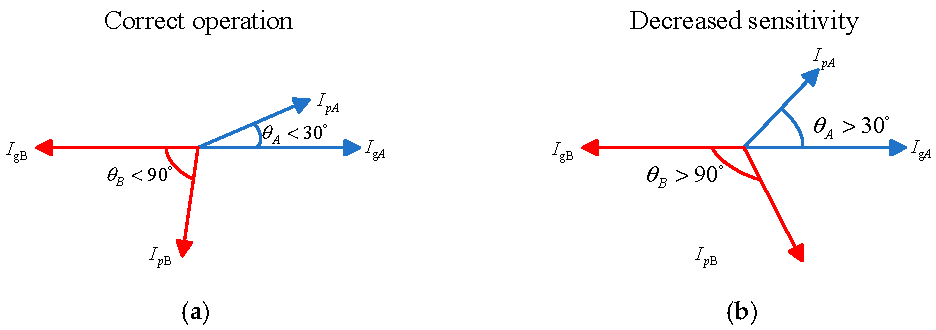
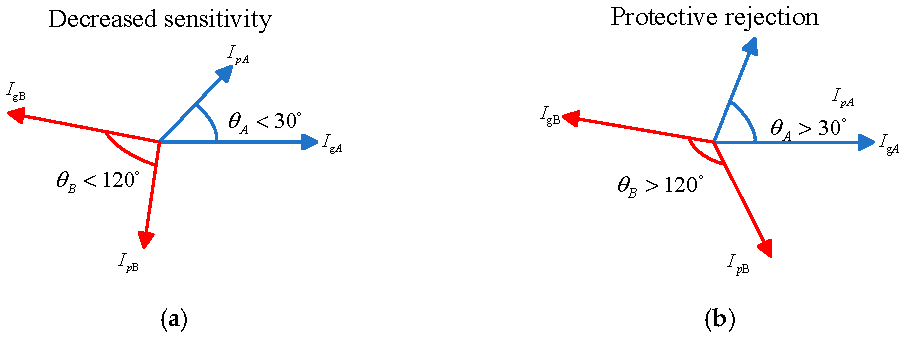
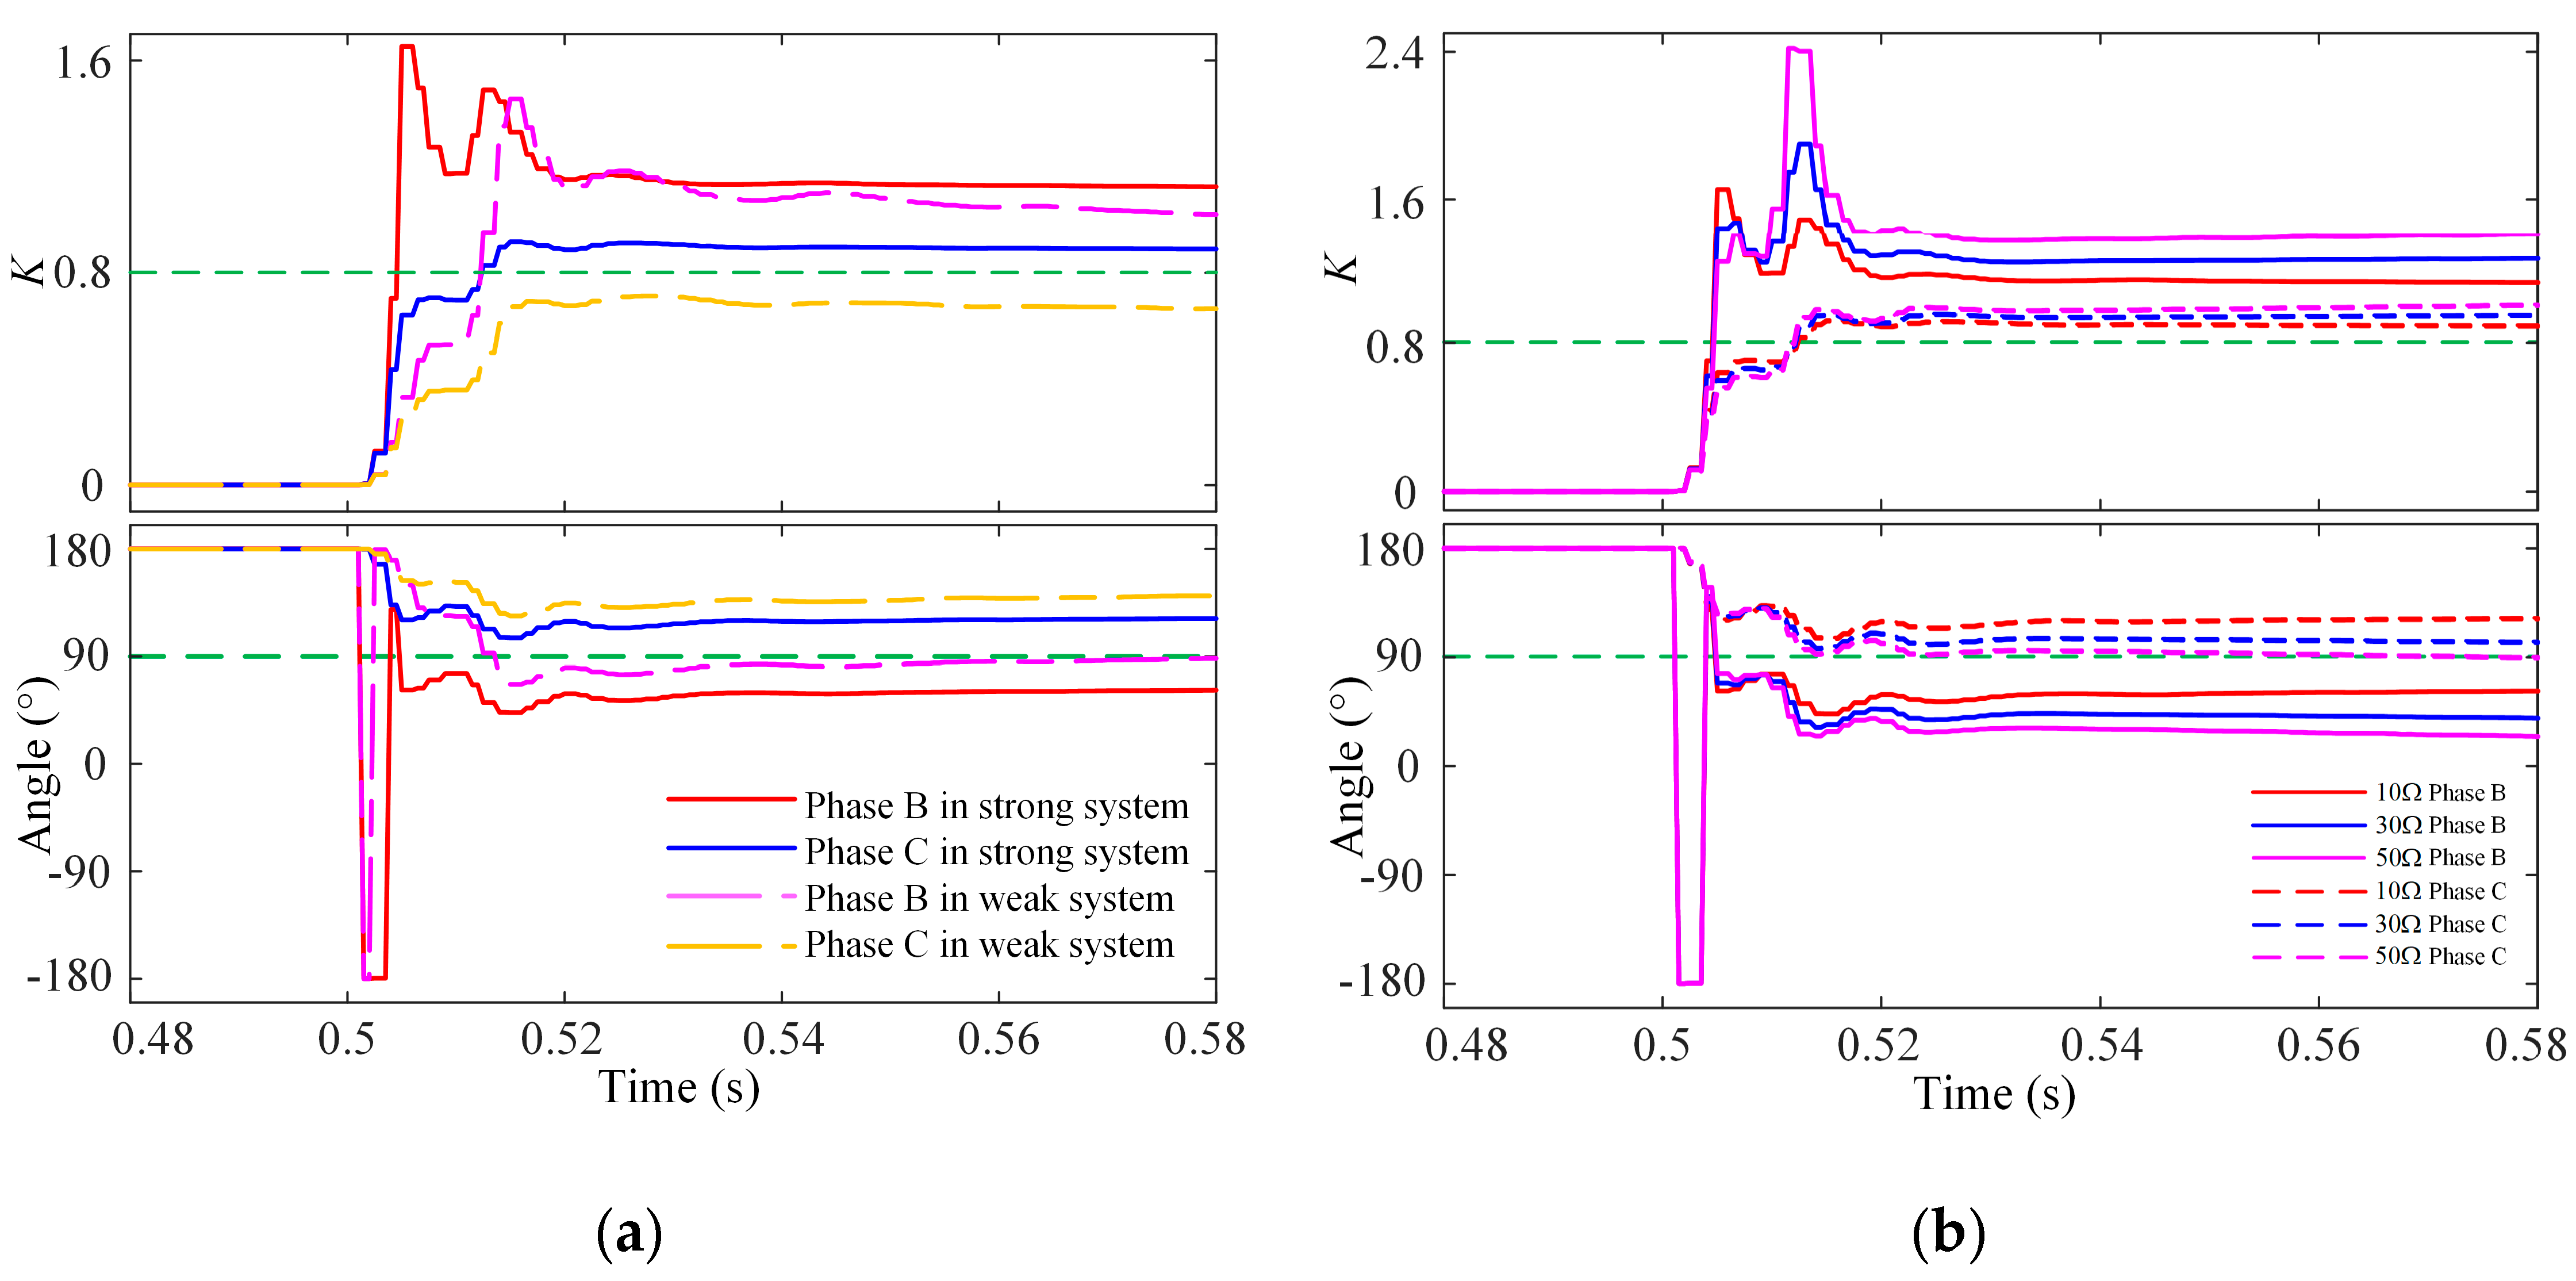
2.1. Influence of Asymmetric Faults on Action Criteria in PV Station
Since the control strategy of the inverter makes the negative sequence component of the short-circuit current zero, when a fault occurs, the fault current contains only the zero sequence component and the positive sequence component. And because the photovoltaic transformer shown in
Figure 1 often uses Y/Δ wiring, the zero-sequence network is open-circuited and can be ignored, leaving only the positive-sequence network. When asymmetric faults occur, due to the weak feed characteristics on the PV side, the fault current on the PV side has little influence on the differential current when the power grid is strong. In this case, the sensitivity of FDP will be reduced, but the possibility of failure to operate will be small. However, when the power grid is weak, the fault current on the PV side has a great influence on the differential current and braking current, and the traditional differential protection will also reduce the sensitivity, and the phase angle difference is obtuse, so the possibility of failure to operate is high [
9].
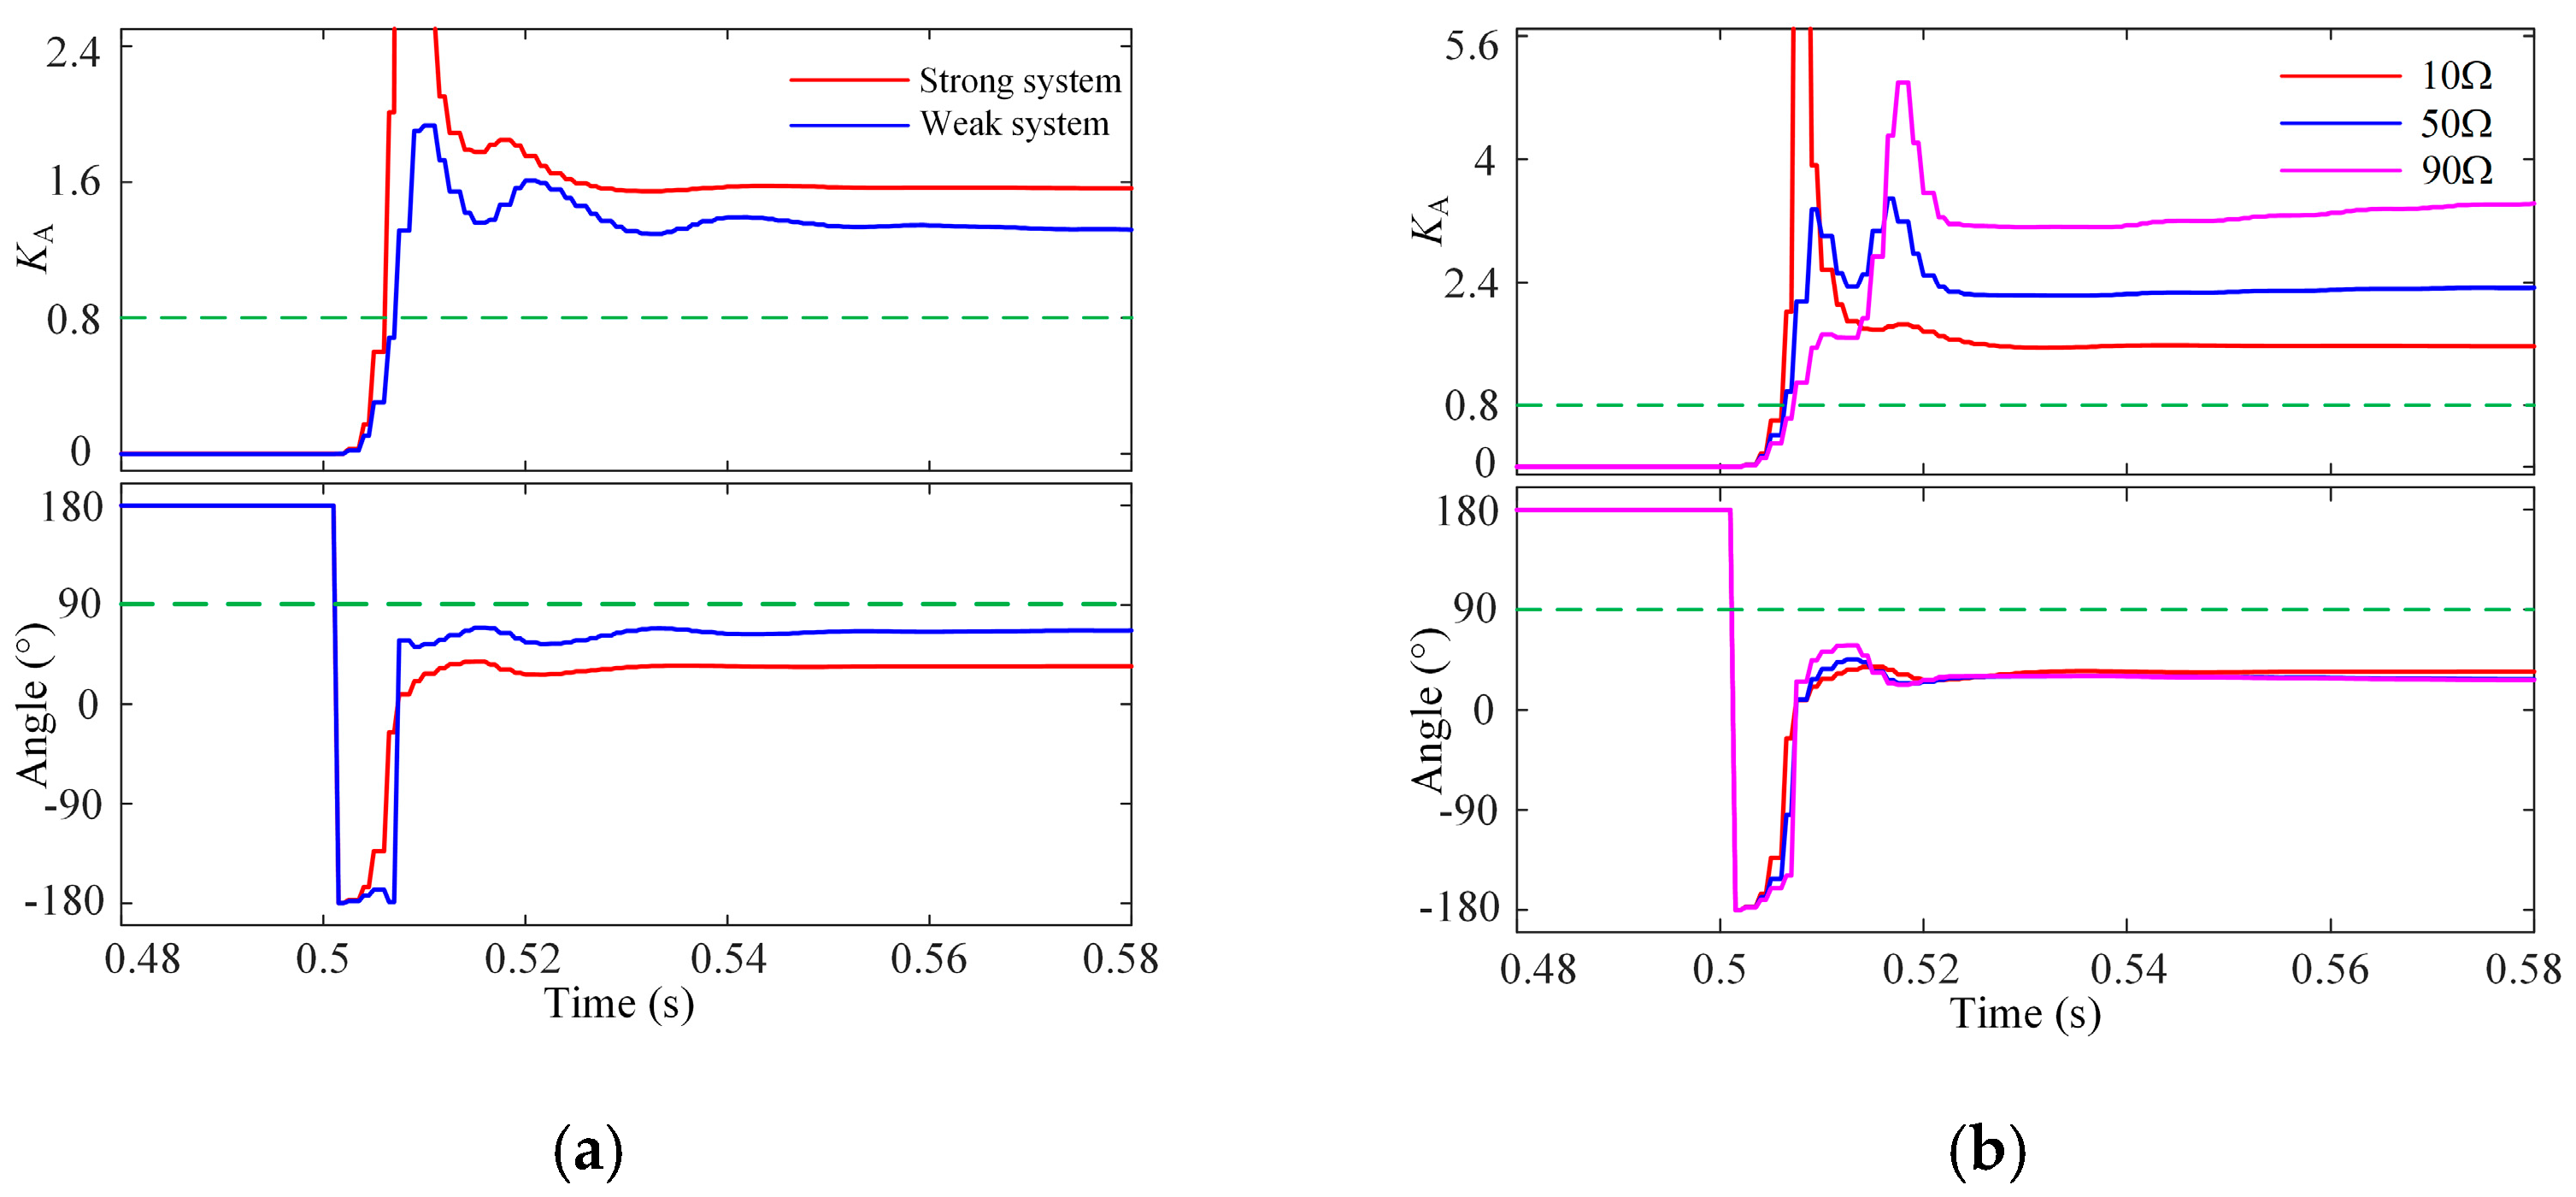
Figure 3 and
Figure 4 show the phase angle between PV side current and grid side current when AB-phase fault occurs in strong power grid and weak power grid, respectively.
2.2. Influence of CT Saturation on Action Criteria in PV Station
CT saturation makes the measured value of fault current smaller than the actual value [
26], which has a more significant impact on external faults and a smaller impact on internal faults. When an external fault occurs, the CT is likely to enter a nonlinear operating state (saturation state) within a few milliseconds. In this case, the high DC component current on the primary side will lead to the enhancement of the conductive ability of the magnetized branch of CT, thus leading to a large secondary current, which may be misjudged as an internal fault, causing the protection system to operate incorrectly [
27]. Due to the controllability and current limiting characteristics of grid-connected inverters of PV stations, the amplitude of grid-connected fault current
Ip is small. Especially in strong systems, external or internal faults on the system side have little impact on the action criterion, and CT saturation rarely occurs. However, with external faults on the PV side, the differential current to braking current ratio increases significantly, potentially causing CT saturation and leading to protection failure or system misoperation [
28].
2.3. Simulation Conclusion and Analysis
The simulation circuit model is built using PSCAD 4.2 as shown in
Figure 1. The system-side synchronous generator operates in two modes: a strong or weak system [
29].
Figure 2 and
Figure 3 analyze the action criteria waveforms and braking current phase angles under different power systems and fault resistances for A-phase ground, BC-phase, and internal faults.
Figure 5 and
Figure 6 study, respectively, waveforms of action criteria and phase angle of braking current under different power systems and fault resistances when phase-A-to-ground and phase-B-to-phase-C internal faults occur.
From
Figure 5a and
Figure 6a, it can be observed that FDP operates accurately when faults occur in a strong system and also operates reliably during earth faults in a weak system. But the phenomenon of refusal to operate is very likely to occur when a short-circuit fault occurs [
26], such as K < 0.8.
From
Figure 5b and
Figure 6b, FDP operates reliably under different fault resistances in a strong system. As fault resistance increases, the action criterion gradually rises. The protection operates reliably during earth faults. However, the protection sensitivity decreases during phase-to-phase faults.
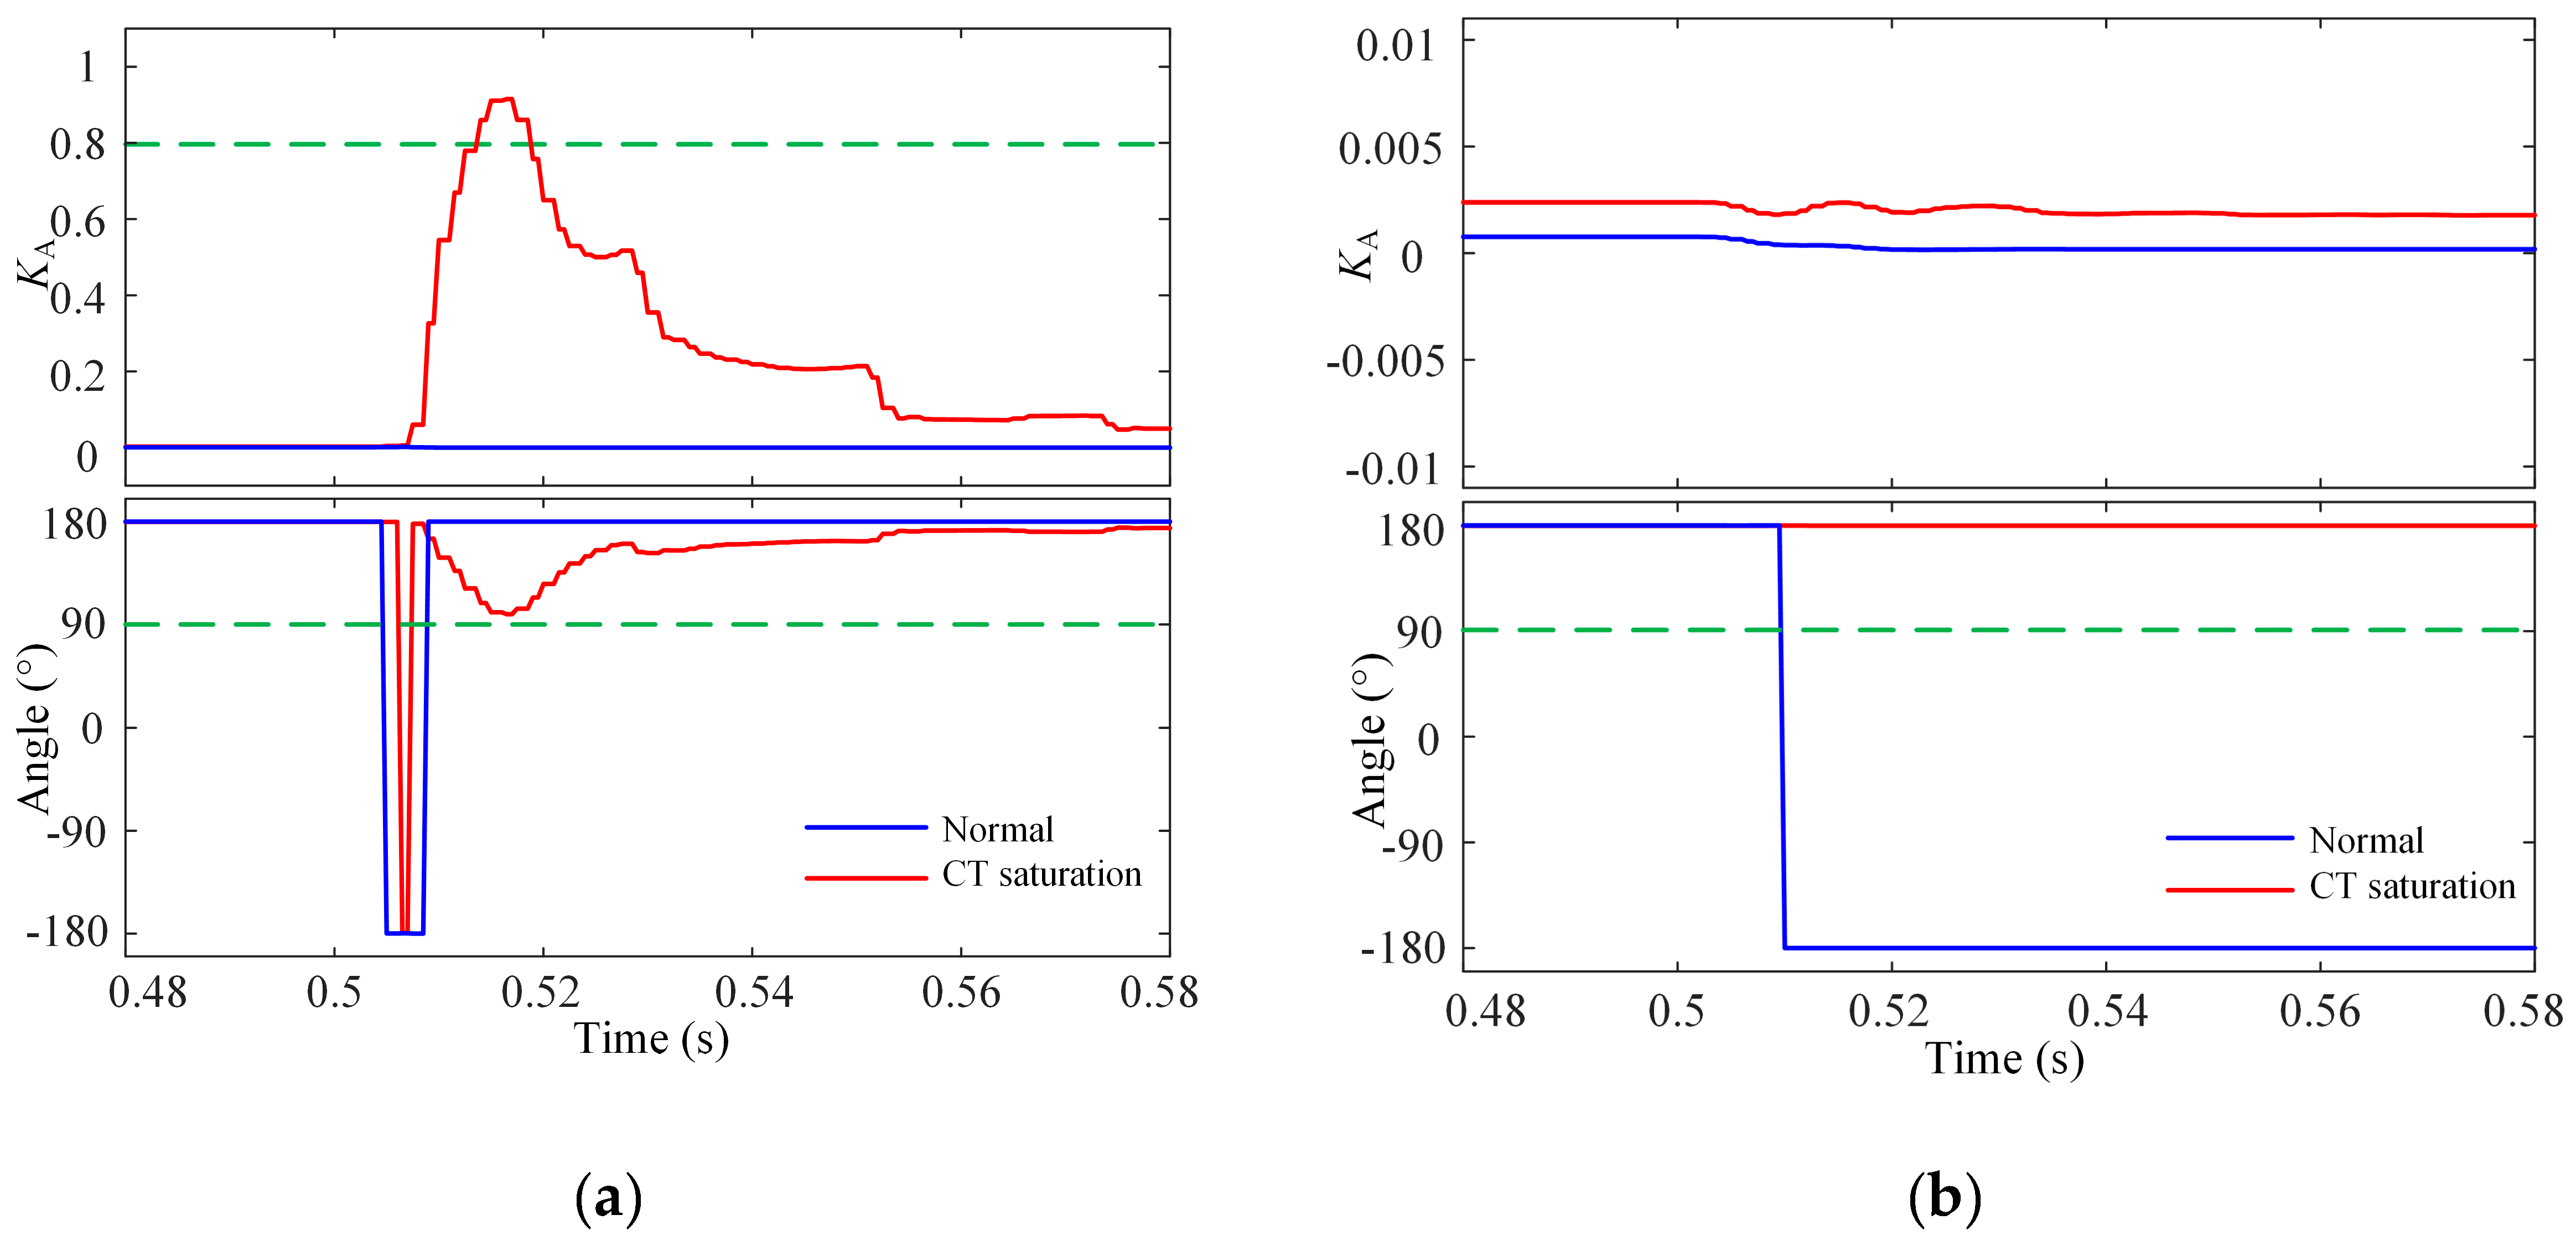
Figure 7 examines the waveforms of the action criterion, the phase angle of the braking current, and the influence of CT saturation in a strong system during external faults on the PV and system sides. In
Figure 7a, severe CT saturation on the PV side causes K
A to increase significantly, exceeding 0.8, but protection fails to act. In
Figure 7b, protection does not operate under serious CT saturation on the system side. The transmission line carries weak current from the PV side, and due to its low power capacity, CT saturation is minimal. K
A increases slightly but remains well below 0.8.
3. Reconstruction Method and Protection Algorithm
To address the adaptability of FDP to PV station access, a new protection algorithm is proposed that leverages the image recognition capabilities of deep learning. This algorithm does not rely on fixed protection thresholds but instead distinguishes waveform differences.
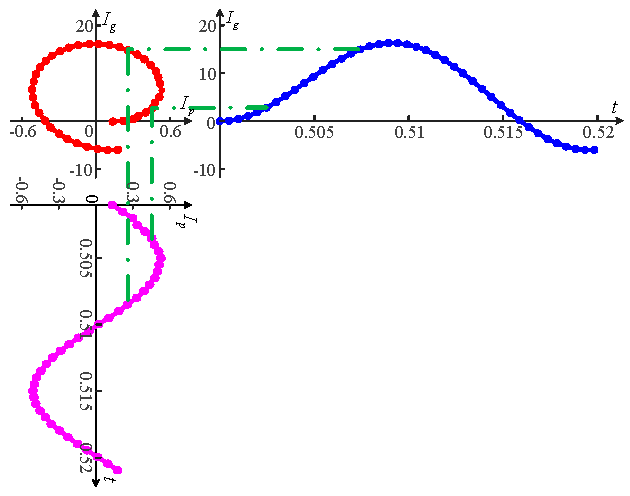
3.1. Reconstructing Current Trajectory in Two-Dimensional Space
As a new power system with a high proportion of new energy is affected by the control system, the amplitude of the fault current is limited, the phase changes, and the equivalent impedance property of the system changes, and the difficulty of accurately identifying the fault is significantly increased by the traditional differential protection that relies on the analysis of the power frequency characteristics of the fault current. As shown in
Figure 2, the characteristics of the transient quantity after the fault is considered, combining new energy control collaboration and deep learning to construct a new principle of protection.
From [
11], the differential current of a photovoltaic parallel network is summarized in Formula (3). It can be seen that the differential current consists of power frequency and DC attenuation, including all the information of the fault current on the PV side and the grid side, which can be used to construct a new protection principle.
In Formula (3), Ip is the current amplitude on the PV side, Ig is the current amplitude on the PV side, ω0 is the power frequency, ψp is the current phase angle on the PV side, and and denote the amplitudes of the alternating current (AC) and direct current (DC) components of the grid-side current, respectively. θ0 is the initial angle, and Ta is the decay time constant of the DC component.
In the two-dimensional space plane coordinate system, the PV side current Ip is taken as the X-axis independent variable, and the system side current Ig is taken as the Y-axis dependent variable. Over time, the two will draw a trajectory curve image in the coordinate system. The trajectory image contains all characteristic information of phase electrical quantities and sequence electrical quantities, such as amplitude, phase, and power of the current at both ends of transmission lines.
The continuous waveform is essentially composed of the point set with a certain sampling frequency. It is assumed that the point sets Ip and Ig with N data points can be expressed as Formula (4); Ip(k) and Ig(k) denote the k-th sampled current values on the PV side and the grid side, respectively:
The data points sampled at the same time in the two sets form
N data pairs in one-to-one correspondence [
18], such as in (5).
This paper uses a 2 kHz sampling frequency. For the 50 Hz power system, 40 data points are sampled in one cycle (20 ms), forming 40 data pairs. All data pairs are mapped to a two-dimensional space plane to obtain the current characteristic trajectory image, as shown in
Figure 8.
Figure 8 demonstrates the methodology for reconstructing two-dimensional spatial current trajectory images, which serve as the critical input for the proposed deep learning-based protection algorithm. This process transforms raw current signals from photovoltaic stations and grid-side systems into time-domain spatial features, enabling A-CNN to extract fault characteristics without relying on predefined thresholds or grid models.
3.2. Characteristics of Current Trajectory Images
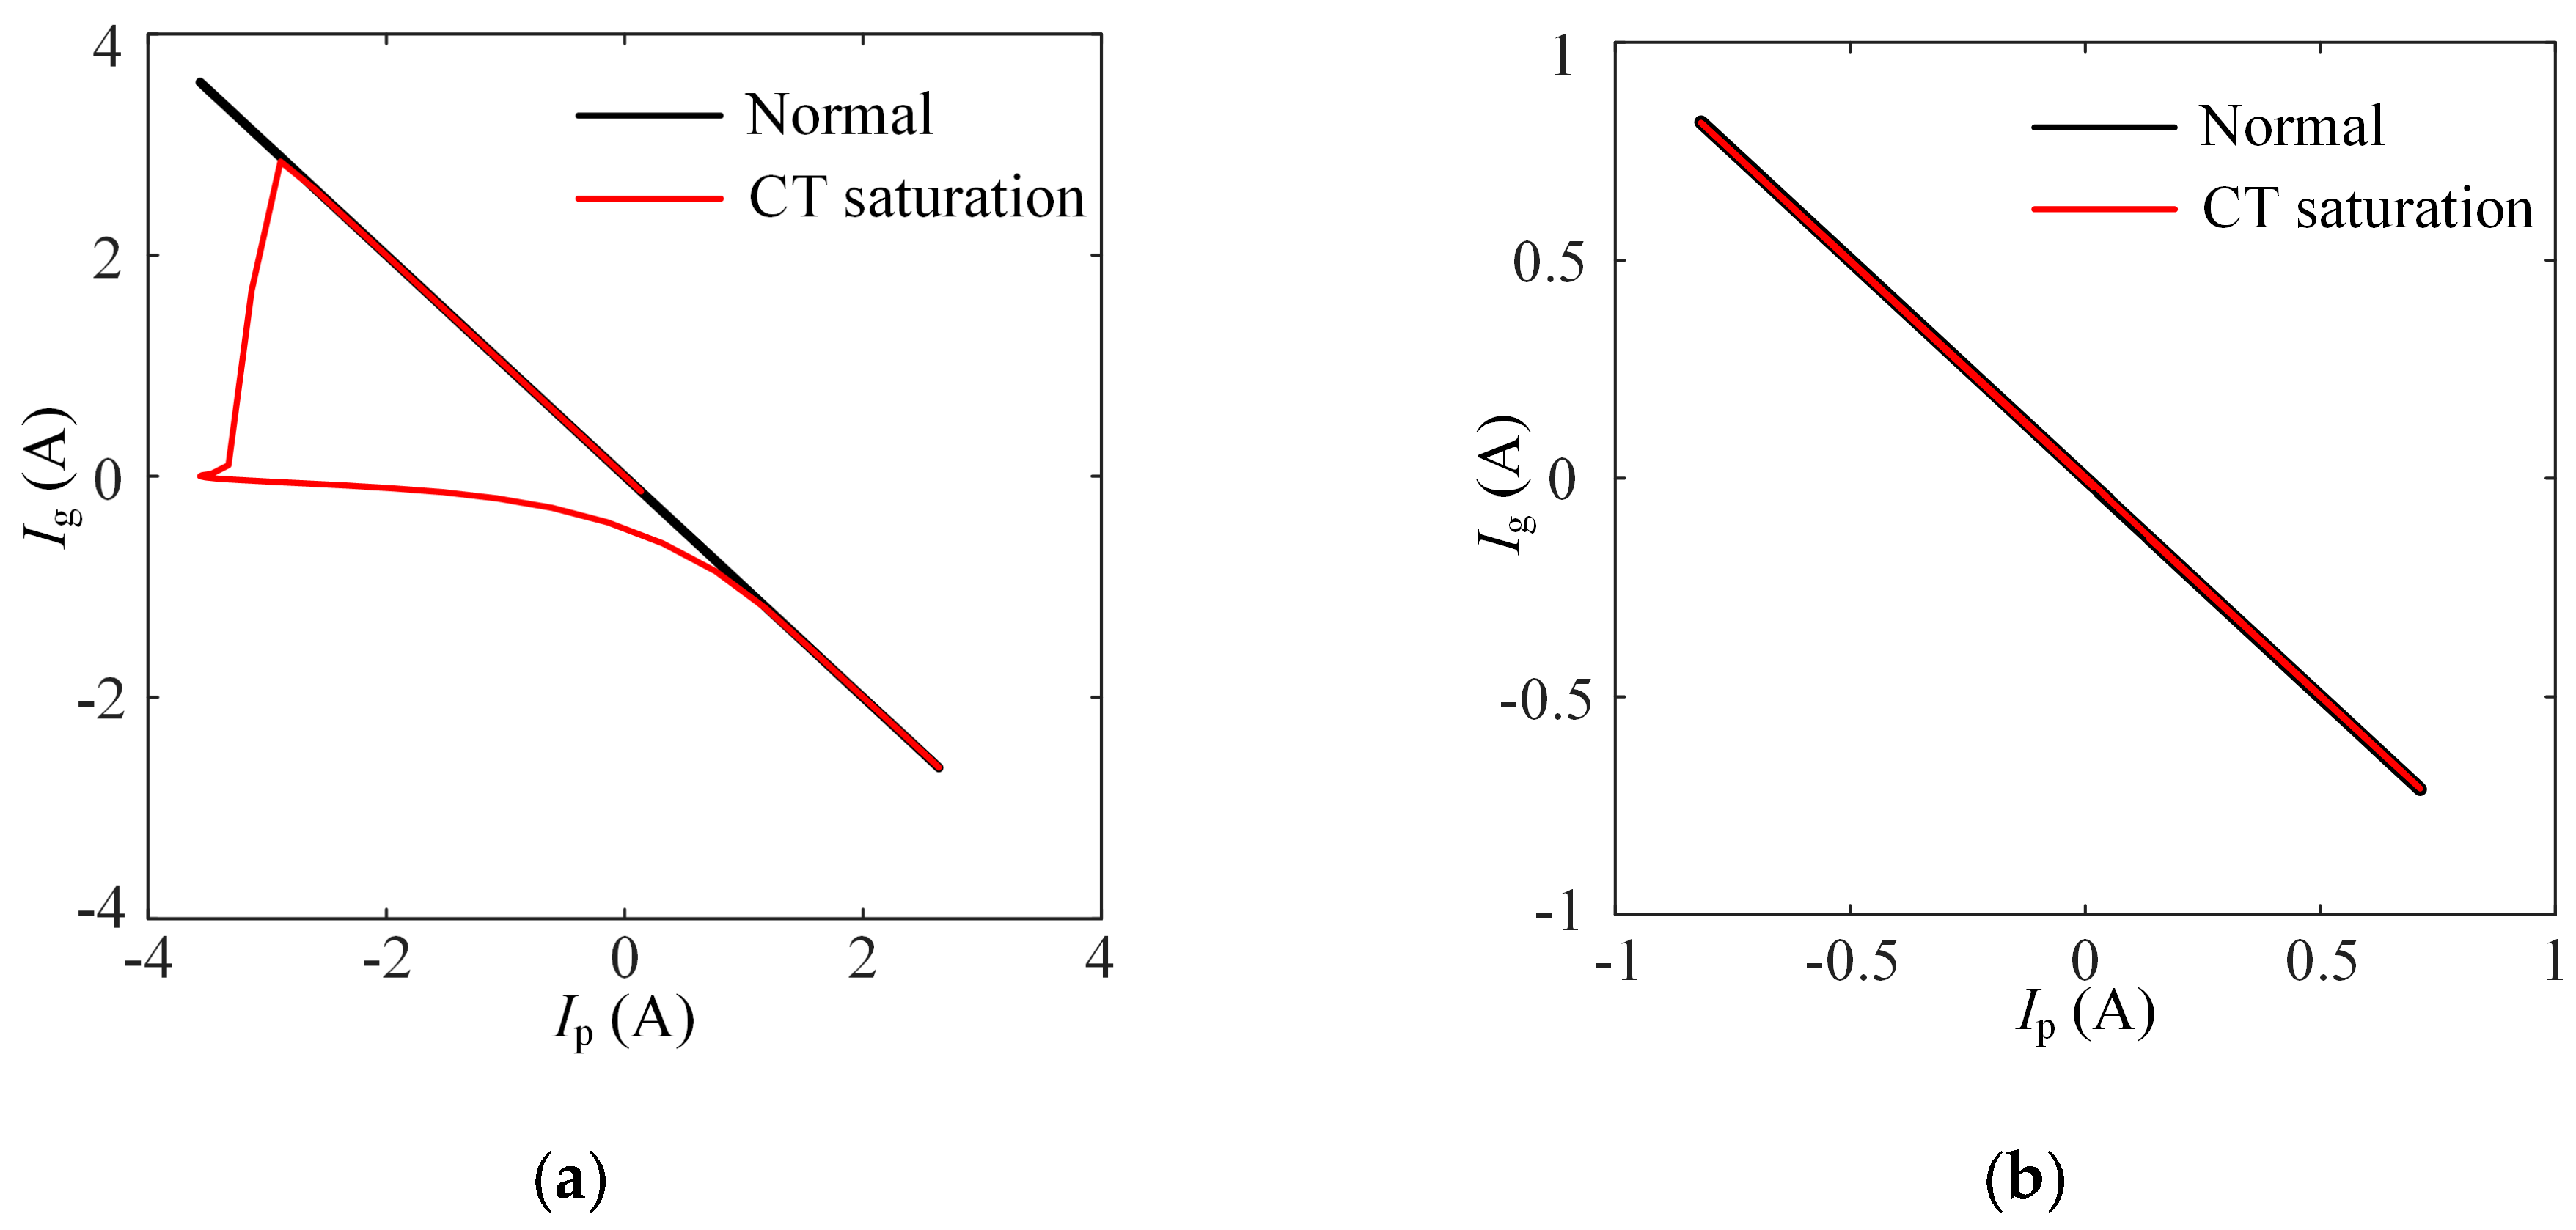
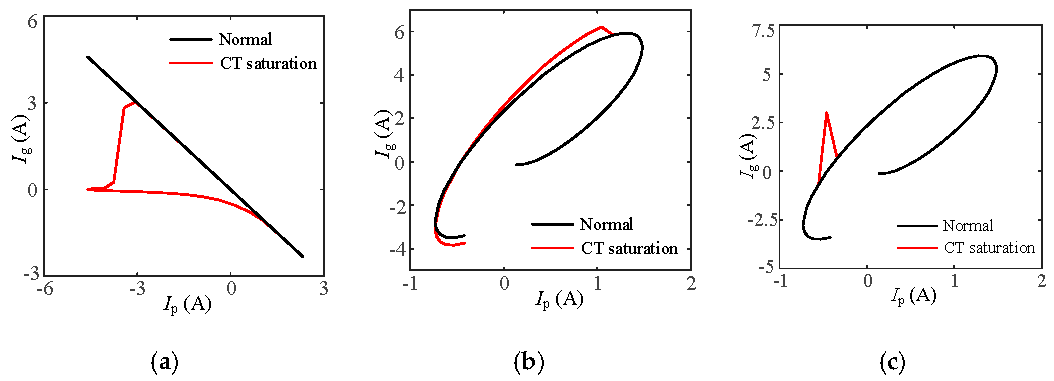
3.2.1. External Failure and CT Saturation
When an external fault occurs, the fault currents on the PV side and system side have equal amplitudes and opposite phases. The reconstructed current trajectory image with
Ip as the horizontal axis and
Ig as the vertical axis is approximately y = −x in the second and fourth quadrants [
30]. When CT saturation is considered, external faults on the system side are not affected much, but the reconstructed waveforms of external faults on the PV side are obviously distorted, as shown in
Figure 9.
3.2.2. Internal Failure and CT Saturation
When an internal fault occurs, as shown in
Figure 10, due to the control strategy, the amplitude of
Ip is much smaller than
Ig. The current trajectory is close to the Y-axis or in the first and third quadrants. With CT saturation, the waveforms become irregularly distorted.
As evidenced by
Figure 9 and
Figure 10, the two-dimensional reconstructed current trajectory images exhibit marked dissimilarities between the internal and external fault conditions, while pronounced waveform discrepancies are also observed between faulted phases and normal phases. So, deep learning can be used to identify the trajectory and then realize fault location.
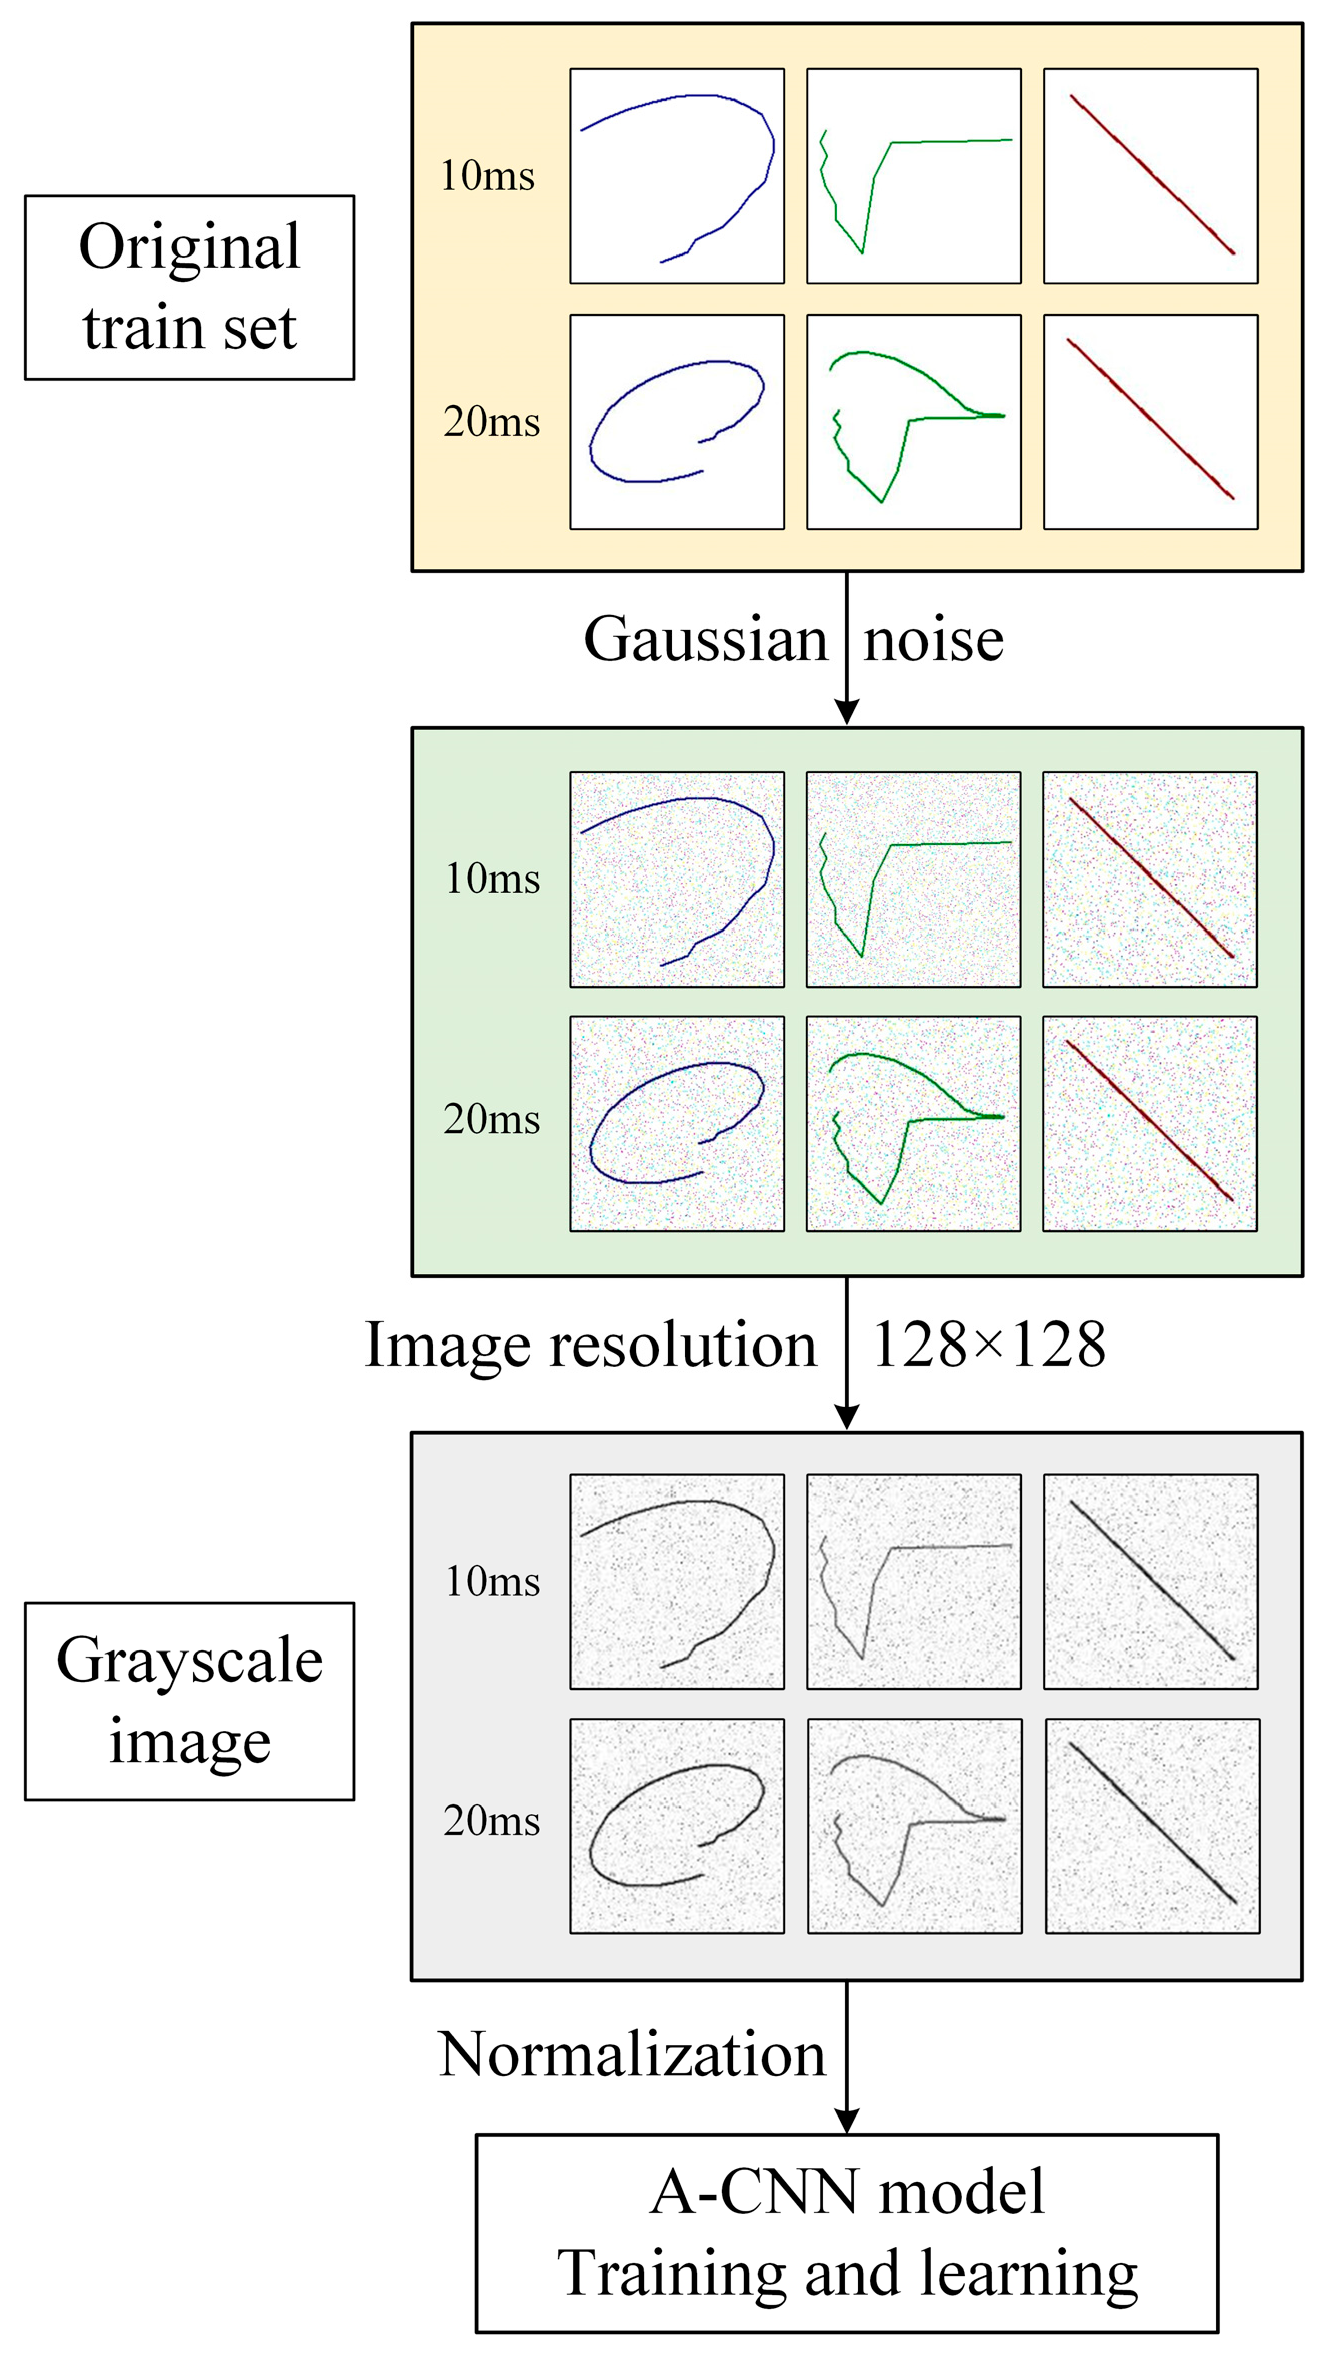
3.2.3. Data Set Processing
The principle of deep learning largely depends on its generalization ability. The more diverse and comprehensive the data features used to train the neural network, the stronger its generalization capacity, resulting in better fault identification accuracy, robustness, and adaptability to various operating conditions. To address this, a data-enhanced convolutional neural network (A-CNN) based on cross-overlapping datasets is proposed. Waveform data from both the half cycle (10 ms) and one full cycle (20 ms) after the fault occurrence are used for A-CNN training and learning. The first 10 ms data set is enhanced to ensure rapid fault detection for quick system response, while the second 10 ms data set acts as a backup to ensure reliability and stability over a broader range of conditions. Together, these datasets improve the algorithm’s performance under various fault scenarios, especially in complex grid environments with high variability and uncertainty. As shown in the train set example, the data set processing is illustrated in
Figure 11, highlighting critical steps for data augmentation, data cleaning, feature extraction, and training optimization. This dual data set approach ensures rapid fault identification while maintaining a high degree of reliability, accuracy, consistency, and fault tolerance, even in the most challenging environments, ensuring long-term operational stability and resilience.
Considering the influence of CT saturation, the data set consists of two types of CT saturation and normal under various fault conditions. The fault conditions mainly include fault type, fault location, fault resistance, and whether CT is saturated. A total of 5664 current trajectory images were collected, including 2832 pictures of 10 ms after the fault moment and 2832 pictures of 20 ms, with a resolution of 128 × 128. Images are divided into a training set and a test set according to the ratio of 4:1, and Gaussian noise is added to the training set for data enhancement.
3.2.4. Protection Principle and Training Effects
The protection algorithm based on two-dimensional spatial current trajectory images and deep learning operates as follows: after a fault occurs, the PV side and system side currents are collected over a defined period. These currents are then combined to reconstruct a detailed characteristic current trajectory, processed into a cross-overlapping data set, and sent to the A-CNN model for training. Real-time monitoring of the current at both ends of the three-phase line enables the system to continuously reconstruct and update the current trajectories, which are fed into the trained neural network for fault identification. Once a fault waveform aligns with the characteristic trajectory, the system can accurately differentiate between internal and external faults, identify faulty or normal phases, and issue either an action or blocking signal to the relay. This advanced algorithm significantly improves upon traditional methods by enhancing reliability, reducing response time, and increasing fault sensitivity, particularly in complex systems like PV stations. Furthermore, it is highly robust against common issues such as CT saturation, data anomalies, outliers, and varying fault locations, ensuring a more consistent and efficient protection response under a wide range of fault conditions. The entire process of real-time monitoring, fault analysis, and protection signaling is illustrated in
Figure 12. This demonstrates how the algorithm’s innovative use of deep learning not only increases the accuracy and speed of fault detection but also provides an adaptive framework that can handle the evolving challenges of new power systems. The method is particularly suited to grids with high renewable energy penetration, where conventional protection schemes often struggle to perform effectively under dynamic and rapidly changing conditions.
Among them, a few points which should be clarified are as follows:
(1) Source of the data set. The data set cannot implement an enumeration of all cases. But, A-CNN has good generalization ability. Similar fault conditions can be accurately identified, which meets the reliability requirements of relay protection.
(2) Realization of fault location. In the new protection algorithm, A-CNN adopts a two-class network. As shown in
Figure 12, label 0 indicates that this phase is a fault phase during an internal fault, and label 1 indicates that this phase is a normal phase or during an external fault. Three-phase fault waveforms are sent to A-CNN for detection, satisfying selectivity.
(3) Meaning of dynamic coverage. A continuous waveform is composed of a point set with a certain sampling frequency. At each moment, the recorded wave of the previous cycle is sent to A-CNN for fault identification. Considering the generalization ability of A-CNN, a complete 20 ms fault waveform after the fault moment can be accurately identified, which will greatly improve rapidity.
(4) Situation of backup protection. The new protection algorithm is a double-ended electrical quantity measurement protection, which cannot be used as a backup protection for the transmission line. But the algorithm can be used as a backup of traditional protection and phase selection elements to further improve robustness.
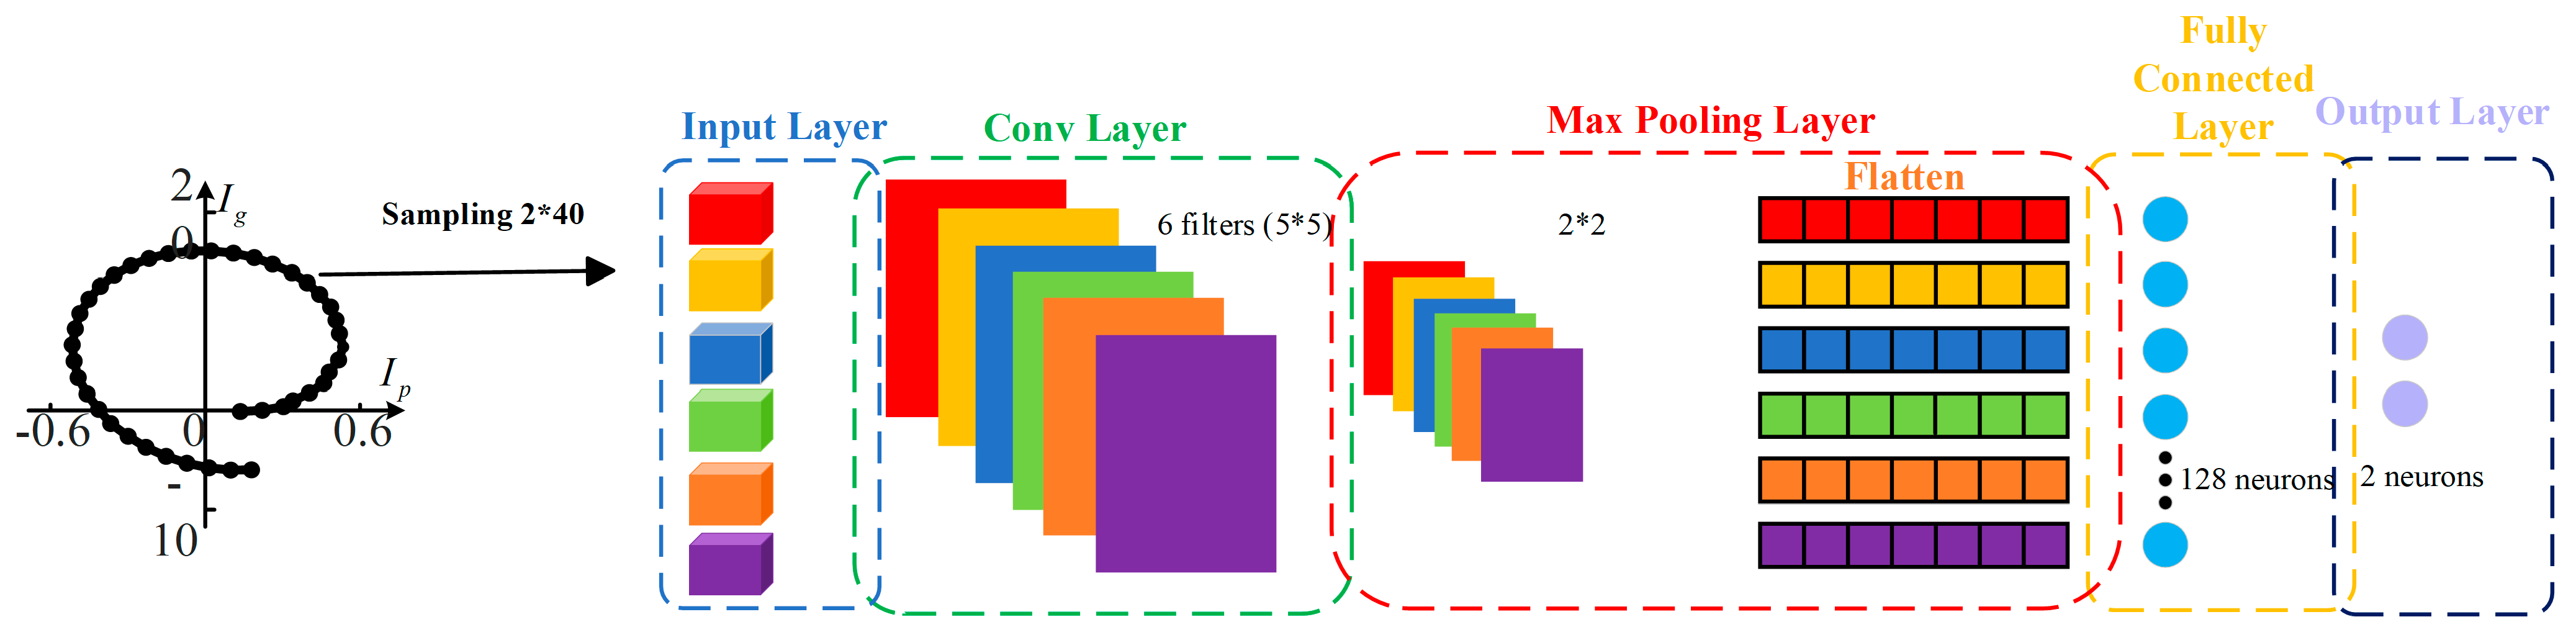
Further, the structure definition of A-CNN is shown in
Table 1 and
Figure 13. Meanwhile,
Table 1 compares the structure of a traditional artificial neural network (ANN) with that of an A-CNN. The A-CNN model described in
Table 1 is used for training, and results are shown in
Table 2.
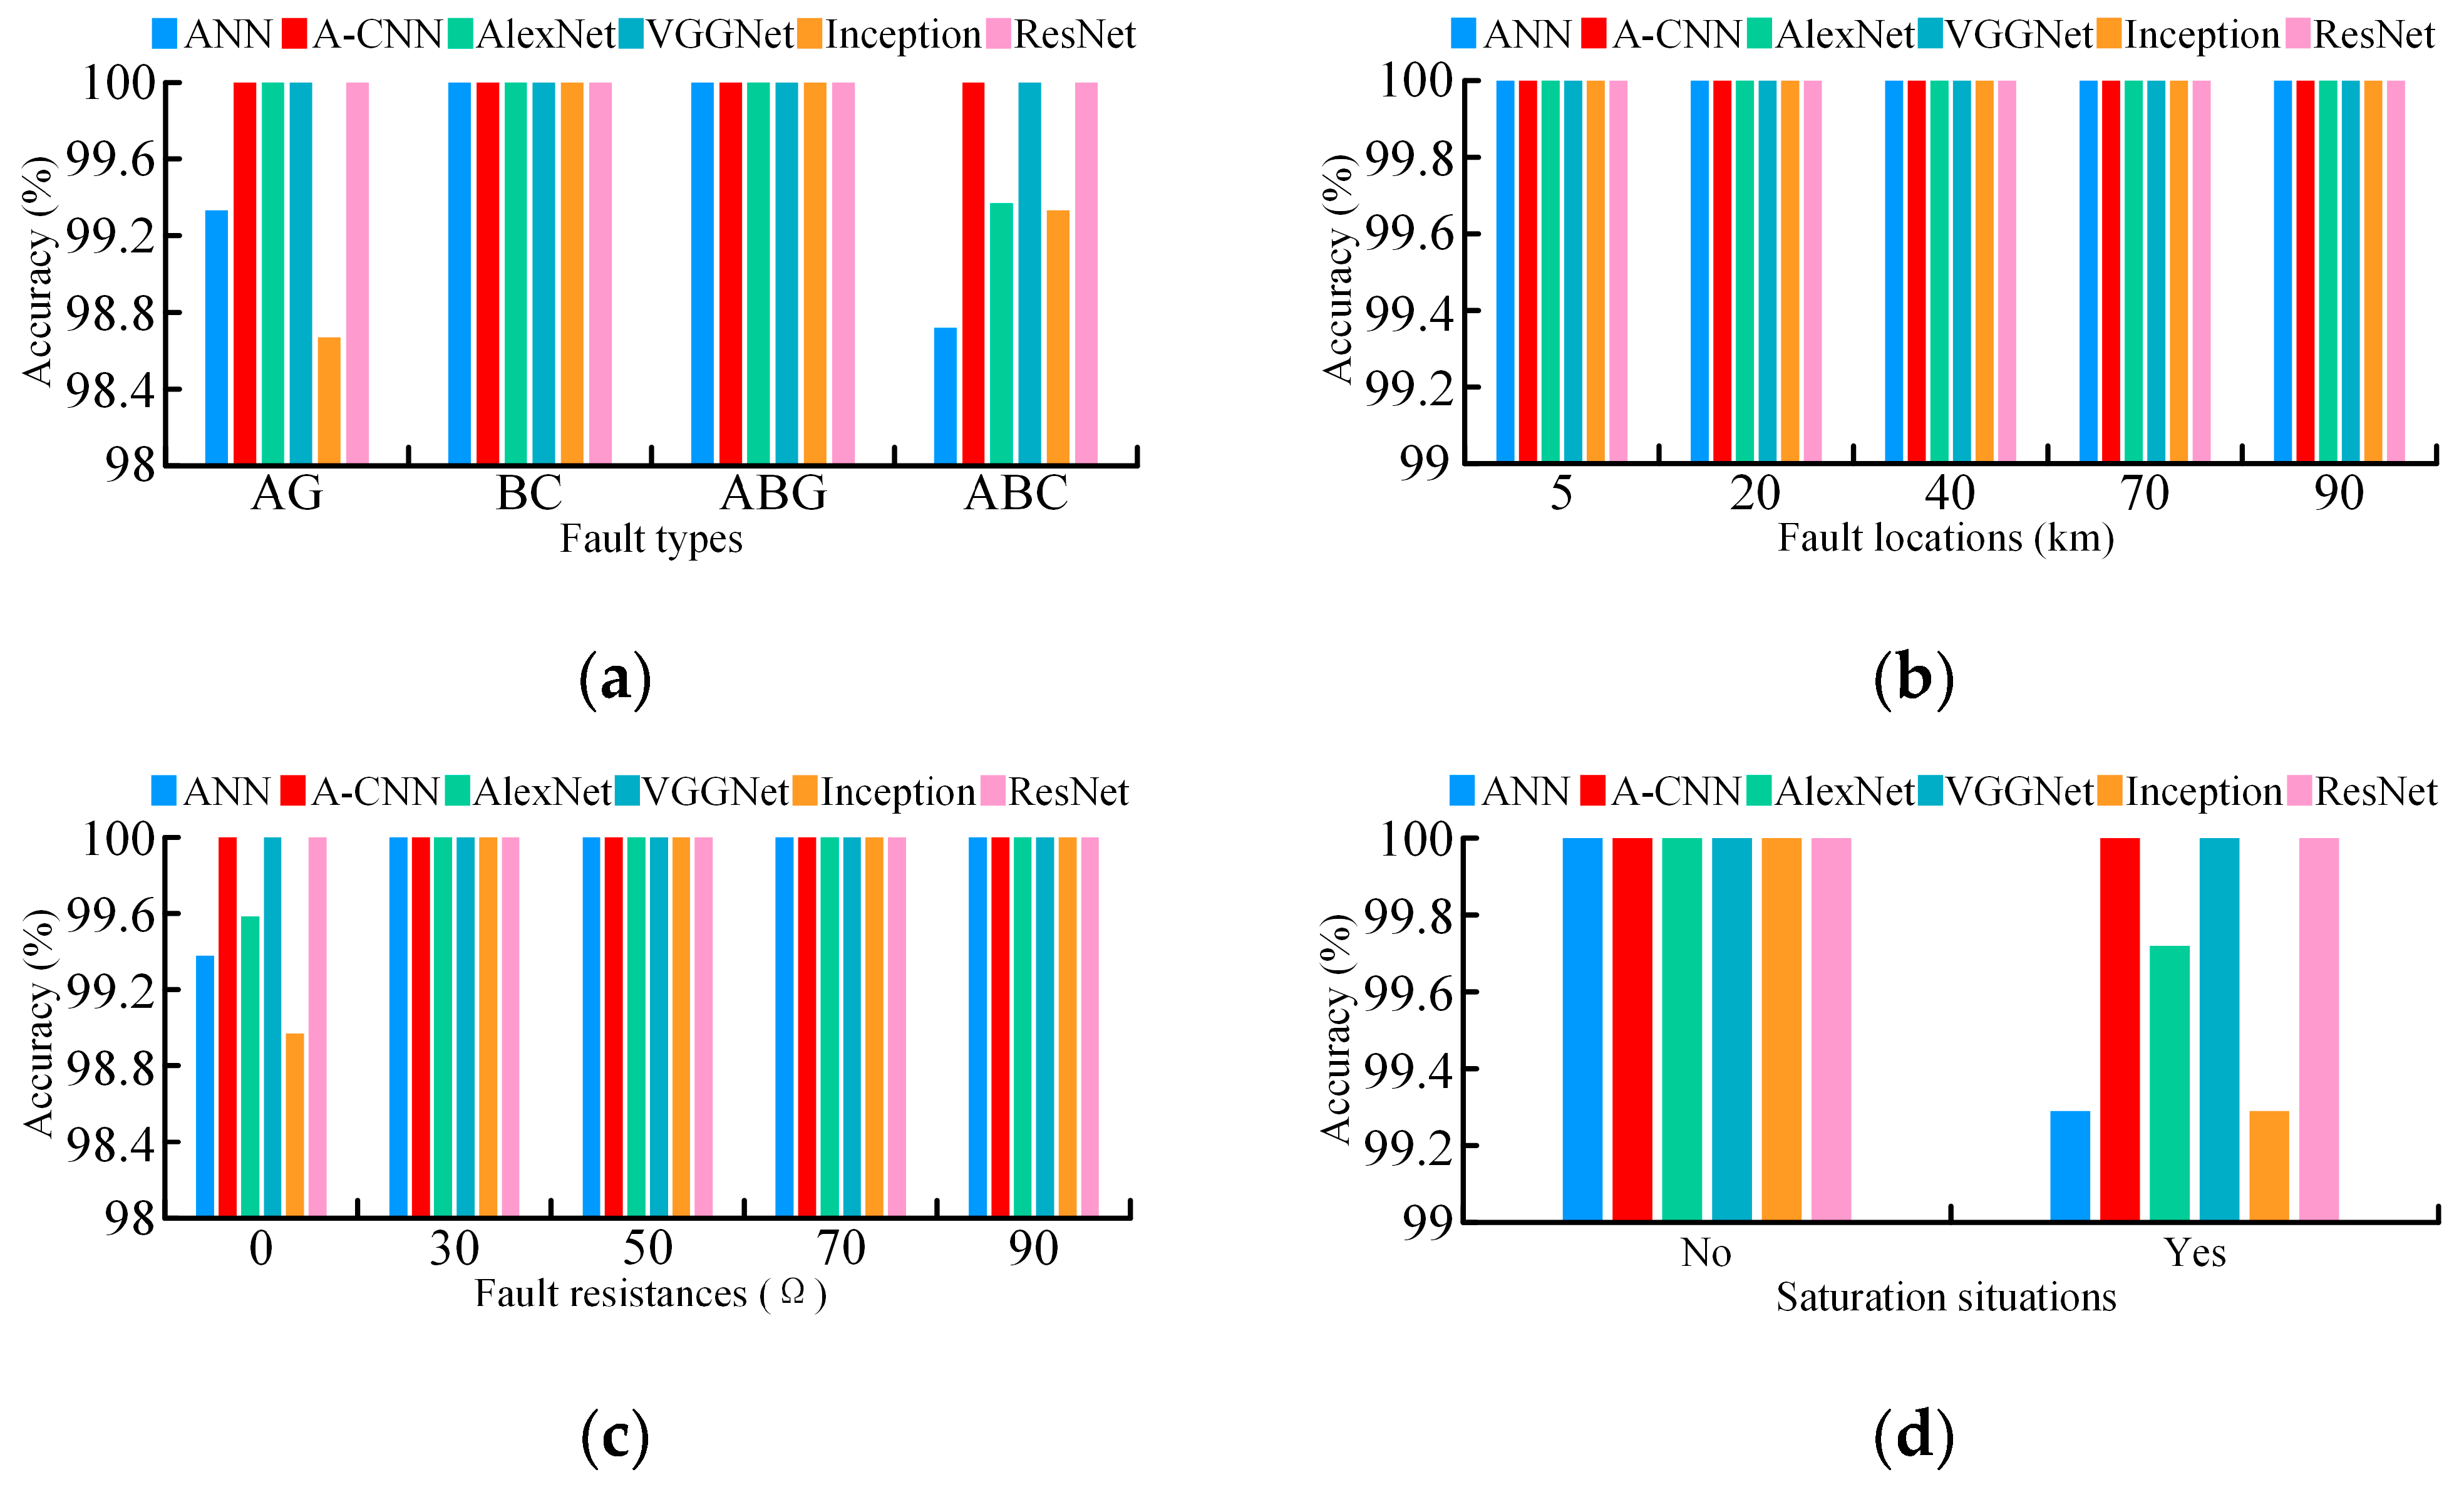
The results of
Table 2 show that A-CNN outperforms other classical neural network models. The reasons for the poor performance of the other models are as follows: ANN, as a traditional neural network, lacks a convolutional layer. LeNet’s use of the sigmoid activation function leads to the vanishing gradient problem. Although the cross-overlapping data set highlights differences in image characteristics, the complex structures of AlexNet and VGGNet often result in overfitting. Inception and ResNet, with their multi-branch and residual connections, enhance training by preventing model degradation, but their overly complex structures make them less efficient. A CNN with an appropriate scale and processing capacity is more suitable, making A-CNN the optimal choice for identifying current trajectory images under various conditions.
3.3. Design Strategy Summary
To clearly present the core design principles behind the proposed algorithm,
Table 3 summarizes five key strategies adopted in this study, including their motivations and contributions to accuracy, speed, and robustness.
3.4. Theoretical Interpretation of Current Trajectory Image Features
To further explain the underlying mechanism of current trajectory-based fault identification, this section provides a theoretical interpretation of how internal and external faults produce distinguishable patterns in two-dimensional current trajectory images.
The trajectory image is constructed using the terminal current measurements of the PV and grid sides, defined in Formulas (4) and (5). Each image point corresponds to a pair of current values (ip(t),ig(t)) over time. These images are formed by mapping these current pairs into a 2D coordinate space.
Under external fault conditions, the PV and grid-side currents are nearly equal in magnitude but opposite in direction due to the symmetrical response to a remote fault. This results in trajectory images that are approximately symmetric with the line y = −x. In contrast, internal faults lead to unequal current contributions from each terminal: the power grid often injects a higher fault current than the PV source, which is limited by inverter constraints. This imbalance causes the image trajectory to shift away from the origin, producing a distinct geometric pattern, typically eccentric or asymmetric.
This geometric distinction can be quantified by:
(1) Centroid deviation: Internal fault images tend to have a centroid that shifts away from the origin, indicating asymmetric current flow.
(2) Radial variance: The spread of trajectory points in polar coordinates shows higher fluctuation in internal faults.
These properties enable effective fault classification.
Figure 9a,b and
Figure 10a,b illustrate the differences in trajectory images between external and internal faults. These physical and geometric properties allow convolutional neural networks (CNNs) to extract discriminative features from trajectory images. In our A-CNN, shallow layers capture local curvature patterns, while deeper layers summarize global spatial characteristics. The model, therefore, learns a data-driven decision boundary between internal and external fault image classes.
This mechanism is supported by recent studies [
18], which theoretically analyze fault-induced trajectory distortions and demonstrate how spatial patterns reflect fault location and system asymmetry. Our method builds upon this foundation with a lightweight CNN design and simplified fault modeling to balance real-time applicability and classification accuracy.
5. Conclusions
This paper proposes a novel protection algorithm for PV-connected transmission lines based on two-dimensional spatial current trajectory images and a data-enhanced convolutional neural network. The proposed method addresses the unique protection challenges introduced by low fault current levels, short fault durations, and CT saturation effects in renewable-integrated systems. Based on extensive simulation validation, the main conclusions are summarized as follows:
(1) The proposed method effectively maps PV-side and grid-side current waveforms into spatial trajectory images, allowing the extraction of dynamic fault features. This eliminates reliance on preset thresholds and fault models.
(2) The A-CNN model demonstrates excellent performance across a wide range of fault conditions, including different fault types, locations, fault resistances, and severe CT saturation. It achieves 100% identification accuracy under all tested scenarios.
(3) Compared to traditional FDP and other mainstream deep learning models, the proposed scheme exhibits stronger robustness and faster detection, with a total fault identification delay of 8 ms, meeting the speed requirement of relay protection systems.
(4) The method satisfies the four fundamental criteria of relay protection—selectivity, sensitivity, speed, and reliability—and is therefore well-suited for modern power systems with high penetration of inverter-based resources.


