Article

A Fast Method for the Acceleration Response Analysis of Two-Dimensional Sites Under Seismic Excitations

1
China First Highway Engineering Group Co., Ltd., Beijing 100024, China
2
China First Highway Engineering Xiamen Engineering Co., Ltd., Xiamen 361021, China
3
Department of Civil Engineering, University of Science and Technology Beijing, Beijing 100083, China
*
Author to whom correspondence should be addressed.
Appl. Sci. 2025, 15(11), 6082; https://doi.org/10.3390/app15116082
Submission received: 24 March 2025 / Revised: 21 May 2025 / Accepted: 26 May 2025 / Published: 28 May 2025
(This article belongs to the Section Civil Engineering)

Abstract

The mode superposition method has been widely used for the seismic response analysis of two-dimensional (2D) sites to enhance computational efficiency. However, this method lacks a guideline of modal truncation to control errors of acceleration responses. In this paper, the mode contribution coefficient of acceleration is proposed to be used as a criterion for modal truncation in the seismic acceleration response analysis of soil layers. Comparative analysis with the modal participation mass and modal contribution factor demonstrates the effectiveness of the proposed factor for the modal truncation of acceleration responses. The computational accuracy of the method for calculating acceleration from displacement using the central difference scheme is verified, which would further improve the computational efficiency in calculating site acceleration responses. A homogeneous soil site and a scarp topography site show that the proposed factor for modal truncation effectively controls the computational error of soil acceleration responses. Additionally, computing acceleration time histories from displacement time histories via the central difference method yields errors comparable to those from directly computing generalized coordinate accelerations. However, modal truncation based on modal participation mass or modal contribution factor results in fewer modes retained and larger computational errors.

1. Introduction

Existing seismic damages have shown that soil sites significantly affect the seismic response of structures [1,2,3]. Since soil sites generally have layered characteristics, the one-dimensional (1D) equivalent linearization [4] is the most commonly used method for seismic response analysis [5,6,7,8]. However, Davis et al. [9] and Celebi [10] analyzed the actual seismic records and found that ground motions at ridges were much larger than at the mountain foot. José Bustos et al. [11] compared 1D and two-dimensional (2D) seismic responses of three representative cross-sections of the Santiago Basin, Chile, and the results showed that 1D simulations cannot capture the basin edge effects in the fine-grained soils. Therefore, although the soil sites are layered, two-dimensional or three-dimensional (3D) seismic response analysis methods need to be adopted to analyze the seismic responses [12,13,14].
Due to the complexity of soil constitutive models, the equivalent linearization method is often used for seismic response analysis. The computational process for 2D and 1D equivalent linearization is the same, with linear calculations performed at each iteration [15,16]. Since the finite element model of the 2D site is enormous, it is of great importance to improve the computational efficiency of the linear seismic response of each iteration. The frequency domain method and the time domain method are often used to analyze the linear seismic response analysis of sites. In the frequency domain method, it is necessary to solve the complex algebraic equation to obtain the response at each exciting frequency [17,18]. Solving complex algebraic equations is relatively time-consuming. The time domain method includes direct integration methods and modal superposition methods.
The direct integration method [19] is convenient for linear and nonlinear seismic response analysis of the site [20,21]. Chandran and Anbazhagan [22] used the FLAC-2D program to analyze the 2D nonlinear site response. The modal superposition method decouples the coupled motion equations into a series of single-degree-of-freedom motion equations. Because only a few low-mode dynamic responses are required, it has high computational efficiency and has become the most common method for dynamic response analysis of linear elastic systems. However, modal truncation [23] is an important issue in the modal superposition method for site seismic response. Wilson [24] proposed the static load participation ratio and dynamic load participation ratio to be the index of modal truncation. For seismic excitation, the dynamic load participation ratio index is the same as the modal participation mass ratio. Chopra [25] proposed the modal contribution factor to estimate the modal truncation error. Pan et al. [26] compared structural response errors by the use of different modal truncation indexes. The calculation results showed that modal truncation based on the modal contribution factor can effectively control the error of displacement. However, two concerns are raised by the use of the modal contribution factor for the site seismic response, as follows: (1) The modal truncation based on the displacement response leads to a larger calculation error of the acceleration response because the higher modes have a greater impact on the structural acceleration response than on the displacement response; (2) In the iterative calculation process, displacement time history and its corresponding maximum strains are used to determine the convergence of the iteration, while the result generated is the acceleration response.
In this paper, to establish a calculation method for site acceleration response under seismic excitations using the modal superposition method, the concept of modal contribution factor of acceleration is proposed for the modal truncation index in acceleration response analysis. The relationship between the error in acceleration time history calculated from displacement time history via the central difference method and the number of truncated modes is then investigated. Consequently, a calculation method for soil layer acceleration response under seismic excitations using the modal superposition method is developed. This approach has the following advantages for analyzing the acceleration response of site under seismic excitation, as follows: (1) It determines the mode number for the acceleration response of the soil sites under seismic excitations; (2) There is only the displacement response and no acceleration response to be calculated in the iterative calculation process, which would improve calculation efficiency of the equivalent linearization calculation. A homogeneous site and a scarp topography site are analyzed to verify the computational accuracy of the proposed method.

2. Seismic Response Calculation Method for Soil Layers Based on the Modal Superposition Method

2.1. Theoretical Background

Figure 1 shows an arbitrary two-dimensional irregular site. After intercepting a certain range of soil, a finite element model with n degrees of freedom (DoF) can be formed. The equation of motion for the soil layer under seismic excitation can be expressed as [25]:
M u ¨ + C u ˙ + K u = M I u ¨ g
where M , C , and K are the mass matrix, damping matrix, and stiffness matrix, respectively; u , u ˙ , and u ¨ are the displacement vector, velocity vector, and acceleration vector; and I is the distribution vector of ground motion; u ¨ g ( t ) is the time history of seismic excitation. The characteristic equation of the undamped system corresponding to Equation (1) is
K ω 2 M ϕ = 0
The first N-th natural frequencies ω i and modes ϕ (i = 1, 2, …, N) of the soil layer can be obtained by solving Equation (2). By expanding the displacement vector into the modal space, the dynamic response of the system can be expressed as
u = i = 1 N ϕ i q i
where qi is the generalized coordinates. For a proportional damping system, equation governing the motion of generalized coordinates can be expressed as
q ¨ i + 2 ζ i ω i q ˙ i + ω i 2 q i = γ i u ¨ g ( t )
where γ i = ϕ i T M I / ϕ i T M ϕ i is the modal participation factor, ζ i is modal damping ratio. After obtaining the q i ( t ) , q ˙ i ( t ) , and q ¨ i ( t ) of the generalized coordinates, the u j ( t ) , u ˙ j ( t ) , and u ¨ j ( t ) of the j-th DoF can be expressed as
u j ( t ) = i = 1 N ϕ j i q i ( t )
u ˙ j ( t ) = i = 1 N γ i ϕ j i q ˙ i ( t )
u ¨ j ( t ) = i = 1 N γ i ϕ j i q ¨ i ( t )

2.2. Required Modes for Acceleration Response Analysis

Equation governing the motion of a linear single DoF system subjected to the ground acceleration u ¨ g ( t ) can be expressed as
d ¨ i + 2 ζ i ω i d ˙ i + ω i 2 d i = u ¨ g ( t )
The contribution of the i-th mode to the displacement is
u i ( t ) = ϕ i q i ( t ) = γ i ϕ i d i ( t )
The equivalent static force for the i-th mode is
f i t = K u i ( t )
Substituting Equations (3) and (9) into Equation (10) gives
f i t = γ i M ϕ i ω i 2 d t
The contribution of the i-th mode to the structural displacement under the excitation of static force f i t is
u i = u i s t ω i 2 d t
The peak values of the contribution of the i-th mode to the structural displacement and acceleration are
u i , max = u i s t S a ( ζ i , ω i )
u ¨ i , max = A i s t S a ( ζ i , ω i )
u i s t = γ i ϕ i / ω i 2
A i s t = ω i 2 u i s t = γ i ϕ i
where u i s t is the static displacement response of i-th mode, and S a ( ζ i , ω i ) is the pseudo-acceleration response spectrum value of the i-th mode.
Chopra [25] proposed that the modal contribution factor r ¯ j i s t based on u i s t can be expressed as
r ¯ j i s t = u j i s t / u j s t
where u j s t is the static displacement response for the j-th degree of freedom, and u j i s t is the static displacement response for the j-th degree of freedom of the i-th mode.
The modal contribution factor is based on displacement response. Comparing Equations (15) and (16), it can be seen that A i s t is u i s t multiplied by ωi2. Therefore, the contribution of higher modes to acceleration will be greater than that to displacement. To estimate the structural acceleration response error caused by modal truncation, the mode contribution factor of acceleration for the j-th degree of freedom of the i-th mode is proposed and can be expressed as
a j i = γ i ϕ j i
Since i = 1 n γ i ϕ i = I , the degrees of freedom in the direction of the seismic input are
i = 1 n a j i = 1
The error of cumulative mode contribution factor of acceleration is defined as
e a j = 1 i = 1 N a j i
Typically, finite element software can extract modal participation factors and mode shapes. Therefore, the mode contribution factor of acceleration can be readily obtained through a simple calculation using these two quantities. As comparison, the error of cumulative modal participation mass e m and the error of cumulative modal contribution factor e u j are expressed as:
e m = 1 i = 1 N γ i 2 / m t
e u j = 1 i = 1 N r ¯ j i s t
where m t is total mass of the system.

2.3. Approximate Calculation Method for Acceleration Time History
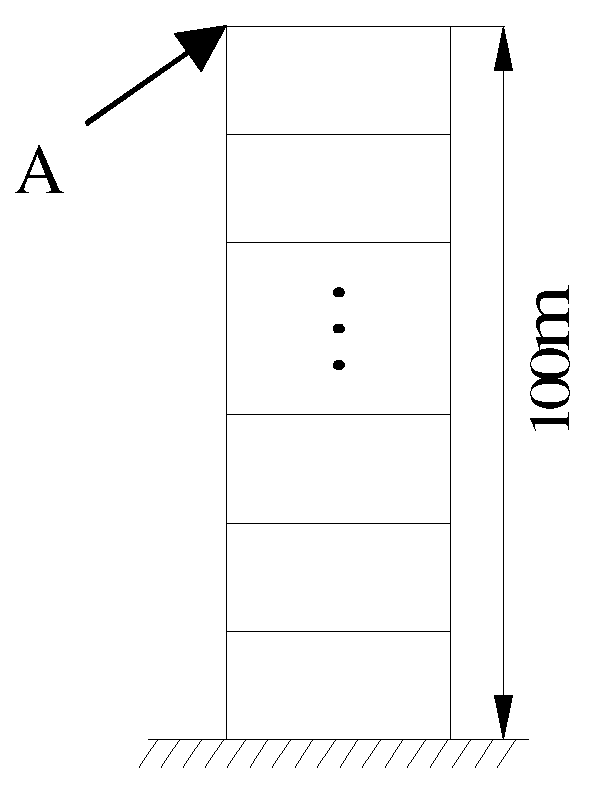
The displacement, velocity, and acceleration of the generalized coordinates can be obtained by solving Equation (4). Thus, the physical coordinates of the displacement, velocity, and acceleration can be obtained by using from Equations (5)–(7). However, in the iteration process of the equivalent linearization method, the shear strain of each element is calculated by the displacement. Acceleration response is required to be output after the iteration converging. If the acceleration of each generalized coordinate is calculated during the iteration process followed by obtaining the acceleration of each degree of freedom, it will significantly increase the computational workload. At the same time, generally, only the acceleration response at a few locations needs to be output. Therefore, to improve computational efficiency, the acceleration response can be obtained by the central difference method from the discrete displacement time history.
Assume that the displacement uj(t) of the j-th degree of freedom at discrete time points tr, with a discrete time step of Δt. For convenience of expression, and where it does not cause confusion, the subscript j is omitted; abbreviate uj(tr), u ˙ j ( t r ) , and u ¨ j ( t r ) as u r , u ˙ r , and u ¨ r , respectively.
For the displacement time history ur at a discrete time step Δt, the central difference approximations for velocity and acceleration are given by
u ˙ r = u r + 1 u r 1 2 Δ t ,   u ¨ r = u r + 1 2 u r + u r 1 Δ t 2
In actual sites, soil layer parameters exhibit non-uniformity, and the mechanical properties of soils cannot be determined accurately. This study mainly aims to develop a new computational method and investigate its accuracy. To avoid the influence of model errors from material parameter uncertainties, a homogeneous site and a scarp topography were systematically analyzed to study the relationship between the modal truncation index, including the error of cumulative modal participation mass and the error of cumulative modal contribution coefficient of acceleration, with displacement and acceleration response errors as the modal number changes. Then, the effect of modal truncation on the errors in displacement, velocity, and acceleration is studied. Meanwhile, the errors of velocity and acceleration calculated by using Equation (23) are further investigated.
The n-dimensional coupled differential equation system of Equation (1) can be transformed into N decoupled motion equations by using the modal superposition method, generally N << n. Therefore, the modal superposition method can significantly simplify the computation of the motion equations. Meanwhile, since N << n, there is modal truncation error in the results of Equations (5)–(7).

3. Homogeneous Site

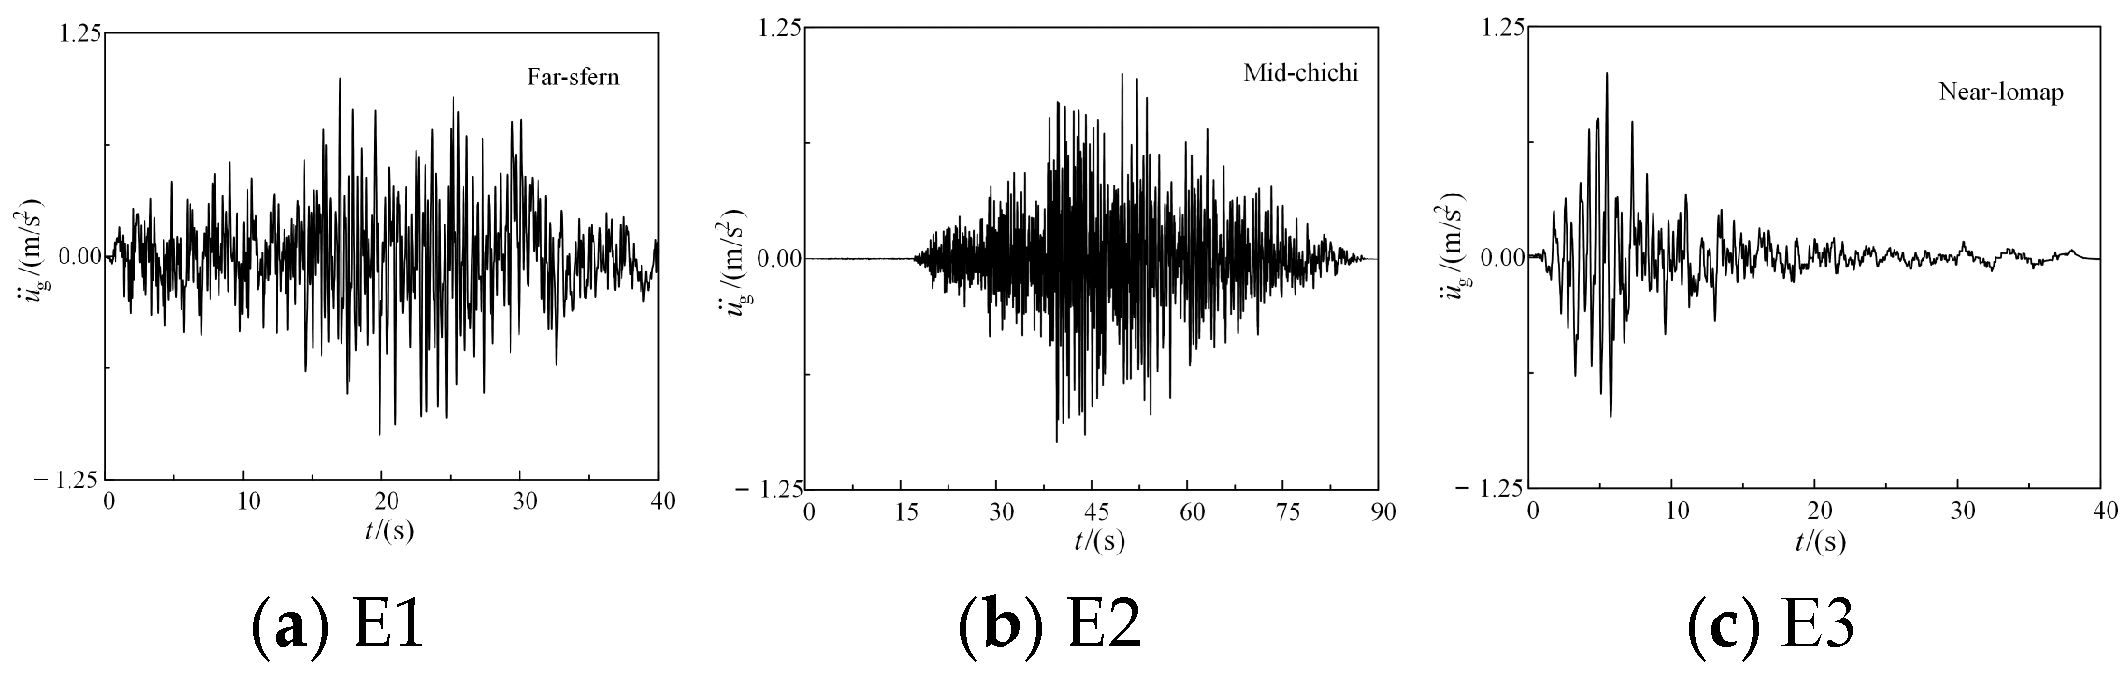
3.1. Numerical Model and Input Ground Motion

The thickness of the homogeneous soil layer is 100 m, the soil density is 1800 kg/m3, and the shear wave velocity is 220 m/s. In the finite element model, the soil layer is divided into 40 layers, with lateral boundaries constrained vertically, and the bottom is rigidly constrained, as shown in Figure 2. Table 1 lists three earthquake waves used as the horizontal seismic inputs. Figure 3 shows the acceleration time history with the amplitude of 1 m/s2.

3.2. Modal Truncation Error for Time-History Analysis

Table 2 presents the frequencies and modal truncation index of the first 10-th modes. eaA and euA are the errors of the cumulative modal contribution factor of acceleration and cumulative modal contribution factor of Point A at the surface. Since the significant contribution modes of different responses are different, modal truncation index is also affected by the modes. If the threshold is set to 5% for modal truncation, the locations of modal truncation modes based on em, euA, and eaA are 4, 1, and 7, respectively. To assess whether the selected modes meet the accuracy requirements, we investigated the error in the seismic response of soil layers varying with the number of modes in the following section.
When all 40 modes are used in the time-history analysis for modal superposition method, the results are considered the exact solution, denoted as r * ( t ) . The approximate solution is denoted as r(t) when N is less than 40 for the modal superposition method. The error of the approximate solution relative to the exact solution is represented by the cumulative error [27]:
e = 0 τ r * r d t 0 τ r * d t × 100 %
where τ is the total duration of the seismic wave.
Table 3 presents the cumulative errors of the time histories for displacement uA, velocity u ˙ A , and acceleration u ¨ A obtained by the modal superposition method with the first 4-th and first 7-th modes. Figure 4 shows the average errors of displacement, velocity, and acceleration varying with the mode number. Figure 5 and Figure 6 show the time histories and the corresponding Fourier spectra of uA and u ¨ A . The results of the time history show the following:
(1)
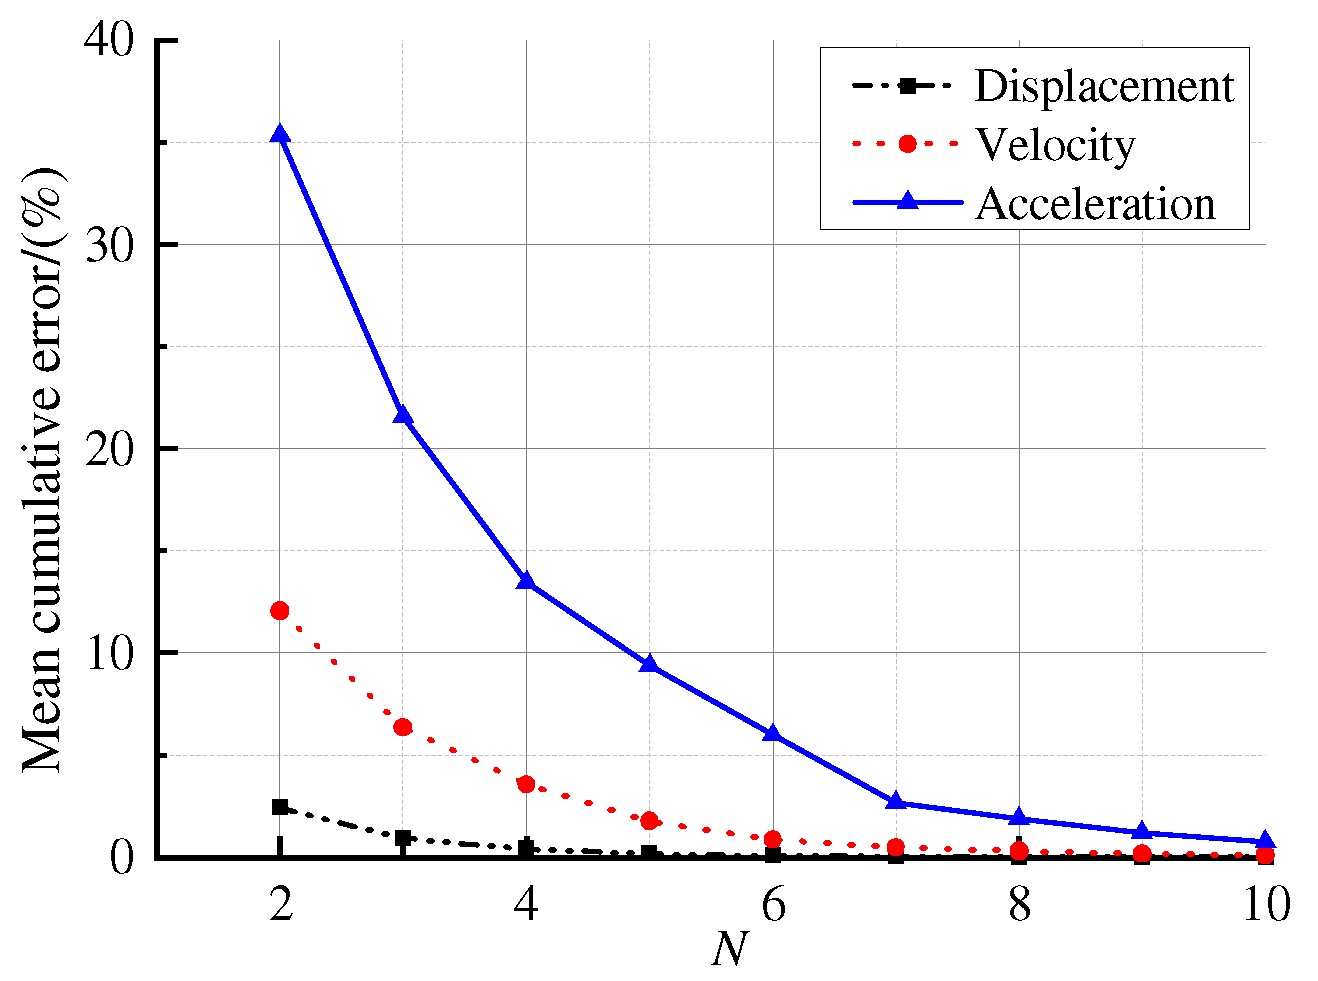
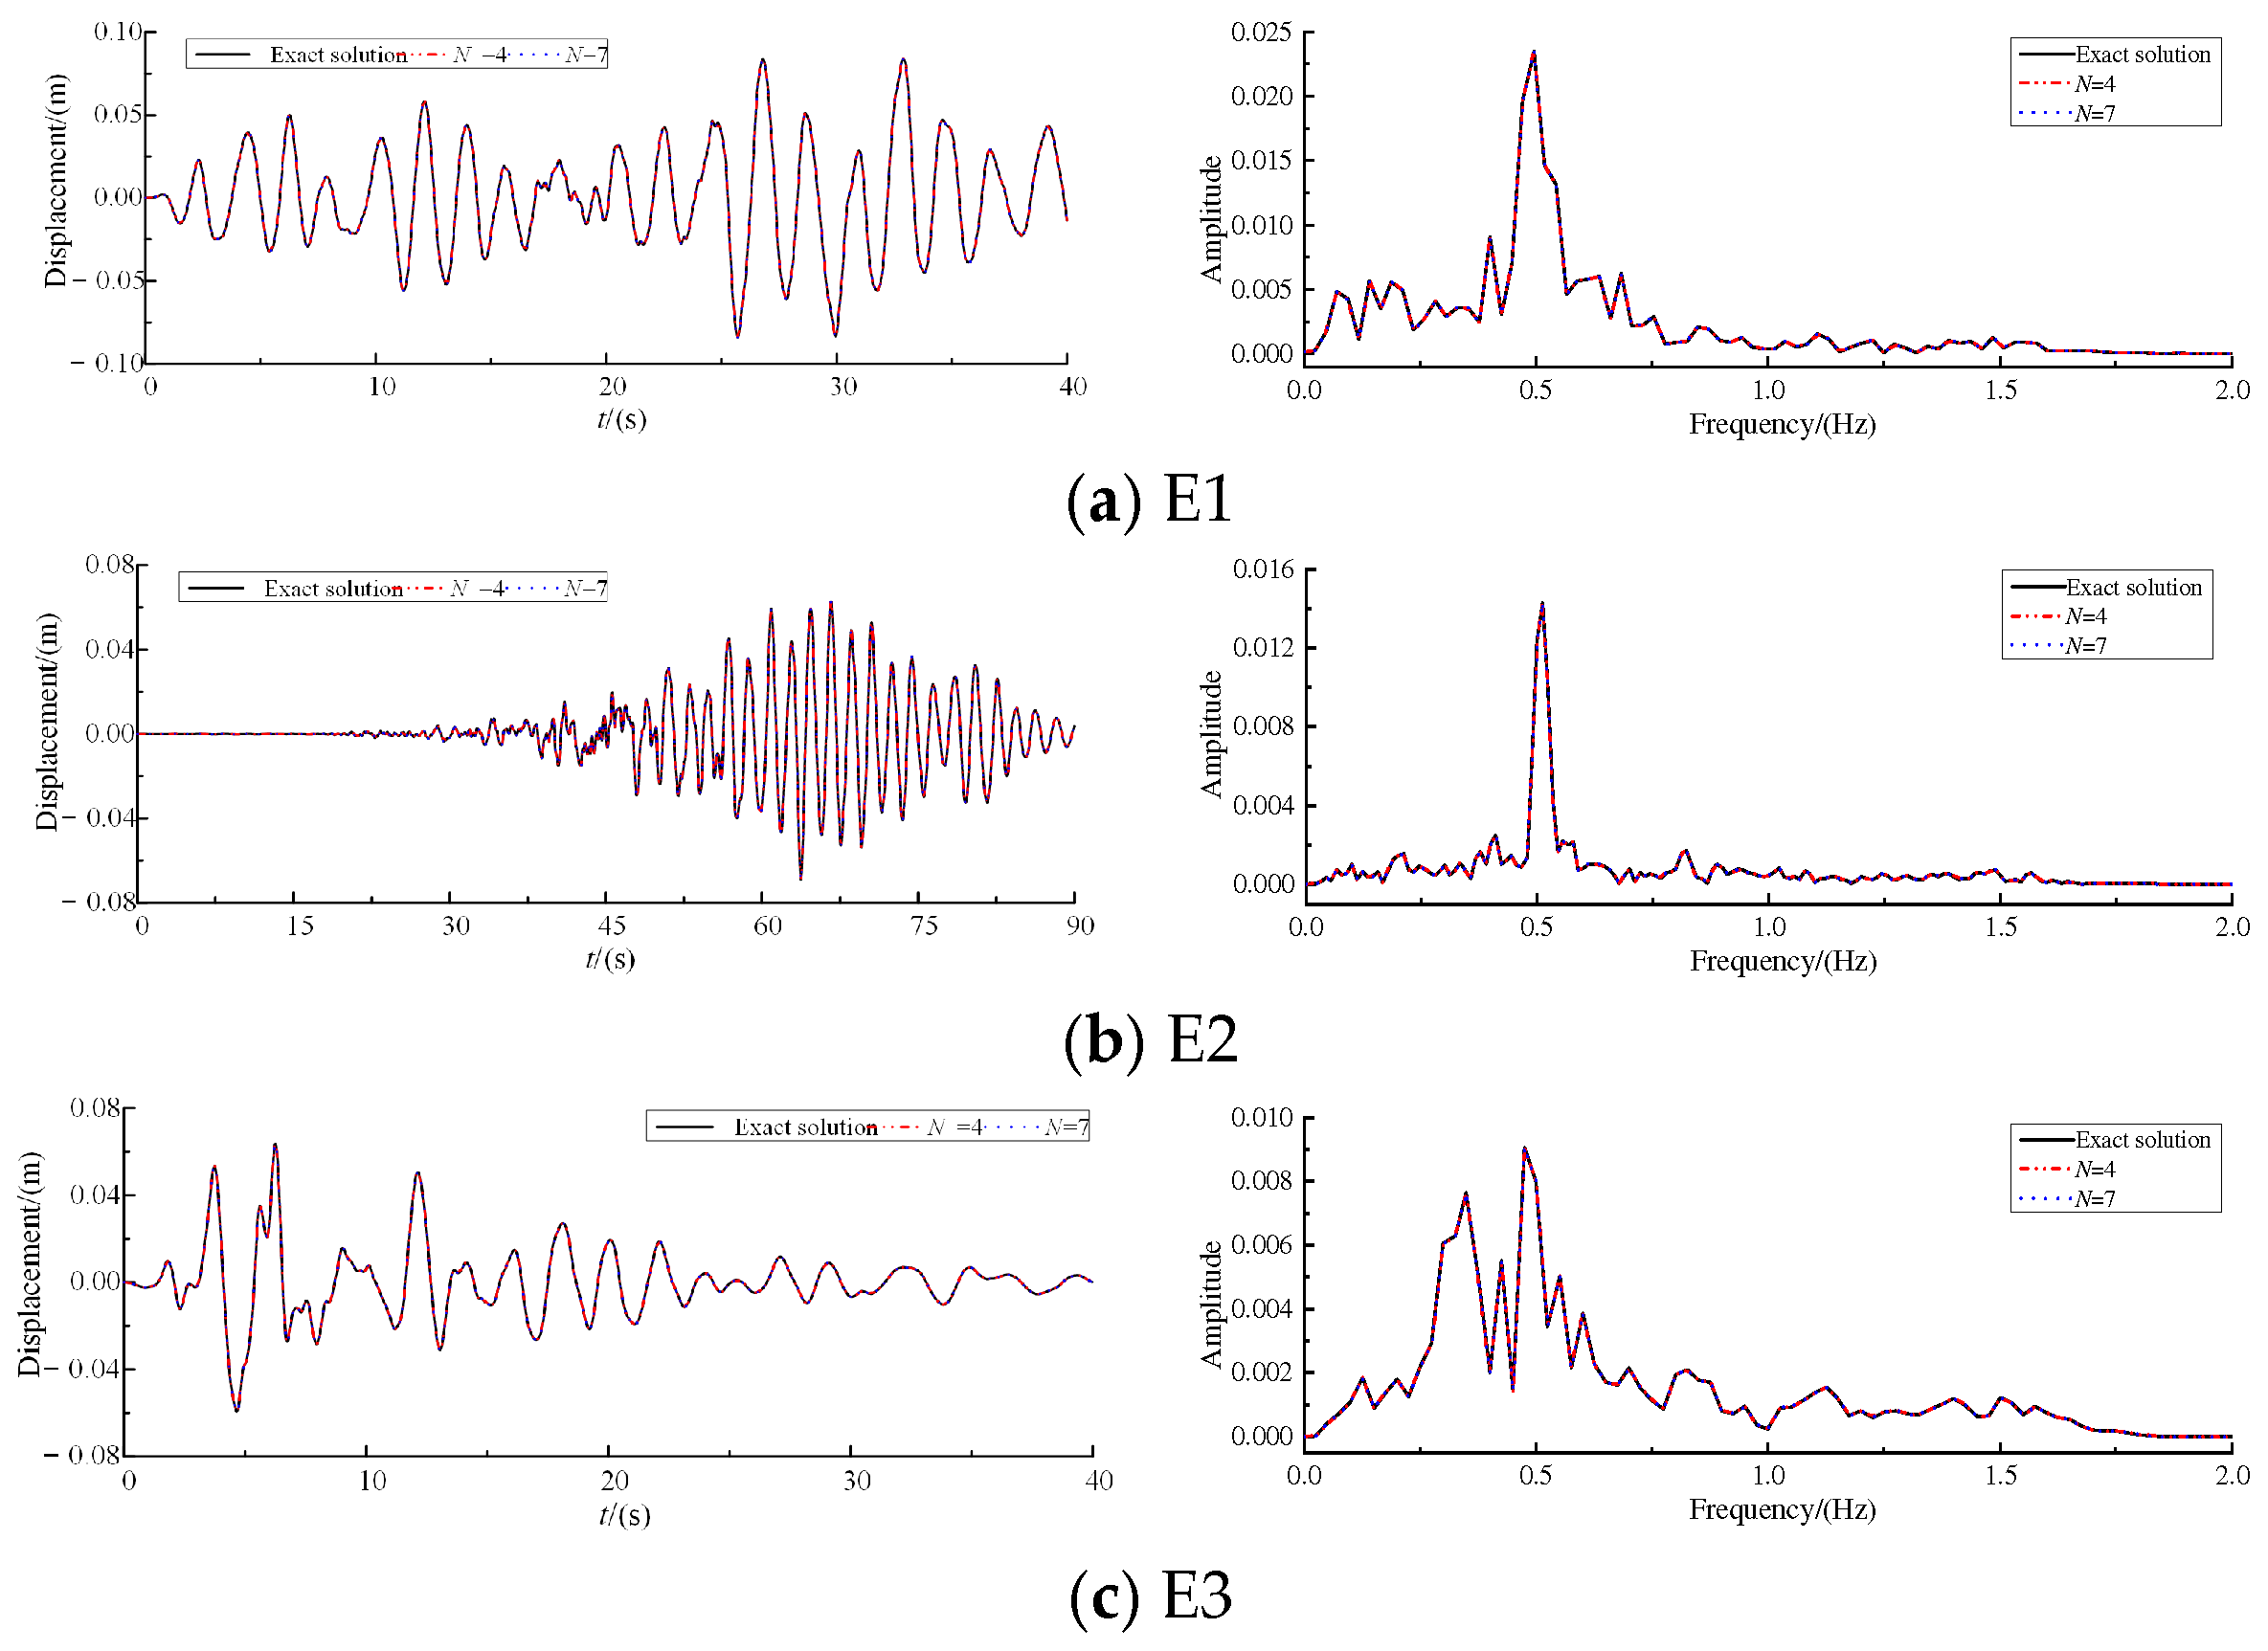
When N = 4, the calculation error of uA is only 0.42%, indicating that the number of modes selected based on modal participation mass is enough to calculate displacement response.
(2)
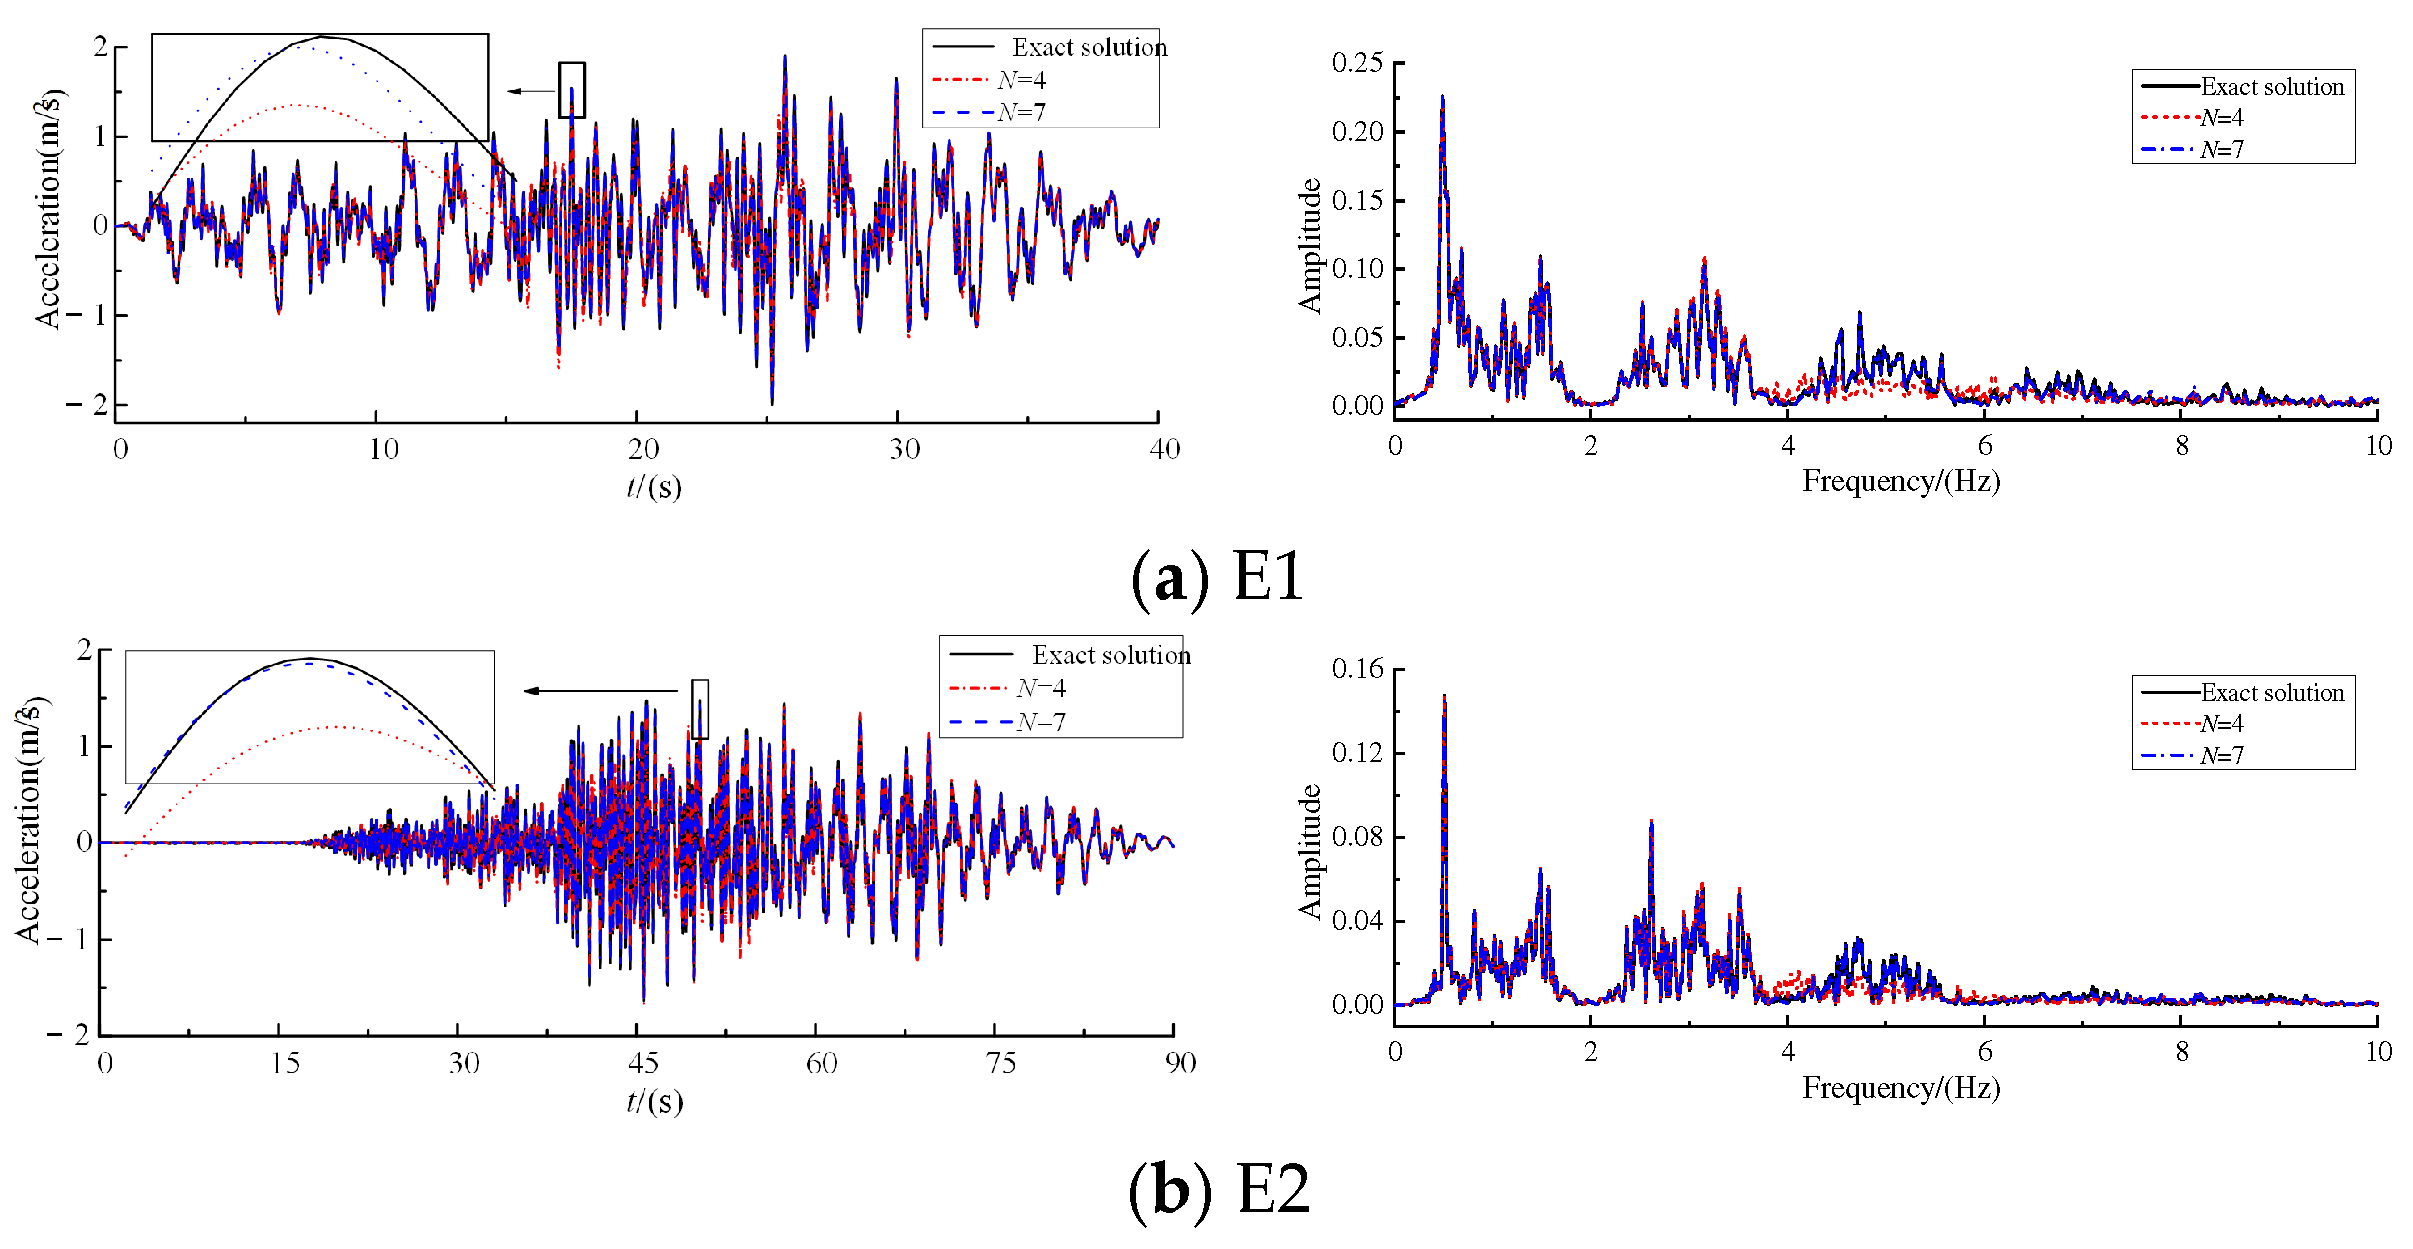
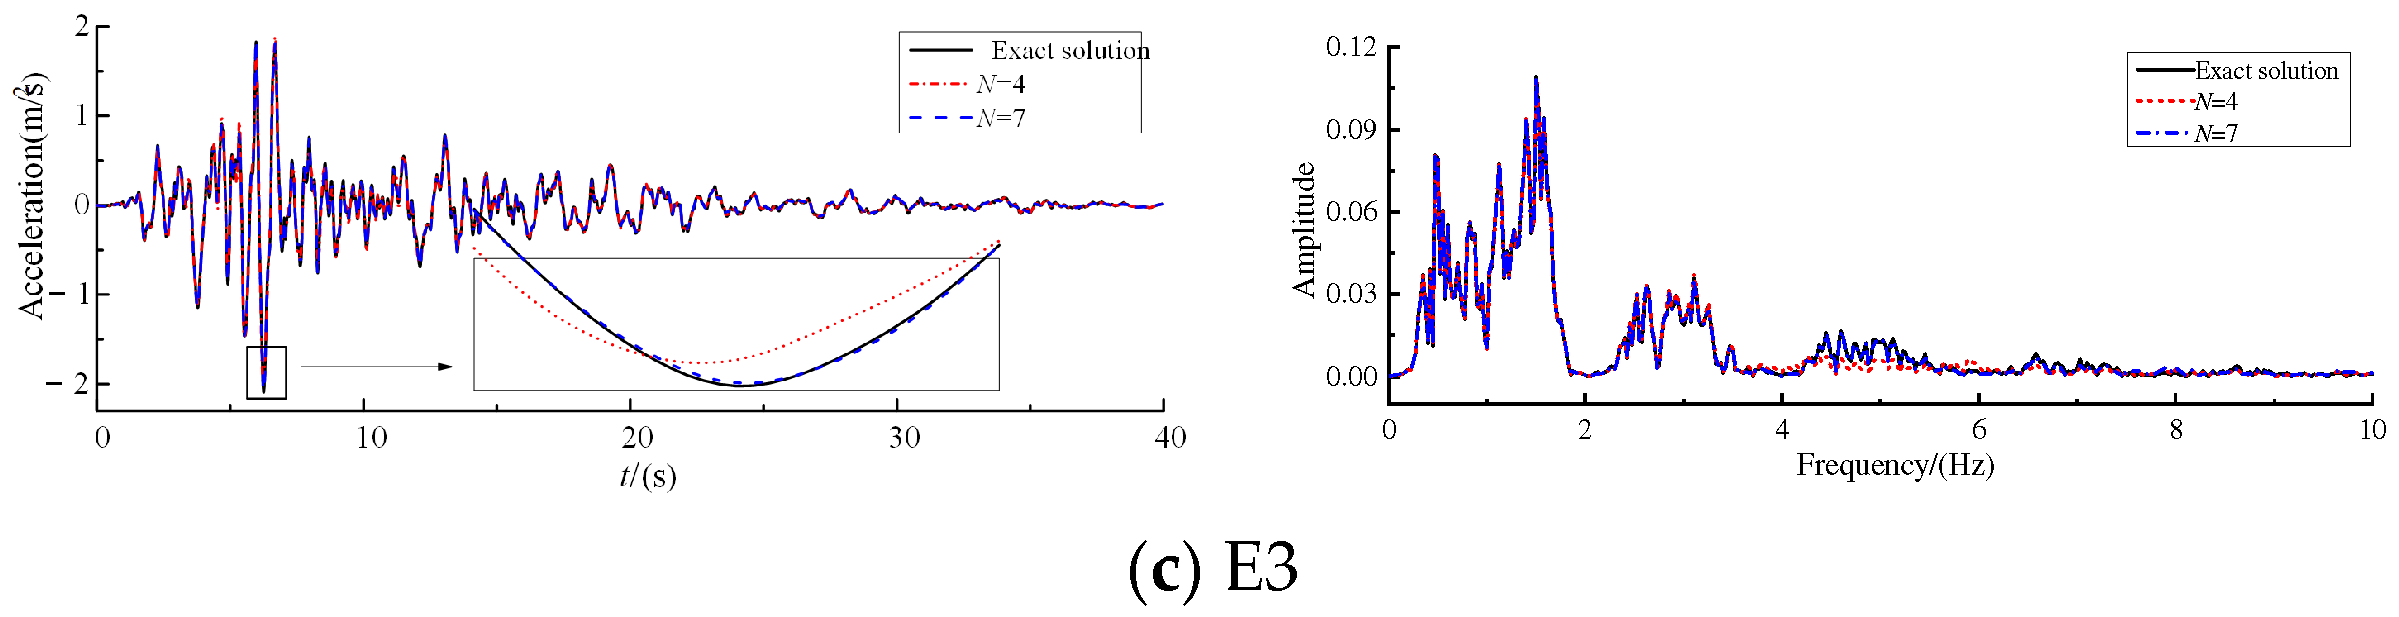
The error of displacement response is the smallest compared with velocity and acceleration, while the error of acceleration response is the largest. The reason is that the higher modes have a greater impact on acceleration than on the displacement. Comparing Figure 5 and Figure 6, it can be observed that the differences in the Fourier spectra of the accelerations are greater than those of the displacement Fourier spectra, which confirms this finding.
(3)
The error of acceleration, u ¨ A , is 13.44% when N = 4, while the error is less than 5% when N = 7. Therefore, when modal participation mass and modal contribution factor are used as truncation criteria, the resulting number of modes is suitable for displacement response analysis, but may introduce significant errors in acceleration response. For high-precision acceleration response, the modal contribution factor of acceleration should be adopted as the truncation criterion.

3.3. The Relative Errors of Acceleration Time History for Approximation Method

The velocity and acceleration can be calculated by use of Equations (6) and (7), which are the results by the modal superposition method. The other method to obtain the velocity and acceleration is the central difference method as given by Equation (23). Figure 7 compared the mean cumulative errors of the two methods under the three different seismic waves excitations. The results show the following:
(1)
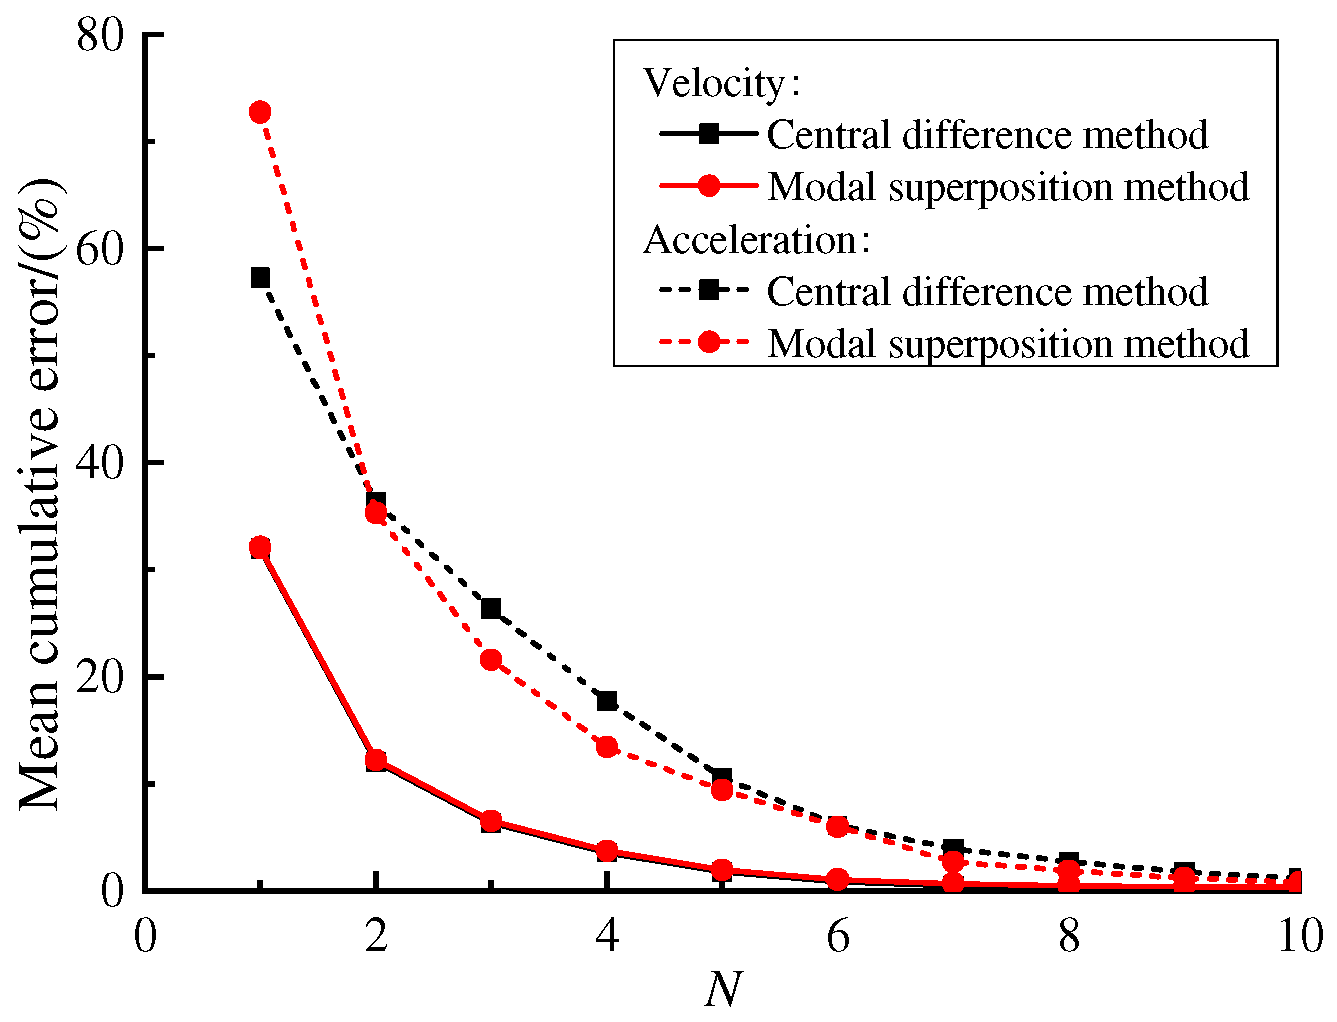
For velocity response, the calculation errors of the central difference method are almost the same as those by the direct modal superposition method, indicating that both the central difference method and the direct modal superposition method can be used for the calculation of velocity responses.
(2)
When N > 5, the acceleration response errors obtained by the central difference method and the modal superposition method are essentially the same. Considering the number of modes determined by different truncation criteria, if the cumulative modal contribution factor of acceleration is used as the truncation index, the central difference method can be employed to compute the acceleration response.

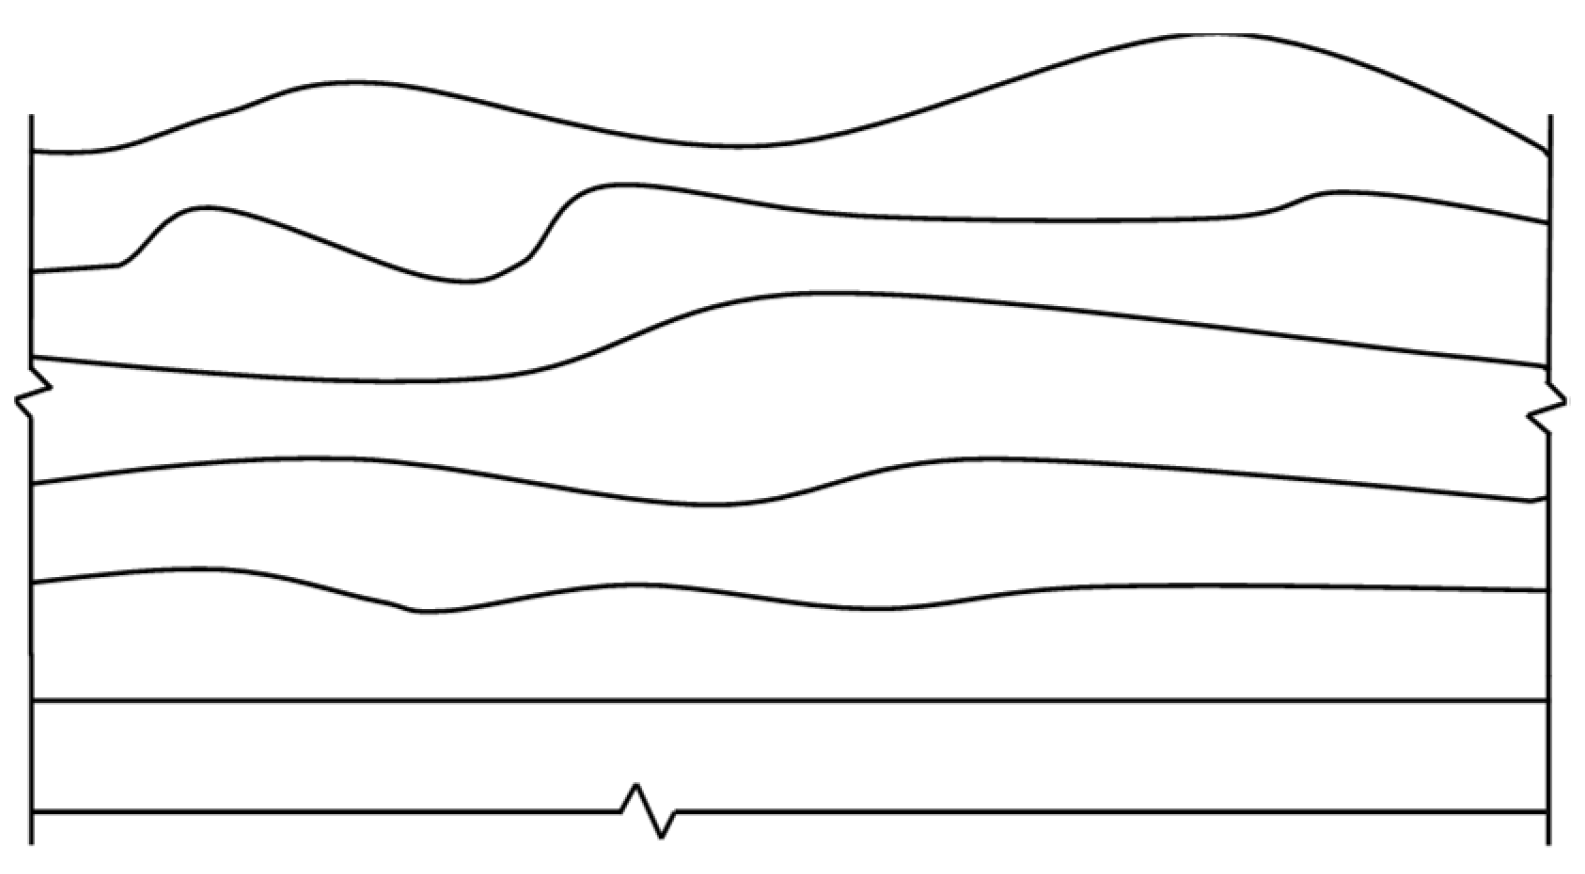
4. Scarp Topography Site

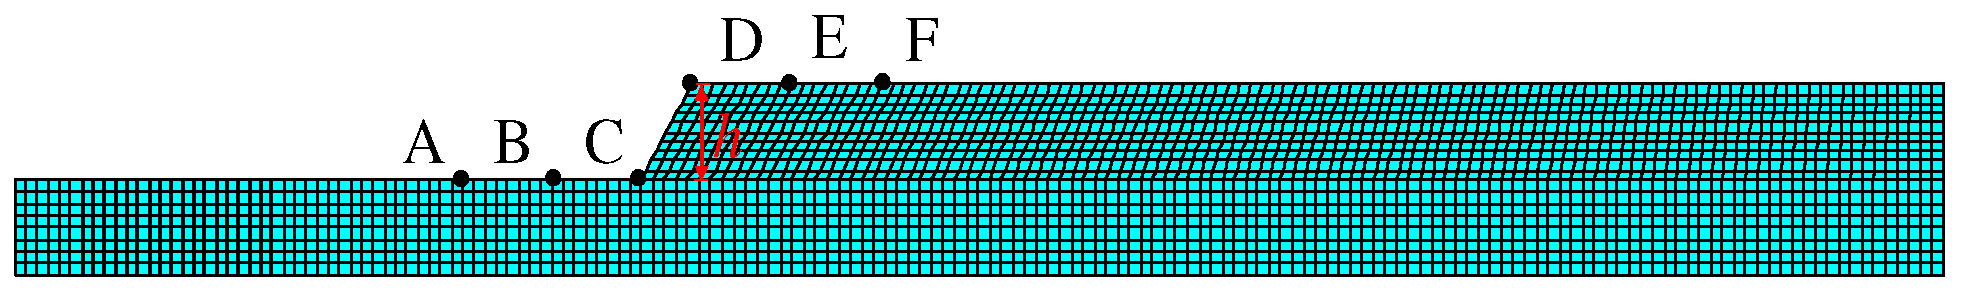
4.1. Finite Element Model

Figure 8 shows the finite element model of a scarp topography site. The soil density used in this study is 1800 kg/m3, and the shear wave velocity is 220 m/s. The thickness of the left side for the site is 40 m, and that of the right side is 80 m. The angle of the slope is 60°. The horizontal range is taken as 7 times the depth of the soil layer on both sides of the step [28]. Thus, the total horizontal length of the model is 863 m. The lateral boundaries of the site are constrained vertically, and the bottom is rigidly constrained. There are 2464 elements and 2651 nodes in the finite element model.

4.2. Modal Truncation Error for Time-History Analysis

As shown in Figure 8, points A, B, C, D, E, and F near the step are taken as the research objects. Points C and D are the toe and crest of the slope, respectively; points A and B are at the distances of 2h and h from the toe, respectively; and points E and F are at the distances of h and 2h from the crest, respectively. Three seismic waves listed in Table 1 are selected as the horizontal seismic inputs. The response obtained by the 1000-th mode is considered the exact solution, and the cumulative error varying with N is shown in Table 4. Table 4 also presents partial frequencies and modal truncation indexes, where eai (i = A, B, …, F) is the error of cumulative modal contribution factor of acceleration; eui (i = A, B, …, F) is the error of cumulative modal contribution factor. Figure 9 and Figure 10 show the mean cumulative error of displacement, velocity, and acceleration responses obtained by the central difference method varying with different numbers of mode. From Table 4 and Figure 9 and Figure 10, the following can be seen:
(1)
If the threshold is set to 10% for modal truncation, the mode number selected based on em is 63, the mode number selected based on euA, euB, euC, euD, euE, euF are 22, 63, 63, 22, 22, 22, respectively, and the mode number selected based on eaA, eaB, eaC, eaD, eaE, eaF are 317, 277, 194, 135, 100, and 135, respectively.
(2)
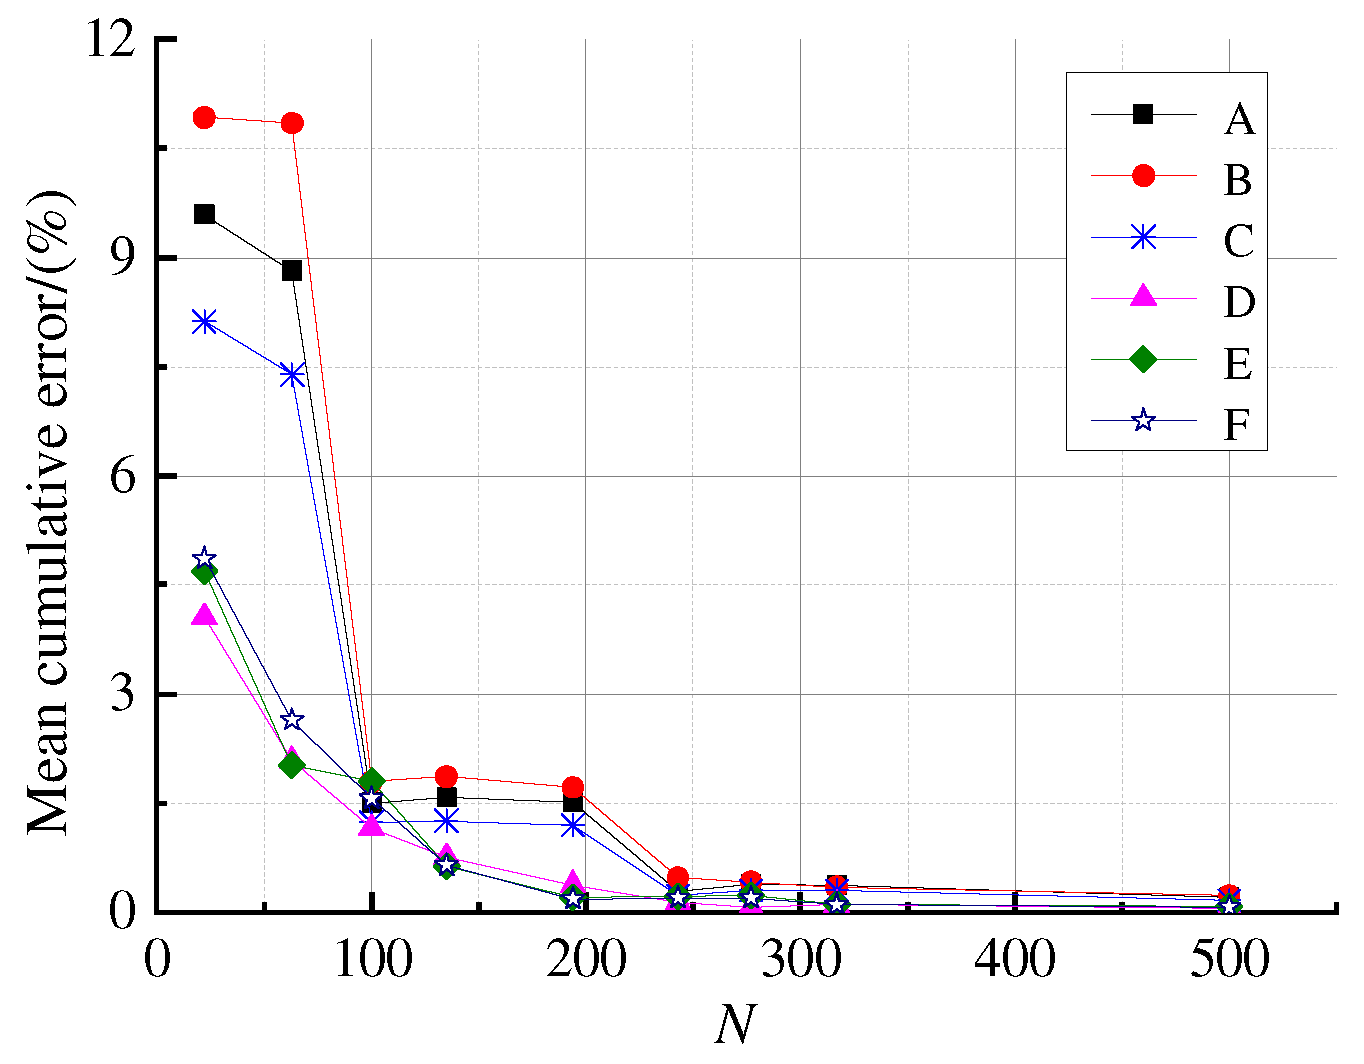
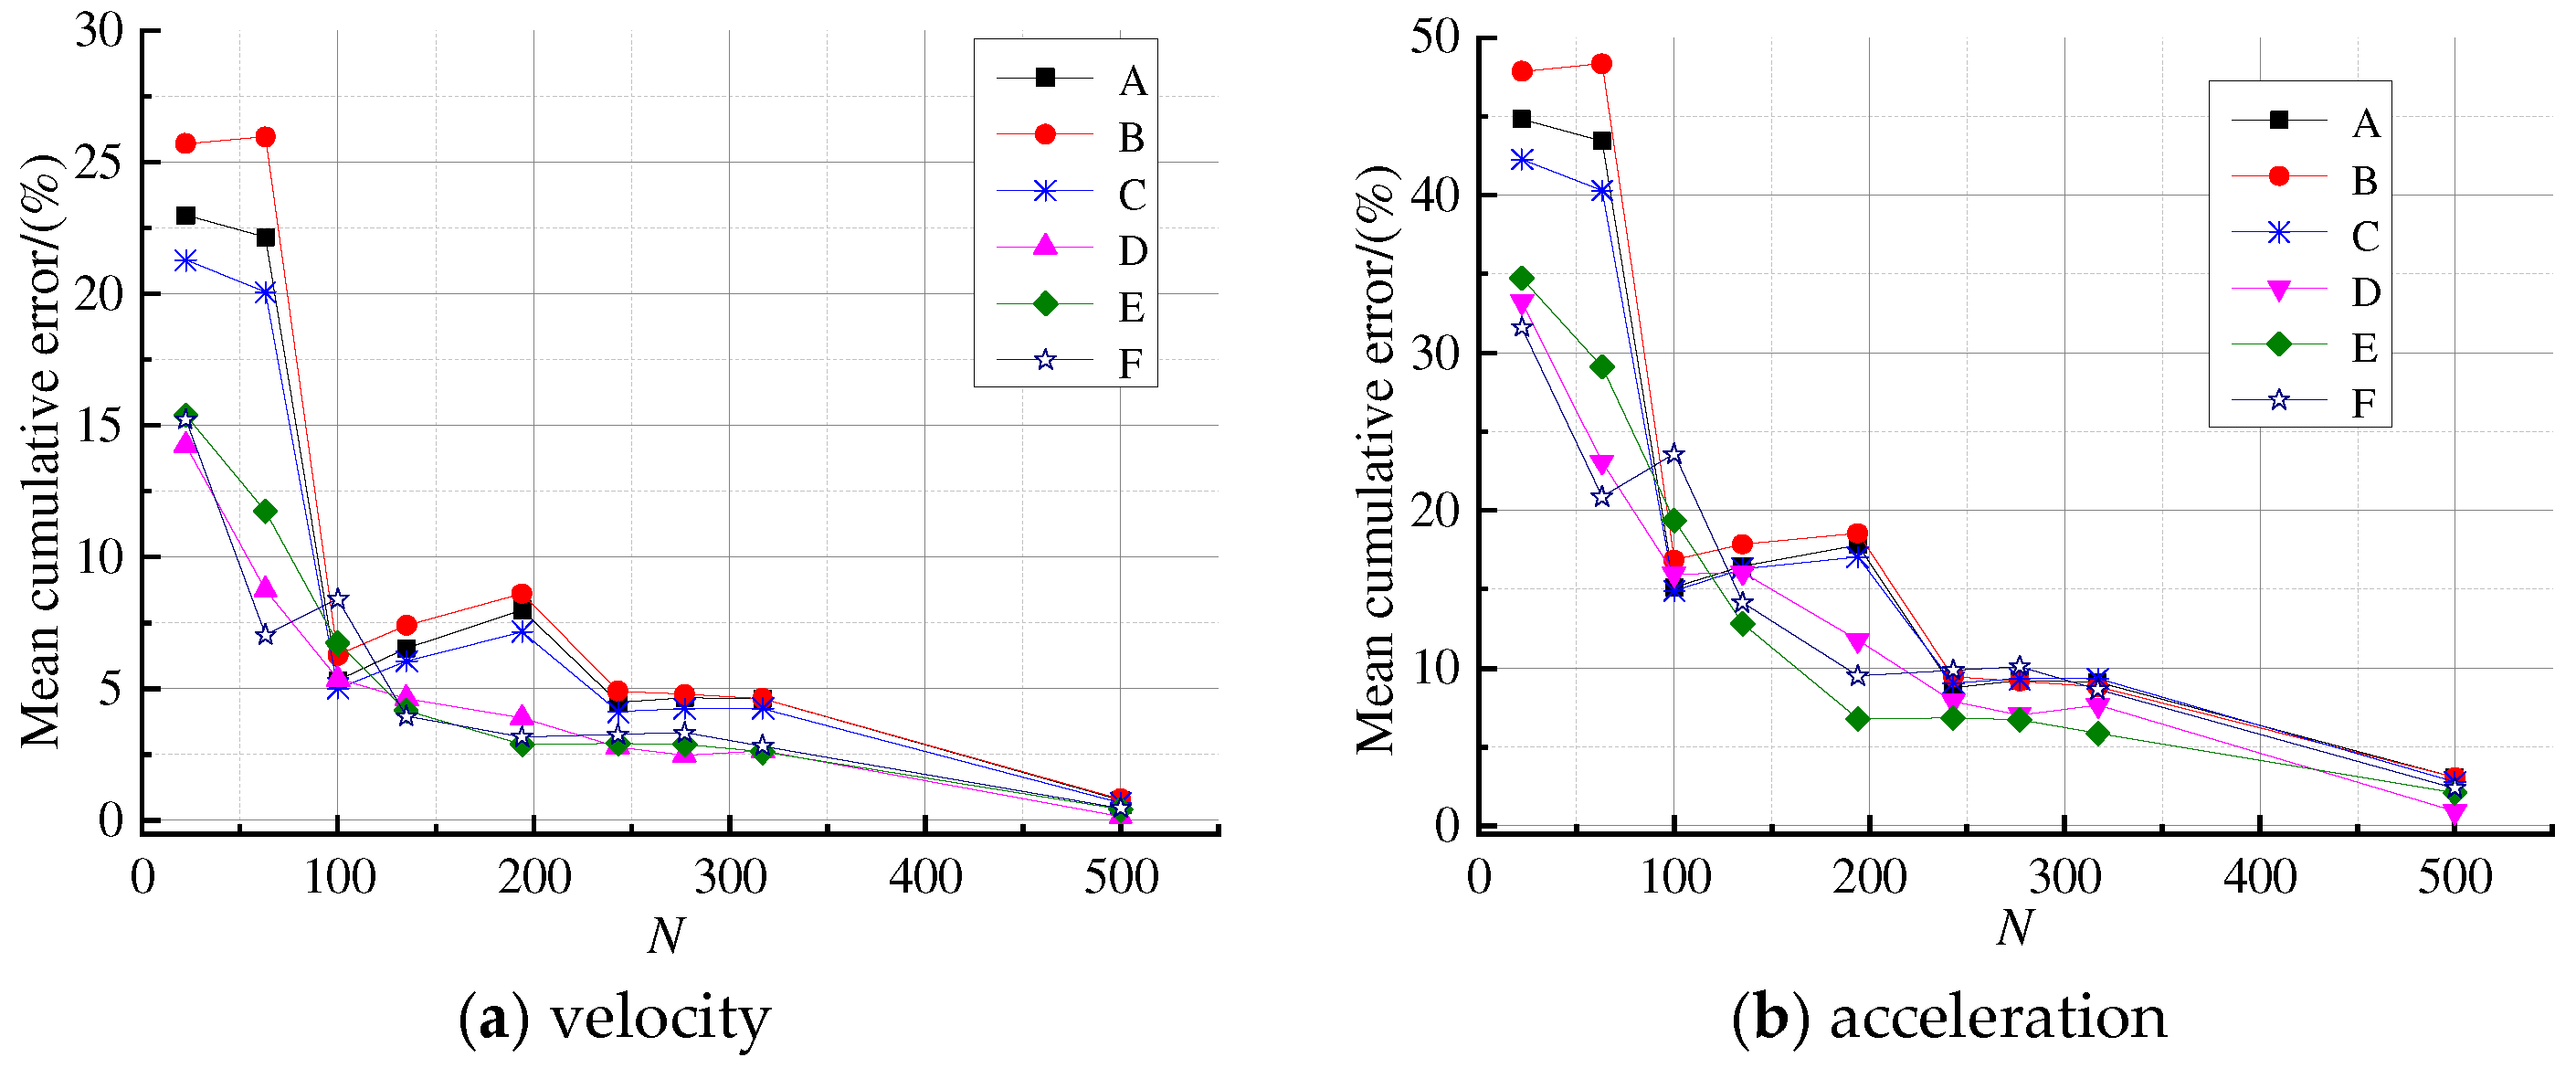
For displacement response, when N ≥ 63, except for uB whose calculation error is slightly greater than 10%, the cumulative error of displacement at all other points is less than 10%, indicating that the mode number selected based on modal participation mass for displacement response analysis is reasonable. The required mode numbers for u ¨ i (i = A, B, …, F) are 243, 243, 243, 243, 194, and 277 respectively. The truncation numbers based on the eai are much larger than the em and eui. This demonstrates once again that the cumulative modal contribution factor of acceleration should be used as the modal truncation criterion for acceleration response.
(3)
The cumulative error of acceleration is the largest, followed by velocity, and the smallest is displacement.
(4)
The cumulative errors of displacement, velocity, and acceleration at the lower step are all greater than those at the upper step. The reason is that the contributions of higher modes to the lower step are larger than to the upper step. For the points A, B, and C on the lower step, 277 modes obtained by eaB would make the cumulative error at all points less than 10%. Therefore, the modal contribution factor of acceleration at the position with a distance of one step height from the toe of the slope at the lower step can be used as the basis for modal truncation.
(5)
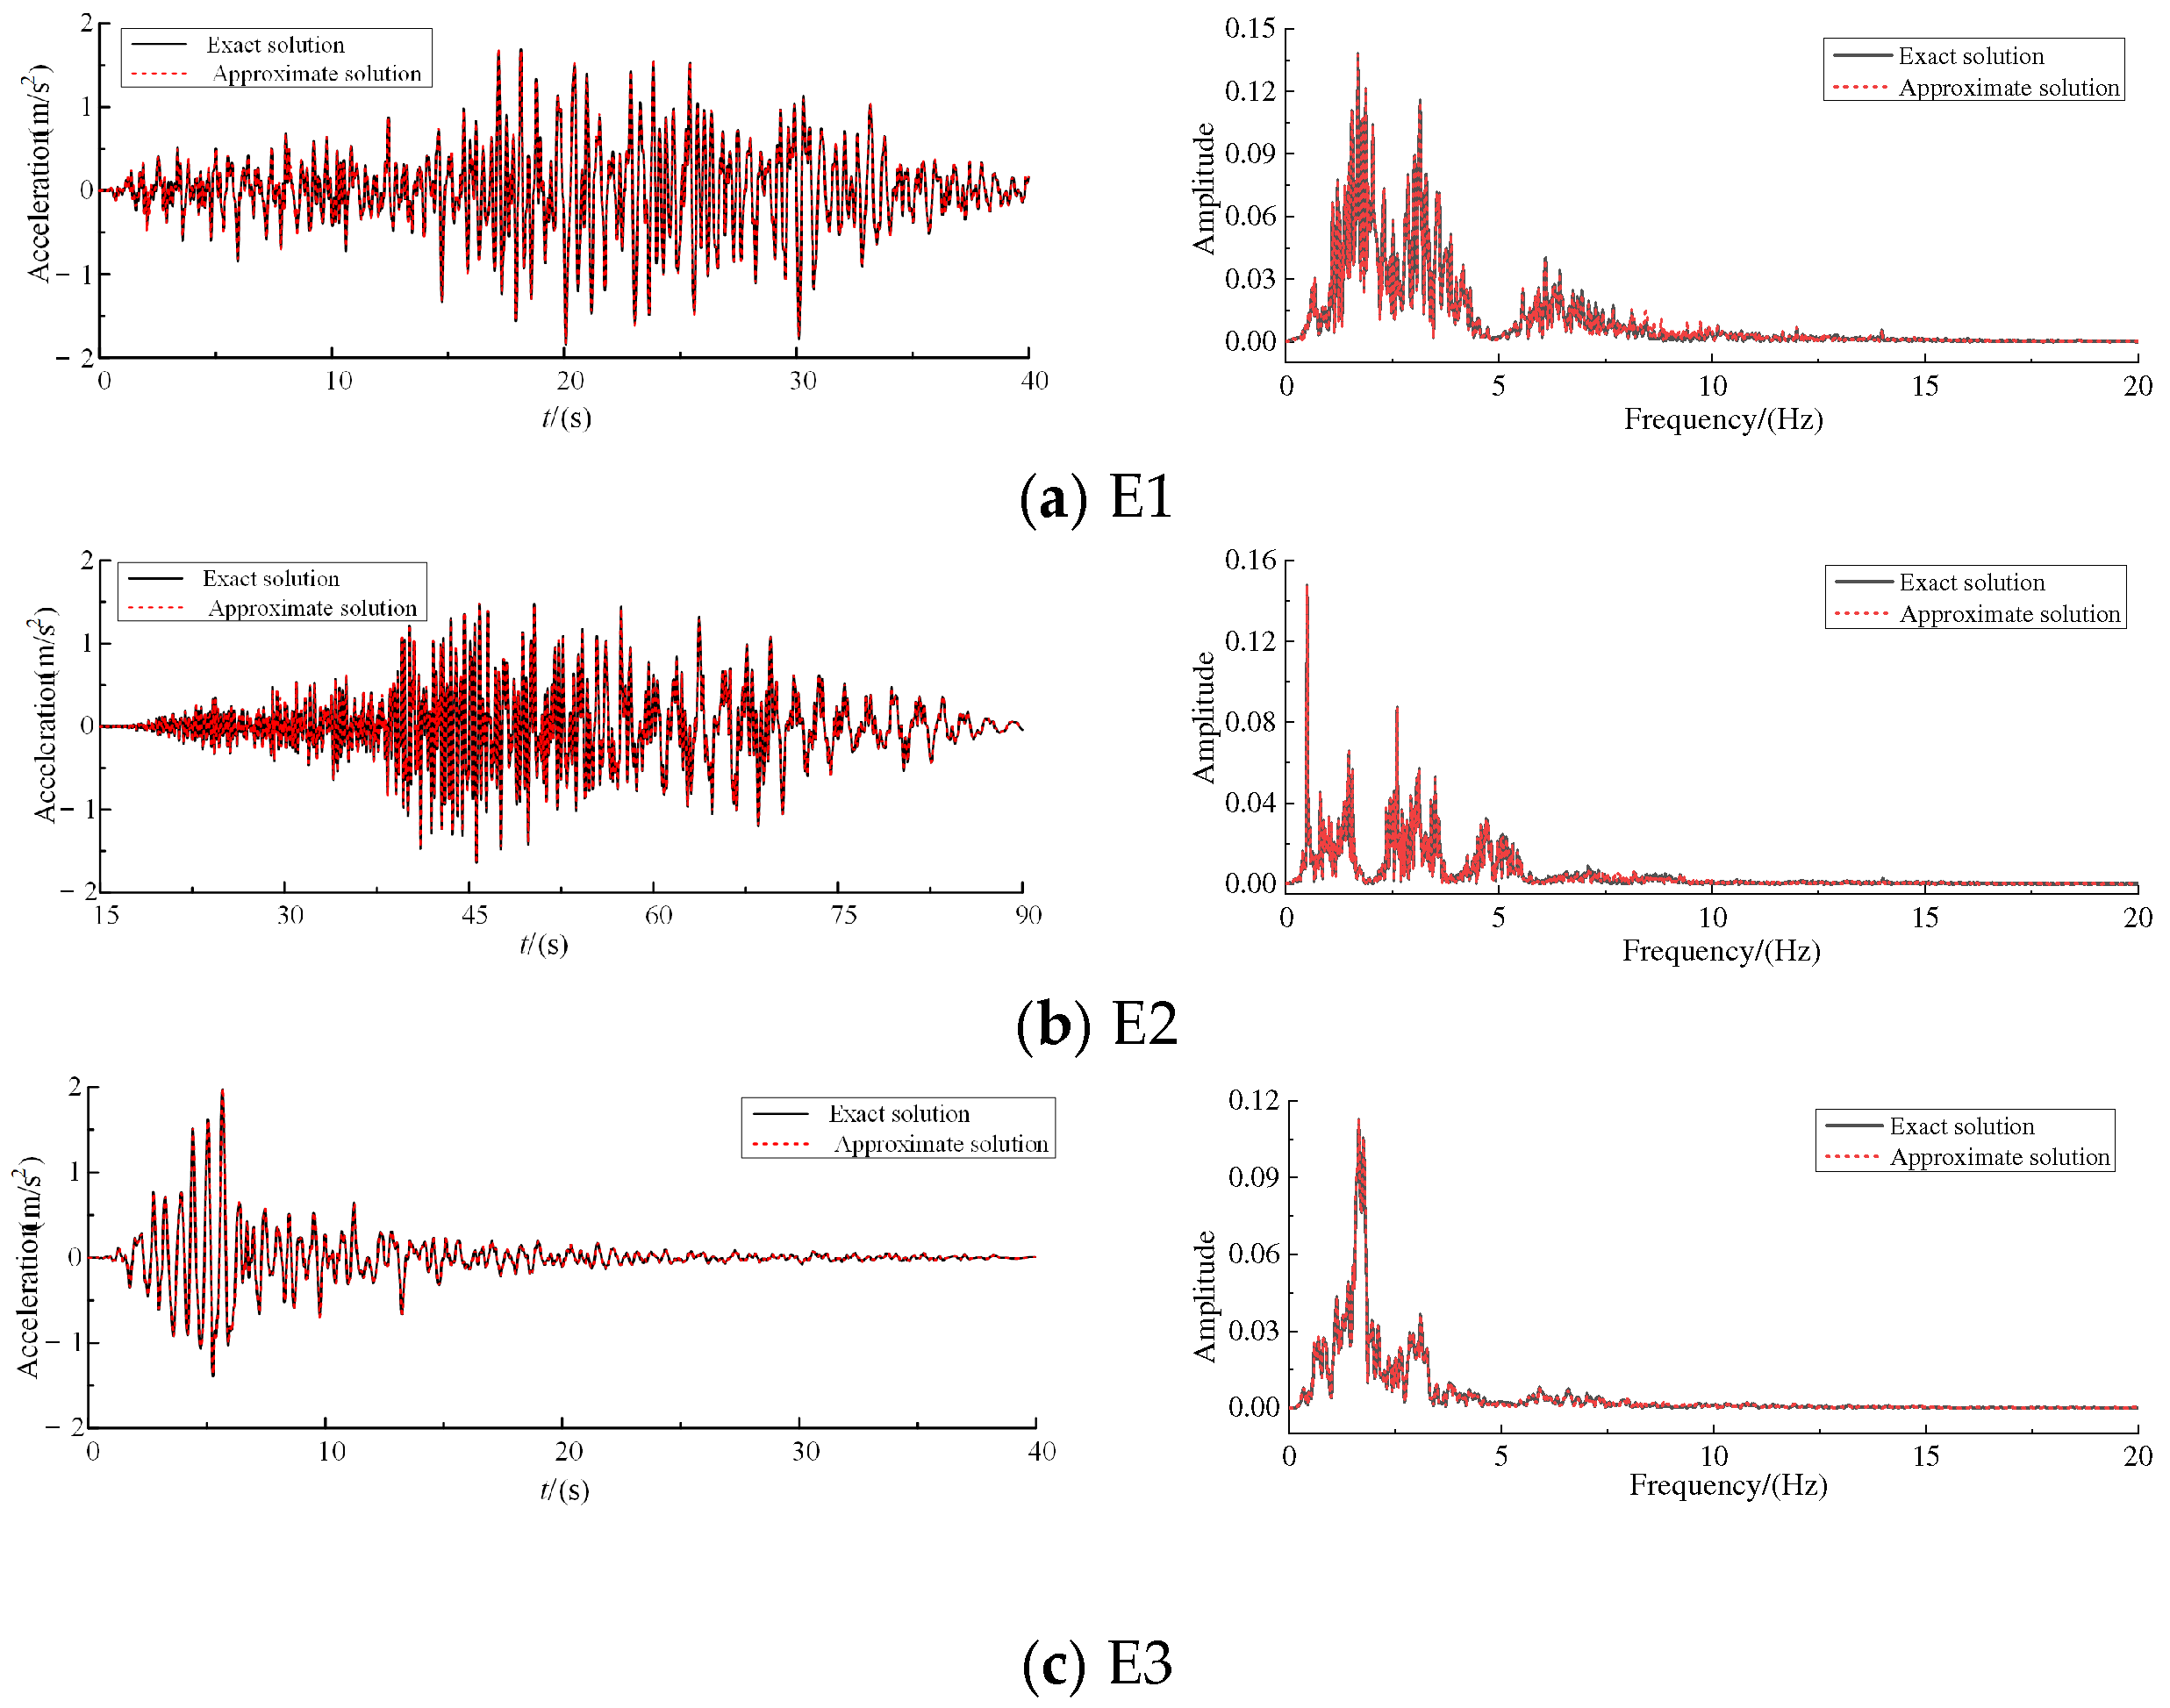
When N ≥ 277, the velocity and acceleration response errors obtained by the central difference method are less than 10%, which indicates that taking the cumulative modal contribution factor of acceleration as the basis for modal truncation, and calculating acceleration by the central difference method, shows high accuracy.
Figure 10 shows that the maximum error occurs at point B. Figure 11 shows the acceleration time history and Fourier spectra at point B obtained by the exact solution and by the central difference method through the use of the displacement based on 277 modes. The exact solution and the central difference approximate solution are almost coincident, indicating that after obtaining high-precision displacement response, the acceleration response obtained by using the central difference method has very high accuracy.

5. Conclusions

This paper proposes a computational method for modal superposition applicable to two-dimensional soil sites for analyzing the acceleration response of the site under seismic force. The calculation method for modal truncation for acceleration response is investigated. The variation of errors in velocity and acceleration time histories derived from numerical differentiation of displacement time histories is discussed. Based on the theoretical analysis and numerical results, the following conclusions can be drawn:
(1)
The contributions of the higher modes to acceleration are larger than to the displacement. Therefore, more modes need to be included in the calculation of acceleration response for the modal superposition method. The cumulative modal contribution factor of acceleration can be used as a modal truncation index for acceleration response. The modal participation mass and displacement-based modal contribution factor can only be used as a modal truncation index for displacement response.
(2)
The mode number of modal truncations is related to the selected degrees of freedom. For a homogeneous site, the acceleration at the site surface can be regarded as the key response quantity. For scarp topography, the position with a distance of one step height from the toe of the slope at the lower step can be used as the basis for modal truncation.
(3)
When the cumulative modal contribution factor of acceleration is used as the truncation criterion, the accuracy of velocity and acceleration obtained by the central difference method is essentially consistent with the results from the modal superposition method. Therefore, displacement responses can be computed using the modal superposition method, and then the velocity and acceleration responses at locations of interest can be obtained using the central difference method.
(4)
The theoretical foundation of this method is the modal superposition approach, which is suitable for linear elastic analysis. However, for nonlinear seismic response analysis of soil layers, the equivalent linearization method is commonly used. Therefore, during each iteration step, the computational method proposed in this paper can be employed to improve the efficiency of equivalent linearization calculations.
However, in this study, the verification of the calculation error of the modal superposition method is limited to numerical simulations. In the future, further analyses of the nonlinear seismic response of actual complex sites will be conducted by combining equivalent linearization and comparing with measured results to evaluate the influence of soil properties and seismic excitation characteristics on the computational error of seismic response, providing a more comprehensive validation of the effectiveness of the proposed algorithm.

Author Contributions

H.C.: Conceptualization. Y.Y.: Investigation, X.L.: Investigation, Validation, Writing—original draft & editing. D.P.: Investigation, Writing—review. All authors have read and agreed to the published version of the manuscript.

Funding

This research was funded by the National Natural Science Foundation of China grant number 52478121.

Institutional Review Board Statement

Not applicable.

Informed Consent Statement

Not applicable.

Data Availability Statement

The data that support the findings for this study are available from the authors by request.

Conflicts of Interest

Authors H.C. and Y.Y. were employed by the company China First Highway Xiamen Engineering Co., Ltd. The remaining authors declare that the research was conducted in the absence of any commercial or financial relationships that could be construed as a potential conflict of interest.

References

  1. Castro, R.R.; Pérez-Campos, X.; Zúñiga, R.; Ramírez-Guzmán, L.; Aguirre, J.; Husker, A.; Cuéllar, A.; Sánchez, T. A review on advances in seismology in Mexico after 30 years from the 1985 earthquake. J. South Am. Earth Sci. 2016, 70, 49–54. [Google Scholar] [CrossRef]
  2. Mahmood, K.; Zamin, B.; Iqbal, S.; Rehman, Z.U.; Afzal, S.; Safdar, M.; Iqbal, Q.; Ali, A. Local site effect on seismic hazard of the relocated new Balakot town. Soil Dyn. Earthq. Eng. 2022, 11, 107451. [Google Scholar] [CrossRef]
  3. Shreyasvi, C.; Venkataramana, K.; Chopra, S. Local site effect incorporation in probabilistic seismic hazard analysis—A case study from southern peninsular India, an intraplate region. Soil Dyn. Earthq. Eng. 2019, 123, 381–398. [Google Scholar] [CrossRef]
  4. Idriss, I.M.; Seed, H.B. Seismic response of horizontal soil layer. J. Soil Mech. Found. Div. 1968, 94, 1003–1031. [Google Scholar] [CrossRef]
  5. Nishanth Kiran, D.; Muzzaffar Khan, M.; Madhu Sudhan Reddy, M.; Kalyan Kumar, G. Earthquake response analysis of sites using DEEPSOIL. In Proceedings of the 7th Indian Young Geotechnical Engineers Conference, Silchar, India, 15–16 March 2019; 2020; pp. 309–315. [Google Scholar]
  6. Hashash, Y. DEEPSOIL5.0 User Manual and Tutorial; University of Illinois: Urbana, IL, USA, 2011. [Google Scholar]
  7. Idriss, I.M.; Sun, J.I. User’s Manual for SHAKE91: A Computer Program for Conducting Equivalent Linear Seismic Response Analyses of Horizontally Layered Soil Deposits; Center for Geotechnical Modeling Department of Civil & Environmental Engineering, University of California: Berkeley, CA, USA, 1992. [Google Scholar]
  8. Puri, N.; Jain, A.; Mohanty, P.; Bhattacharya, S. Earthquake response analysis of sites in state of Haryana using DEEPSOIL software. Procedia Comput. Sci. 2018, 125, 357–366. [Google Scholar] [CrossRef]
  9. Davis, L.L.; West, L.R. Observed effects of topography on ground motion. Bull. Seismol. Soc. Am. 1973, 63, 283–298. [Google Scholar] [CrossRef]
  10. Celebi, M. Topographic and geological amplification determined from strong motion and aftershock records of March 1985 Chile earthquake. Bull. Seismol. Soc. Am. 1987, 77, 1147–1167. [Google Scholar] [CrossRef]
  11. Bustos, J.; Pastén, C.; Pavez, D.; Acevedo, M.; Ruiz, S.; Astroza, R. Two-dimensional simulation of the seismic response of the Santiago Ba-sin, Chile. Soil Dyn. Earthq. Eng. 2023, 164, 107569. [Google Scholar] [CrossRef]
  12. Jin, D.D.; Chen, G.X.; Dong, F.F. Large-Scale two-dimensional nonlinear analysis on seismic effect of Fuzhou Basin. Appl. Mech. Mater. 2011, 90–93, 1426–1433. [Google Scholar] [CrossRef]
  13. McGann, C.R.; Bradley, B.; Wotherspoon, L.; Lee, R. Basin effects and limitations of 1Dsite response analysis from 2D numerical models of the Thorndon basin. Bull. New Zealand Soc. Earthq. Eng. 2021, 54, 21–30. [Google Scholar] [CrossRef]
  14. Ayoubi, P.; Mohammadi, K.; Asimaki, D. A systematic analysis of basin effects on surface ground motion. Soil Dyn. Earthq. Eng. 2021, 141, 106490. [Google Scholar] [CrossRef]
  15. Yiming, L.; Guoxin, W.; Yang, D. Nonlinear seismic response analysis of slopes considering the coupled effect of slope geometry and soil stratigraphy. Geophys. J. Int. 2024, 238, 616–630. [Google Scholar]
  16. Martin Philippe, P.; Bolton Seed, H. One dimensional dynamic ground response analysis. J. Geotech. Eng. Div. 1982, 108, 935–954. [Google Scholar] [CrossRef]
  17. Yoshida, N.; Kobayashi, S.; Suetomi, I.; Miura, K. Equivalent linear method considering frequency dependent characteristics of stiffness and damping. Soil Dyn. Earthq. Eng. 2002, 22, 205–222. [Google Scholar] [CrossRef]
  18. Mojtahedzadeh, N.; Siddharthan, R. Estimating free field seismic settlement history in a saturated layered soil profile. Soil Dyn. Earthq. Eng. 2021, 150, 106937. [Google Scholar] [CrossRef]
  19. Pan, D.G.; Fu Xq Qi, W.R. The Direct integration method with virtual initial conditions on the free and forced vibration of a system with hysteretic damping. Appl. Sci. 2019, 9, 3707. [Google Scholar] [CrossRef]
  20. Liu, Z.; Qiao, Y.; Cheng, X.; El Naggar, M.H. Nonlinear seismic response and amplification effect of 3D sedimentary basin based on bounding surface constitutive model. Soil Dyn. Earthq. Eng. 2022, 158, 107292. [Google Scholar] [CrossRef]
  21. Chen, W.; Lin, J.; Zheng, Y.; Su, L.; Chen, G.; Huang, L. Nonlinear seismic response of seabed with terrain variation and seawater-seabed coupling. Soil Dyn. Earthq. Eng. 2024, 180, 108579. [Google Scholar] [CrossRef]
  22. Chandran, D.; Anbazhagan, P. 2D nonlinear site response analysis of typical stiff and soft soil sites at shallow bed-rock region with low to medium seismicity. J. Appl. Geophys. 2020, 179, 104087. [Google Scholar] [CrossRef]
  23. Li, X.J.; Pan, D.G.; Shi, S.Z. A modal-superposition-based equivalent linearization method for seismic response analysis of two-dimensional sites. Eng. Mech. 2023, 40, 179–189. (In Chinese) [Google Scholar]
  24. Wilson, E.L. Three-Dimensional Statical and Dynamic Analysis of Structures; Computers and Structures: Berkeley, CA, USA, 2002. [Google Scholar]
  25. Chopra, A.K. Dynamics of Structures: Theory and Applications to Earthquake Engineering; Prentice-Hall: Englewood Cliffs, NJ, USA, 1995. [Google Scholar]
  26. Pan, D.; LI, X.; Tan, J. Modal truncation method on cantilever-type structures under seismic excitations. J. Build. Struct. 2020, 41, 55–62. (In Chinese) [Google Scholar]
  27. D’Aveni, A.; Muscolino, G. Response of non-classically damped structures in the modal subspace. Earthq. Eng. Struct. Dyn. 1995, 24, 1267–1281. [Google Scholar] [CrossRef]
  28. Bai, J.; Dong, S. Selection of lateral artificial boundary distance and analysis of its influence factors in seismic responses analysis of sites. World Inf. Earthq. Eng. 2018, 34, 179–187. [Google Scholar]
Figure 1. Two-dimensional irregular site.
Applsci 15 06082 g001
Figure 2. Finite element model of the homogeneous soil.
Applsci 15 06082 g002
Figure 3. The acceleration time histories of input earthquake waves.
Applsci 15 06082 g003
Figure 4. Mean cumulative errors of modal superposition method of the homogeneous soil.
Applsci 15 06082 g004
Figure 5. Time histories and Fourier spectra of uA.
Applsci 15 06082 g005
Figure 6. Time histories and Fourier spectra of u ¨ A .
Applsci 15 06082 g006aApplsci 15 06082 g006b
Figure 7. Mean cumulative errors vary with N.
Applsci 15 06082 g007
Figure 8. Finite element model of scarp topography site.
Applsci 15 06082 g008
Figure 9. Mean cumulative error curves of displacement of scarp topography site.
Applsci 15 06082 g009
Figure 10. Cumulative errors of central difference method of scarp topography site.
Applsci 15 06082 g010
Figure 11. The acceleration histories and Fourier spectra of point B.
Applsci 15 06082 g011
Table 1. Ground motions.
No.Seismic WaveTimeMonitoring StationEarthquake
E1Far-sfern2 September 1971Isabella DamSan Fernando
E2Mid-chichi20 September 1999TTNO25Chi-Chi Taiwan
E3Near-lomp18 October 1989Belmont-EnvirotechLoma Prieta
Table 2. Partial frequencies and modal truncation indexes of site.
NFrequency/Hzγem/%euA/%eaA/%
10.499603.917.933.2027.31
21.499−201.18.830.6215.08
32.496−120.45.570.2410.29
43.48985.733.910.107.78
54.47766.412.920.026.22
65.457−54.052.260.015.17
76.42945.441.7904.41
87.39239.091.4603.83
98.343−34.191.1903.38
109.281−30.290.9903.01
Table 3. Cumulative errors of the soil surface time-history responses (%).
Seismic WaveuA u ˙ A u ¨ A
474747
E10.390.053.690.63.690.61
E20.610.064.810.6023.654.65
E30.260.032.230.3112.982.83
Mean value0.420.0473.580.5113.442.69
Table 4. Partial frequencies and mode truncation indexes of scarp topography site (%).
Nf/(Hz)emeuAeuBeuCeuDeuEeuFeaAeaBeaCeaDeaEeaF
221.8812.697.95 17.60 13.61 8.00 7.85 6.47 31.5731.7824.4517.490.210.22
633.099.862.12 5.85 3.85 3.36 3.04 0.65 26.2531.1120.411.257.6411.92
1004.027.861.25 2.87 2.16 0.08 0.06 0.38 13.8113.238.324.398.5913.12
1354.586.650.24 0.56 0.33 0.14 0.09 0.13 15.1615.8310.349.959.759.02
1945.575.940.24 0.51 0.40 0.09 0.04 0.04 14.3714.269.889.084.295.72
2436.095.400.01 0.16 0.01 0.03 0.02 0.04 7.0910.673.742.634.736.35
2776.505.380.06 0.14 0.07 0.01 0.02 0.04 10.089.546.982.534.496.74
3176.894.950.06 0.10 0.10 0.03 0.01 0.02 9.658.027.054.174.155.75
5008.374.430.05 0.10 0.07 0.01 0.02 0.02 6.596.324.160.733.564.08
100010.543.910.00 0.00 0.00 0.00 0.00 0.00 4.204.193.281.380.991.72
Disclaimer/Publisher’s Note: The statements, opinions and data contained in all publications are solely those of the individual author(s) and contributor(s) and not of MDPI and/or the editor(s). MDPI and/or the editor(s) disclaim responsibility for any injury to people or property resulting from any ideas, methods, instructions or products referred to in the content.

