

Flowability-Dependent Anisotropic Mechanical Properties of 3D Printing Concrete: Experimental and Theoretical Study


Abstract
1. Introduction
2. Materials and Methods
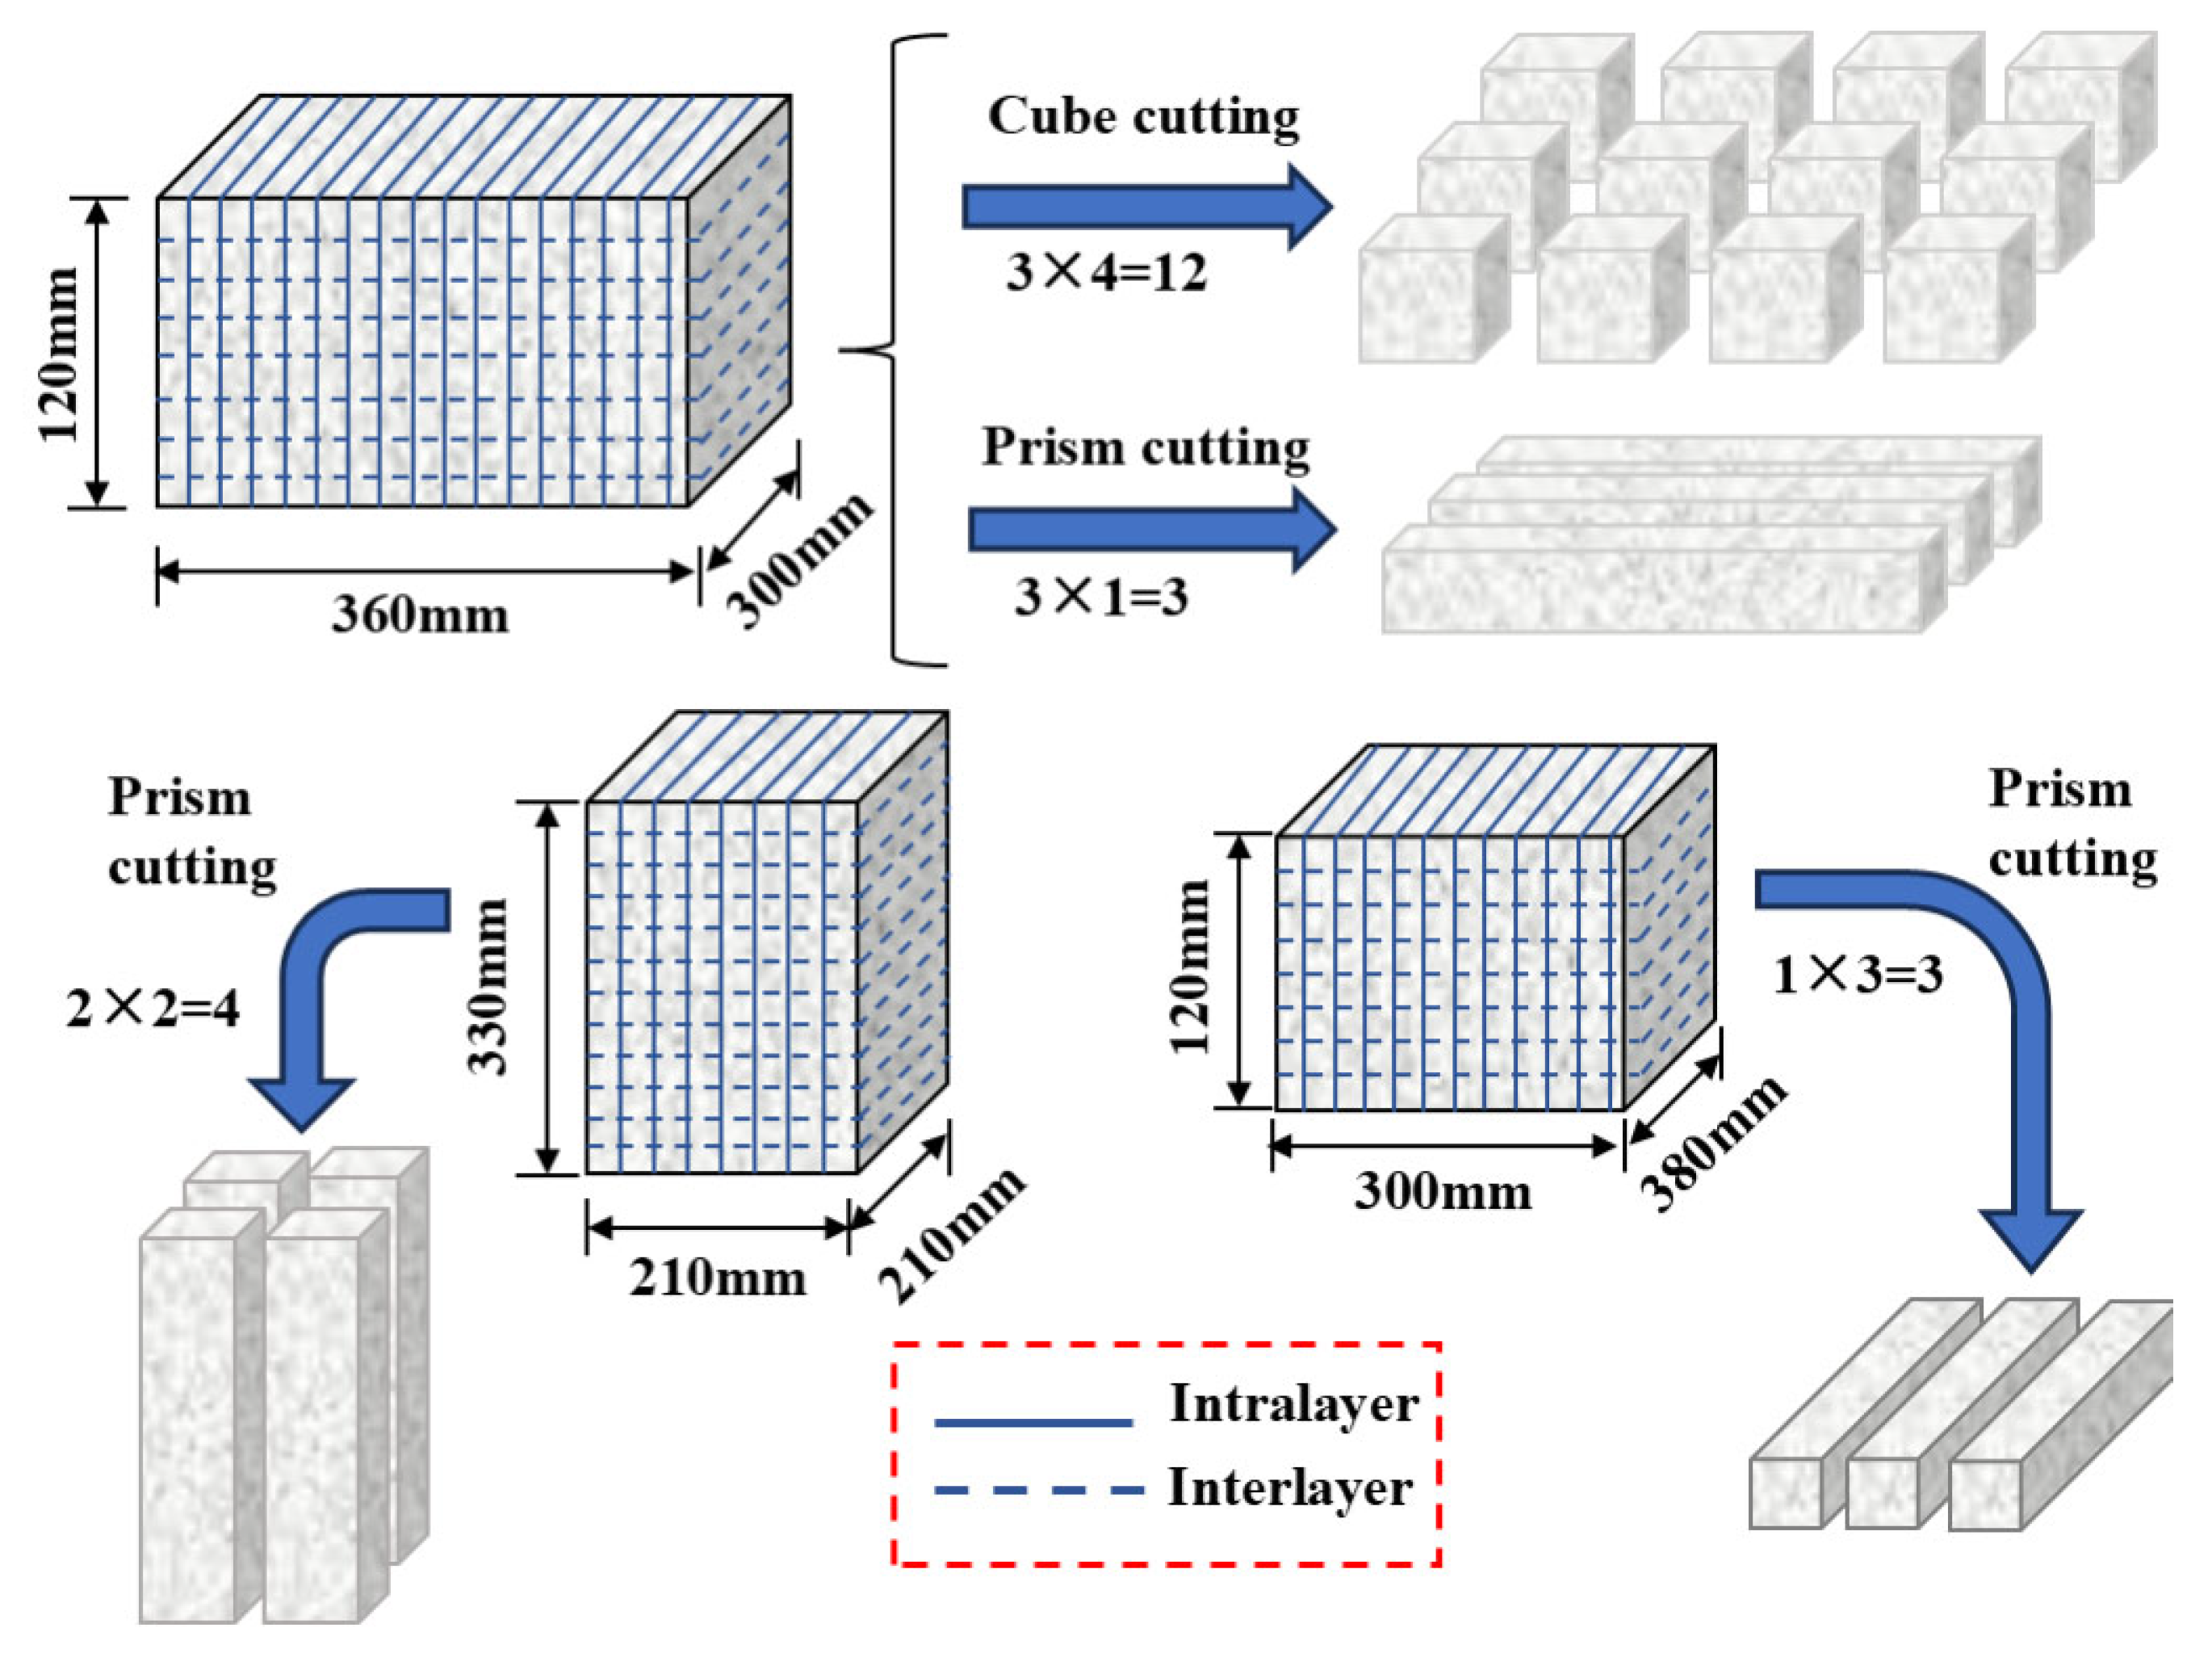
2.1. Raw Materials and Printing Processes
2.2. Mechanical Test
2.3. X-CT Test
3. Results and Discussion
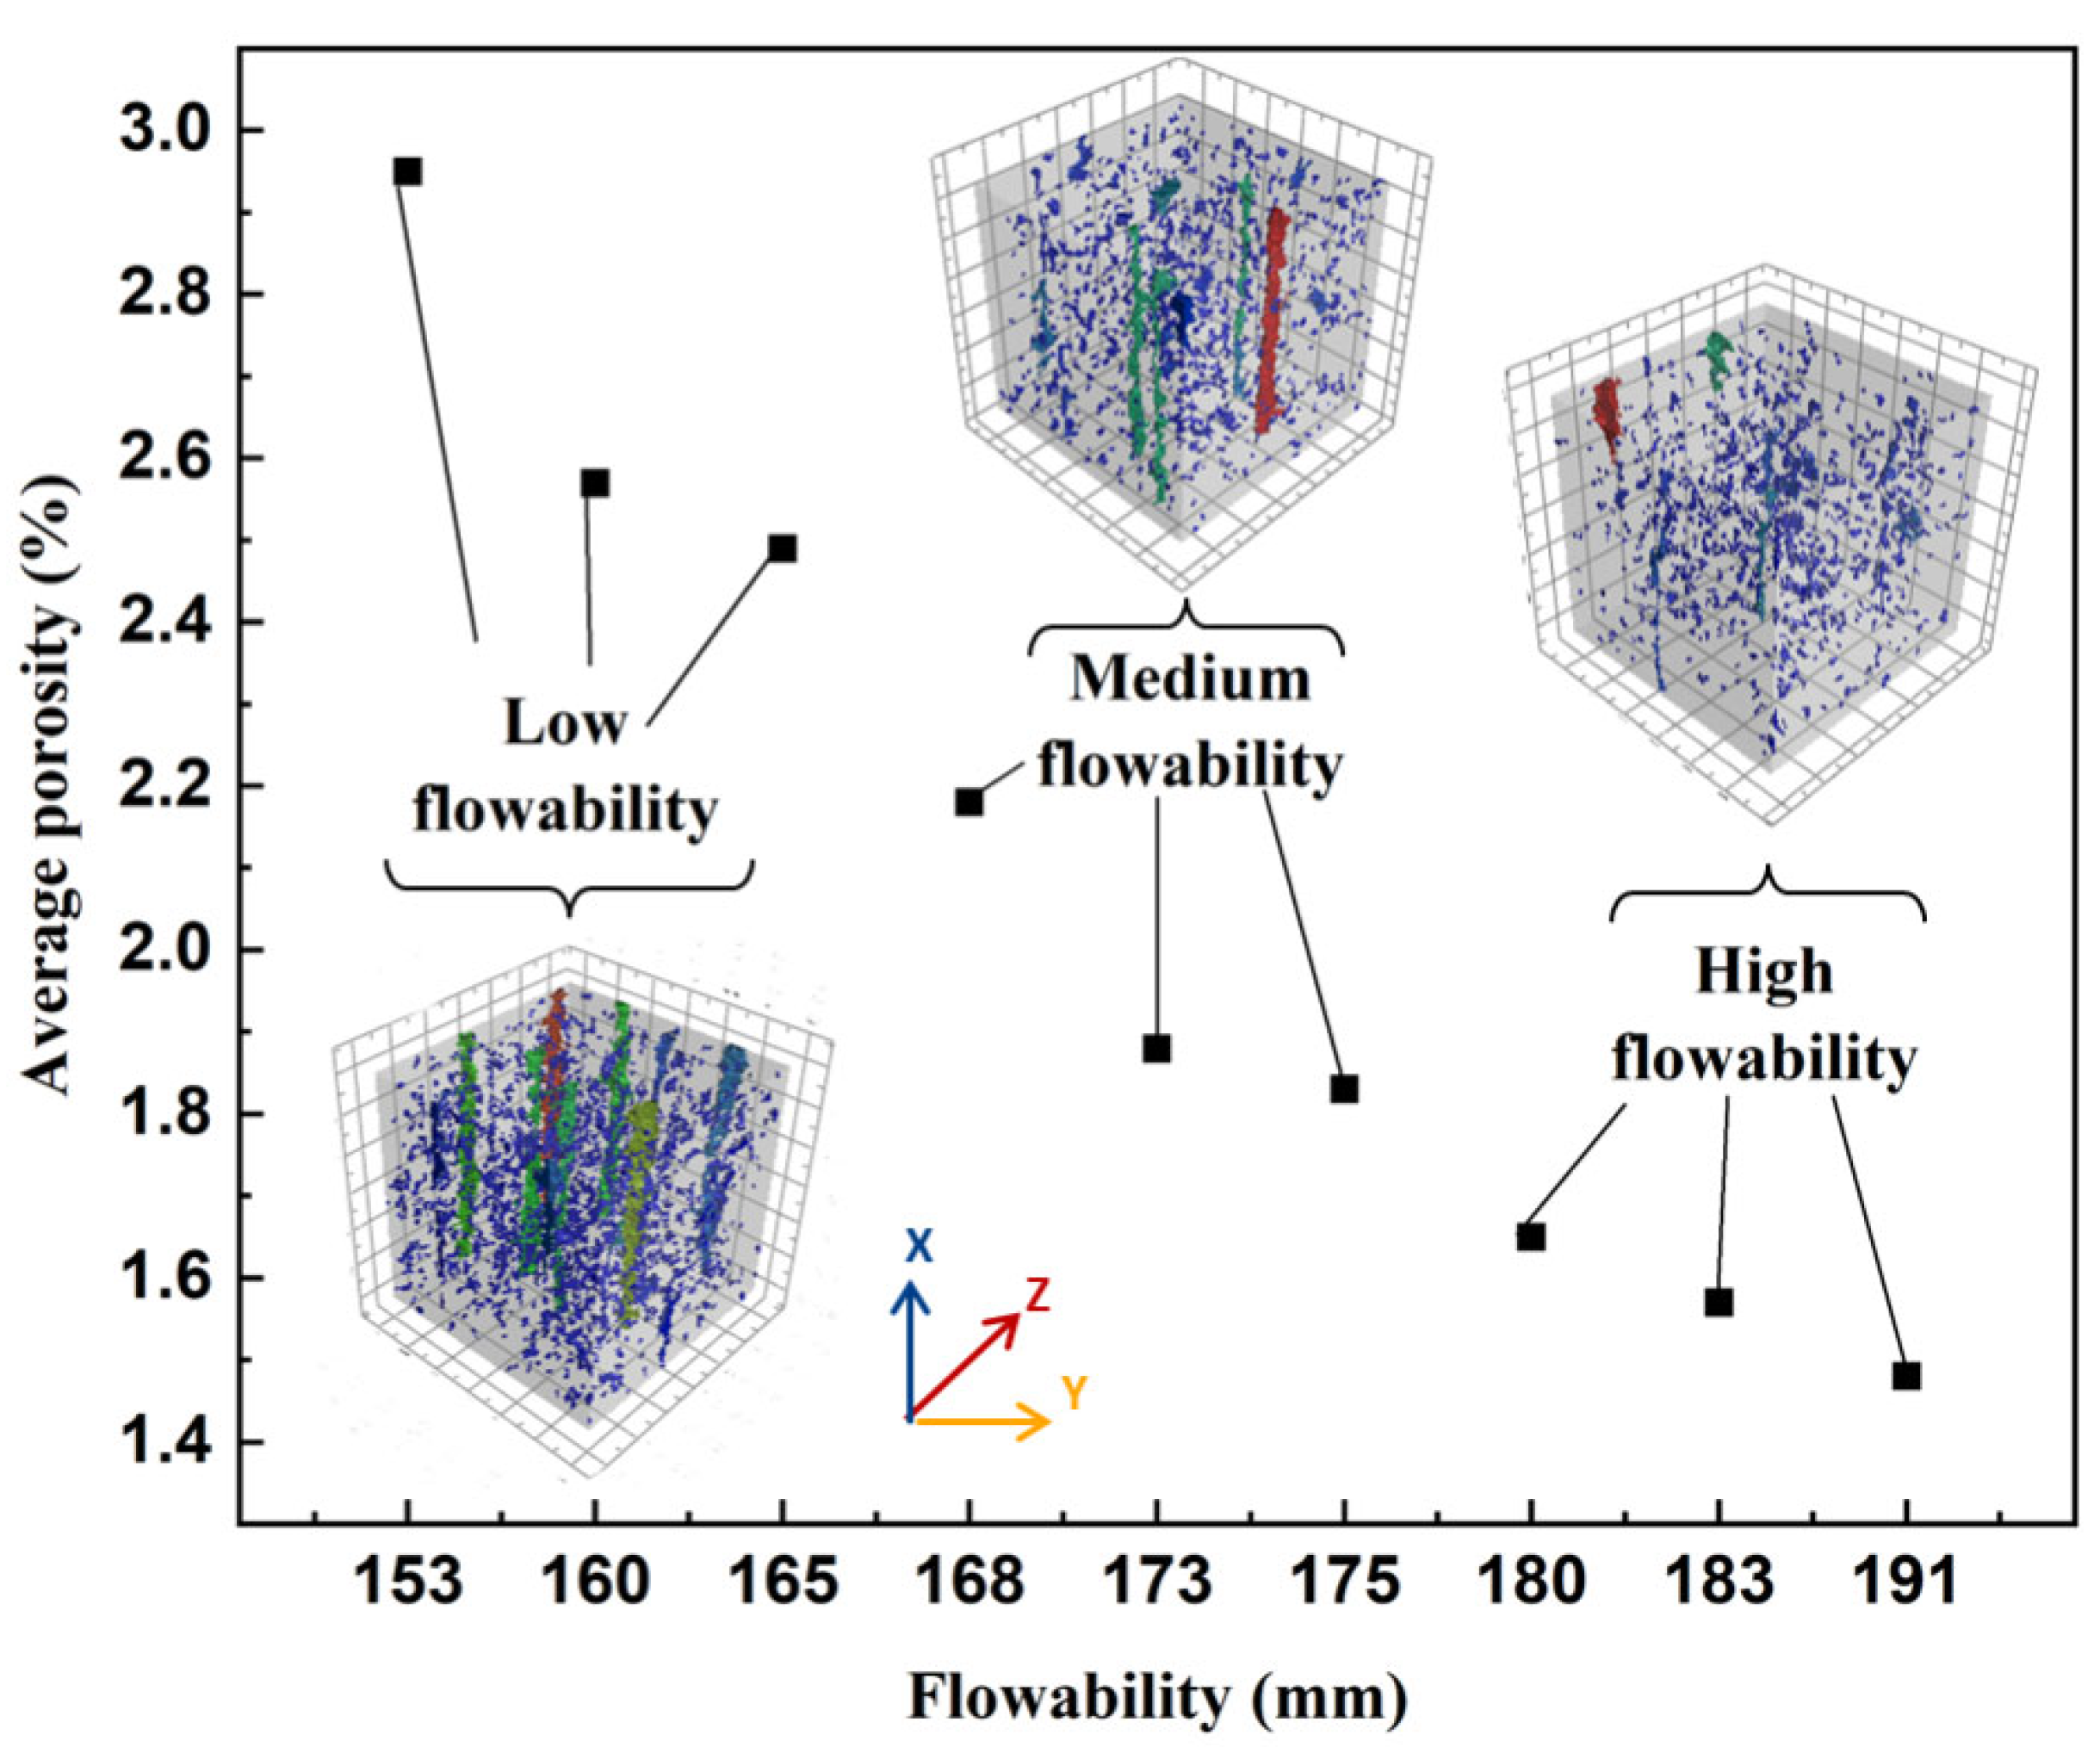
3.1. X-CT Test Results
3.2. Failure Modes
3.3. Mechanical Test Results
4. Anisotropy Analysis
4.1. Evaluation of Anisotropic Mechanical Properties
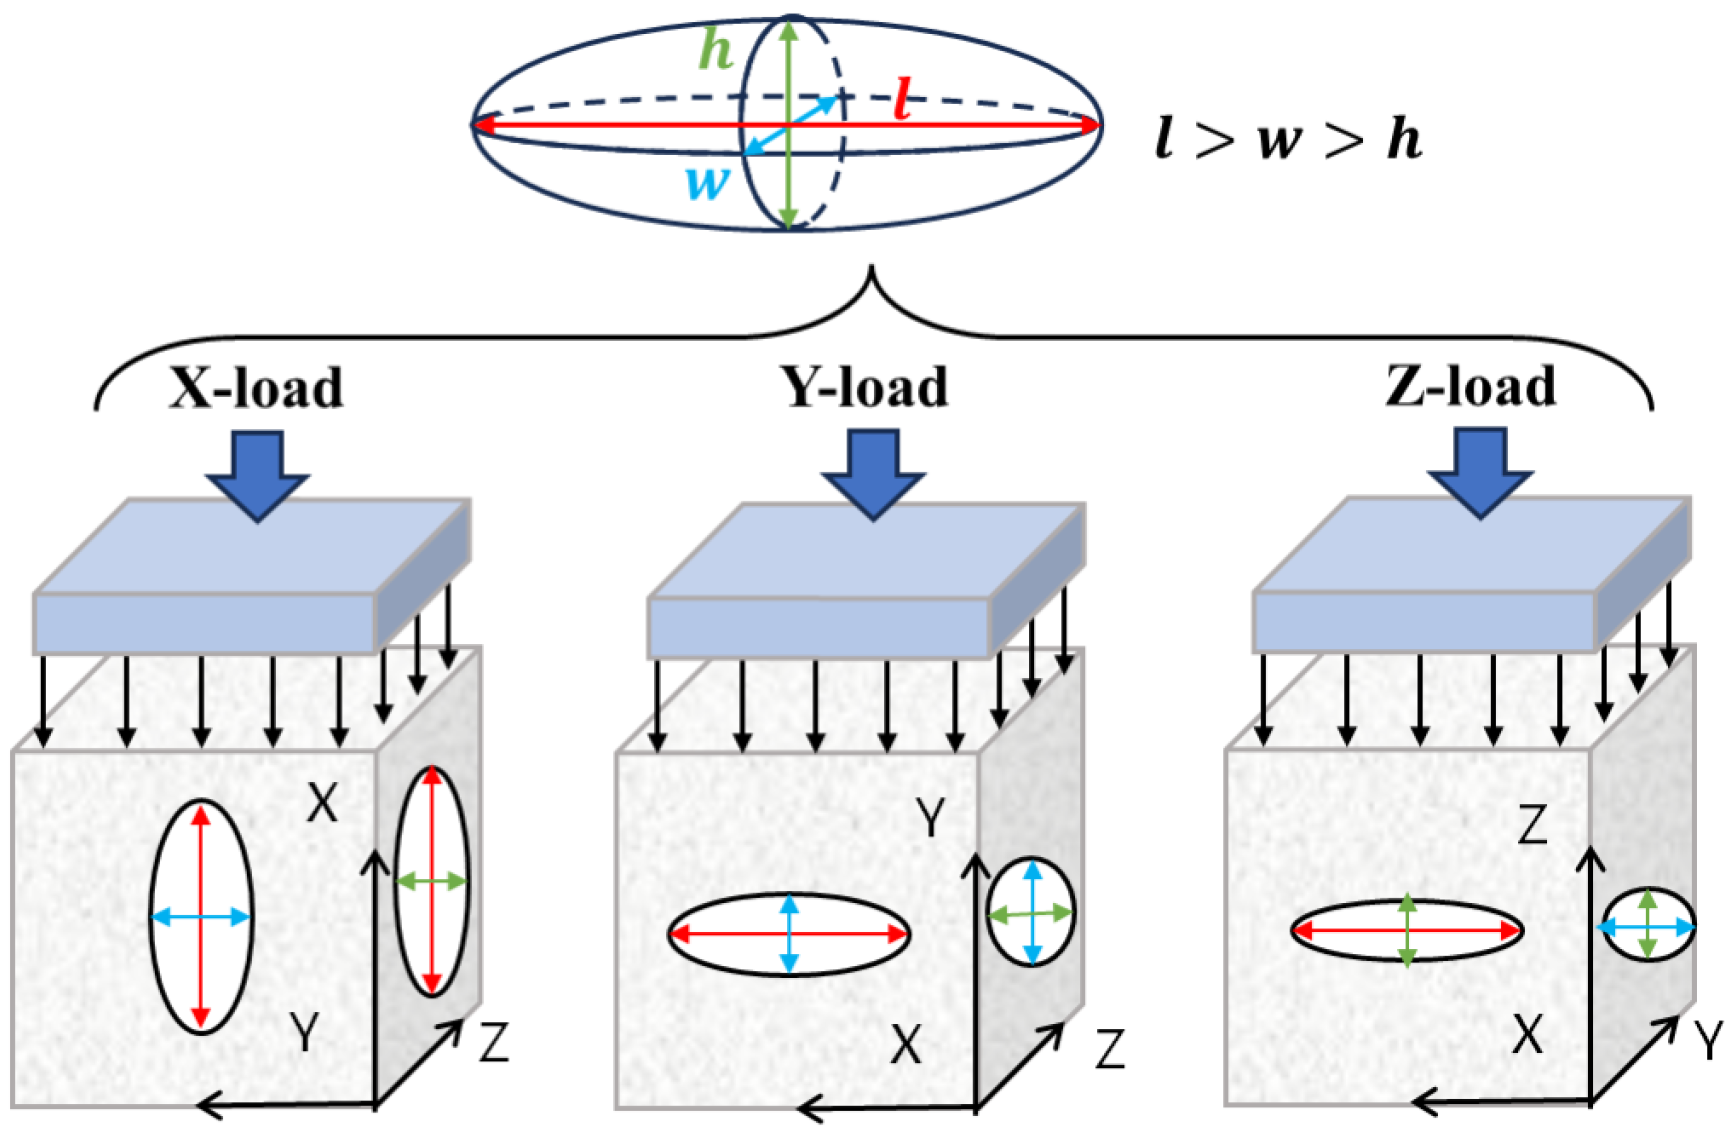
4.2. Fracture Theory of Ellipsoidal Pores Based on Stress Intensity Factor
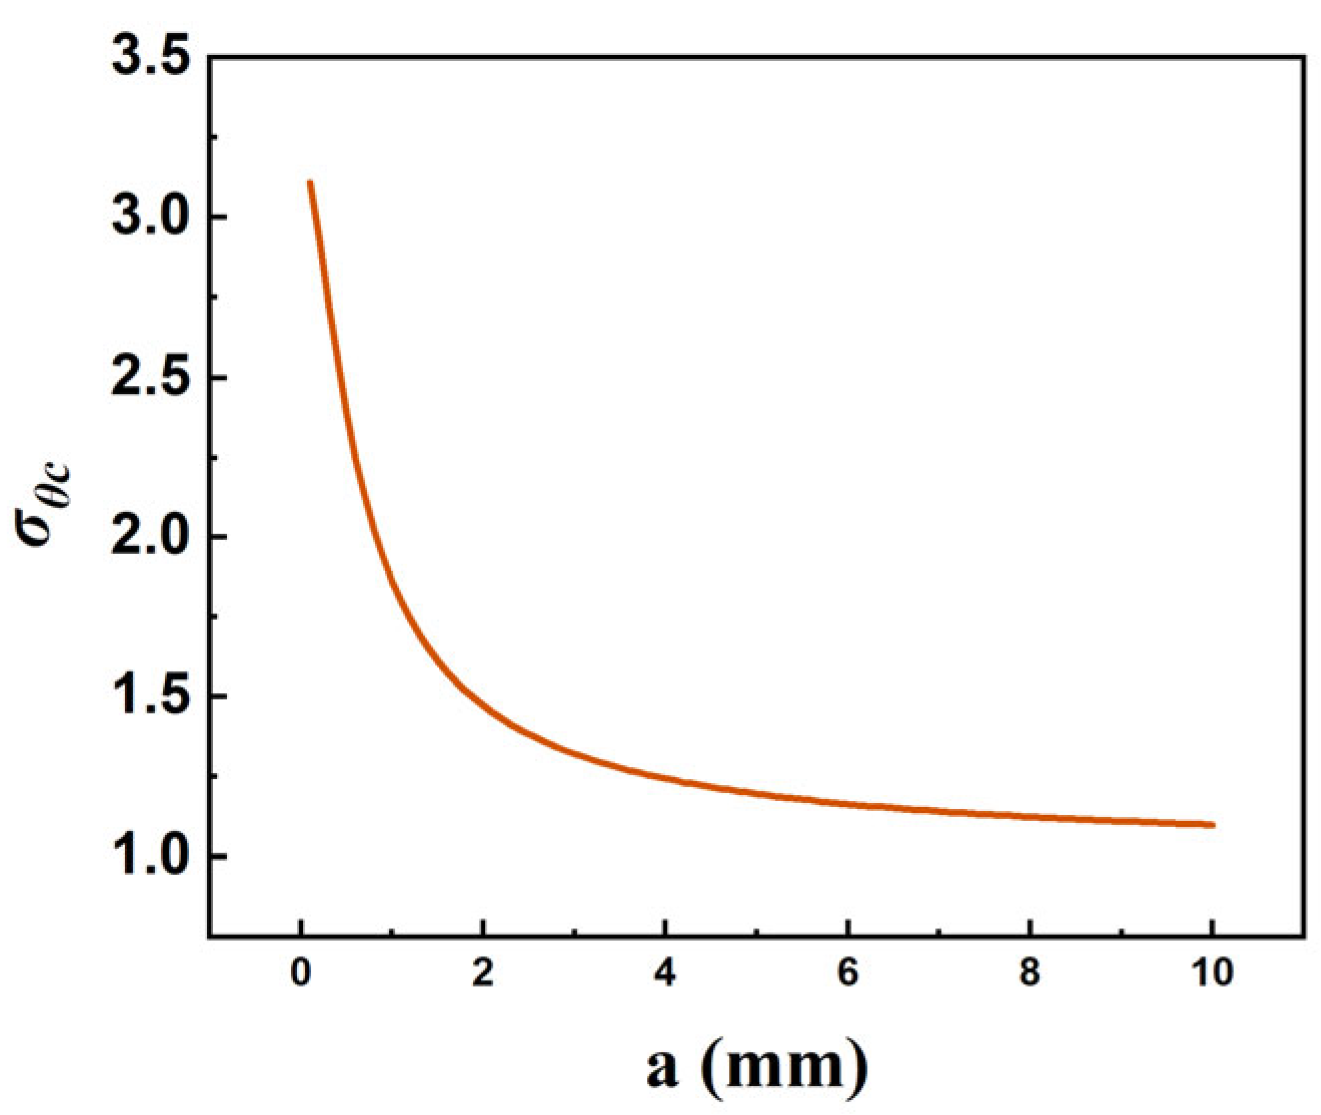
4.3. Mechanism of Compressive Strength Anisotropy Based on Maximum Critical Tangential Stress
5. Conclusions
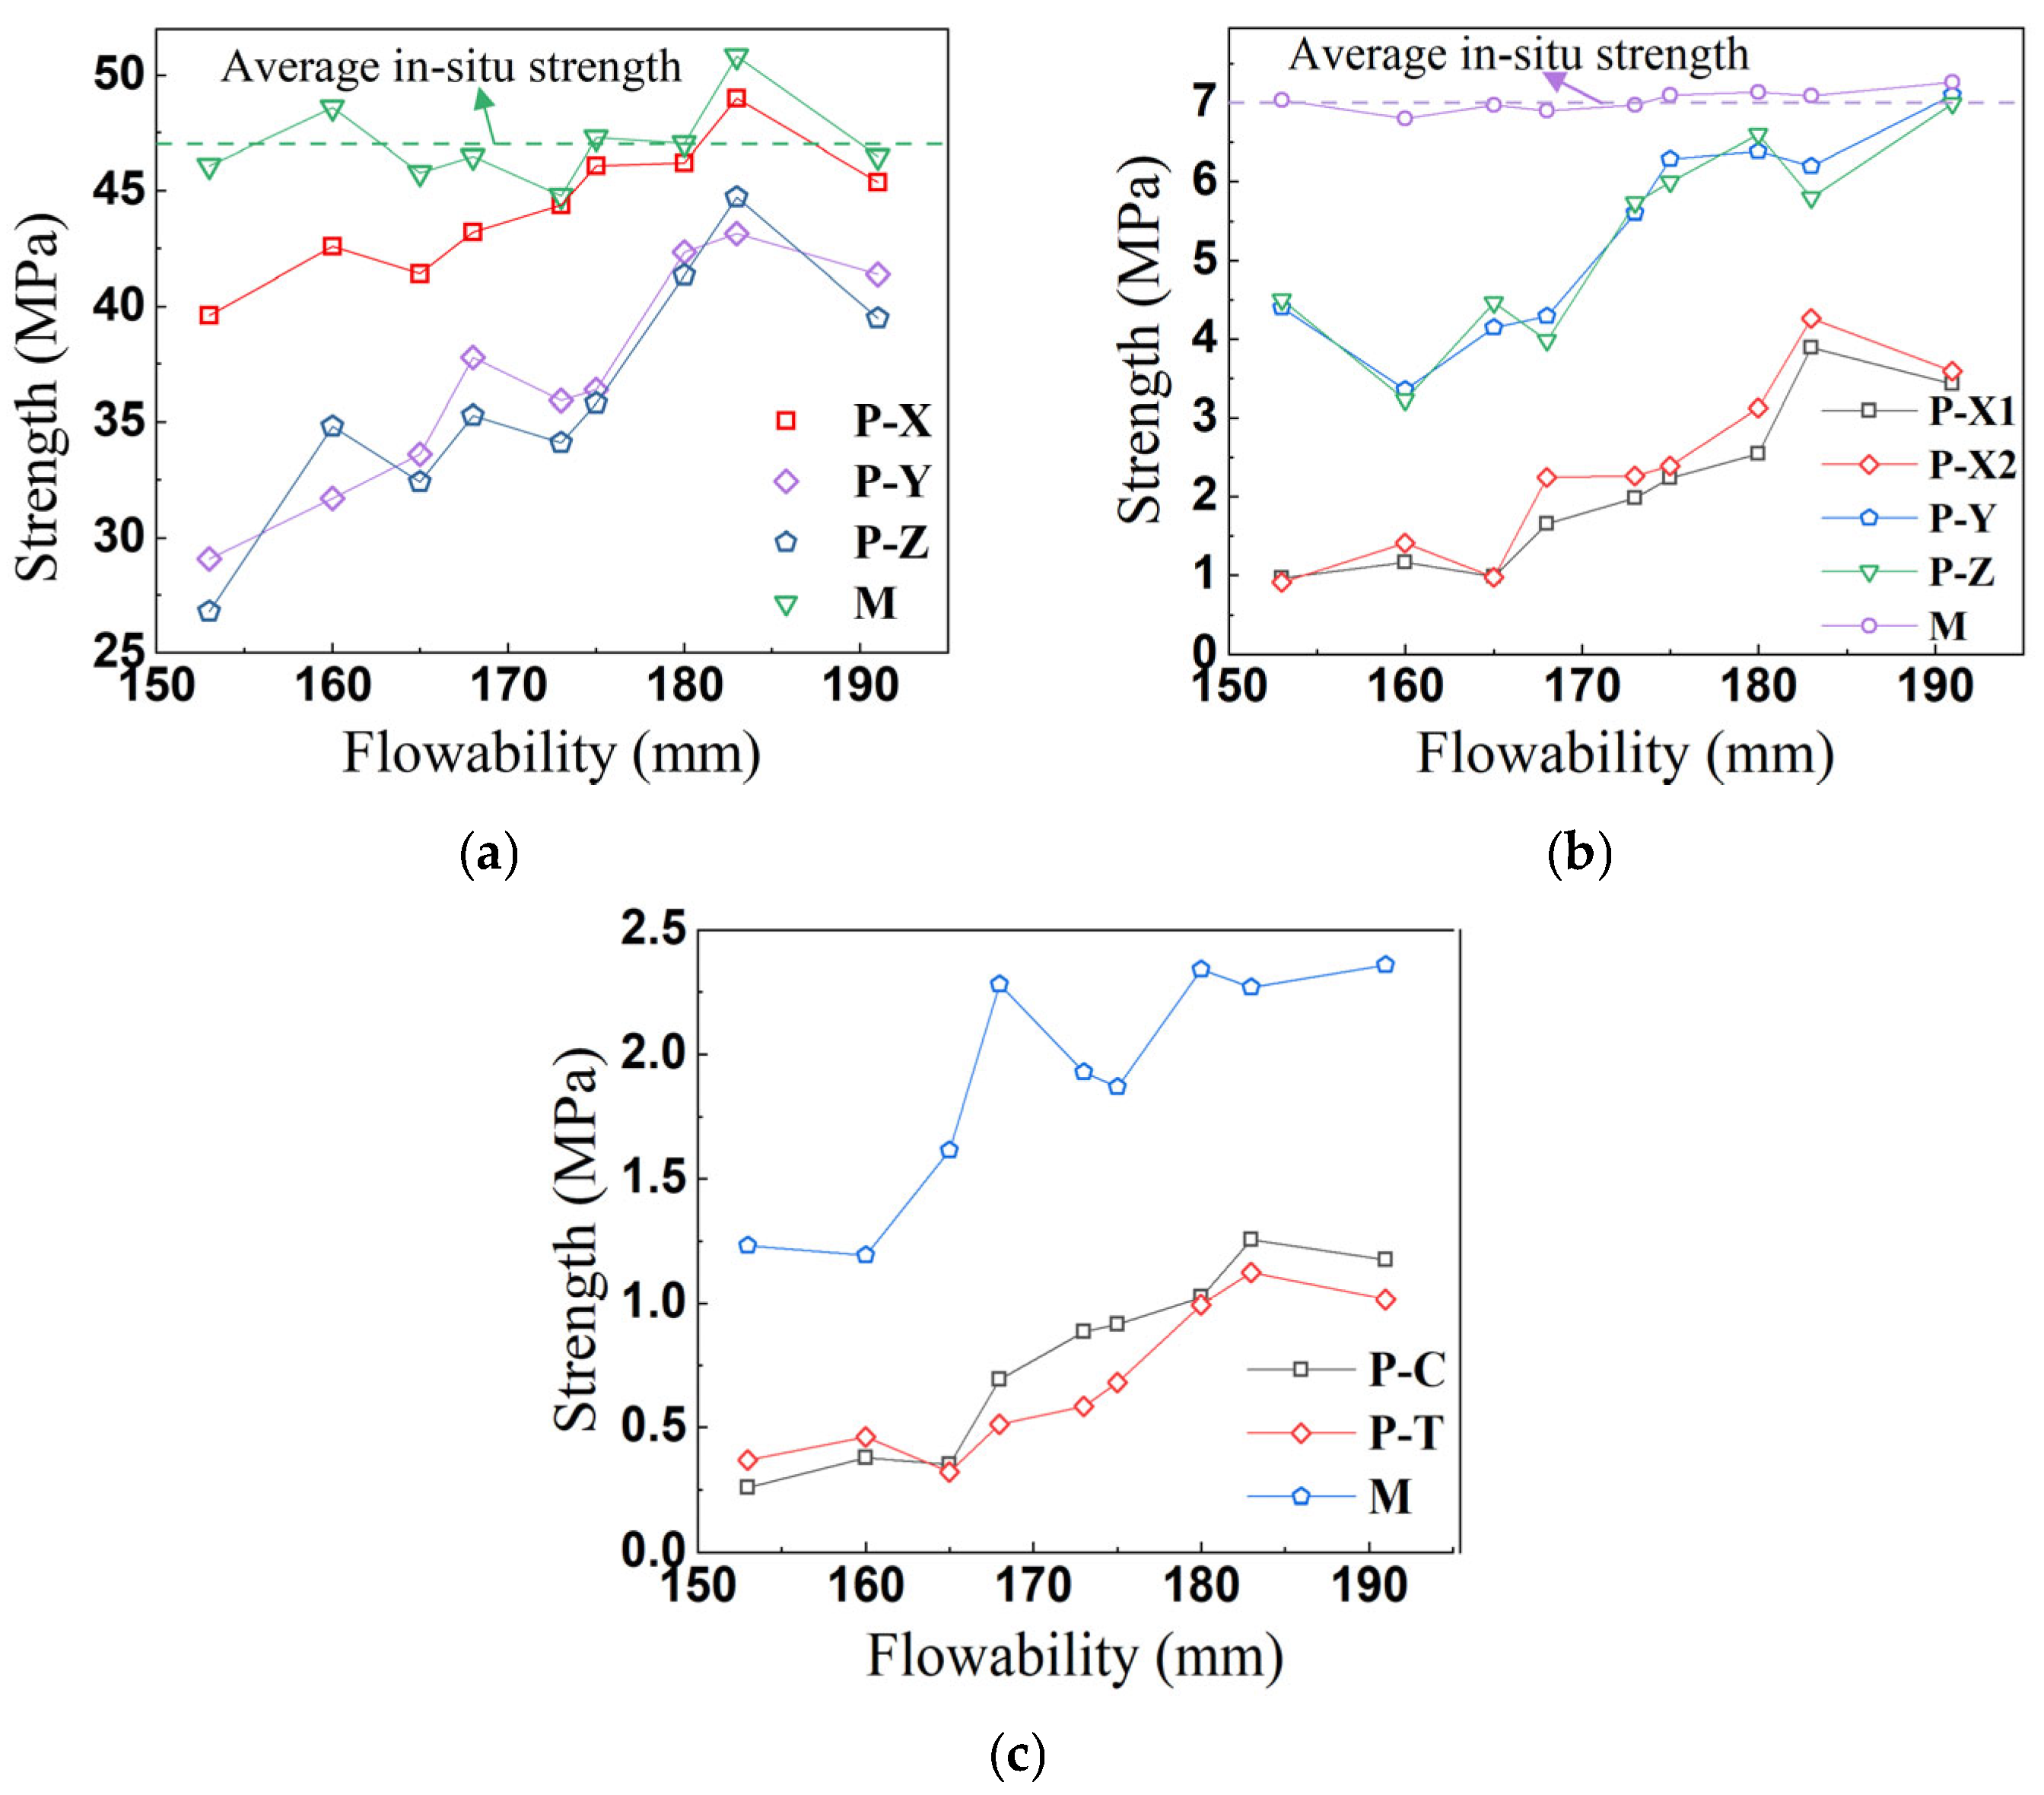
- All 3DPC specimens exhibited lower compressive, flexural, and splitting tensile strengths compared to cast concrete, along with significant anisotropy: compressive strength (X > Y > Z), flexural strength (Y ≈ Z > X2 > X1), and splitting tensile strength (C > T). With increasing flowability, reduced porosity and enhanced interfacial bonding improved the compressive strength in all directions and flexural strength in the Y/Z directions, approaching cast concrete levels. However, the flexural strength in the X1/X2 directions and interfacial splitting tensile strength remained substantially lower due to interfacial weaknesses.
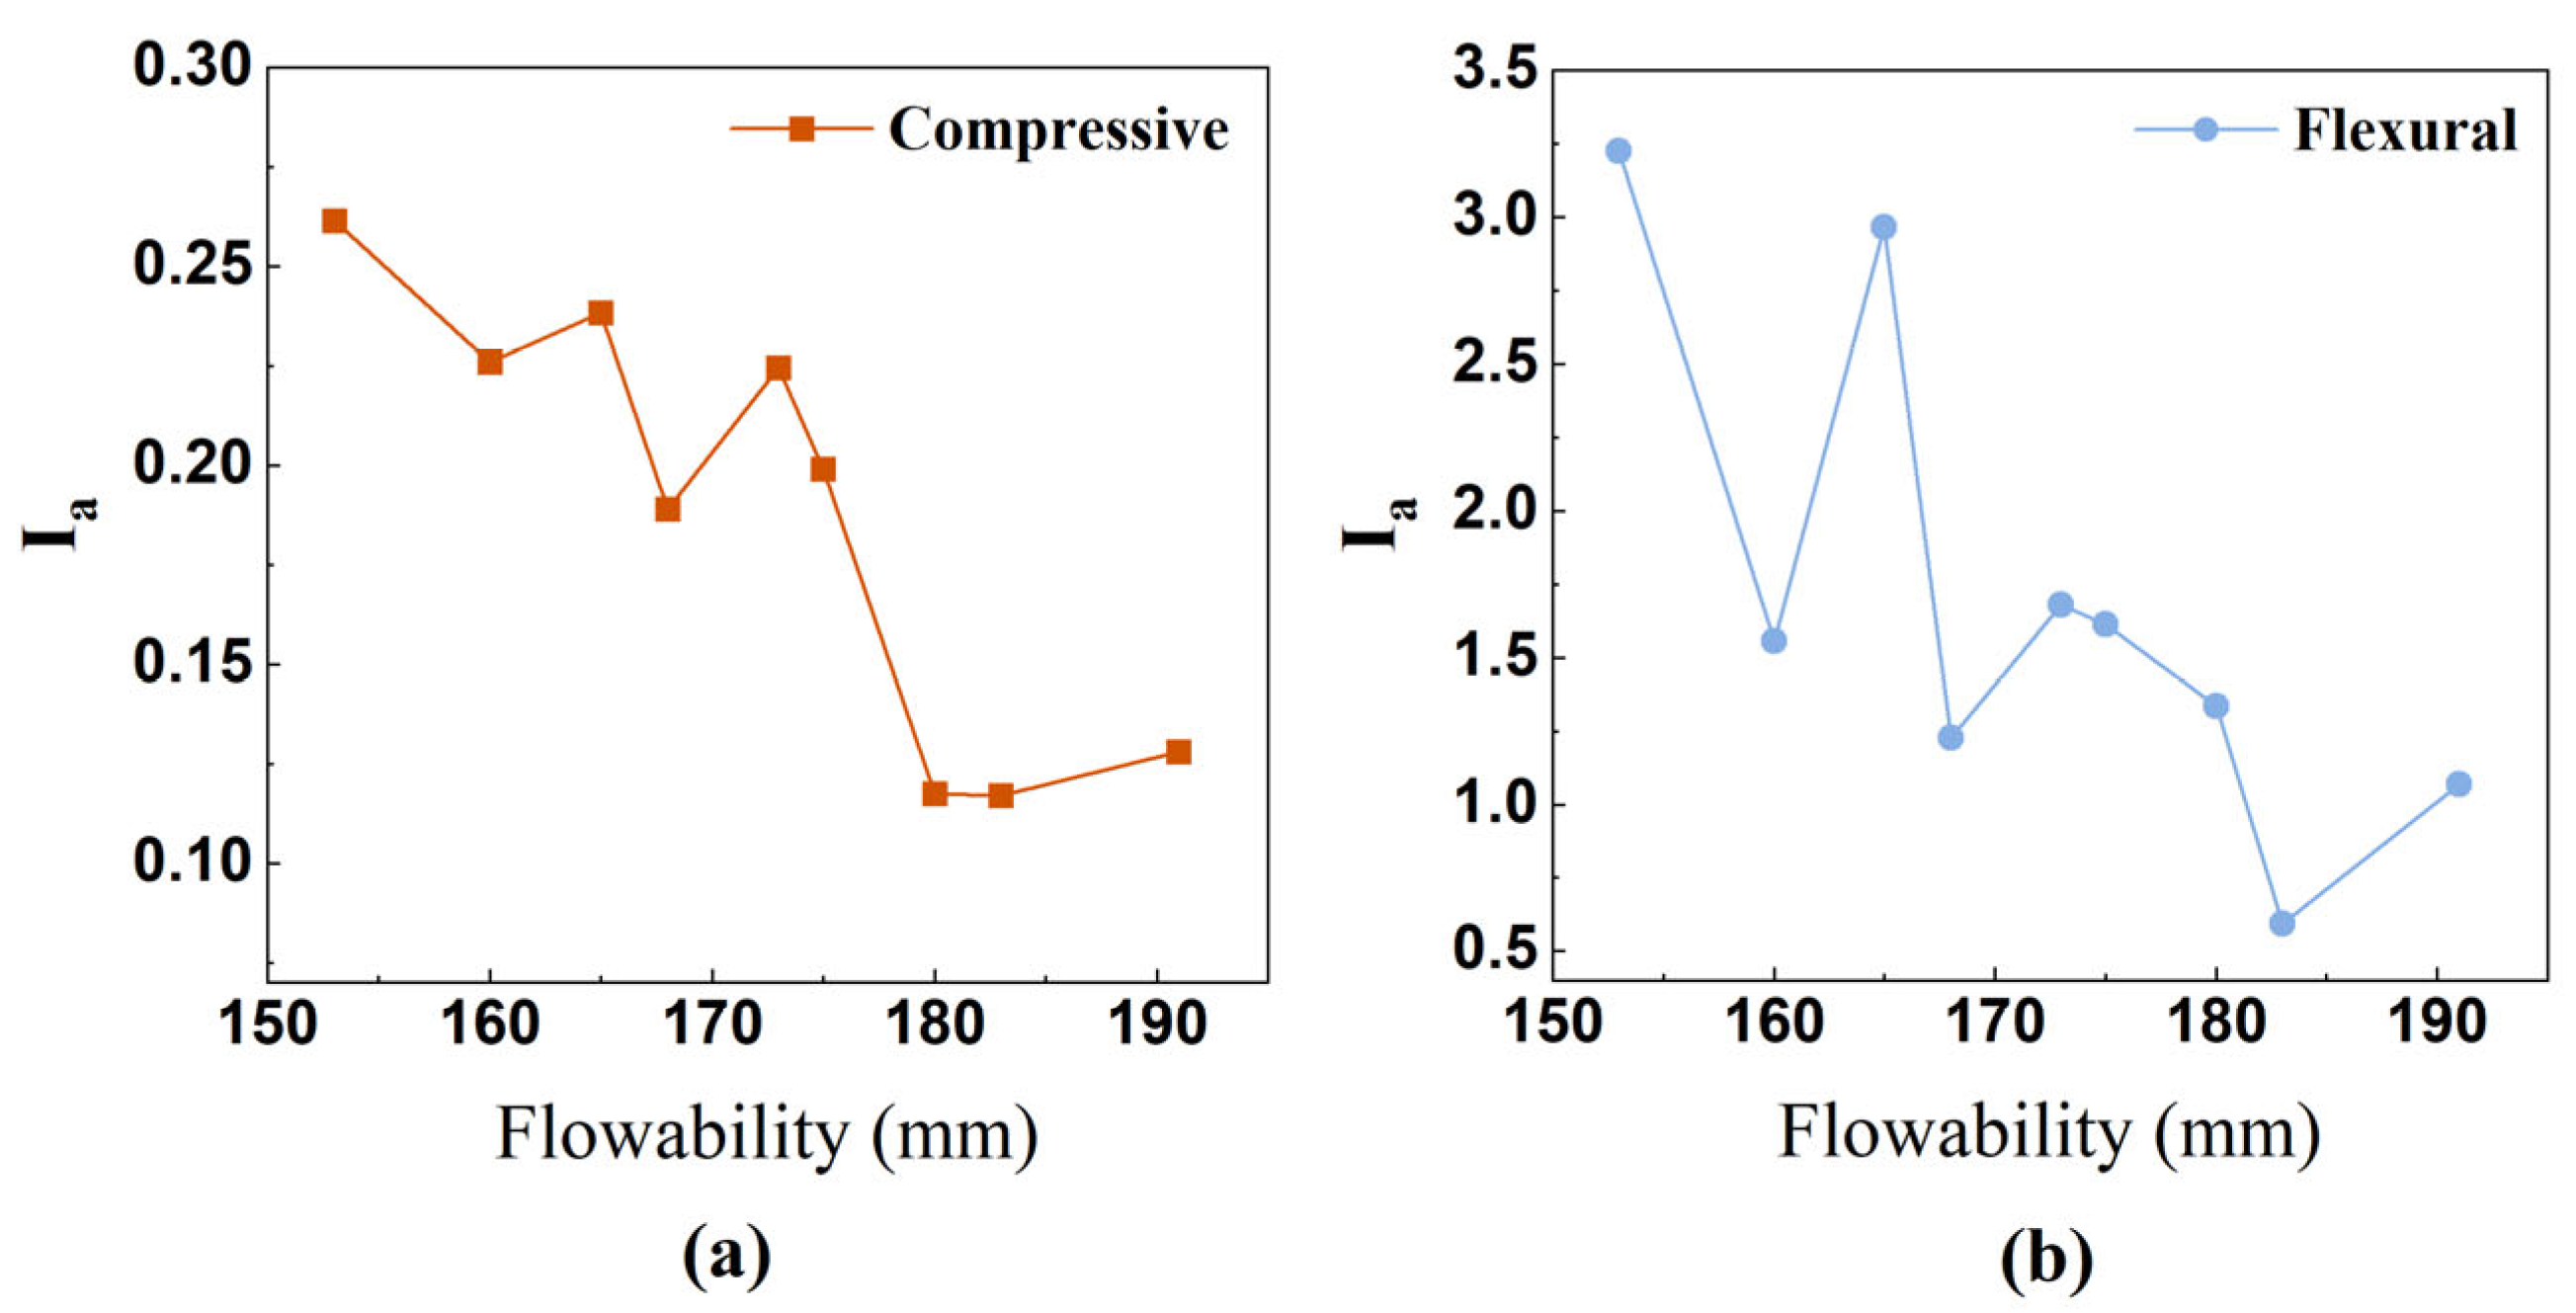
- The anisotropy coefficient decreased significantly with increasing flowability by 66.7% for compressive strength and 66.8% for flexural strength. Notably, flexural strength demonstrated 3.5–10 times greater anisotropy than compressive strength, reflecting its higher sensitivity to interfacial defects.
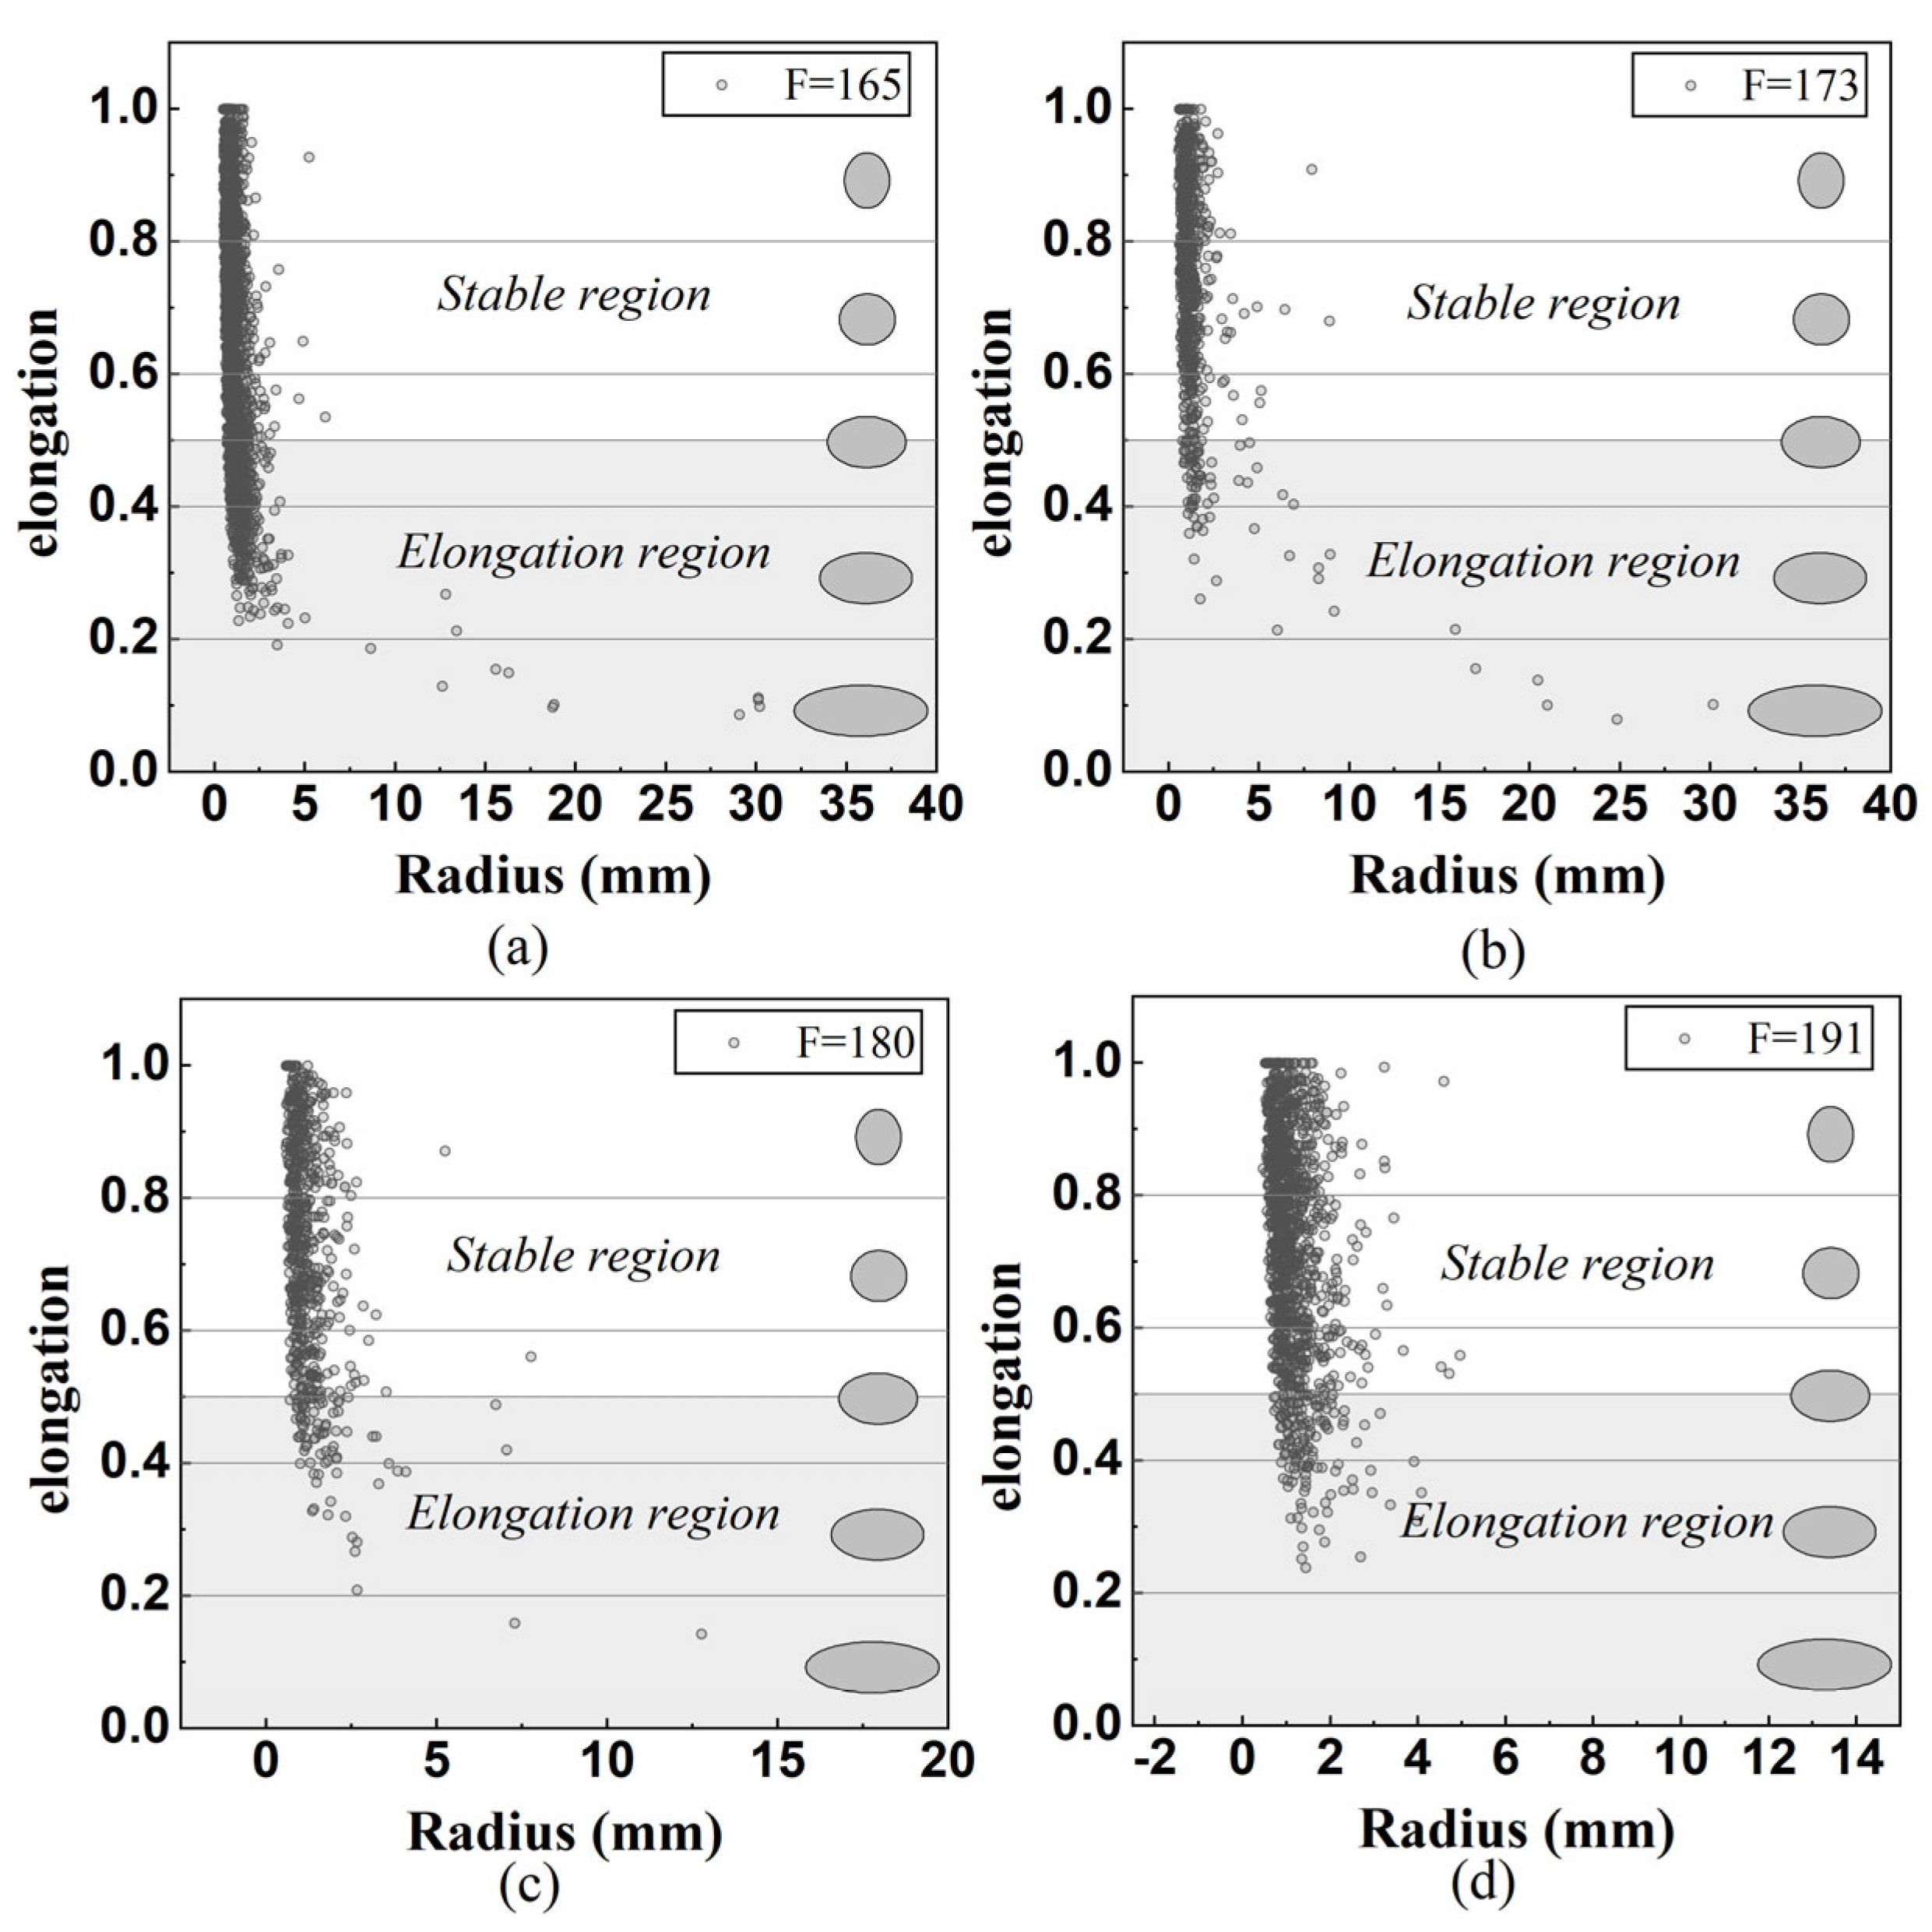
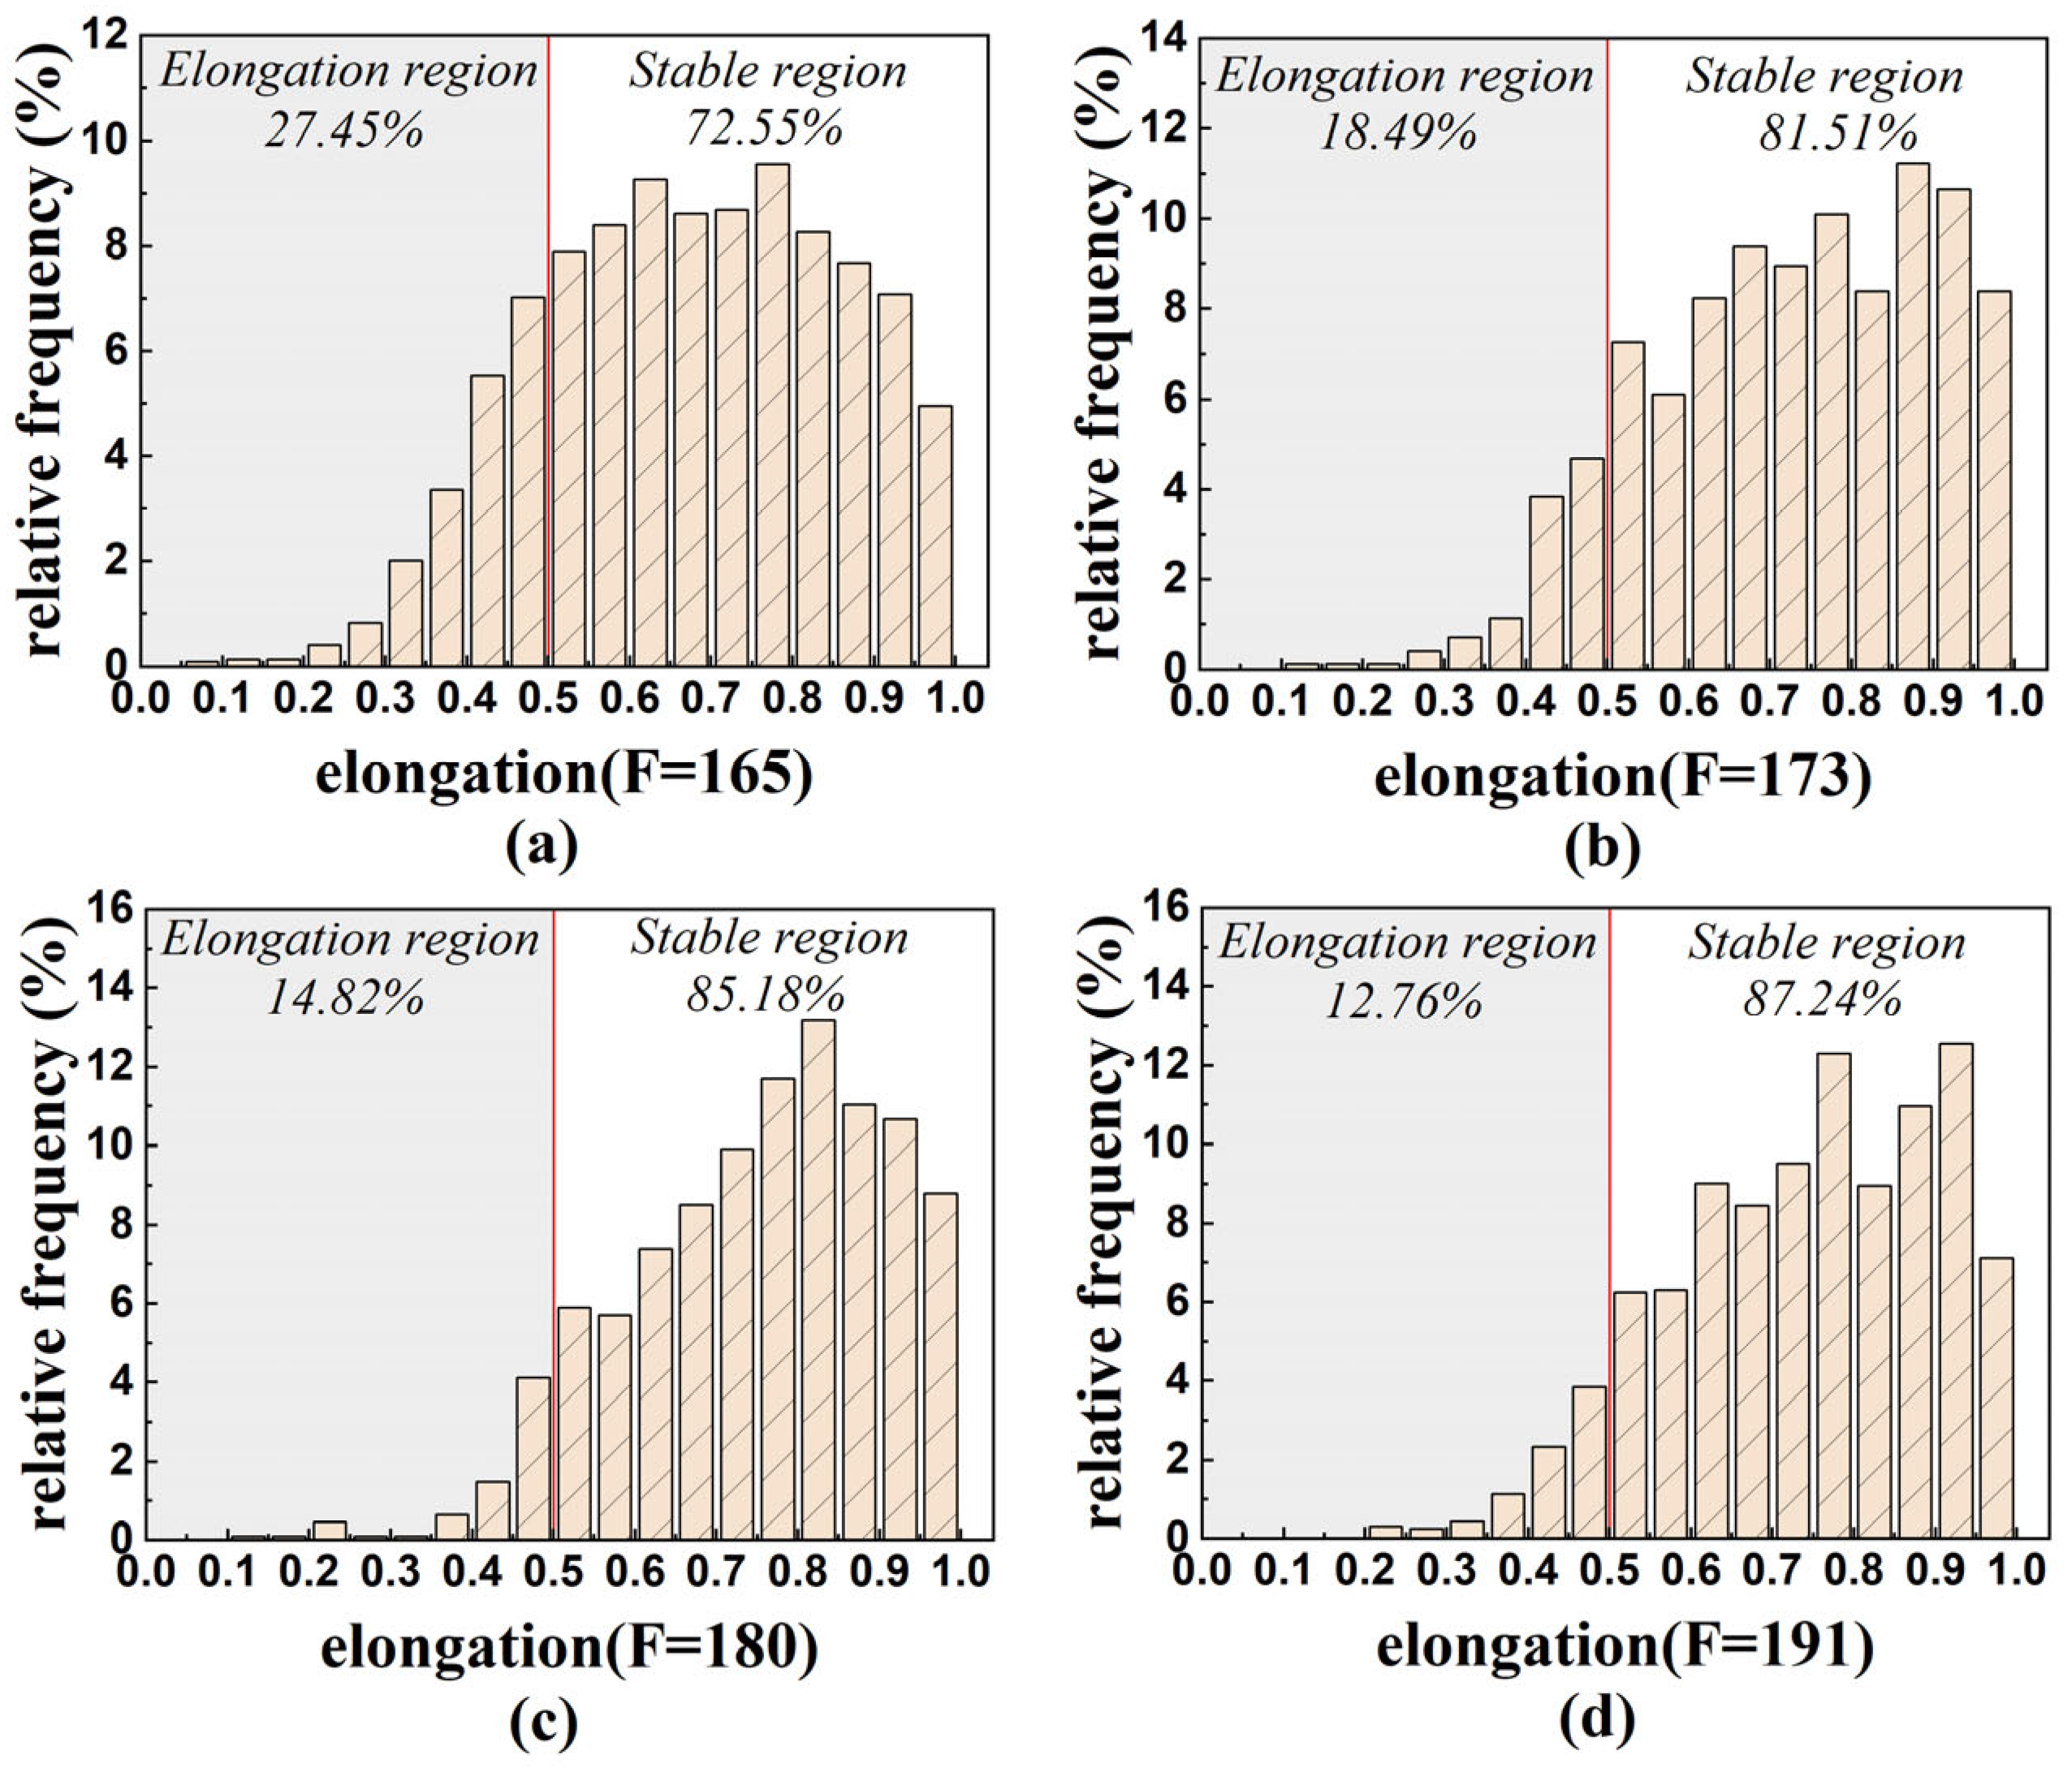
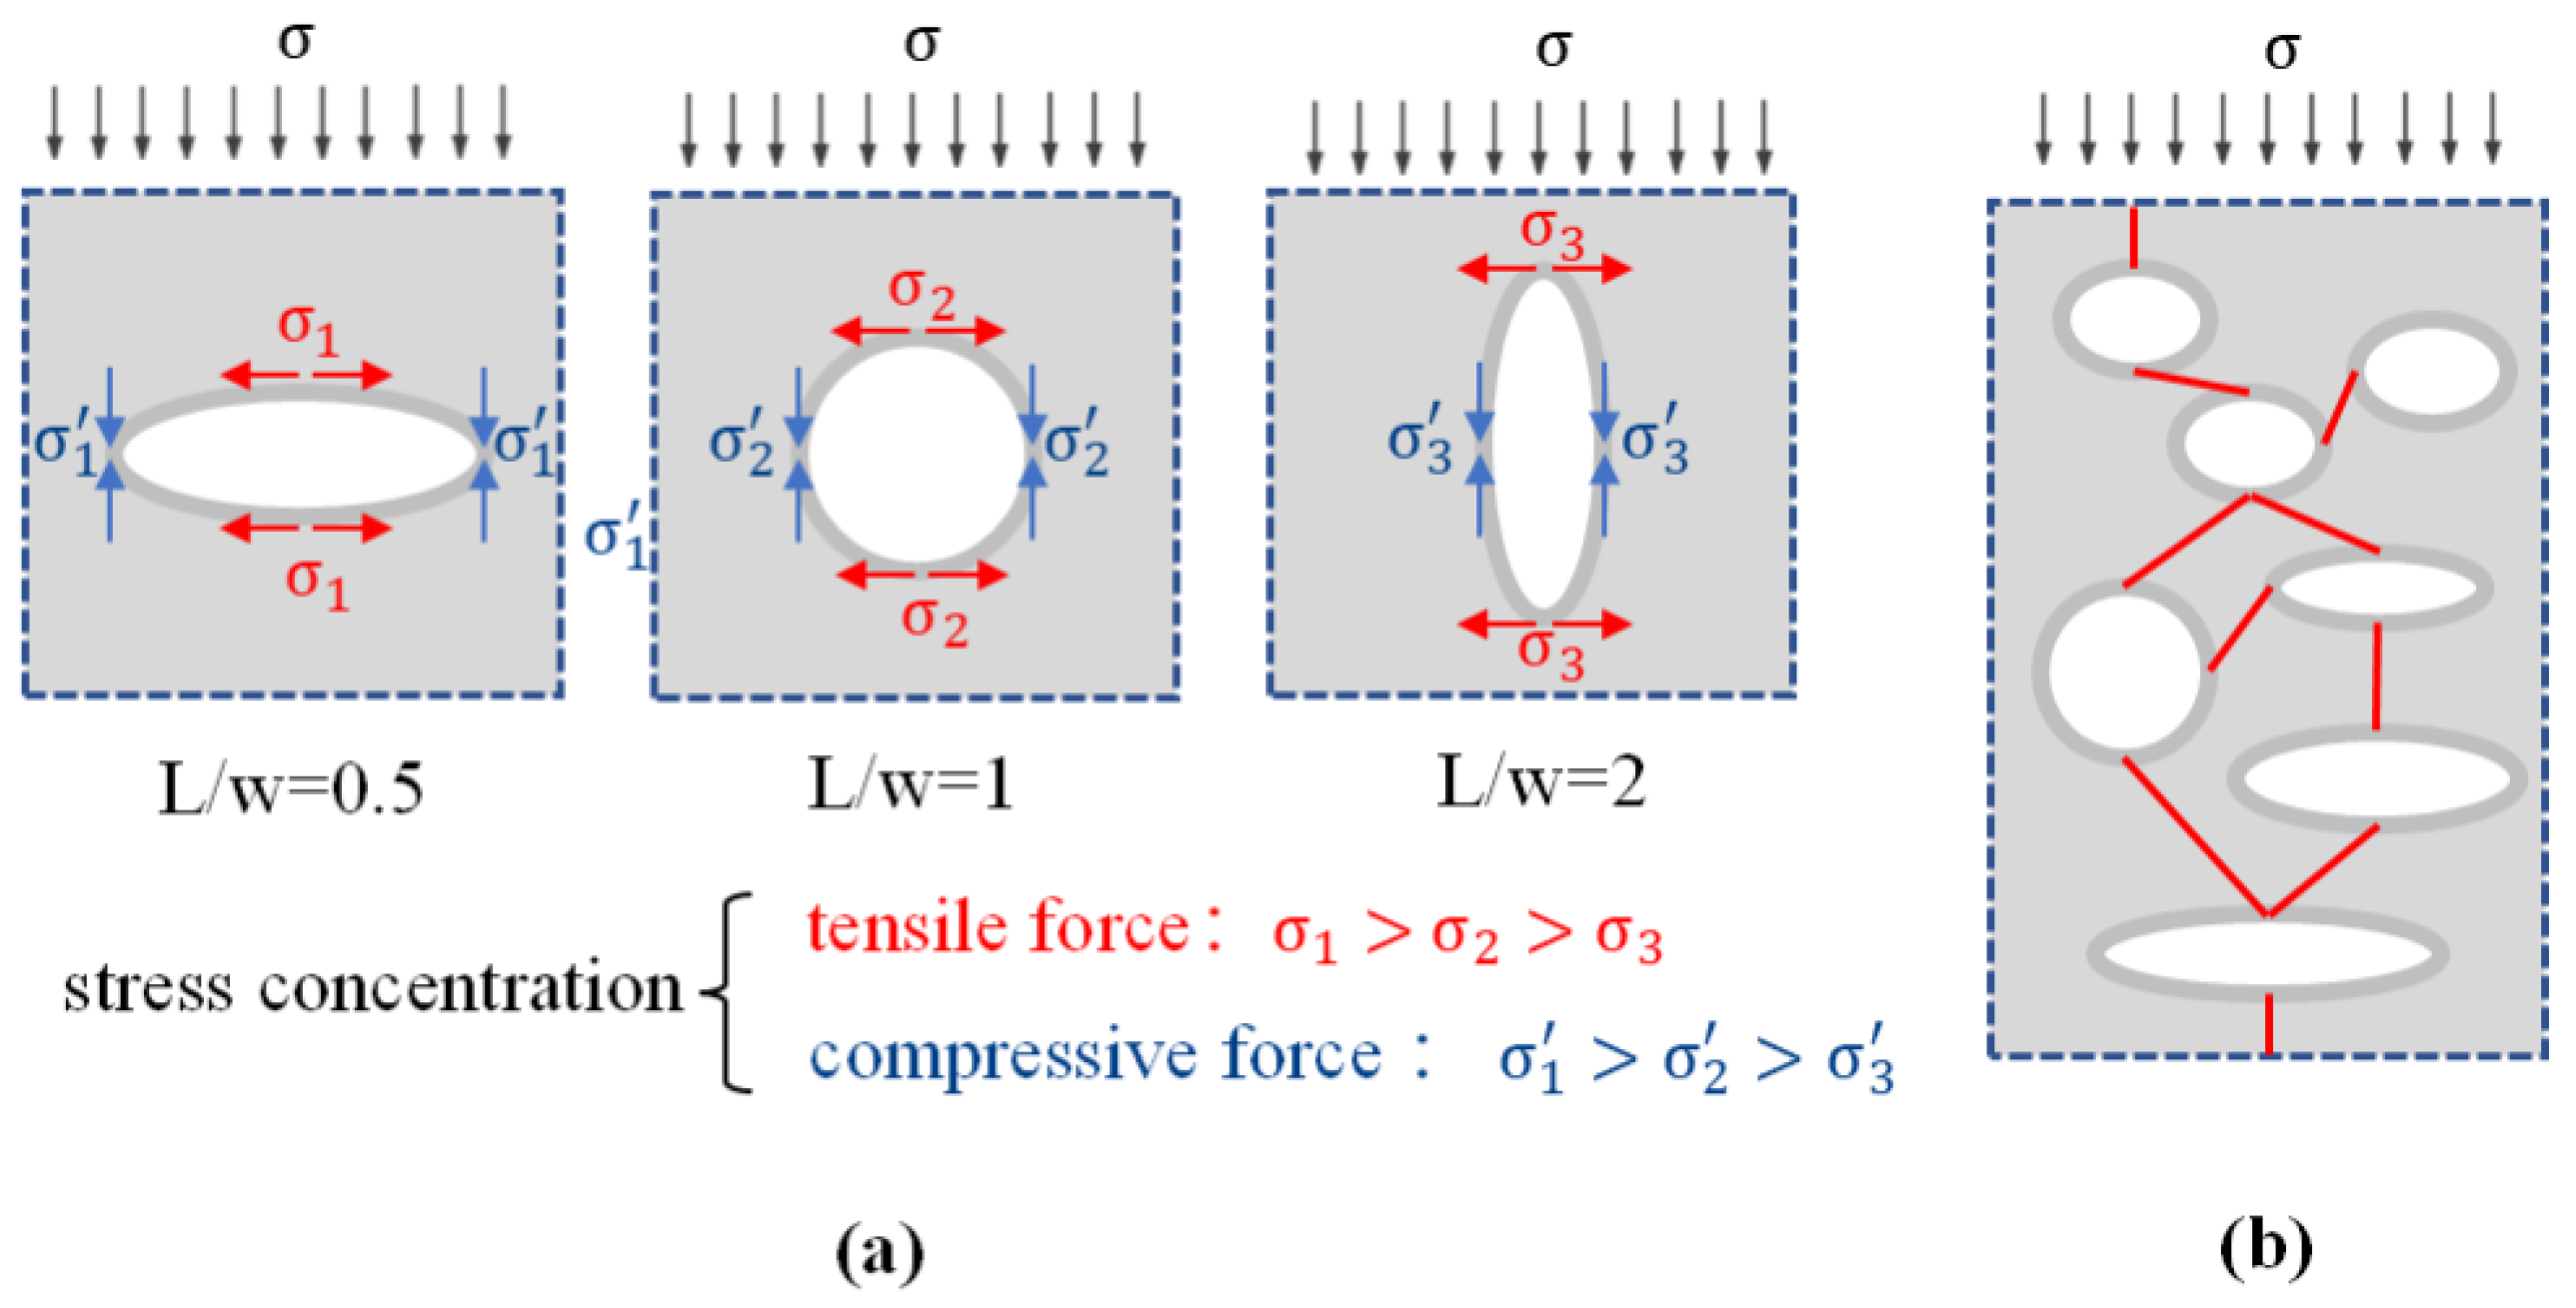
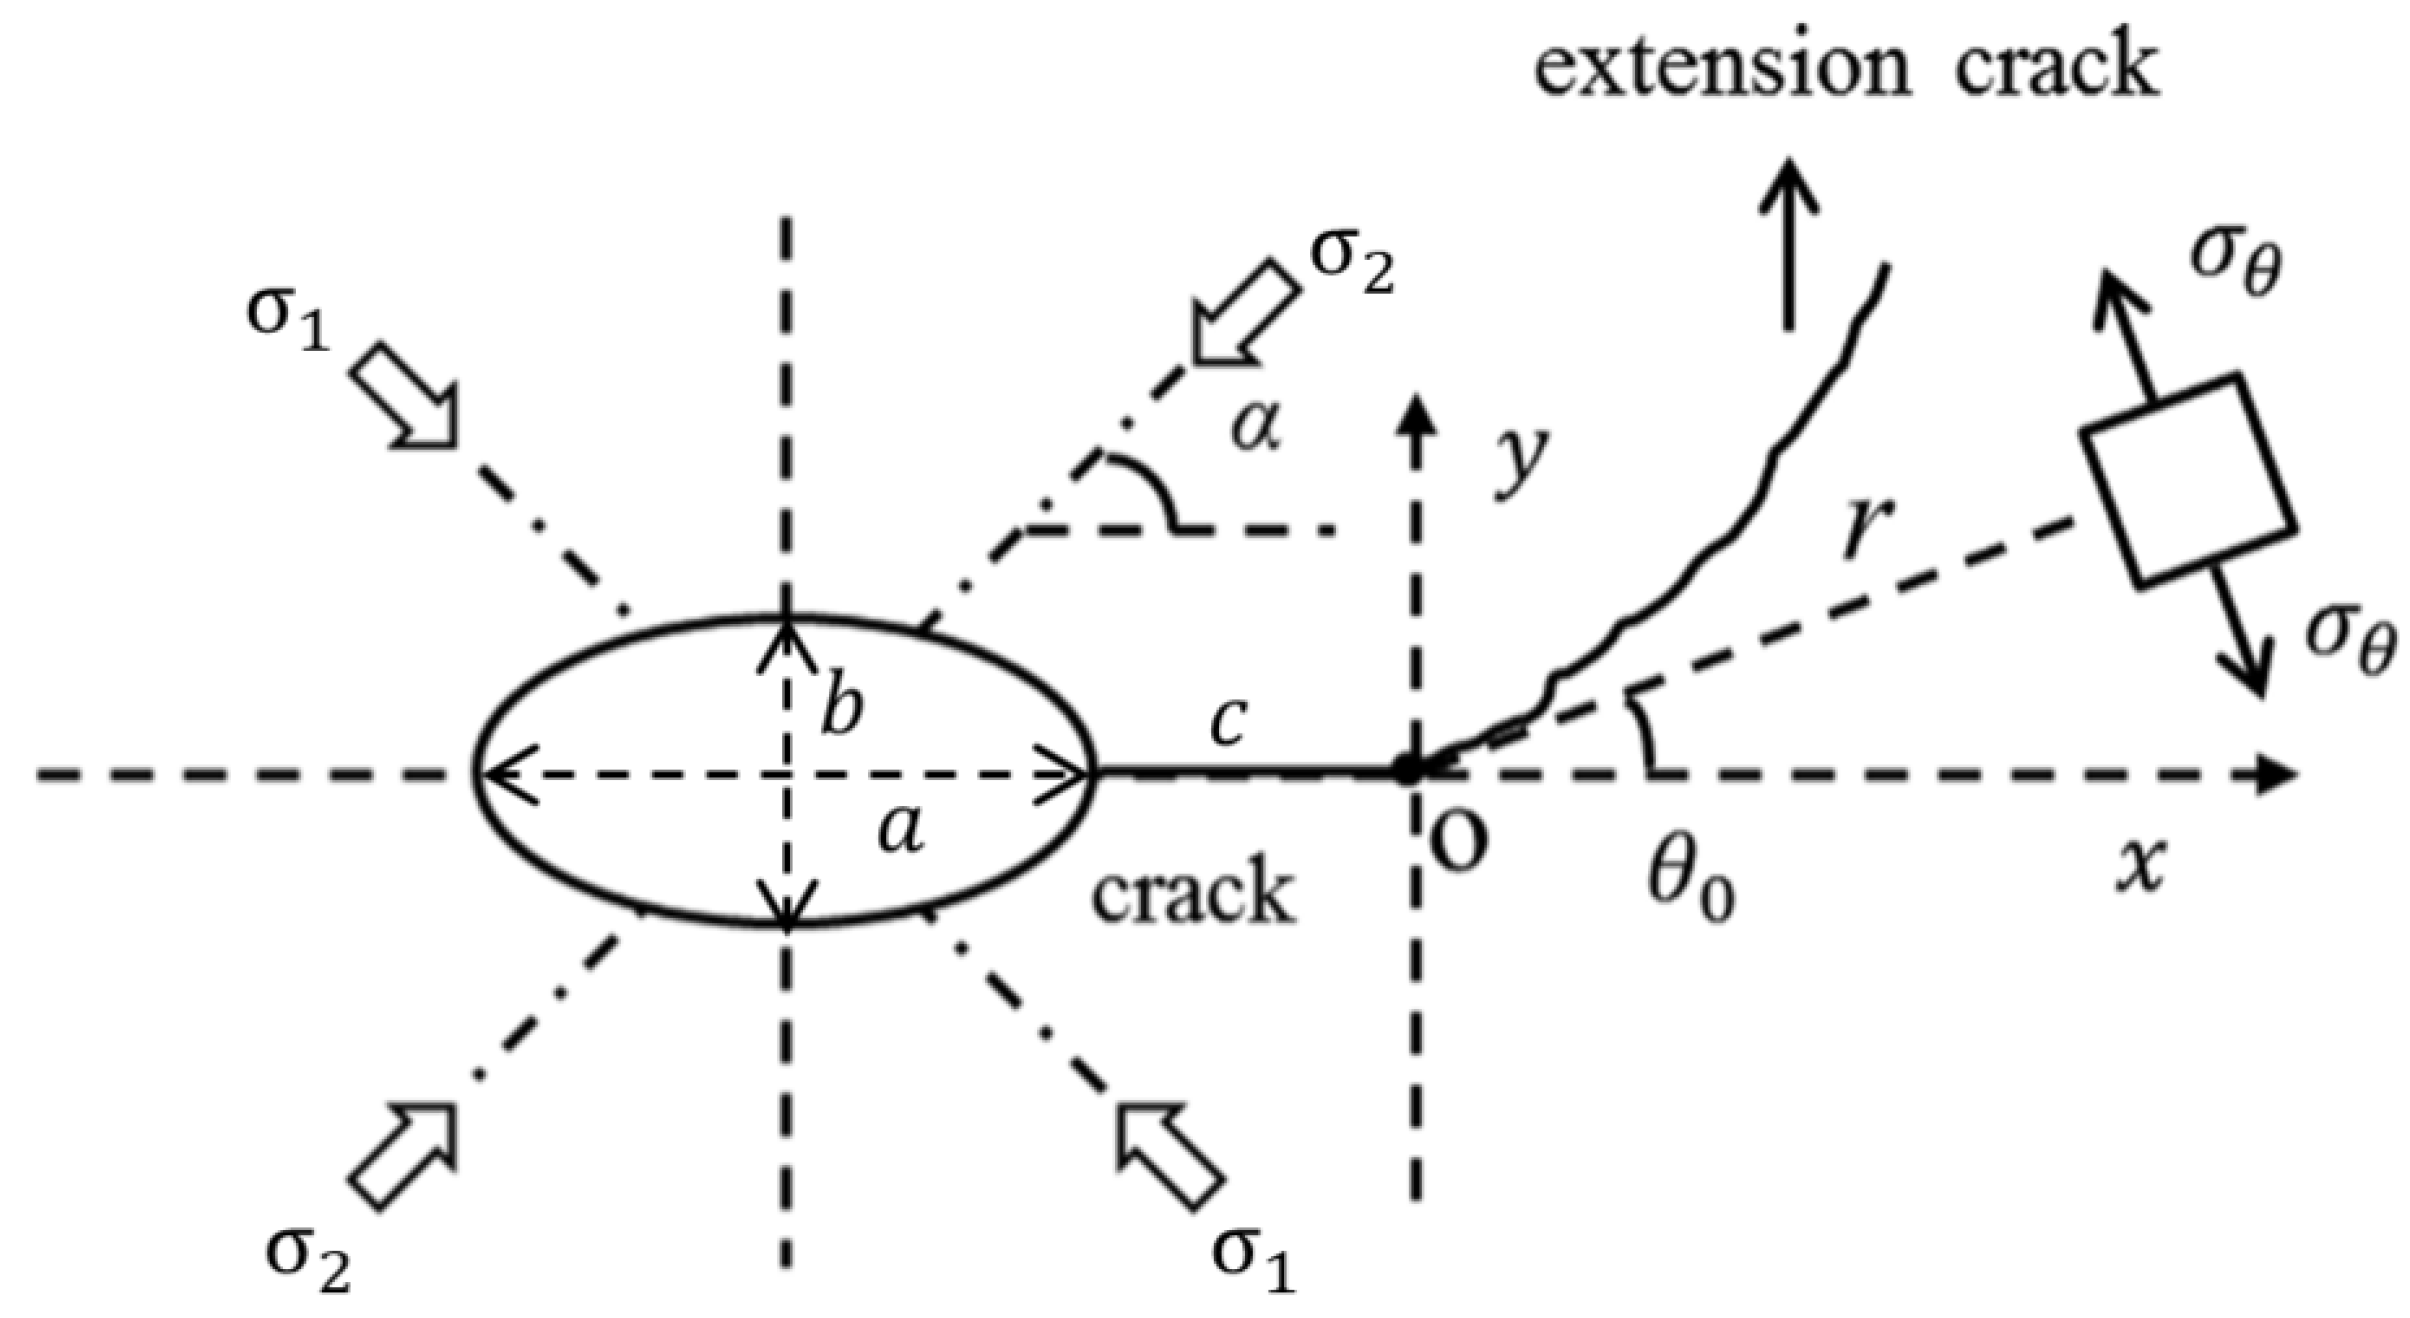
- The aspect ratio of ellipsoidal pores significantly affects the compressive performance of 3DPC, as quantified through Griffith’s fracture theory and stress intensity factor calculations. Flatter pores induce greater stress concentration and lower critical fracture stress, with X direction specimens exhibiting the most elongated pore geometries and consequently the highest compressive strength, followed by Y direction and then Z direction specimens. Notably, increased flowability promotes the transformation of elliptical pores toward more spherical morphologies with reduced flattening, thereby progressively mitigating the anisotropy in compressive performance.
Author Contributions
Funding
Institutional Review Board Statement
Informed Consent Statement
Data Availability Statement
Conflicts of Interest
References
- Chao, Z.; Deng, Z.; Ma, L.; Liu, C.; Chen, Y.; Wang, Z.; Jia, Z.; Wang, X.; Jia, L.; Chen, C.; et al. Research Progress and Application of 3D Printing Concrete. Bull. Chin. Ceram. Soc. 2021, 40, 1769–1795. [Google Scholar]
- Sun, X.; Zhou, J.; Wang, Q.; Shi, J.; Wang, H. PVA fibre reinforced high-strength cementitious composite for 3D printing: Mechanical properties and durability. Addit. Manuf. 2022, 49, 102500. [Google Scholar] [CrossRef]
- Rahul, A.V.; Mohan, M.K.; De Schutter, G.; Van Tittelboom, K. 3D printable concrete with natural and recycled coarse aggregates: Rheological, mechanical and shrinkage behaviour. Cem. Concr. Compos. 2022, 125, 104311. [Google Scholar] [CrossRef]
- Almusallam, A.A.; Maslehuddin, M.; Abdul-Waris, M.; Khan, M.M. Effect of mix proportions on plastic shrinkage cracking of concrete in hot environments. Constr. Build. Mater. 1998, 12, 353–358. [Google Scholar] [CrossRef]
- Dilawar Riaz, R.; Usman, M.; Ali, A.; Majid, U.; Faizan, M.; Jalil Malik, U. Inclusive characterization of 3D printed concrete (3DPC) in additive manufacturing: A detailed review. Constr. Build. Mater. 2023, 394, 132229. [Google Scholar] [CrossRef]
- Mechtcherine, V.; Bos, F.P.; Perrot, A.; Da Silva, W.R.L.; Nerella, V.N.; Fataei, S.; Wolfs, R.J.M.; Sonebi, M.; Roussel, N. Extrusion-based additive manufacturing with cement-based materials—Production steps, processes, and their underlying physics: A review. Cem. Concr. Res. 2020, 132, 106037. [Google Scholar] [CrossRef]
- Zhang, Y.; Zhang, Y.; She, W.; Yang, L.; Liu, G.; Yang, Y. Rheological and harden properties of the high-thixotropy 3D printing concrete. Constr. Build. Mater. 2019, 201, 278–285. [Google Scholar] [CrossRef]
- Kruger, J.; du Plessis, A.; van Zijl, G. An investigation into the porosity of extrusion-based 3D printed concrete. Addit. Manuf. 2021, 37, 101740. [Google Scholar] [CrossRef]
- Surehali, S.; Tripathi, A.; Neithalath, N. Anisotropy in Additively Manufactured Concrete Specimens under Compressive Loading—Quantification of the Effects of Layer Height and Fiber Reinforcement. Materials 2023, 16, 5488. [Google Scholar] [CrossRef]
- Jiang, Q.; Liu, Q.; Wu, S.; Zheng, H.; Sun, W. Modification effect of nanosilica and polypropylene fiber for extrusion-based 3D printing concrete: Printability and mechanical anisotropy. Addit. Manuf. 2022, 56, 102944. [Google Scholar] [CrossRef]
- Zhao, Y.; Wu, X.; Zhu, L.; Yang, Z.; Wang, Y.; Xi, X. The Influence of Polypropylene Fiber on the Working Performance and Mechanical Anisotropy of 3D Printing Concrete. J. Adv. Concr. Technol. 2021, 19, 1264–1274. [Google Scholar] [CrossRef]
- Bai, M.; Wu, Y.; Xiao, J.; Ding, T.; Yu, K. Workability and hardened properties of 3D printed engineered cementitious composites incorporating recycled sand and PE fibers. J. Build. Eng. 2023, 71, 106477. [Google Scholar] [CrossRef]
- Ma, G.; A, R.; Xie, P.; Pan, Z.; Wang, L.; Hower, J.C. 3D-printable aerogel-incorporated concrete: Anisotropy influence on physical, mechanical, and thermal insulation properties. Constr. Build. Mater. 2022, 323, 126551. [Google Scholar] [CrossRef]
- Liu, C.; Yue, S.; Zhou, C.; Sun, H.; Deng, S.; Gao, F.; Tan, Y. Anisotropic mechanical properties of extrusion-based 3D printed layered concrete. J. Mater. Sci. 2021, 56, 16851–16864. [Google Scholar] [CrossRef]
- Le, T.T.; Austin, S.A.; Lim, S.; Buswell, R.A.; Law, R.; Gibb, A.G.F.; Thorpe, T. Hardened properties of high-performance printing concrete. Cem. Concr. Res. 2012, 42, 558–566. [Google Scholar] [CrossRef]
- Ma, G.; Li, Z.; Wang, L.; Wang, F.; Sanjayan, J. Mechanical anisotropy of aligned fiber reinforced composite for extrusion-based 3D printing. Constr. Build. Mater. 2019, 202, 770–783. [Google Scholar] [CrossRef]
- Feng, P.; Meng, X.; Chen, J.; Ye, L. Mechanical properties of structures 3D printed with cementitious powders. Constr. Build. Mater. 2015, 93, 486–497. [Google Scholar] [CrossRef]
- Wang, X.; Jia, L.; Jia, Z.; Zhang, C.; Chen, Y.; Ma, L.; Wang, Z.; Deng, Z.; Banthia, N.; Zhang, Y. Optimization of 3D printing concrete with coarse aggregate via proper mix design and printing process. J. Build. Eng. 2022, 56, 104745. [Google Scholar] [CrossRef]
- Liu, C.; Wang, X.; Chen, Y.; Zhang, C.; Ma, L.; Deng, Z.; Chen, C.; Zhang, Y.; Pan, J.; Banthia, N. Influence of hydroxypropyl methylcellulose and silica fume on stability, rheological properties, and printability of 3D printing foam concrete. Cem. Concr. Compos. 2021, 122, 104158. [Google Scholar] [CrossRef]
- Gao, H.; Chen, Y.; Chen, Q.; Yu, Q. Thermal and mechanical performance of 3D printing functionally graded concrete: The role of SAC on the rheology and phase evolution of 3DPC. Constr. Build. Mater. 2023, 409, 133830. [Google Scholar] [CrossRef]
- Liu, H.; Liu, C.; Bai, G.; Wu, Y.; He, C.; Zhang, R.; Wang, Y. Influence of pore defects on the hardened properties of 3D printed concrete with coarse aggregate. Addit. Manuf. 2022, 55, 102843. [Google Scholar] [CrossRef]
- Liu, H.; Liu, C.; Wu, Y.; Bai, G.; He, C.; Yao, Y.; Zhang, R.; Wang, Y. 3D printing concrete with recycled coarse aggregates: The influence of pore structure on interlayer adhesion. Cem. Concr. Compos. 2022, 134, 104742. [Google Scholar] [CrossRef]
- Xiao, J.; Liu, H.; Ding, T. Finite element analysis on the anisotropic behavior of 3D printed concrete under compression and flexure. Addit. Manuf. 2021, 39, 101712. [Google Scholar] [CrossRef]
- Nerella, V.N.; Hempel, S.; Mechtcherine, V. Effects of layer-interface properties on mechanical performance of concrete elements produced by extrusion-based 3D-printing. Constr. Build. Mater. 2019, 205, 586–601. [Google Scholar] [CrossRef]
- Pham, L.; Tran, P.; Sanjayan, J. Steel fibres reinforced 3D printed concrete: Influence of fibre sizes on mechanical performance. Constr. Build. Mater. 2020, 250, 118785. [Google Scholar] [CrossRef]
- Sanjayan, J.G.; Nematollahi, B.; Xia, M.; Marchment, T. Effect of surface moisture on inter-layer strength of 3D printed concrete. Constr. Build. Mater. 2018, 172, 468–475. [Google Scholar] [CrossRef]
- Long, C. Investigation on the Performance of Underwater 3D Printing Concrete Materials and Compression Components. Master’s Thesis, Zhejiang University, Hangzhou, China, 2021. [Google Scholar]
- Jing, Z. Constitutive Mode of 3D Printed Concrete Material and Bending Behavior of 3D Printed Concrete Beam. Master’s Thesis, Zhejiang University, Hangzhou, China, 2021. [Google Scholar]
- Iskander, M.; Shrive, N. The effect of the shape and size of initial flaws on crack propagation in uniaxially compressed linear brittle materials. Theor. Appl. Fract. Mech. 2020, 109, 102742. [Google Scholar] [CrossRef]
- Liu, X.; Yang, S.; Huang, Y.; Cheng, J. Experimental study on the strength and fracture mechanism of sandstone containing elliptical holes and fissures under uniaxial compression. Eng. Fract. Mech. 2019, 205, 205–217. [Google Scholar] [CrossRef]
- Cui, W.; Liu, M.; Song, H.; Guan, W.; Yan, H. Influence of initial defects on deformation and failure of concrete under uniaxial compression. Eng. Fract. Mech. 2020, 234, 107106. [Google Scholar] [CrossRef]
- Wang, H.; Shen, W.; Sun, X.; Song, X.; Lin, X. Influences of particle size on the performance of 3D printed coarse aggregate concrete: Experiment, microstructure, and mechanism analysis. Constr. Build. Mater. 2025, 463, 140059. [Google Scholar] [CrossRef]
- Zhou, Y. Experimental study on the effect caused by water reducing agent on concrete. Concrete 2011, 86–88, 91. [Google Scholar] [CrossRef]
- Zhang, C.; Hou, Z.; Chen, C.; Zhang, Y.; Mechtcherine, V.; Sun, Z. Design of 3D printable concrete based on the relationship between flowability of cement paste and optimum aggregate content. Cem. Concr. Comp. 2019, 104, 103406. [Google Scholar] [CrossRef]
- Xiaoyan, S.; Long, C.; Hailong, W.; Jing, Z. Mix Proportion Optimization of 3D Printing Concrete for Underwater Intelligent Construction. Mater. Rep. 2022, 36, 21050230–21050239. [Google Scholar]
- T/CBMF 183—2022/T/CCPA 33—2022; Test Methods for Basic Mechanical Properties of 3D Printed Concrete. Group Standards of the People’s Republic of China: Beijing, China, 2022.
- GB/T 50081-2019; Standard for Test Methods of Concrete Physical and Mechanical Properties. Ministry of Housing and Urban-Rural Development: Beijing, China, 2019.
- Brisard, S.; Serdar, M.; Monteiro, P.J.M. Multiscale X-ray tomography of cementitious materials: A review. Cem. Concr. Res. 2020, 128, 105824. [Google Scholar] [CrossRef]
- Liu, C.; Liu, H.; Wu, Y.; Wu, J.; Ding, S. Effect of X-ray CT characterized pore structure on the freeze–thaw resistance of 3D printed concrete with recycled coarse aggregate. Constr. Build. Mater. 2025, 469, 140492. [Google Scholar] [CrossRef]
- Chen, Y.; Zhang, Y.; Xie, Y.; Zhang, Z.; Banthia, N. Unraveling pore structure alternations in 3D-printed geopolymer concrete and corresponding impacts on macro-properties. Addit. Manuf. 2022, 59, 103137. [Google Scholar] [CrossRef]
- Cao, C.; Hu, Z.; Chai, Y.; Li, Q.; Li, W.; Pan, H.; Li, Y. Investigations on Interface Shear-stress Transfer Behavior of Concrete Composite Slabs with Lattice Girders. KSCE J. Civ. Eng. 2024, 28, 4457–4472. [Google Scholar] [CrossRef]
- Davis, T.; Healy, D.; Bubeck, A.; Walker, R. Stress concentrations around voids in three dimensions: The roots of failure. J. Struct. Geol. 2017, 102, 193–207. [Google Scholar] [CrossRef]
- Sun, X.; Wang, Q.; Wang, H.; Chen, L. Influence of multi-walled nanotubes on the fresh and hardened properties of a 3D printing PVA mortar ink. Constr. Build. Mater. 2020, 247, 118590. [Google Scholar] [CrossRef]
- Ye, J.; Cui, C.; Yu, J.; Yu, K.; Dong, F. Effect of polyethylene fiber content on workability and mechanical-anisotropic properties of 3D printed ultra-high ductile concrete. Constr. Build. Mater. 2021, 281, 122586. [Google Scholar] [CrossRef]
- Griffith, A.A. The Phenomena of Rupture and Flow in Solids. Philos. Trans. R. Soc. Lond. Ser. A 1921, 221, 163–198. [Google Scholar]
- van den Heever, M.; du Plessis, A.; Kruger, J.; van Zijl, G. Evaluating the effects of porosity on the mechanical properties of extrusion-based 3D printed concrete. Cem. Concr. Res. 2022, 153, 106695. [Google Scholar] [CrossRef]
- Dong, W.; Wu, Z.; Tang, X.; Zhou, X. A comparative study on stress intensity factor-based criteria for the prediction of mixed mode I-II crack propagation in concrete. Eng. Fract. Mech. 2018, 197, 217–235. [Google Scholar] [CrossRef]
- Huang, J.; Wang, H.; Zhou, L.; Zhu, Z.; Deng, Z.; Deng, A. Analysis of stress intensity factor for a crack emanating from elliptical hole subjected to compressive stress and shear stress. Theor. Appl. Fract. Mech. 2022, 120, 103413. [Google Scholar] [CrossRef]


| Cement | Silica Fume | Natural River Sand | Water | PCE-SP (%) | Tartaric Acid | Defoamer (%) | Thixotropic Agent (%) | PP Fiber (%) |
|---|---|---|---|---|---|---|---|---|
| 1 | 0.11 | 1.11 | 0.39 | 0.5–1 | 0.01 | 0.22 | 0.11 | 0.56 |
| Type | Loading Direction | |||
|---|---|---|---|---|
X  | Y  | Z  | Cast | |
| Low flowability | 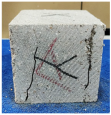 | 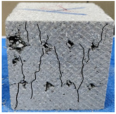 | 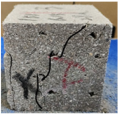 | 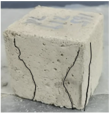 |
| Medium flowability | 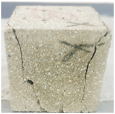 | 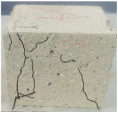 | 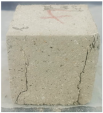 |  |
| High flowability |  | 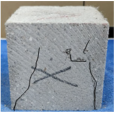 | 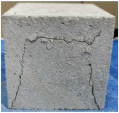 | 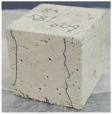 |
Disclaimer/Publisher’s Note: The statements, opinions and data contained in all publications are solely those of the individual author(s) and contributor(s) and not of MDPI and/or the editor(s). MDPI and/or the editor(s) disclaim responsibility for any injury to people or property resulting from any ideas, methods, instructions or products referred to in the content. |
© 2025 by the authors. Licensee MDPI, Basel, Switzerland. This article is an open access article distributed under the terms and conditions of the Creative Commons Attribution (CC BY) license (https://creativecommons.org/licenses/by/4.0/).
Share and Cite
Song, X.; Xu, Q.; Wang, H.; Sun, X.; Xue, F. Flowability-Dependent Anisotropic Mechanical Properties of 3D Printing Concrete: Experimental and Theoretical Study. Appl. Sci. 2025, 15, 6070. https://doi.org/10.3390/app15116070
Song X, Xu Q, Wang H, Sun X, Xue F. Flowability-Dependent Anisotropic Mechanical Properties of 3D Printing Concrete: Experimental and Theoretical Study. Applied Sciences. 2025; 15(11):6070. https://doi.org/10.3390/app15116070
Chicago/Turabian StyleSong, Xinlei, Quanbiao Xu, Hailong Wang, Xiaoyan Sun, and Feng Xue. 2025. "Flowability-Dependent Anisotropic Mechanical Properties of 3D Printing Concrete: Experimental and Theoretical Study" Applied Sciences 15, no. 11: 6070. https://doi.org/10.3390/app15116070
APA StyleSong, X., Xu, Q., Wang, H., Sun, X., & Xue, F. (2025). Flowability-Dependent Anisotropic Mechanical Properties of 3D Printing Concrete: Experimental and Theoretical Study. Applied Sciences, 15(11), 6070. https://doi.org/10.3390/app15116070