
A Novel Moving Load Identification Method for Continuous Rigid-Frame Bridges Using a Field-Based Displacement Influence Line


Abstract
1. Introduction
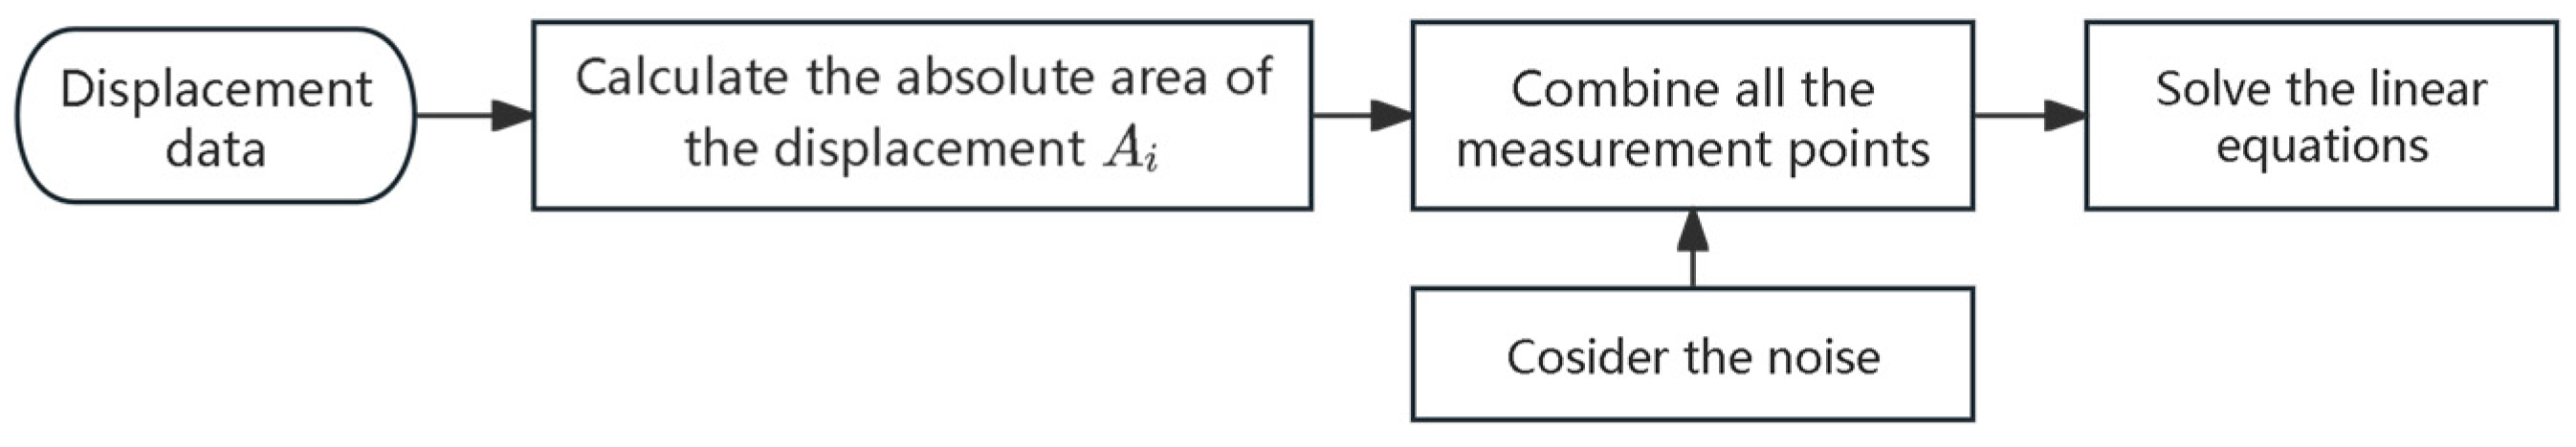
2. Methodology
3. Numerical Simulations
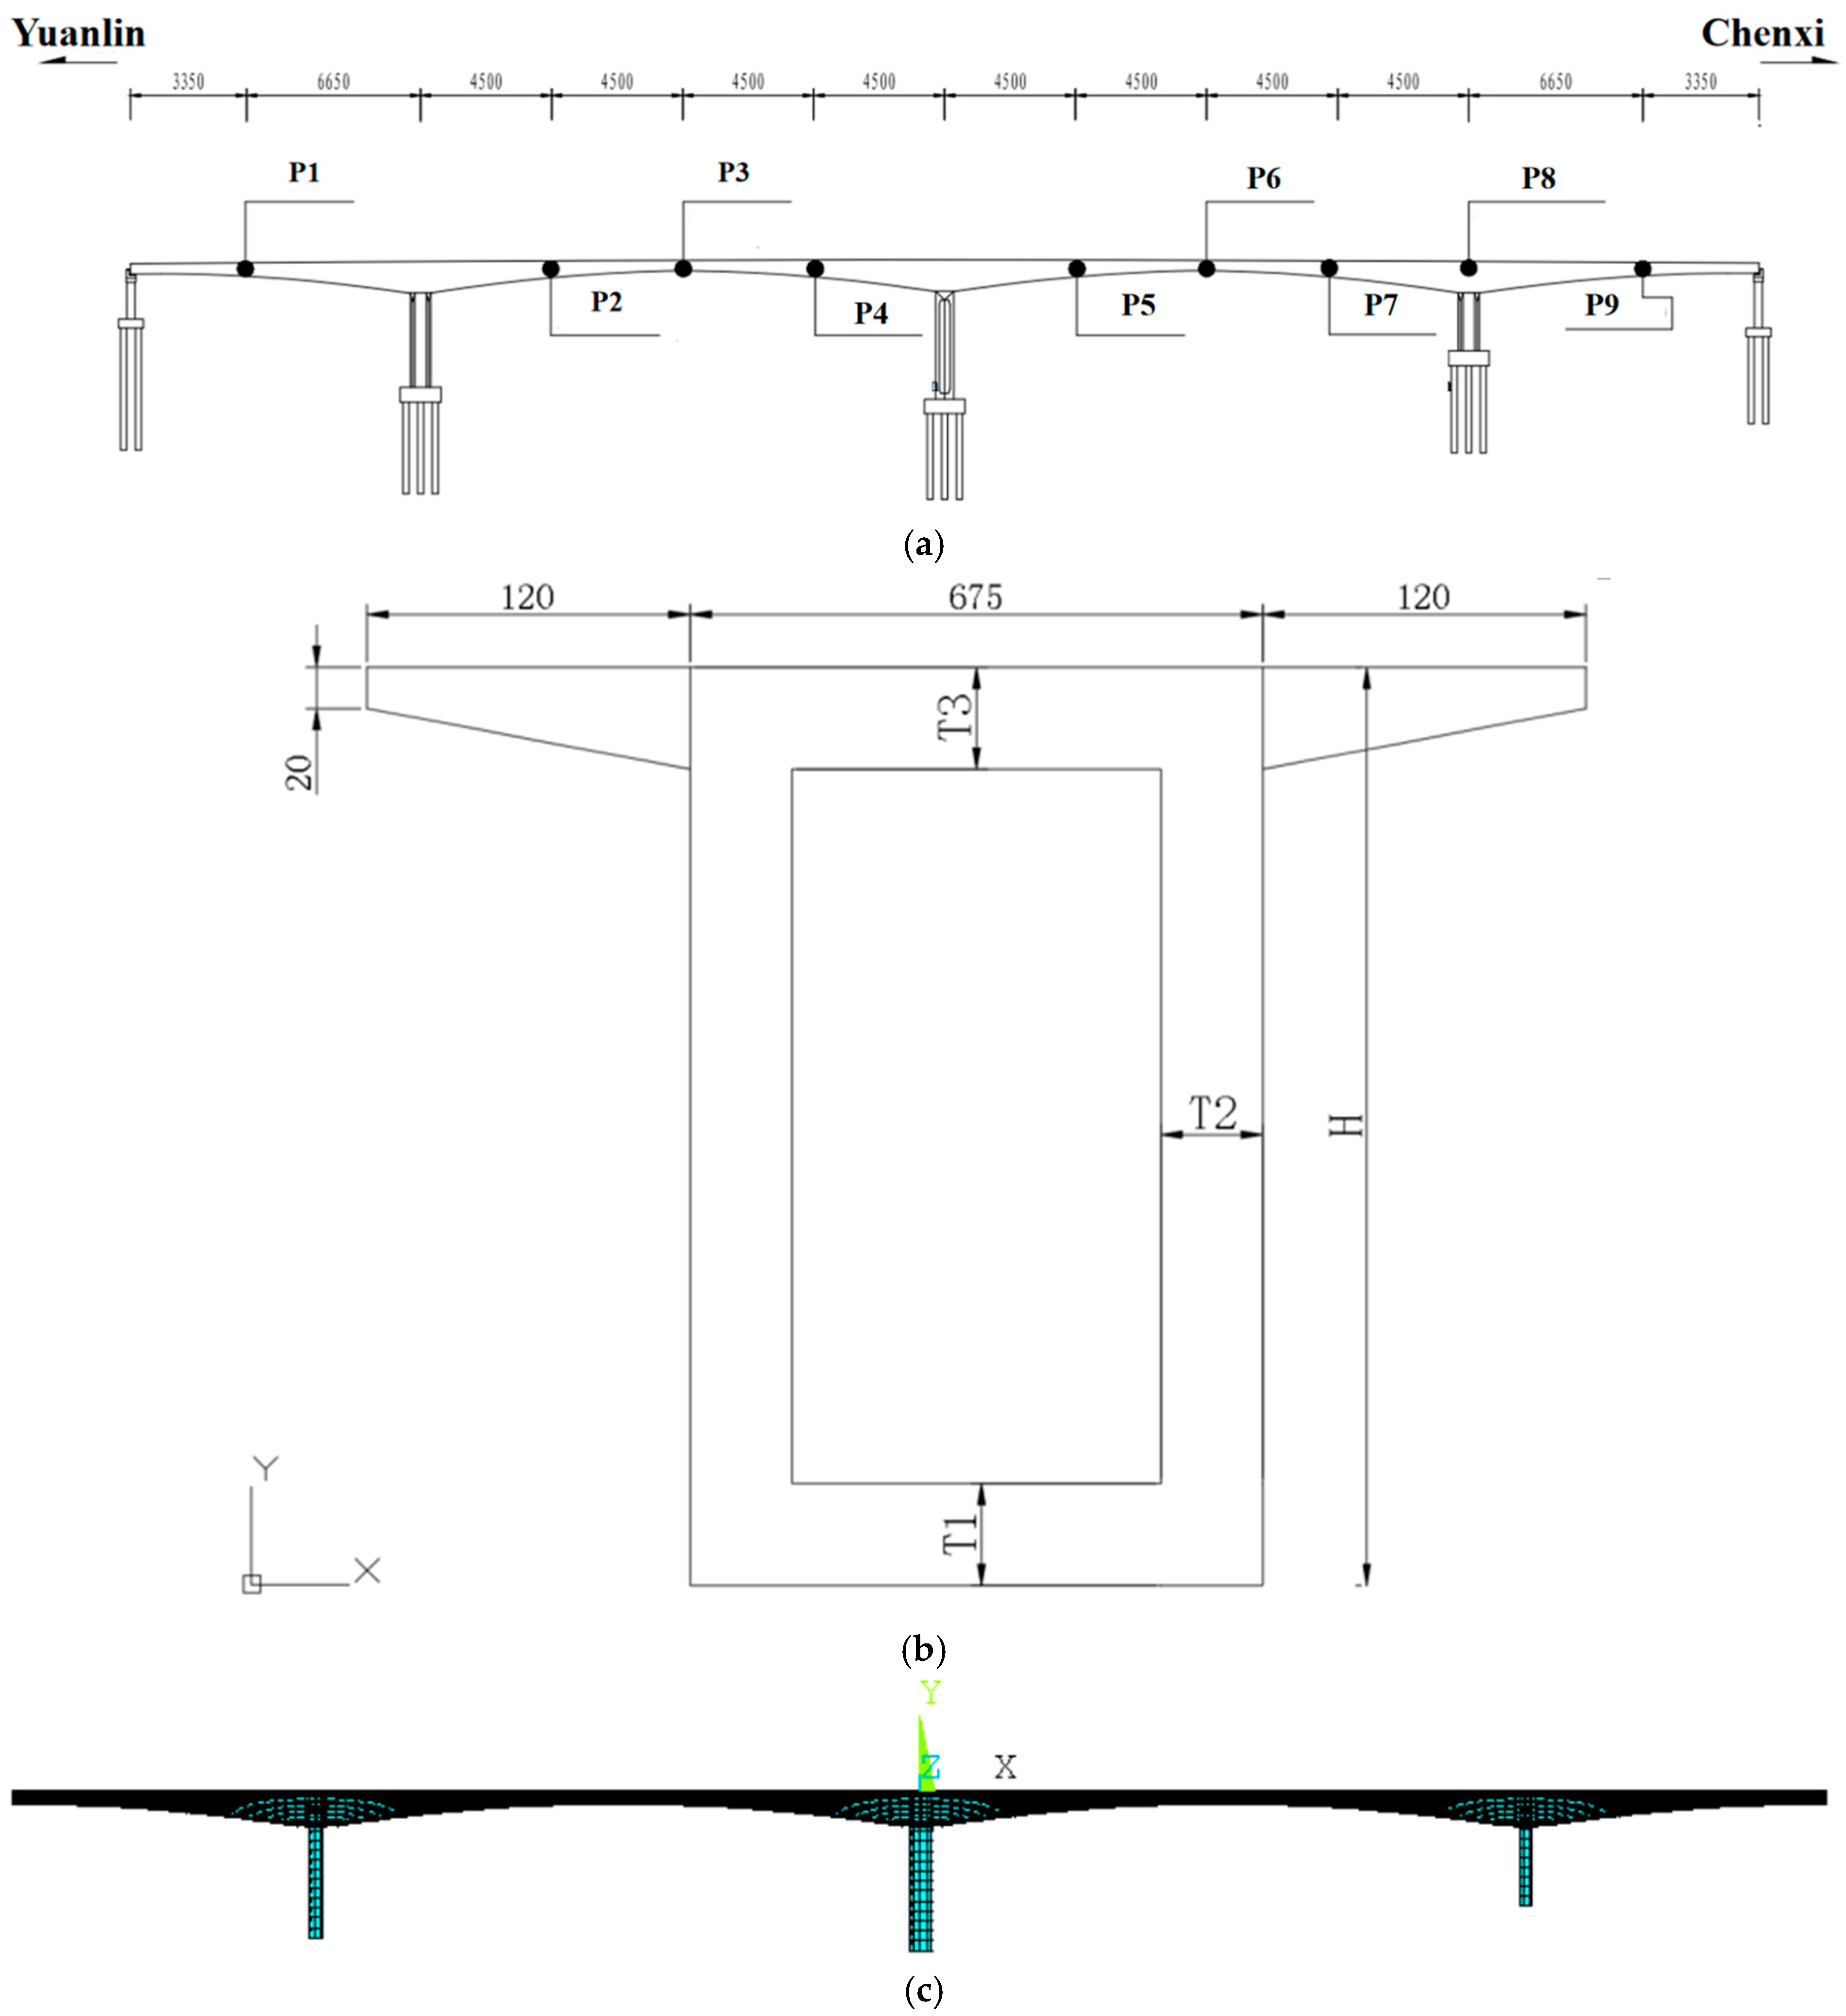
3.1. Simulation Model
3.1.1. The Geometry of the Bridge in the Field
3.1.2. Validation of the Model on Frequency
3.1.3. The Base of the Influence Line
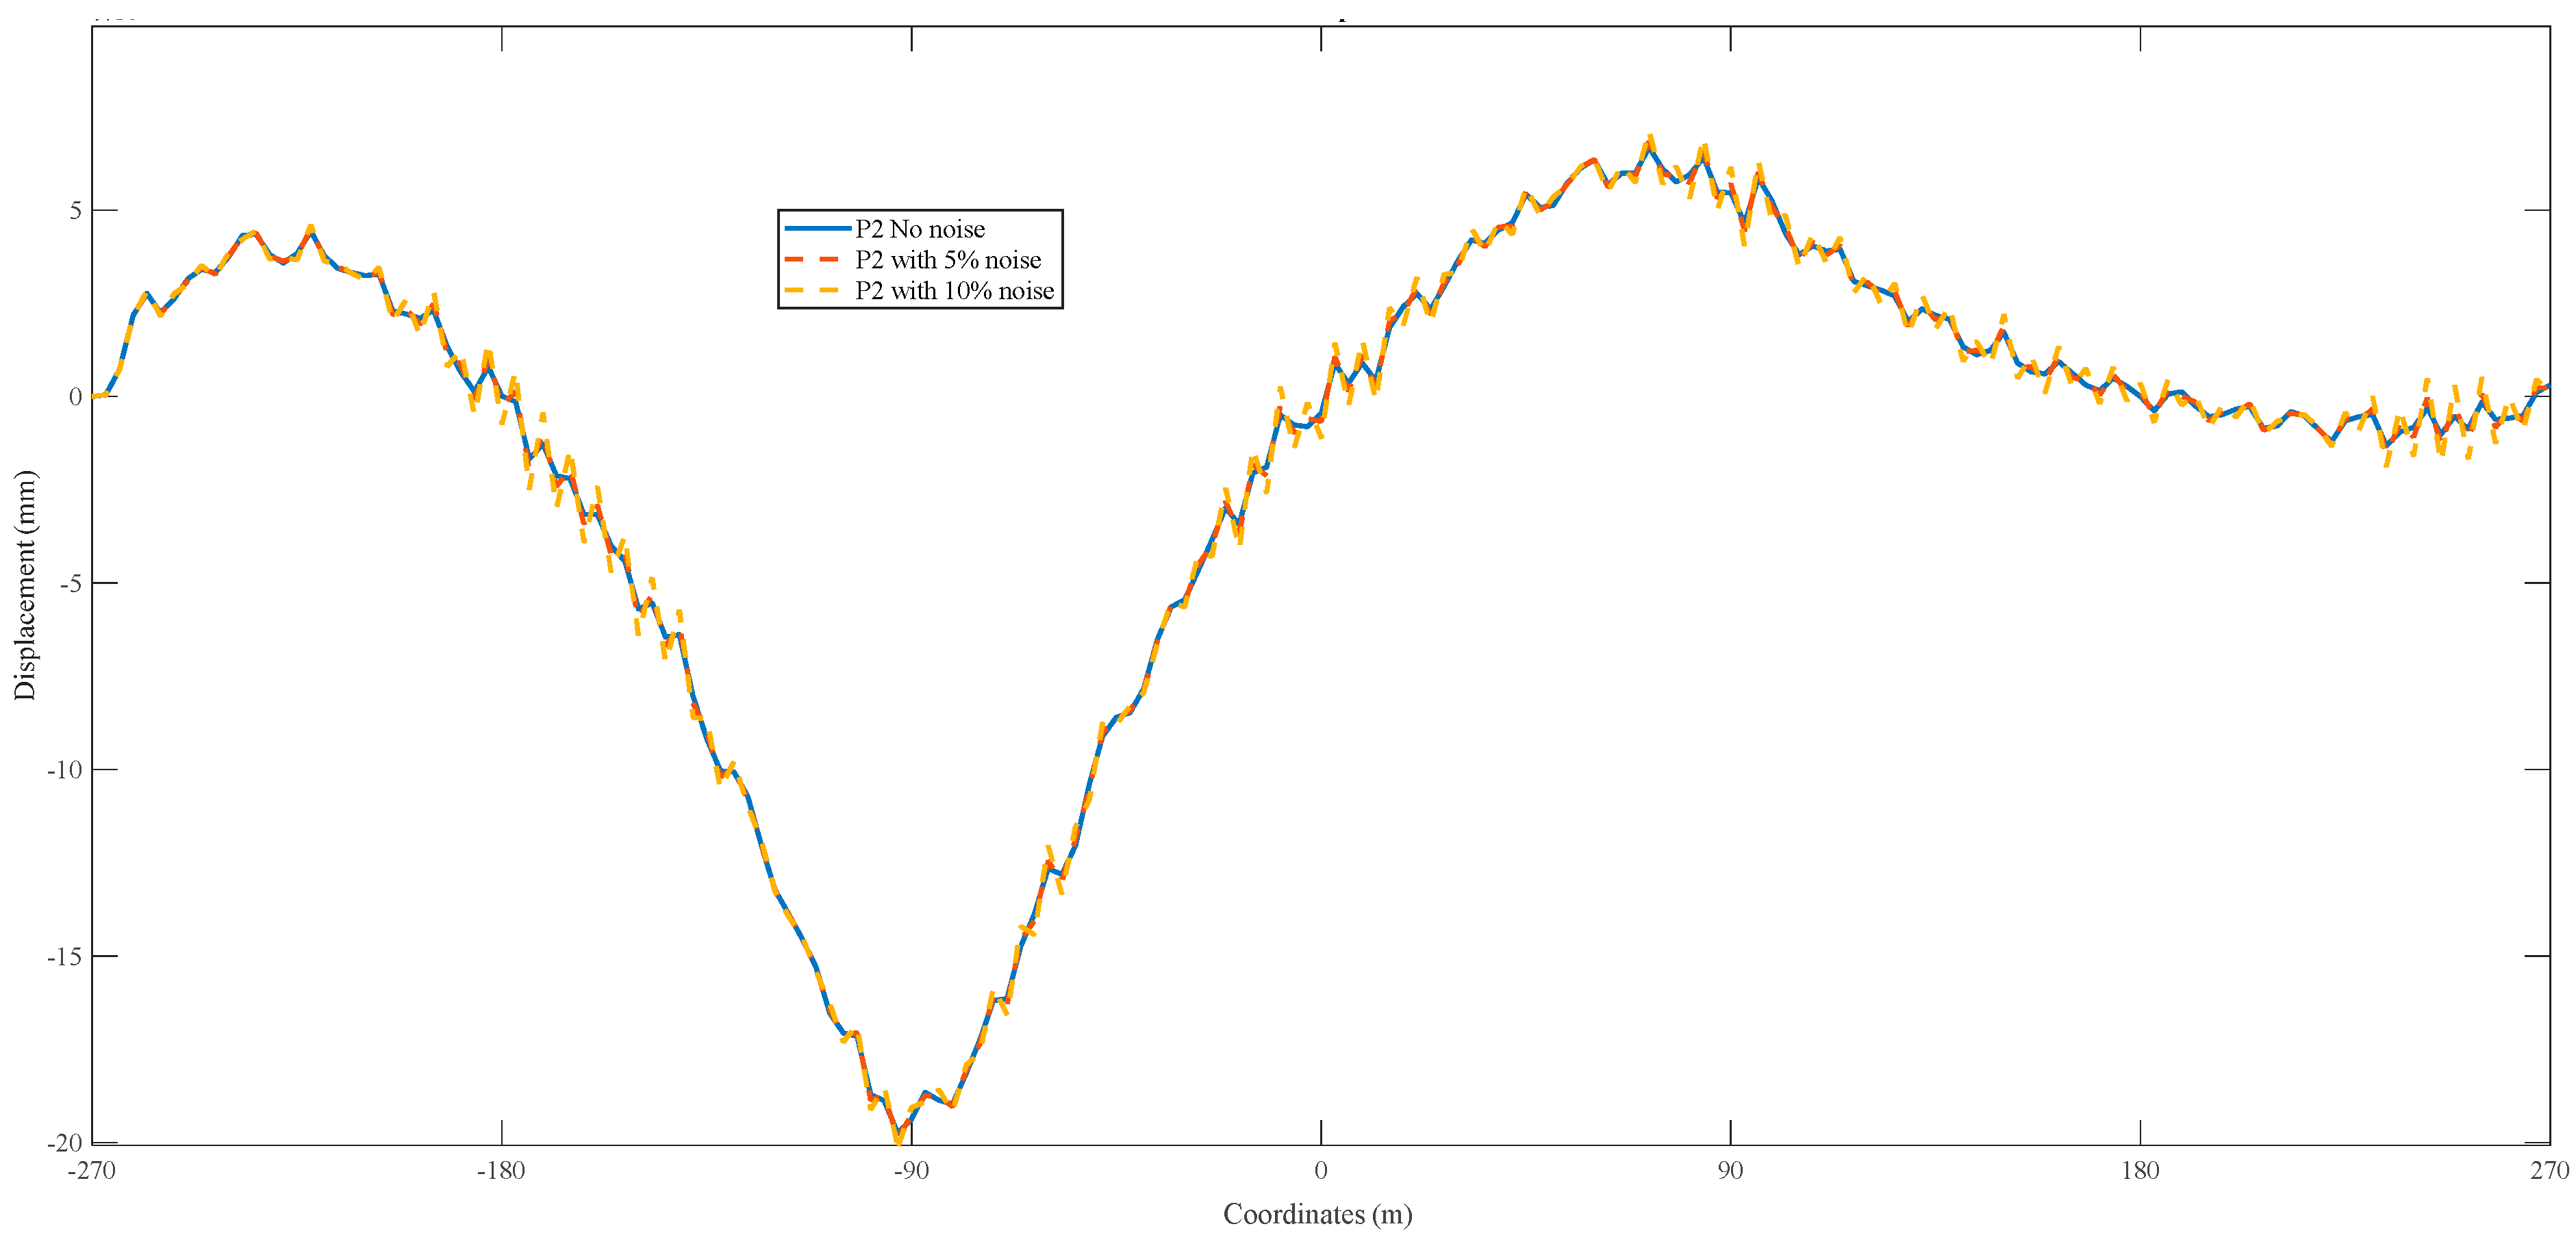
3.2. Results with Different Noises
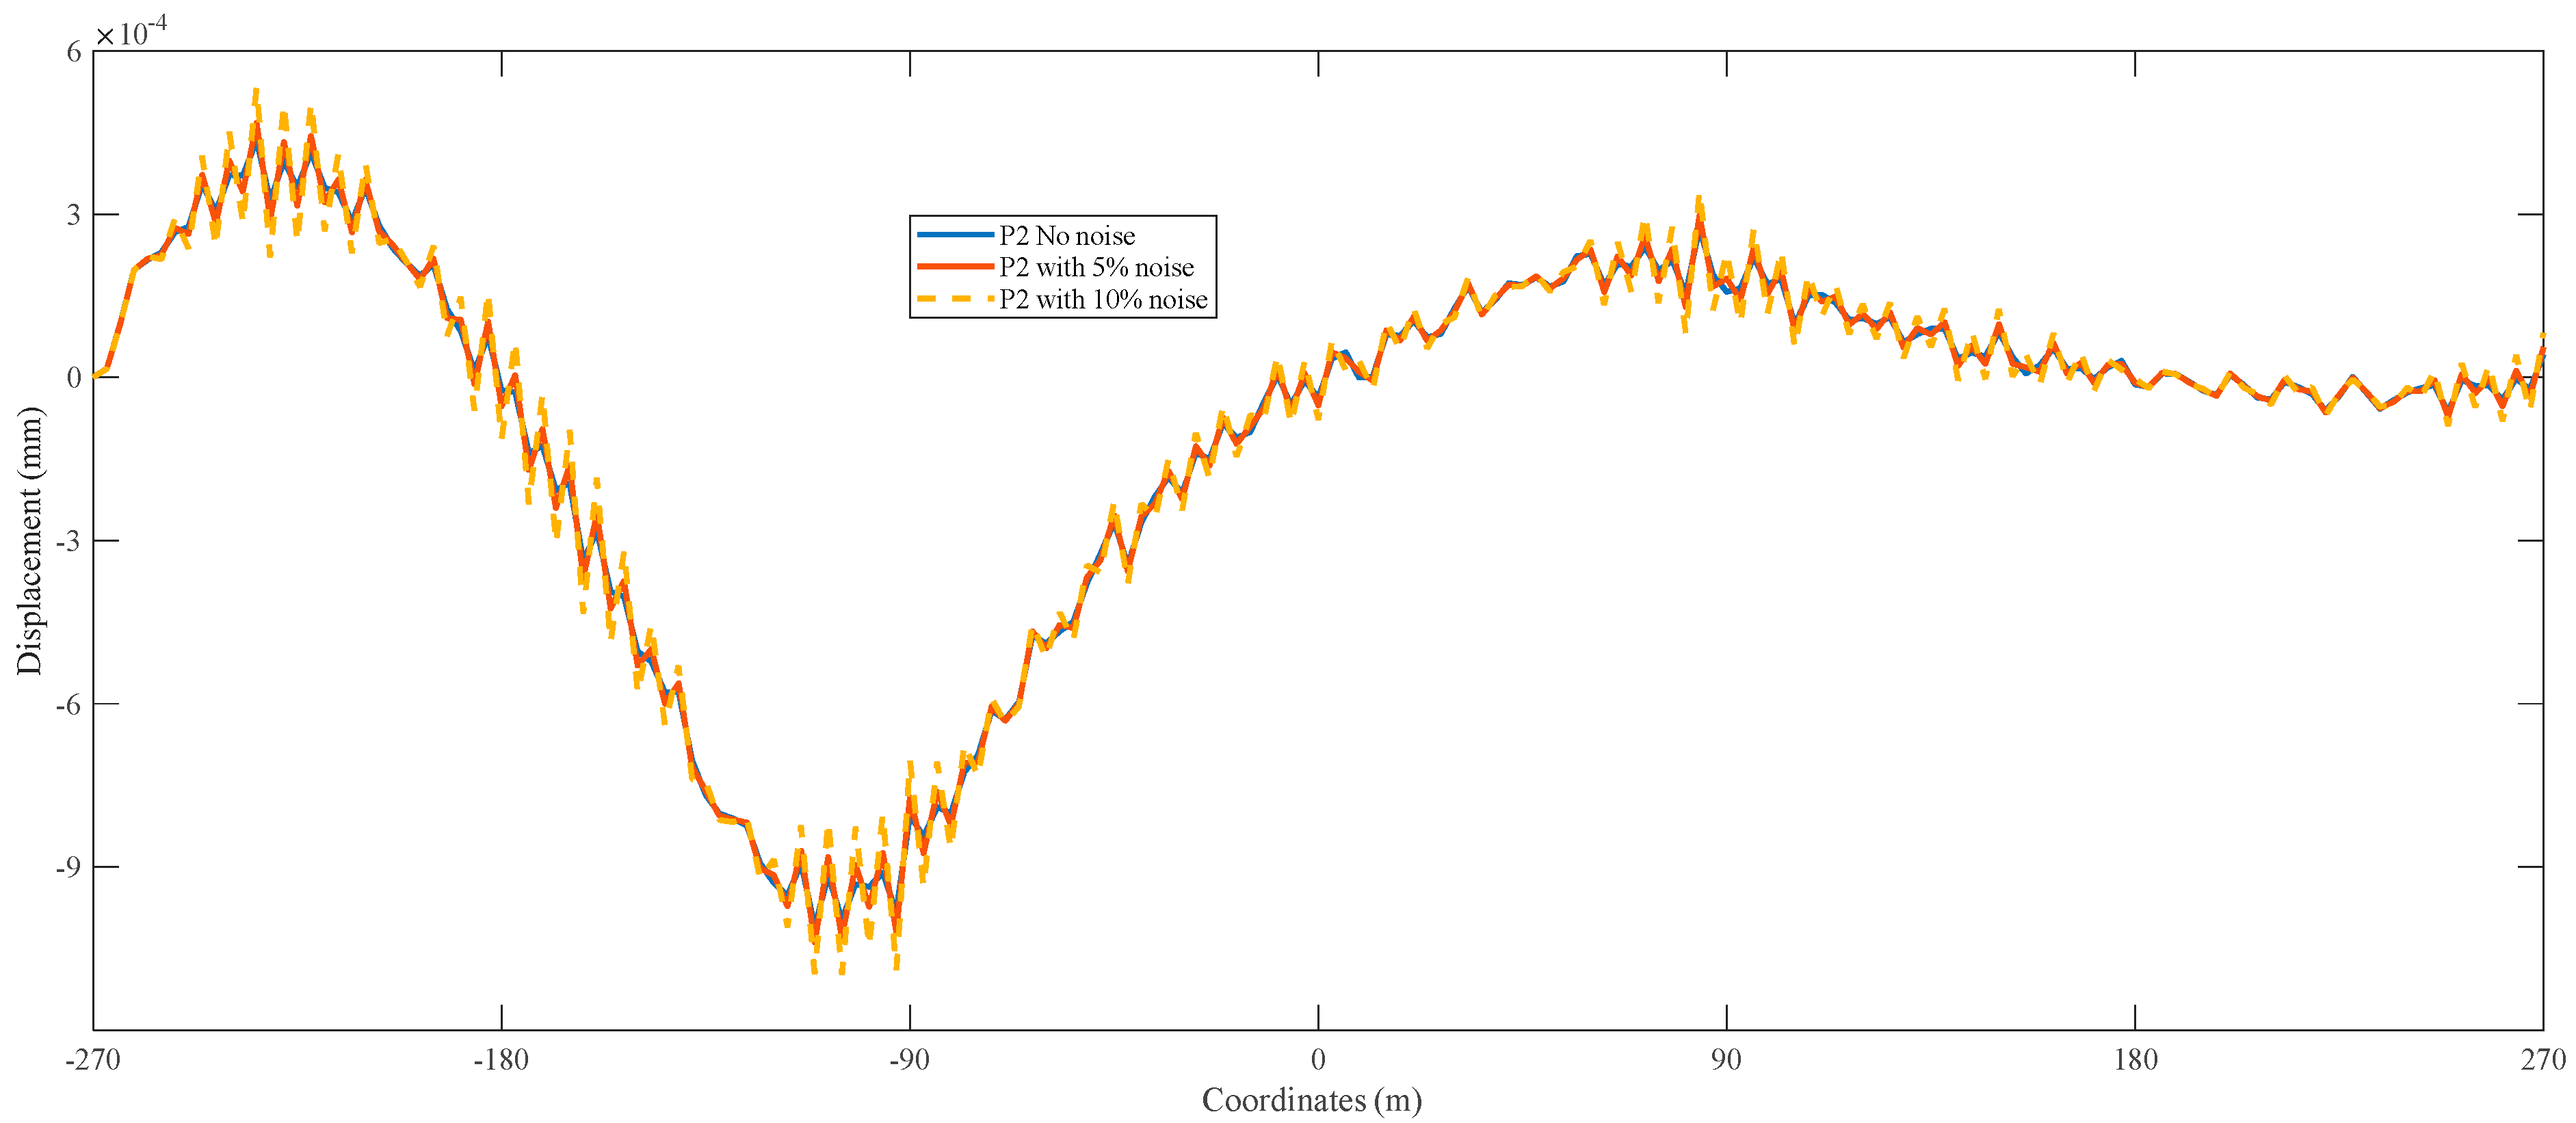
3.2.1. Vehicle Load with Turbulence Noise
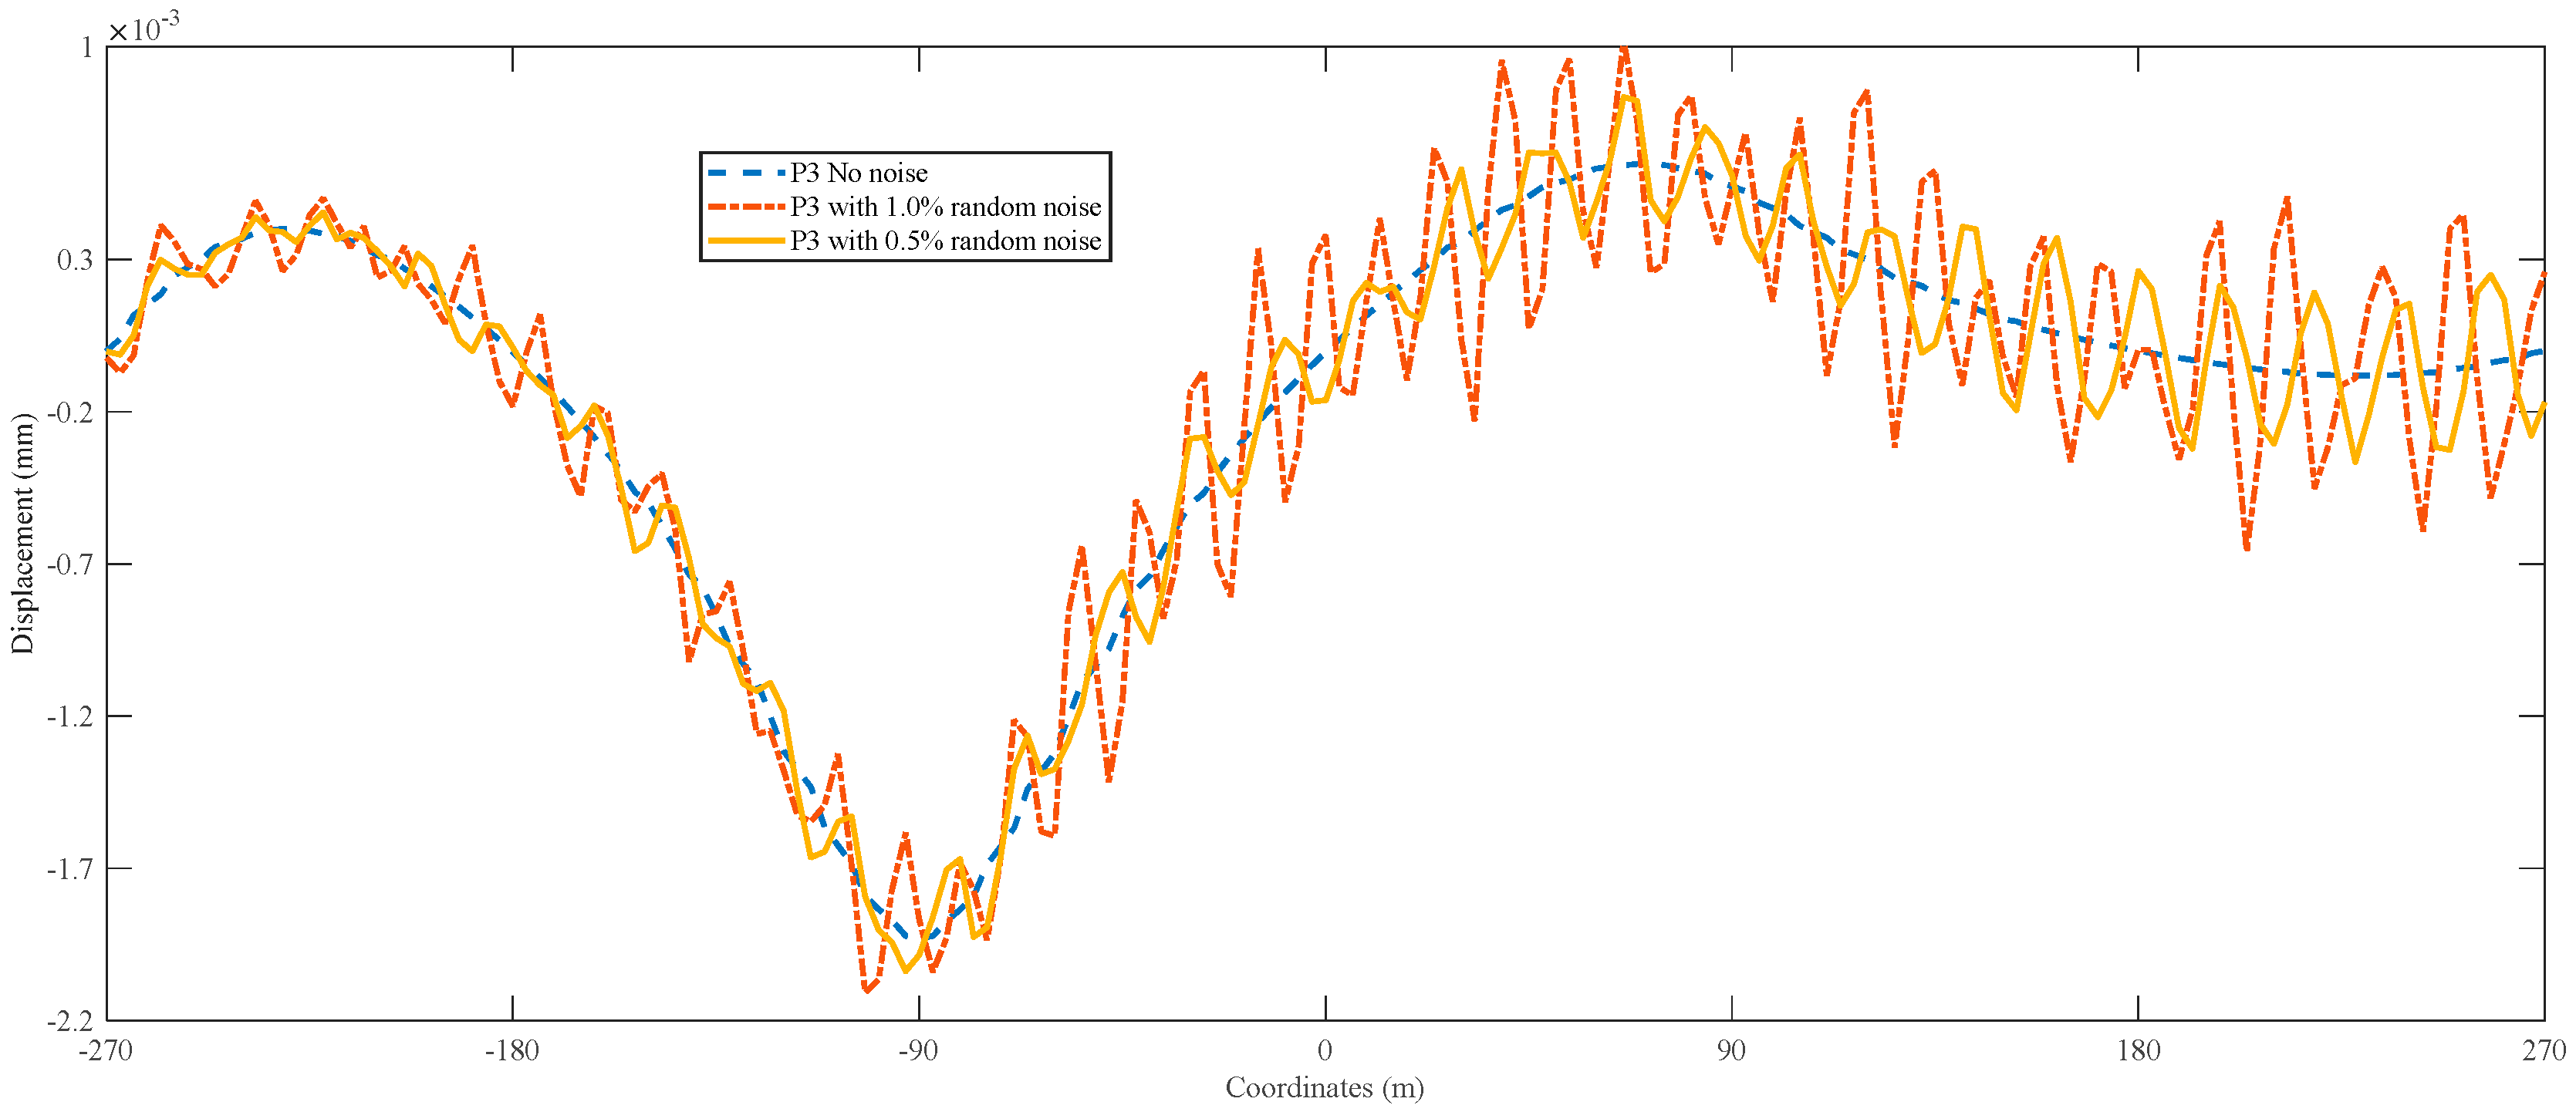
3.2.2. Uniform on the Bridge with Random Noise Ranged (−1, 1)
3.2.3. Uniform Load with Noise Ranged (0, 1)
3.3. Summary of the Identification Results
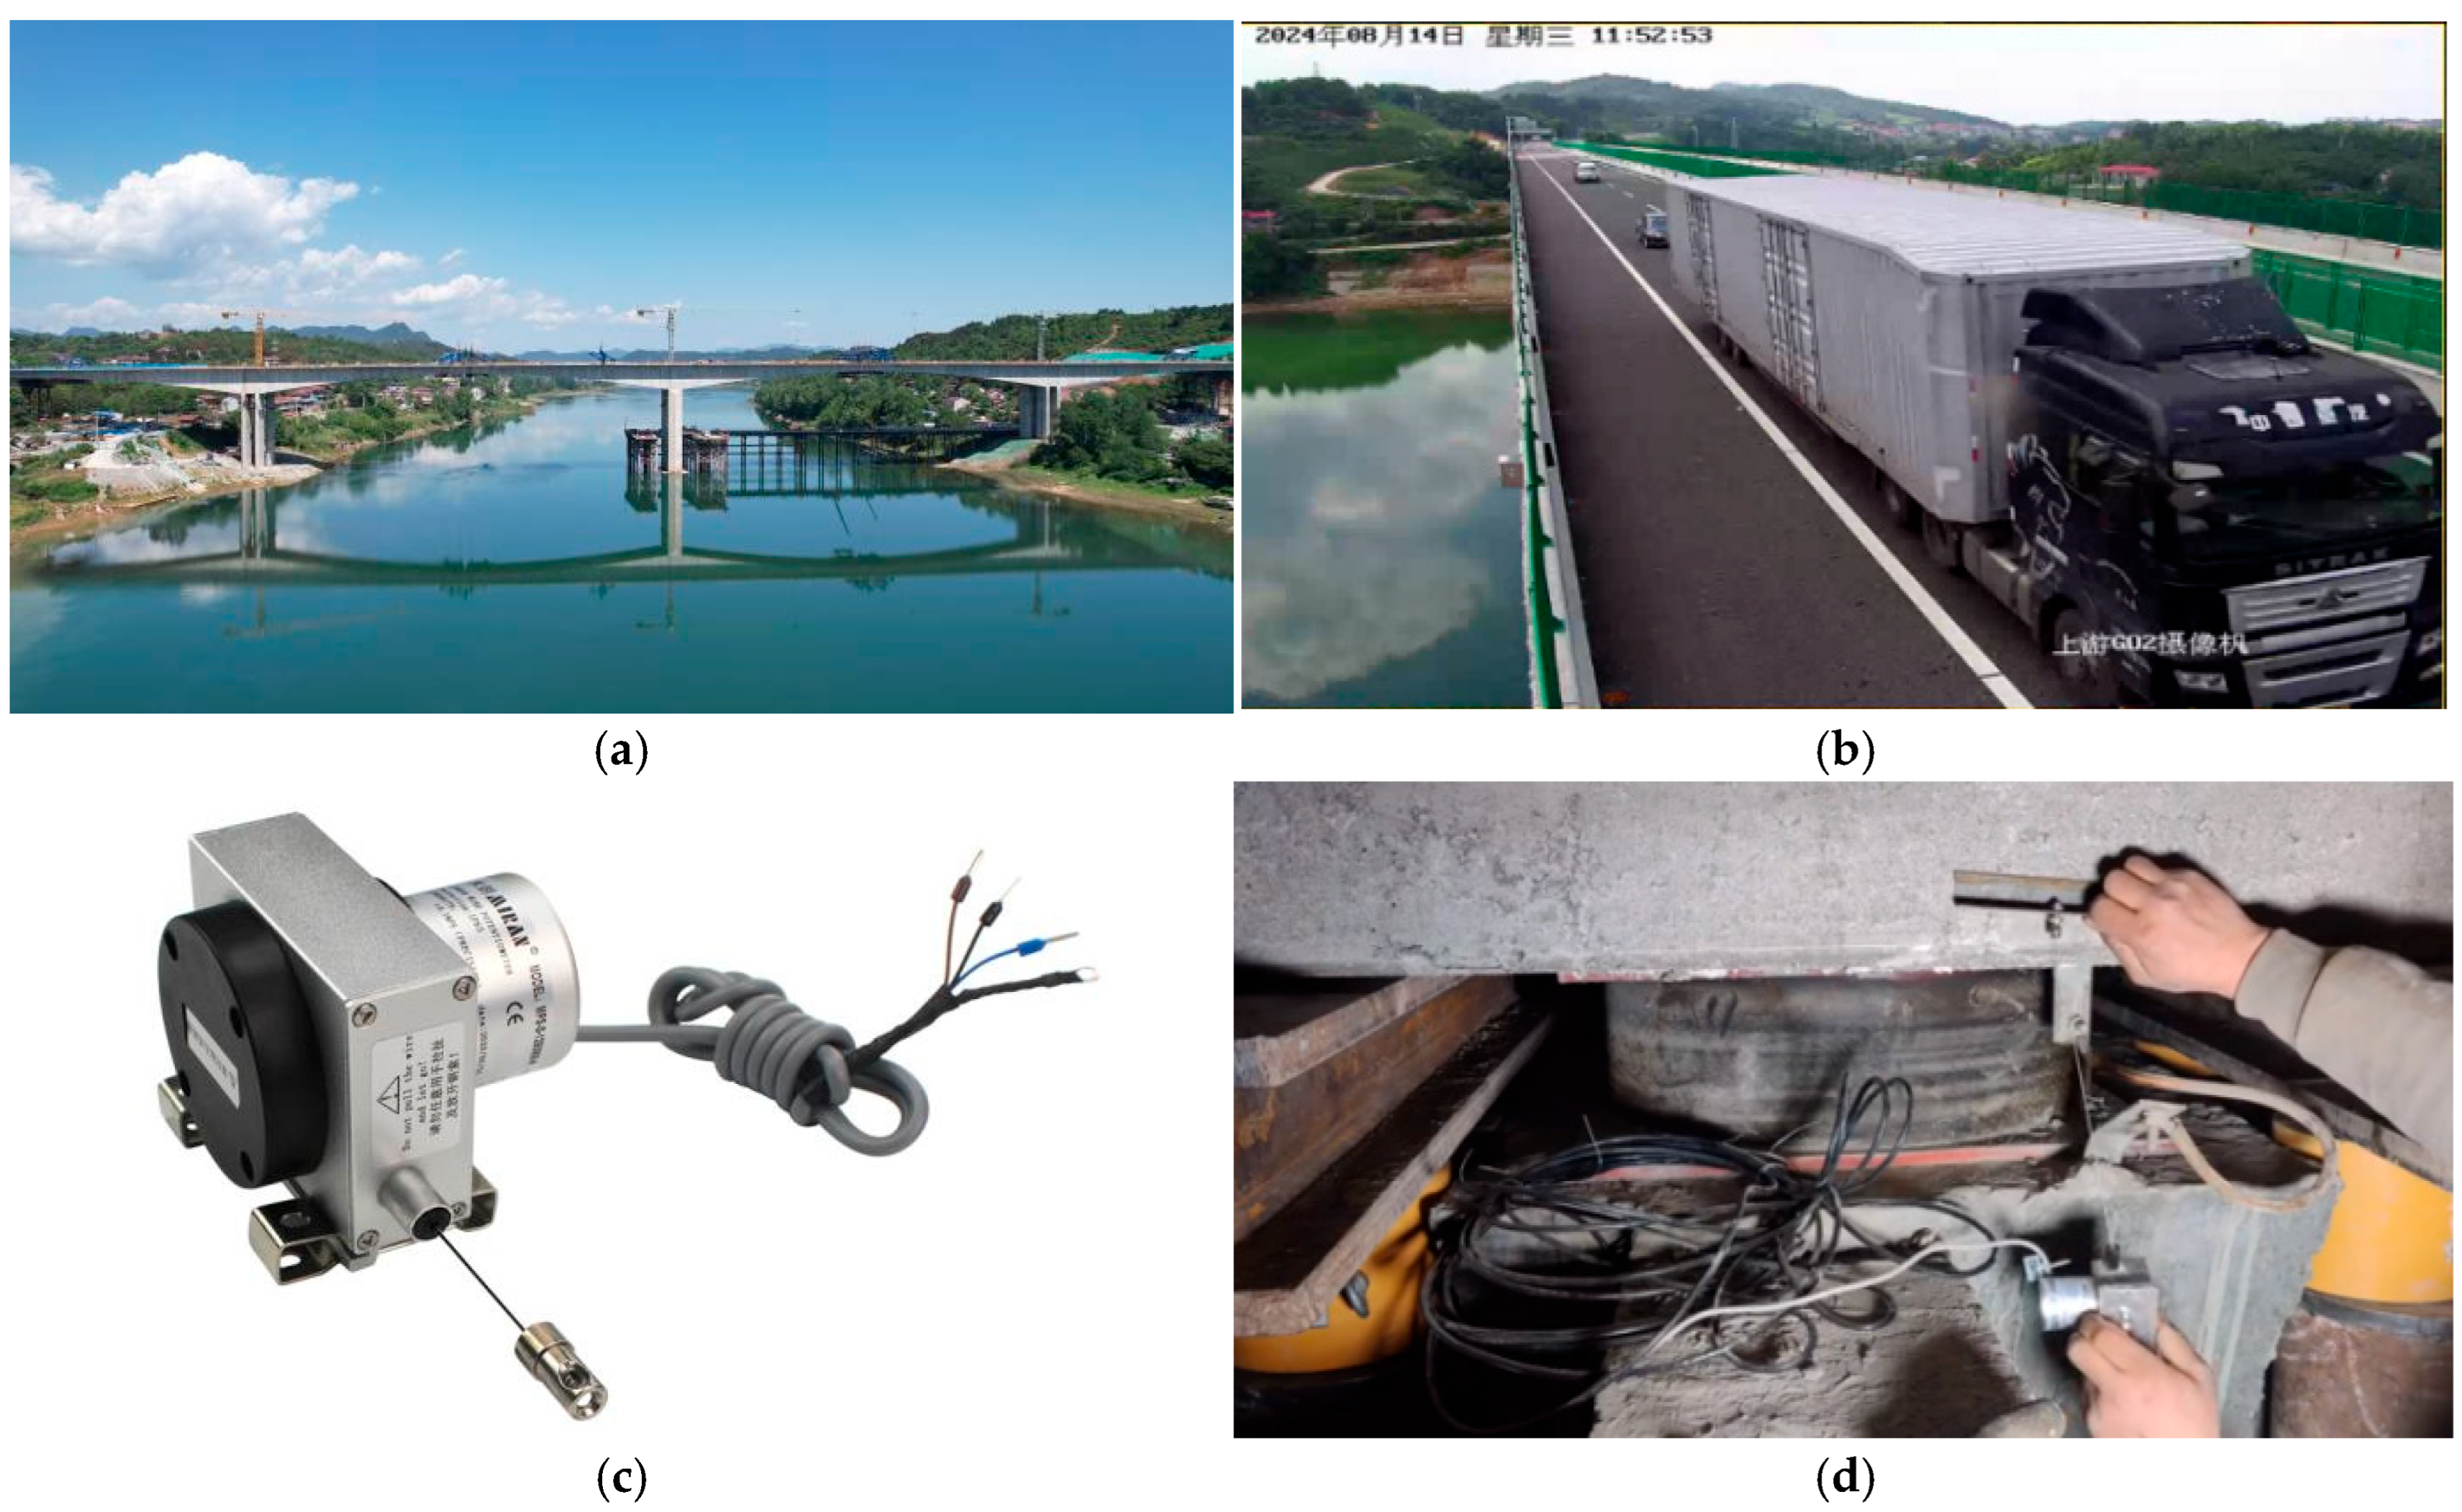
4. Application in Chenxi Bridge
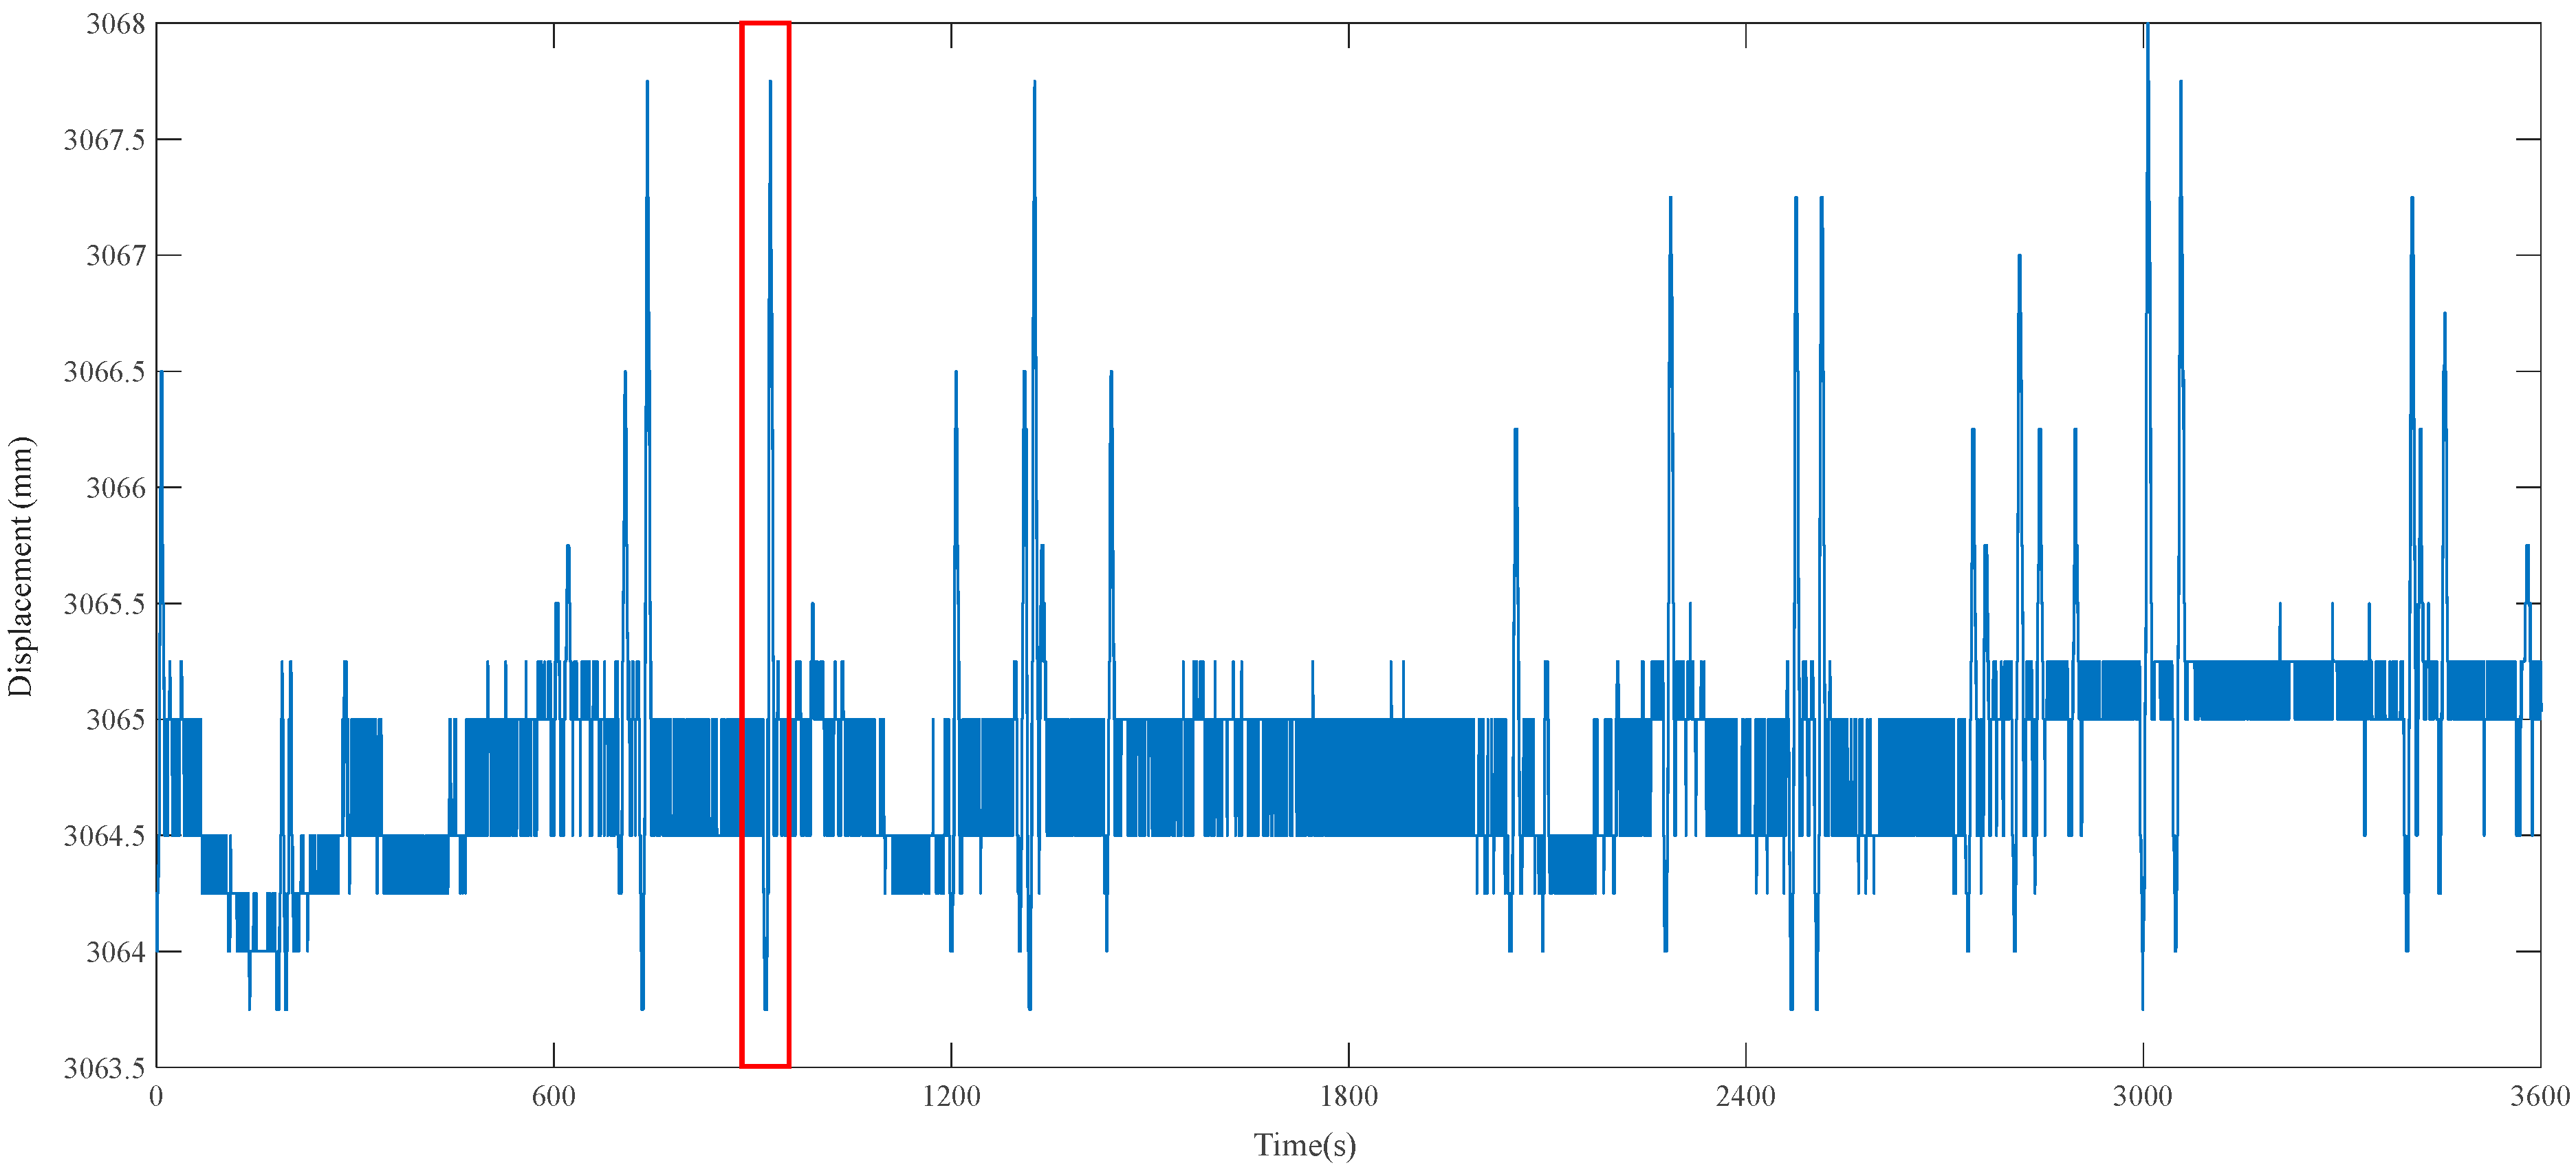
4.1. Original Data
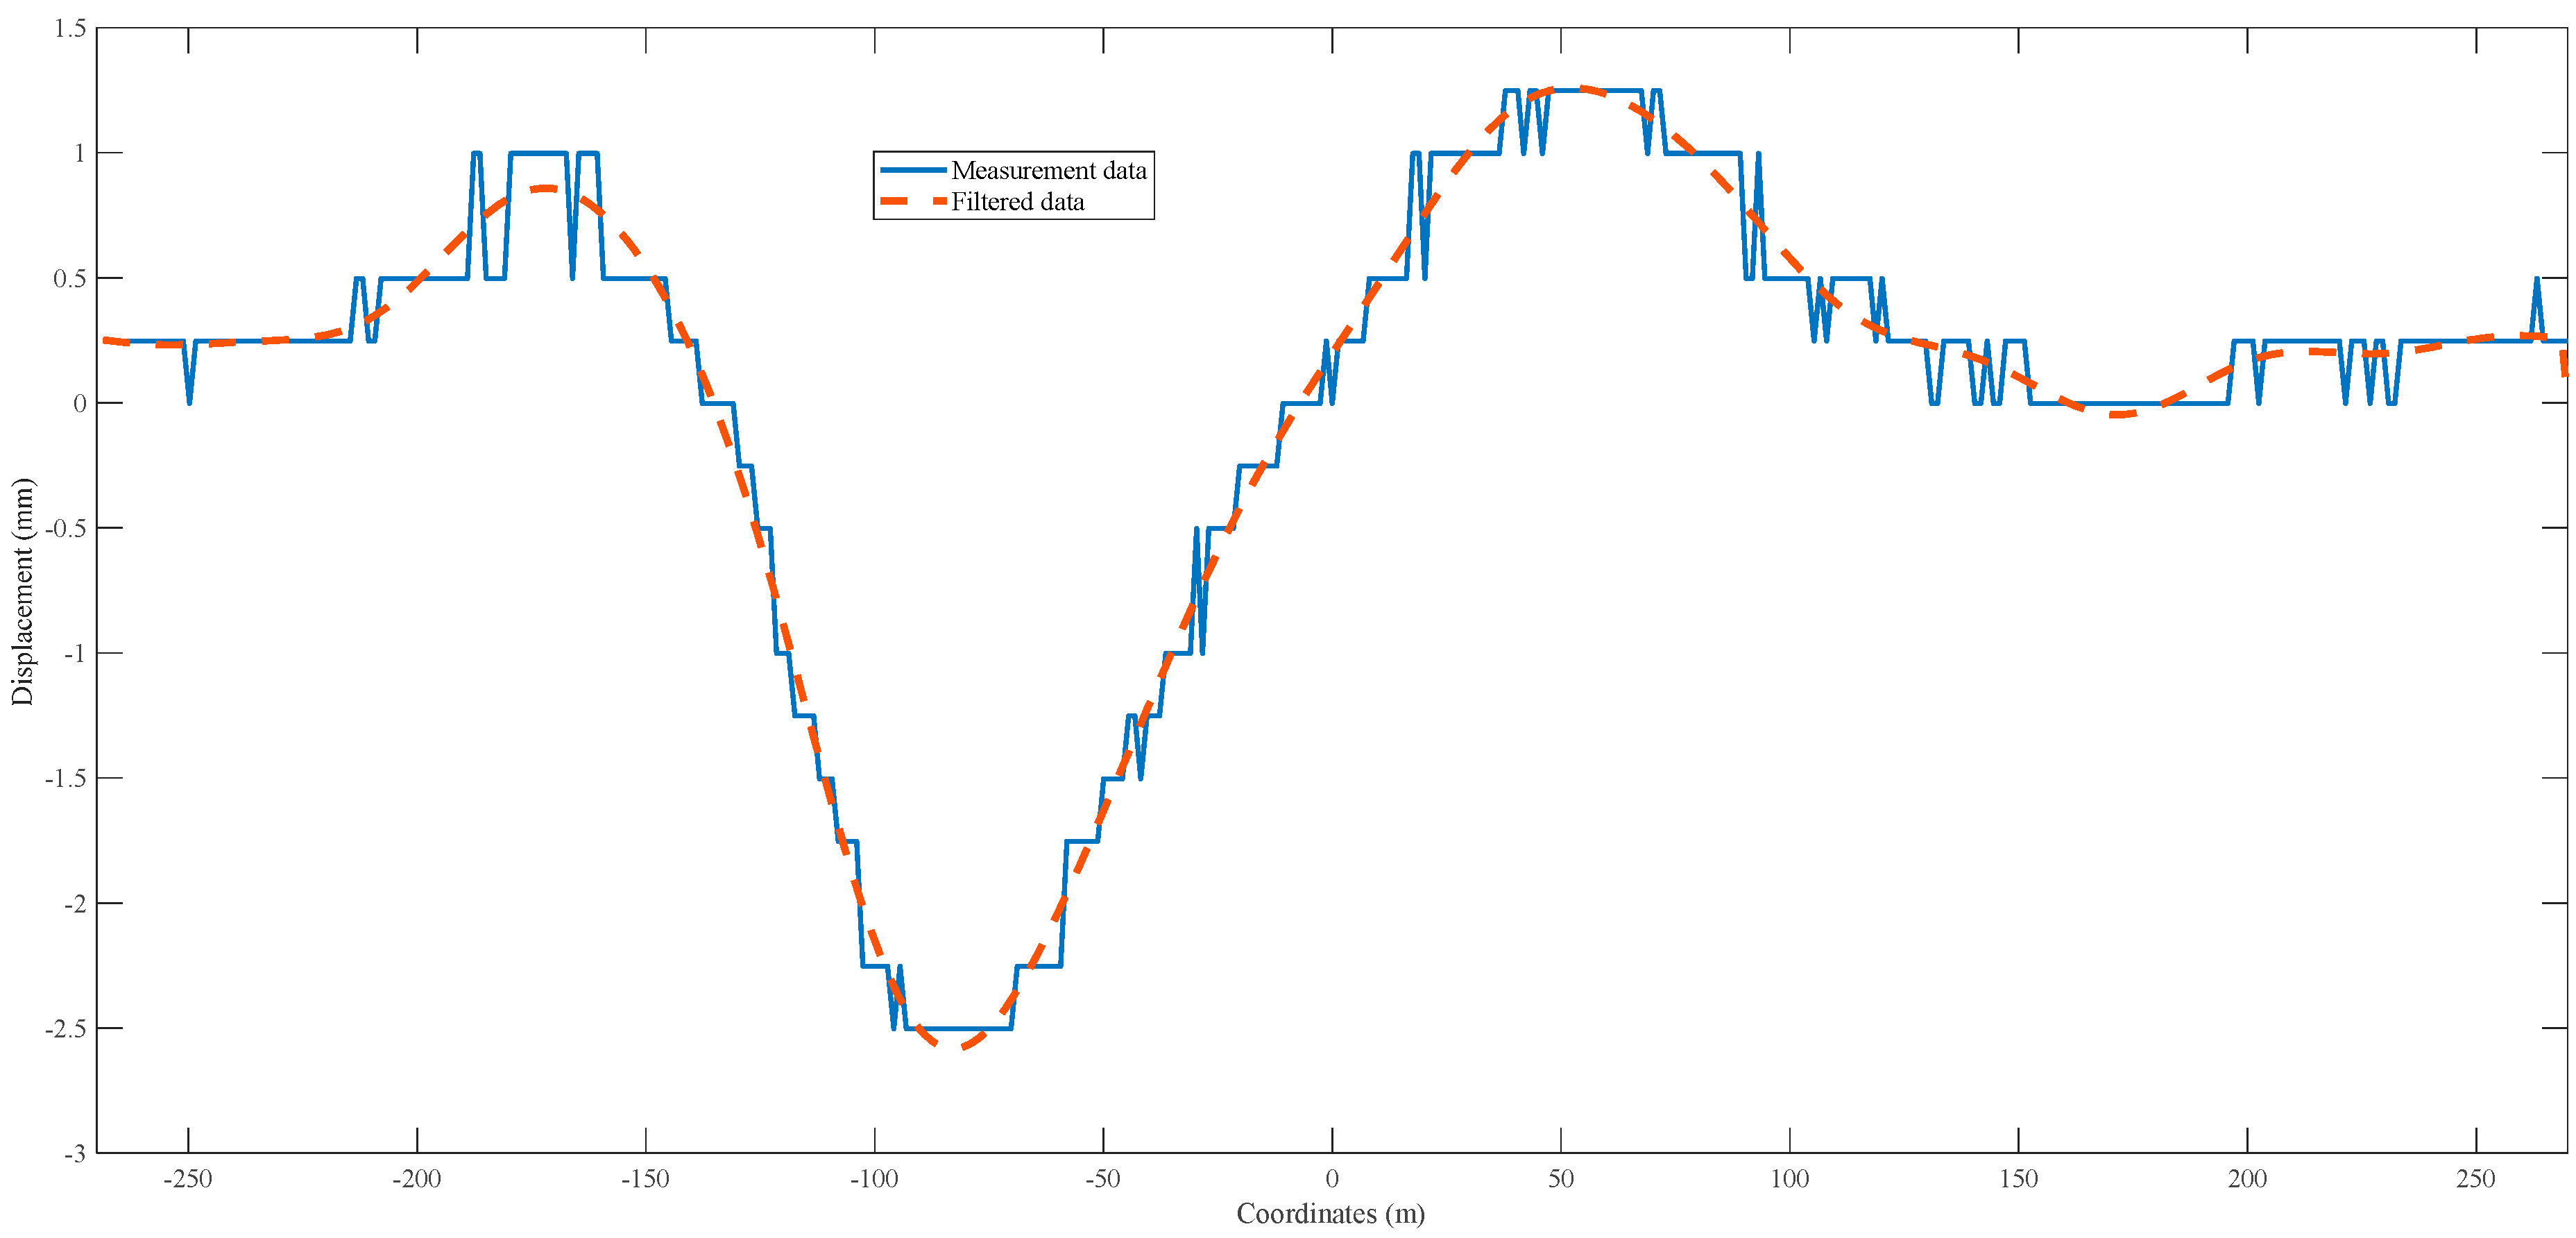
4.2. Data Correction
4.3. Identification for Test Data
5. Discussions
6. Conclusions
- (1)
- For cases with noise subject to the moving load: The three methods, including IL, AIL, and AIL-Modified, can all identify moving loads effectively. The wheelbase and moving speed have little impact on the identification methods.
- (2)
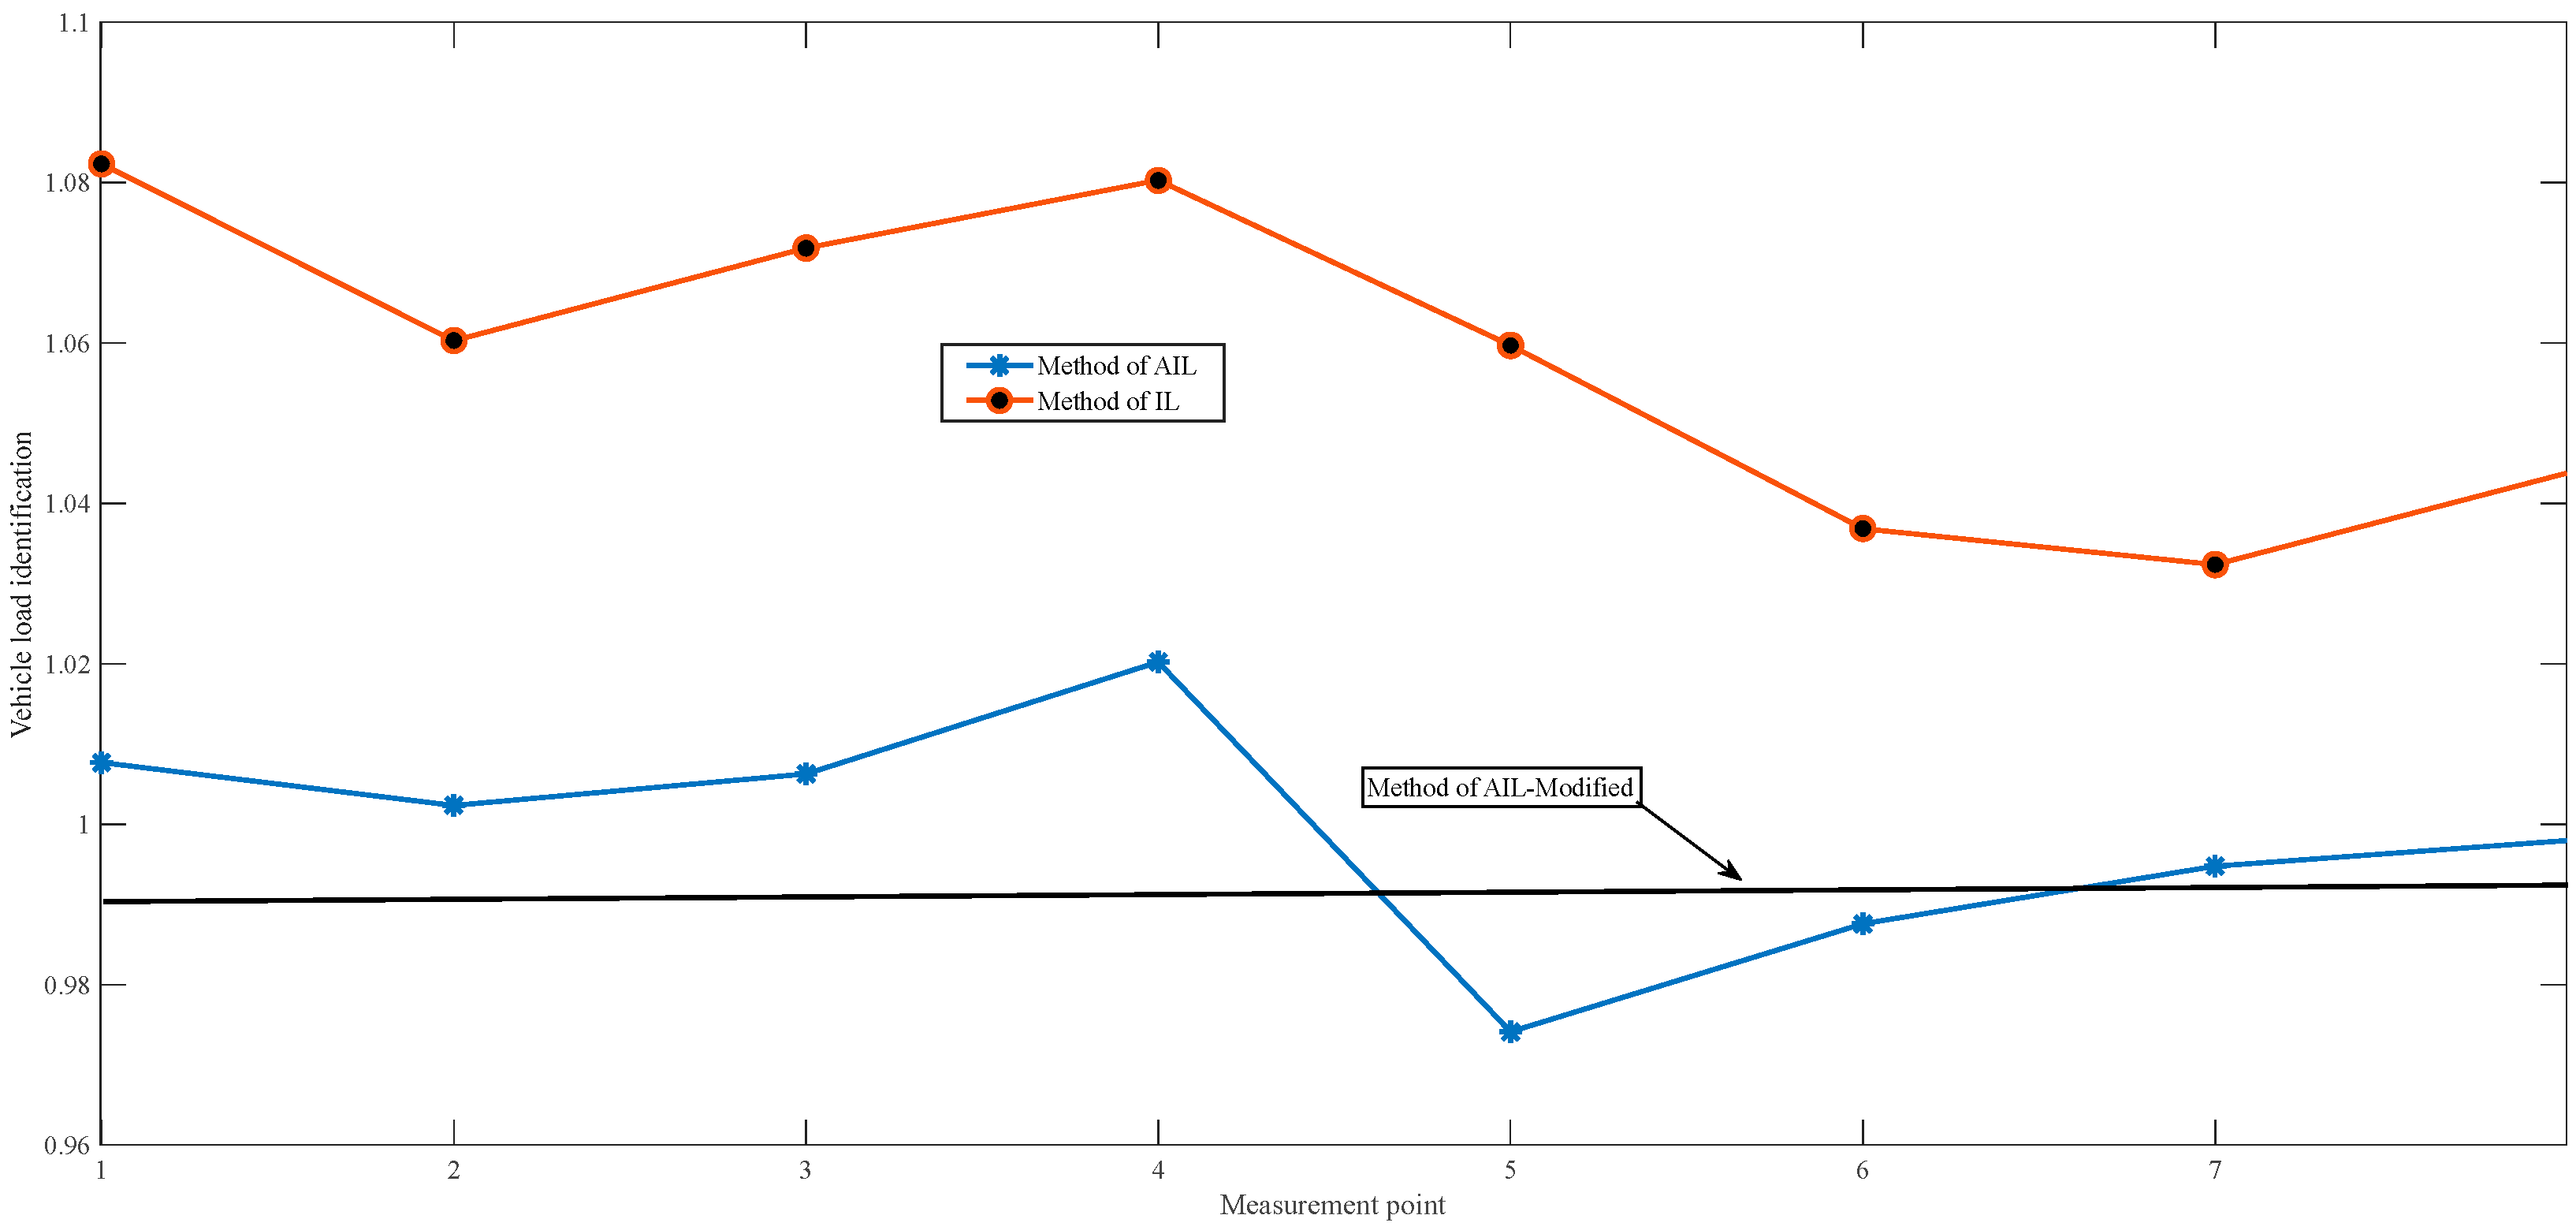
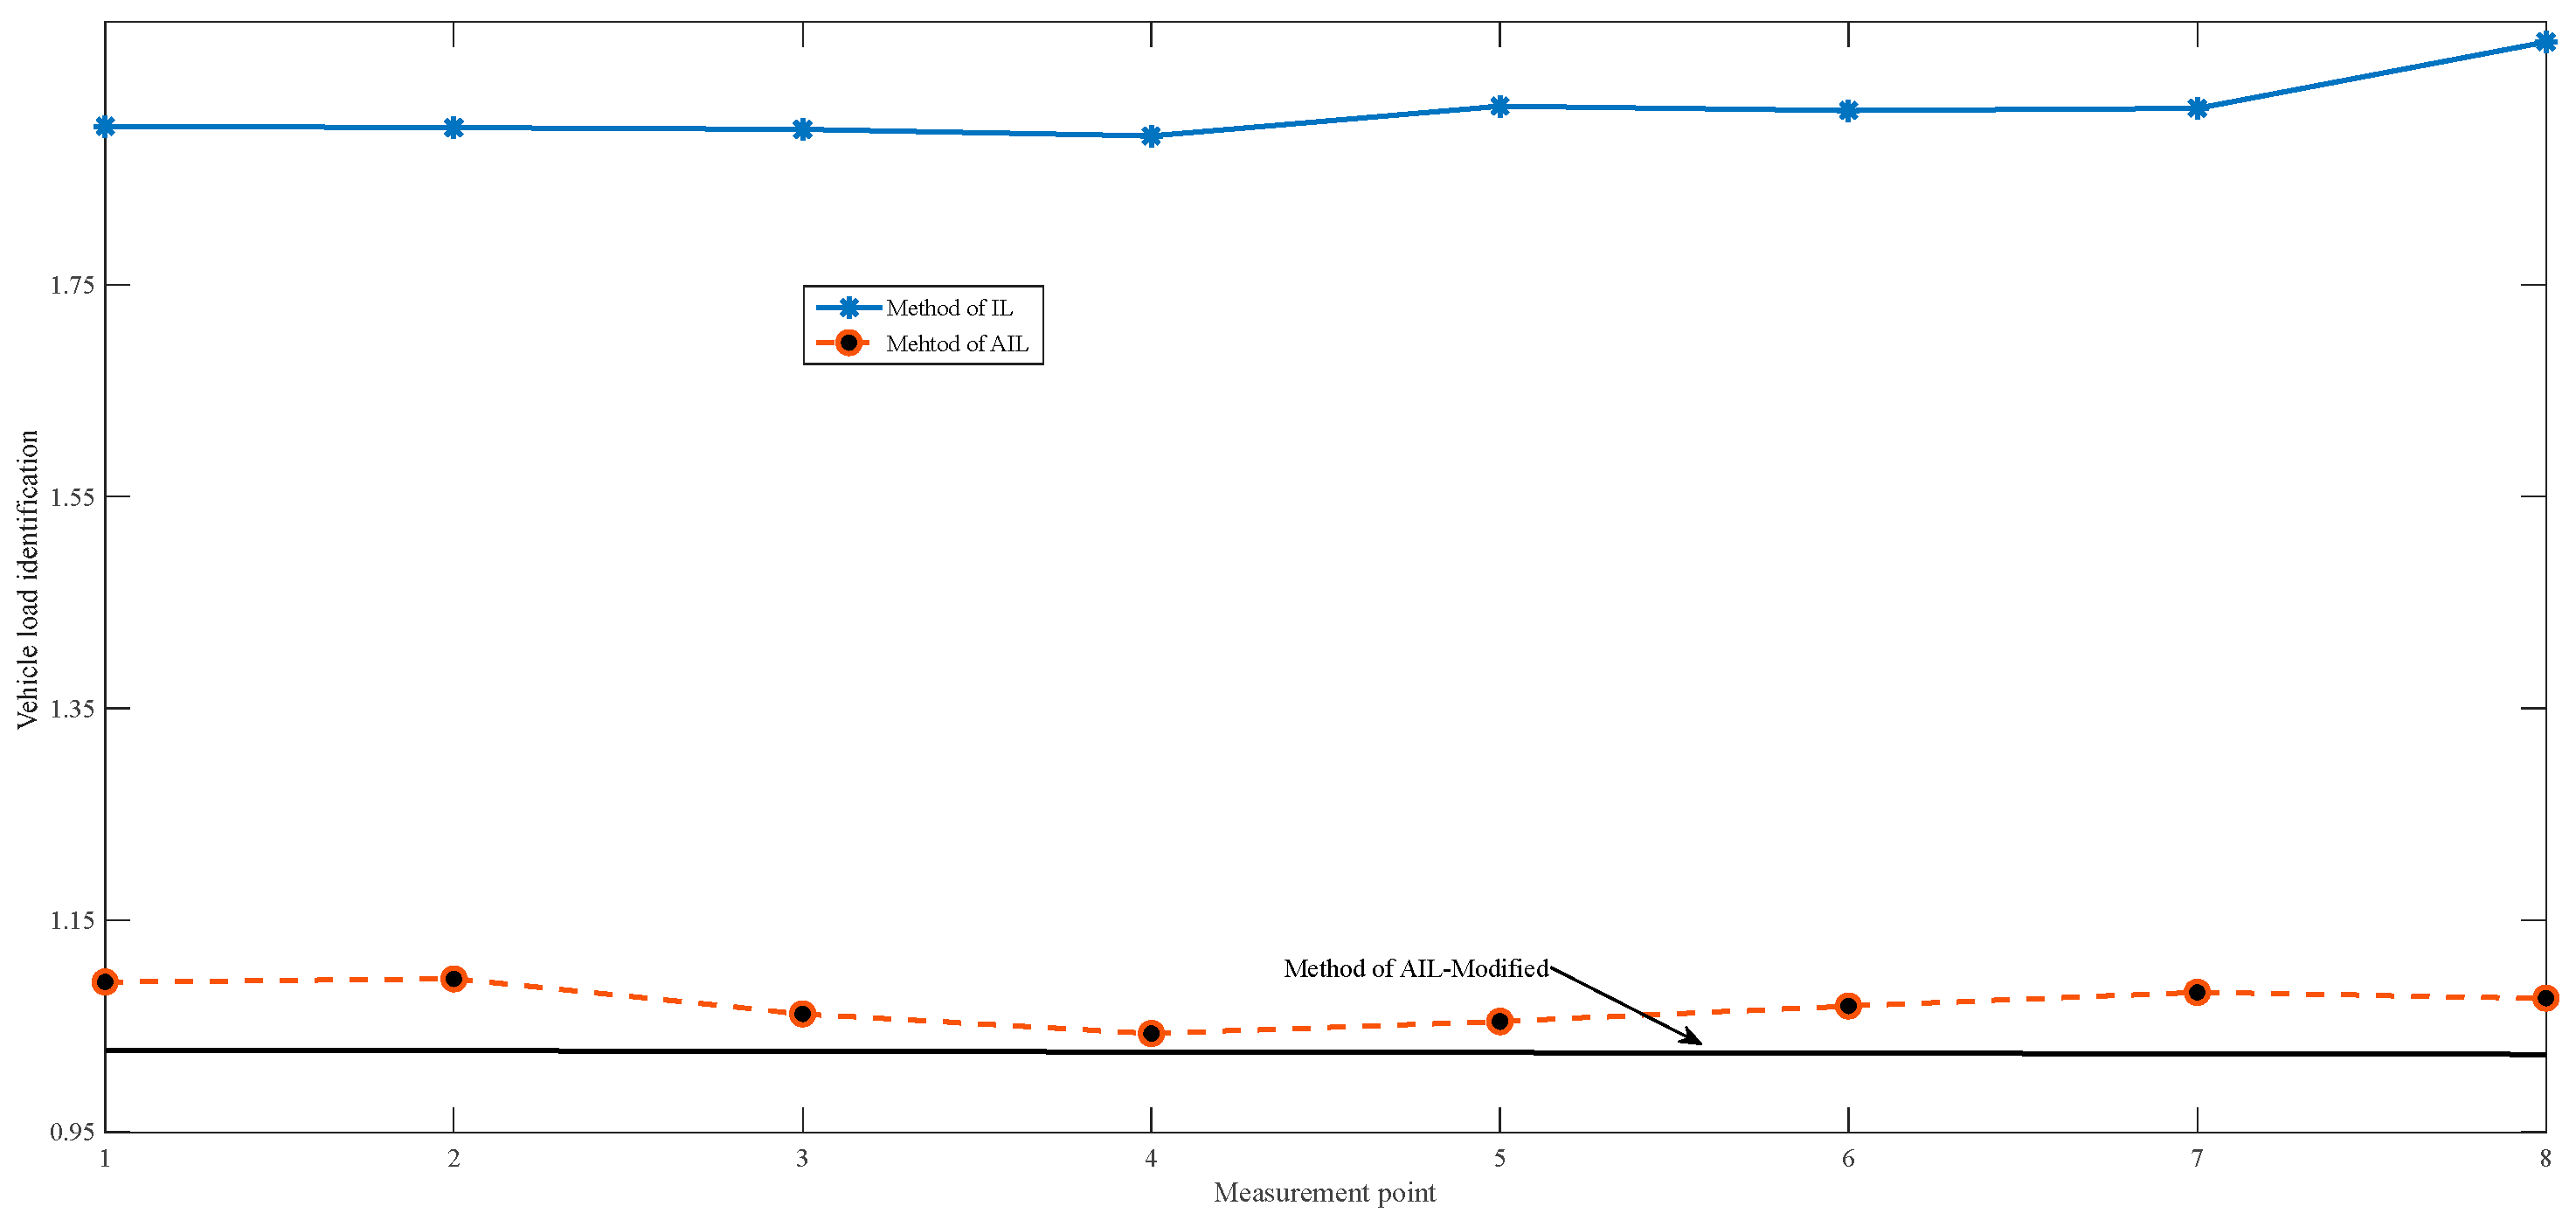
- The IL method is highly sensitive to the location of monitoring points, while the AIL and AIL-Modified methods are less dependent on the location of the monitoring points.
- (3)
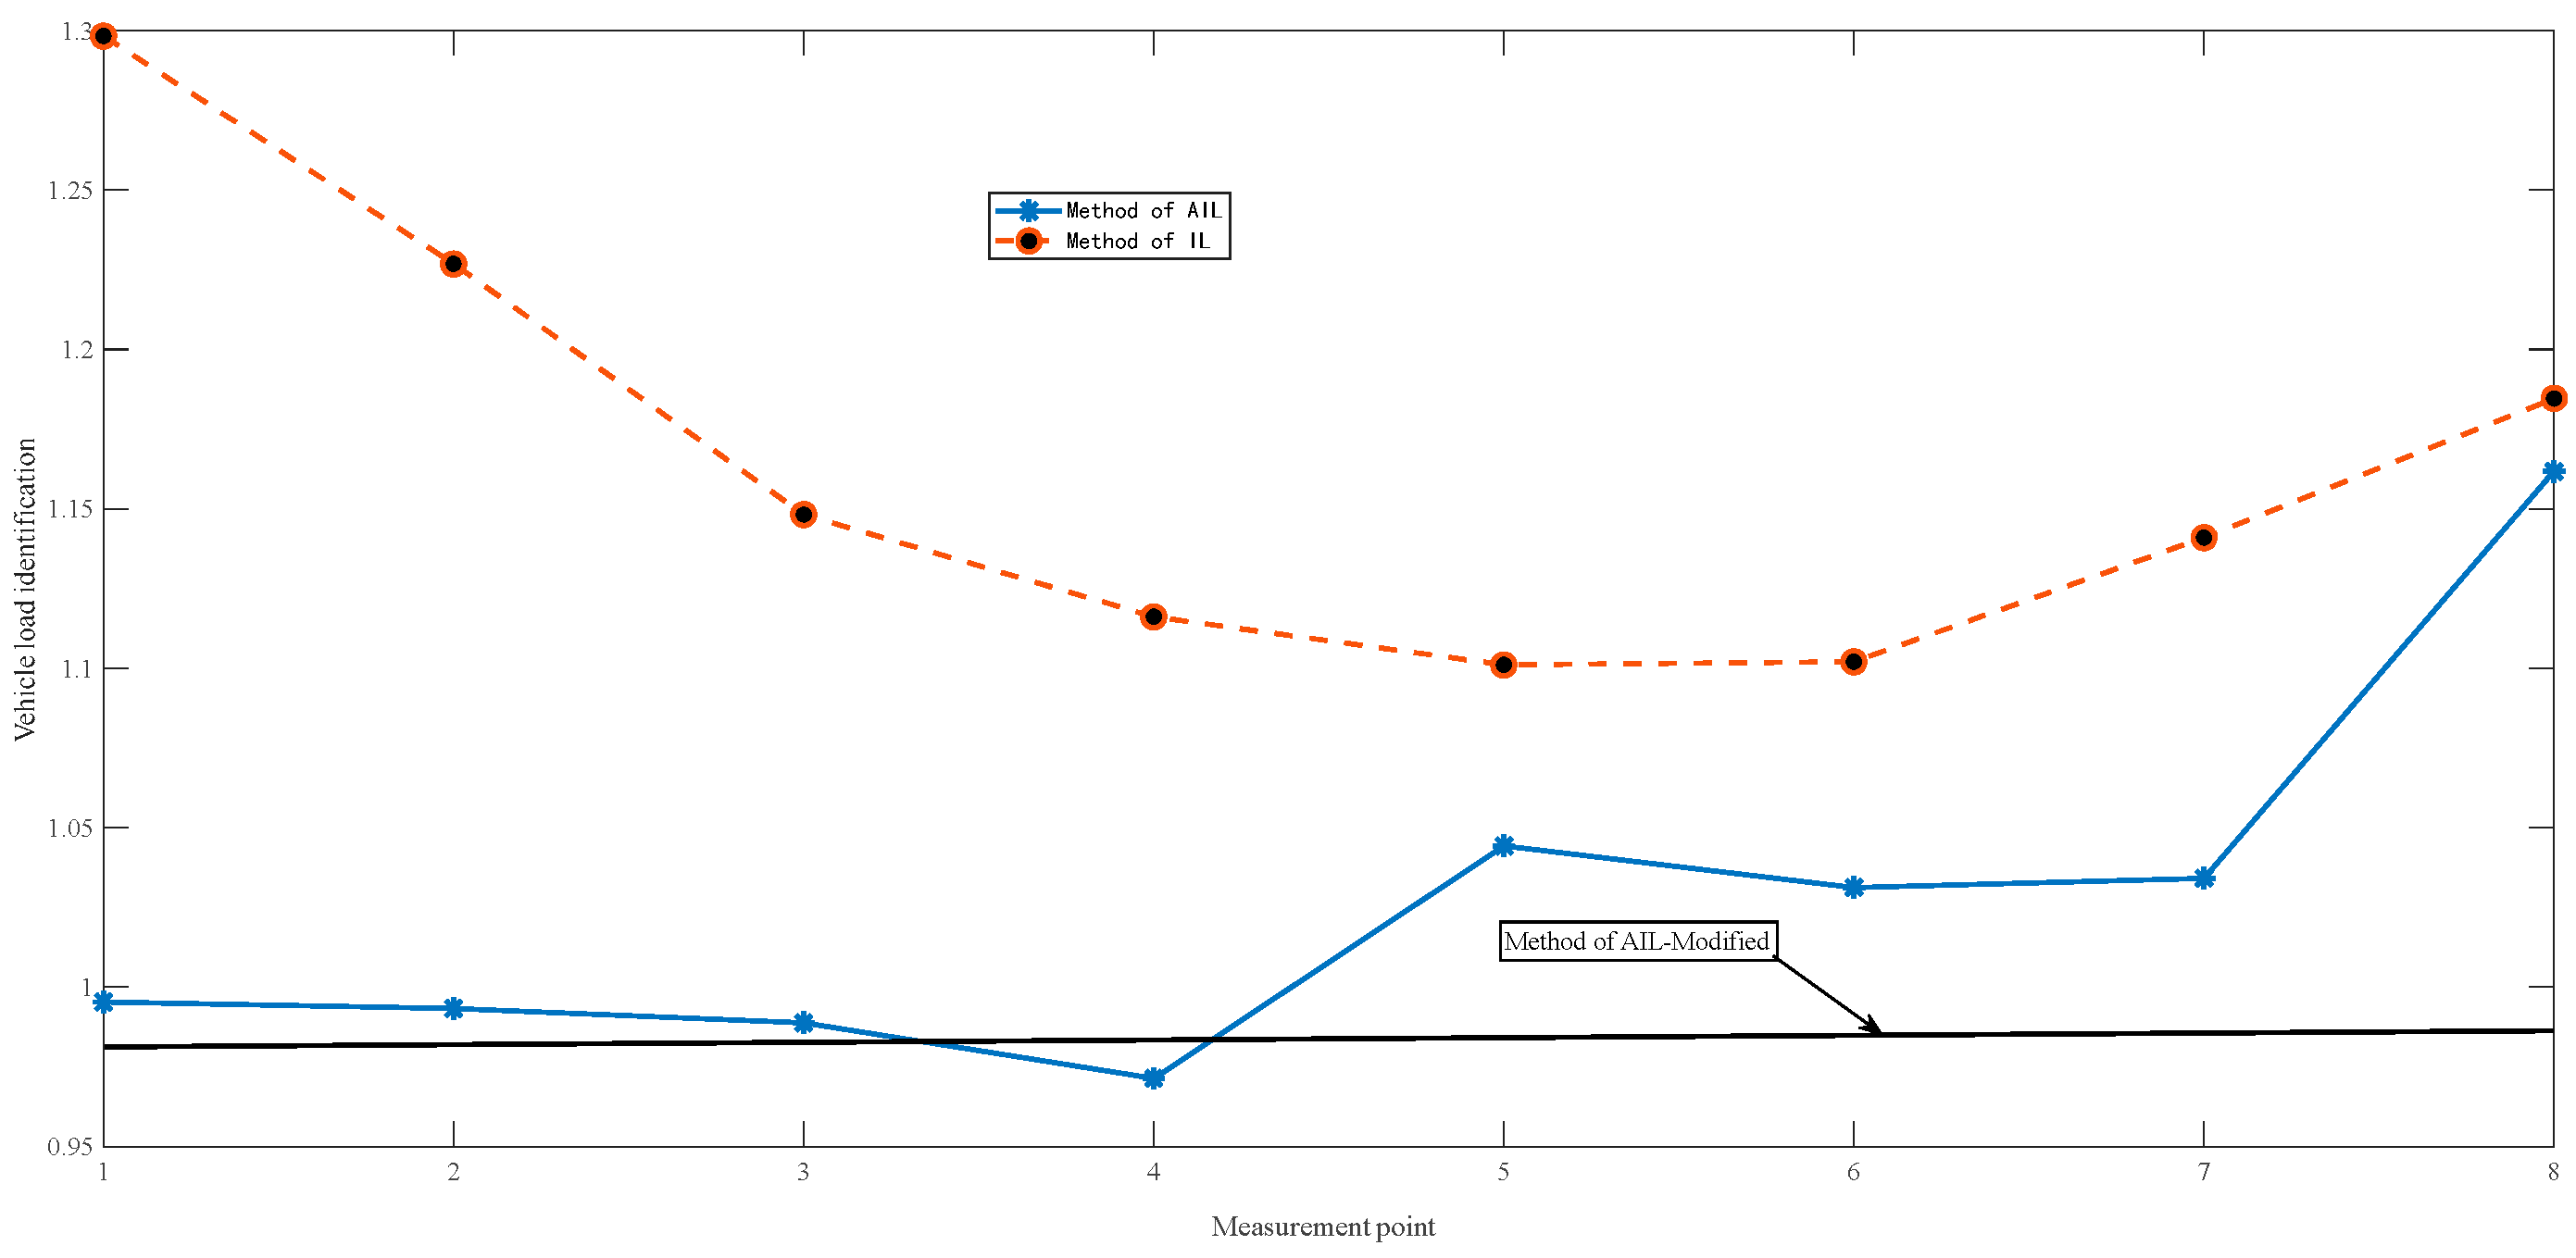
- For cases with uniformly distributed load noise subject to the bridge, the IL method becomes nearly unreliable. The AIL method performs within acceptable error margins, and the AIL-Modified method provides more accurate identification results.
- (4)
- The application of the proposed method to the bridge demonstrates its feasibility and potential for implementation in similar bridge structures. However, the effectiveness of this method is highly dependent on the accuracy of input data. Therefore, further research is necessary to assess its applicability to other types of bridges. And the location of the displacement sensors also has a significant effect.
- (5)
- The accurate moving load identification is fundamentally crucial to fatigue life models that help to assess the remaining life of bridge structures. This underpins the predictive and preventative maintenance regime that is cost-effective and eco-friendly.
Author Contributions
Funding
Institutional Review Board Statement
Informed Consent Statement
Data Availability Statement
Acknowledgments
Conflicts of Interest
Appendix A

| Sect No. | H1 | T1 | T2 | T3 | Beam No. |
|---|---|---|---|---|---|
| 0 | 1080.0 | 120.0 | 90 | 30 | 0 |
| 1 | 1080.0 | 120.0 | 90 | 30 | 1 |
| 2 | 1034.7 | 114.5 | 90 | 30 | 2 |
| 3 | 990.6 | 109.1 | 90 | 30 | 3 |
| 4 | 947.9 | 103.9 | 90 | 30 | 4 |
| 5 | 906.5 | 98.8 | 90 | 30 | 5 |
| 6 | 866.5 | 93.9 | 90 | 30 | 6 |
| 7 | 827.8 | 89.2 | 90 | 30 | 7 |
| 8 | 790.5 | 84.6 | 90 | 30 | 8 |
| 9 | 748.7 | 79.5 | 90 | 30 | 9 |
| 10 | 708.9 | 74.6 | 90 | 30 | 10 |
| 11 | 671.0 | 70.0 | 90 | 30 | 11 |
| 12 | 635.0 | 65.6 | 90 | 30 | 12 |
| 13 | 601.0 | 61.5 | 75 | 30 | 13 |
| 14 | 569.0 | 57.5 | 75 | 30 | 14 |
| 15 | 534.0 | 53.4 | 75 | 30 | 15 |
| 16 | 503.0 | 49.5 | 75 | 30 | 16 |
| 17 | 475.0 | 46.1 | 60 | 30 | 17 |
| 18 | 449.3 | 42.9 | 60 | 30 | 18 |
| 19 | 426.5 | 40.1 | 60 | 30 | 19 |
| 20 | 404.5 | 37.4 | 60 | 30 | 20 |
| 21 | 386.5 | 35.2 | 50 | 30 | 21 |
| 22 | 372.8 | 33.5 | 50 | 30 | 22 |
| 23 | 363.7 | 32.4 | 50 | 30 | 23 |
| 24 | 360.0 | 32.0 | 50 | 30 |
References
- Kaloop, M.R.; Mohammed, E.; Wan, J.H. Safety and reliability evaluations of bridge behaviors under ambient truck loads through structural health monitoring and identification model approaches. Measurement 2022, 187, 110234. [Google Scholar] [CrossRef]
- Li, X.; Zhu, J. Identification of bridge influence line and multiple-vehicle loads based on physics-informed neural networks. Struct. Health Monit. 2025, 24, 1167–1186. [Google Scholar] [CrossRef]
- Zhao, D.; He, W.; Deng, L.; Wu, Y.; Xie, H.; Dai, J. Trajectory Tracking and Load Monitoring for Moving Vehicles on Bridge Based on Axle Position and Dual Camera Vision. Remote Sens. 2021, 13, 4868. [Google Scholar] [CrossRef]
- Mousavi, M.; Holloway, D.; Olivier, J.C. Using a moving load to simultaneously detect location and severity of damage in a simply supported beam. J. Vib. Control 2019, 25, 2108–2123. [Google Scholar] [CrossRef]
- Yang, J.; Hou, P.; Yang, C.; Zhang, Y. Study on the Method of Moving Load Identification Based on Strain Influence Line. Appl. Sci. 2021, 11, 853. [Google Scholar] [CrossRef]
- Liang, H.; Lei, W.; Li, S.; Xiang, C.; Ge, H. The Identification of Multi-Vehicle Moving Loads on the Single Lane Based on Influence Line Method. In Proceedings of the 3rd International Conference on Material Engineering and Application, Shanghai, China, 12–13 November 2016. [Google Scholar]
- Liu, C.; Zhu, Y.; Zeng, Q.; Pan, C.; Duan, Z. Bridge Damage Identification Using Rotation Influence Line Under Random Vehicle Loads. Int. J. Struct. Stab. Dyn. 2023, 24, 2450085. [Google Scholar] [CrossRef]
- Qin, Y.; Tang, Q.; Xin, J.; Yang, C.; Zhang, Z.; Yang, X. A Rapid Identification Technique of Moving Loads Based on MobileNetV2 and Transfer Learning. Buildings 2023, 13, 572. [Google Scholar] [CrossRef]
- Zhang, Q.; Zhao, W.; Zhang, J. Moving Load Identification with Long Gauge Fiber Optic Strain Sensing. Balt. J. Road Bridge Eng. 2021, 16, 131–158. [Google Scholar] [CrossRef]
- Yan, W.; Yuen, K. A new probabilistic frequency-domain approach for influence line extraction from static transmissibility measurements under unknown moving loads. Eng. Struct. 2020, 216, 110625. [Google Scholar] [CrossRef]
- Zhang, H.; Yi, T.; Zhang, X.; Wei, Y.; Li, H. Operational Influence Line Identification of High-Speed Railway Bridge Considering Uncertainty of Train Load. ASCE-ASME J. Risk Uncertain. Eng. Syst. Part A Civ. Eng. 2024, 10, 04024052. [Google Scholar] [CrossRef]
- Qian, C.; Chen, C.; Hong, L.; Dai, L. Axle Load Identification of Moving Vehicles Based on Influence Lines of Bridge Bending Moment. Nonlinear Eng. 2014, 3, 125–131. [Google Scholar] [CrossRef]
- Pimentel, R.; Ribeiro, D.; Matos, L.; Mosleh, A.; Calçada, R. Bridge Weigh-in-Motion system for the identification of train loads using fiber-optic technology. Structures 2021, 30, 1056–1070. [Google Scholar] [CrossRef]
- Pourzeynali, S.; Zhu, X.; Ghari, Z.; Rashidi, M.; Samali, B. Comprehensive Study of Moving Load Identification on Bridge Structures Using the Explicit Form of Newmark-β Method: Numerical and Experimental Studies. Remote Sens. 2021, 13, 2291. [Google Scholar] [CrossRef]
- Liu, J.; Sun, X.; Han, X.; Jiang, C.; Yu, D. A novel computational inverse technique for load identification using the shape function method of moving least square fitting. Comput. Struct. 2014, 144, 127–137. [Google Scholar] [CrossRef]
- Kordi, A.; Mahmoudi, M. Damage Detection in Truss Bridges under Moving Load Using Time History Response and Members Influence Line Curves. Civ. Eng. Infrastruct. J. 2022, 55, 183–194. [Google Scholar]
- Cavadas, F.; Smith, I.; Figueiras, J. Damage detection using data-driven methods applied to moving-load responses. Mech. Syst. Signal Process. 2013, 39, 409–425. [Google Scholar] [CrossRef]
- Zhu, J.; Zhang, C.; Li, X. Structural damage detection of the bridge under moving loads with the quasi-static displacement influence line from one sensor. Measurement 2023, 211, 112599. [Google Scholar] [CrossRef]
- Zhou, Y.; Zhang, D.; Di, S.; Huang, J. Research on damage diagnosis method of beam bridge based on multi-source influence line information fusion. J. Earthq. Eng. 2019, 46, 1300–1310. (In Chinese) [Google Scholar]
- Wu, B.; Wu, G.; Yang, C.; He, Y. Damage identification and bearing capacity evaluation of bridges based on distributed long-gauge strain envelope line under moving vehicle loads. J. Intell. Mater. Syst. Struct. 2016, 27, 2344–2358. [Google Scholar] [CrossRef]
- Wu, B.; Wu, G.; Yang, C.; He, Y. Damage identification method for continuous girder bridges based on spatially-distributed long-gauge strain sensing under moving loads. Mech. Syst. Signal Process. 2018, 104, 415–435. [Google Scholar] [CrossRef]
- Zhu, X.; Cao, M.; Ostachowicz, W.; Xu, W. Damage Identification in Bridges by Processing Dynamic Responses to Moving Loads: Features and Evaluation. Sensors 2019, 19, 463. [Google Scholar] [CrossRef] [PubMed]
- Yang, J.; Hou, P.; Yang, C.; Yang, N.; Li, K. Damage Identification Method of Box Girder Bridges Based on Distributed Long-Gauge Strain Influence Line under Moving Load. Sensors 2021, 21, 915. [Google Scholar] [CrossRef]
- Zhou, Y.; Li, M.; Shi, Y. Damage Identification Method ofTied-Arch Bridges Based on the Equivalent Thrust-Influenced Line. Struct. Control Health Monit. 2024, 33, 6896975. [Google Scholar] [CrossRef]
- Yang, J. Research on Bridge Damage Identification and Monitoring System Based on Distributed Long Range FBG Sensing. Ph.D. Thesis, Southeast University, Nanjing, China, 2021. (In Chinese). [Google Scholar]
- Moslehi Tabar, A.; Tsavdaridis, K.D.; Bravo-Haro, M. Identification of high-speed moving loads using weakened modal shape functions conceptualised by the dynamic influence line. Structures 2025, 74, 108549. [Google Scholar] [CrossRef]
- Sun, H.; Peng, X.; Xu, J.; Tu, H. Identification of Moving Train Axle Loads for Simply Supported Composite Beam Bridges in Urban Rail Transit. Appl. Sci. 2024, 14, 8310. [Google Scholar] [CrossRef]
- Wang, H.; Zhu, Q.; Li, J.; Mao, J. Identification of moving train loads on railway bridge based on strain monitoring. Smart Struct. Syst. 2019, 23, 263–278. [Google Scholar]
- Sieniawska, R.; Śniady, P.; Żukowsi, S. Identification of the structre parameters applying a moving load. J. Sound. Vib. 2009, 319, 355–365. [Google Scholar] [CrossRef]
- Hester, D.; Brownjohn, J.; Huseynov, F.; Obrien, E.; Gonzalez, A.; Casero, M. Identifying damage in a bridge by analysing rotation response to a moving load. Struct. Infrastruct. Eng. 2020, 16, 1050–1065. [Google Scholar] [CrossRef]
- Carbonari, S.; Nicoletti, V.; Martini, R.; Gara, F. Dynamics of bridges during proof load tests and determination of mass-normalized mode shapes from OMA. Eng. Struct. 2024, 310, 118111. [Google Scholar] [CrossRef]
- Parloo, E.; Cauberghe, B.; Benedettini, F.; Alaggio, R.; Guillaume, P. Sensitivity-based operational mode shape normalisation: Application to a bridge. Mech. Syst. Signal Process. 2005, 19, 43–55. [Google Scholar] [CrossRef]
- He, Y.; Zhang, Y.; Yang, C. Research on Bridge Load Identification Technology Based on Influence Line. Mod. Transp. Technol. 2016, 13, 48–51. (In Chinese) [Google Scholar]
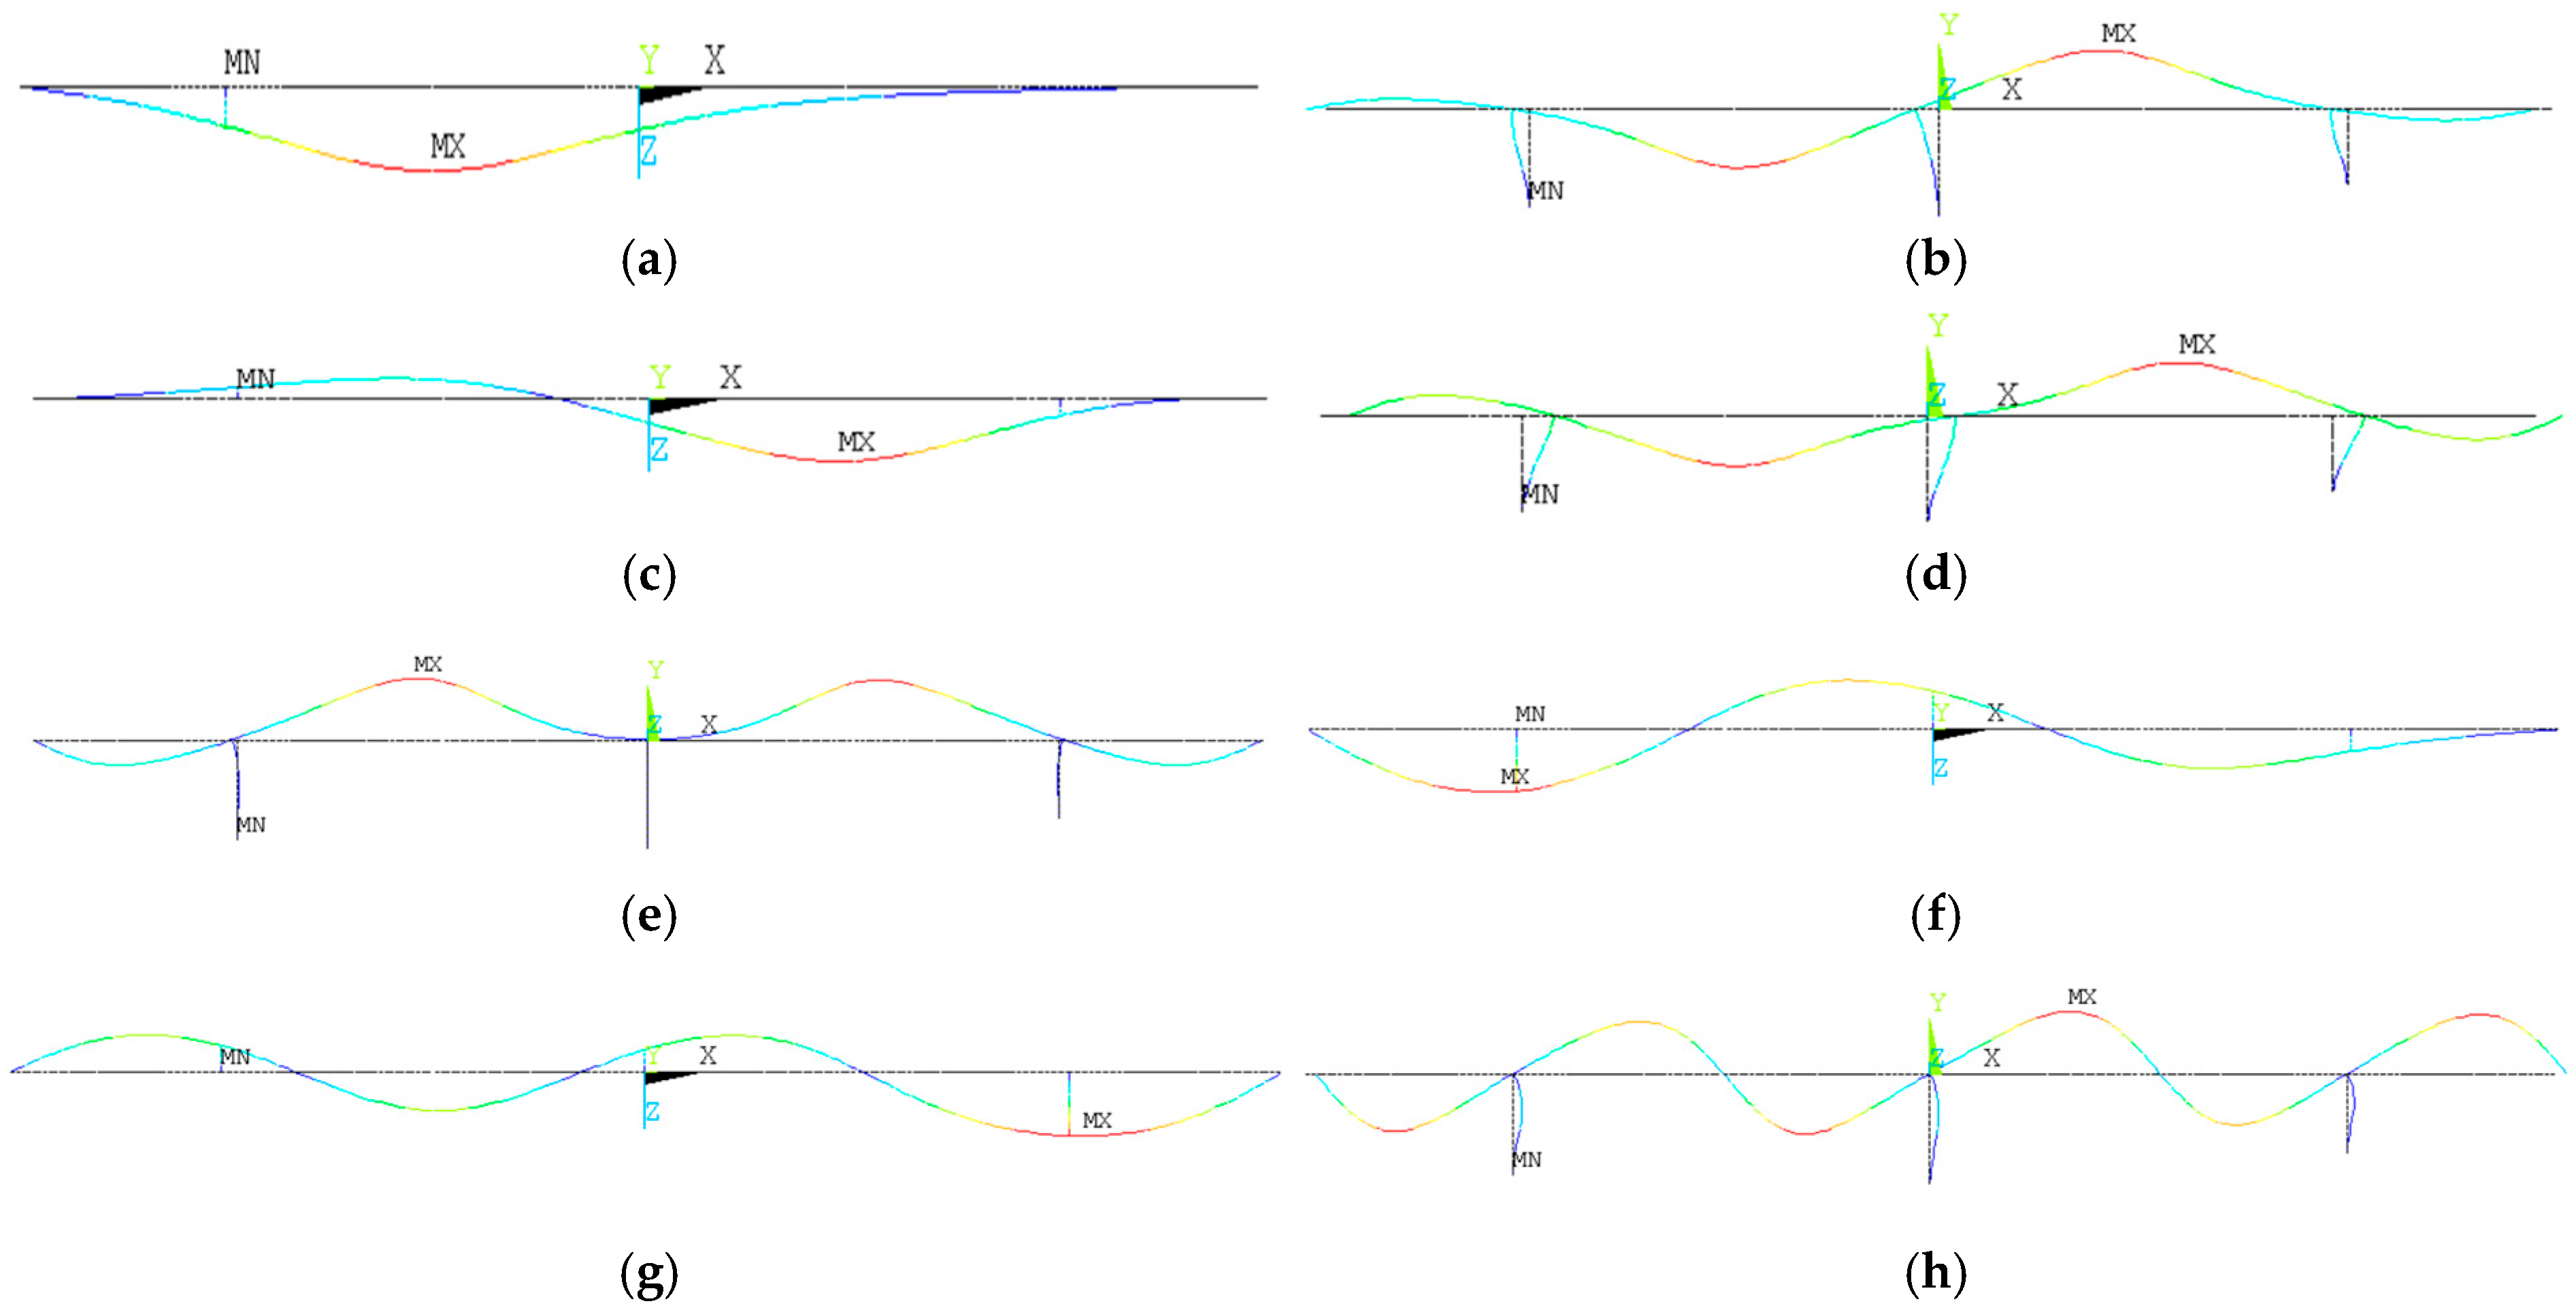


| Modal Order | 1 | 2 | 3 | 4 | 5 | 6 | 7 | 8 |
|---|---|---|---|---|---|---|---|---|
| Simulation | 0.53 | 0.53 | 0.58 | 0.63 | 0.79 | 0.88 | 1.10 | 1.29 |
| Measured value | 0.52 | 0.52 | 0.53 | 0.68 | 0.84 | 0.89 | 1.14 | 1.36 |
| Errors | 0.01 | 0.01 | 0.05 | −0.05 | −0.05 | −0.01 | −0.04 | −0.07 |
| Case | Speed (m/s) | Load (kN) | Noise | Remark |
|---|---|---|---|---|
| 1 | 3.0 | 10 | / | Single point |
| 2 | 3.0 | 10 | 5% × sin(5t) | |
| 3 | 5.0 | 10 | 10% × sin(5t) | |
| 4 | 3.0 | 10 | 10% × sin(10t) | Two points |
| Case | Load (kN) | Noise Amplitude | Remarks |
|---|---|---|---|
| 5 | 10 | 0.5% | The mean of the disturbance noise is zero. |
| 6 | 10 | 1.0% |
| Case | Load | Noise Type | Noise Strength | Remark |
|---|---|---|---|---|
| 7 | 10 | Uniform random | 0.5% | Mean of disturbance Noise is 0.5 |
| 8 | 10 | 1.0% |
| Case | Noise Details | IL | AIL | AIL-Modified |
|---|---|---|---|---|
| 1 | Moving-load noise | 1.2% | 2.2% | 1.8% |
| 2 | 2.2% | 2.4% | 2.2% | |
| 3 | 2.3% | 1.8% | 1.9% | |
| 4 | Two point (3 m) | 1.5% | 2.0% | 1.5% |
| 5 | White noise Mean zero | 6.3% | 3.2% | 2.2% |
| 6 | 15.3% | 2.6% | 2.7% | |
| 7 | White noise Mean 0.5 | 45% | 7.2% | 2.3% |
| 8 | 93% | 10.3% | 3.2% |
| MIRAN-130 | Range | Precision | Temperature | Sample Rate |
|---|---|---|---|---|
| Value | 0–500 mm | 0.1% × F.S | −40~85 °C | 1–20 Hz |
| Method | P1 | P2 | P3 | P4 | P5 | P6 | P7 | P8 |
|---|---|---|---|---|---|---|---|---|
| IL | 42.7 | 43.0 | 39.2 | 42.4 | 42.2 | 38.3 | 37.9 | 41.1 |
| AIL | 42.6 | 42.3 | 44.6 | 41.1 | 42.9 | 42.8 | 42.7 | 43.8 |
| AIL-Modified | 43.1 | |||||||
| Measured value | 44.6 | |||||||
Disclaimer/Publisher’s Note: The statements, opinions and data contained in all publications are solely those of the individual author(s) and contributor(s) and not of MDPI and/or the editor(s). MDPI and/or the editor(s) disclaim responsibility for any injury to people or property resulting from any ideas, methods, instructions or products referred to in the content. |
© 2025 by the authors. Licensee MDPI, Basel, Switzerland. This article is an open access article distributed under the terms and conditions of the Creative Commons Attribution (CC BY) license (https://creativecommons.org/licenses/by/4.0/).
Share and Cite
Deng, L.; Liu, P.; Huang, T.; Kaewunruen, S. A Novel Moving Load Identification Method for Continuous Rigid-Frame Bridges Using a Field-Based Displacement Influence Line. Appl. Sci. 2025, 15, 6028. https://doi.org/10.3390/app15116028
Deng L, Liu P, Huang T, Kaewunruen S. A Novel Moving Load Identification Method for Continuous Rigid-Frame Bridges Using a Field-Based Displacement Influence Line. Applied Sciences. 2025; 15(11):6028. https://doi.org/10.3390/app15116028
Chicago/Turabian StyleDeng, Linyong, Ping Liu, Tianli Huang, and Sakdirat Kaewunruen. 2025. "A Novel Moving Load Identification Method for Continuous Rigid-Frame Bridges Using a Field-Based Displacement Influence Line" Applied Sciences 15, no. 11: 6028. https://doi.org/10.3390/app15116028
APA StyleDeng, L., Liu, P., Huang, T., & Kaewunruen, S. (2025). A Novel Moving Load Identification Method for Continuous Rigid-Frame Bridges Using a Field-Based Displacement Influence Line. Applied Sciences, 15(11), 6028. https://doi.org/10.3390/app15116028