1. Introduction
Since the first ruby laser [
1] was invented in 1960, laser technology has advanced rapidly from a basic light source to an extreme physical property control tool. In the 1990s, the breakthrough of Chirped Pulse Amplification (CPA) technology [
2,
3,
4,
5,
6] increased the peak intensity of lasers, which gave rise to the widespread application of ultrashort (femtosecond to attosecond) pulses [
7] and became the core means to study ultrafast processes such as chemical bond cleavage and biomolecular reactions [
8]. To generate radiation with shorter wavelengths and higher energies, scientists have developed a variety of nonlinear techniques: dynamic compression based on molecular modulation [
9], frequency shift control of stimulated Raman scattering [
10], and nonlinear Thomson scattering. Moreover, it is important to note that relativistic electrons in a strong laser field are driven by a periodic ponderomotive force to generate high-order harmonics, and finally radiate X-rays [
11,
12,
13,
14,
15,
16] and even gamma photons [
17,
18,
19,
20,
21]. This kind of ultrashort and high-energy photon source not only makes it possible to directly observe the electron ionization dynamics at the atomic scale but also provides a revolutionary tool for pump–probe experiments and high-resolution imaging. Meanwhile, the latest research utilizes the characteristics of the quantized electromagnetic field coupled with Frenkel excitons in organic materials to form an exciton–polariton (EP) [
22]. Currently, nonlinear Thomson scattering has become a key research direction in extreme optical physics and the design of compact particle accelerators due to its characteristics of efficiently generating narrow pulse width and high-brightness radiation in a strong field, continuously promoting multi-field innovations from basic quantum dynamics to medical imaging technology.
It is well known that nonlinear Thomson scattering does not require complex accelerator facilities. It only needs the interaction between the laser and the gas target to generate a compact high-energy photon source, significantly reducing the experimental cost and scale. These characteristics make it have irreplaceable application potential in fields such as dynamic imaging, nuclear physics, and medical radiotherapy. Moreover, we only need to precisely manipulate the spatial angular distribution and spectral characteristics of radiation by regulating the laser polarization (linear, circular, or elliptical polarization), thereby achieving flexible customization of the light source parameters. For circular polarization, Wang [
23] and others studied the spatial radiation characteristics of electron Thomson scattering in a circularly polarized tightly focused laser beam and found that in a strong laser pulse, most of the radiation energy is decoupled. Zhang [
24] and others studied the optimal waist radius of nonlinear Thomson scattering under the action of an external magnetic field. For the linearly polarized laser system, Chen et al. [
25] studied the emission spatial characteristics under different laser intensities and found changes in the position and number in the lobed radiation pattern. Yu et al. [
26] studied the analysis of the waist in the spatial emission characteristics of electrons driven by a strong linearly polarized laser pulse. However, there is currently a lack of systematic analyses of the spatial emission characteristics of electrons under the synergy of laser intensity and waist radius of linearly polarized laser pulses. This paper focuses on the parametric space of linearly polarized NTS. By constructing a three-dimensional electron dynamics model, we reveal the coupling regulation law of laser intensity and waist radius on radiation power, electron trajectory, and time spectrum, aiming to establish a universal framework for inverting laser parameters from radiation characteristics and provide theoretical support for the on-demand design of highly directional X/γ-ray sources.
2. Materials and Methods
We have learned that paraxial approximation can no longer meet the requirements of tightly focused lasers and that higher-order field effects [
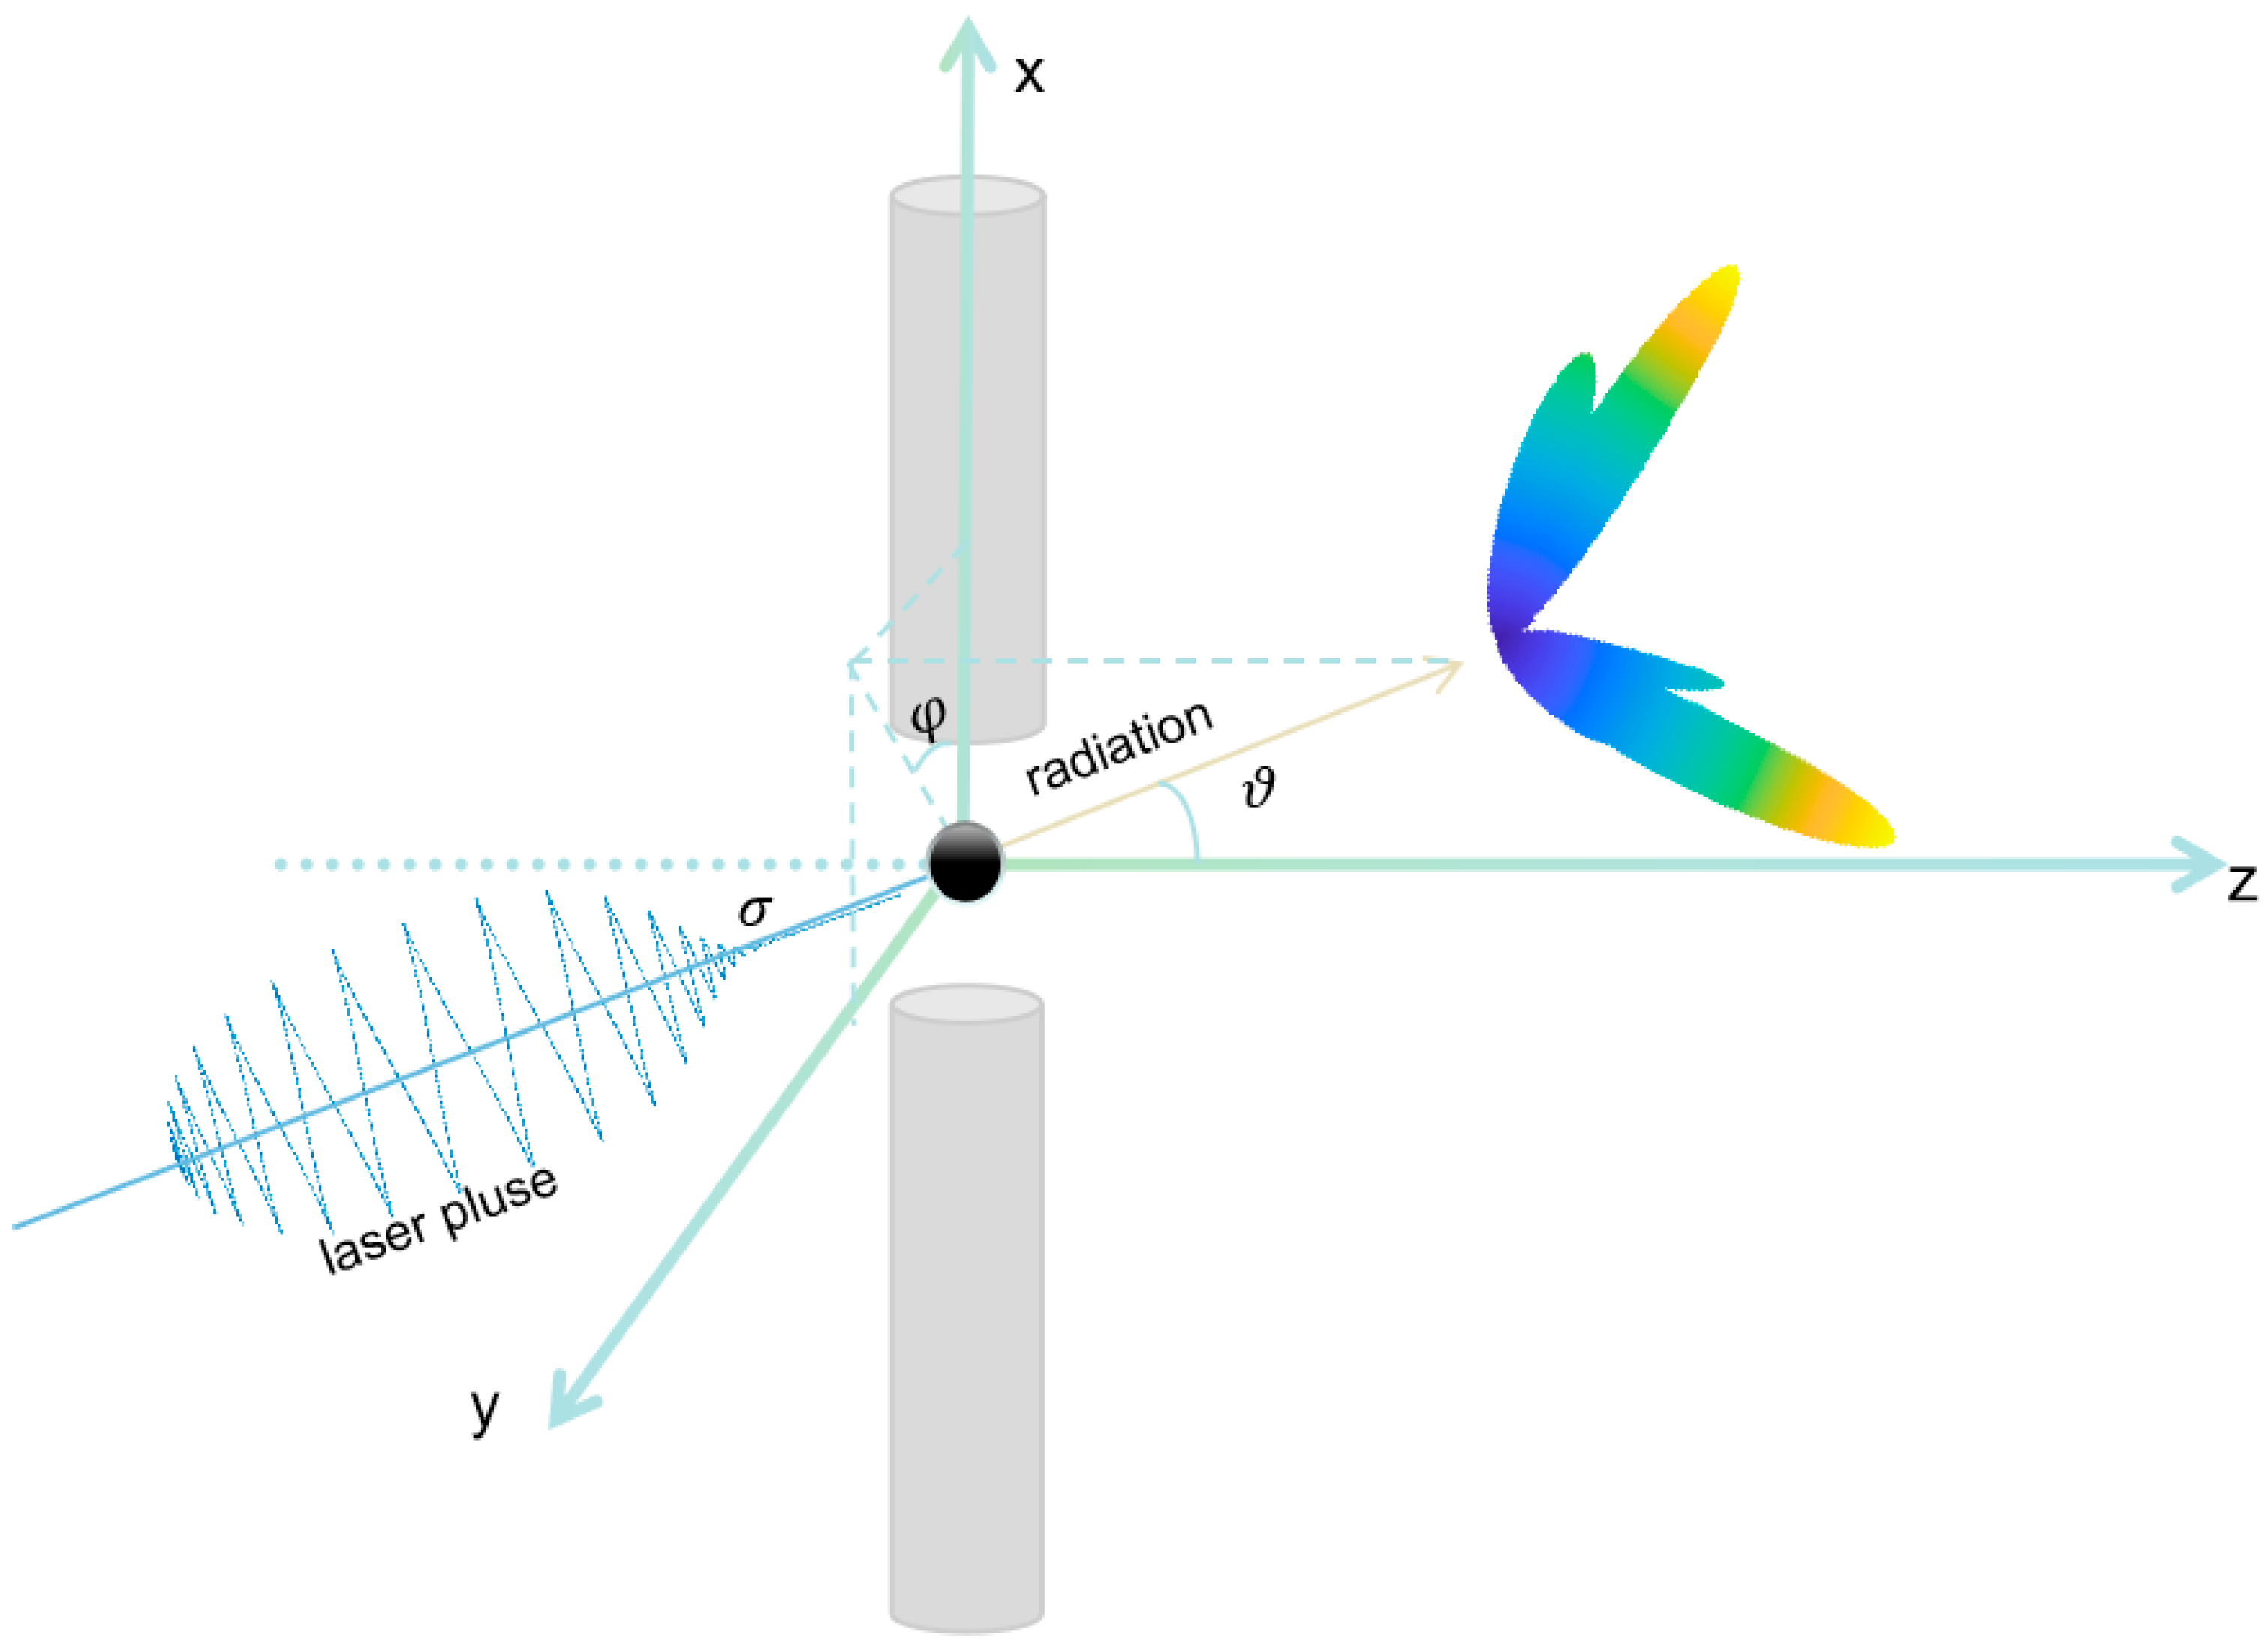
27] need to be considered. The process we simulated is shown in
Figure 1. By modeling and performing linear polarization vector decomposition of the light beam, the following electric field components can be obtained:
Similarly, the magnetic field part can also be decomposed into the following parts:
In Equations (1)–(6), it is stated that , , . The cross-section of the tightly focused beam has a circular form with a radius of , since we approximate it as a long cylinder. This indicates that the cross-section across every point z on the axis is also circular, with a radius of , determined by k = and the Rayleigh length . For laser electron collision, we select the z-axis as the trajectory. In the absence of any further requirements, the laser’s focus z is 0. The focus spot is the only location where the laser can be maintained at its strongest since it has the lowest laser radius and the maximum laser intensity. is the diffraction angle.
L represents the pulse width, and it is related to the beam duration.
, where
represents the duration of the laser.
In the equation, indicates a constant phase, and it also shows that . is expressed as the wavefront curvature phase, and is expressed as the plane wave phase. When moving from −∞ to +∞, the Guoy phase associated with a Gaussian beam with a total phase shift in π is represented as , and the radius of curvature of the wavefront intersecting the beam axis is represented as .
The following definitions apply to several coefficients of the formula:
,
and
. These equations are created using the vector potential of amplitude
and frequency
ω. Each field satisfies the Maxwell equation
E plus the handwritten epsilon power of one-sixth of the order term. This work establishes a model that only designs one electron. Through the numerical solution of the equation, we analyzed the dynamics of the electron, mass
m, and charge
.
The momentum p is equal to , and the energy . The Lorentz factor . u is the velocity, normalized by the speed of light c in a vacuum. The expression for the peak field strength is in which . This paper adopts . Therefore, (W/cm2). It will not be repeated later.
n represents the spatial coordinate system, and the radiation direction vector is expressed as , which corresponds to the spherical coordinate representation. The azimuthal angle in the plane perpendicular to the origin describes the deflection orientation, while the polar angle characterizes the angular deviation relative to the laser propagation direction.
In this study, the single-electron radiation power and spectrum are of central importance. We therefore present the governing equations below:
The radiation power at time t is normalized to per unit solid angle (Ω). The above equation represents the n-th harmonic radiation power per unit solid angle, where denotes the electron acceleration. This implies that once the electron’s dynamical state is determined, its electromagnetic radiation can be quantitatively evaluated. Additionally, the relation defines the retarded time t’, with being the observer-to-origin distance and r the electron’s position vector. The cumulative radiation energy within each solid angle critically depends on the temporal evolution of the radiation power.
By substituting the laser’s electric and magnetic field components, we obtain the following:
In the equations, the normalized frequency is defined as , where ω is the frequency of the scattered radiation. The energy radiated per unit solid angle (Ω) and per unit frequency interval (dω) is normalized to . Finally, the radiation energy spectrum is expressed by Equation (14), where denotes vacuum permittivity and represents the vector field of the scattered radiation.
3. Results
The optical parameters of the laser system encompass the peak amplitude, beam waist, and pulse duration ranging from ultrashort to extended regimes. Building upon this framework, we systematically investigated the electrodynamic, spatiotemporal, and spectral-domain evolution of nonlinear Thomson scattering (NFTS) radiation under Gaussian laser pulses, spanning transitions from weak-field to ultra-relativistic intensities and from tightly focused to quasi-plane-wave geometries.
3.1. The Coupling Effect of Optical Characteristic Parameters on Radiative Characteristics
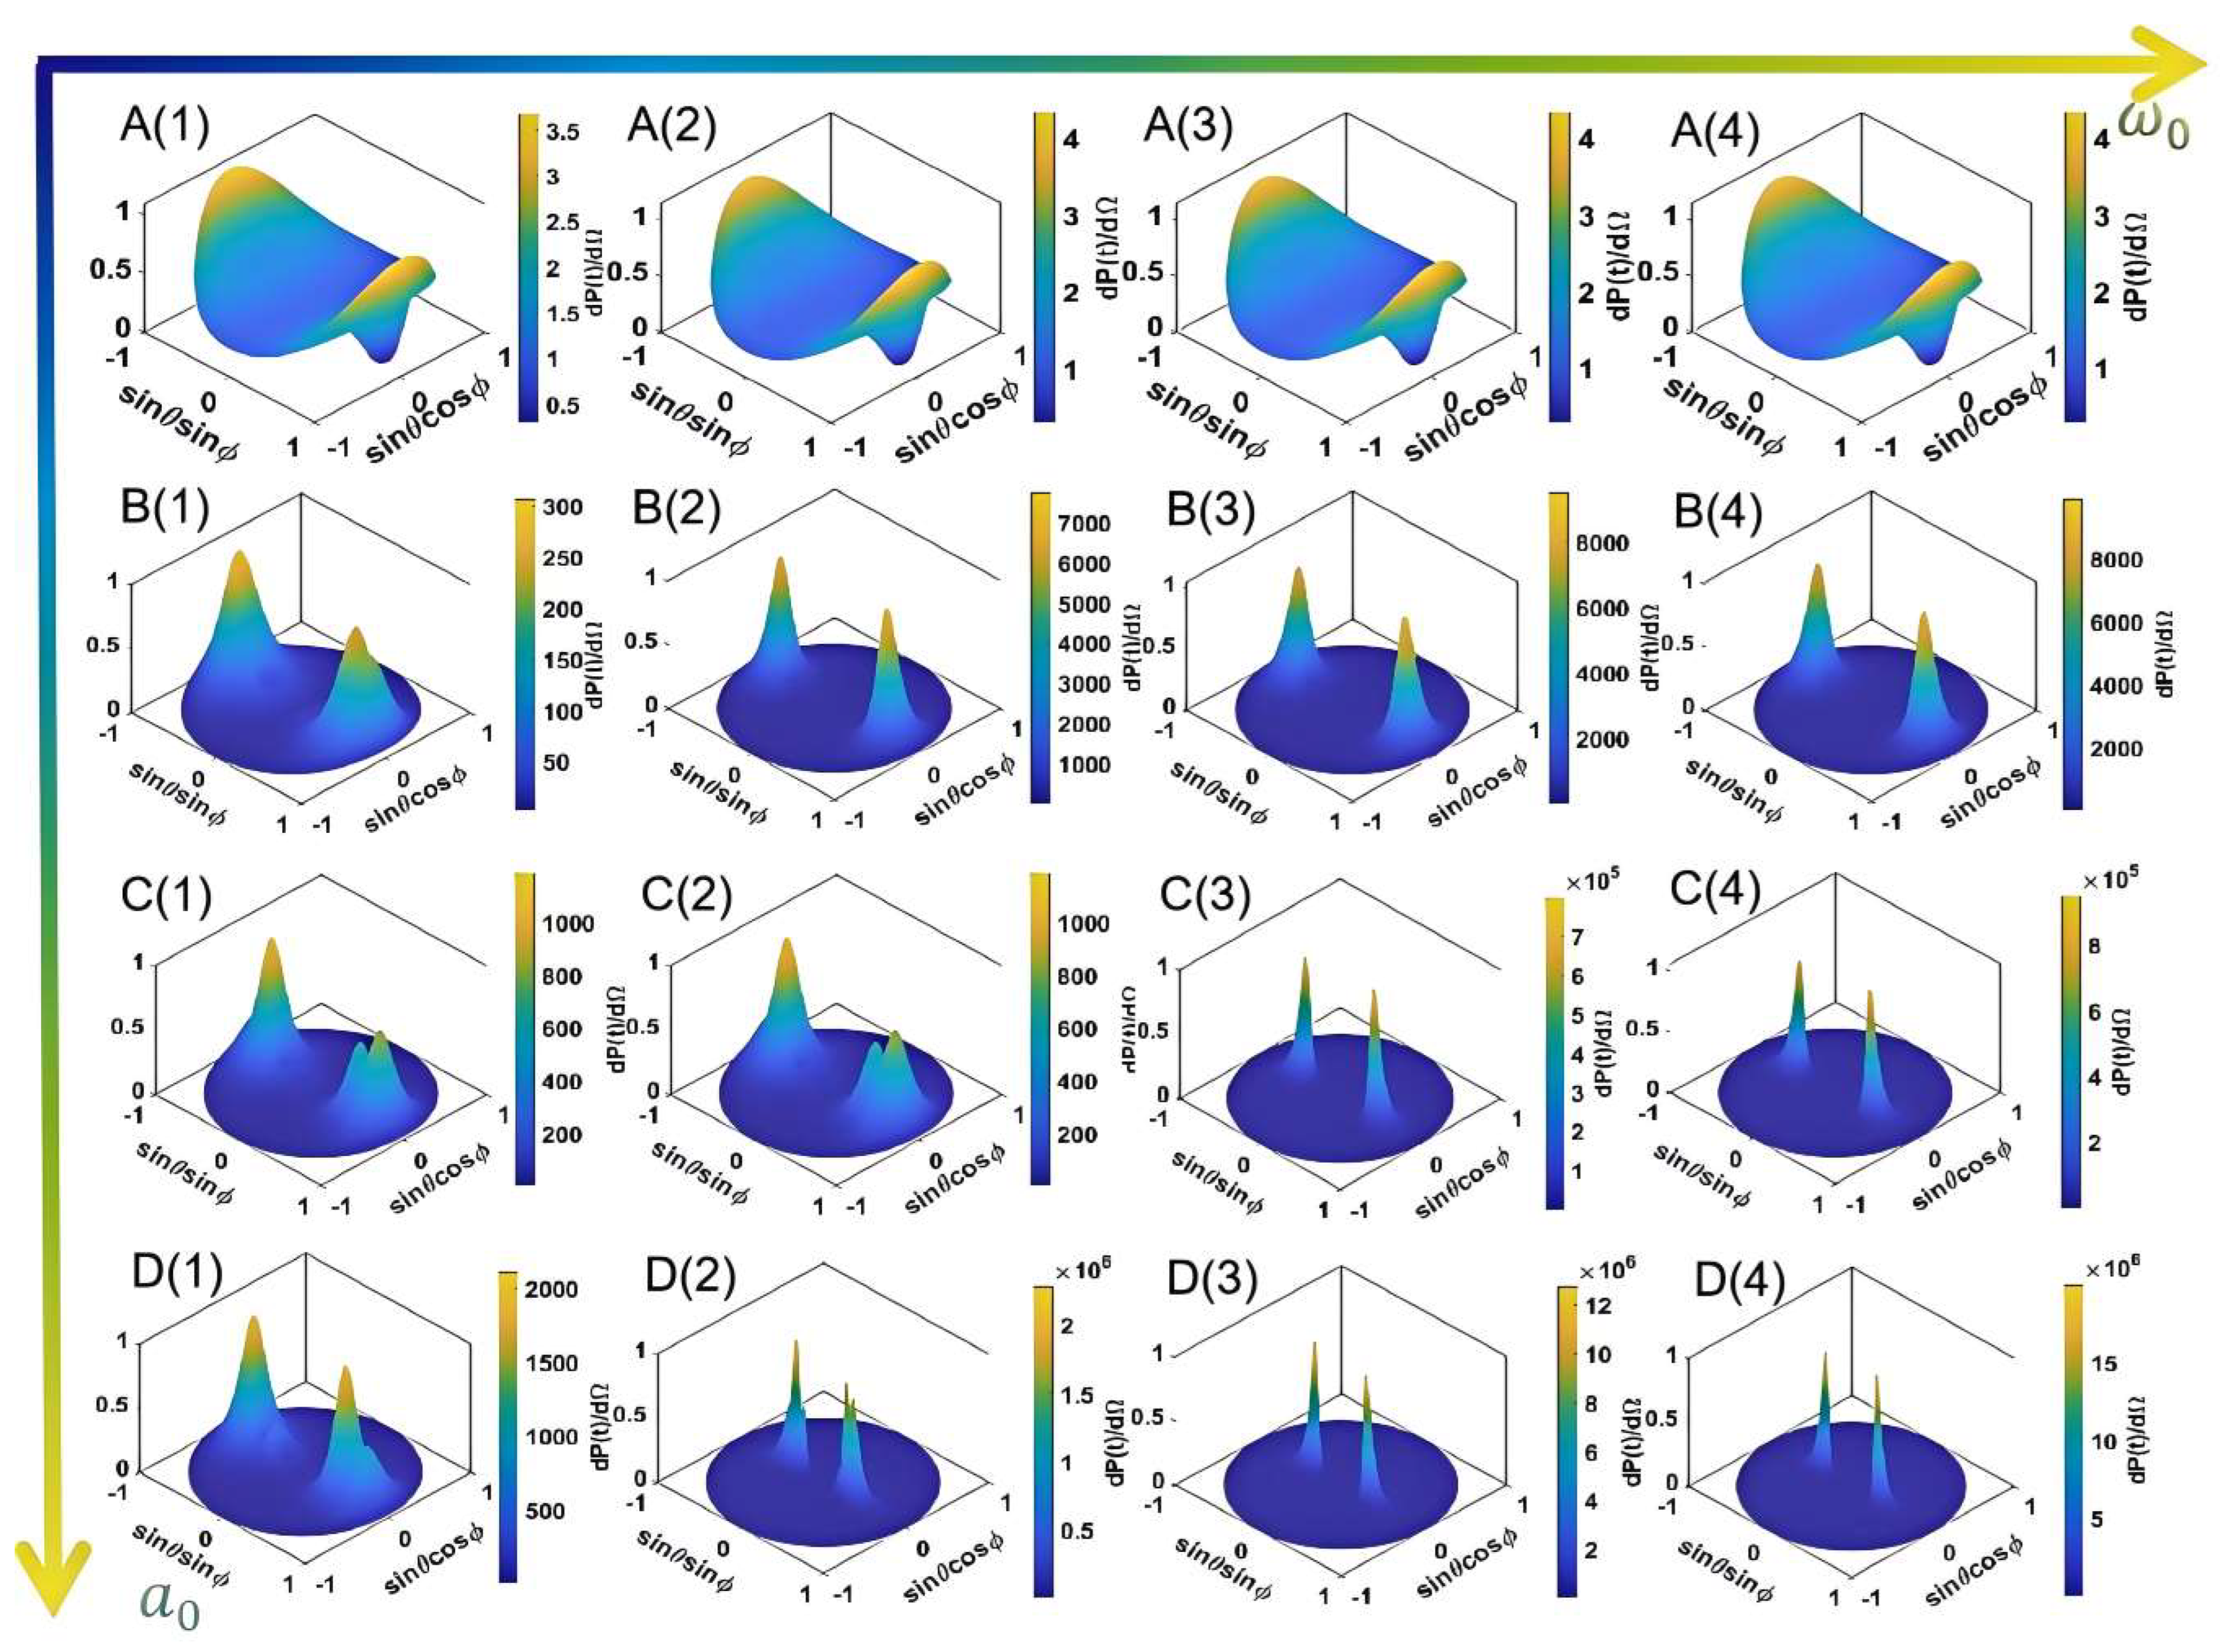
To investigate the influence of laser intensity () and beam waist radius () on nonlinear Thomson scattering (NTS), we systematically varied ω0 across a range of values (1 ≤ ≤ 9, 1 ≤ ≤ 9). For the convenience of research, it is stated again that has undergone normalization processing, so it has no unit. is at the micron level, and this will not be repeated later. Numerical results reveal that both increasing and enhances the electron radiation power. Notably, when is not excessively small, its impact on radiation power exhibits a linear enhancement within approximately one order of magnitude. In contrast, the dependence on follows a pronounced exponential growth trend. This demonstrates that while both parameters positively modulate radiation power, dominates the scaling behavior, and a detailed decoupled analysis of their individual effects will follow. Below, we focus on their synergistic coupling mechanisms.
In
Figure 2, when the laser intensity is relatively low (
< 3), variations in the beam waist radius (
) exhibit negligible effects on the electron radiation power. For instance, as
increases from 1 to 9, the radiation power rises by merely 0.5 t/Ω. Notably, a critical transition occurs at
= 3, and scaling ω
0 within the same range (1–9) amplifies the radiation power by one order of magnitude. This enhancement escalates progressively with higher
—reaching two, three, and four orders of magnitude at
= 5, 7, and 9, respectively. These observations collectively demonstrate that while
and
synergistically enhance radiation power, their coupling strength grows nonlinearly with increasing
. Specifically, higher
values amplify the sensitivity of radiation power to
, revealing a dominant role of laser intensity in mediating the beam waist-radius-dependent energy scaling.
Our observations reveal that increasing the beam waist radius () significantly enhances the spatial symmetry of electron radiation patterns. Initially, the radiation spectrum may exhibit multiple spectral peaks; however, while the laser intensity () exerts limited control over the number or intensity of these peaks (failing to effectively concentrate radiation power), enlarging drastically reduces the number of minor peaks, leading to a more centralized energy distribution.
By integrating the data of the radiation power and through data fitting, we have drawn a three-dimensional image (
Figure 3). Meanwhile, in order to increase the contrast, we have taken the logarithm of the radiation power with base 10. This further supports the above research content.
In summary, higher laser intensities () amplify the sensitivity of radiation symmetry to variations in . Under fixed values of , larger values not only boost the total radiation power but also improve its collimation, with the power scaling approximately being quadratically dependent on . These findings highlight the critical role of beam waist radius modulation in tailoring radiation coherence and efficiency under relativistic laser–electron interactions.
Given the negligible influence of the beam waist radius (
) on radiation power at low laser intensities (
< 3), we selected
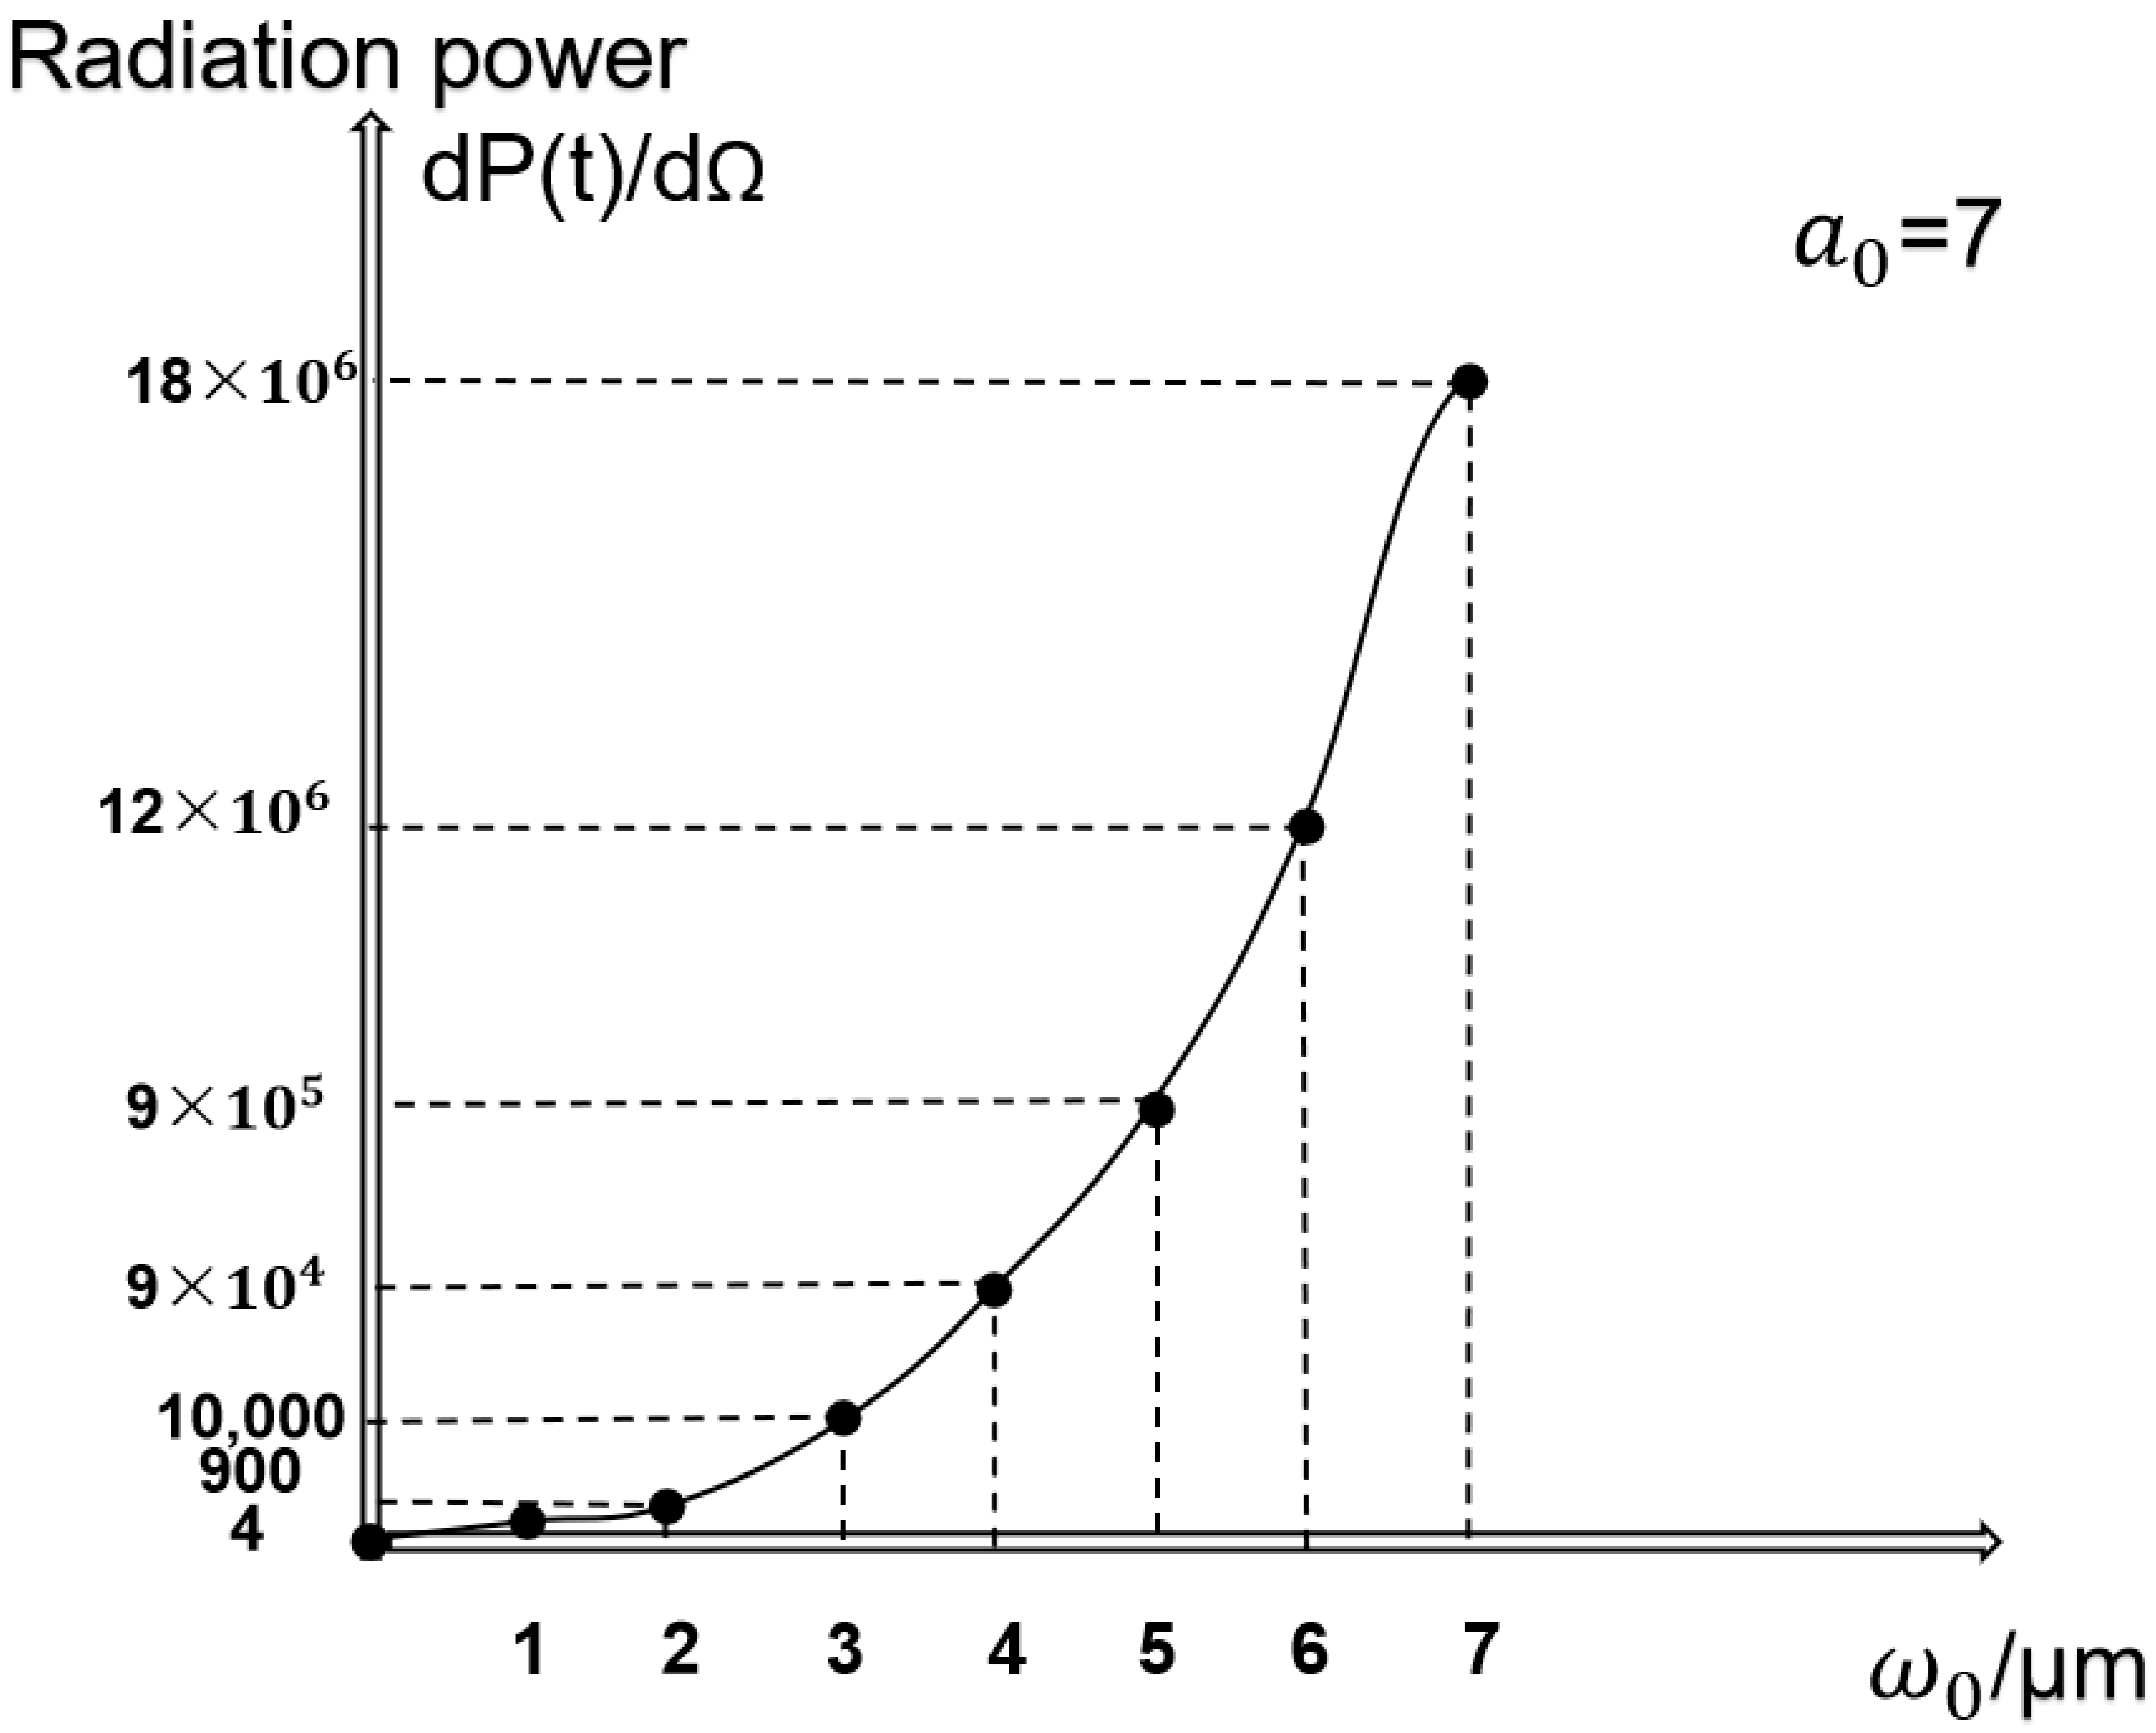
= 7 to maximize the sensitivity of radiation dynamics to
, thereby amplifying its effect and enhancing the observability of the phenomenon. As evidenced by the data in
Figure 4, when
is initially small, it drives a rapid exponential enhancement of electron radiation power. However, once a critical threshold of
is reached, the scaling transitions to a steady linear regime, reflecting a saturation of geometrically focused benefits.
Building on the prior findings that laser intensity (
) dominates radiation power scaling, we analyze the case of
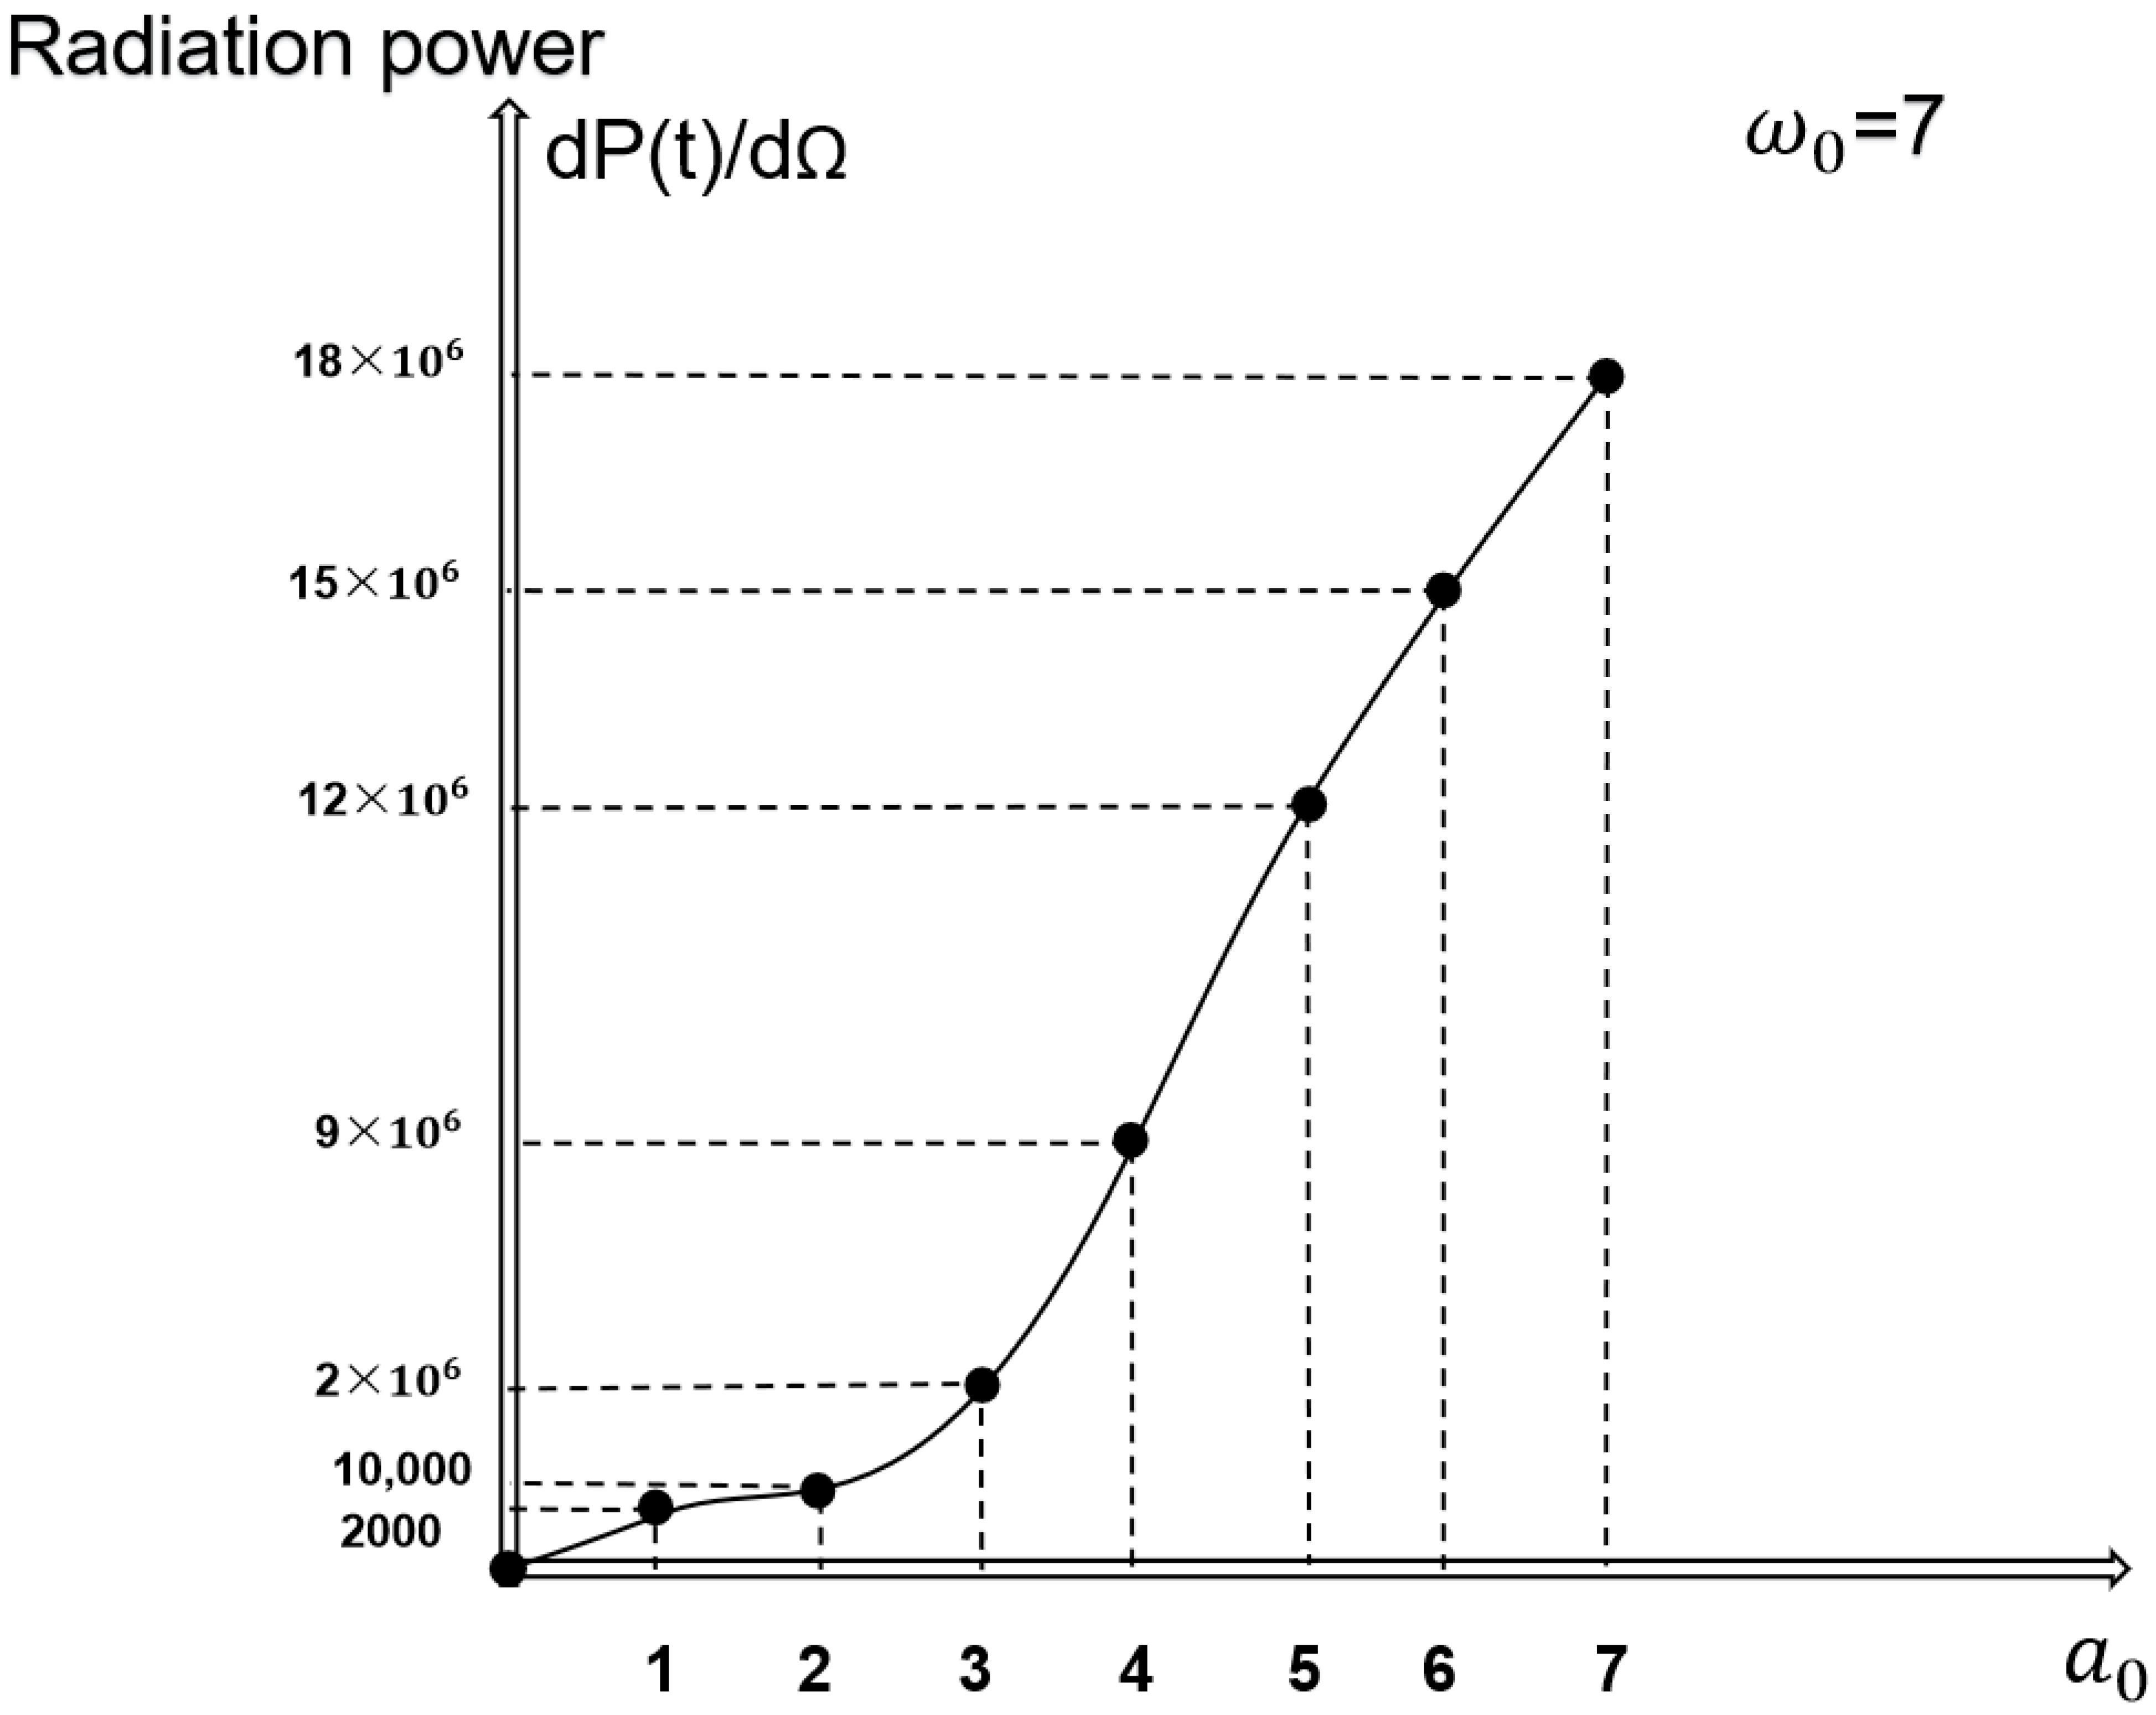
= 7 to amplify the effects of
. As shown in
Figure 5, the radiation power exhibits exponential growth for
= 1–6, transitioning to a quasi-linear regime at
= 6–7. This clearly demonstrates that the exponential phase governed by
spans a broader parameter range, offering greater potential for optimizing radiation power compared to the linear saturation stage.
3.2. Electronic Trajectory
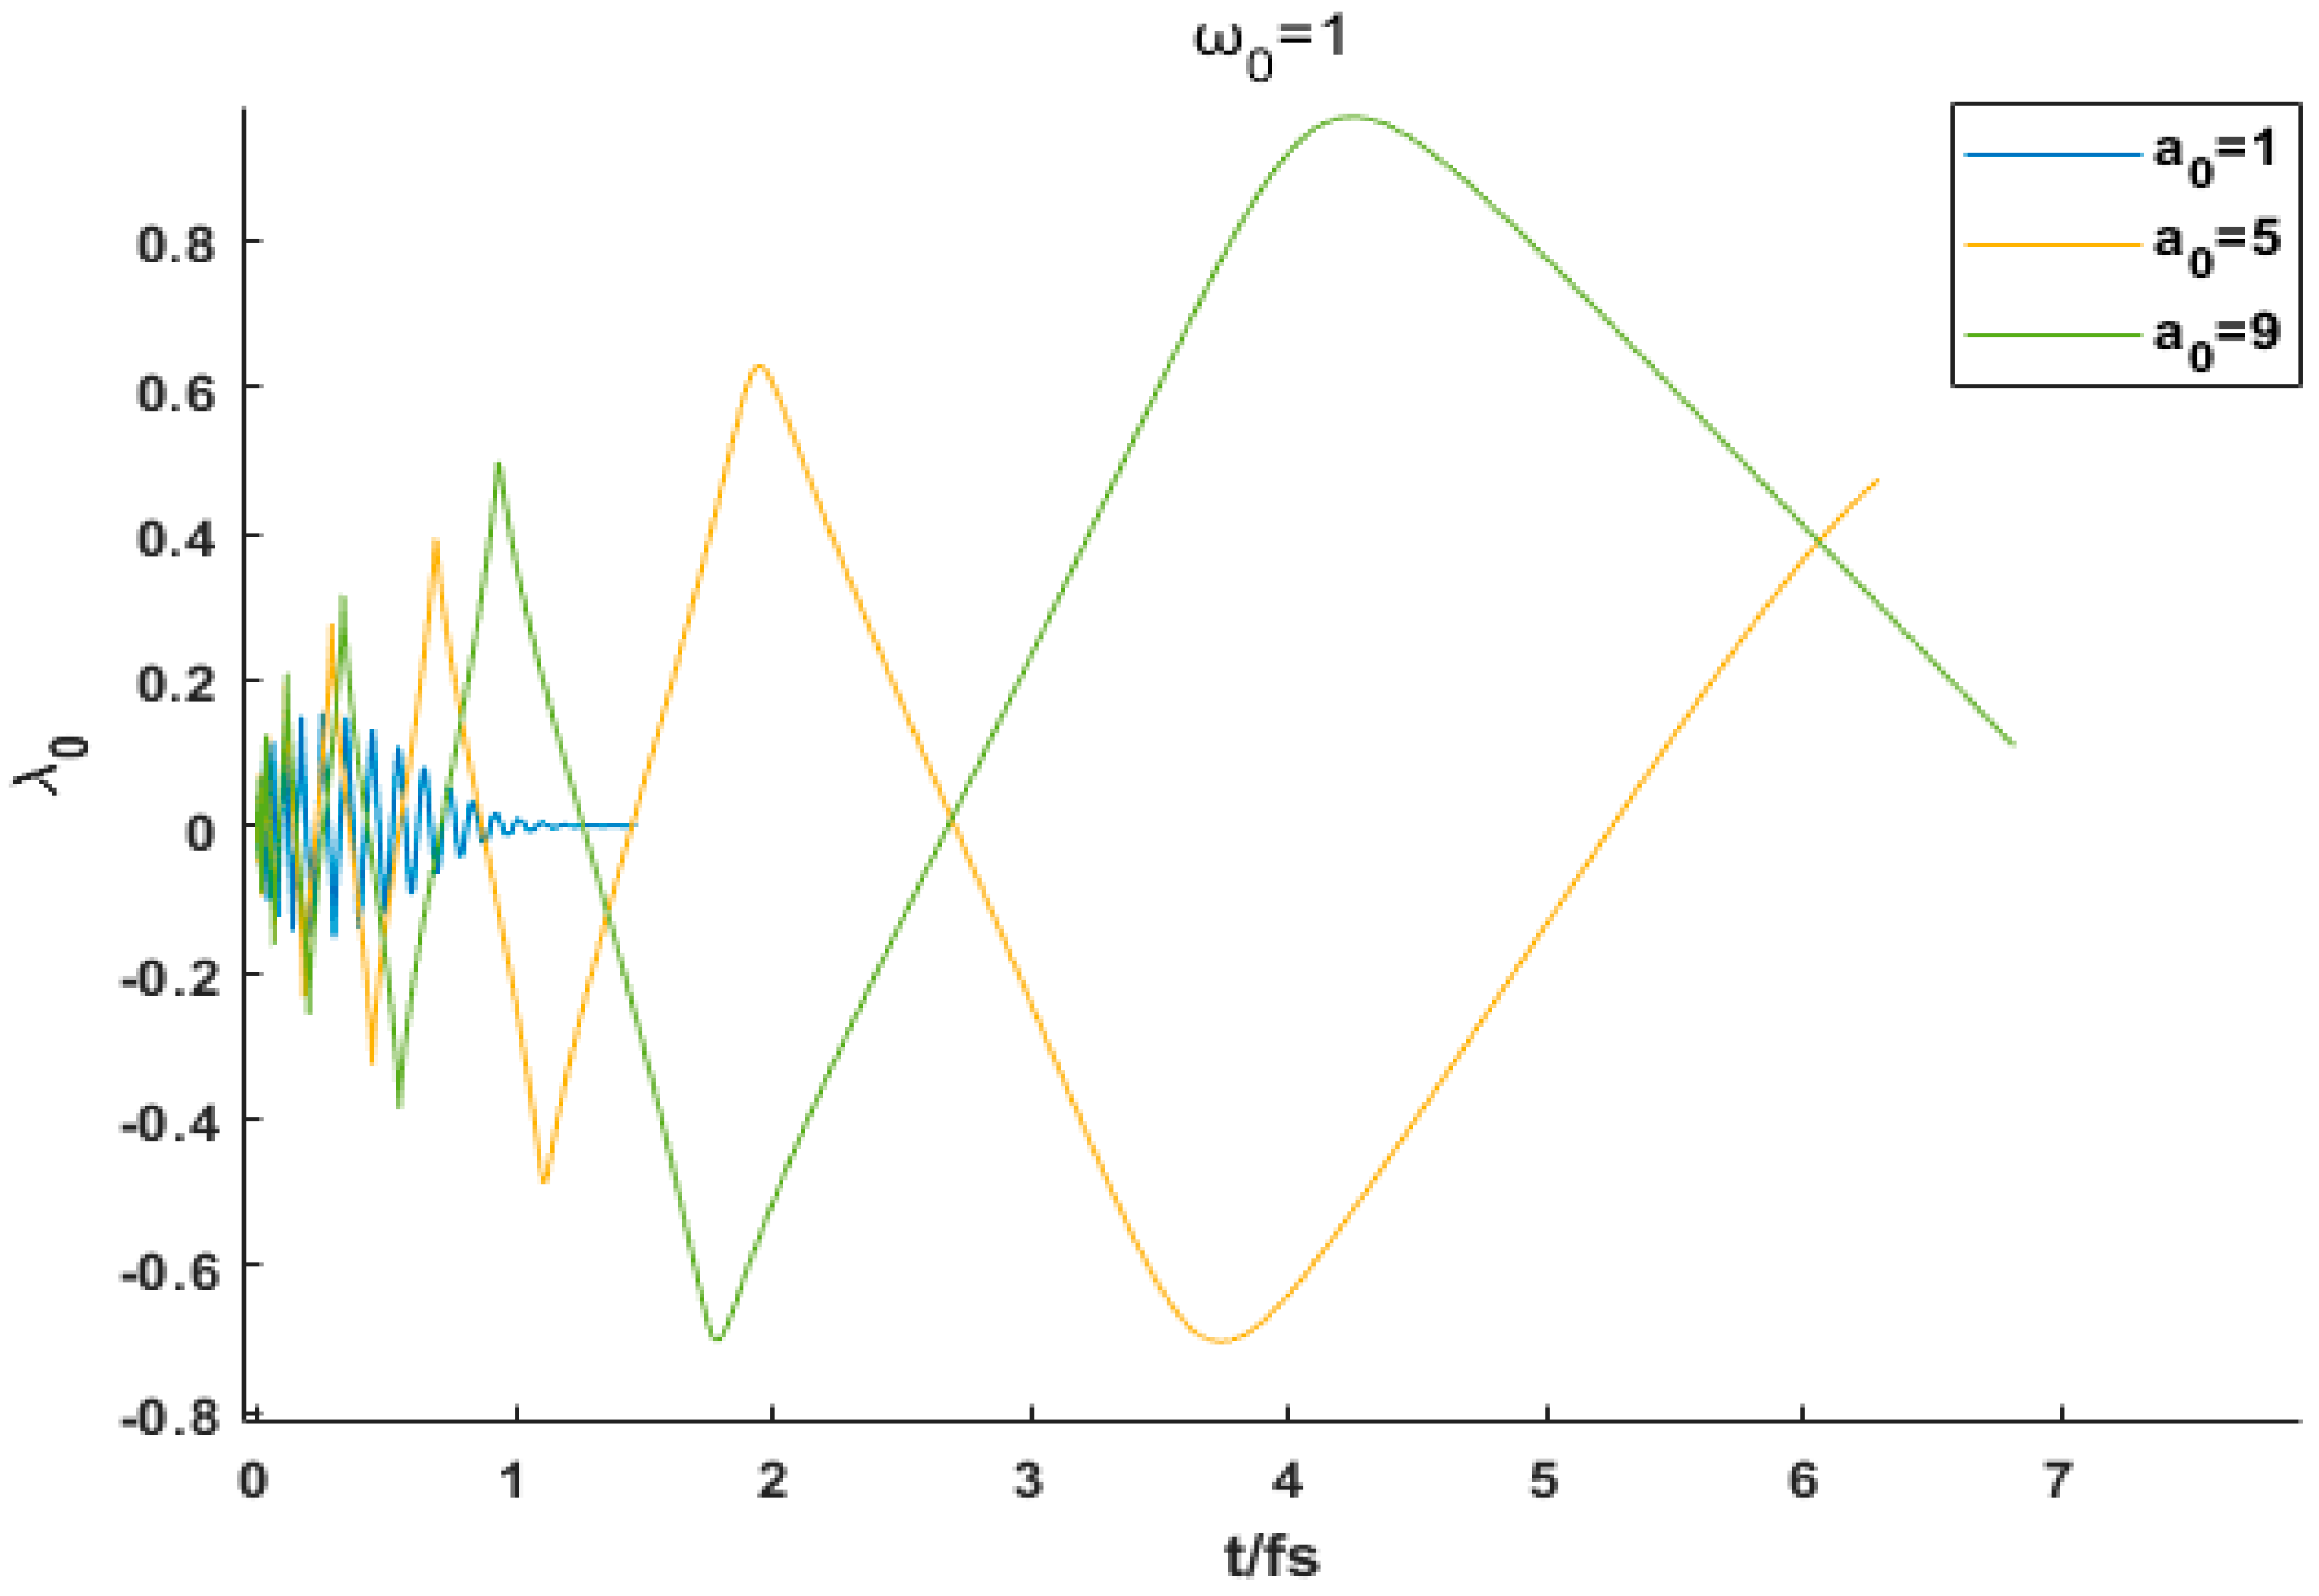
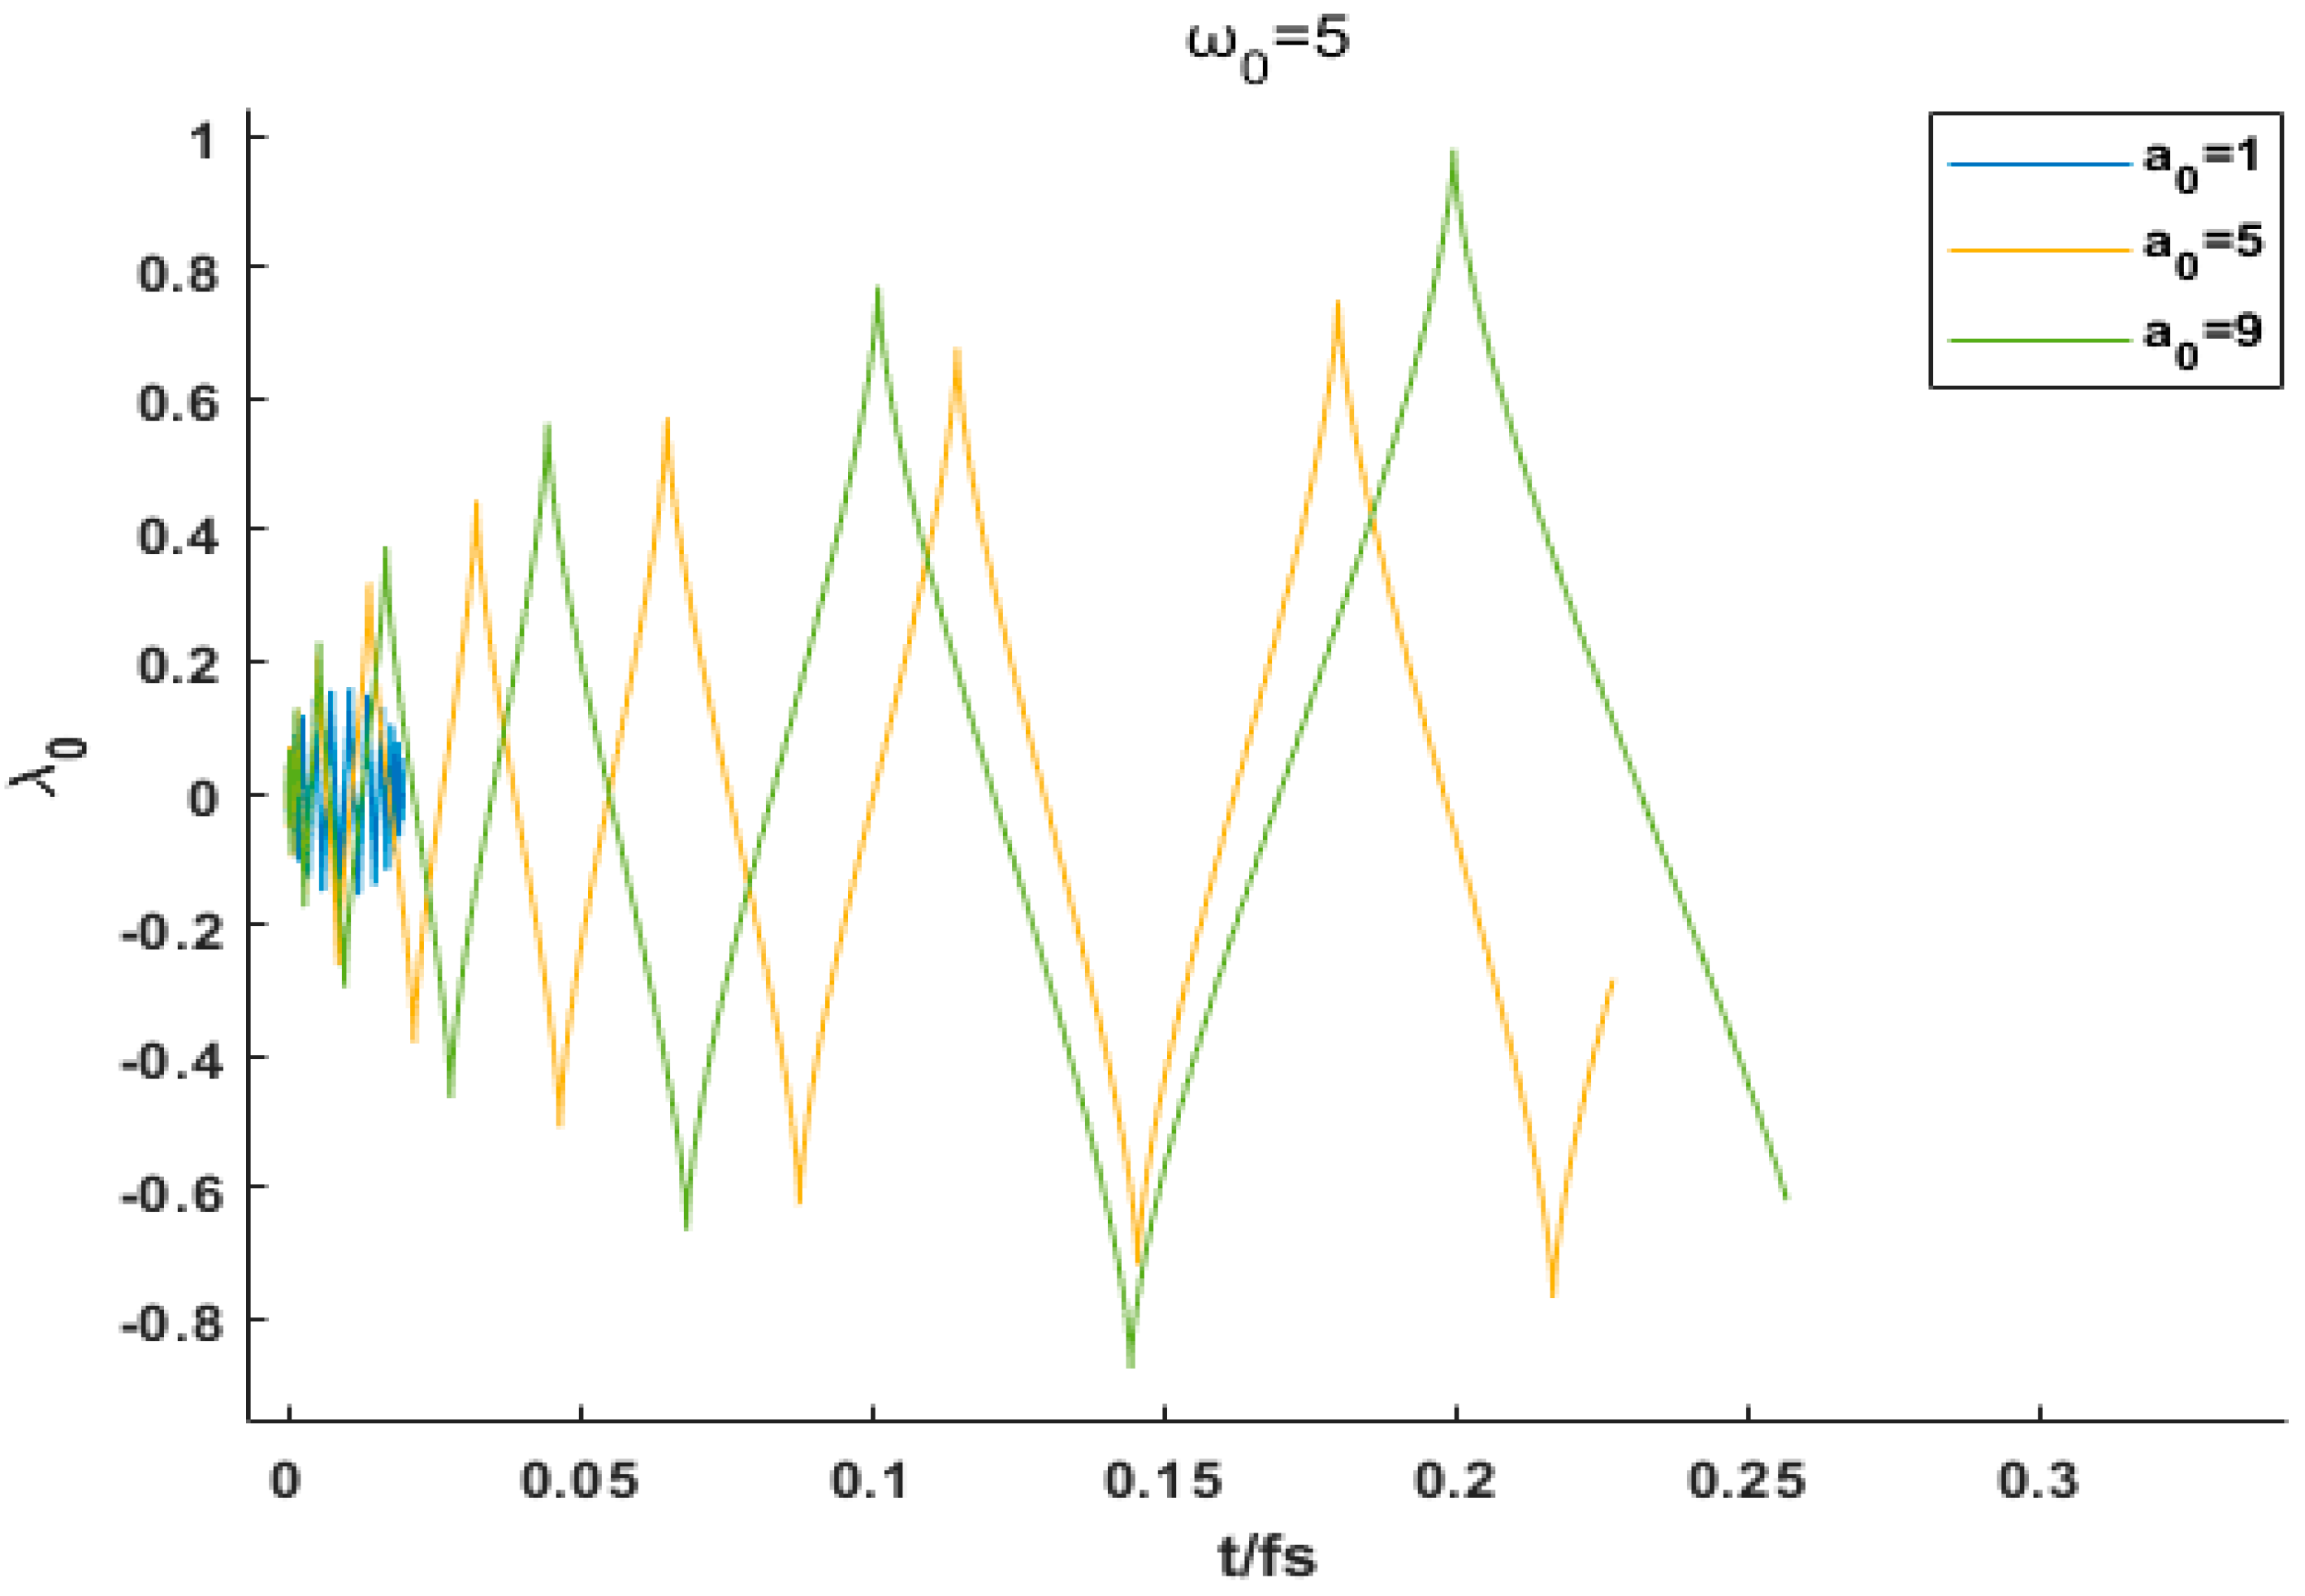
Based on the experimental observations in
Figure 6,
Figure 7 and
Figure 8, the control of electron trajectories by laser parameters exhibits distinct nonlinear characteristics. Under low-intensity conditions (e.g.,
= 1), a small beam waist radius (
) causes drastic transverse-field-gradient variations. Electrons undergo asymmetric acceleration within a single oscillation cycle, resulting in irregular “serrated” trajectories. At this stage, the transverse displacement of electrons significantly exceeds longitudinal displacement, accompanied by large-amplitude energy fluctuations. As
increases, the field gradient becomes smoother, allowing electrons to complete full oscillations over multiple laser cycles. The trajectories gradually evolve into symmetric “zigzag” patterns, with markedly improved stability in energy variations.
When laser intensity is significantly increased (e.g., = 5 or 9), electrons are accelerated to higher energies, and radiation reaction forces increasingly influence their motion. If ω0 is insufficient (e.g., = 1), cumulative directional shifts in velocity vectors after each oscillation cause gradual tilting of the trajectory midline, forming asymmetric “tilted zigzag” patterns. This tilting originates from the nonuniform energy release during intense acceleration: radiation energy loss after each oscillation induces systematic directional shifts in velocity vectors, ultimately manifesting as angular deflection of the entire trajectory. Only when ω0 is proportionally increased (e.g., ω0 = 5 or 9) does the expanded spatial scale of the laser field provide sufficient interaction length for electrons to maintain directional symmetry over multiple oscillations, leading to linearized trajectories.
A further comparison of trajectory symmetry and energy evolution reveals that symmetric “zigzag” trajectories correspond to more uniform energy fluctuations. When electron motion exhibits high symmetry, balanced forward/backward accelerations produce periodic energy oscillations. In contrast, asymmetric trajectories enhance randomness in energy release, characterized by significant differences in fluctuation amplitudes.
3.3. Time Spectrum
In experimental parameter modulation studies, the laser intensity (
) and beam waist radius (
) exhibit significant synergistic modulation effects on the energy distribution and temporal characteristics of time-resolved spectra.
Figure 9 shows our amplification diagram of the peak value of the time spectrum. When both parameters are within low ranges (e.g.,
= 1,
= 1), the energy distribution of the temporal spectrum displays broad and flat features, with a low-intensity main peak accompanied by multiple secondary peaks, reflecting a weakly coupled interaction between electrons and the laser field.
As and ω0 are independently increased, observations reveal that under a fixed laser intensity (), varying from 1 to 9 causes energy changes spanning up to five orders of magnitude (minimum: zero orders). Conversely, under a fixed , increasing from 1 to 9 leads to energy variations of up to eight orders of magnitude (minimum: three orders). These results demonstrate that a gradual increase in induces significant increases, by orders of magnitude, in the peak energy of temporal spectra, with its dominant regulatory role far exceeding that of . The intense laser field significantly elevates the electron acceleration gradient, forcing radiation energy to concentrate within a narrower temporal window. This manifests as a sharp increase in the main peak intensity and a marked compression of the pulse width. Under fixed values of , enlarging reduces the number of secondary peaks in the temporal spectra, transforming the main peak profile from an asymmetric tailed shape to a nearly symmetric Gaussian-like structure.
Notably, the simultaneous increase in and further enhances the optimization of temporal spectra. When both parameters are raised in tandem, the temporal spectra not only achieve extremely high peak energy but also exhibit a significantly reduced full width at half maximum (FWHM), indicating ultrafast, high-intensity energy concentration in the temporal domain.
3.4. Frequency Spectrum
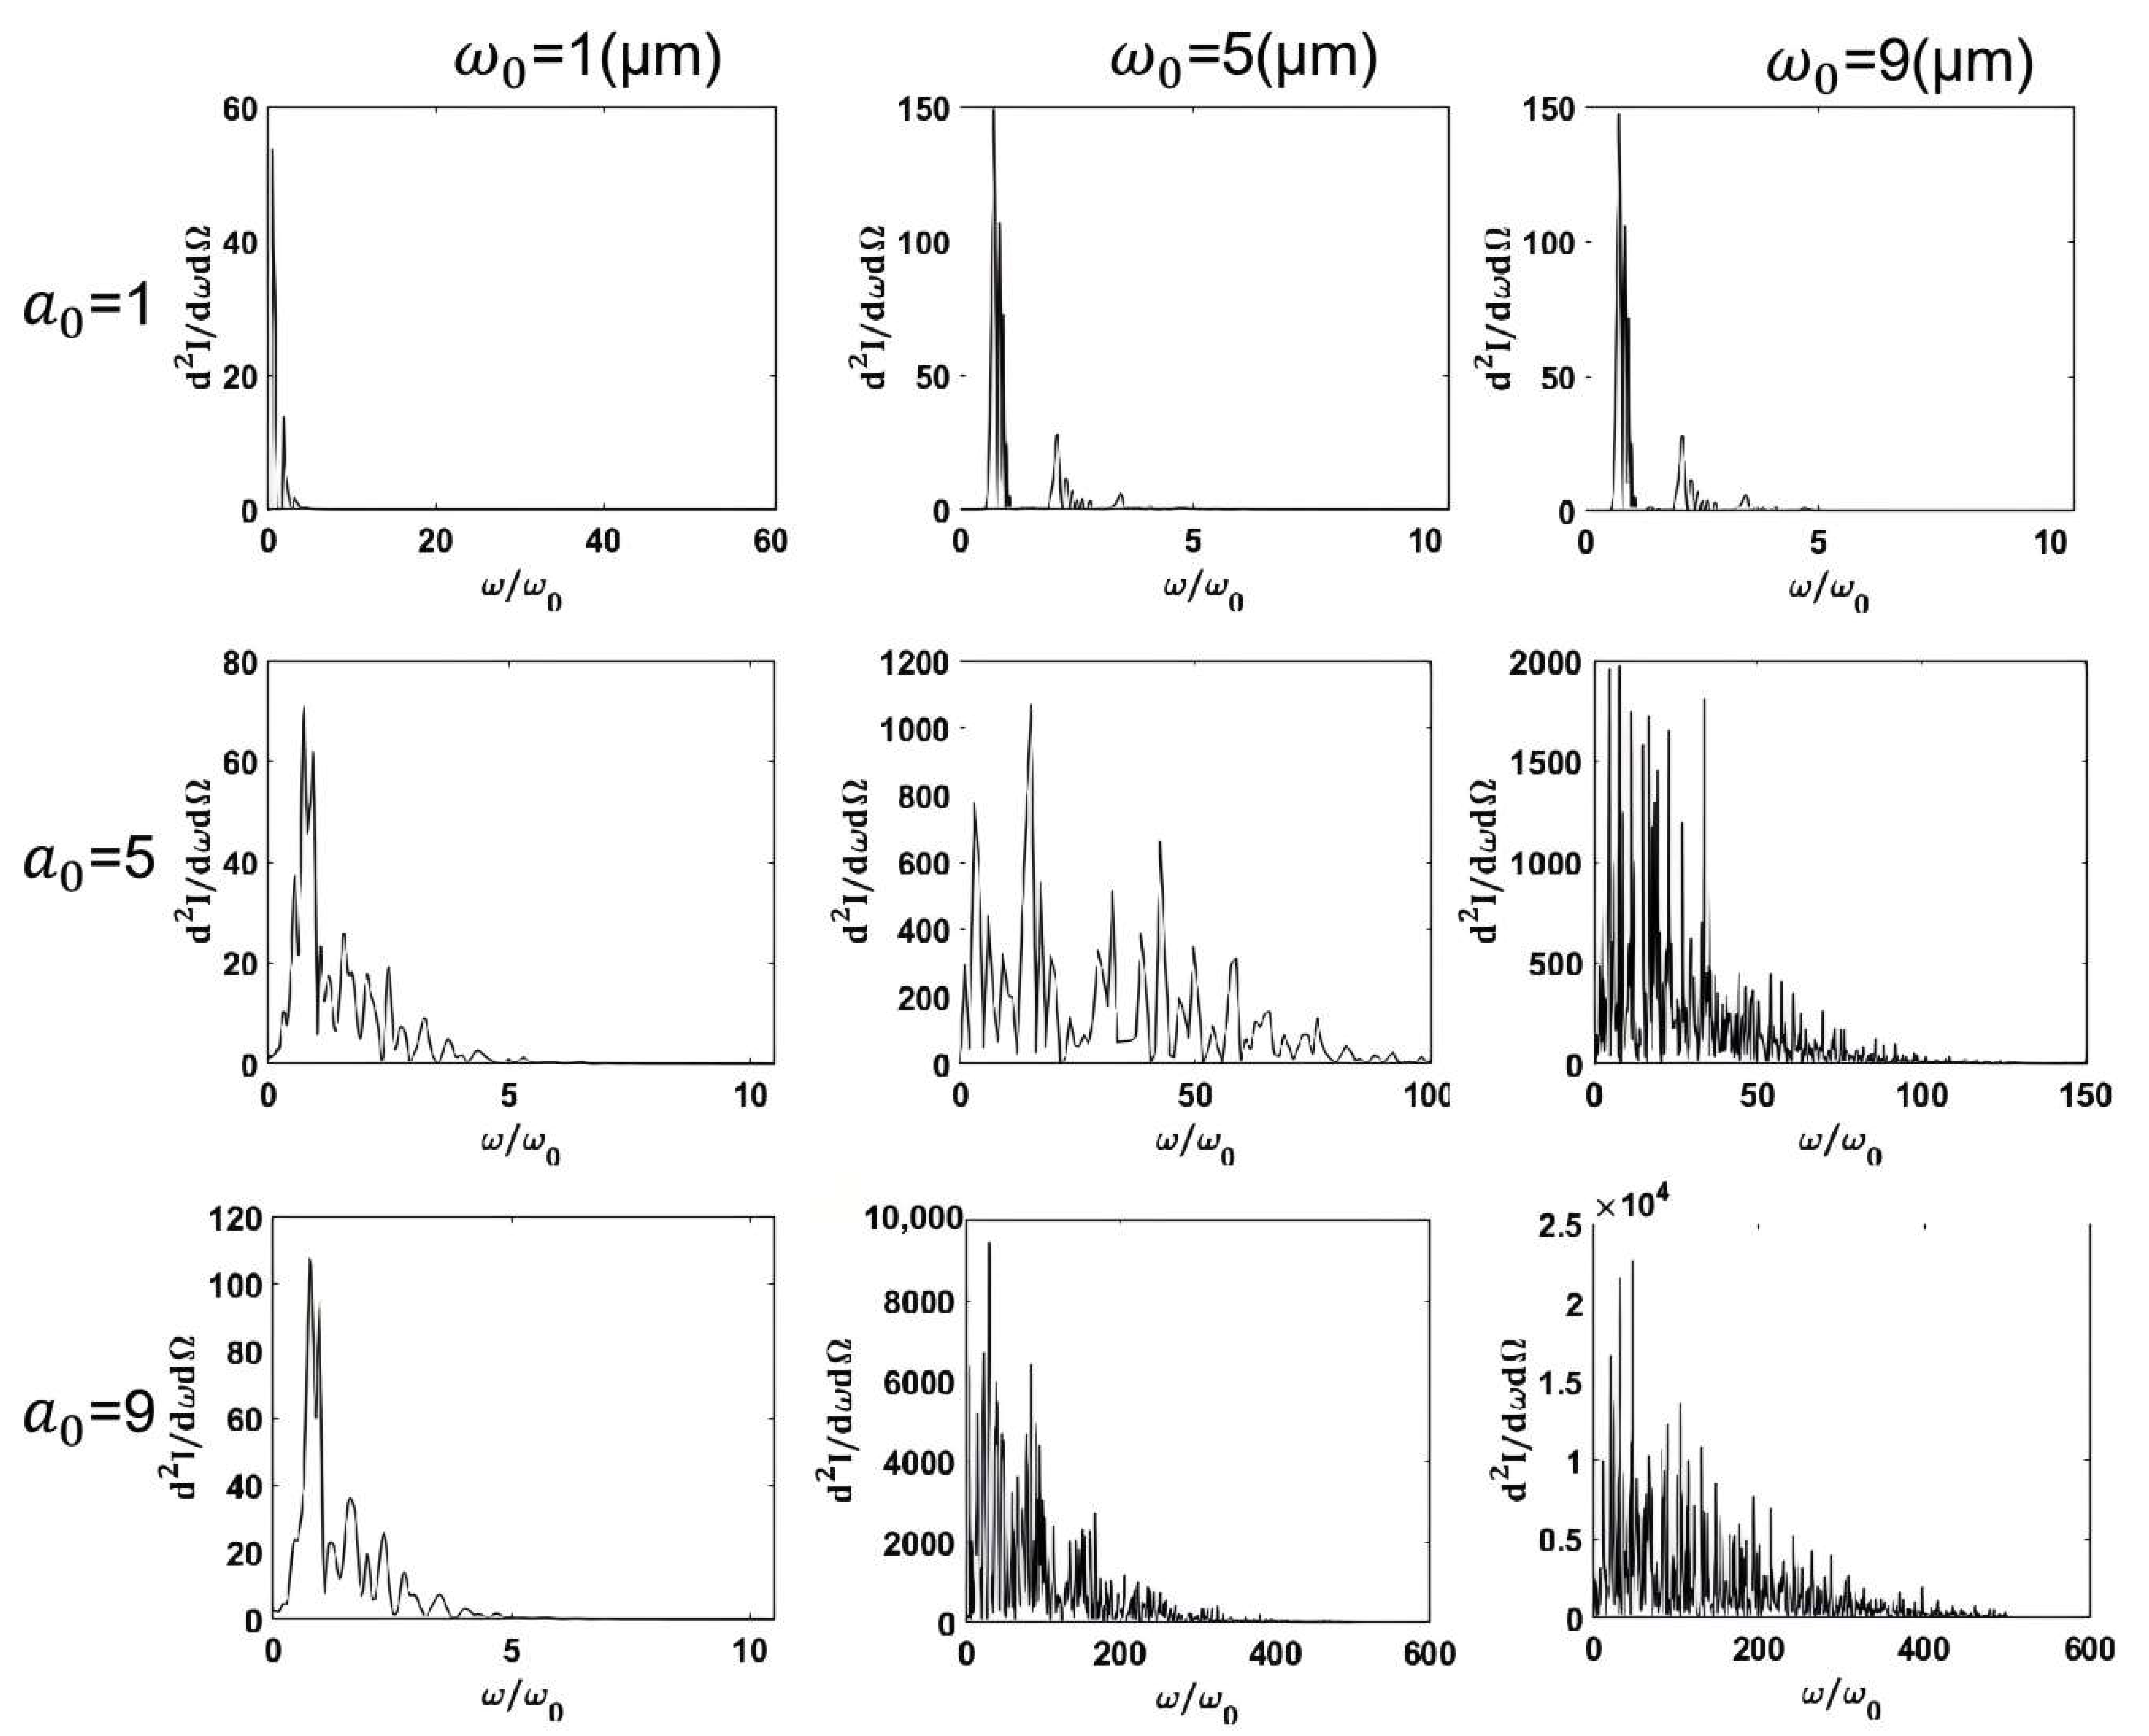
In addition to temporal variations, the power distribution of electrons in the frequency domain exhibits significant changes. From an energy perspective, small parameter combinations result in minimal energy generation by electrons. By observing
Figure 10, when
is relatively small, the influence of the waist radius on the energy can be negligible. As
increases, variations in the beam waist radius demonstrate amplify the effects on maximum radiation intensity. Notably, at
= 9, the beam waist radius enhances the maximum radiation intensity by two orders of magnitude, followed by a gradual energy decay toward zero after reaching the peak. Overall, both increased light intensity and an enlarged beam waist radius contribute to spectral broadening. Under constant light intensity, the controlled adjustment of the beam waist radius can expand the spectral width tenfold. However, when the beam waist radius exceeds a critical threshold, the spectral range tends to saturate without further expansion. Comparative analysis indicates distinct spectral characteristics: prominent supercontinuum features emerge when
< 5, while enhanced monochromaticity dominates when
> 5.
