1. Introduction
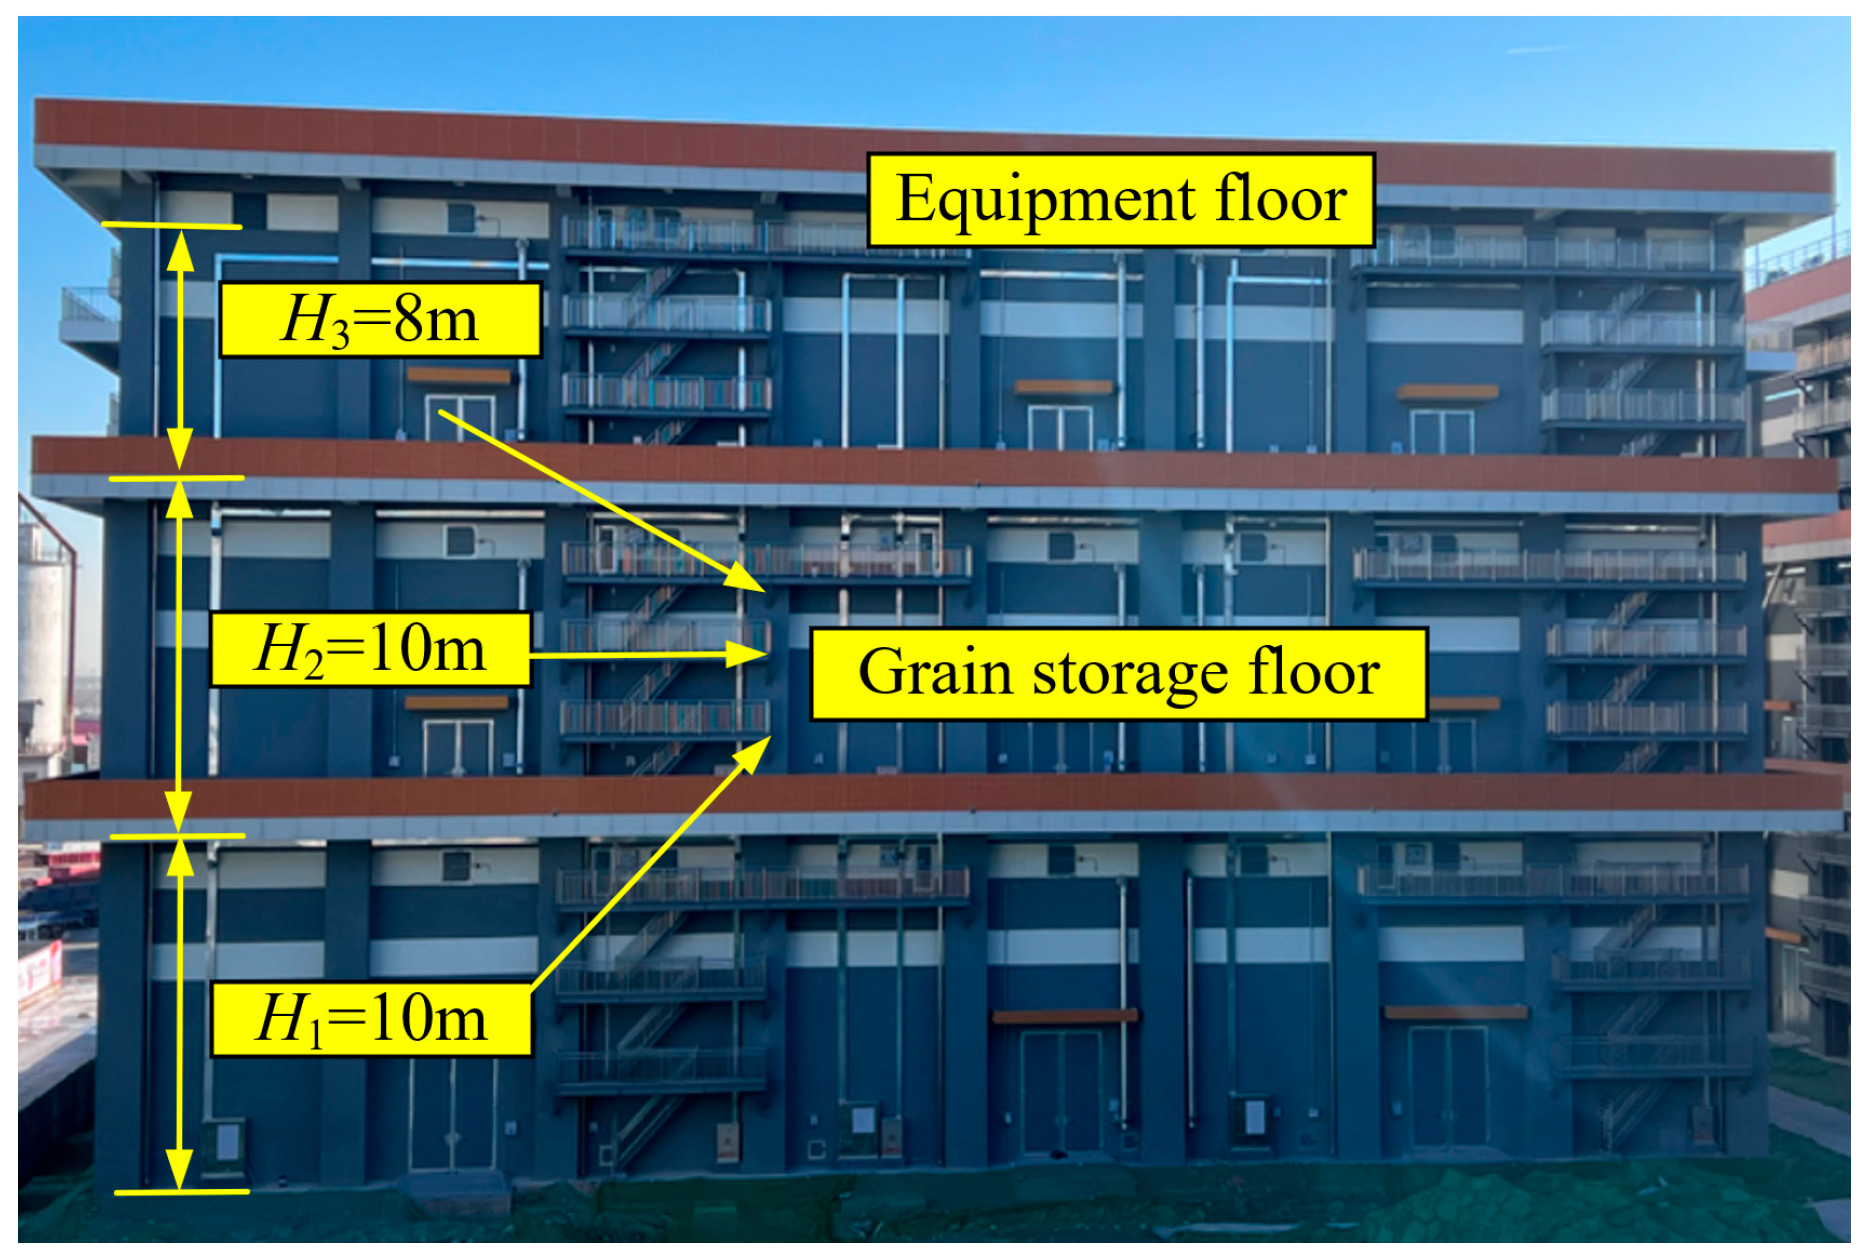
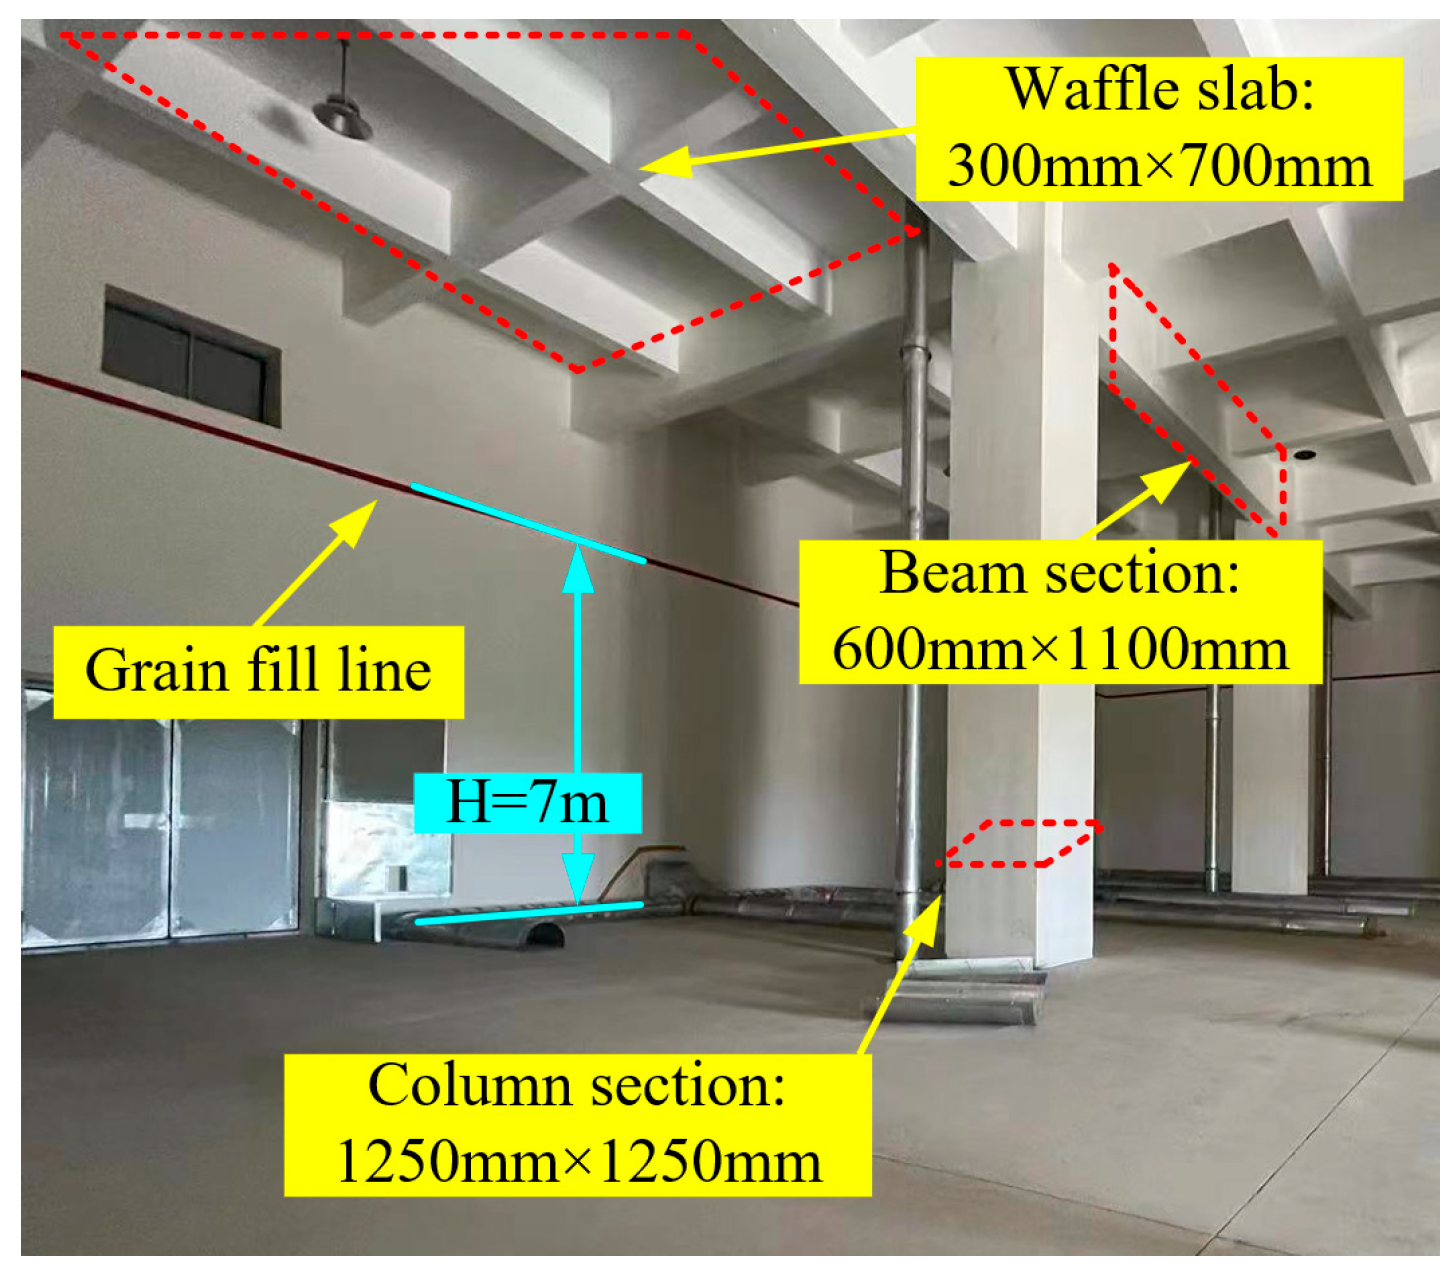
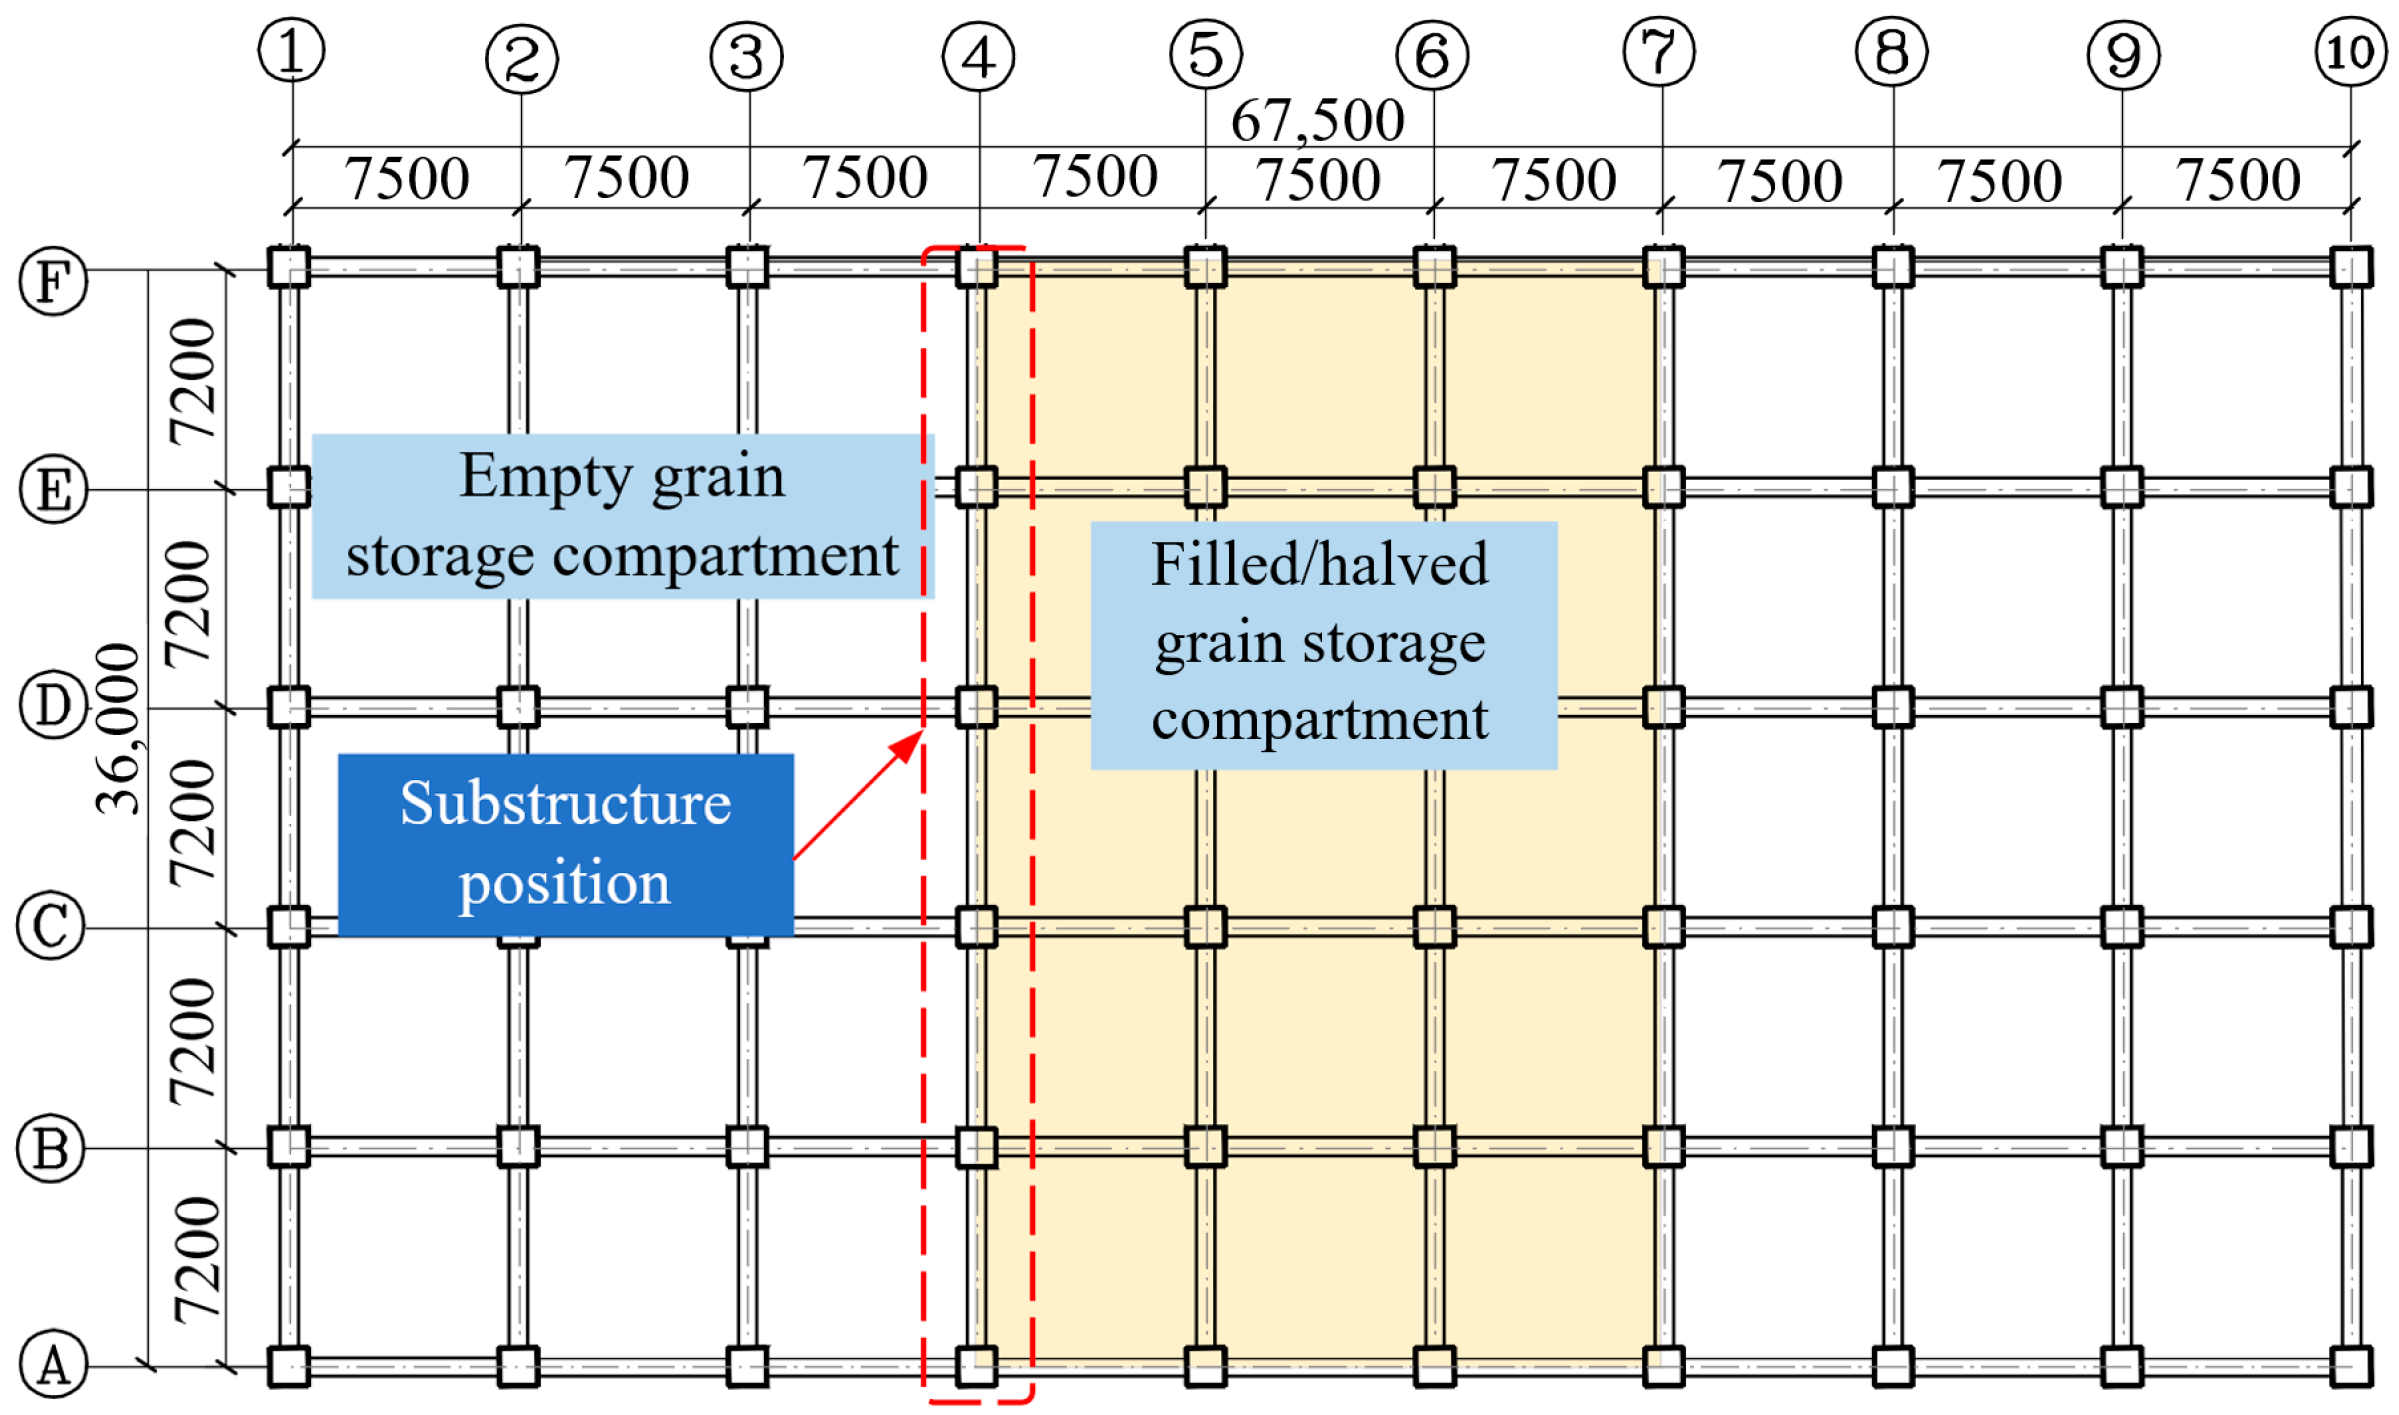
The multi-floored grain warehouse is a type of multi-story building structure designed for bulk grain storage. Featuring large height, width, and capacity, this structural form enables the warehouse to carry far heavier loads than typical civil frame structures under high grain-filling and heavy-stacking conditions. In China’s economically developed but land-constrained coastal regions, such warehouses have become the preferred solution for national grain reserves and emergency supply systems [
1] (
Figure 1 and
Figure 2). The grain load stored within can reach and even exceed 100,000 tons. In addition to substantial vertical loads, the walls and columns must also resist significant lateral forces, making the structure’s seismic performance critical to ensuring a stable and secure post-earthquake grain supply.
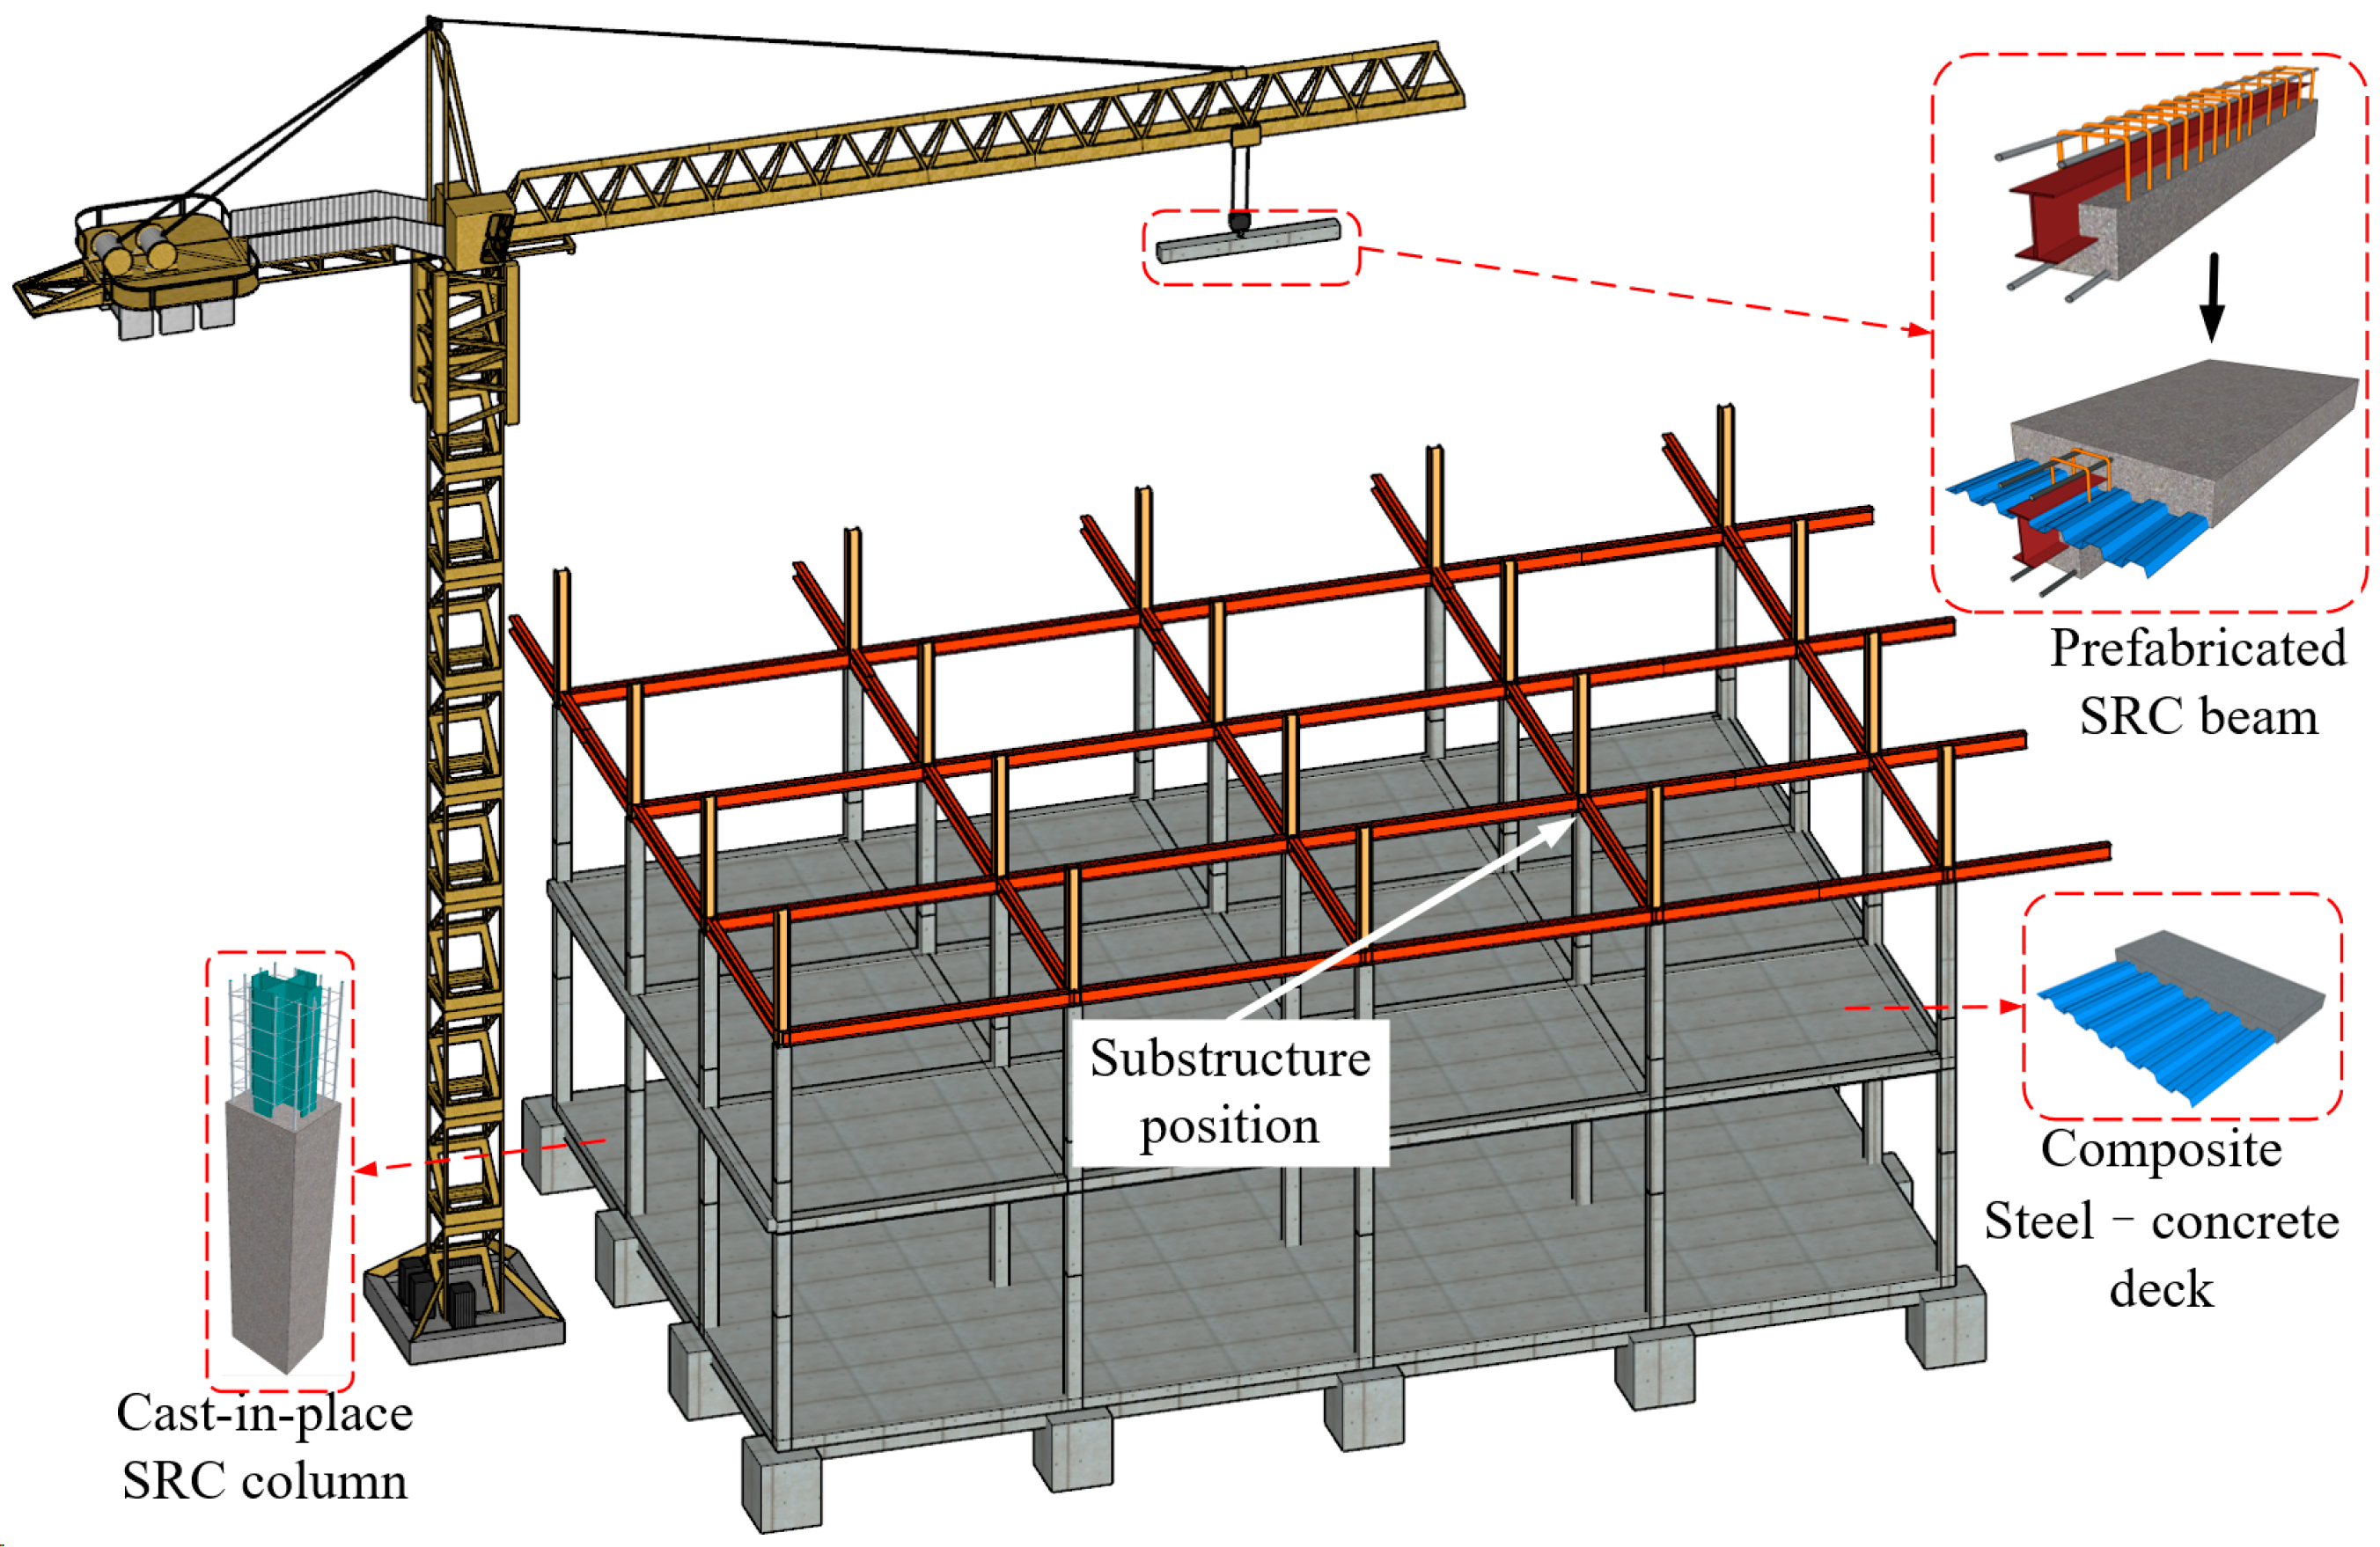
On the other hand, due to the need for efficient spatial utilization, the increasing grain-filling height in multi-story grain warehouses has led to a substantial enlargement of the structural dimensions. This expansion has resulted in extensive on-site wet construction work, which not only causes environmental pollution but also compromises the flexibility and feasibility of process layout [
2,
3]. In response, Jinquan Zhao et al. proposed a novel structural system tailored for multi-story grain warehouses by introducing the Composite Structure of Steel and Concrete (CSSC) structure (defined according to JGJ 138-2016) [
4], which demonstrates the superior mechanical performance of the CSSC system compared to conventional configurations [
5,
6,
7], while also offering superior corrosion and fire resistance compared to conventional concrete-filled steel tube structures [
8,
9,
10]. As illustrated in
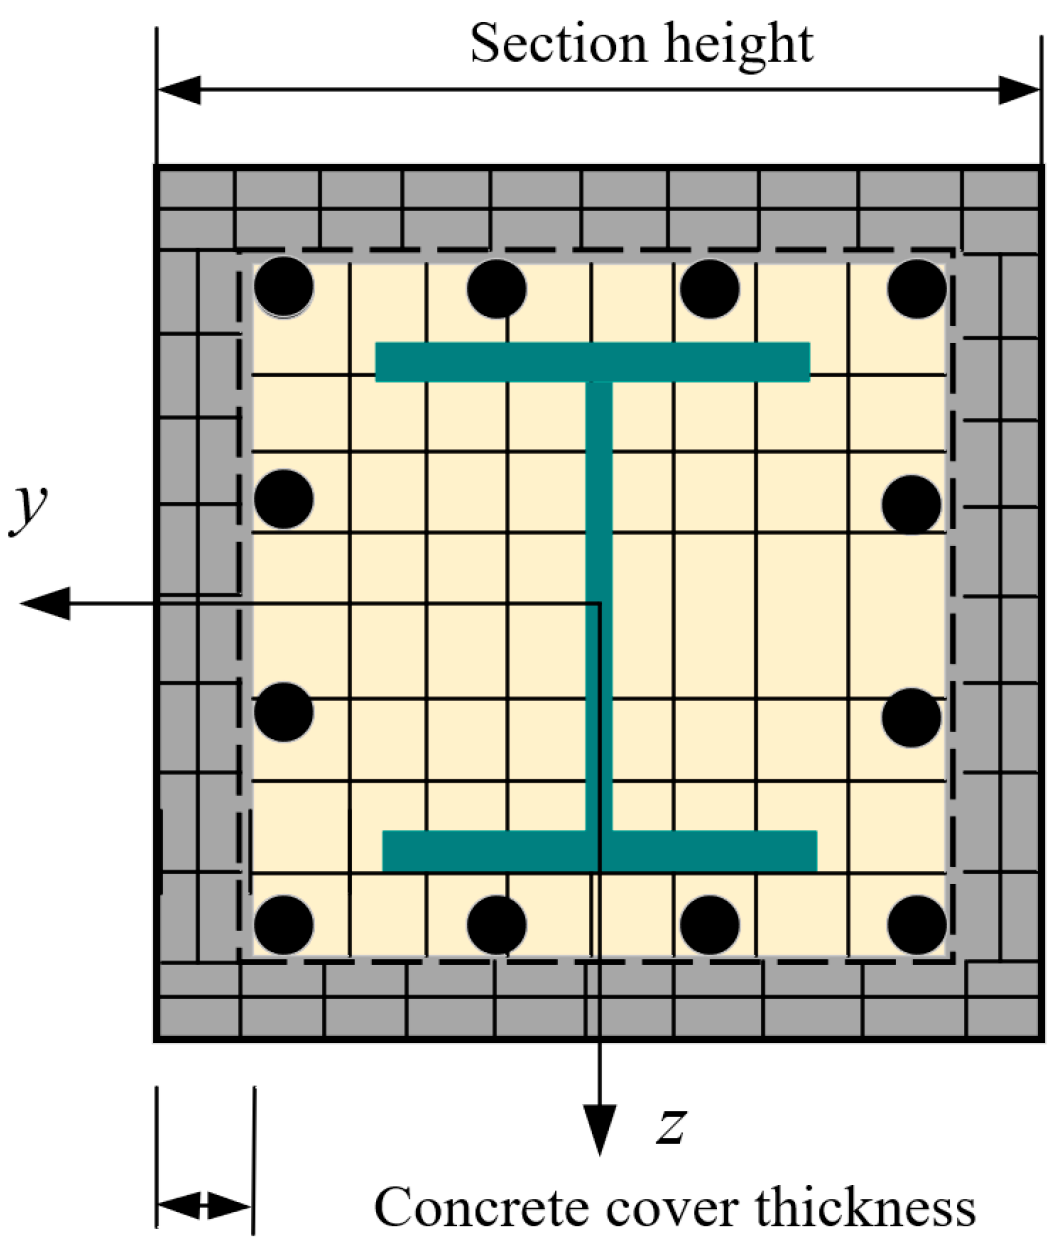
Figure 3, this CSSC-based system significantly minimizes the cross-sectional dimensions of the warehouse. To validate the performance of this system, Zhao and colleagues conducted a series of experimental studies on critical components such as beam–column joints, wall panels, and connection details under various loading scenarios [
11]. The results revealed that grain loads adversely affect the seismic performance of the CSSC structural system; under full-storage conditions, the bearing capacity and peak displacement of the joints were reduced by 10.8% and 15.7%, respectively, with a noticeable intensification in crack propagation along the beams.
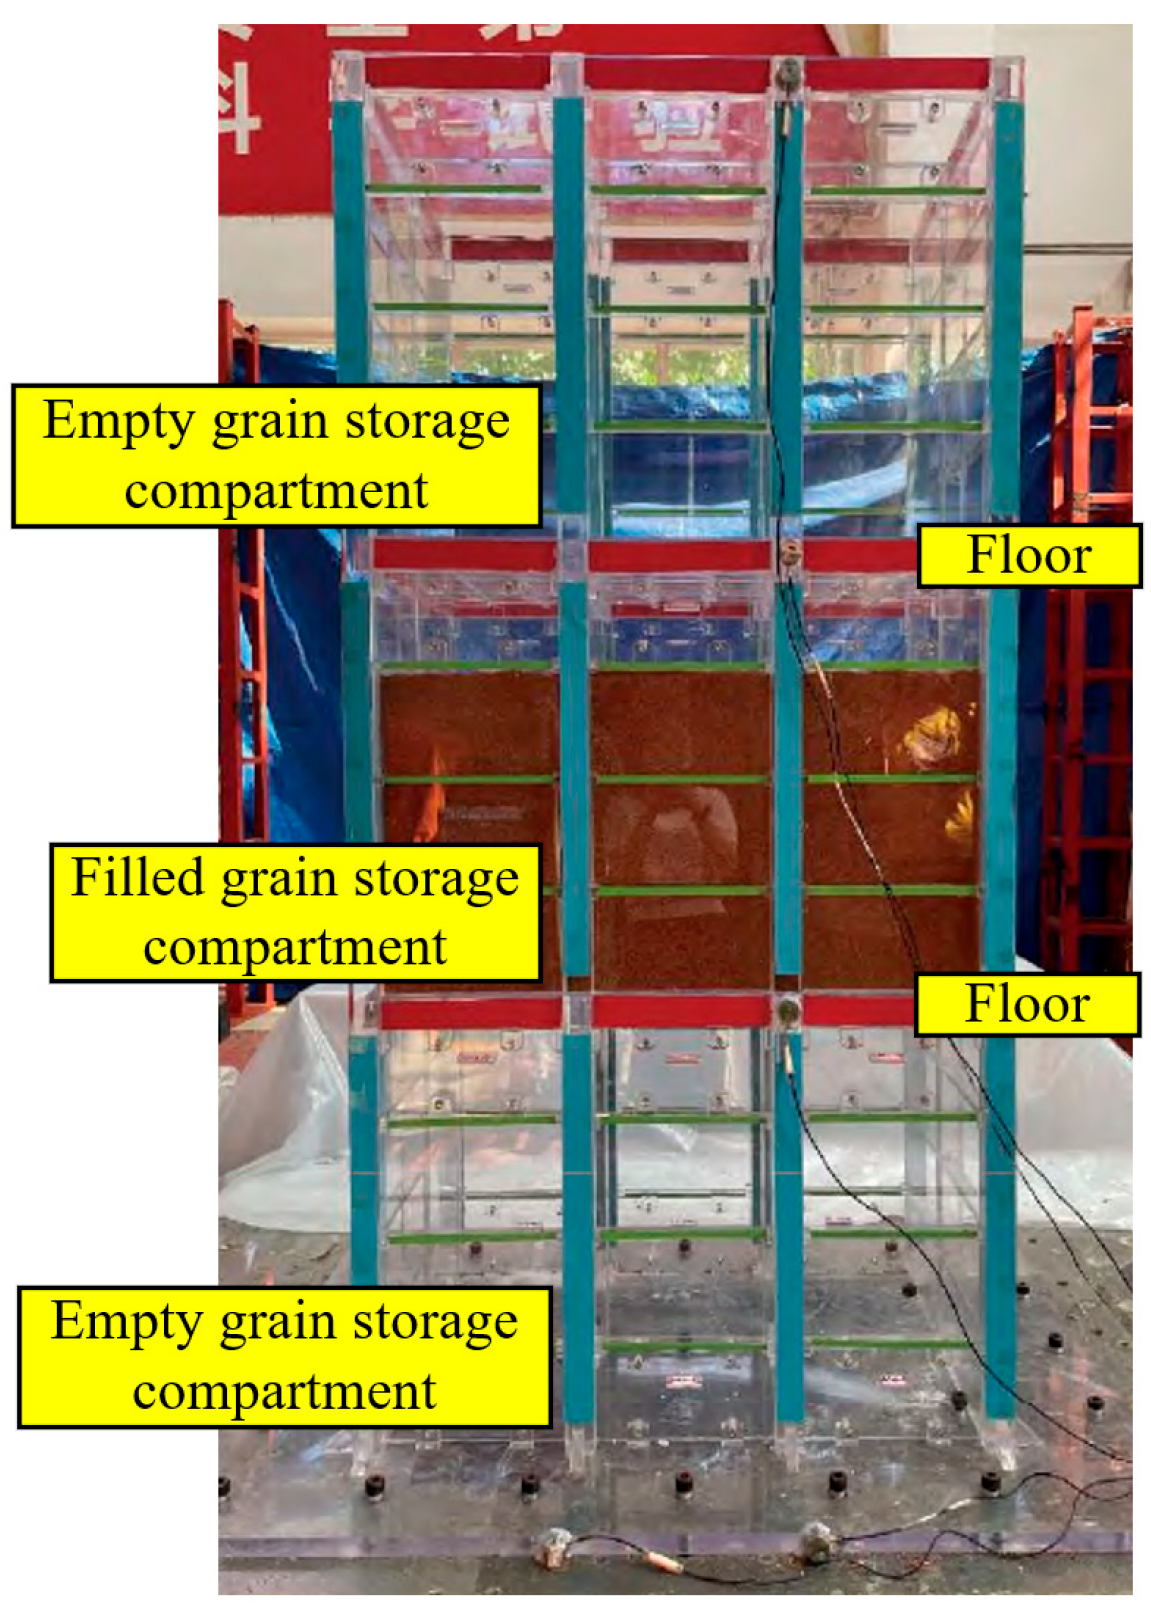
At present, experimental testing and finite element analysis are the primary methods used to investigate the seismic performance of multi-floored grain warehouses. Building on these approaches, numerous studies have explored the structural behavior of such warehouses under varying grain storage conditions through both physical experiments and numerical simulations. For instance, Qikeng Xu et al. [
12] conducted shaking table tests using scaled organic glass models of multi-floored grain warehouses, revealing that the dynamic characteristics of the structure vary significantly under different loading conditions; the experimental setup is illustrated in
Figure 4. Their results demonstrated that grain contributes to both the mass and stiffness of the system, making it imperative to account for these differences in seismic evaluations. In addition to experimental studies, finite element simulations have also been employed. Likun Liu [
13], using Abaqus (6.14), analyzed wall deformations of the grain warehouse under different grain-loading conditions and found considerable deviations from conventional frame structures, suggesting that standard design models may not be directly applicable. Similarly, Zhiwei Gu [
14,
15] developed finite element models in ANSYS 2021 R2 (ANSYS, Inc., Canonsburg, PA, USA) to perform fragility analyses across various loading configurations. Their results indicated that both the gravity and lateral movement of stored grain adversely affect the structure, with simultaneous seismic and grain-loading actions significantly increasing the risk of floor damage. Notably, the structural collapse behavior varied markedly among scenarios, with full-storage conditions leading to rapid plastic deformation and a dramatic rise in failure probability. While these studies provide valuable insights for seismic design, most focus only on empty or fully loaded states, thus failing to address the diverse vertical grain-loading configurations commonly encountered in real-world grain warehouse operations (
Figure 5).
In actual service, multi-floored grain warehouses exhibit dozens of possible grain-loading patterns (e.g., Empty–Full–Empty, Full–Empty–Full), each producing markedly different effects on structural stiffness, strength, and seismic response—yet few studies systematically quantify these differences. To address this gap, this study develops a prototype CSSC grain warehouse structure based on an actual engineering project, considering multiple realistic loading scenarios observed in practice. A representative frame was selected for detailed investigation, and pushover, as well as time history analyses, were conducted under various grain-loading conditions. By comparing differences in pushover curves and dynamic responses, the study evaluates the impact of grain-loading patterns on the seismic performance of the CSSC frame. The findings aim to provide a theoretical and practical reference for structural design and engineering applications.
3. Pushover Analysis
3.1. Roof Displacement–Base Shear Curve Analysis
The pushover analysis method evaluates the elasto-plastic seismic performance of a structure through static nonlinear analysis. The most used approach is the capacity spectrum method (CSM), as proposed in FEMA 440. Given the uniform distribution of mass and stiffness along the height of the grain warehouse, an inverted triangular horizontal load pattern was applied in the Y direction. To ensure convergence of the numerical model, horizontal loads were simplified as equivalent point loads. The concentrated load on each floor was calculated using the following expression:
In the equation, Fi denotes the horizontal point load at floor i; Gi and Gj represent the gravity loads of floors i and j, respectively; H>i and Hj are the floor heights; n is the total number of floors; and Vb is the total base shear of the structure.
Based on this, the pushover curve was transformed into a spectral acceleration–spectral displacement (
Sa–Sd) curve using the modal decomposition response spectrum method. The calculation is as follows:
Sa is the elastic spectral acceleration, Sd is the elastic spectral displacement, W is the effective mass of the first mode, φroof is the modal amplitude at the roof level, and Γ is the modal participation factor.
The seismic demand spectrum was derived from the standard elastic response spectrum. The value of
Sa was taken from the design code, while
Sd was calculated using the following expression:
where
T is the fundamental period of the structure.
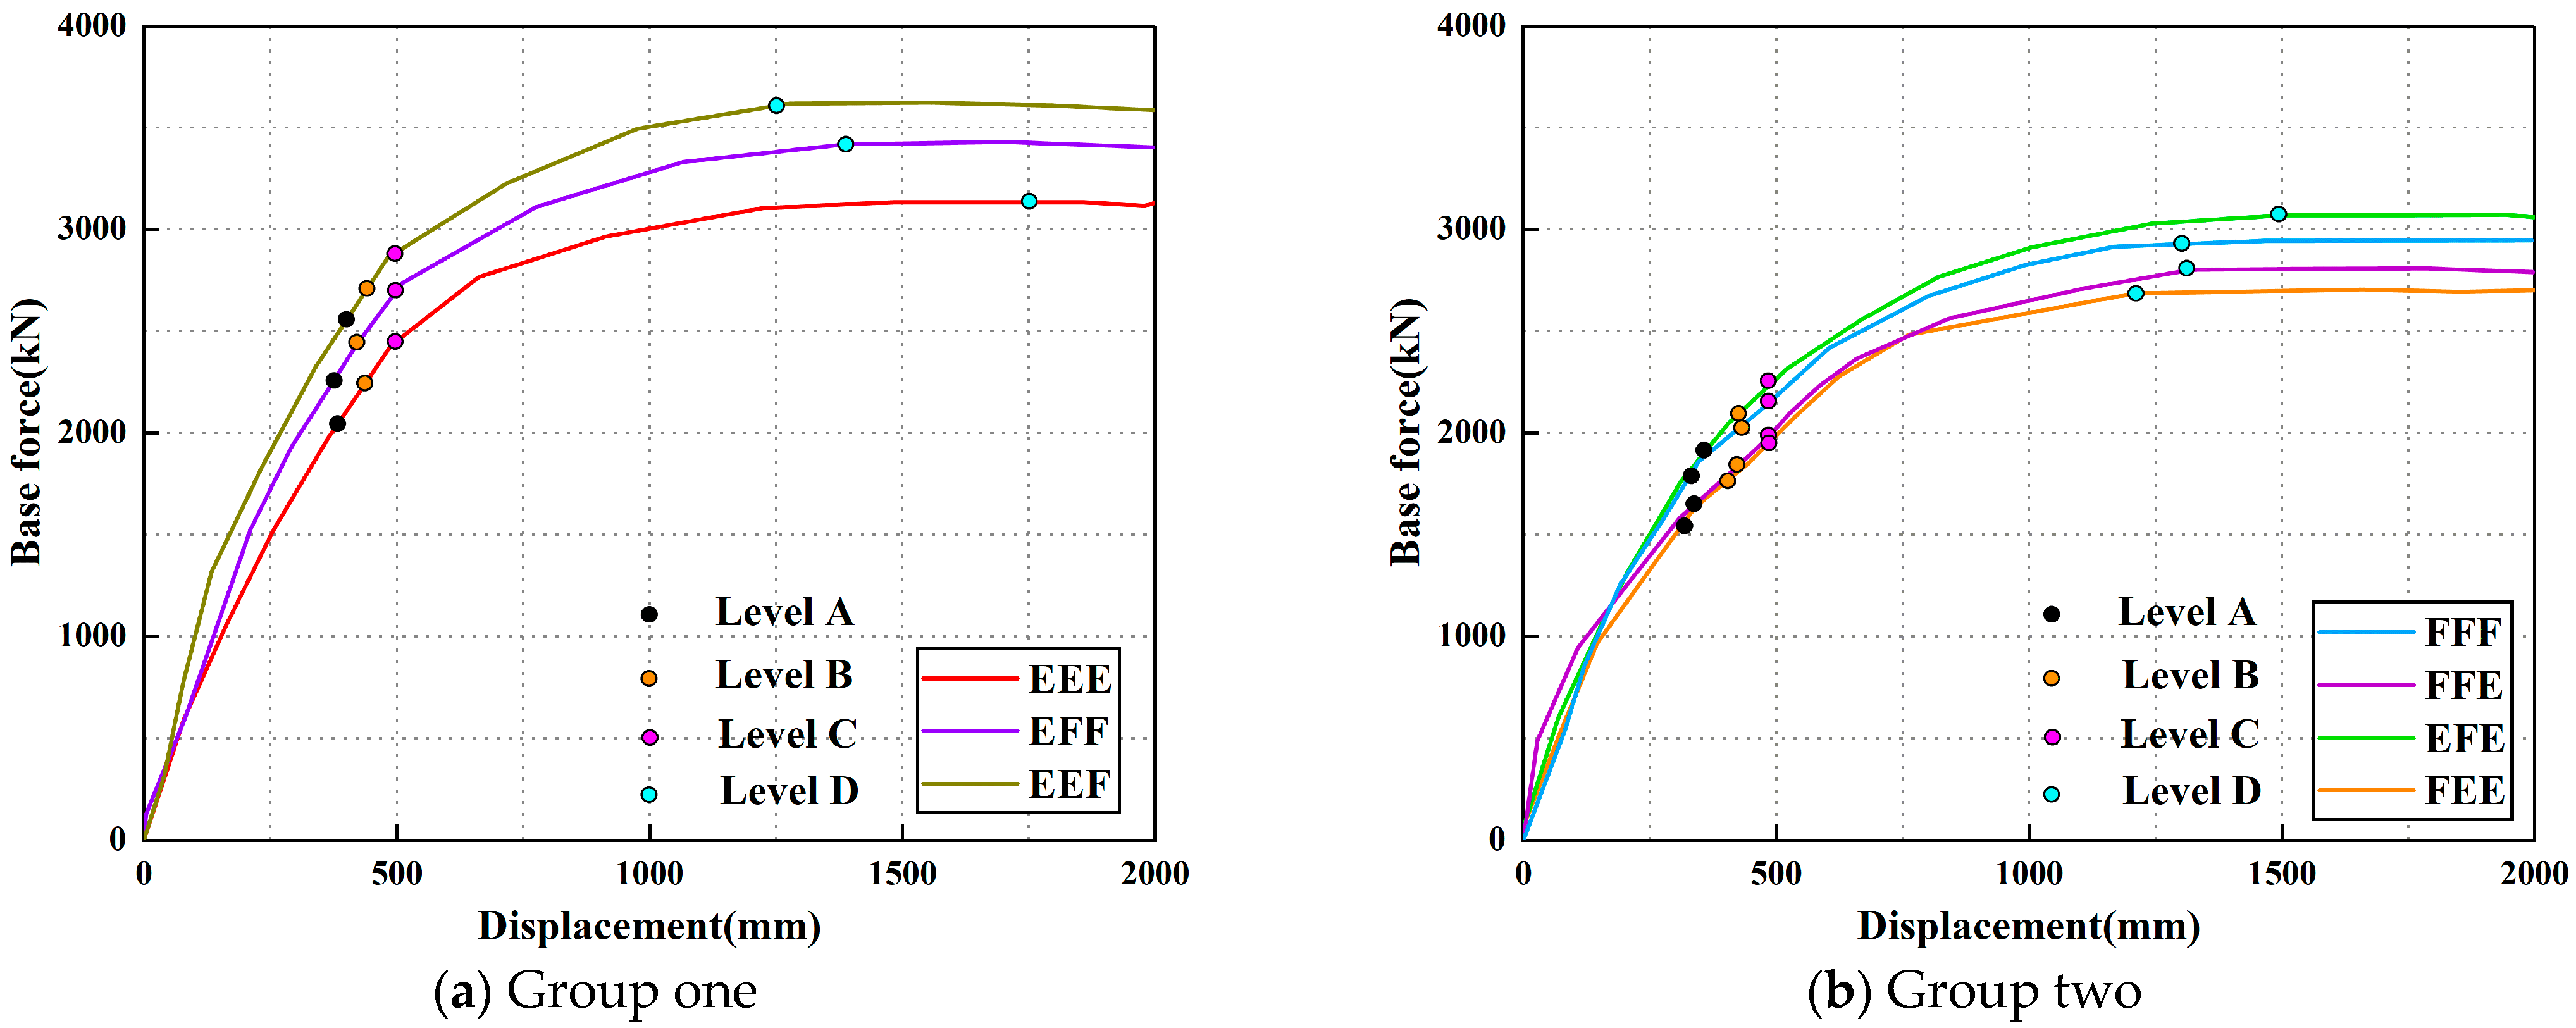
According to the calculation procedure, the roof displacement–base shear (
Δ–
V) curves for each case are shown in
Figure 10. For clarity and comparison, the
Δ–V curves were divided into four performance levels: level A and level B correspond to the first occurrence of plastic hinges at beam ends and column ends, respectively; level C indicates a maximum inter-story drift ratio of 2%; and level D marks the peak base shear. For analysis purposes, the cases were grouped into two sets; the base shear and displacement of the model at different displacement levels are listed in
Table 6.
Results show that grain-loading conditions significantly influence the peak base shear of the three-story frame. The EEF condition exhibited the highest lateral load capacity. This is primarily due to the enhanced moment–axial force interaction in the bottom-story columns under high vertical loads, which increased initial stiffness and ductility. Additionally, the upper empty floors reduced overall mass, mitigating inertial effects and delaying global yielding, thereby maintaining higher lateral resistance over a larger displacement range. In contrast, the FEE condition concentrated mass in the upper stories, increasing inertia at the top, while lower vertical forces in the empty bottom stories promoted early plastic hinge formation and yielding, resulting in lower base shear. According to
Table 6, the peak base shear under the EEF condition increased by 35.14% compared to the least favorable FEE condition. The common EEE condition showed a 6.67% higher base shear than the FFF condition, indicating that full loading (FFF) weakens seismic performance.
In practice, grain is typically loaded progressively from the third to the first floor, making FEE and FFE common scenarios. In both cases, the upper mass dominates, leading to lower base shear during pushover and minimal differences between them. These results clearly demonstrate that grain-loading conditions, through changes in mass distribution and vertical loading, have a direct and pronounced effect on the nonlinear structural response.
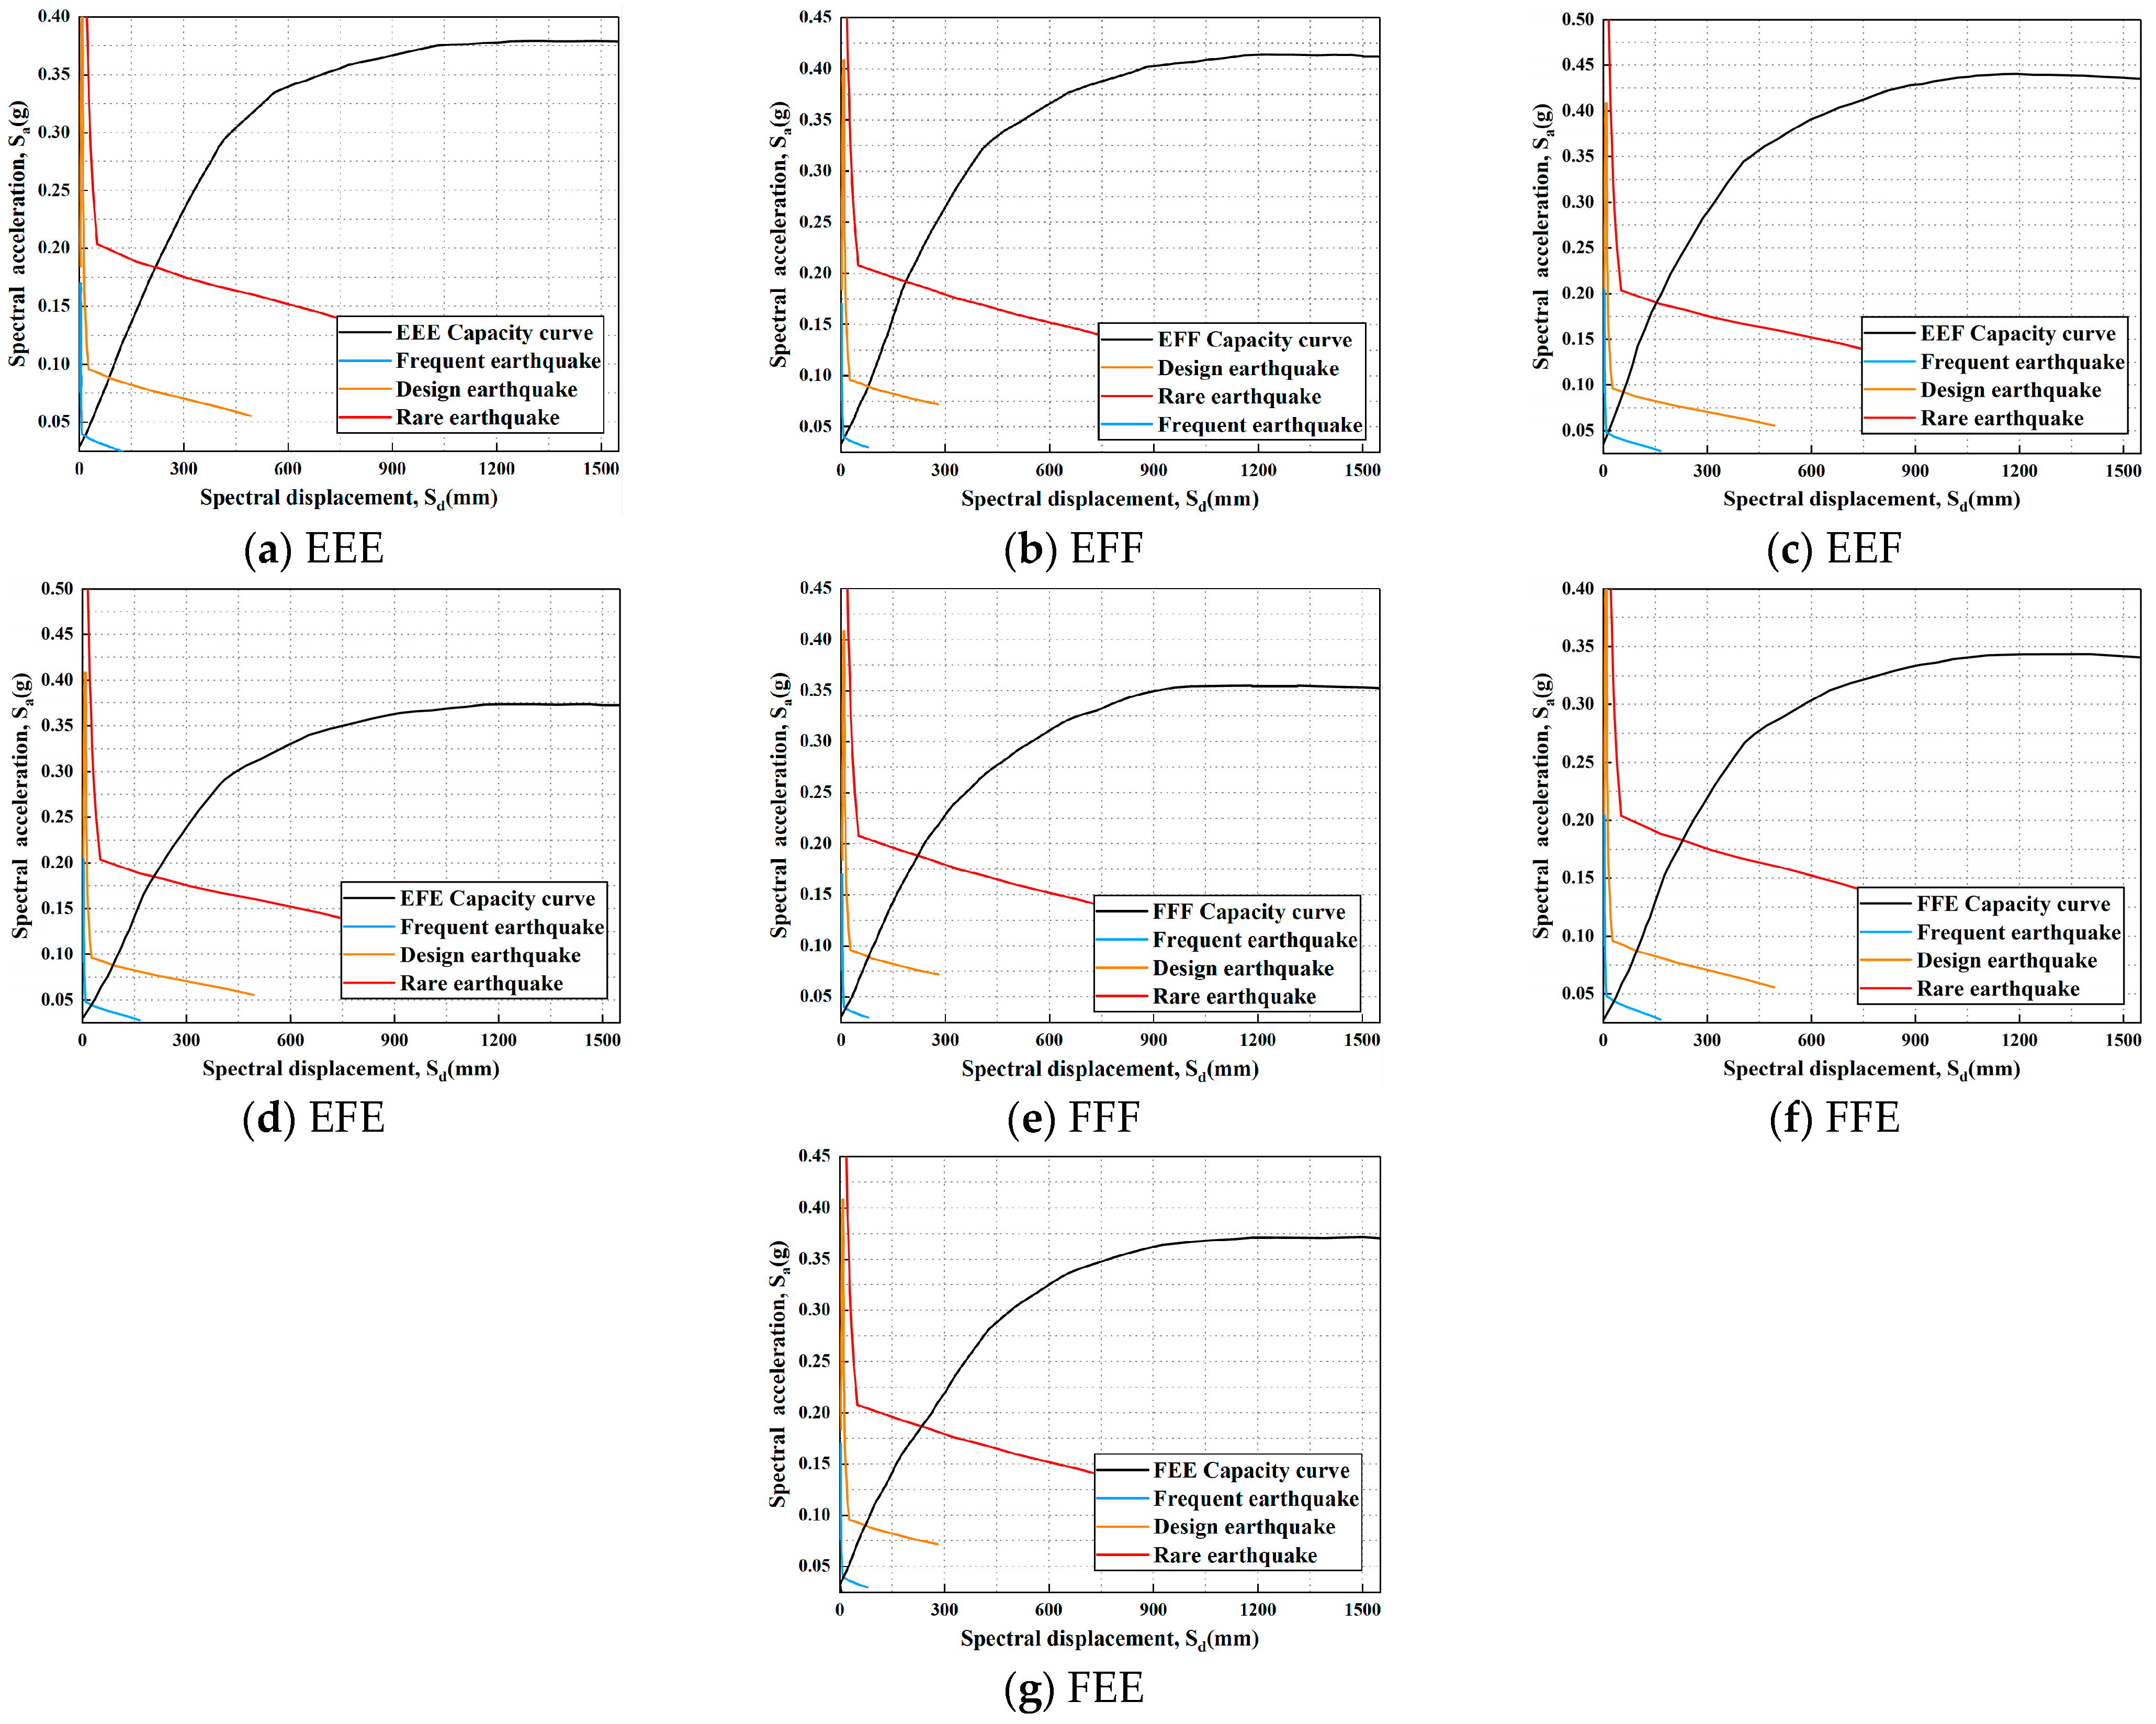
3.2. Performance Point Determination
Figure 11 shows the performance points of different cases under various grain-loading conditions, as determined by the capacity spectrum method. All performance points under frequent, design-level, and rare earthquakes lie on the ascending branch of the capacity spectrum, indicating good ductility and energy dissipation. The corresponding roof displacements are all below the inter-story drift limits (1/300 and 1/50) specified in the Technical Code for Concrete Filled Steel Tubular Structures (GB50936-2014) [
22], confirming that the deformation demands meet code requirements. Compared with FEE, EFE, and FFE conditions, the EEF condition exhibits significantly smaller displacements at all performance levels and is close to EFF and EEE, suggesting that grain loading on the first floor enhances initial stiffness and base shear capacity, effectively limiting seismic displacement.
Under rare earthquakes, the FEE condition performs notably worse, with lower base shear and larger displacement, caused by upper mass concentration and insufficient vertical force in the empty bottom story, which accelerates stiffness degradation and leads to early plastic hinge formation. Additionally, FEE, FFE, and FFF conditions yield similar performance points under all intensities, all inferior to cases with bottom grain loading and upper empty storage, further validating the pushover results. These findings demonstrate that grain-loading configurations significantly influence nonlinear seismic response through their impact on mass distribution and vertical force paths.
4. Time History Analysis
4.1. Ground Motion Selection and Scaling
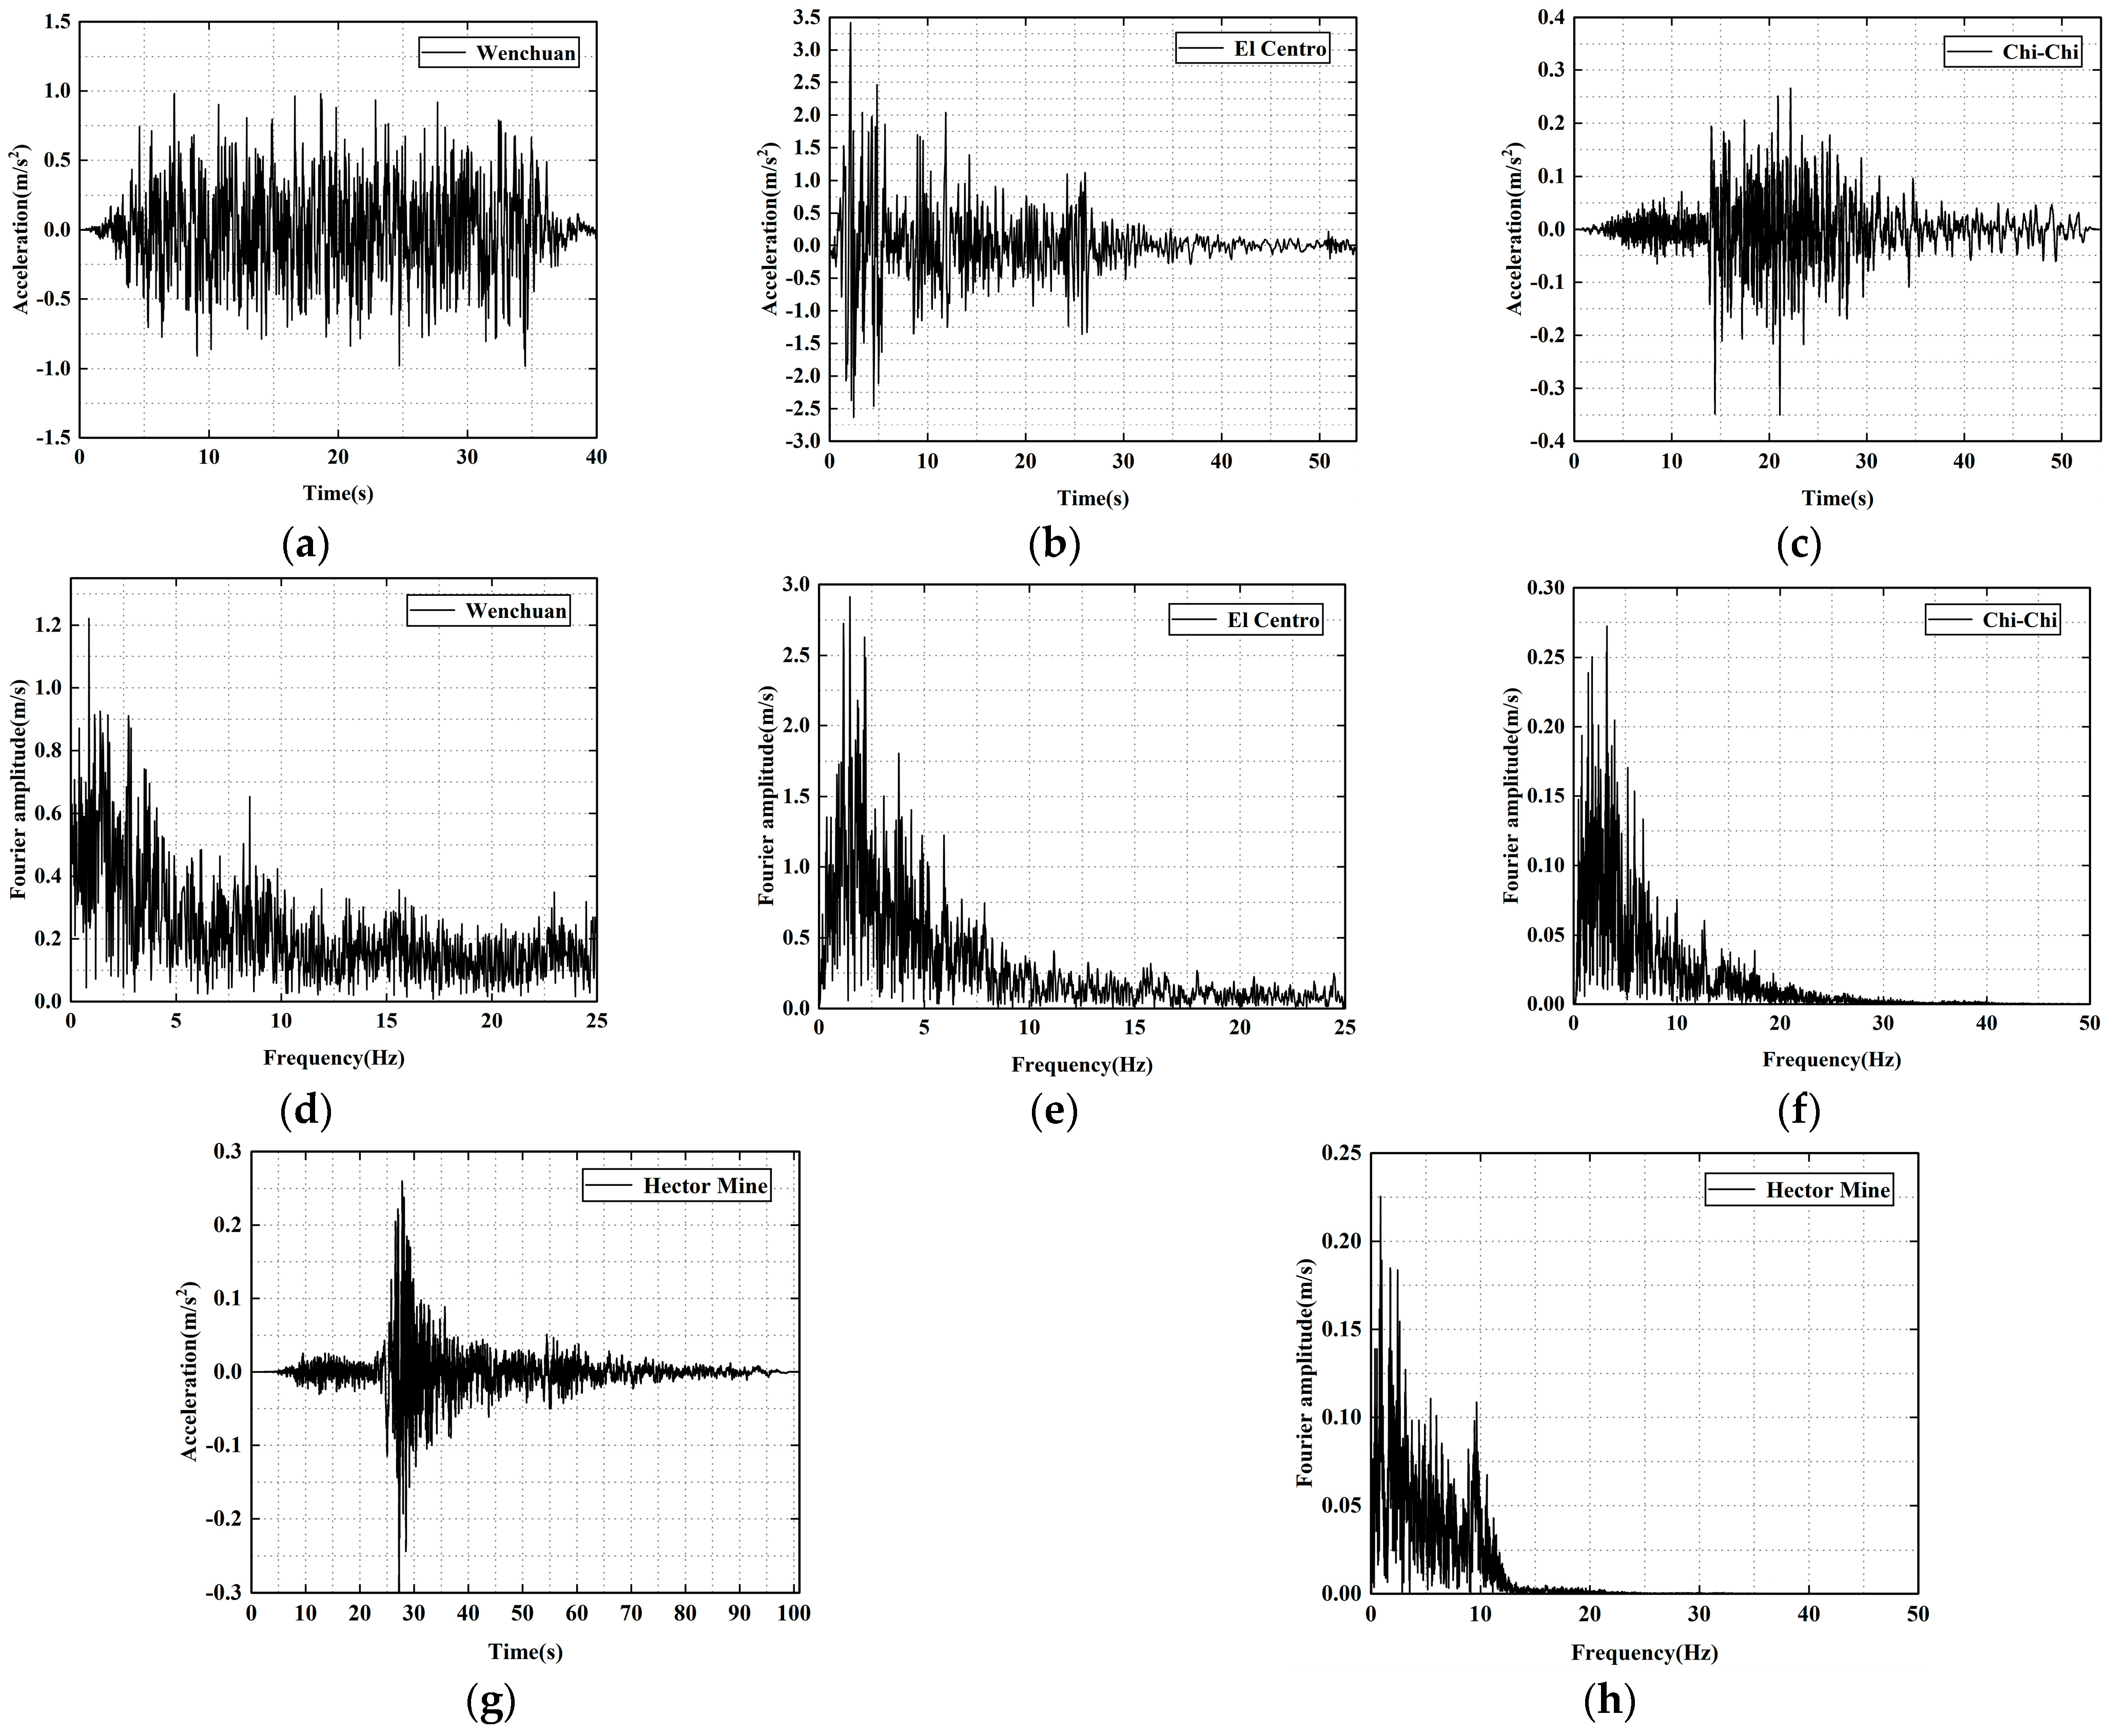
Four ground motion records corresponding to the case study were selected from the Pacific Earthquake Engineering Research Center (PEER) ground motion database. The time history curves of the different earthquake records are shown in
Figure 12, and each record was scaled to match the target PGAs of 0.35 m/s
2 for the frequent level (approximately 63% exceedance probability in 50 years), 1.0 m/s
2 for the design level (approximately 10% exceedance in 50 years), and 2.2 m/s
2 for the rare level (≈2–3% exceedance in 50 years) in accordance with seismic design categorization.
4.2. Acceleration Response
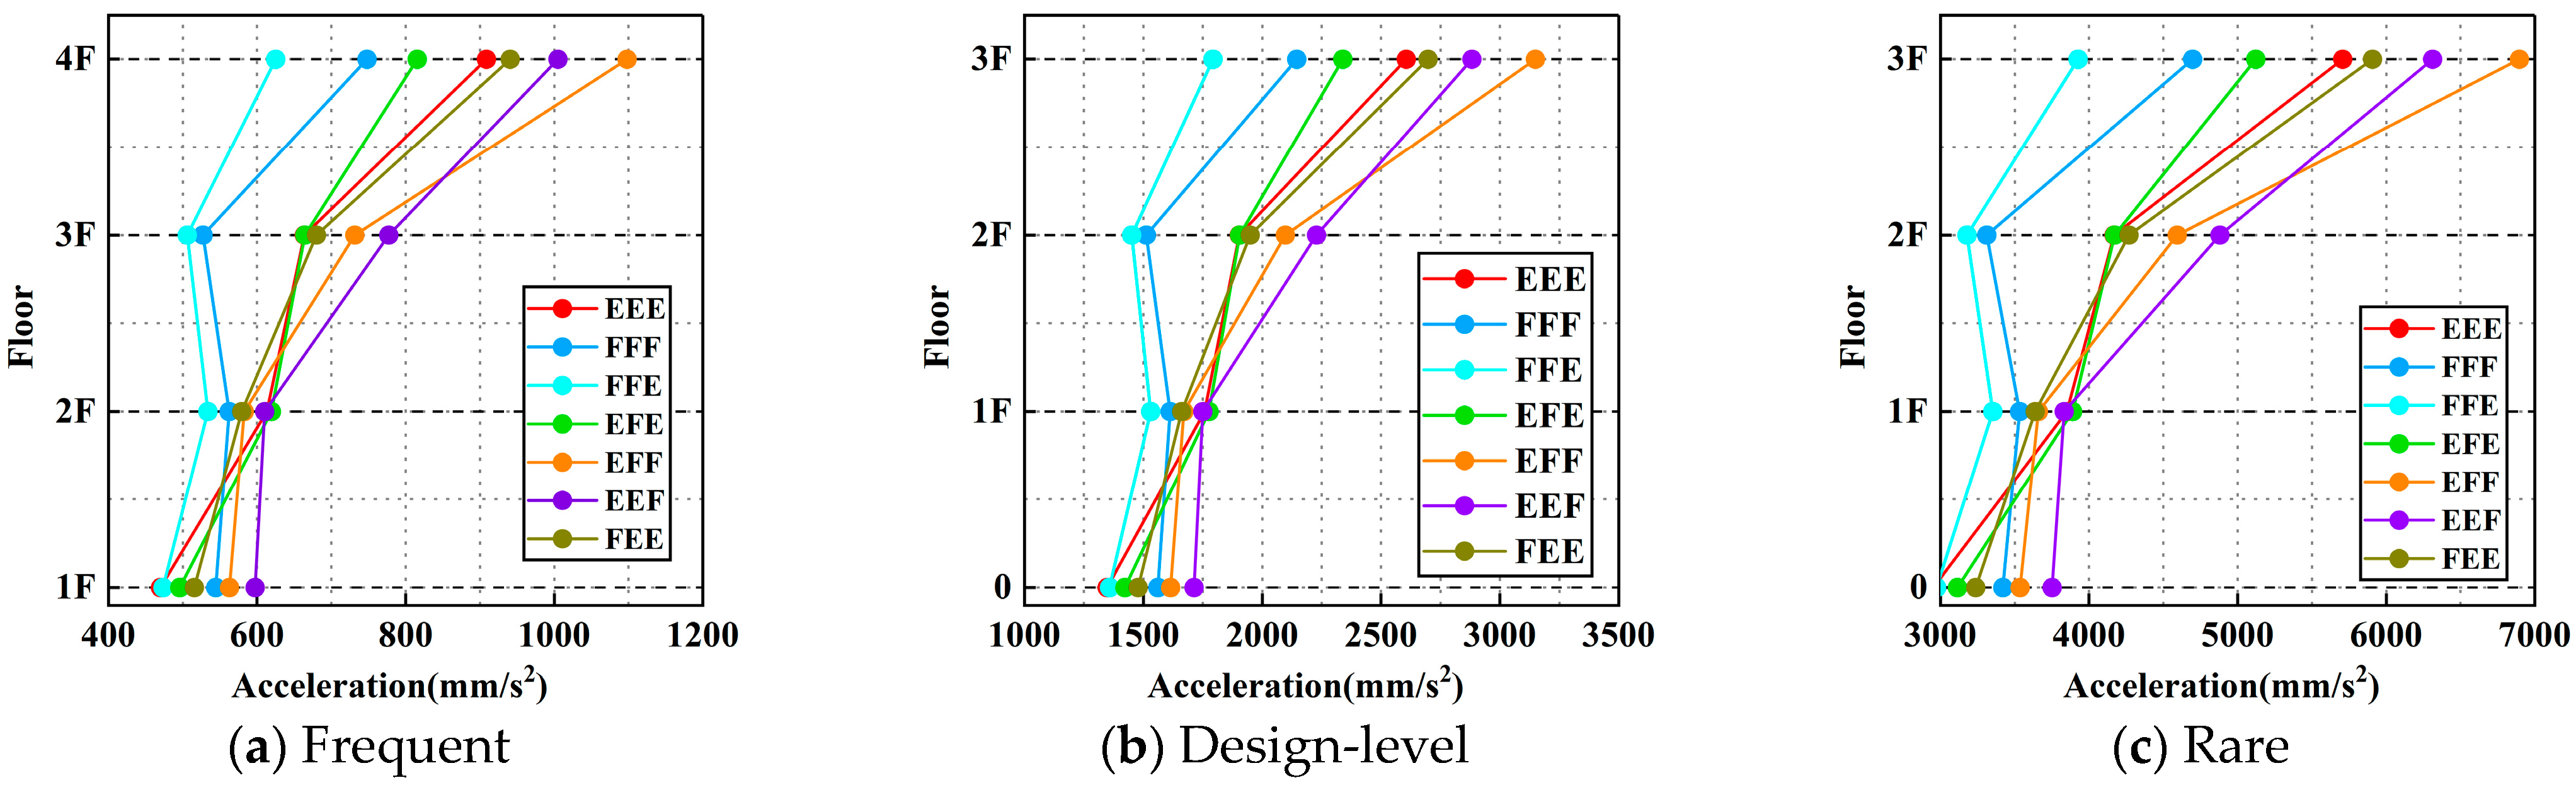
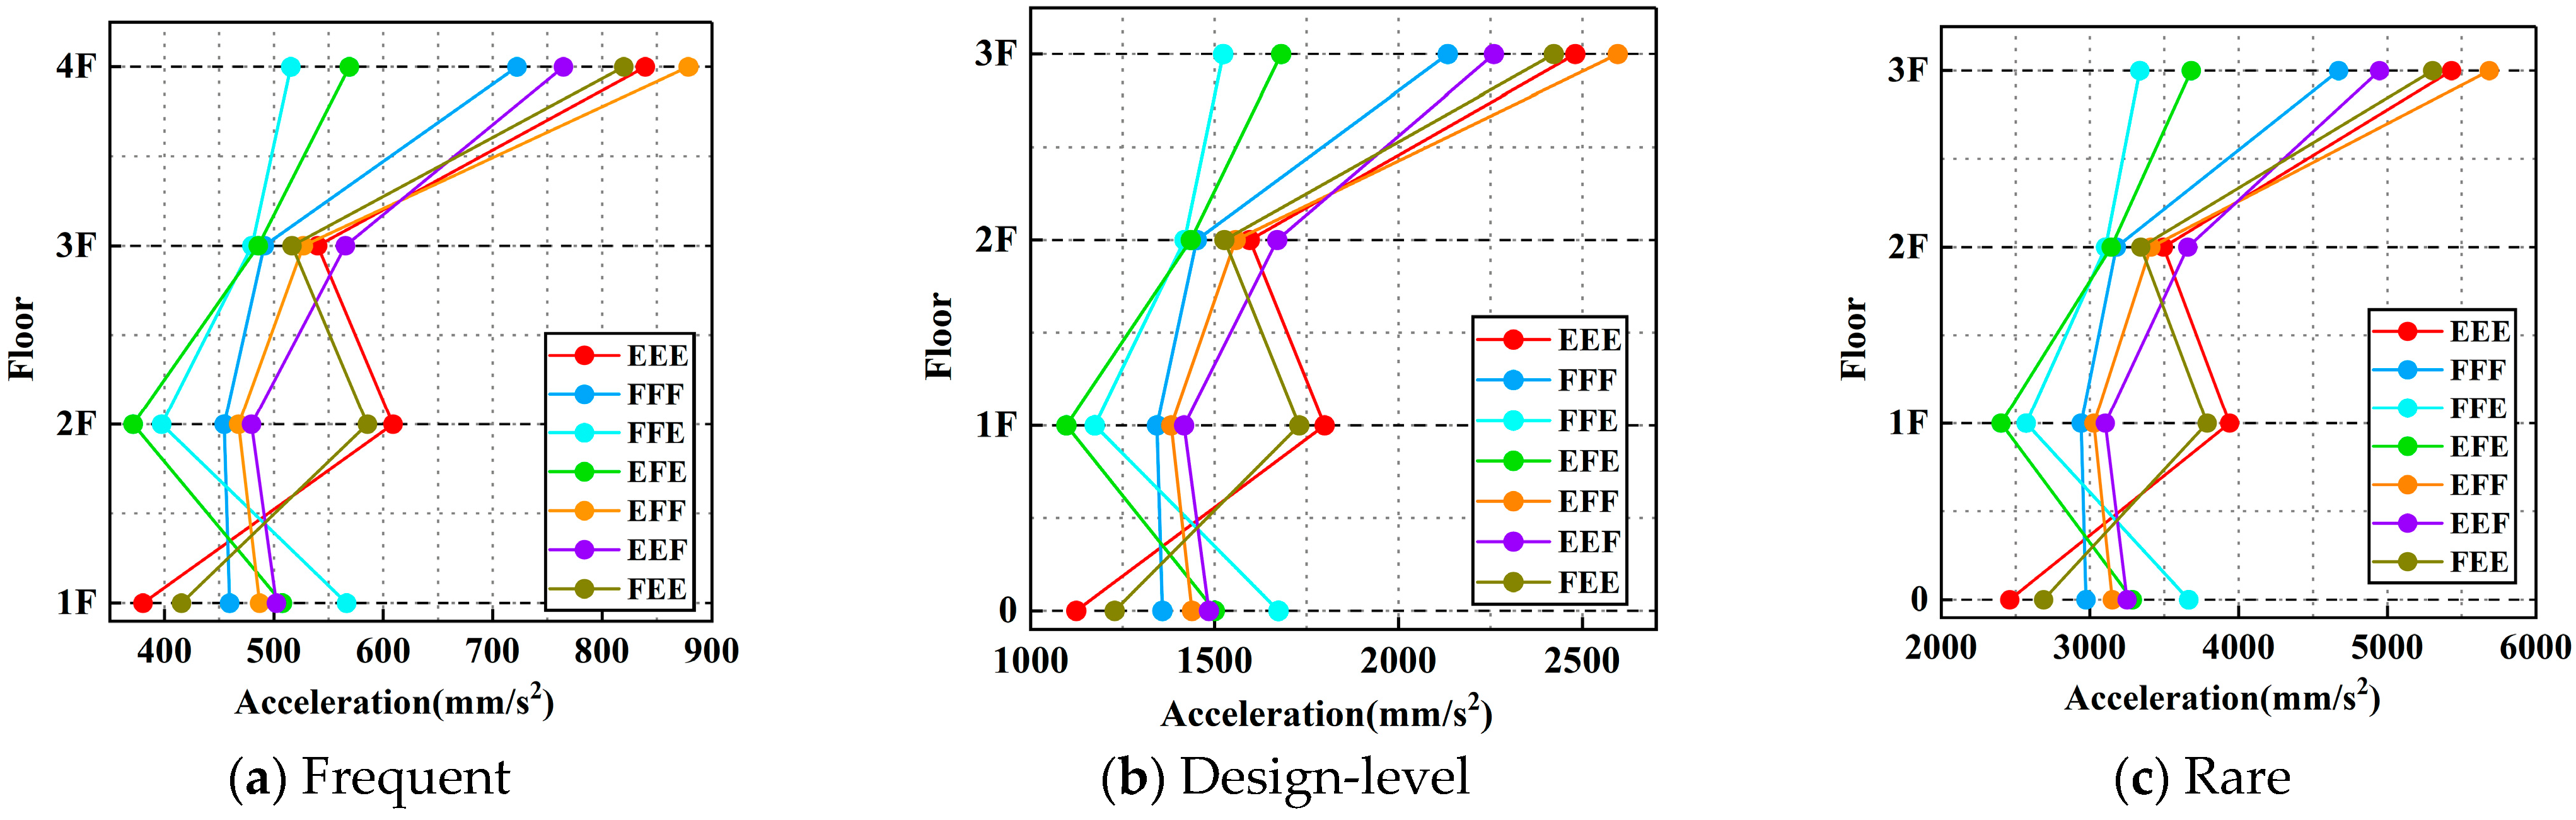
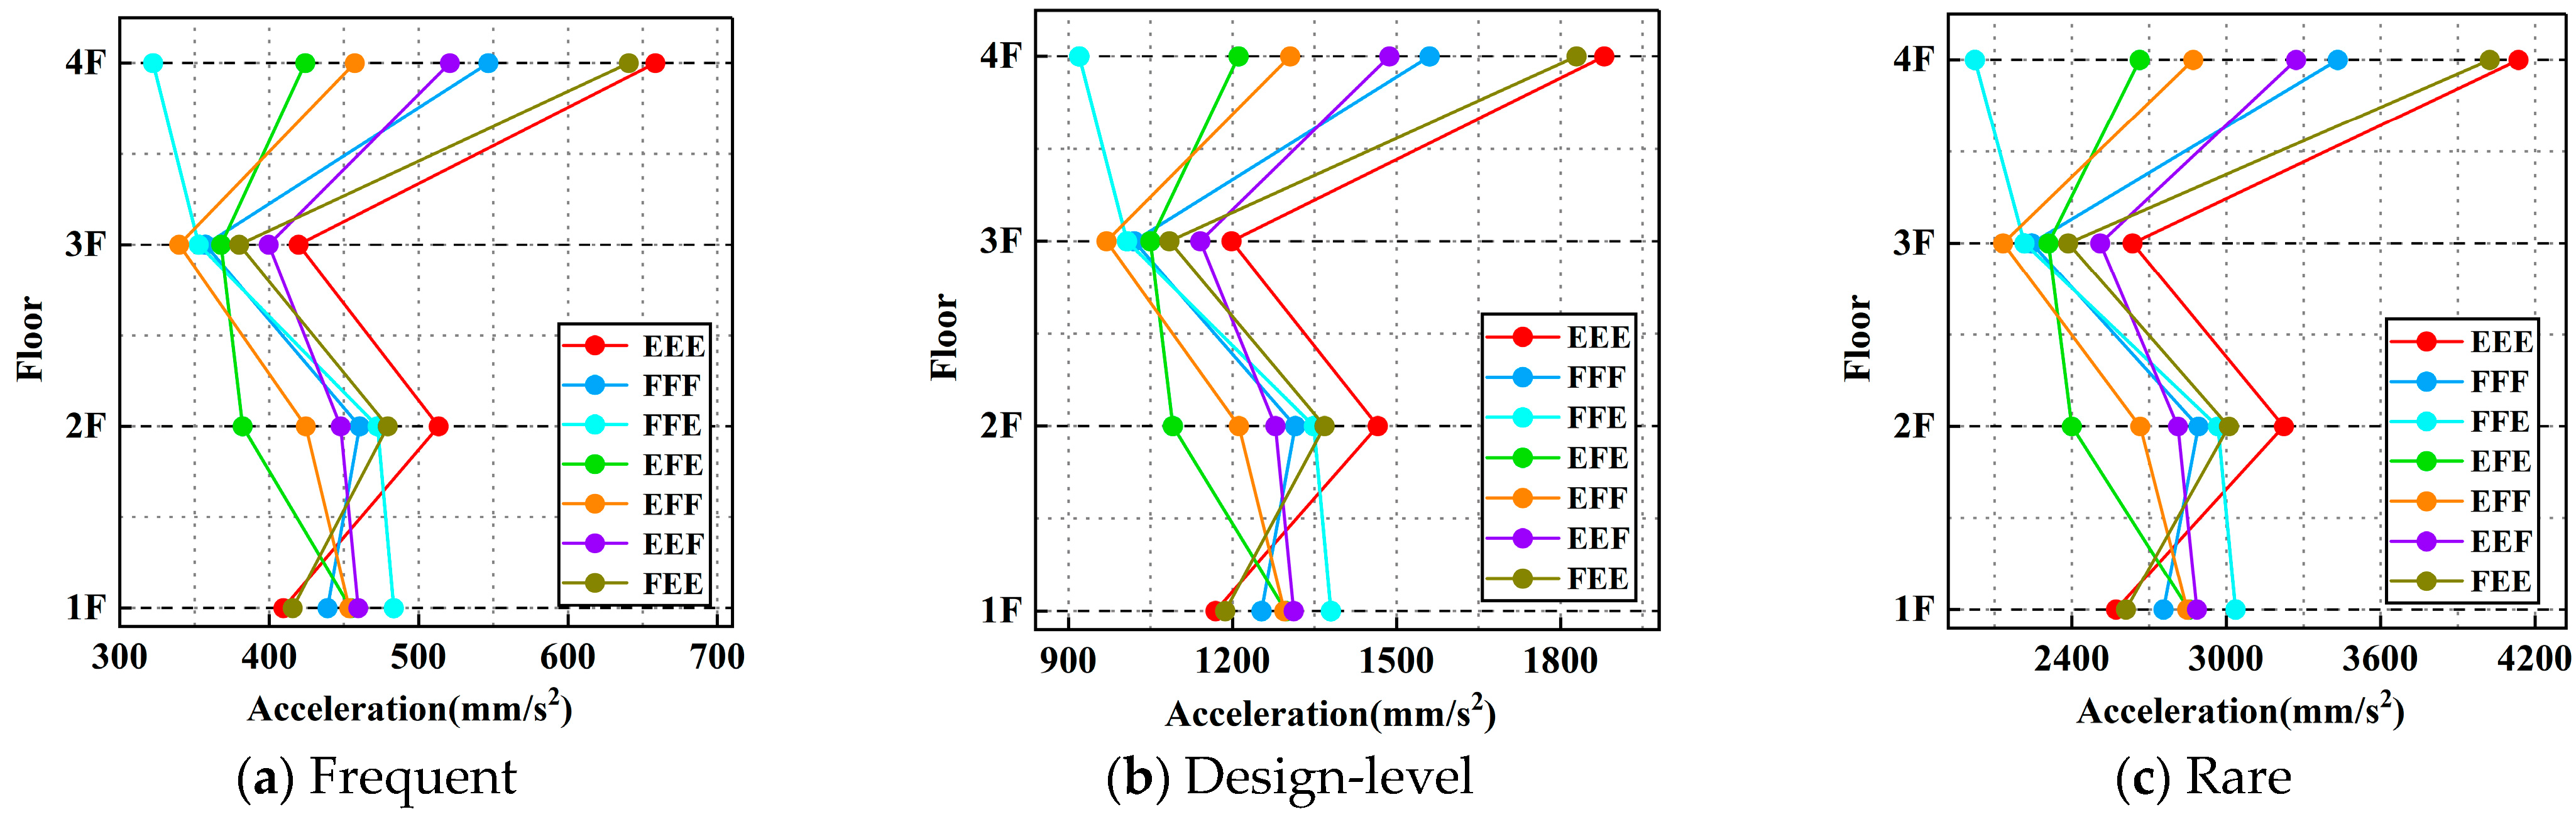
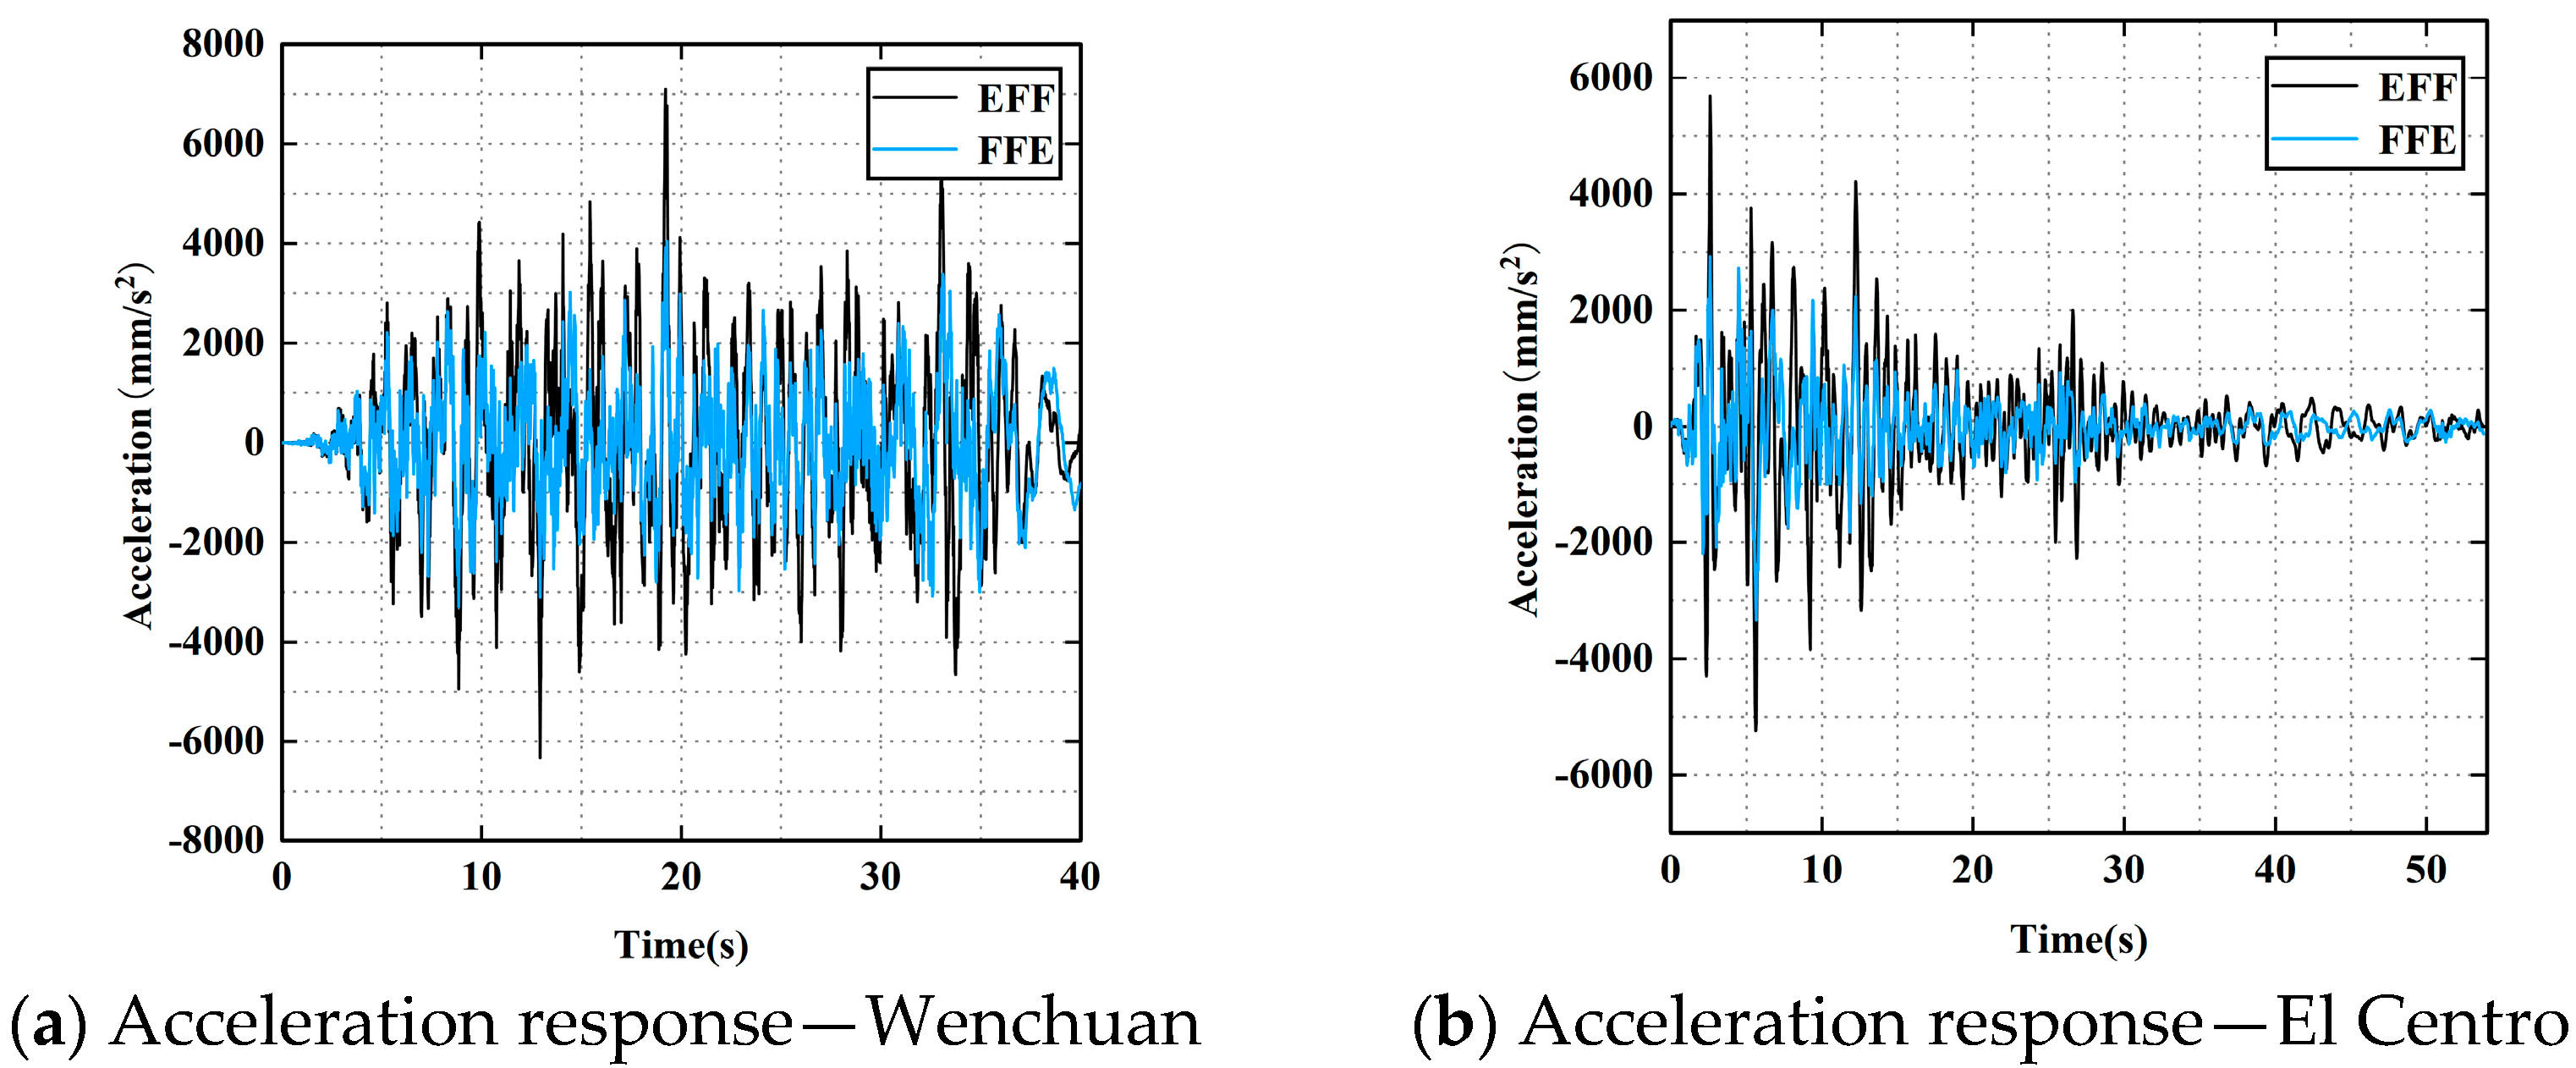
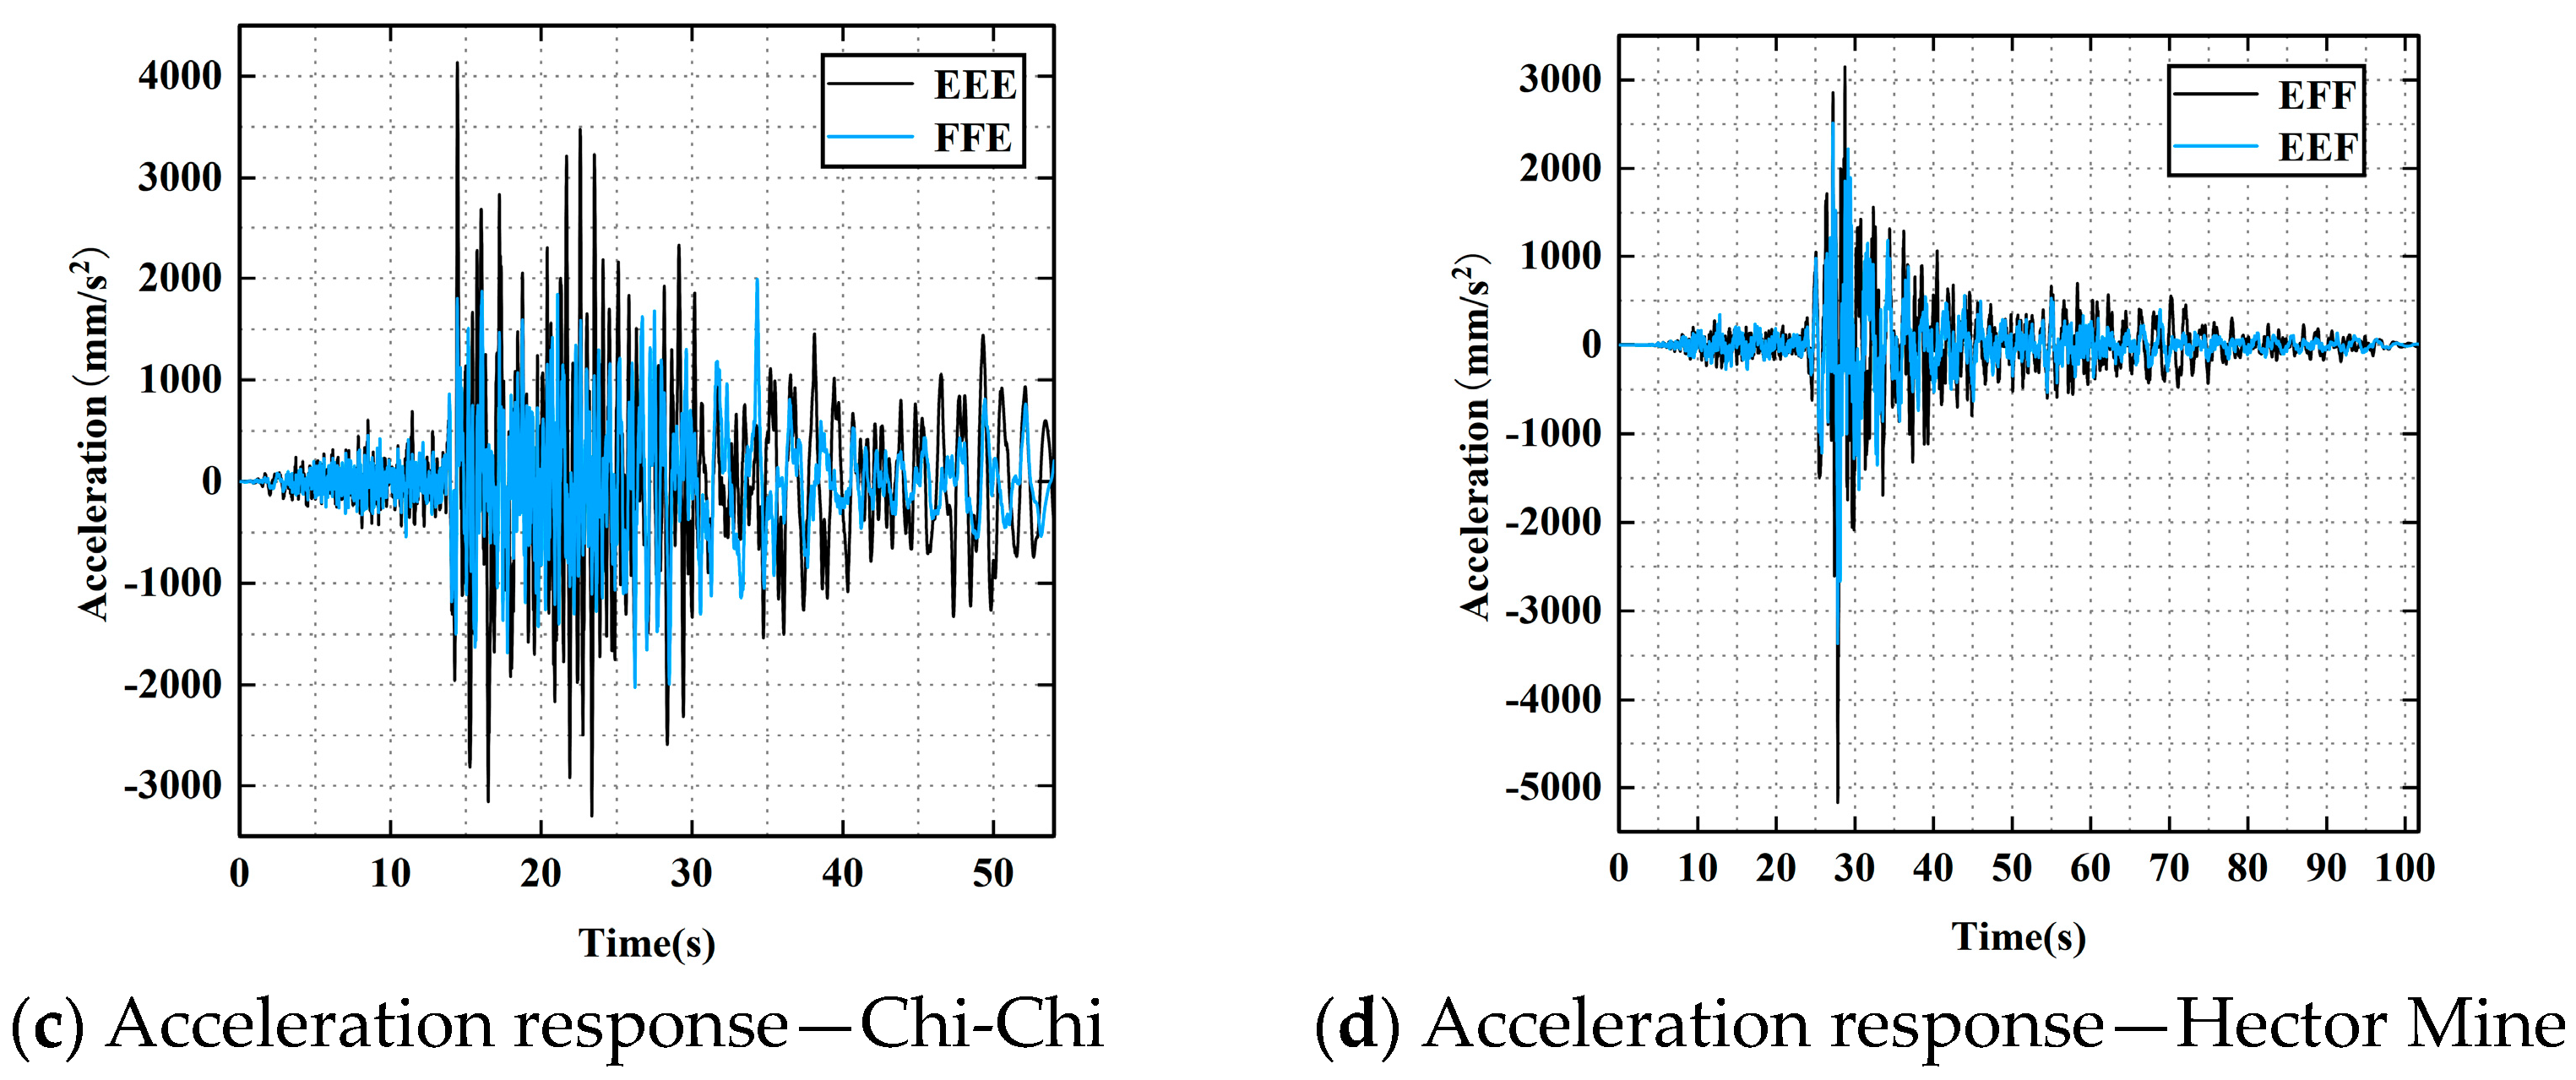
The magnitude of structural acceleration reflects the intensity of inertial forces experienced during seismic excitation. As shown in
Figure 13,
Figure 14,
Figure 15 and
Figure 16, the absolute acceleration values at each floor increase significantly with the intensification of the input ground motion. Moreover, the acceleration distribution trends vary markedly under different earthquake records. This variation is primarily attributed to differences in the spectral characteristics of each seismic wave, where the coupling between specific frequency components and the structure’s natural frequencies at various modes leads to distinct floor-level acceleration response patterns. Particularly under earthquake records with broader spectra and substantial mid-to-high frequency components, such as the Wenchuan and El Centro records, the floor responses across different grain-loading scenarios exhibit pronounced differentiation.
Further analysis of the influence of different grain-loading conditions reveals that top-loaded configurations (e.g., FFE, FFF), due to greater mass at the upper levels, produce a more balanced overall mass distribution, thereby enhancing global structural stiffness and reducing the top-floor acceleration amplification. In contrast, bottom-loaded conditions (e.g., EEF, EFF) are characterized by lower upper mass, making the structure more vulnerable to excitation by mid-to-high frequency components in the ground motion, resulting in significant acceleration amplification at the top floor. For instance, under the Wenchuan and El Centro records, the peak top-floor acceleration in the EFF scenario increased by 76.12% and 70.49%, respectively, compared to the FFF scenario (
Figure 13 and
Figure 14), while under the Hector Mine record, the EFF case showed a 62.79% increase over the EEF case (
Figure 16).
Notably, in the empty warehouse condition (EEE), the reduced structural mass and relatively higher stiffness can lead to strong resonance or near-resonance effects when the dominant frequency of the ground motion aligns with the structure’s natural frequency. This results in significantly amplified top-floor responses. For example, under the Chi-Chi earthquake, the peak top-floor acceleration in the EEE case was 104.67% higher than that in the FFE case (
Figure 15), highlighting the heightened sensitivity of the structure in an empty state to specific ground motion characteristics.
The acceleration time histories at the roof level under different ground motions are shown in
Figure 17; the peak acceleration values and overall response patterns under different earthquake records vary significantly across grain-loading scenarios. This indicates that the structural acceleration response of multi-floored grain warehouses is highly sensitive to the specific grain-loading configuration. In particular, scenarios such as EFF and EEE, characterized by lighter mass in the upper floors or reduced total mass, are more prone to acceleration amplification under seismic excitation. In contrast, the FFE condition, with a relatively balanced grain distribution across floors, demonstrates more stable and moderate top-floor acceleration responses.
4.3. Displacement Response
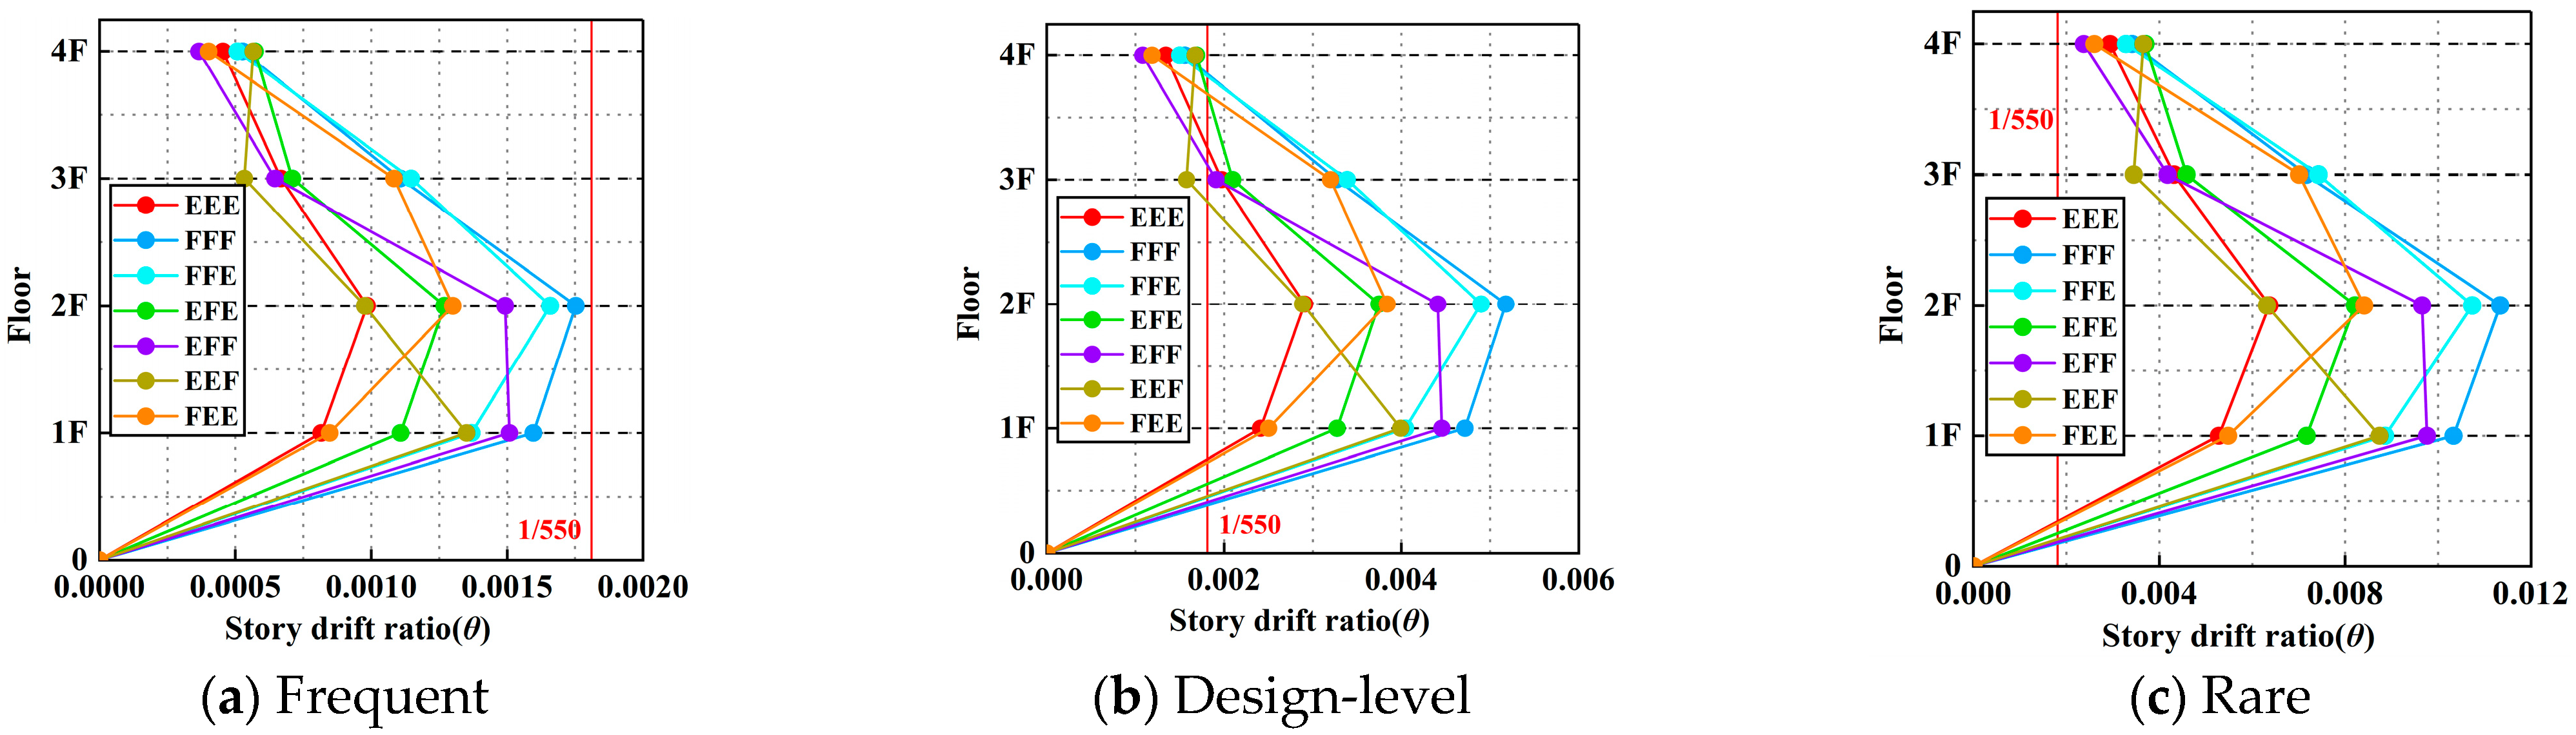
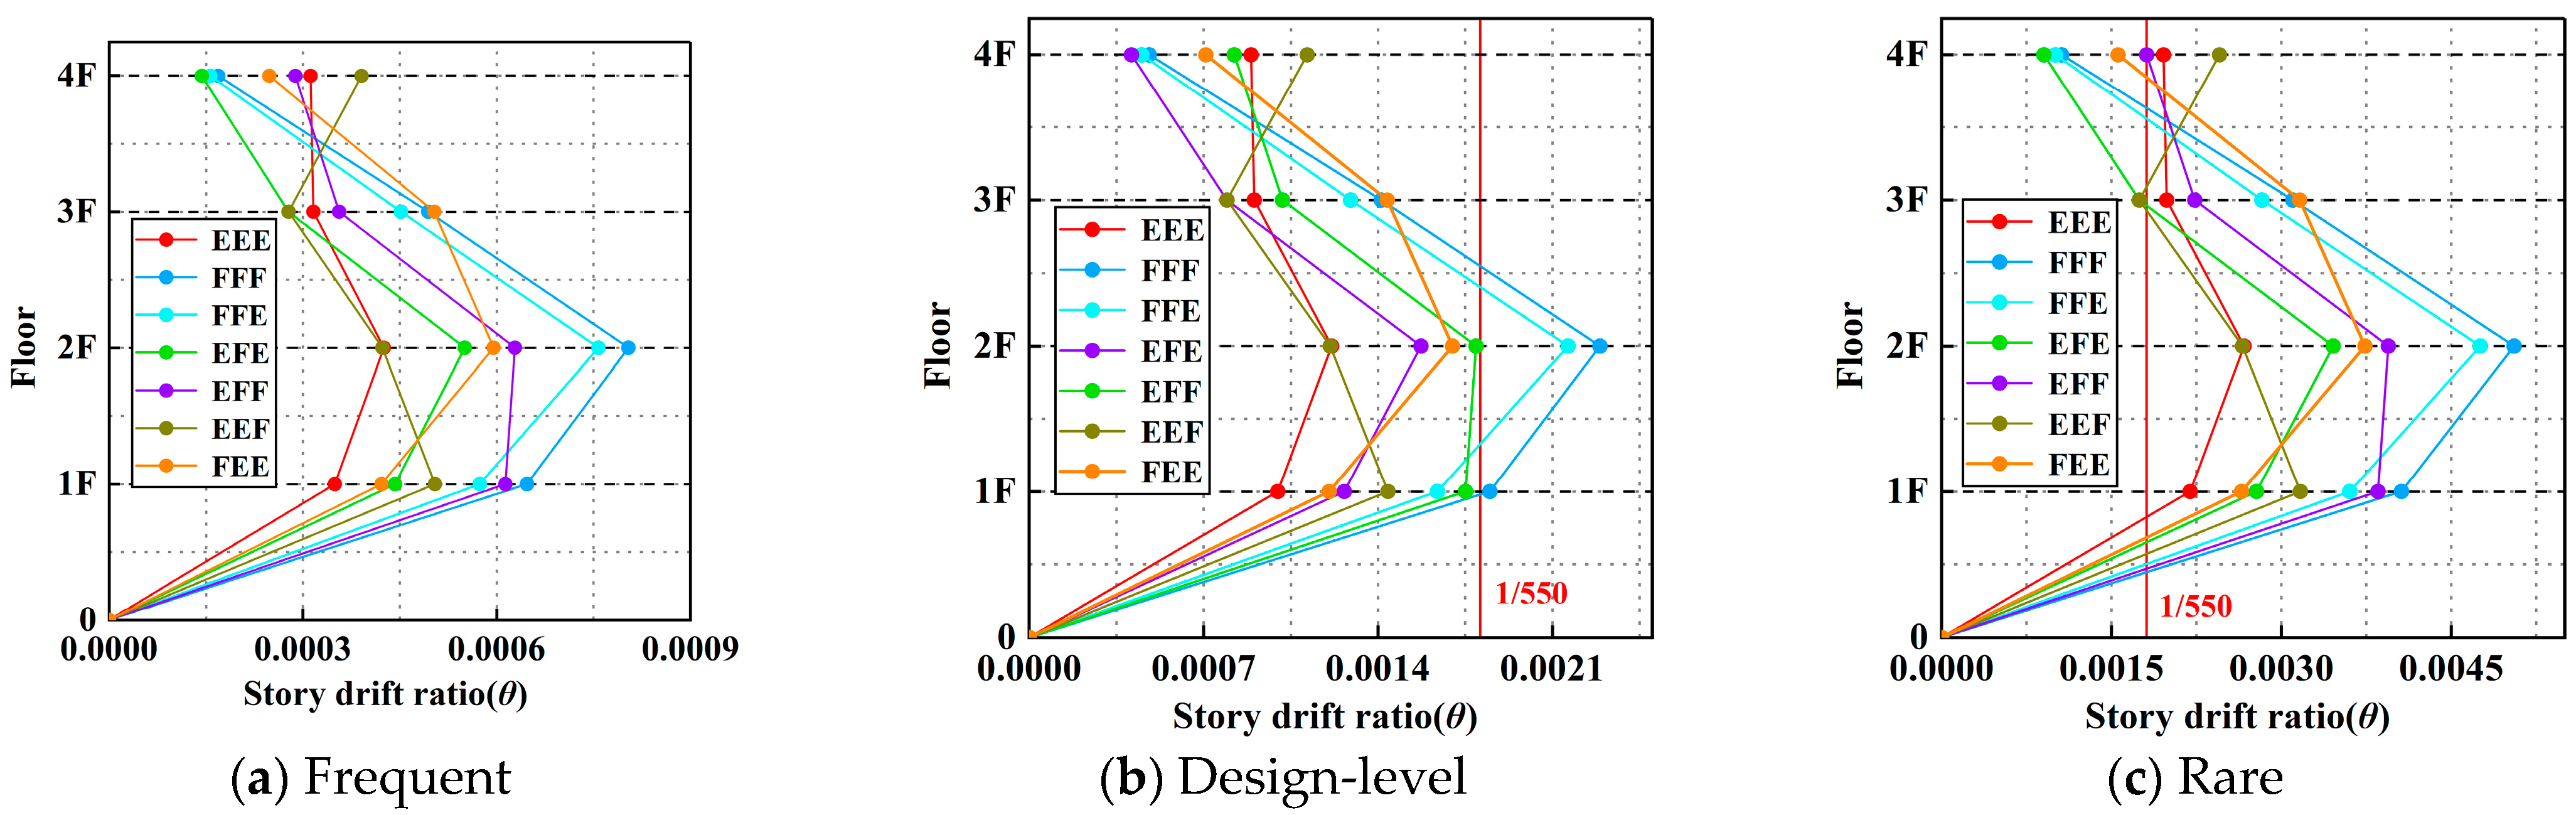
Figure 18,
Figure 19,
Figure 20 and
Figure 21 illustrate the distribution of inter-story drift ratios of the CSSC multi-floored grain warehouse structure under four representative earthquake records. Overall, with the increase in ground motion intensity, the inter-story drift ratios under all grain-loading conditions exhibit an upward trend. The maximum drift ratio consistently appears at the second floor, indicating that this level is the critical region for lateral deformation control within the structure.
Grain-loading configuration has a pronounced influence on the distribution of inter-story drift. The FFF and FFE scenarios consistently exhibit the highest inter-story drift ratios under all earthquake records, with the most prominent deformation occurring at the first and second floors. Although upper-floor grain storage increases the overall structural stiffness, the concentration of grain mass in the middle and upper levels generates substantial inertial forces during seismic excitation. This intensifies the stress demand on the lower structural components, leading to greater inter-story deformation. In contrast, the EEE condition, characterized by a reduced total structural mass, results in significantly lower inertial forces and a correspondingly weaker seismic response. For most earthquake records, the inter-story drift at the second floor remains low in the EEE scenario, and although some top-floor amplification is observed in specific cases, the overall deformation pattern remains relatively uniform.
Further comparison reveals that, relative to the EEE condition, the second-floor inter-story drift ratio in the FFF condition increases by 74.33%, 192.41%, 87.27%, and 151.61% under the Wenchuan, El-Centro, Chi-Chi, and Hector Mine records, respectively. These results further confirm the substantial impact of grain mass distribution on structural seismic response and underscore the necessity of accounting for deformation concentration at lower levels under full-storage conditions in the structural design of multi-floored grain warehouses.
The displacement time history curves of the second floor are shown in
Figure 22, where significant differences in both overall response and peak displacement can be observed across different grain-loading scenarios. In the EEE condition, where no grain is stored on any floor, the total structural mass is substantially reduced, resulting in lower inertial forces. Under identical seismic excitation, the reduced inertial demand leads to a lower stress level within the structure, thereby weakening the accumulation of nonlinear deformation effects and effectively limiting the displacement response.
In summary, the structural responses in terms of both acceleration and displacement under different earthquake records exhibit consistent trend characteristics. Acceleration responses are primarily concentrated at the top of the structure, indicating a tendency for vibration amplification in the upper levels and revealing a pronounced whipping effect. In contrast, displacement responses are characterized by the maximum inter-story drift ratio occurring at the second floor, highlighting that the lower structural components experience the most significant shear deformation during seismic excitation. The displacement analysis results suggest that the combined effects of grain loading and seismic action are unfavorable to structural performance. However, across all grain-loading scenarios, the inter-story drift ratios remain within the limits specified by the design code. Even under the most critical condition—full storage (FFF)—the CSSC multi-floored grain warehouse structure still demonstrates sufficient safety reserves.
5. Conclusions
This study employed finite element simulation to investigate the seismic response of a multi-floored grain warehouse structure under the combined influence of horizontal and vertical grain loads. Various grain-loading conditions were considered, and the structural pushover curves, performance points, acceleration responses, and displacement behaviors were compared. The key conclusions are as follows:
(1) Pushover analysis results indicate that full grain storage across all three floors reduces the base shear force. Compared to the most unfavorable FEE condition, the base shear peak in the EEF scenario (grain stored only on the first floor) increased by 35.14%. Among the more commonly observed real-world scenarios, the base shear peak under the EEE condition (empty warehouse) was 6.67% higher than that of the FFF condition (fully loaded).
(2) Capacity spectrum analysis revealed that the displacement at all performance points in the EEF condition was significantly lower than in other scenarios, indicating that storing grain on the first floor enhances the initial stiffness and base shear capacity, effectively limiting seismic displacement response. The FEE scenario, in contrast, exhibited the lowest base shear at corresponding performance points, further validating the pushover analysis findings.
(3) Different grain-loading configurations significantly altered the structure’s acceleration response, which was primarily concentrated on the top floor. A clear amplification of upper-floor vibrations was observed. In the FFE and FFF scenarios, the larger top-floor mass and more balanced stiffness distribution resulted in relatively stable top-floor accelerations. However, the EFF and FEE cases, with uneven vertical distribution of mass and stiffness, were more susceptible to high-magnitude acceleration amplification under seismic excitation.
(4) The CSSC multi-floored grain warehouse exhibited significant differences in inter-story drift ratios across loading conditions, with maximum drift consistently occurring at the second floor. All drift ratios remained within the design code limits under various scenarios. Even under the most critical FFF condition, the structure demonstrated sufficient safety margins, confirming the applicability and seismic reliability of the CSSC structural system for different grain-loading configurations.


 ,
, 


