1. Introduction
In recent years, with treatment and maintenance in water conservancy and harbor and waterway projects, a significant amount of dredged silt with high water content, high compressibility, and low strength has been annually produced. The dredged silt cannot meet project requirements, and the problems of environmental pollution and site wastage caused by the accumulation of large quantities of silt need to be solved urgently [
1,
2,
3]. The engineering properties of dredged sludge can be improved through the addition of curing materials, and converting sludge into construction components that can meet the needs of projects via adding cementitious materials is a promising avenue for resource utilization [
4,
5]. In the construction of ecological environments, in order to promote comprehensive sustainable development, the resource utilization of engineering waste is unavoidable Synergistic cement–industrial waste curing sludge supports environmental protection, and waste recycling is an important pathway. It not only utilizes the potential activity of industrial wastes and enhances the treatment effect but also solves the problems of high energy consumption and pollution in cement production [
6,
7]. Moreover, the challenges of industrial waste dumps occupying land resources and environmental pollution hazards [
8] are also alleviated. Overall, synergistic cement–industrial waste curing sludge has significant economic and environmental benefits [
9].
At present, many scholars have carried out a high number of studies on solidified synergistic cement–industrial waste soil. In their study on the preparation of fluid-cured soil using slag, Zhu et al. [
10] found that the early strength and late strength of the ash-to-sand ratio were higher with the same water-to-solid ratio. Ding et al. [
11] prepared fluid-cured soil using fly ash and mineral powder and used it as a roadbed filler. They investigated the effects of different curing agent ratios on the performance indexes of roadbed pavements and also evaluated the feasibility of cured silt as a filler. Zhang et al. [
12] used fluid-consolidated soil for backfilling pipelines to reasonably reduce the cost of various working conditions. However, most of the existing applications of cured silt-reclaimed backfill are focused on the research of road base pavement; studies on pipeline backfill are fewer in number. Zhang et al. [
13] used cement and slag to cure silt and found that blast furnace slag significantly increased the unconfined compressive strength of the cured soil. Furthermore, it had an excellent stabilizing effect on Fe, Ni, and Zn. The results of Meng et al.’s study [
14,
15] on the effect of the addition of fly ash and silica fume on the strength of cured soil showed that fly ash reduced the early strength of cementitious materials. However, the effect of silica fume and fly ash on their strength enhancement showed a linear increasing trend overall. Alemshet et al. [
16] added fly ash and steel slag micronized powder to expansive soil and found that they reduced its expansion rate and improved its stability and strength. Ren et al. [
17] determined the effect of curing agent dosage on strength using a cement–water-based polymer as a curing agent. The mechanism of the strength formation of the cured soil was also discussed. Zhou et al. [
18] investigated the effects of different cementitious materials, dosages, and ages on the properties of fluid-cured soils under a dry environment. They noted that dry conditions tended to reduce the strength of the fluid-consolidated soils and that the longer the duration of drying, the greater the reduction in strength.
This paper utilized the Zhuhai alluvial filling project, employing cement–industrial waste as the curing cementitious material. The significant degree of influence of cement, fly ash, blast furnace slag, and phosphogypsum on the strength of cured soil was analyzed via the orthogonal design of experiments. Finally, the engineering performance optimization of the cured soil was carried out by combining admixtures to reveal its strength development law. This article provides some valuable references for the resource utilization of silt in coastal areas and forms a scientific and effective technical method.
2. Materials and Methods
2.1. Experimental Materials
The raw materials selected in this study were marine silt, fly ash, S95 blast furnace slag, phosphogypsum, cement, calcium chloride, and a polycarboxylic acid water-reducing agent.
The silt used for the test was taken from soft soil washed and filled during the construction of a coastal site. The soil samples were yellowish-brown in color with a soft texture and the continuous and overall fine grading of the soil particles. The samples could not be used directly as engineering soil, and we tested their basic physical indexes in accordance with Test Procedures for Highway Geotechnical Engineering (JTG 3420-2020). The basic physical property indicators and chemical composition of the raw materials are shown in
Table 1 and
Figure 1.
2.2. Experimental Design
In order to derive the optimum mixing ratio of cement, fly ash, slag, and phosphogypsum, tests were carried out using an L16 orthogonal experimental design. Among these materials, the cement dosage was 9%, 12%, 15%, and 18%, the fly ash and blast furnace slag dosages were 2%, 4%, 6%, and 8%, and the phosphogypsum dosage was 0.5%, 1%, 1.5%, and 2%. The natural moisture content of the soil samples was set to 180%. The table of orthogonally designed tests is shown in
Table 2.
The formula for calculating the mean value, K, and the extreme value, R, is the following:
: Compressive strength test results for a factor.
: The number of horizontal factors.
2.3. Specimen Preparation and Maintenance
The natural moisture content of the batch of silt soil was measured using a high-temperature furnace (KSL-1700X-A4) and then calculated to configure the silt soil into a 180% silt slurry. Further, the raw materials were weighed according to
Table 2, and the cement, fly ash, slag, and phosphogypsum were combined well in proportion. We poured the pre-prepared silt slurry into a mortar mixer to blend the cementitious materials and mixed them for 2~3 min, with a mixing rate of 2 r/s. We poured the mixture into a φ50 mm × 50 mm PVC pipe after it was evenly combined and vibrated it on a vibration table until the specimen surface was uniform and smooth with no air bubbles overflowing. After the vibration, we covered the PVC pipe with a layer of cling film and took off the mold after 24 h of room-temperature maintenance. After demolding, the soil specimens were wrapped tightly with cling film and placed in a standard curing box SHBY-40B (temperature, 20 °C; humidity, 95 °C) until a specified age to carry out subsequent tests.
2.4. Test Program
To ensure the homogeneity and consistency of the specimens, the silt soil of each batch of samples was taken from the prepared silt slurry. According to the specifications for the flowability of solidified soil in a fluidized state. It can be determined that when the natural moisture content of the sludge is 180%, the flowability requirements of the solidified soil are basically met.
2.4.1. Unconfined Compressive Strength Test
A WDW-50 electronic universal testing machine was used, with a maximum range of 50 kN and a set loading rate of 1 mm/min. The compressive strength of each group of cured soils was tested after the specimens were cured to various ages. We recorded data when each group of specimens demonstrated a pressure peak and damage. In order to avoid errors in each group of specimens, we used the average of three parallel specimens as the strength of the measured value.
2.4.2. Fluidity Test
We referred to the specification Test methods for air-entraining mortars and air-entraining grouts for the fluidity test. We poured the homogeneous mixture into an 80 mm × 80 mm plexiglass bucket placed on a transparent glass plate. With a 30 cm steel ruler, we gently tapped the outside of the cylinder so that the silt fluid-cured soil became dense, with reduced surface gaps, and we moved the ruler slowly along the glass cylinder, scraping the specimen. Finally, the glass cylinder was slowly lifted and left to stand for 30 s. The degree of extension of the fluid-cured soil at this point was recorded with a steel ruler. The test was repeated three times, and the average of the three test results was taken as the final flow value of the fluid-cured soil.
2.4.3. Working Performance Regulation Test of Fluid-Cured Soil
Although two sets of optimal ratios were obtained in the orthogonal test, their compressive strengths did not meet most engineering needs. Therefore, experiments were conducted to regulate the properties of the fluid-cured soils using physical and chemical methods. Using the physical method, by changing the initial water content of silt, the strengths of the two ratios, as well as the change rule of fluidity, were obtained. Using the chemical method, based on chemical means, we selected two additives, a calcium chloride early strength agent and a polycarboxylic acid water-reducing agent, and explored the change rule of the strength and fluidity of the fluid-cured soil to ensure that it met the needs of this project. We chose calcium chloride with a purity greater than 99.5% from an experimental industrial salt and a polycarboxylic acid water-reducing agent produced by Shandong Feike New Material Science and Technology Company.
2.4.4. Microstructural Analysis
Microscopic morphology tests were performed to analyze the hydration products using scanning electron microscopy (SEM). The samples to be tested were taken out, crushed, and powdered for gold plating. The microscopic morphology of the clinker was observed using a Zeiss Sigma 300 scanning electron microscope with an accelerating voltage of 5 kV.
The raw material composition and cured soil preparation process are shown in
Figure 2.
3. Test Results and Analysis
3.1. Analysis of Orthogonal Test Results
Table 3 shows the unconfined compressive strength of the cured soil at 3d, 7d, and 28d in the orthogonally designed tests. From
Table 3, it can be seen that the rate of strength increase from 3d to 7d was greater than that from 7d to 28d. For the 16 groups of tests, the highest strength was in group 10, where the compressive strength at 28d reached 239.72 kPa.
Orthogonal tests were conducted to determine the degree of influence of a factor on the results by analyzing the R-value of the extreme deviation as well as the K-value of the mean. The higher the R-value, the higher the degree of influence of a factor on the results of the tests, which was called the primary factor; the smaller the R-value, the lower the degree of influence of a factor on the results, which was called the secondary factor [
19].
3.1.1. Range Analysis
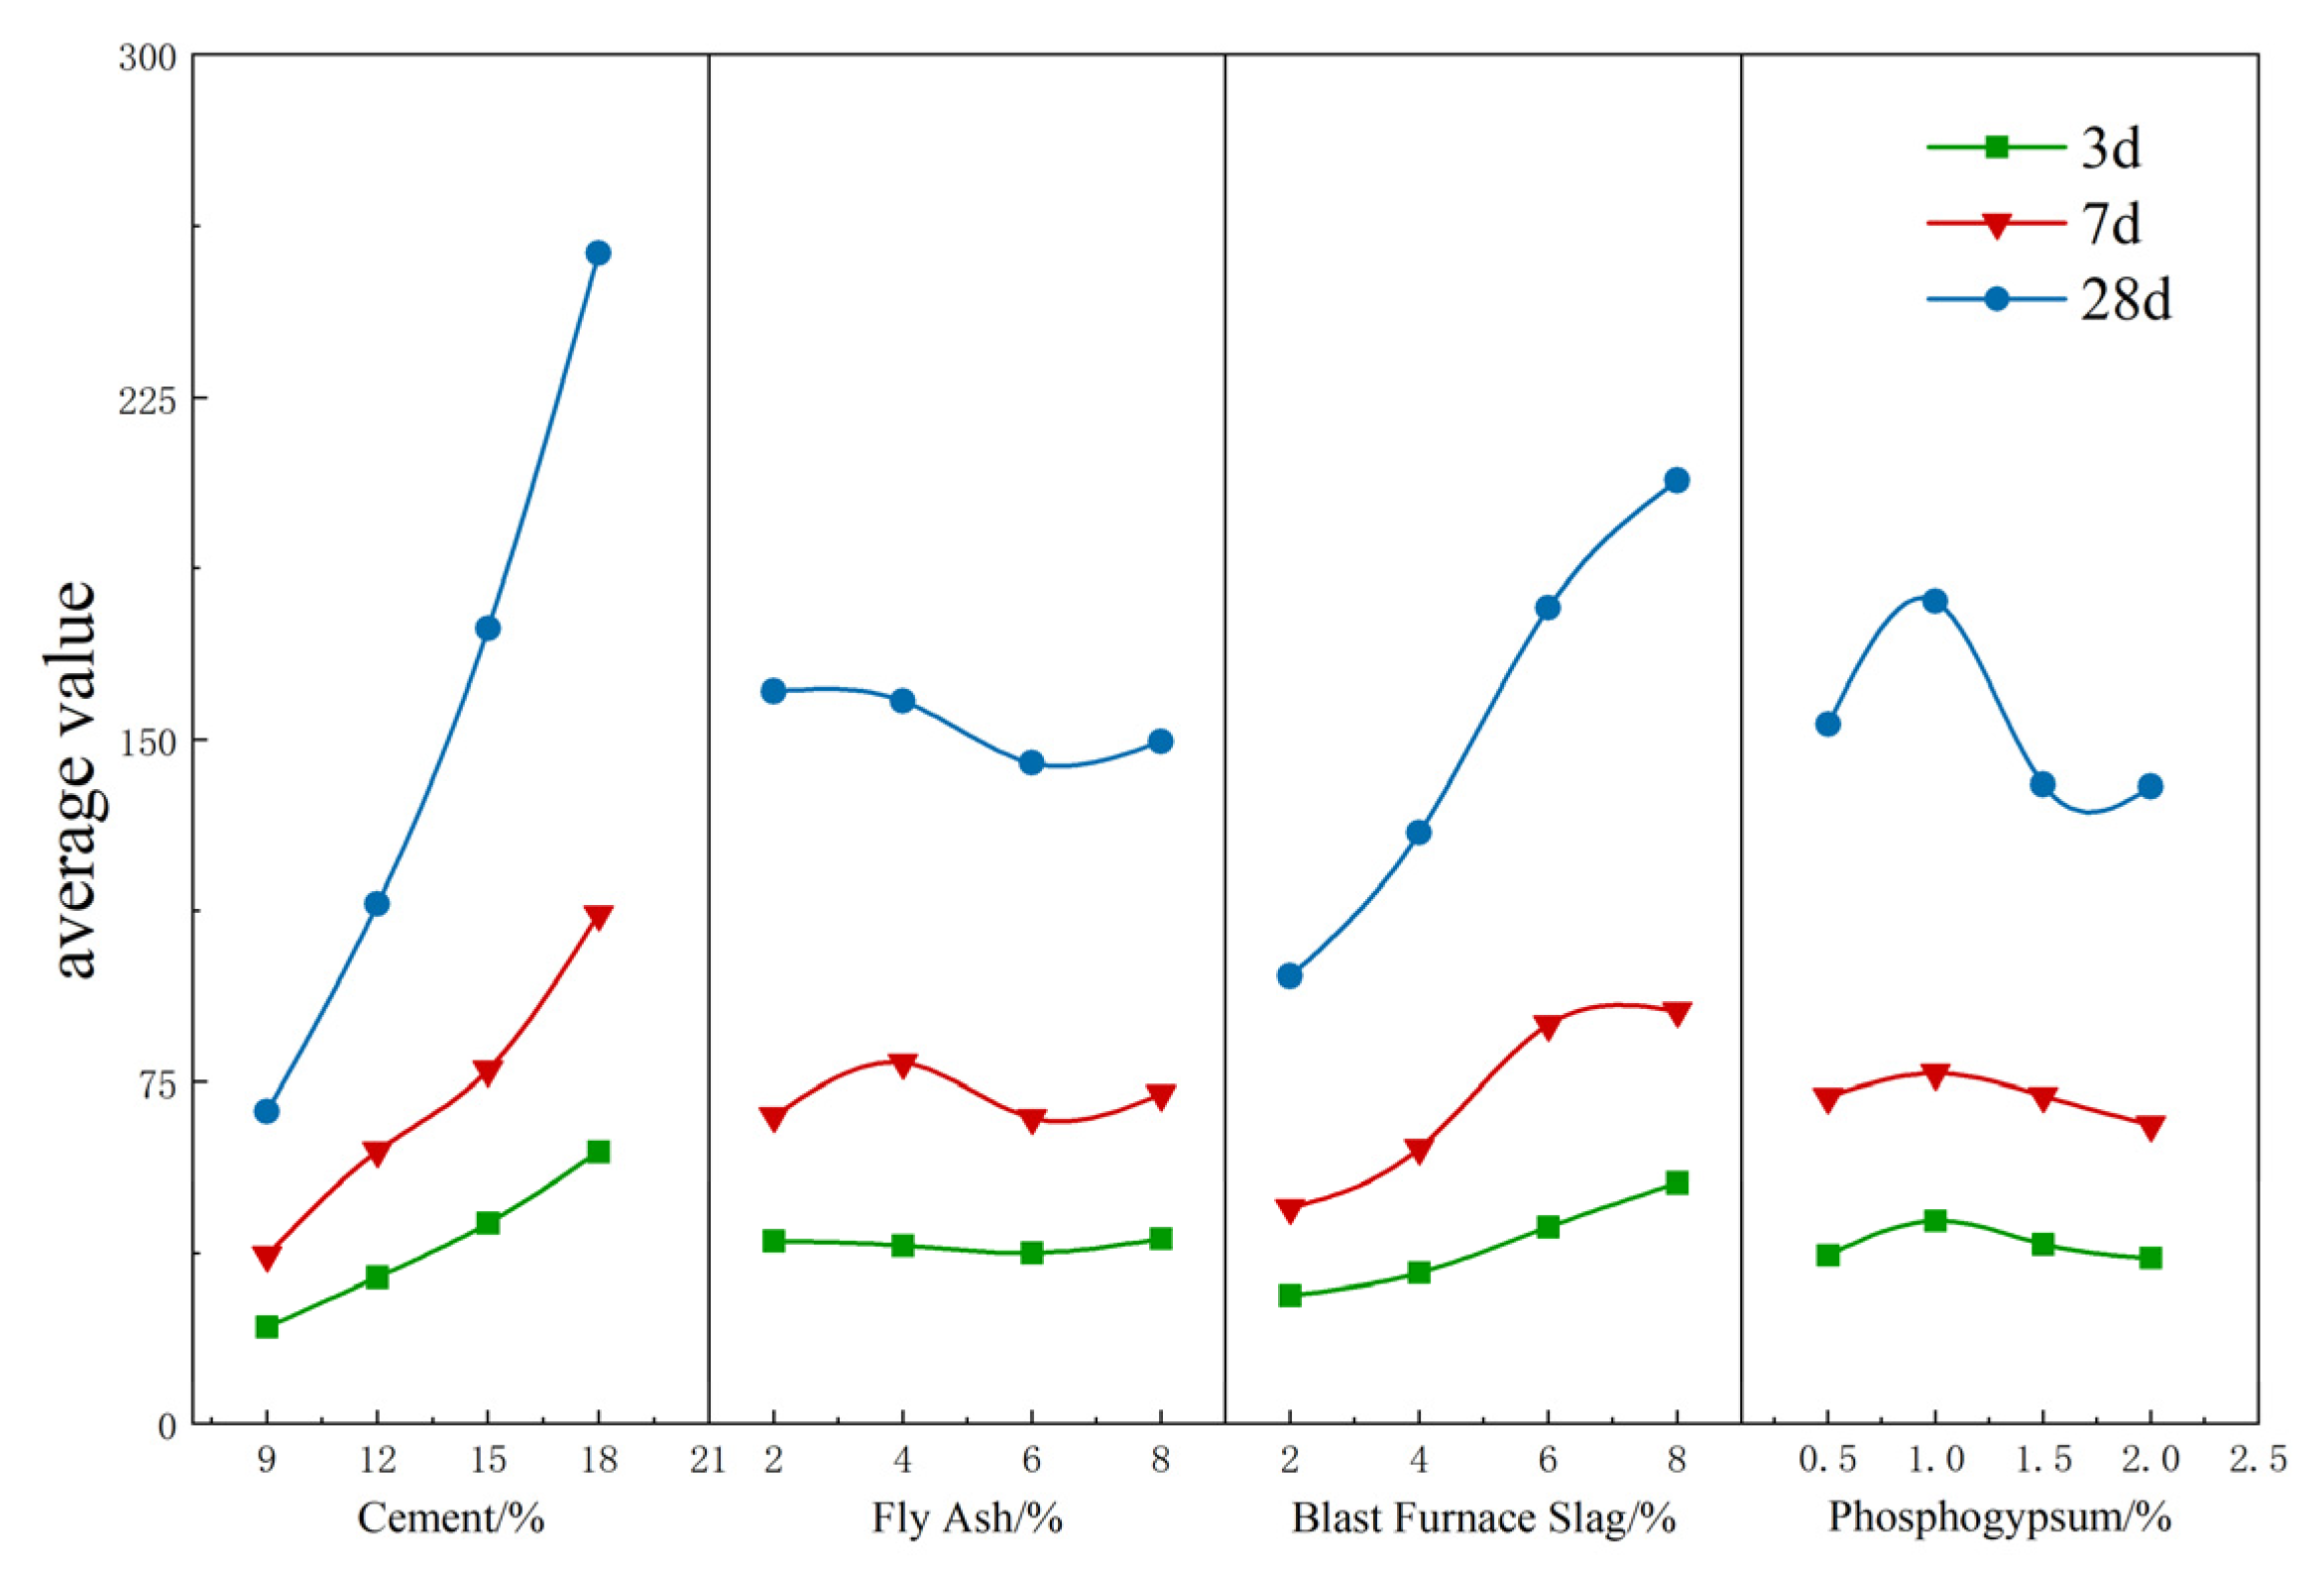
From the results of the orthogonal test polarity in
Figure 3, we can observe that the larger the extreme value of the factor R, the more significant the effect on the compressive strength of the cured soil at that age. The factors affecting the 3d and 28d unconfined compressive strength of the cured soil were in the following orders of priority: cement dosage > slag dosage > phosphogypsum dosage > fly ash dosage and cement dosage > slag dosage > phosphogypsum dosage > fly ash dosage. Additionally, the main relationship of the factors affecting 7d was as follows: cement dosing > slag dosing > fly ash dosing > phosphogypsum dosing. It can be seen that cement dosage and slag dosage were the main factors, and fly ash and phosphogypsum were the secondary factors; the dosage of phosphogypsum had a positive effect on the excitation of the strength of the fluid-cured soil.
According to the results of the analysis graph of the mean value of the unconfined compressive strength in
Figure 4, Factor A (cement admixture, K
4), Factor C (slag admixture, K
4), and Factor D (phosphogypsum admixture, K
2) were greater than the other mean values, K, at 3d, 7d, and 28d. Factor B (fly ash admixture, K4) was at its maximum at 3d and 7d, and K2 was greater than the other mean values, K, at 28d. The optimal ratios at 3d and 7d derived from the above analysis were A
4B
4C
4D
1 (18% cement, 8% fly ash, 8% slag, 1% phosphogypsum), while the optimum ratio at 28d was A
4B
1C
4D
1 (18% cement, 2% fly ash, 8% slag, 1% phosphogypsum).
3.1.2. Analysis of Variance
Extreme variance analysis processed the data briefly to derive a hierarchy of factors to obtain the optimal blending ratio in the case of multiple selected variables. However, the precision of the extreme variance analysis was insufficient, and the magnitude of the experimental error could not be estimated. In addition, it was not possible to give a precise quantitative estimate of the magnitude of the effect of the factors on the results of the experiment, nor could a criterion be proposed for determining whether the role of the factors examined was significant or not. Therefore, in order to compensate for the shortcomings of the extreme variance analysis, the ANOVA method was used. The results of the analysis are shown in
Table 4,
Table 5 and
Table 6.
Analysis of the ANOVA table incorporating 3d, 7d, and 28d compressive strengths using software showed that the F-ratio of cement at any age was greater than the F-critical value (a = 0.05). The effect of cement on the compressive strength of cured soil at 3d, 7d, and 28d was proven to be significant. The F-ratio of slag, shown in
Table 4 and
Table 6, was greater than the F-critical value of 9.28 (a = 0.05), and the F-ratio of 7d slag was slightly less than the F-critical value of 5.39 (a = 0.1). This shows that among the industrial waste fractions, slag had a significant effect on the 3d and 28d compressive strength of cured soil. However, the F-ratios of fly ash and phosphogypsum were less than the F-critical values (a = 0.1), indicating that the effects of fly ash and phosphogypsum on the compressive strength of cured soil were not significant at 3d, 7d, and 28d.
Based on the above ANOVA results, it can be proved that the results for the four different factors were chiefly consistent with the results of the extreme variance analysis. The optimal level combination of each factor still followed the extreme variance analysis results of A4B4C4D1 (3d, 7d) and A4B1C4D1 (28d).
In addition to the effect on mechanical properties, economic indicators are also a factor to be considered. The prices of test materials required for local tests in Hengyang are 120 RMB/ton for fly ash, 115 RMB/ton for slag, 240 RMB/ton for phosphogypsum, and 345 RMB/ton for cement. The price per ton using curing agent Ratio I was RMB 237.9, and the price per ton of material using curing agent Ratio II was RMB 262.4. The prices of the two curing agents were 31.1% and 24.0% lower than that of pure cement.
3.2. The Effect of Changes in Water Content on the Mechanical Properties and Workability of Fluid-Consolidated Soil
We selected the orthogonal test results for Ratio I and Ratio II, with a curing agent mixing control at 35%.
From the folded data in
Figure 5, it can be seen that the mobility of the fluid-consolidated soil decreased substantially with a decreasing water content. The initial moisture content of Ratios I and II decreased from 220% to 140%, and the flow rate decreased from 104.2 mm and 95.5 mm, respectively. When the water content of the cured soil mix was less than or equal to 180%, the flows of both ratios were less than 160 mm (loss of pumpability).
From the bar data in
Figure 5, it can be seen that with the decrease in water content, the strength of the 3d cured soil increased from 0.050 MPa to 0.178 MPa and 0.038 MPa to 0.204 MPa for Ratio I and Ratio II, respectively; the strength of the 7d cured soil increased from 0.092 MPa to 0.305 MPa and 0.087 to 0.317 MPa, respectively; and the strength of the 28d cured soil increased from 0.184 MPa to 0.550 MPa and 0.173 MPa to 0.586 Mpa, respectively. The reduction in the water content dramatically increased the strength of the cured soil, but the flowability also decreased dramatically with the reduction in the water content. The compressive strength at 3d and 7d was slightly higher for Ratio I than it was for Ratio II. However, the compressive strength at 28d was higher for Ratio II than it was for Ratio I, which is in line with the expected results of the orthogonal test design.
Reduced water content leads to the easier formation of hydration products (e.g., C-S-H gels) in dense mesh structures between particles, reinforcing the soil skeleton. Macroscopically, it promotes an increase in compressive strength. On the other hand, increased water content leads to an imbalance in the water–cement ratio. Excess water dilutes the concentration of the curing agent, yielding a slower reaction rate and delayed or incomplete cementation, resulting in reduced strength.
On the basis that (1) the strength met the specification requirements, but the fluidity did not (water content: 140%), and (2) the flowability met the requirements, but the compressive strength did not (water content: 180%), two of the water content rates were selected to test the performance enhancement in the fluid-cured soil.
4. Performance Enhancement Tests on Fluid-Cured Soil
4.1. Analysis of Results of Polycarboxylic Acid Water-Reducing Agent Doping
According to the related research [
20], additives can effectively improve the performance of fluid-cured soil and increase its flow, strength, and durability. Admixtures can be categorized into many types depending on the conditions of use. Under the condition of a 140% water content (compressive strength met the requirement, and fluidity did not), the polycarboxylic acid water-reducing agent was selected to test the fluidity and compressive strength of the fluid-cured soil. We fixed the curing agent Ratios I and II and a mixing amount of 35%. Through the pre-tests, whose results are shown in
Table 7, it was found that 6% was the critical value of the polycarboxylic acid water-reducing agent dosage acting on the fluidity of the cured soil for Ratios I and II before the flow value slowly increased. When the dosage of the polycarboxylic acid water-reducing agent exceeded the critical value of 6%, its effect on the flowability of the fluid-cured soil was very significant. From 6% to 7%, the flow value of the two ratios of the soil increased by 37.2% and 38.8%, respectively. When the water-reducing agent dosage was more than 6.2%, the fluidity of the soil met the specification requirements of Technical Standard for Filling of Ready-mixed Fluidized Cured Soil T/CECS 1 037-2022.
Based on the pre-tests of the agents, detailed tests were carried out on polycarboxylic acid water-reducing agent dosages in the interval of 6% to 7%, with a gradient of 0.2%. We analyzed the change rules of the fluidity and unconfined compressive strength of the fluid-cured soil with different amounts of admixtures (6.0%, 6.2%, 6.4%, 6.6%, 6.8%) and with different maintenance ages (3d, 7d, and 28d).
As shown in
Figure 6, the 7d and 28d unconfined compressive strengths of Ratios I and II decreased slowly from 6.0% to 6.8%. The 3d compressive strength showed a slight increase and then a decrease, but compared with the unadulterated polycarboxylic acid water-reducing agent, there was a significant decrease in the 3d strength. The strength of cured soil was reduced by 9% and 10% for Ratios I and II, respectively. The compressive strength of the cured soil at 7d and 28d did not change significantly compared with that of the unadulterated water-reducing agent.
This is because the molecular structure of the polycarboxylic acid water-reducing agent comprises a hydroxyl group, a carboxyl group, a sulfonic acid group, and other functional groups, promoting adsorption, complexation, electrostatic repulsion, and spatial site resistance. It effectively inhibits initial C
3A and C
3S hydration and delays the formation of cured soil structures but has little effect on the development of later structures [
21]. At the same time, in the polycarboxylic acid molecule, the main chain is negatively charged and adsorbs cement particles and positively charged hydration products. The adsorbed particles form a double-layer structure and generate the same electrostatic repulsion between the particles. It is these two effects that allow polycarboxylic acid molecules to inhibit and disrupt the formation of flocculated structures at the microscopic level, resulting in the release of free water encapsulated in cement particles and a dramatic improvement in the flow properties of the cured soil at the macroscopic level [
22]. On the other hand, it is also proven that rationally incorporating a polycarboxylic acid water-reducing agent can ensure that the compressive strength of cured soil can be reduced by a small margin while its mobility obtains excellent enhancement.
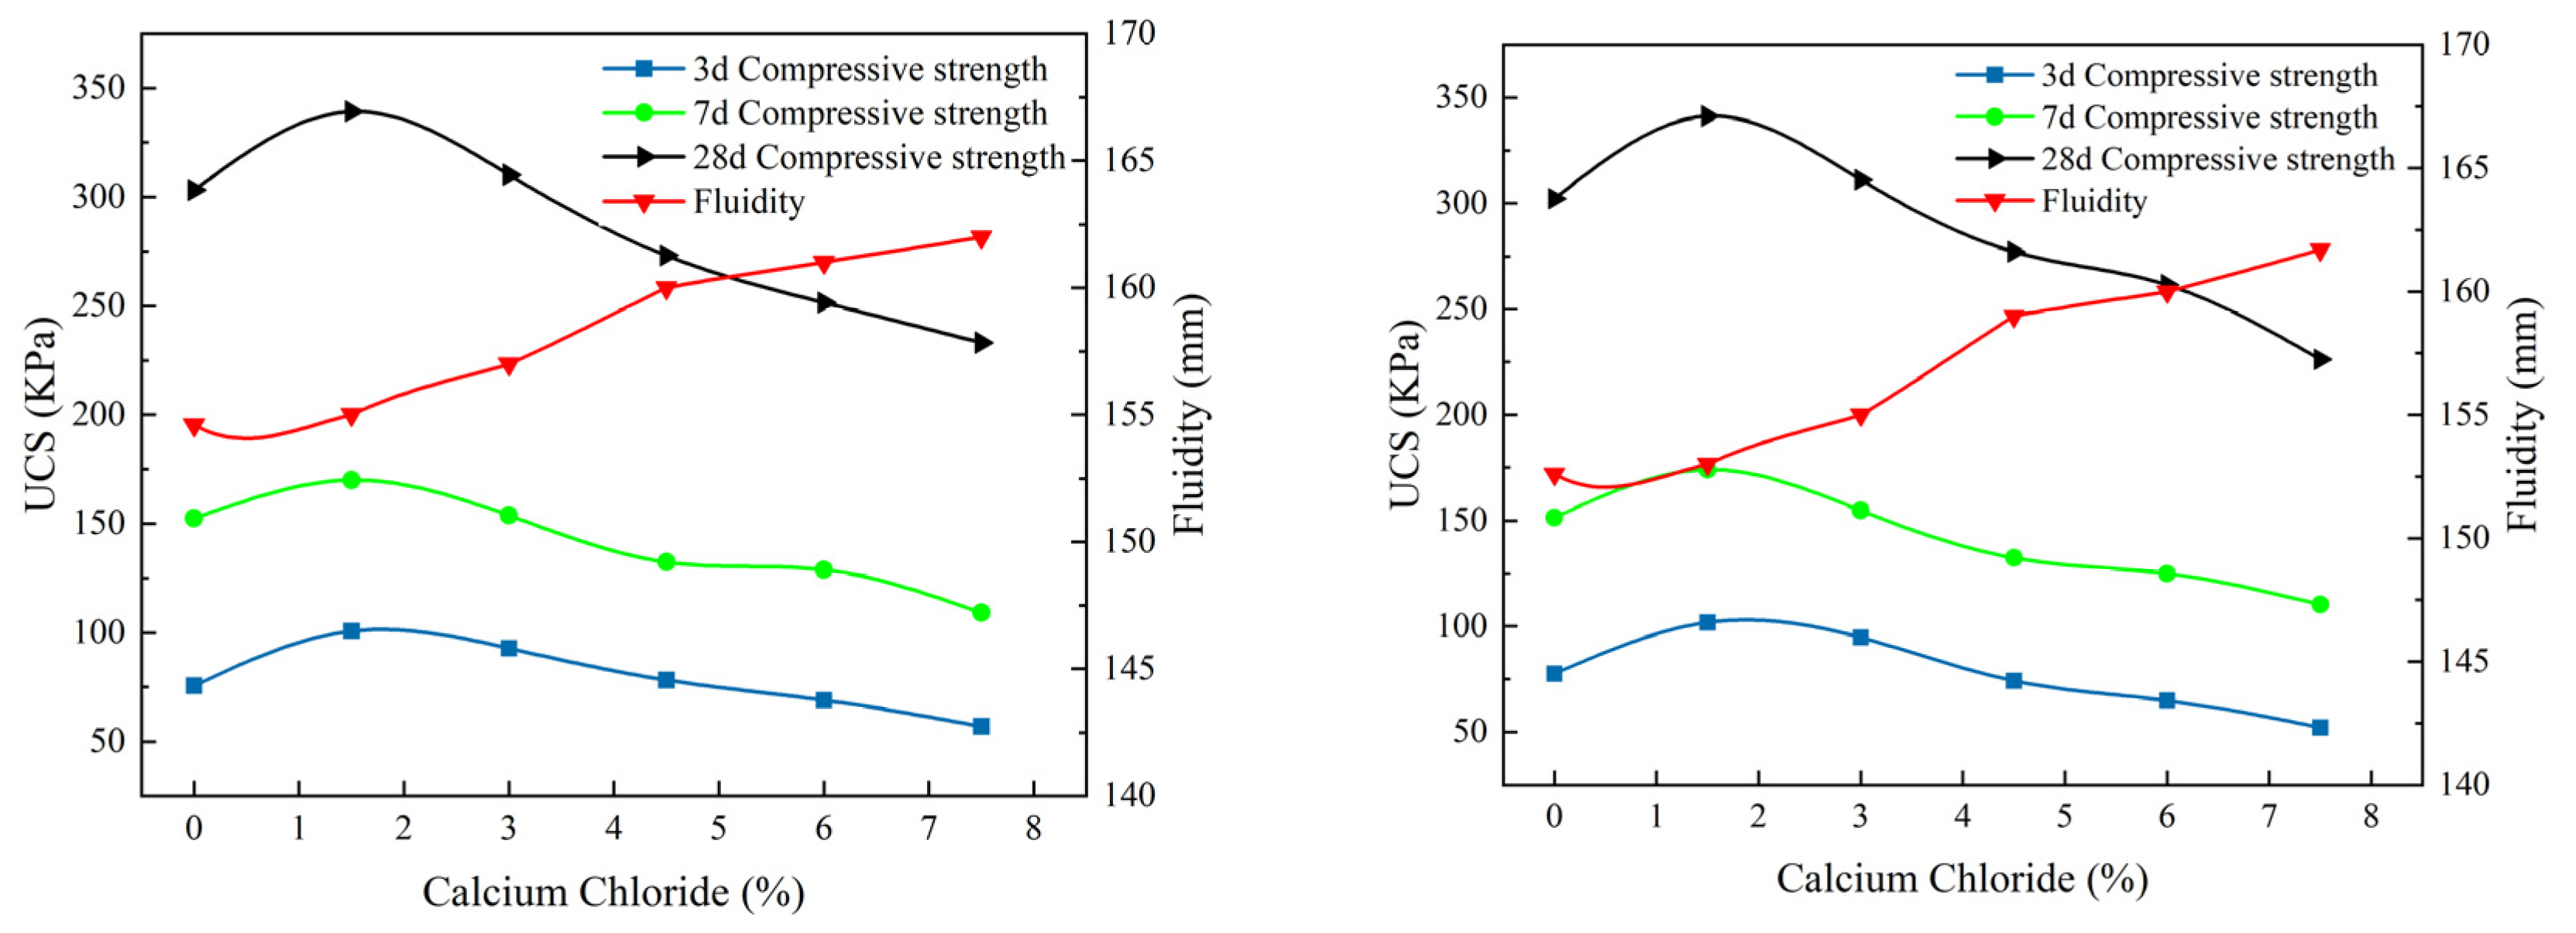
4.2. Analysis of the Results of Calcium Chloride Doping
The test results of Ratios I and II are shown in
Figure 7. The test was carried out with a gradient of 1.5% calcium chloride doping to analyze the flow degree and strength change rule of the fluid-cured soil at different doping amounts (0%, 1.5%, 3%, 4.5%, 6%, and 7.5%). From the test results, it can be seen that there was a peak interval of about 1.5% in the compressive strength, regardless of the use of Ratio 1 or Ratio 2. However, with calcium chloride doping greater than 1.5%, the compressive strength began to gradually decline, and calcium chloride doped outside the cured soil strength at 3d promoted the largest change compared to the case of un-doped calcium chloride, with year-on-year growth of 33%. However, the strength of the cured soil at 7d and 28d increased by approximately 12%, which indirectly reflects the characteristic of the “early strength” of calcium chloride, the cured soil’s flowability, and the strength change rule of the fluid state. It is worth noting that with the increase in dosage, the strength of the cured soil began to decrease, and when the dosage of calcium chloride was more than 4.5%, the compressive strength at 3d, 7d, and 28d was smaller than that in the case of unadulterated calcium chloride [
23].
As the in situ soil was taken from the Hongwan Project of China Railway Construction Port and Navigation Bureau, the soil samples were subjected to seawater infiltration for an extended amount of time. The samples were not treated more than once after the removal of impurities and contained large amounts of seawater. According to previous studies, soft soils are rich in a variety of salts, with chloride ions being the most abundant. Further, cement–industrial slag composites produce C-S-H, CAH, Ca(OH)
2, and other substances during hydration, and an appropriate amount of CaCl
2 can react with tricalcium aluminate (C
3A) in cement to produce almost insoluble F’s salt, accelerating the hydration of C
3A. At the same time, the generated F’s salt and calcium chloride solid phase accelerate the formation of the cement paste structure and provide an early strengthening effect. Soil samples themselves are rich in a large number of chloride ions, and the equations for the reaction between chloride ions in seawater and the hydration products of cement after the admixture of excess calcium chloride are shown in Equations (3) and (4):
Chloride ions react with calcium hydroxide to form calcium chloride, which reacts with a large amount of hydrated calcium aluminate to form an abundance of F’s salt, which has low strength and does not play a cementing role. The F’s salt coats the surface of clay particles and hydration products, preventing the clay minerals from continuing the hard-setting reaction with the calcium hydroxide. Ultimately, it affects the compressive strength of cured soil.
On the other hand, when mixed with calcium chloride, the soil dissolves in water and forms Ca+ and cl- positive and negative ions. It adsorbs positively and negatively charged hydration products and forms a double-layer structure, which inhibits and destroys the cement flocculation structure. At the same time, a large amount of F’s salt is generated, which has a loose structure and does not act as a good cementing agent. Macroscopically, this shows that the flowability increases with an increase in calcium chloride dosage.
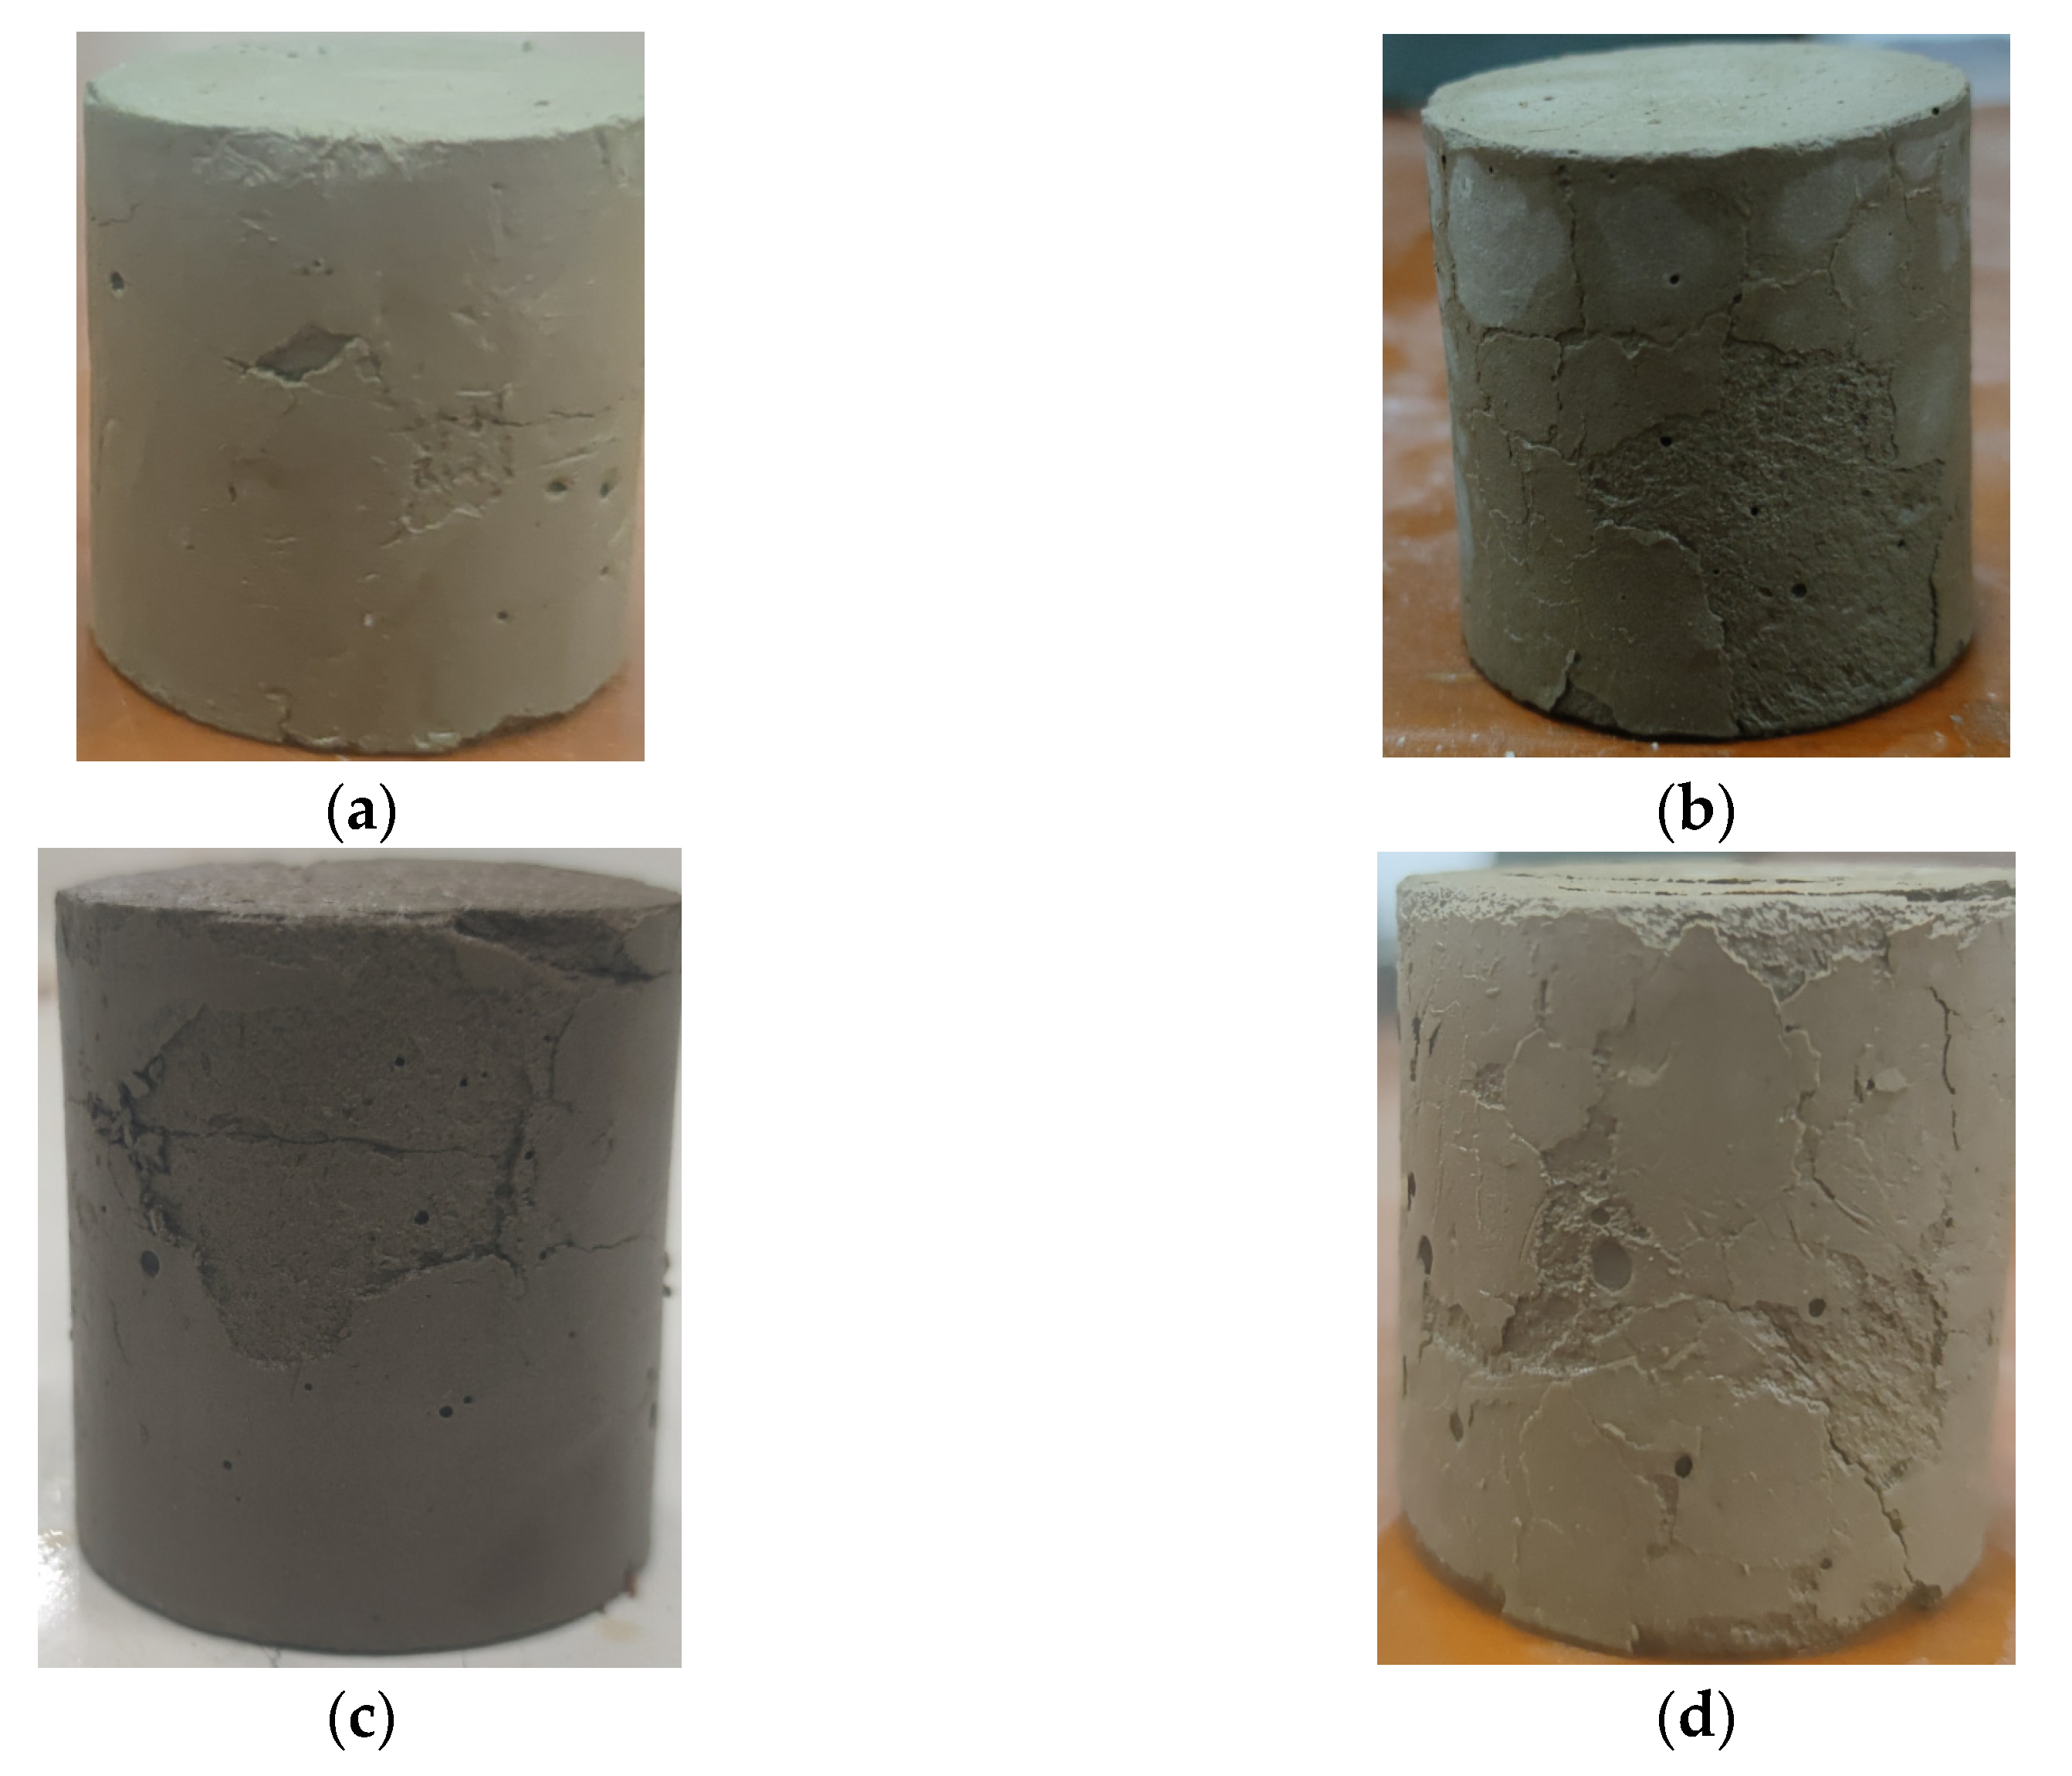
5. Dry-And-Wet Cycle Test
We selected the orthogonal test results for Ratios I and II and pure cement from three cases, using the standard curing box to cure the samples to 28d after dry-and-wet cycle tests. As shown in
Figure 7, it is evident that the apparent integrity of the cured soil during the wet and dry cycles was severely affected by erosion. As the number of wet and dry cycles increased, the skin of the cured soil specimen began to peel off, and cracks developed within the cured soil specimen.
In
Figure 8, it can be seen that the strength of the specimen after the first wet-and-dry cycle was greater than that before the cycle. This was due to the fact that the hydrolytic hydration reaction of the cementitious material was still continuing at the beginning of the dry–wet cycle. Water intrusion promoted the production of C-S-H, AFt, etc., in the soil, resulting in a slight increase in the strength of the specimen in the pre-dry–wet cycle.
As the dry–wet cycle continued, the evaporation and absorption of water occurred within the cured soil, and the soil particles dried out and became wet, resulting in concentrations of stress [
24]. These small cracks did not have a significant effect at the beginning of the wet–dry cycle. However, as the number of cycles increased, they developed and became interconnected to form larger cracks. When these were formed to a certain extent, the integrity of the soil body was affected, and the bonding of the cured soil particles decreased. From a macroscopic point of view, this led to a significant reduction in the compressive strength of the material.
6. Microscopic Mechanism Analysis
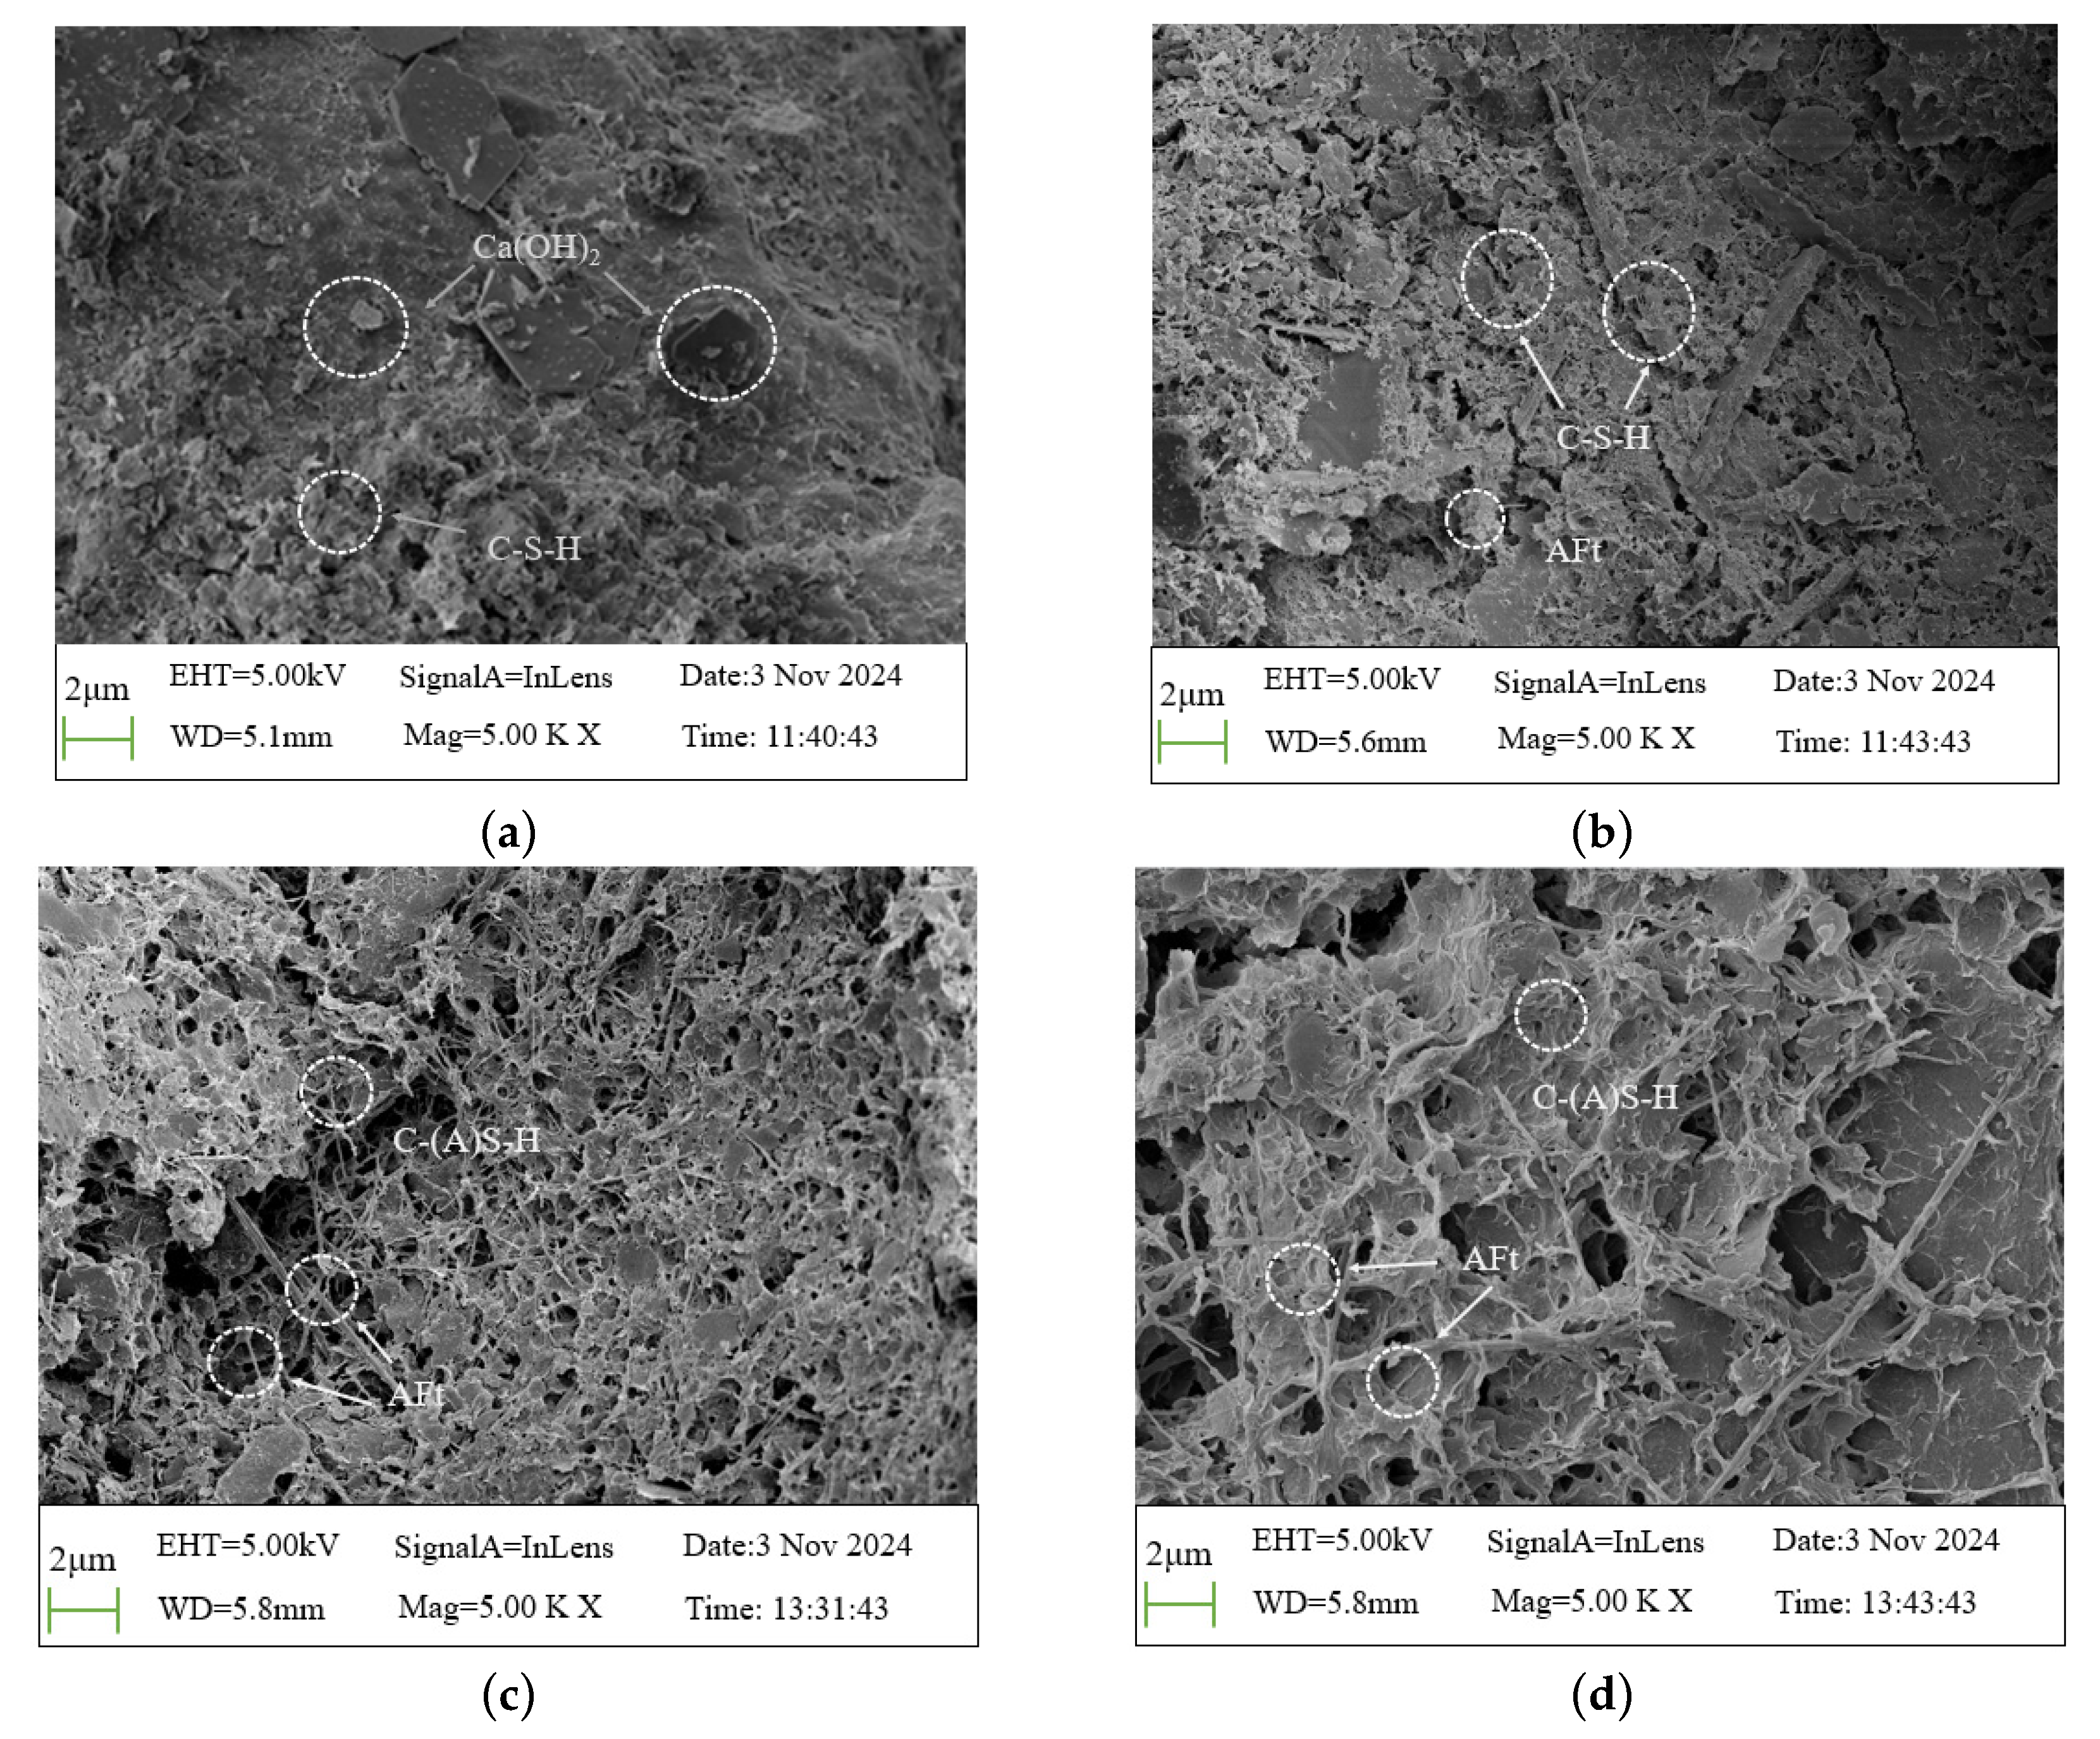
SEM scanning tests were carried out on three groups of specimens: pure cement–cured soil and cured soils I and II. After 28d of curing in a standard curing box, the surfaces of the samples were sprayed with gold using an ion sputtering apparatus, and the samples were scanned through SEM using a field emission scanning electron microscope. The scanning photographs are shown in
Figure 9.
Figure 10a,b show the SEM photographs of pure cement–cured soil at 7d and 28d of curing. As can be seen from the figure, the 7d pure cement–cured soil specimen’s internal formation had flaky, hexagonal plate-like material, and this material was near the phenomenon of the aggregation of gelatinous agglomerates, distinct from the surface of the pure cement specimen after hydration for 28d. According to the hydration product micro-morphological characteristics being assessed, the formation of a hexagonal plate-like material of Ca (OH)
2 crystals occurred, and there was an agglomerated structure of a small amount of C-S-H gel. At this time, the internal structure of the soil had not been completely hydrated and had obvious pores, and the structure had not formed a stable and effective connection. After 28d of hydration, a large amount of C-S-H gel, a small amount of Aft, and clay particles could be clearly seen on the surface of the pure cement specimen, compared with the surface of 7d cured soil specimen. The increase in the age of C-(A)-S-H was constantly generated, so the internal pores of the soil body were effectively filled.
The two groups of curing agents I and II are shown in
Figure 10c,d, compared to the 28d pure cement–cured soil specimen, with ratios mixed with a certain amount of industrial waste. No flaky, plate-like Ca(OH)
2 crystals can be seen in the figure. This indicates that a large amount of Ca(OH)
2 underwent secondary hydration with reactive silica–aluminum materials, such as SiO
2 and Al
2O
3, through a volcanic ash reaction. This resulted in the formation of more needle and rod calcium alumina (AFt) within the cured soil. Additionally, a large number of AFt crystals were generated and stacked on top of each other to form a mesh structure. Reducing the porosity and forming a rigid skeleton through crystallization inhibited the shrinkage and deformation of the soil body and enhanced the overall stability [
25]. A comparison of
Figure 10b–d reveals that the surface densification of the cement–industrial slag ratio at 28d was higher than that of the pure cement sample. As can be seen, the specimen does not appear to have a significantly large pore structure, the overall structure of the specimen is strong, and the distribution of hydration products is dense. This is the reason for the significant enhancement in the mechanical properties of the cured soil, including dry and wet resistance. It can be seen that the designed industrial waste curing agent can effectively improve the mechanical properties, such as the strength and permeability of high-water-content mud. Its products, such as C-S(A)-H and Aft, can better fill the inter-particle pores with a strong cohesive effect [
26].
7. Conclusions
In this study, the feasibility and curing mechanism of synergistic industrial waste–cement was analyzed by taking sea-phase silty soil as the research object, and an orthogonally designed test was used to improve the soft soil in an indoor environment, utilizing cement and a variety of industrial wastes. We drew the following conclusions:
(1) The orthogonal test results show that the cement dosage had the most significant effect on the compressive strength of the cured soil, and the blast furnace slag in the industrial waste also played a major role. The phosphogypsum dosage had a greater effect than the fly ash dosage at 3d and 28d, and the dosage of fly ash was greater than that of phosphogypsum at 7d. Through the analysis of the 3d, 7d, and 28d compressive strength, we found that the best ratio for the cement–industrial slag curing agent for early strength was 1:0.4:0.4:0.05 (cement–fly ash–slag–phosphogypsum), and the best ratio for late strength was 1:0.1:0.4:0.05, which saved 49% and 38% cement year on year.
(2) An increase in the initial moisture content caused a rapid decrease in the strength of the fluid-consolidated soils, but liquidity was substantially improved. There was a loss of pumpability in the cured soils when the initial moisture content was less than 180 percent. When the water content was reduced to 140%, the strength of Ratios I and II reached 550 kPa and 586 kPa, respectively, and the fluid-cured soil specification strength criteria were sufficiently met.
(3) There was a critical dosage of 6% for the polycarboxylic acid water-reducing agent, and when the dosage was greater than this, the flow rate changed significantly. With curing agent Ratios I and II, the flow rate slowly increased when the water-reducing agent dosage exceeded 6%. The water-reducing agent had a significant effect on the mobility of the cured soils. From 6% to 7% dosing, the flow values of the two formulations of the fluid-cured soil increased by 37.2% and 38.8%. Through the rational mixing of the water-reducing agent, the solidified soil’s compressive strength was reduced by a small amount, while its mobility was significantly improved.
(4) The right amount of calcium chloride could effectively improve the early strength of the cured soil. From the experimental data, it is observed that the compressive strength of the soil increased and then decreased with the increase in the calcium chloride content. Additionally, the strength of the cured soil peaked at a 1.5% calcium chloride dosage. The calcium chloride produced by the reaction further reacted with the hydrated calcium aluminate to form the F’s salt. Ultimately, the compressive strength of the cured soil was reduced. At the same time, an increase in the F’s salt content could increase the flowability of the mix by a small amount.
(5) Through microscopic analysis, it was shown that the cement–industrial waste reaction was synergistic, and the number of gel products, such as C-S-H, in the fluid-cured soil significantly increased. The resulting expanded hydrated AFt crystals filled the inter-pore spaces of the soil particles, and the interwoven formation of the skeleton through the products generated by the hydration of the cementitious material made the structure of the soil body denser and improved its mechanical properties.


