Article

Optimization Design of Multi-Blade Centrifugal Fan Based on Variable Weight PSO-BP Prediction Model and Multi-Objective Beluga Optimization Algorithm

1
School of Mechanical Science and Engineering, Huazhong University of Science and Technology, Wuhan 430074, China
2
Wuhan Second Ship Design and Research Institute, Wuhan 430205, China
3
State Key Laboratory of Digital Manufacturing Equipment and Technology, Huazhong University of Science and Technology, Wuhan 430074, China
4
Valeo Automotive Air Conditioning Hubei Co., Ltd., Jingzhou 434000, China
*
Author to whom correspondence should be addressed.
Appl. Sci. 2025, 15(11), 5950; https://doi.org/10.3390/app15115950
Submission received: 8 April 2025 / Revised: 15 May 2025 / Accepted: 22 May 2025 / Published: 25 May 2025

Abstract

:
Multi-blade centrifugal fans are the main workhorse of automotive air conditioners, and the performance of these fans affects riding comfort. This article proposes a prediction model and a multi-objective optimization algorithm and applies them to the optimization design of a multi-blade centrifugal fan. A prediction model between the design variables and optimization objectives, named wPSO-BP, is proposed, and the model is more effective than the BP prediction model in predicting fan performance. A multi-objective optimization algorithm, named NSGA-III-LBWO, is proposed and applied to the optimization design of the fan along with the wPSO-BP prediction model. The results indicate that the aerodynamics and noise performance of the optimized fan were improved, which provides a reference for the optimized design of these types of fans.

1. Introduction

Multi-blade centrifugal fans are an important part of automotive air conditioning, and improving their performance is crucial to ensuring good car ride comfort [1]. The core component of automobile air conditioning systems is multi-blade centrifugal fans, which have the advantages of compact structures and high flow rates, but they have the disadvantages of short blade channels, low efficiency, and a high noise level. Therefore, this paper is devoted to researching and improving the comprehensive performance of these fans in order to improve the ride comfort and energy utilization efficiency of automobiles.
The volute tongue is closest to the rotating impeller compared to other positions of the volute, and the adjustment of the structural parameters of the tongue is a key factor for improving the aerodynamic performance and reducing the noise of these fans. Wei [2] studied and analyzed the effects of different volute tongue clearances on the internal flow of a centrifugal fan through simulation and found that, after reasonable adjustment of the clearance, the flow loss near the tongue was reduced and the pressure gradient decreased, and the experimental results showed that the aerodynamic noise was reduced by 3.74 dB. Hao [3] experimentally investigated the effects of four kinds of inclined tongue structures on the aerodynamic noise of a fan and concluded that pressure pulsation near the tongue could be attenuated by the reasonable design of the tilting angle and radius of the tongue, such that the eddy current noise in the middle-frequency band could be decreased. Yuan [4] also investigated the use of an inclined tongue and found that the noise could be reduced to 2.33 dB after redesigning the tongue, but the aerodynamic performance of the fan was slightly reduced because of the creation of a new secondary flow near the tongue, which interfered with the impeller outflow. Lun [5] focused on the effect of adjusting the parameters of an inclined tongue on the overall aerodynamic performance of a fan, and they found that the work efficiency was increased by about 4% and the static pressure was increased by about 11 Pa. Some scholars have also borrowed designs for volute tongues from biological structures found in nature. Inspired by the wing structure of the long-eared owl, Wu [6] proposed a bionic snail tongue structure that inhibits the development of eddy currents in the vicinity of the tongue and reduces the noise radiated outward from the volute shell. Wang [7] studied and analyzed the aerodynamic properties of an owl’s wing shape and applied them to the tongue, which enabled better synergy between the shell and the impeller, suppressing flow separation and resulting in improved flow.
Impellers are important parts of fans, and their structure also affects fan performance. Wu [8] designed impellers with different attack angles and obtained information on the total pressure, turbulence intensity, etc., through simulation, and they found that the attack angle affects the flow separation in the impeller channel, which, in turn, affects the energy conversion efficiency of the fan. Ding [9] investigated the effect of outlet angle variation on the flow field, and the analysis of the simulation results showed that the angle exhibits different aerodynamic characteristics when the flow rate changes. Jinho [10] optimized the design of the blade outlet angle and other parameters to improve the aerodynamic performance of an impeller. Zhang [11] grooved the blades in order to improve the flow over the blade surfaces and weaken the blade wake, which increased the total pressure of the fan by about 3.6%. Anantharaman [12] studied the effect of four impellers with different numbers of blades on aerodynamic performance and found that an appropriate increase in the number of blades reduced losses in the impeller channel and increased the efficiency of the fan by up to 5.74%. Prezelj [13] tilted the blades of a fan at a certain angle so that the shape of the blade channel was changed, the flow noise between the blades decreased, and the outer-shell radiation noise decreased more significantly in the middle- and low-frequency bands.
In recent years, the application of optimization methods has promoted the development of fluid machinery, and scholars have conducted many studies on optimization objectives and optimization algorithms. Shin [14] optimized the design of centrifugal fans for refrigerators based on the response surface method to modify the blade angle, size, and other parameters in order to lower the noise. Zhang [15] built a prediction model for a centrifugal fan with sample points obtained through experimental methods, and they used the noise and casing quality as optimization objectives, which resulted in a 7.3 dB noise reduction of the fan. Bamberger [16] obtained a performance dataset for centrifugal fans by numerical means and trained a high-precision artificial neural network, which accelerated the optimization progress of the fans. Liu [17] used the response surface method to select the inlet and outlet angles of the blades, and the simulation analysis results showed that the flow separation in the blade channel was improved, the interference of the blade wake on the airflow was weakened, and the efficiency of the fan was improved by 4.2%. Meng [18] optimized a particle swarm algorithm using a limit state machine to redesign the blade size with the pneumatic properties in mind, and the results showed that the total pressure rose by about 11 Pa. Avşar [19] used a multi-objective genetic algorithm based on data obtained from the Kriging prediction model to optimize the aerodynamic performance of the impeller for cooling, increasing the static pressure of the fan.
Many studies focus on the improvement in single parameters of the volute or impeller, while because of the compact structure of the multi-blade centrifugal fan, the matching of the volute and impeller is decisive for the comprehensive performance of the fan. In addition, when selecting the optimization objective of the fan, usually only the aerodynamic or noise performance is considered, and the multi-objective optimization method is less frequently used. In this paper, both volute and impeller parameters are considered and a prediction model named wPSO-BP is constructed for fast optimization, extracting samples based on the Latin hypercube method. The NSGA-III-LBWO algorithm is proposed and applied to the multi-objective optimization of the total pressure, efficiency, and sound pressure level of the fan. The optimization effect is demonstrated, comparing the prototype fan with the optimized fan, which provides an idea for the optimization of centrifugal fans.

2. Establishment of Prediction Model

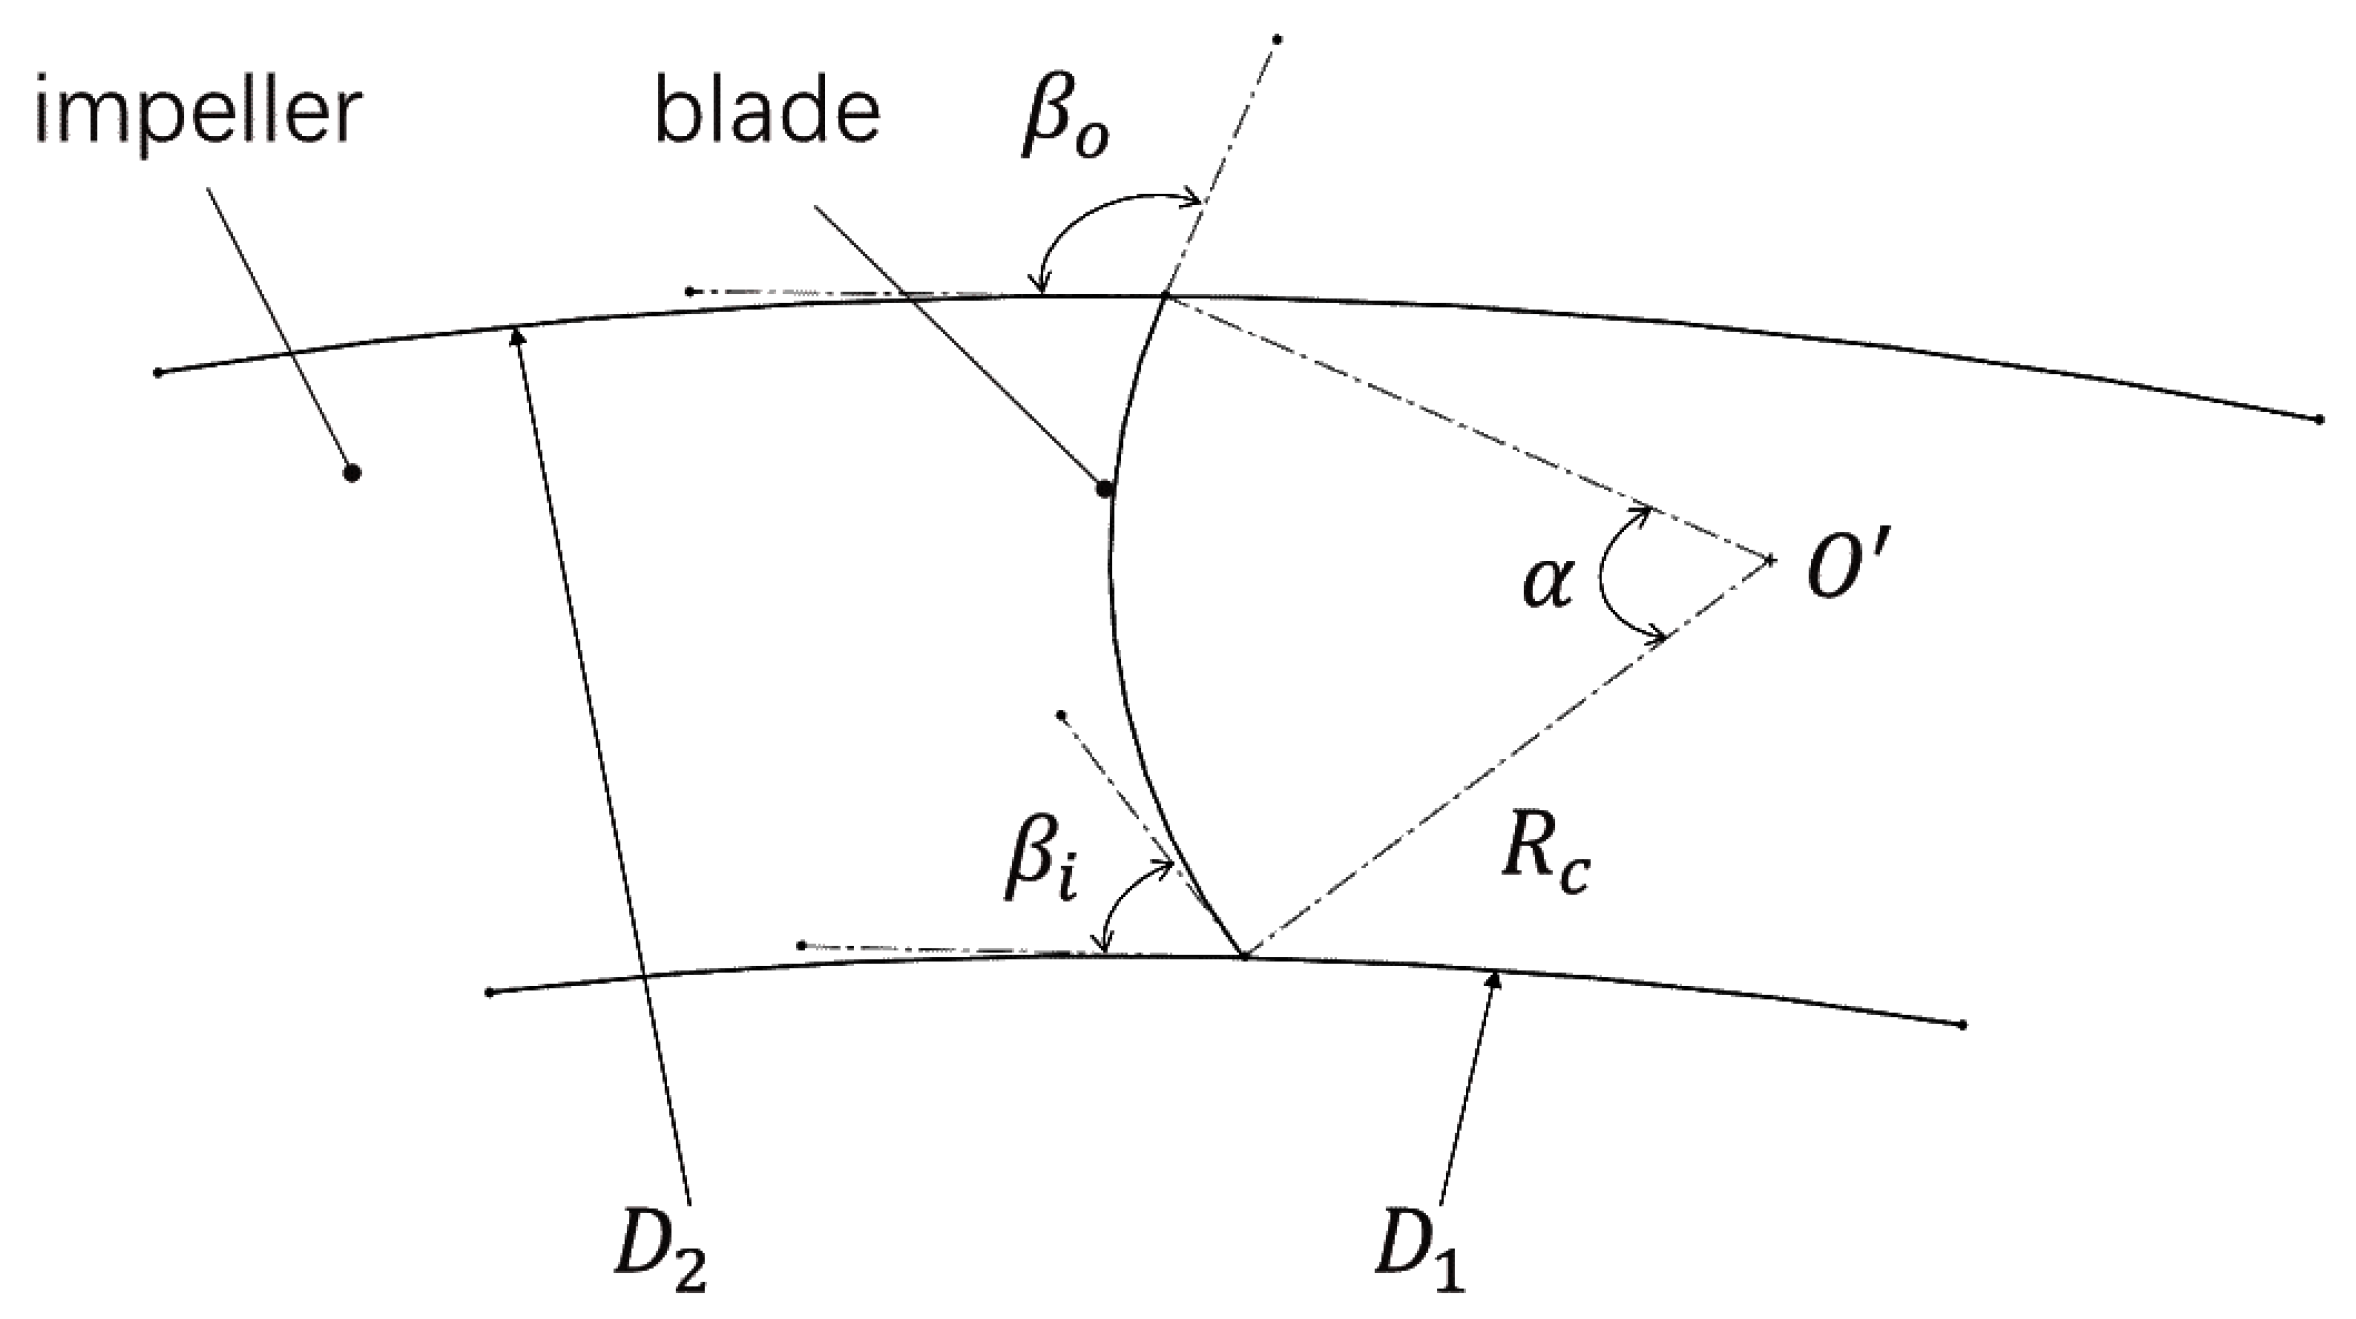
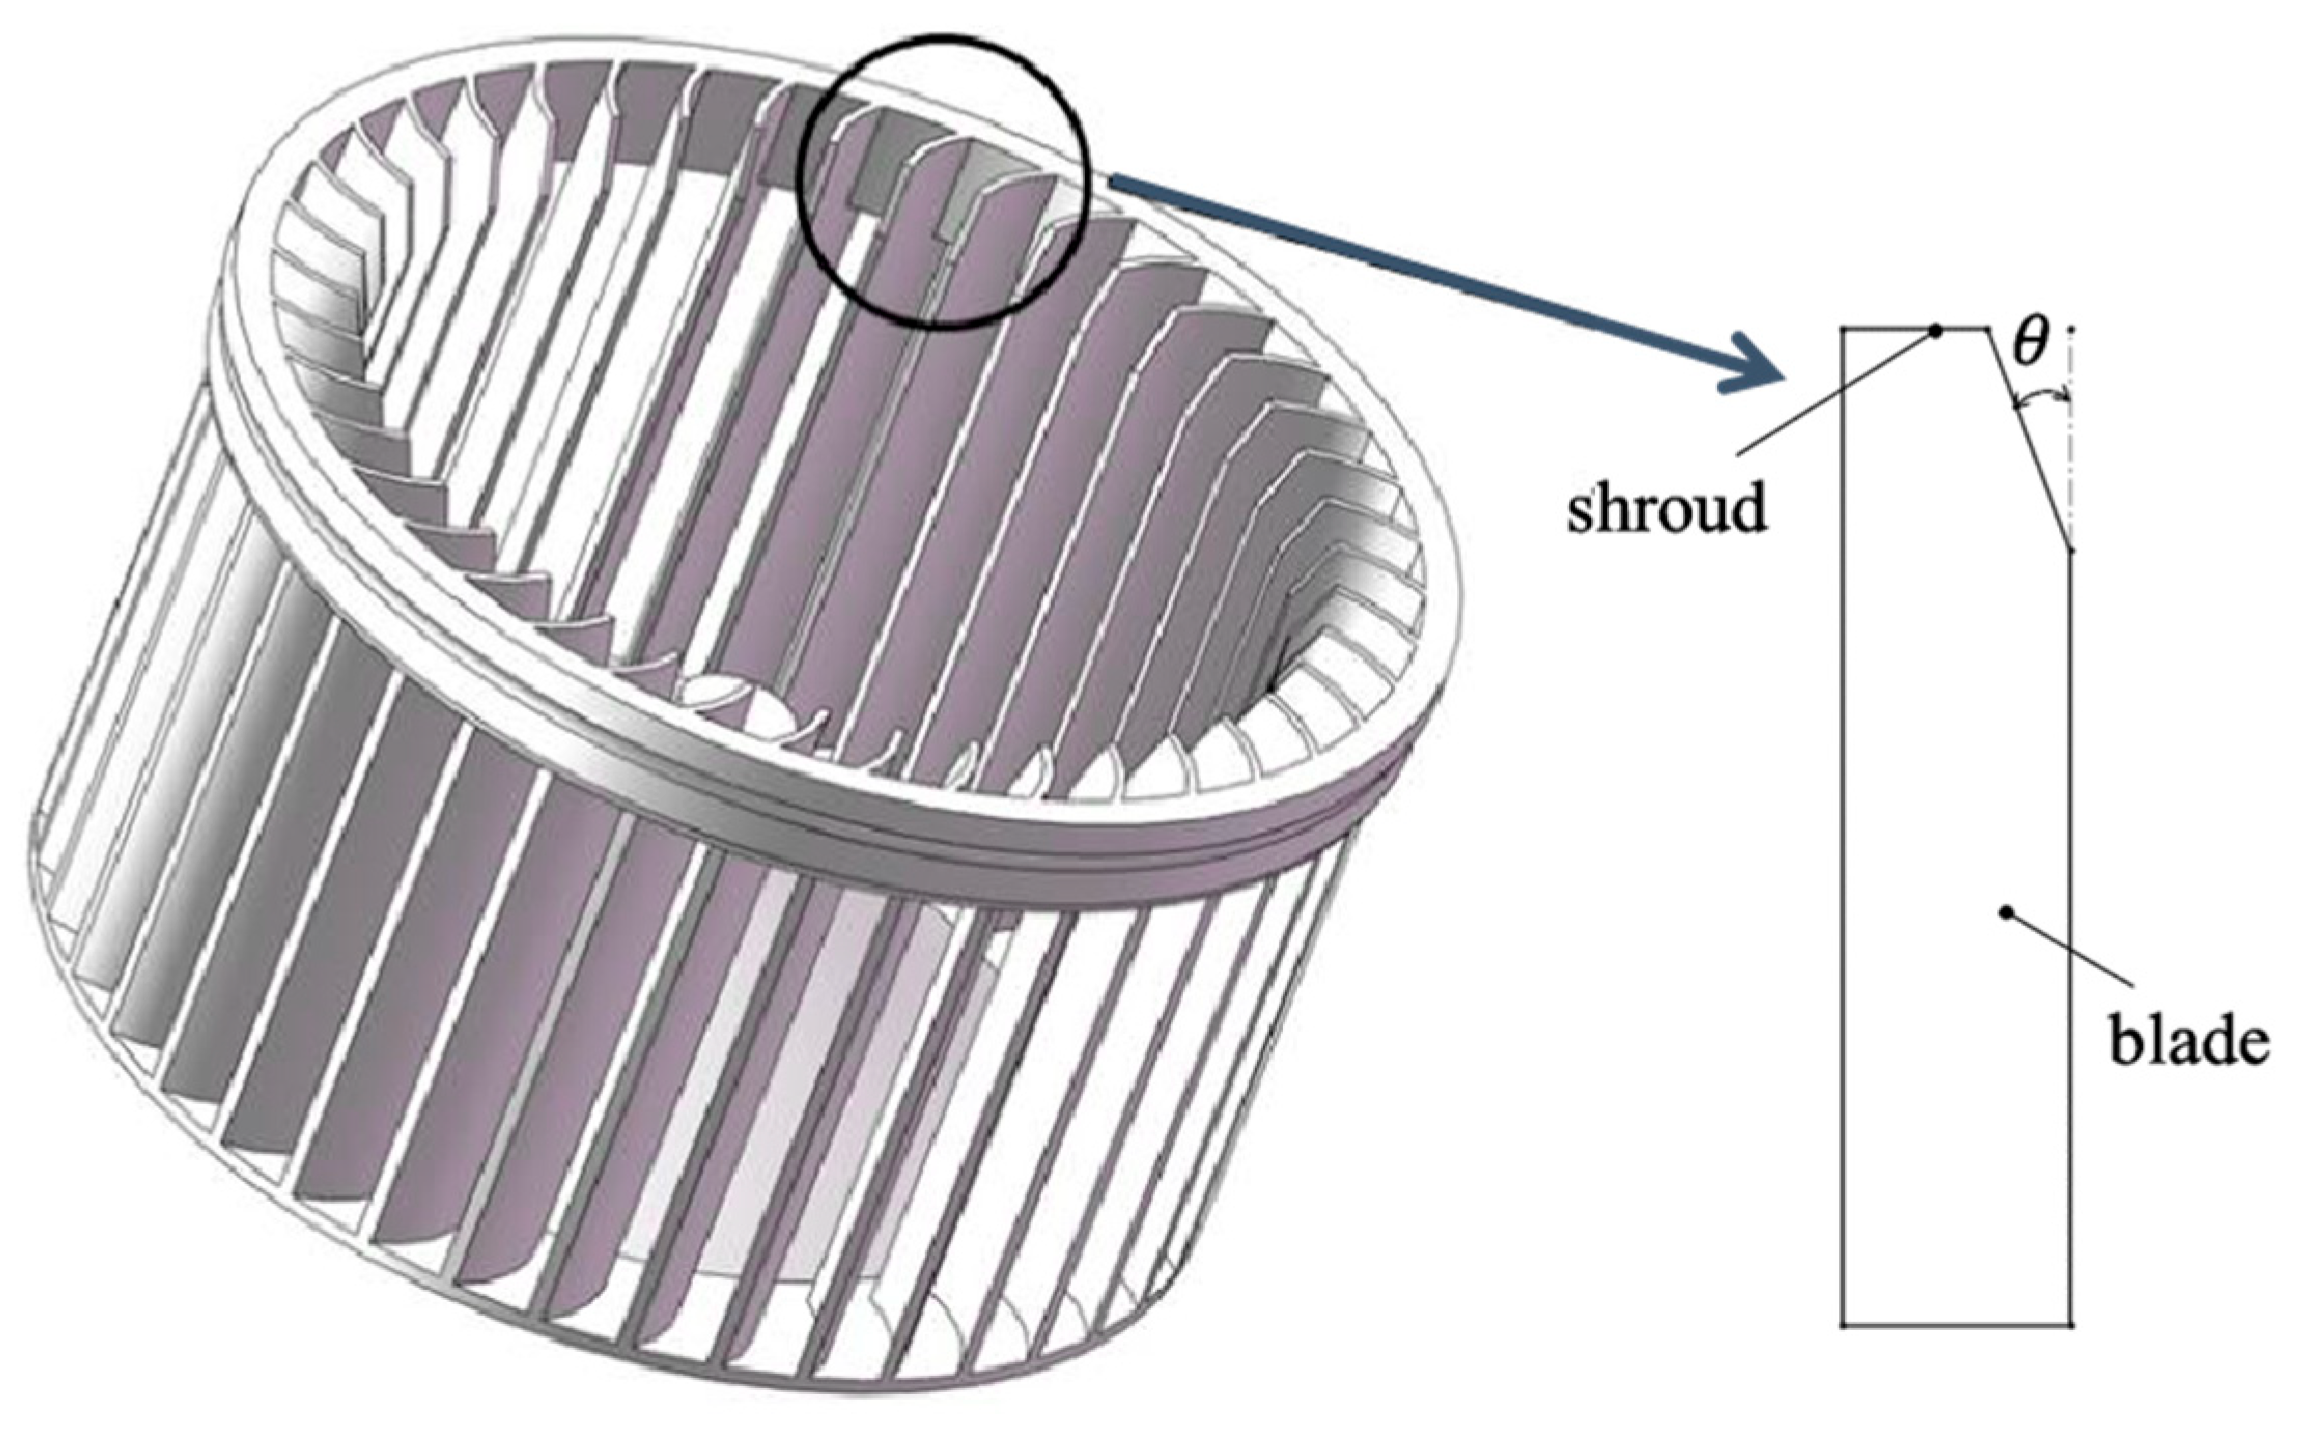
2.1. Design Variables and Optimization Objectives

The structural parameters of the impeller and volute casing exert a decisive influence on the aerodynamic performance of the multi-wing centrifugal fan. Table 1 summarizes the key structural and operational parameters of the multi-wing centrifugal fan designed for use in the automotive air conditioning system in this study. Before constructing the predictive model, the design variables and optimization objectives should be clearly defined.
Under the design conditions, as the outlet angle of the blades increases, the total pressure and efficiency of the fan increase, which will lead to an increase in noise, because the airflow can be sufficiently accelerated to form a “jet-wake” when the outlet angle is large. Therefore, a reasonable outlet angle can effectively improve the performance of the fan.
The match between the blade inlet angle and the airflow inlet angle determines the quality of flow in the blade channel. Flow separation in the blade channel typically produces shedding vortices that interfere with the main flow, degrade fan performance, and generate noise. Therefore, it is necessary to determine the optimal blade inlet angle to minimize flow losses in the blade channel, while also reducing the noise generated by inflowing airflow over the blades.
The single-arc blade in this paper is presented in Figure 1. The relationship between the arc radius R c and central angle α of the blade and the inner diameter D 1 , outer diameter D 2 , inlet angle β i , and outlet angle β o of the impeller can be obtained:
R c = R 2 2 R 1 2 2 [ R 2 cos π β o R 1 cos π β i ]
R o o = R c 2 + R 2 2 2 R c R 2 c o s ( π β o )
α = acos R c 2 + R o o 2 R 2 2 2 R c R o o acos R c 2 + R o o 2 R 1 2 2 R c R o o
where R c is the arc radius of the blade, R 1 and R 2 are the inner and outer diameters of the impeller, respectively, β i and β o are the inlet and outlet angles of the blade, respectively, R o o is the distance from the center of the blade arc to the center of the impeller, and α is the blade central angle.
The volute tongue prevents air recirculation within the volute during fan operation. However, residual airflow bypassing the volute tongue disrupts the impeller mainstream, inducing flow separation within the blade passage and cross-impeller flow, thereby causing performance degradation and noise generation. Furthermore, the tongue’s close proximity to the impeller subjects it to periodic high-speed flow interactions, generating time-varying pressure pulsations that render the tongue structure the primary noise source in the fan system. As shown in Figure 2, the inclined tongue structure features a radius varying along the axial direction, leading to a phase difference in the airflow effects from the front to the rear disc sides of the impeller on the volute tongue. The superposition of noise from unsteady forces with different phases yields smaller amplitudes compared to forces with the same phase in constant-radius tongue structures. Consequently, the fan incorporates an inclined volute tongue design to minimize noise originating from the tongue region.
As the airflow direction near the front disc is mainly axial, the blades near the front disc are mainly responsible for conveying airflow to the middle and rear discs, and are not the main working parts. On the premise of not changing the size of the collector, in order to reduce the impact of inlet flow on the top of the blade and reduce the turbulence noise, it is necessary to ensure that the outlet diameter of the collector is equal to the impeller blade inner diameter. Therefore, blades near the front disc should be chamfered (Figure 3), which can minimize the impact of the removal on the power output of the impeller.
Based on the aforementioned analysis, the blade design variables and their corresponding boundary conditions are summarized in Table 2. The optimization objectives include enhancing total pressure P t o t a l , improving fan efficiency η , and reducing noise levels L p . A weight allocation model for each objective parameter is proposed to achieve synergistic optimization of aerodynamic performance and acoustic characteristics.
P t o t a l = P t o t a l , o u t P t o t a l , i n
where P t o t a l , o u t and P t o t a l , i n are the total pressure at the outlet and inlet of the fan, respectively.
η = P t o t a l Q v M ω
where Q v is the fan flow rate, M is the impeller torque, and ω is the impeller angular velocity.
L p = 20 l g ( p p r e f )
where p is the sound pressure and p r e f is the standard reference sound pressure, 2 × 10 5   P a .

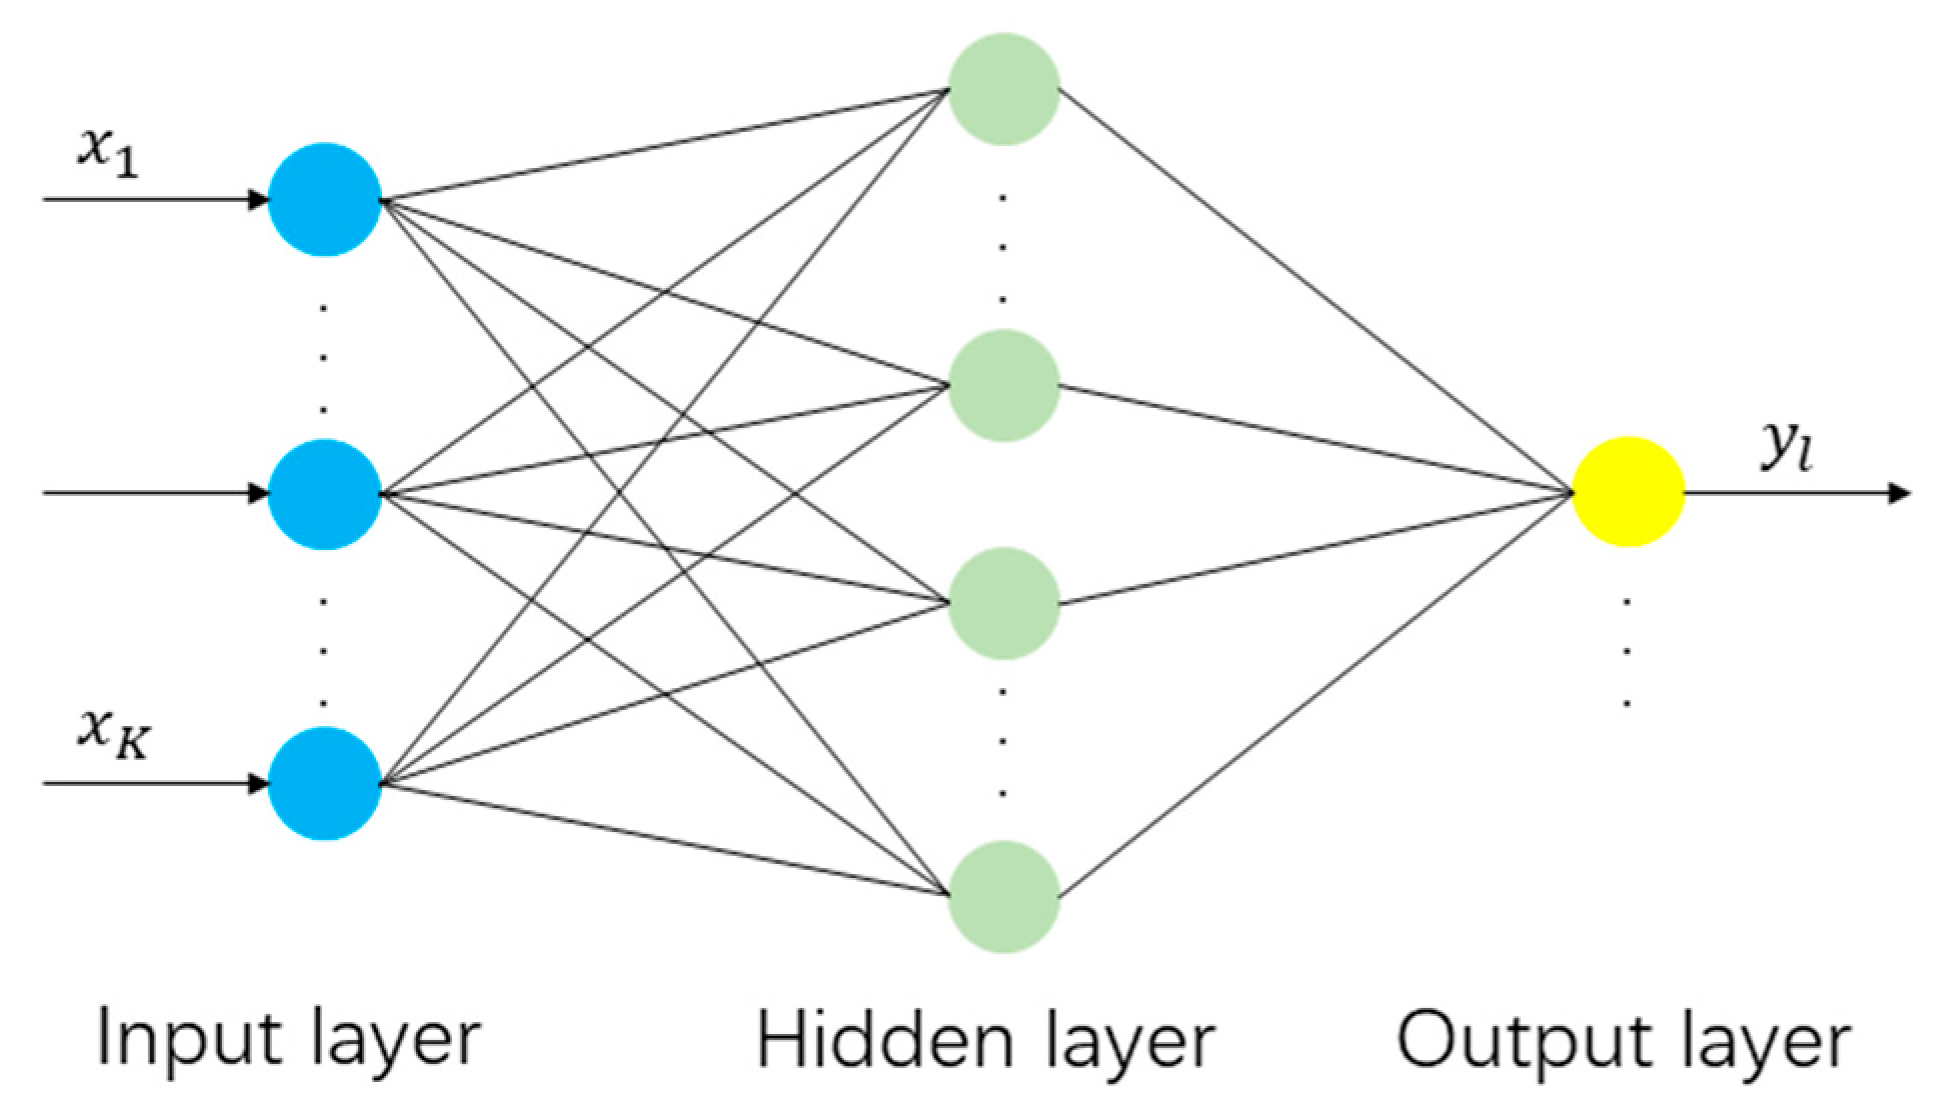
2.2. Variable-Weight PSO-Optimized BP Neural Network (wPSO-BP) Prediction Model

The BP neural network (Figure 4) has good nonlinear processing ability and is suitable for predicting the outcomes of the fan. The network is constructed as follows: obtain the predicted values based on the inputs, adjust the node thresholds and connection weights at each layer by calculating the prediction error, and repeat the process until the error is acceptable or the iterative upper limit is reached and then the training is finished.
Despite the good predictive ability of the BP neural network, it also has problems such as slow convergence speed and difficulty in guaranteeing the global optimization of network parameters, which may not guarantee accuracy of the fan performance prediction. Therefore, this study employs the particle swarm optimization (PSO) algorithm to optimize the BP neural network’s initial weights and thresholds, utilizing prediction error as the fitness function to enhance prediction accuracy
The velocity update formula for particle swarm is as follows:
v i k + 1 = w v i k + c 1 r 1 p i k x i k + c 2 r 2 g i k x i k
The formula for updating the position of the particle swarm is as follows:
x i k + 1 = x i k + v i k + 1
where k is the current number of the iteration step, w is the inertia weight, v i k is the velocity of particle i in the k th iteration, which is a vector when the particle has multiple attributes, c 1 and c 2 are learning factors used to adjust the maximum step size of particle learning, r 1 and r 2 are random values within [ 0 ,   1 ] , and x i k is the position of particle i in the k th iteration.
The inertia weight w controls the degree to which particles preserve their previous velocity during motion updates. A larger w in the initial phase biases the particle swarm towards global search, while a smaller w in the later phase helps in local search [20]. In order to better enhance the search ability of PSO, a calculation method for inertia weight decreasing update is proposed:
w = w s t a r t ( w e n d w s t a r t ) 2 π a r c s i n ( k k m a x )
where w s t a r t and w e n d are the initial and final inertia weights, respectively, and k m a x is the upper limit of the number of iterations.
Figure 5 illustrates the workflow for constructing a centrifugal fan prediction model based on a variable-weight PSO-optimized BP neural network (wPSO-BP). The model employs a BP neural network incorporating a variable inertia weight strategy, utilizes a rectified linear unit (ReLU) activation function in the hidden layer, applies a linear function in the output layer, and adopts the mean squared error (MSE) as the training objective. The initial learning rate was set to 0.01 and dynamically optimized through the wPSO algorithm. During the data preprocessing stage, all input and output variables were normalized via the Min–Max method, and the dataset was divided into training and testing subsets at a 4:1 ratio to evaluate the model’s predictive performance. For the parameter configuration of the wPSO algorithm, the population size was set to 20, the maximum number of iterations was capped at 50, and the inertia weight was linearly reduced from an initial value of 1.0 to 0.4. The maximum number of training epochs for the BP neural network was set to 1000, and the target training accuracy was defined as 0.0001, thereby ensuring the model achieved both high predictive accuracy and strong generalization capability.
Step 1: Input simulation data of the centrifugal fan.
Step 2: Initialize the structure and parameters of the BP neural network.
Step 3: Initialize the parameters of PSO, including the population number N , individual speed v 0 and position x 0 , initial weight w 0 , etc., and calculate individual fitness.
Step 4: During the iterative calculation process, use Equations (7) and (8) to calculate the speed v k and position x k of individuals, and update the global optimal and individual historical optimal.
Step 5: Before the end of the k th iteration, update the inertia weight w k + 1 according to Equation (9). Determine whether the maximum number of iterations k m a x has been reached. If so, proceed to step 6; otherwise, return to step 4.
Step 6: Output the optimal solution.
Step 7: Apply optimal solutions to BP neural network, start training, and evaluate the prediction results.

3. Establishment of Multi-Objective Optimization Algorithm

3.1. BWO Based on Logistic Chaotic Map Initialization (LBWO)

Beluga whale optimization (BWO) [21] is inspired by the behavior of beluga whales, and corresponds their swimming, hunting, and whale fall to exploration, exploitation, and whale fall, and the actions performed by individuals are determined by B f and W f in the algorithm. In order to enhance global convergence, the algorithm introduces Levy flight [22] during the exploitation phase and controls the behavior of individual beluga whales through adaptive balance factors and probability of whale fall. BWO can effectively control the execution of an individual’s actions at different stages, which is advantageous for solving realistic problems. Therefore, BWO is selected as the basic algorithm for multi-objective optimization of the fan.
According to BWO, the beluga whale position is generated through random initialization, which can cause uneven distribution of individual positions and reduce the accuracy of the solution. The chaotic sequence based on chaos theory has the characteristics of randomness and convenience [23]. A Logistic chaotic map [24] is used to initialize the population in this paper. The expression for the Logistic chaotic map is as follows:
x i + 1 = μ · x i · 1 x i ,             i = 1 , 2 , N 1
where μ is a control parameter with a range of [ 0 ,   4 ] , when μ is near 4, it exhibits a pseudo random distribution, and x i corresponds to individual i , which is used to initialize the position of the individual, with a range of ( 0,1 ) .

3.2. Multi-Objective Beluga Optimization Algorithm (NSGA-III-LBWO)

Original beluga whale optimization is suitable for solving single-objective optimization problems. When there are multiple optimization objectives (total pressure, efficiency, and sound pressure level), they are usually added in a normalized and weighted manner [25] to transform into a single-objective optimization problem. However, it is not easy to achieve optimal values for each optimization variable through this means.
To address the aforementioned limitation, this study proposes a multi-objective beluga whale optimization algorithm (NSGA-III-LBWO), integrating strategies from both LBWO [26] and NSGA-III [27] (Table 3). NSGA-III is a multi-objective evolutionary algorithm that incorporates the Pareto dominance mechanism [28]. The evaluation of individuals is no longer based solely on objective value magnitudes; instead, solution quality is assessed through the dominance relationships defined by the Pareto dominance mechanism. In the population, an individual p is said to dominate another individual q if the condition specified in Equation (11) is satisfied. The Pareto front is defined as the set of objective function values corresponding to the Pareto-optimal solutions, wherein all solutions are mutually non-dominated and no external solution dominates any member of the set.
i 1 , 2 , , ζ , f i p f i q     l 1 , 2 , , ζ , f l p < f l q
where f i X is the value of individual X on the i th objective function and ζ is the number of objective functions.
Compared to the single-objective optimization algorithm, NSGA-III based on non-dominated sorting enhances the exploration capability of the search space. Building upon the framework of NSGA-II, NSGA-III introduces a novel reference-point-based mechanism for evaluating individual solutions. By generating a series of uniformly distributed reference points in space, individuals and reference points are associated, so that some individuals with clustered distribution are eliminated, ensuring that the Pareto front can also maintain uniform distribution characteristics, which can ensure the uniformity and accuracy of the calculation results when analyzing nonlinear problems such as centrifugal fan performance optimization.
During the offspring generation phase in NSGA-III-LBWO, a portion of the initial population is derived from the current Pareto-optimal set, while the remainder is generated using the Logistic chaotic mapping defined in Equation (10). The positions of individuals are iteratively updated following the optimization rules of LBWO, with the final updated solutions being retained as the offspring individuals. To enhance the efficiency of the optimization process, the number of offspring individuals sampled from the non-dominated Pareto set C t n o n d o m i n a t e d will increase (Equation (12)), so as to search near the current Pareto set, which facilitates jumping out of the local optimum.
C t n o n d o m i n a t e d = α · t · S
where t is the cycle number, α is the constant scaling factor, and S is the population size.
Before generating initial positions based on the Pareto set in the LBWO algorithm, it is necessary to evaluate the individuals in the Pareto set according to Equation (13) and select the first C t n o n d o m i n a t e d non-dominated individuals to generate initial positions.
v a l p = i = 1 ζ w i · f i p
where v a l p is the value of individual p and w i is the weight of the i th objective function.
The centrifugal fan performance optimization problem in this paper can be expressed as follows:
f i n d   X = β i , β o , R v , s , θ
The objective functions can be described as follows:
max ( P t o t a l ( X ) ) max η X                   min L p X            
where X is an ideal design variable combination that should maximize the total pressure and efficiency of the fan and, at the same time, minimize the noise. The multi-objective optimization steps of the prototype fan are based on NSGA-III-LBWO, as shown in Figure 6.
Step 1: Determine population size N , number of iterations t m a x , individual attributes, and objective functions. Initialize the population P 0 , calculate the objective functions values of each individual, and perform non-dominated sorting on the individuals.
Step 2: Based on the current Pareto set and Equation (10), generate the offspring population C t in LBWO.
Step 3: Merge the original population P t and the offspring population C t to obtain population R t .
Step 4: According to the non-dominated strategy and reference point mechanism, N individuals are selected from population R t to join the new population P t + 1 .
Step 5: Update the number of iterations t to determine if the end condition is met. If it is, end and output the optimization result; otherwise, return to step 2.

4. Optimization and Analysis of Multi-Blade Centrifugal Fan

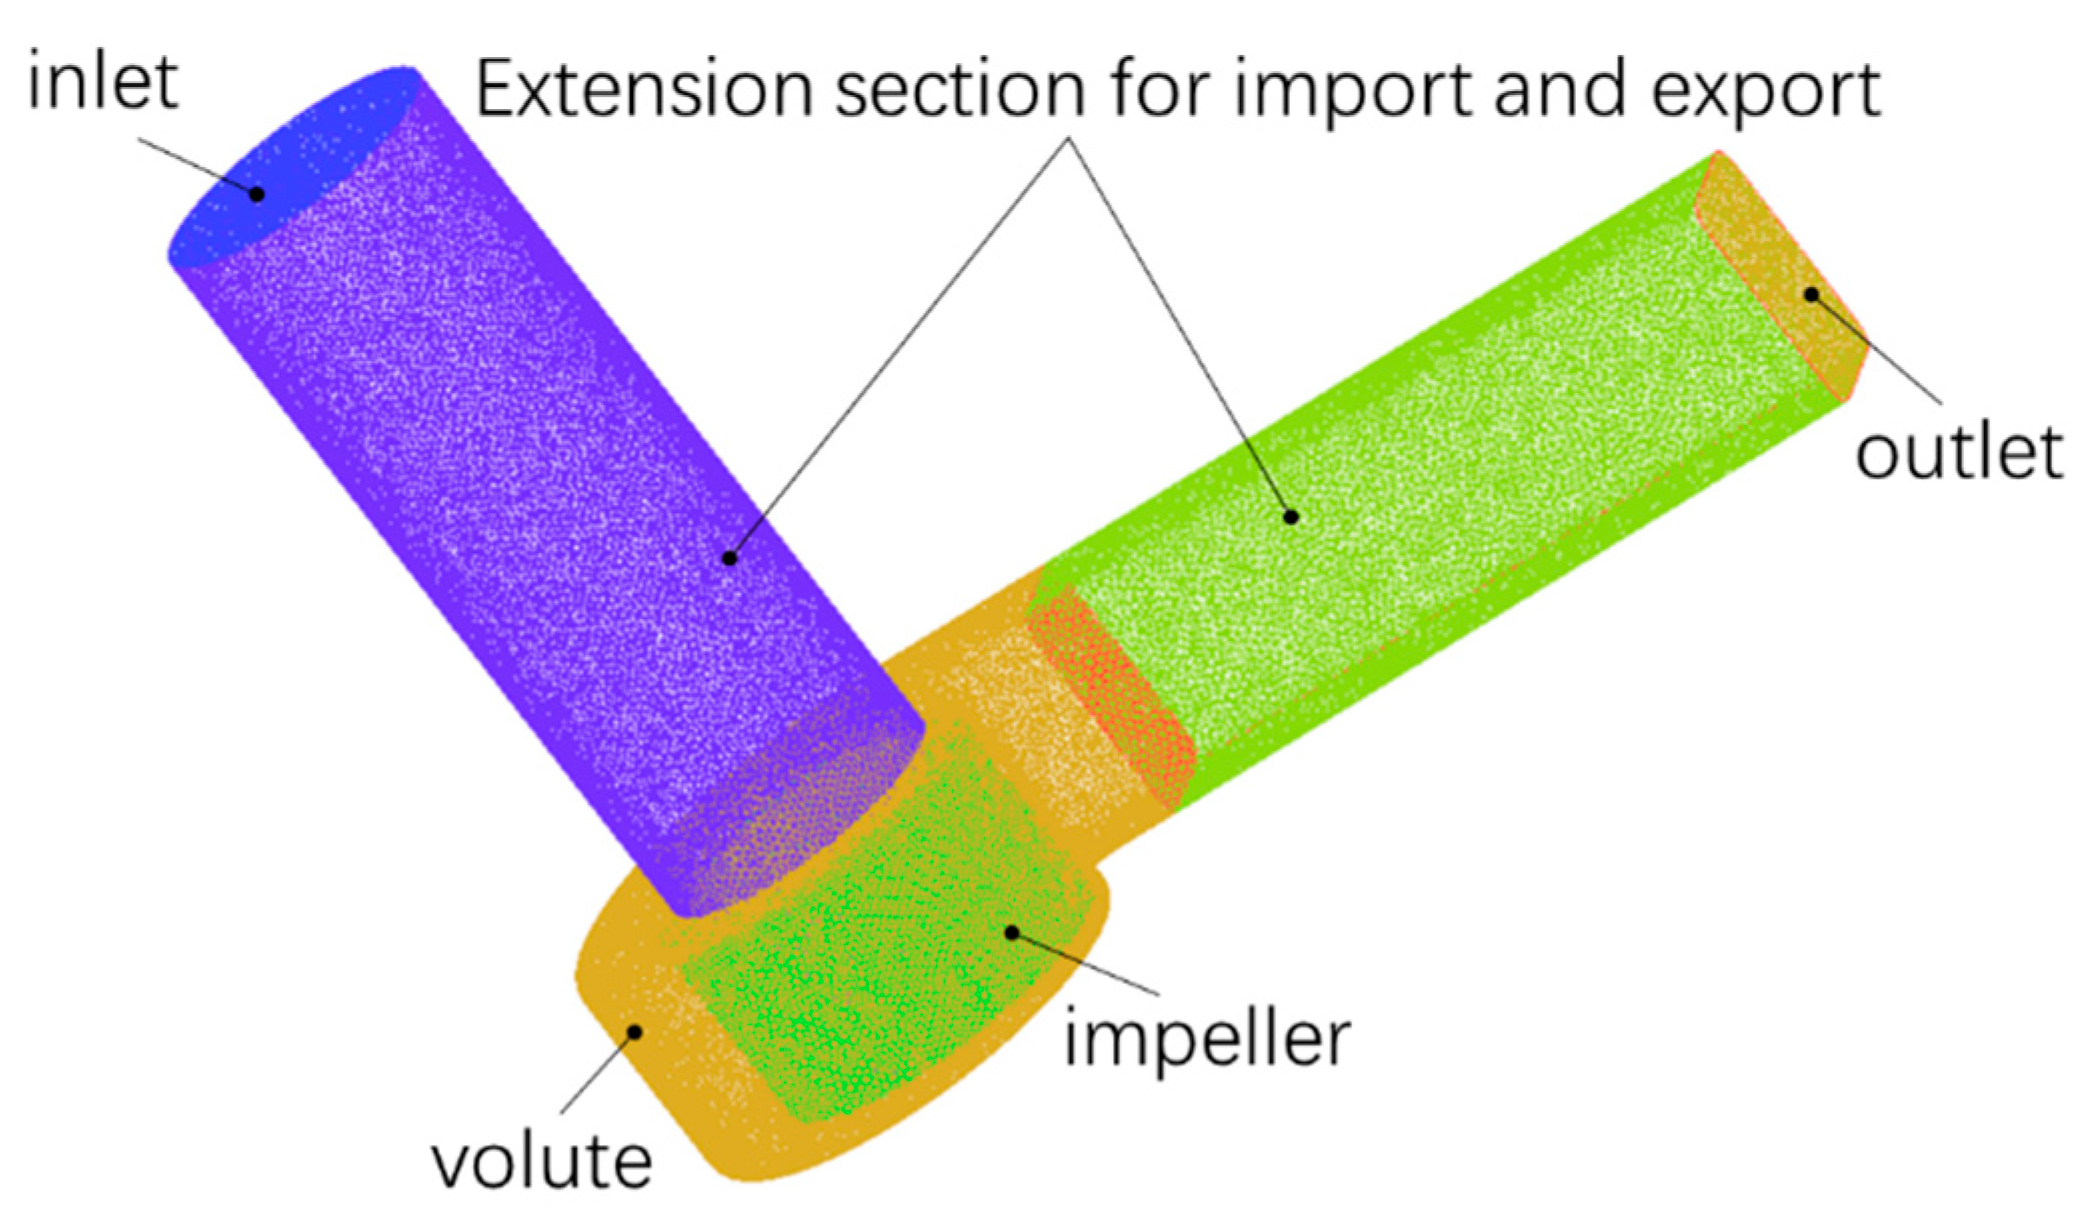
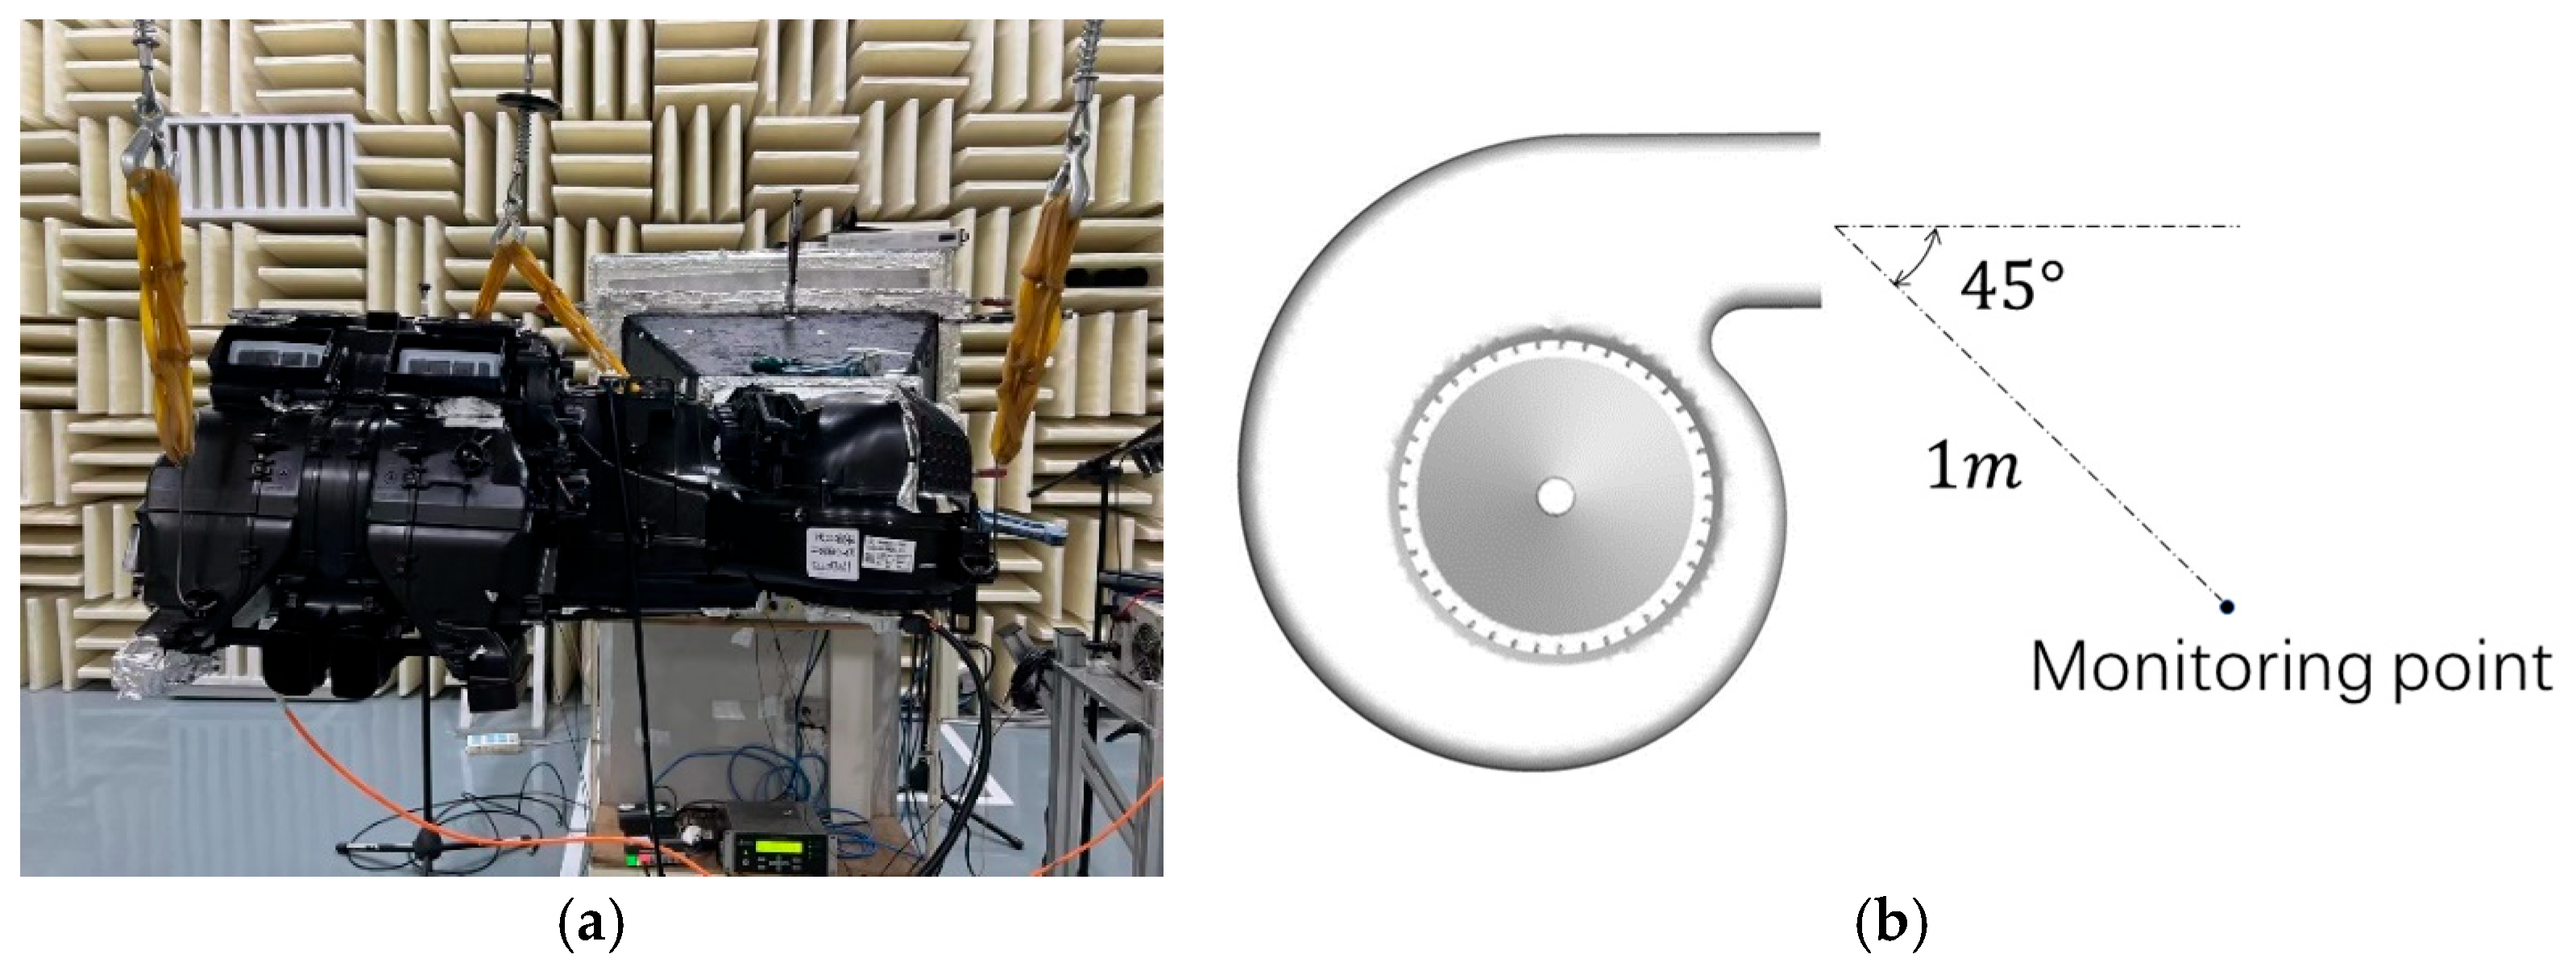
4.1. Reliability Verification of the Numerical Simulation

In order to eliminate the impact of the number and quality of meshes on the calculation results and minimize the number of meshes to ensure efficiency, mesh independence verification needs to be carried out first. The total pressure and efficiency are selected as verification indicators, and eight sets of calculation examples are calculated (Figure 7). Taking into account the accuracy and speed of the solution, a 5.99 × 10 6 mesh scheme is selected to carry out the subsequent simulations (Figure 8).
To verify the reliability of the simulation model, the total pressure and efficiency under different operating conditions are calculated and compared with experimental data, as shown in Figure 9.
Comparative analysis between numerical simulations and experimental measurements (Figure 9) shows that the maximum relative errors of full pressure and efficiency are 2.1% and 9.6%, respectively, which all appear under Q = 100 m3/h (not the typical working interval of the fan), while in the typical operating flow interval of the fan, good consistency is shown between the simulation results and the experimental data, which indicates that the simulation model has good prediction accuracy.
The noise experiment of the fan is conducted in a semi-anechoic room (Figure 10a). The background noise sound pressure level is 15   d B , which is far lower than the centrifugal fan noise. The microphone is located at the fan outlet and is offset by 45 °   (Figure 10b) to reduce the impact of outlet airflow and motor noise on the experimental results. Aerodynamic noise calculations and experiments in this paper are conducted at a flow rate of 500   m 3 / h , and the noise spectrum obtained is shown in Figure 11.
By comparing the experimental and simulation results of fan noise, it can be seen that there are some differences between the two. The reason for the error is that the noise generated by the mechanical part of the fan and the electromagnetic noise generated by the motor during operation are not considered in the simulation. Additionally, the original structure is simplified somewhat during the simulation. Under rated operating conditions, the simulated noise at the measuring point is 57.75   d B , while the experimental is 58.85   d B , with an error of 1.1   d B .
Overall, the consistency between simulation and experiment is in good coincidence, indicating the rationality of model simplification, mesh partitioning, and simulation parameter settings during simulation, which can be used for subsequent calculations and optimization.

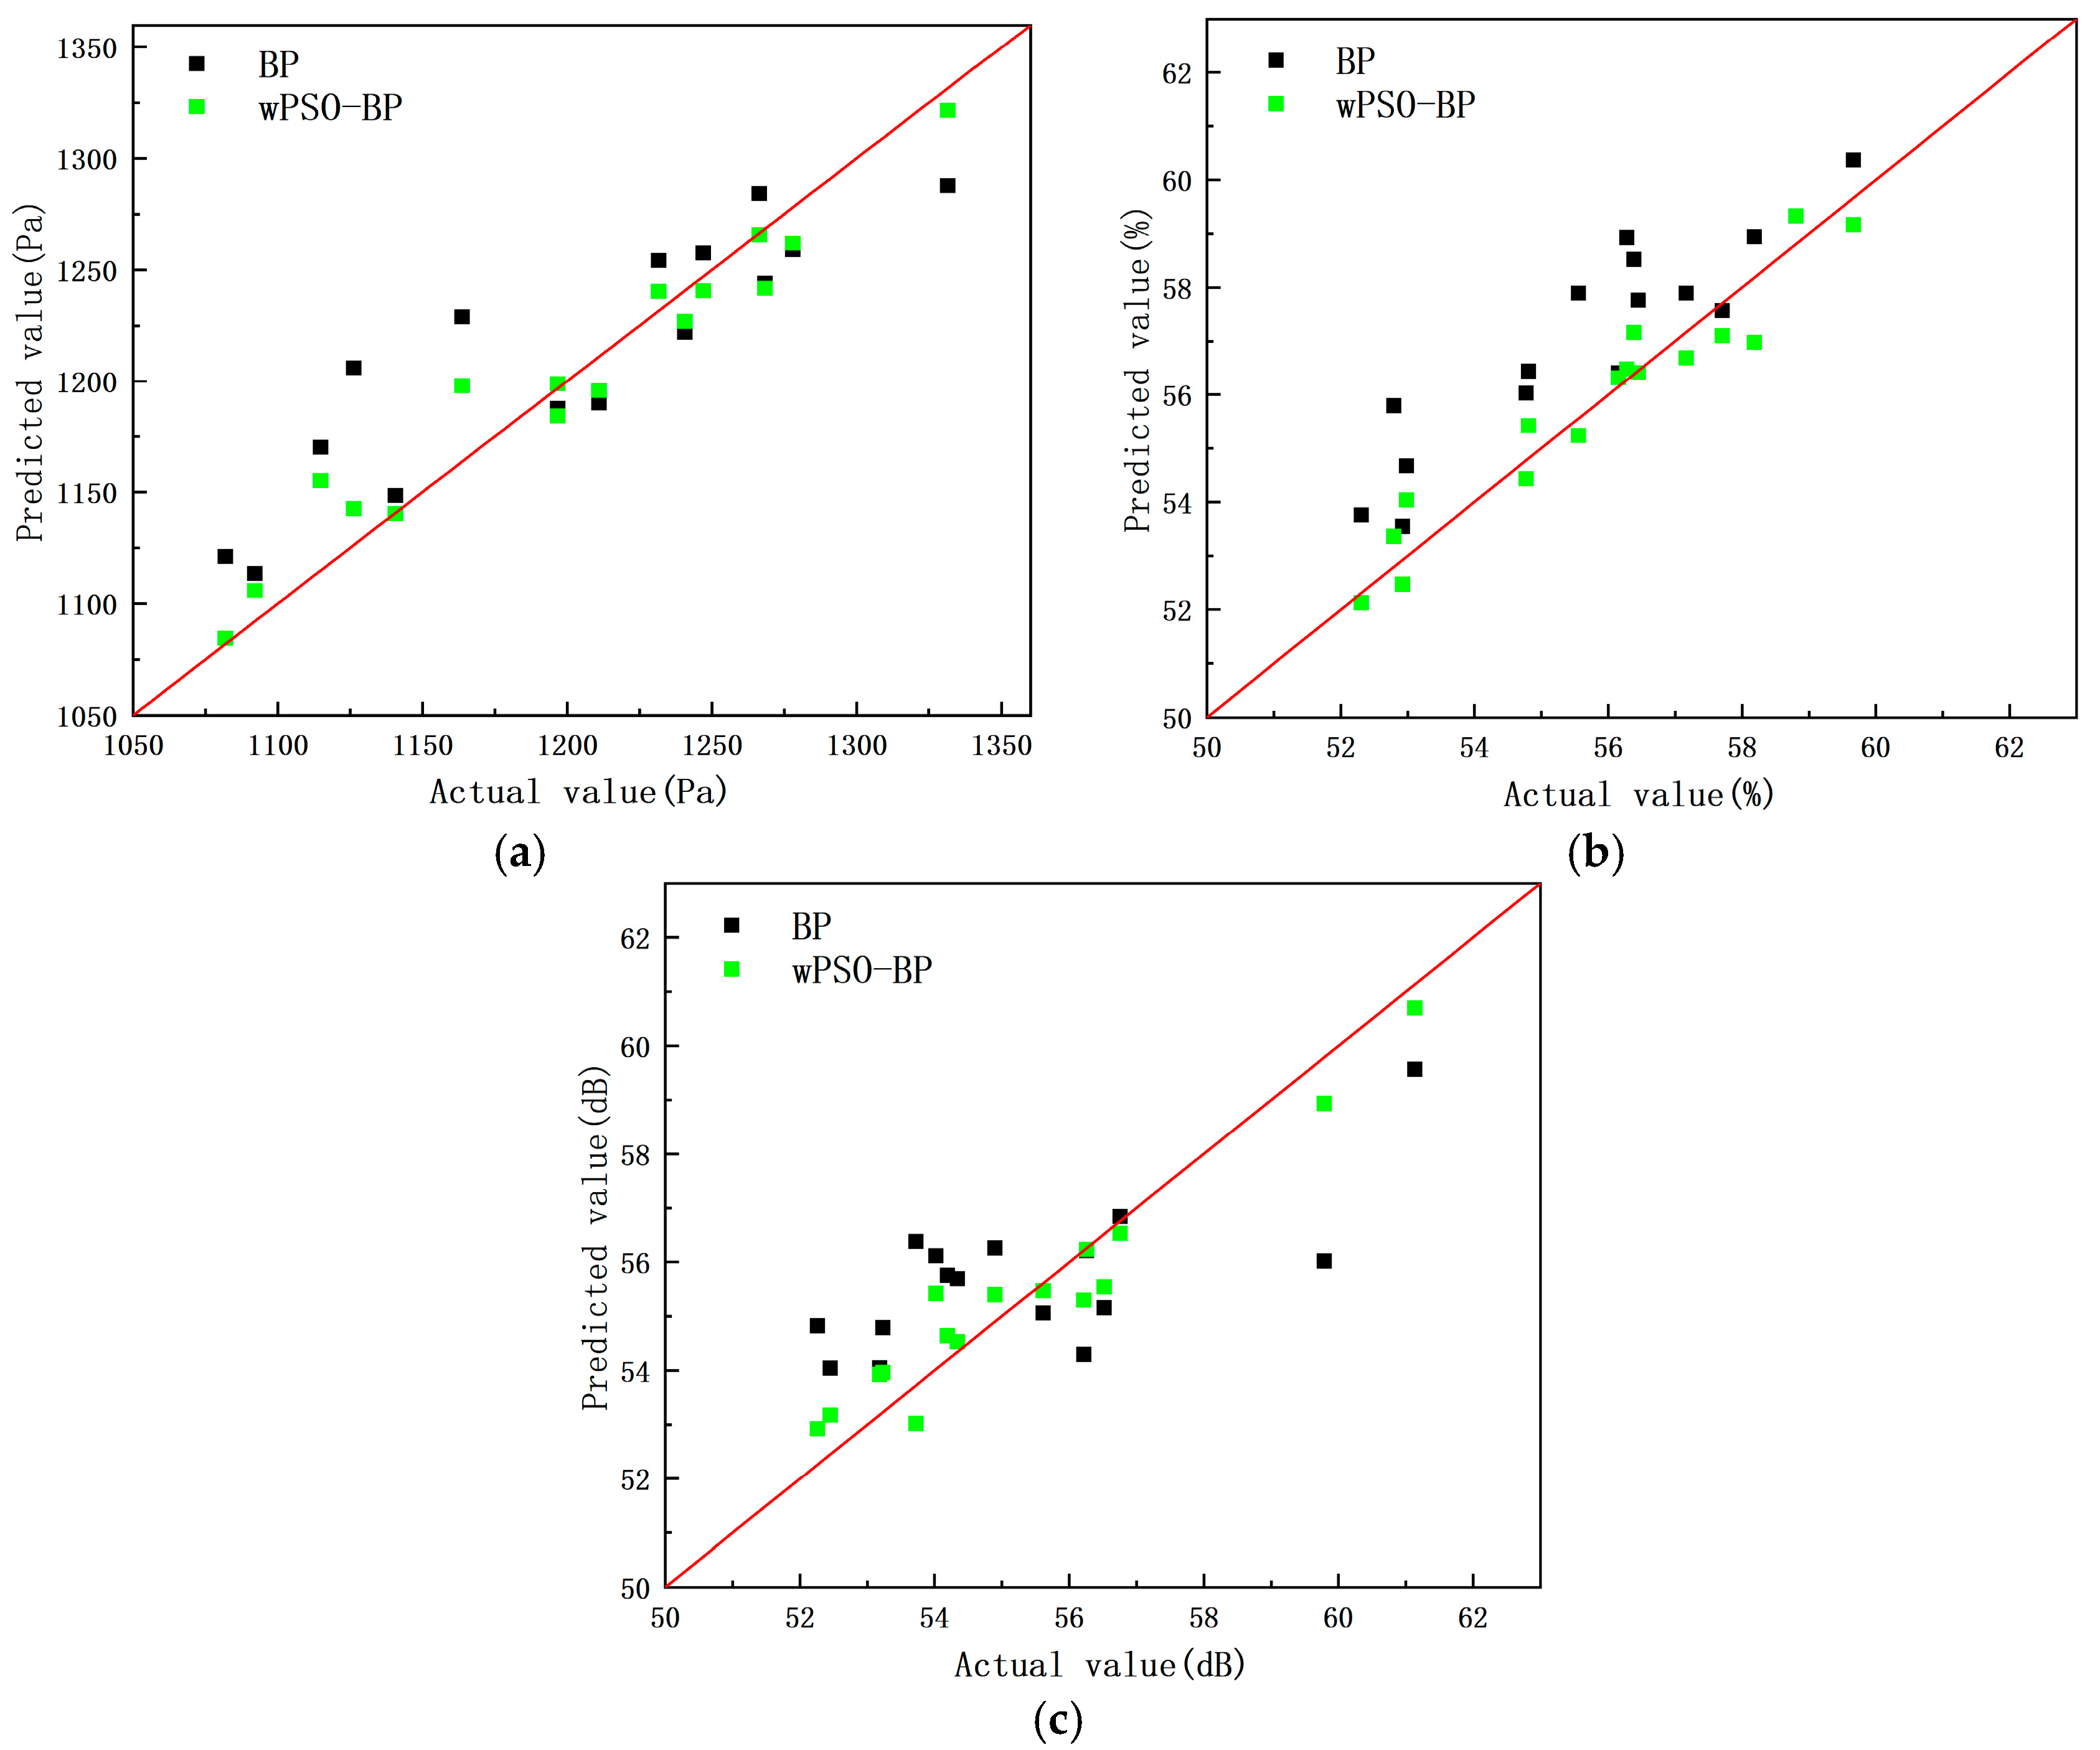
4.2. Prediction Model Results and Analysis

To establish the mapping between design variables and optimization objectives, 80 sample points are generated using the Latin hypercube sampling (LHS) method [29]. The use of LHS ensures uniform coverage of the multidimensional parameter space with a limited number of samples, thereby preventing local clustering while enhancing predictive accuracy and reducing computational costs [30]. These samples, including representative cases listed in Table 4, constitute the training and testing datasets for the prediction model. The performance metrics (e.g., total pressure, efficiency, and sound pressure level) for these samples are obtained through validated simulation techniques. Moreover, an automated batch processing workflow is implemented to handle the computational workload, which substantially improves computational efficiency.
The comparison results of wPSO-BP and BP are presented in Figure 12. Compared to the BP prediction model, the value obtained by the wPSO-BP prediction model is closer to the calculated value.
To further compare the two prediction models, quantitative analysis is conducted. The root mean square error (RMSE), mean absolute error (MAE), and coefficient of determination (R2) are calculated according to Equation (16)–(18), respectively.
R M S E = 1 m i = 1 m ( y i y i ^ ) 2
M A E = 1 m i = 1 m | ( y i y i ^ ) |
R 2 = 1 i = 1 m ( y i y i ^ ) 2 i = 1 m ( y i y ¯ ) 2
where m is the number of samples, y i ^ is the true value corresponding to sample i , and y ¯ is the average of true values.
Table 5 shows the evaluation indexes of the two models; it can be seen that the wPSO-BP prediction model can effectively reflect the link between the design variables and the optimization objectives, and its coefficient of determination is greater than 0.9, which can be used for subsequent optimization.

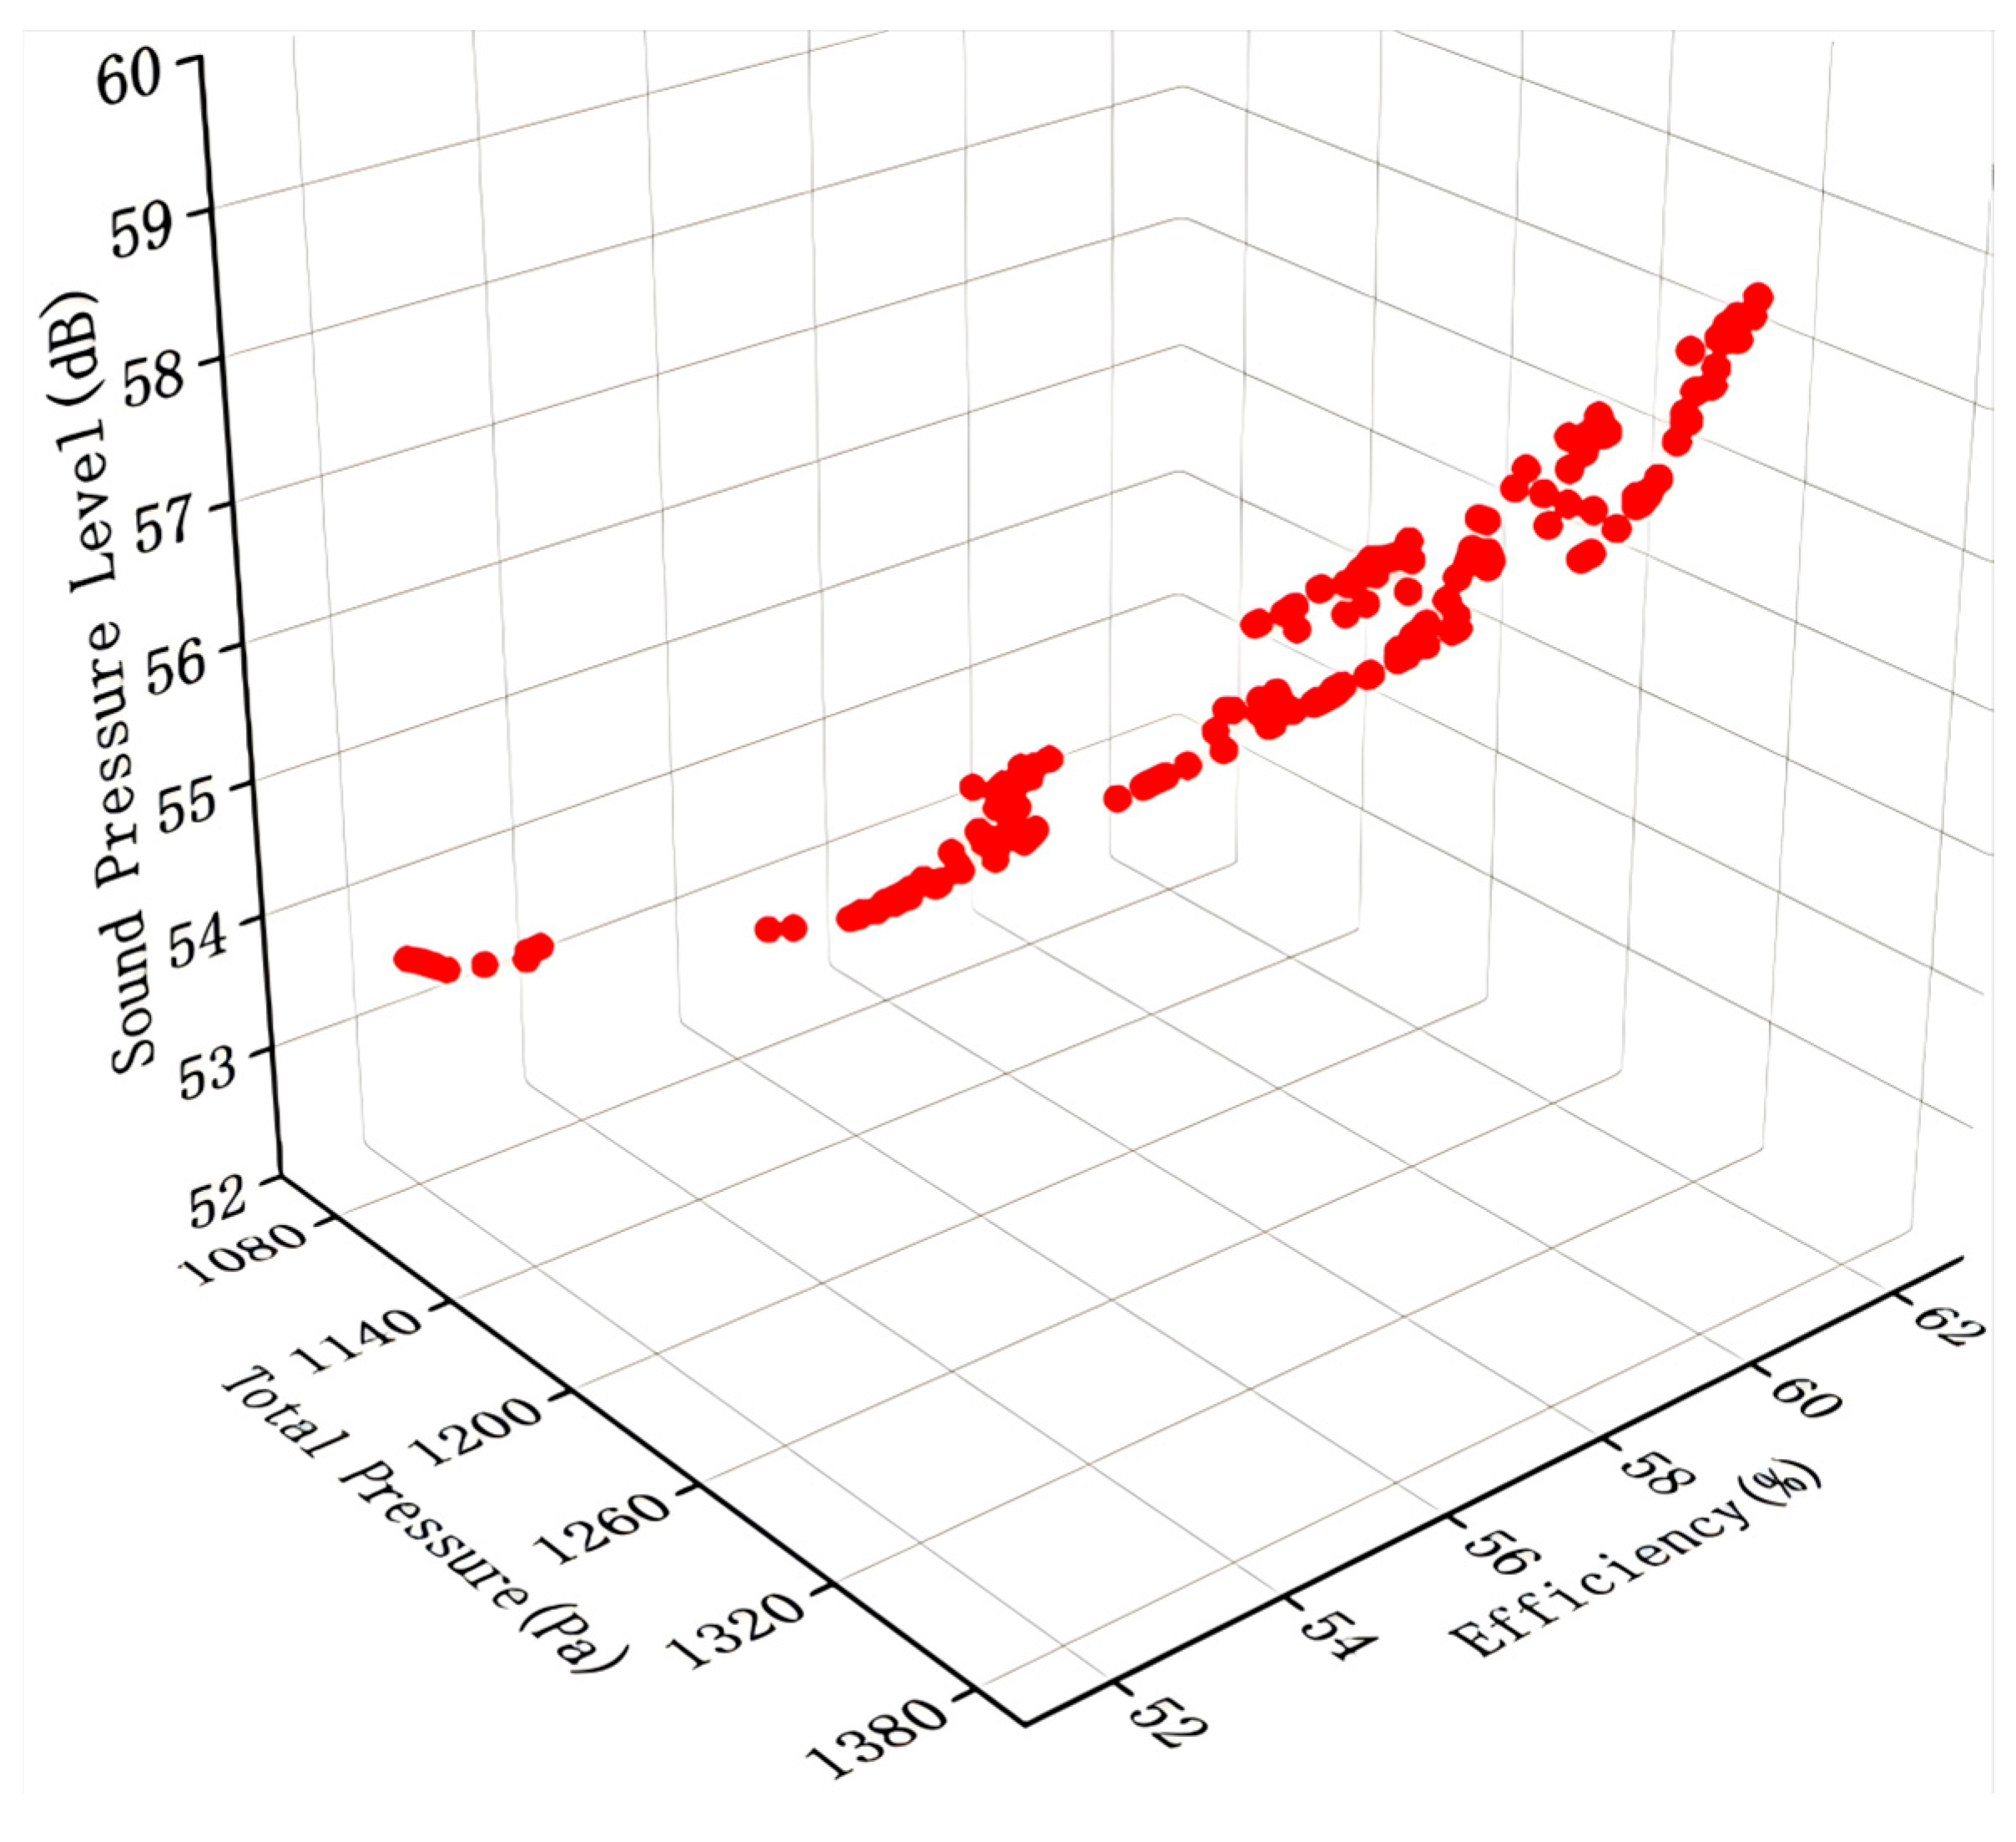
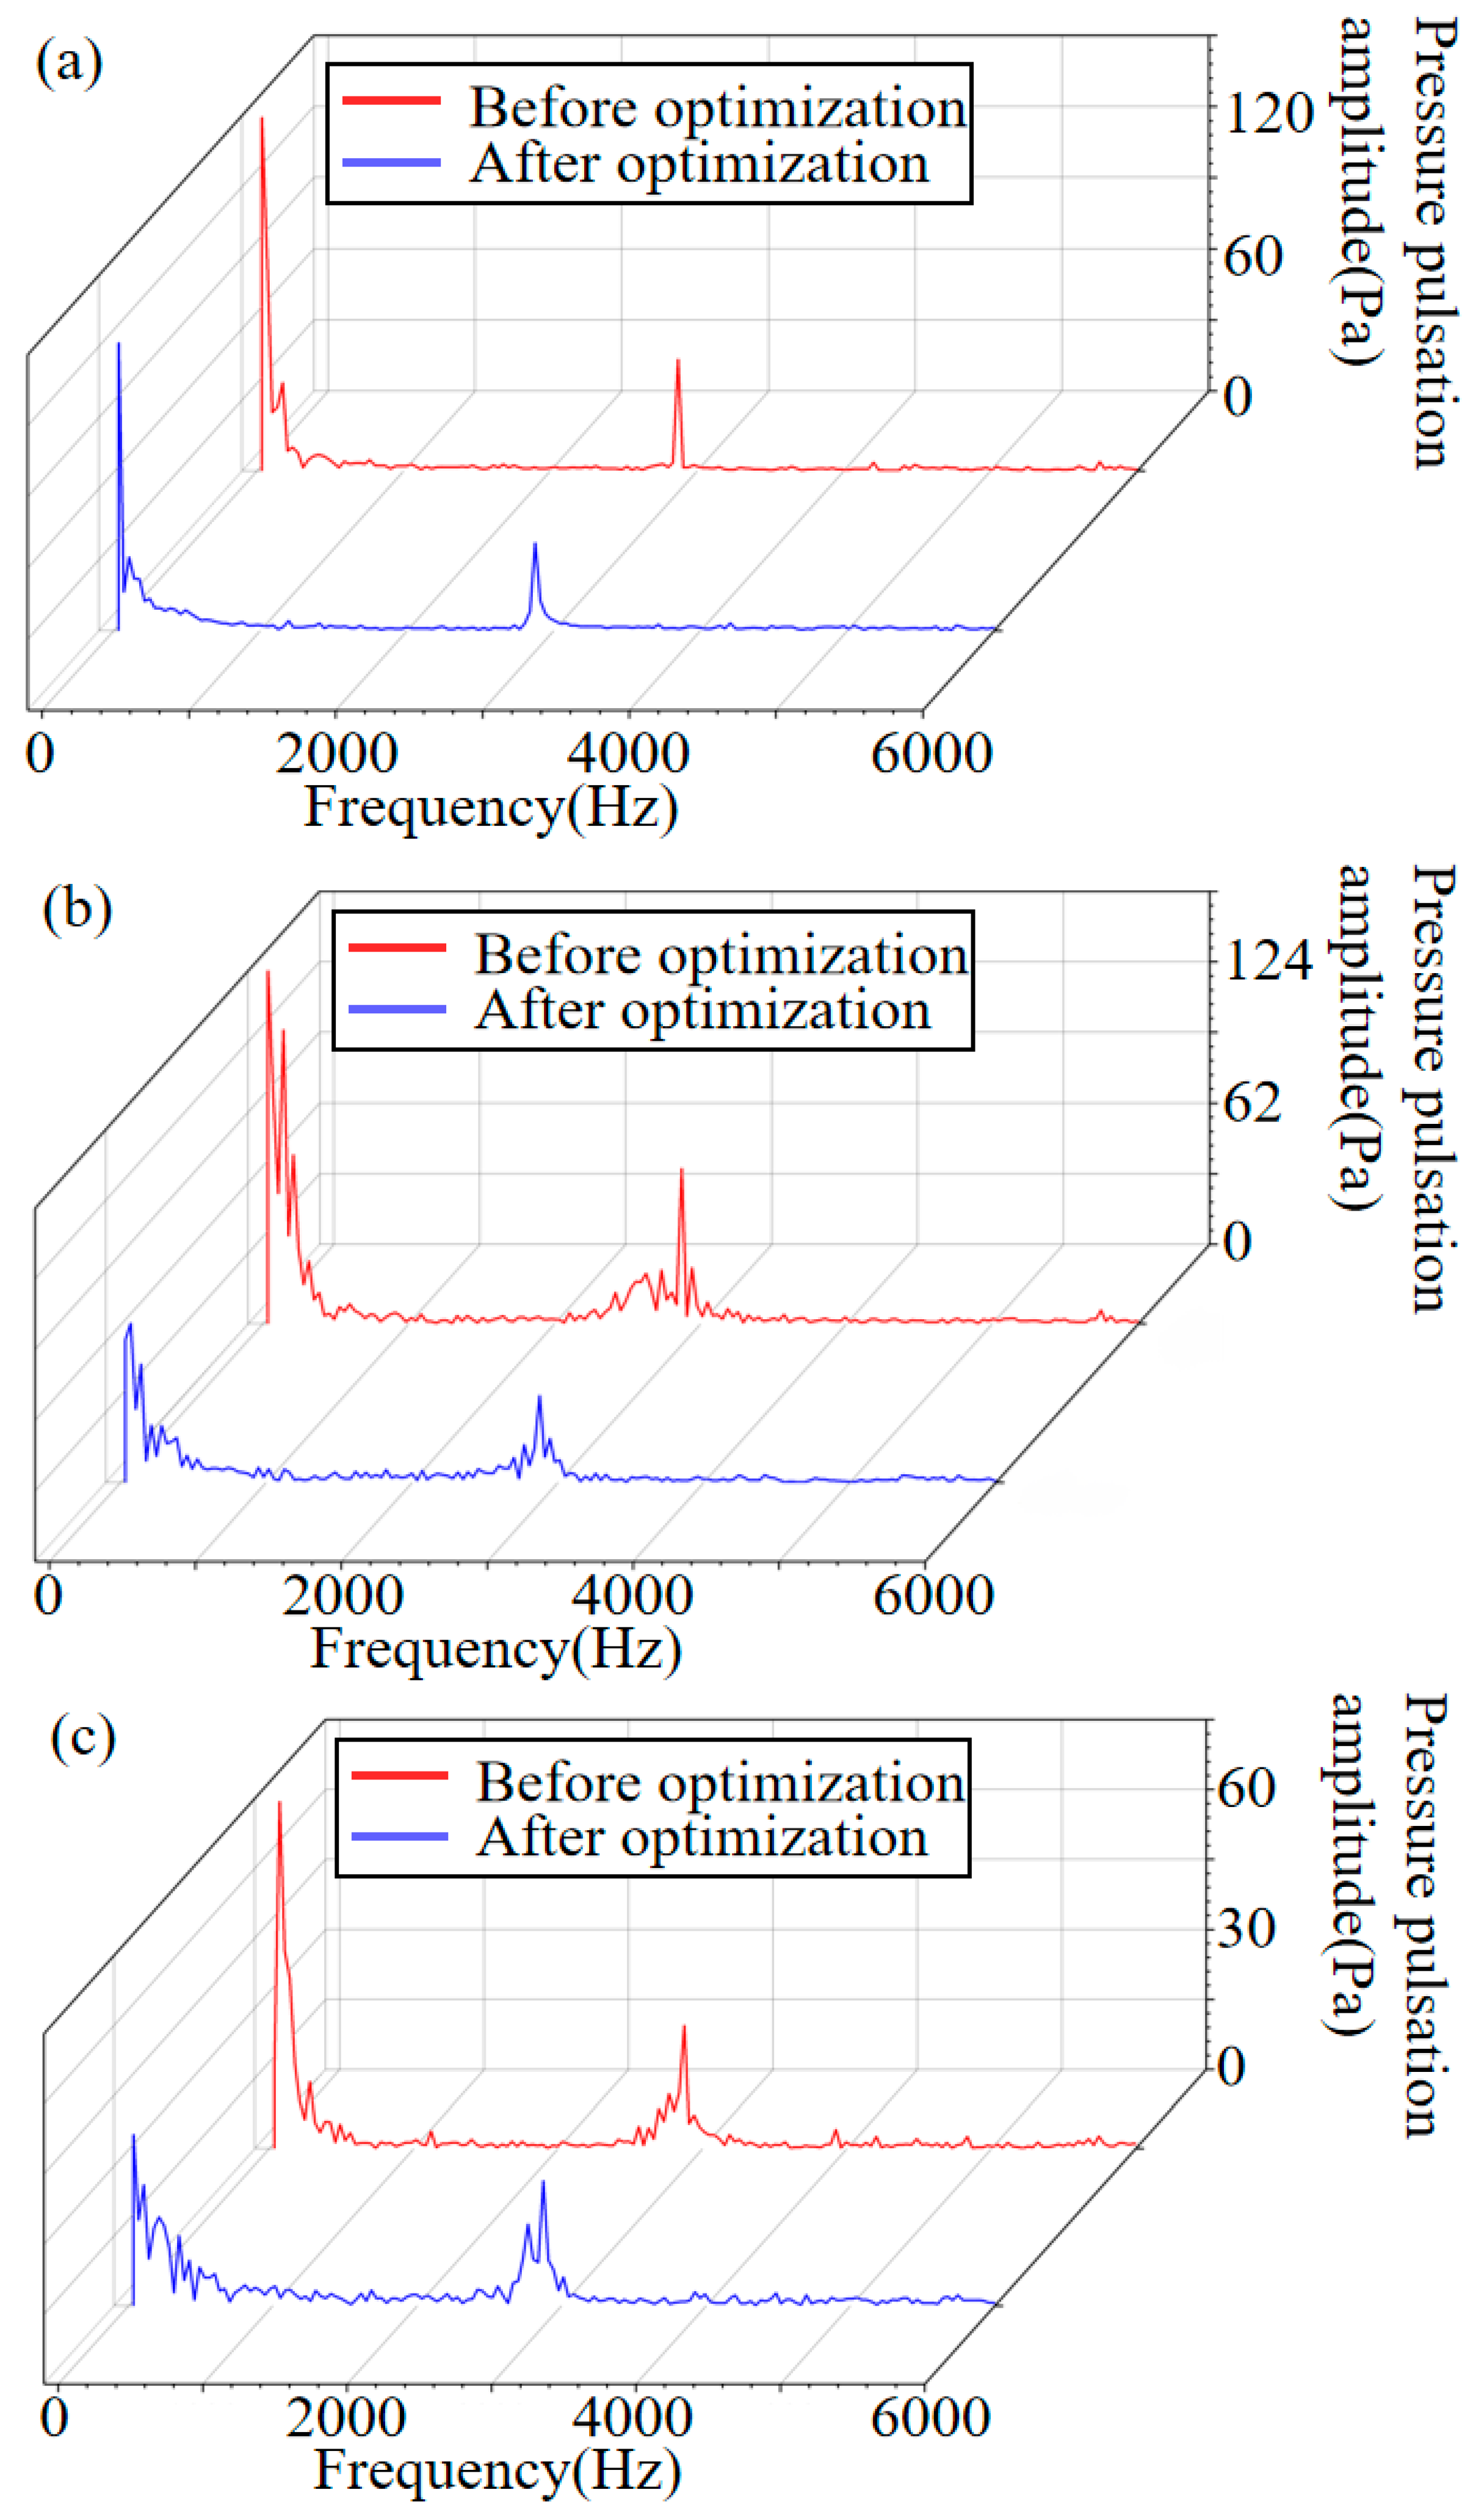
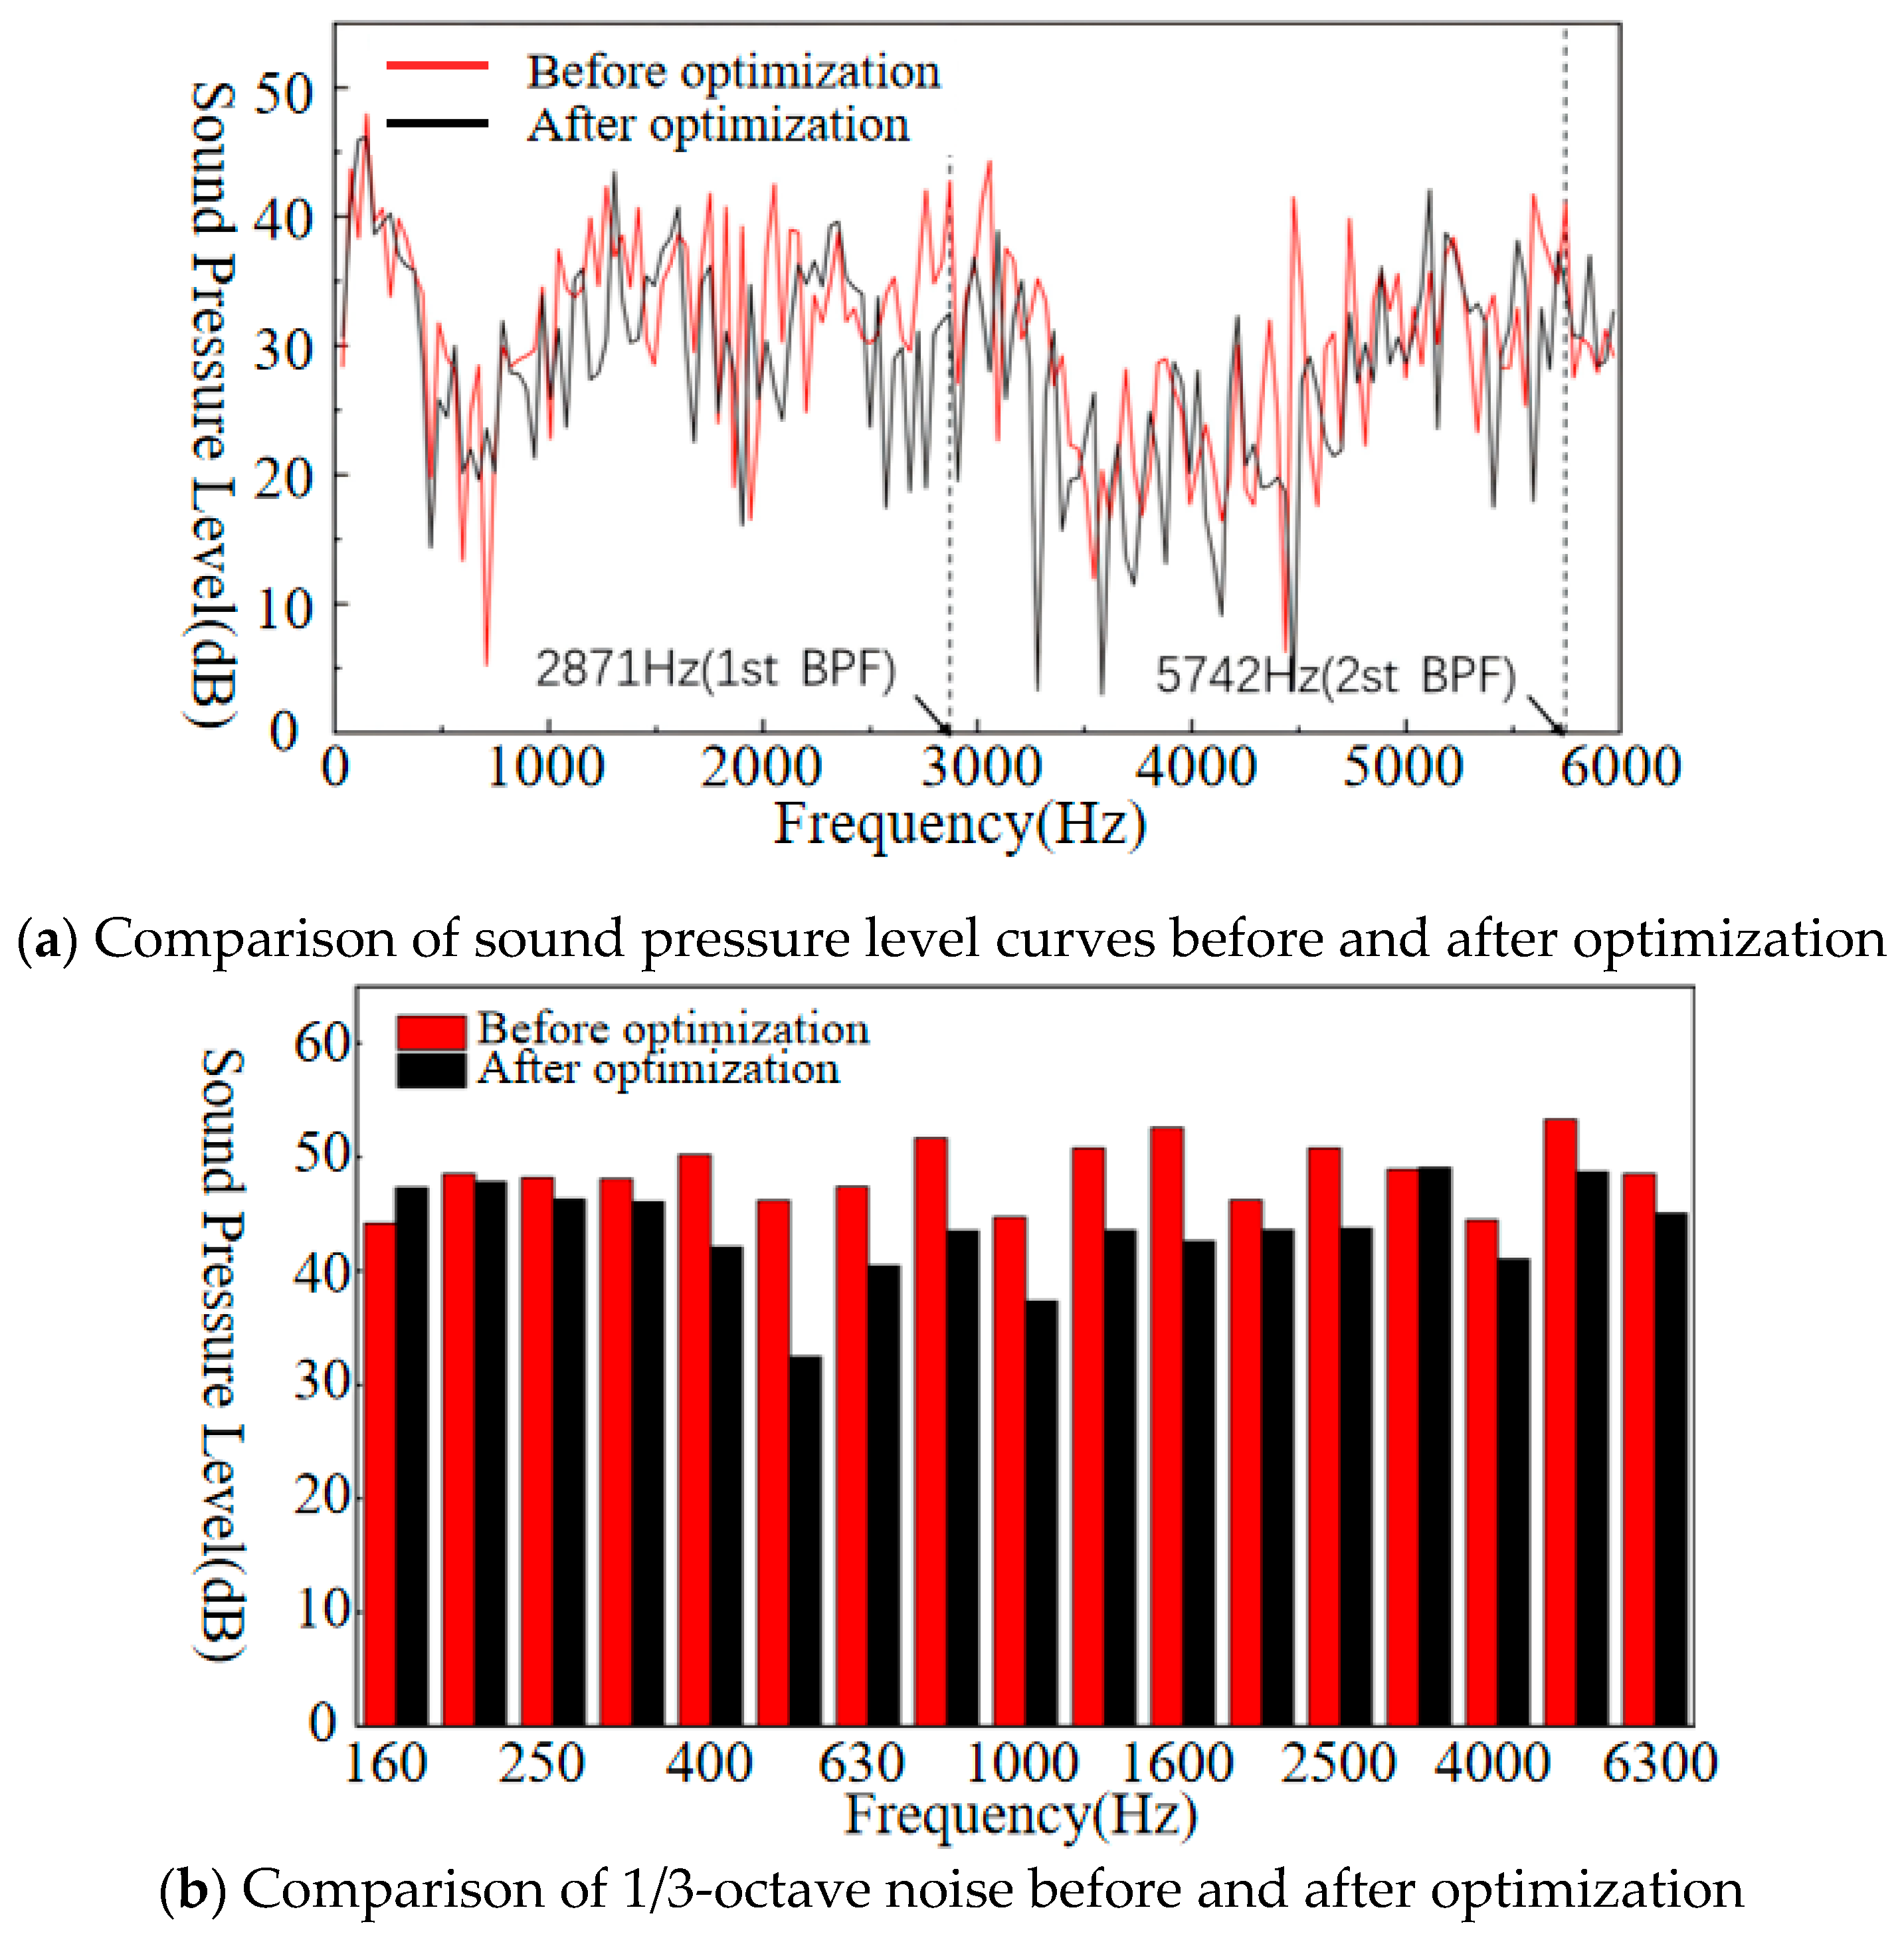
4.3. Optimization Results and Analysis

In this study, a collaborative optimization design of a prototype multi-wing centrifugal fan was carried out using the wPSO-BP prediction model and the NSGA-III-LBWO multi-objective optimization algorithm. The algorithm parameters were set as follows: the population size was set to 200, the number of iterations was 100, and the computational program was developed on the MATLAB 2022a platform. The core process includes the following:
  • Parameter initialization: 200 sets of initial samples are generated using the Latin hypercubic sampling technique and input into the wPSO-BP model for the prediction of full pressure ( P t o t a l ), efficiency ( η ), and noise ( L p );
  • Pareto front search: the reference point stratification mechanism of NSGA-III is used to screen the non-dominated solutions, and the Logistic chaos mapping of LBWO is combined to enhance the global search capability.
The Pareto frontiers obtained through optimization (see Figure 13) show that the optimal solution set exhibits an obvious trade-off between full pressure enhancement, efficiency improvement, and noise suppression, thus verifying the effectiveness of the proposed multi-objective optimization framework.
As shown in Figure 13, the sound pressure level of the fan increases with both efficiency and total pressure, indicating that the total pressure, efficiency, and noise performance of the multi-blade centrifugal fan cannot be simultaneously optimized, necessitating trade-off decisions. Compared to the improvements in aerodynamic performance, noise reduction during fan operation holds higher practical significance. The optimization configuration and corresponding results are summarized in Table 6. The optimized fan achieves a total pressure increase of 34.79 Pa, an efficiency improvement of 0.67%, and a reduction in sound pressure level of 1.73 dB compared to the baseline prototype. These results demonstrate that the optimization approach based on the wPSO-BP prediction model and NSGA-III-LBWO algorithm is effective, and the optimization goal of improving aerodynamic performance while reducing noise is achieved.
For the convenience of analyzing the fans before and after optimization, three sections are selected, namely the front disc side (z = 75 mm), middle position (z = 50 mm), and rear disc side (z = 25 mm) (Figure 14).
The static pressure nephograms before and after optimization are shown in Figure 15 and Figure 16. After optimization, the range of low static pressure near the center of the impeller in the z = 75 mm section is significantly reduced, the pressure gradient decreases, the interference of the airflow entering the blade channel is reduced, and the flow loss inside the blade channel is reduced, resulting in an improvement in aerodynamic performance. The maximum static pressure position is closer to the outlet compared to before optimization in the sections of z = 50 mm and z = 25 mm, which weakens the backflow phenomenon near the tongue, improving the impeller efficiency and reducing the fan noise. The maximum and minimum static pressure difference after optimization has increased by approximately 187 P a compared to before, indicating an improvement in the pneumatic performance.
Figure 17 and Figure 18 illustrate the velocity–streamline nephograms of the fan. Analysis shows that the airflow acceleration effect of each section of the fan is significantly promoted. Based on the turbulence kinetic energy diagram (Figure 19 and Figure 20), it can be inferred that the matching between the airflow inlet angle and the blade inlet angle has been improved, the flow separation effect in the blade channel has been weakened, and the flow loss inside the fan has decreased. The average velocity of the airflow at the impeller outlet position has increased by about 8 m / s compared to before optimization, which means that the airflow is receiving more energy, and the fan efficiency has improved by 0.67%.
Figure 19 and Figure 20 show the nephograms of turbulent kinetic energy before and after optimization. It can be seen that during the operation of the fan, the positions with strong turbulent kinetic energy are concentrated near the tongue, in the blade channel, and inside the impeller, all of which are the main sources of fan noise. By comparison, it can be found that the flow situation near the volute tongue with the section of z = 75 mm has significantly improved, as the tongue radius near the front disc of impeller is larger, and the unsteady interference between the tongue and airflow is weakened, manifested by a decrease in the overall fan noise. After optimization, the turbulent kinetic energy in the blade channel of the fan at the main work area z = 50 mm and z = 25 mm sections significantly decreased compared to before optimization. The mutual interference between high-speed outflow and low-speed airflow in the volute passage is reduced, manifested as a reduction in the area of the area around the blade with larger turbulent kinetic energy. Although the high turbulent kinetic energy area inside the impeller increased compared to before optimization, the overall performance of the fan was improved.
To further illustrate the optimization effect, three monitoring points p1, p2, and p3 near the volute tongue (Figure 2) are selected for pressure pulsation analysis, as shown in Figure 21. From the figure, it can be seen that there are obvious peaks at the rotating frequency (70 Hz) and blade frequency (2871 Hz) at each pressure pulsation monitoring point before and after optimization, indicating the accuracy of the simulation results. The optimized fan has a varying reduction in the peak pressure pulsation at three monitoring points. The reduction effect of pressure pulsation is most significant in the middle and rear disc positions of the impeller: the amplitude of the middle and rear discs decreased by 32.12   P a and 55.82   P a at 70 Hz, while the amplitude decreased by 30.03   P a and 2.6   P a at 2871 Hz, respectively.
After increasing the tongue radius at the front disc, the interference between the airflow and the tongue is weakened, and the periodic impact on the volute tongue is weakened. Moreover, due to the change in the radius of volute tongue, there is a phase difference in the unsteady force on the volute tongue at different heights. After superposition, the overall effect is weakened compared to before optimization, which is manifested as a decrease in the noise of the optimized fan (Figure 22).
In order to observe the noise performance of the optimized fan, the noise sound pressure level of the remote field monitoring points before and after optimization are compared (Figure 22). According to the curves, it can be observed that the sound pressure level of the optimized fan has decreased to a certain extent in most frequency bands, and at the one- and two-time blade frequencies, the noise has significantly decreased by 10.24   d B and 6.46   d B , respectively. Therefore, the overall sound pressure level of the fan has reduced from 57.75   d B to 56.02   d B .

5. Conclusions

In this paper, a prediction model (wPSO-BP) and a multi-objective optimization algorithm (NSGA-III-LBWO) are proposed, and the blade inlet and outlet angle, volute tongue radius on the front disc side, and front disc side blade chamfer angle of the multi-blade centrifugal fan are optimized based on the wPSO-BP prediction model and NSGA-III-LBWO, which improves the comprehensive performance of the fan. The conclusions can be drawn as follows:
(a)
A prediction model between design variables and optimization objectives called wPSO-BP is proposed and compared with the BP prediction model. The result indicates that wPSO-BP has a better effect.
(b)
A Logistic chaotic map is used for population initialization in beluga whale optimization (LBWO), and a multi-objective optimization algorithm is proposed based on NSGA-III and LBWO (NSGA-III-LBWO).
(c)
Based on the wPSO-BP prediction model and NSGA-III-LBWO, the prototype fan is optimized, and the result shows that the aerodynamic and noise performance of the fan improved, which provides a certain reference value for the optimization of multi-blade centrifugal fans.

Author Contributions

Conceptualization, W.J. and J.L.; methodology, W.J. and J.W.; software, W.J. and R.X.; validation, J.L., M.Z. and Q.H.; formal analysis, W.J. and J.W.; investigation, R.X. and M.Z.; resources, Q.H. and M.Z.; data curation, W.J. and J.W.; writing—original draft preparation, W.J. and J.W.; writing—review and editing, J.L. and Q.H.; visualization, W.J.; supervision, J.L. and Q.H.; project administration, J.L.; funding acquisition, Q.H. All authors have read and agreed to the published version of the manuscript.

Funding

This research was funded by the Guangxi Innovation Driven Development Special Fund Project, grant number AA22068060-6, and the Guangxi Science and Technology Major Special Project, grant number AA23062073-3.

Institutional Review Board Statement

Not applicable.

Informed Consent Statement

Not applicable.

Data Availability Statement

The original contributions presented in this study are included in the article. Further inquiries can be directed to the corresponding author.

Acknowledgments

The computation was completed on the HPC Platform of Huazhong University of Science and Technology.

Conflicts of Interest

Author Jiaxuan Wang was employed by Wuhan Second Ship Design and Research Institute. Author Ming Zhou was employed by Valeo Automotive Air Conditioning Hubei Co., Ltd. The remaining authors declare that the research was conducted in the absence of any commercial or financial relationships that could be construed as a potential conflict of interest.

References

  1. Kamada, M.; Shimoyama, K.; Sato, F.; Washiashi, J.; Konishi, Y. Multi-objective design optimization of a high efficiency and low noise blower unit of a car air-conditioner. Proc. Inst. Mech. Eng. Part D J. Automob. Eng. 2019, 233, 3493–3503. [Google Scholar] [CrossRef]
  2. Wei, Y.; Li, L.; Lun, Y.; Wang, Z.; Yang, H.; Zhang, W. Effect of Volute-Tongue Clearance on the Aerodynamic Performance and Noise of Multi-Wing Centrifugal Fan for Air Conditioning. J. Appl. Fluid Mech. 2023, 16, 1483–1498. [Google Scholar]
  3. Hao, W.; Wang, J.; He, X.; Zhu, Z.; Wang, Z.; Yang, H.; Zhang, W.; Wei, Y. Reduction of aerodynamic noise of single-inlet centrifugal fan with inclined volute tongue. Meas. Control 2020, 53, 1376–1387. [Google Scholar] [CrossRef]
  4. Yuan, Y.; Xiao, Y.; Ming, P.; Lu, H. The aerodynamic and noise characteristics of centrifugal fan with partially tilted tongue. Phys. Fluids 2023, 35, 127113. [Google Scholar] [CrossRef]
  5. Lun, Y.; Lin, L.; He, H.; Ye, X.; Zhu, Z.; Wei, Y. Effects of vortex structure on performance characteristics of a multiblade fan with inclined tongue. Proc. Inst. Mech. Eng. Part A J. Power Energy 2019, 233, 1007–1021. [Google Scholar] [CrossRef]
  6. Wu, L.; Liu, X.; Wang, M. Effects of bionic volute tongue on aerodynamic performance and noise characteristics of centrifugal fan used in the air-conditioner. J. Bionic Eng. 2020, 17, 780–792. [Google Scholar] [CrossRef]
  7. Wang, K.; Ju, Y.; Zhang, C. A quantitative evaluation method for impeller-volute tongue interaction and application to squirrel cage fan with bionic volute tongue. J. Fluids Eng. 2019, 141, 081104. [Google Scholar] [CrossRef]
  8. Wu, Y.; Dou, H.S.; Wei, Y.K.; Chen, X.P.; Chen, Y.N.; Cao, W.B. Effect of attack angle on flow characteristic of centrifugal fan. IOP Conf. Ser. Mater. Sci. Eng. 2016, 129, 012059. [Google Scholar] [CrossRef]
  9. Ding, H.; Chang, T.; Lin, F. The influence of the blade outlet angle on the flow field and pressure pulsation in a centrifugal fan. Process 2020, 8, 1422. [Google Scholar] [CrossRef]
  10. Choi, J.; Ryu, S.Y.; Cheong, C.; Kim, M.K.; Lee, K. Blade shape optimization of centrifugal fan for improving performance and reducing aerodynamic noise of clothes dryer. J. Acoust. Soc. Korea 2019, 38, 321–327. [Google Scholar]
  11. Zhang, H.; Dong, F.; Zhang, X.; Chu, W. Numerical Investigation of Effect of Blade Surface Slot on the Performance and Flow Field of a Low Speed Centrifugal Fan. In Proceedings of the Turbo Expo: Power for Land, Sea, and Air. American Society of Mechanical Engineers, London, UK, 22–26 June 2020; Volume 84102, p. V02ET39A011. [Google Scholar]
  12. Ch, S.V.; Anantharaman, K.; Rajasekaran, G. Effect of blade number on the performance of centrifugal fan. Mater. Today Proc. 2023, 72, 1143–1152. [Google Scholar]
  13. Prezelj, J.; Novaković, T. Centrifugal fan with inclined blades for vacuum cleaner motor. Appl. Acoust. 2018, 140, 13–23. [Google Scholar] [CrossRef]
  14. Shin, D.; Heo, S.; Cheong, C.; Kim, T.H.; Jung, J. Performance/noise optimization of centrifugal fan using response surface method. Trans. Korean Soc. Mech. Eng. A 2017, 41, 165–172. [Google Scholar]
  15. Zhang, J.; Chu, W.; Zhang, J.; Lv, Y. Vibroacoustic optimization study for the volute casing of a centrifugal fan. Appl. Sci. 2019, 9, 859. [Google Scholar] [CrossRef]
  16. Bamberger, K.; Carolus, T.; Belz, J.; Nelles, O. Development, validation, and application of an optimization scheme for impellers of centrifugal fans using computational fluid dynamics-trained metamodels. J. Turbomach. 2020, 142, 111005. [Google Scholar] [CrossRef]
  17. Liu, T.; Zhang, Y.; Li, K.; Wang, Y.; Li, J. Aerodynamic Optimization of a Centrifugal Fan Using Response Surface Methodology. Open J. Fluid Dyn. 2019, 9, 92. [Google Scholar] [CrossRef]
  18. Meng, F.; Wang, L.; Ming, W.; Zhang, H. Aerodynamics optimization of multi-blade centrifugal fan based on extreme learning machine surrogate model and particle swarm optimization algorithm. Metals 2023, 13, 1222. [Google Scholar] [CrossRef]
  19. Avşar, G.; Ezertaş, A.A.; Başkan Perçin, Ö. Aerodynamic Design and Performance Optimization of a Centrifugal Fan Impeller. In Turbo Expo: Power for Land, Sea, and Air; American Society of Mechanical Engineers: Boston, MA, USA, 2023; Volume 87110, p. V13DT34A008. [Google Scholar]
  20. Salaria, U.A.; Menhas, M.I.; Manzoor, S. Quasi Oppositional Population Based Global Particle Swarm Optimizer With Inertial Weights (QPGPSO-W) for Solving Economic Load Dispatch Problem. IEEE Access 2021, 9, 134081–134095. [Google Scholar] [CrossRef]
  21. Zhong, C.; Li, G.; Meng, Z. Beluga whale optimization: A novel nature-inspired metaheuristic algorithm. Knowl.-Based Syst. 2022, 251, 109215. [Google Scholar] [CrossRef]
  22. Chawla, M.; Duhan, M. Levy flights in metaheuristics optimization algorithms–a review. Appl. Artif. Intell. 2018, 32, 802–821. [Google Scholar] [CrossRef]
  23. Yu, H.; Zhao, N.; Wang, P.; Chen, H.; Li, C. Chaos-enhanced synchronized bat optimizer. Appl. Math. Model. 2019, 77, 1201–1215. [Google Scholar] [CrossRef]
  24. Zhu, H.; Zhao, Y.; Song, Y. 2D logistic-modulated-sine-coupling-logistic chaotic map for image encryption. IEEE Access 2019, 7, 14081–14098. [Google Scholar] [CrossRef]
  25. Miettinen, K. Nonlinear Multiobjective Optimization; Springer: New York, NY, USA, 1998. [Google Scholar] [CrossRef]
  26. Deb, K.; Jain, H. An Evolutionary Many-Objective Optimization Algorithm Using Reference-Point-Based Nondominated Sorting Approach, Part I: Solving Problems With Box Constraints. IEEE Trans. Evol. Comput. 2014, 18, 577–601. [Google Scholar] [CrossRef]
  27. Hou, Y.; Liao, X.; Chen, G.; Chen, Y. Co-Evolutionary NSGA-III with deep reinforcement learning for multi-objective distributed flexible job shop scheduling. Comput. Ind. Eng. 2025, 203, 110990. [Google Scholar] [CrossRef]
  28. Palakonda, V.; Mallipeddi, R. Pareto dominance-based algorithms with ranking methods for many-objective optimization. IEEE Access 2017, 5, 11043–11053. [Google Scholar] [CrossRef]
  29. Dong, H.; Nakayama, M.K. Quantile estimation with Latin hypercube sampling. Oper. Res. 2017, 65, 1678–1695. [Google Scholar] [CrossRef]
  30. Iordanis, I.; Koukouvinos, C.; Silou, I. On the efficacy of conditioned and progressive Latin hypercube sampling in supervised machine learning. Appl. Numer. Math. 2025, 208, 256–270. [Google Scholar] [CrossRef]
Figure 1. Single-arc blade structure.
Applsci 15 05950 g001
Figure 2. Inclined tongue (p1, p2, and p3 are pressure pulsation monitoring points).
Applsci 15 05950 g002
Figure 3. Beveled blade.
Applsci 15 05950 g003
Figure 4. The structure of the BP neural network.
Applsci 15 05950 g004
Figure 5. The construction process of the centrifugal fan prediction model based on the variable-weight PSO-optimized BP neural network (wPSO-BP).
Applsci 15 05950 g005
Figure 6. Optimization process of prototype fan.
Applsci 15 05950 g006
Figure 7. Result of the mesh independence verification.
Applsci 15 05950 g007
Figure 8. Mesh of the fan.
Applsci 15 05950 g008
Figure 9. Comparison of total pressure and efficiency results. (a) Total pressure. (b) Efficiency.
Applsci 15 05950 g009
Figure 10. Experimental research on noise of the prototype fan. (a) Semi-anechoic room. (b) Microphone position.
Applsci 15 05950 g010
Figure 11. Noise spectrum of simulation and experiment.
Applsci 15 05950 g011
Figure 12. Comparison between predicted and calculated values. (a) Total pressure. (b) Efficiency. (c) Sound pressure level.
Applsci 15 05950 g012
Figure 13. Pareto front.
Applsci 15 05950 g013
Figure 14. Sections at different heights perpendicular to the axis of the impeller.
Applsci 15 05950 g014
Figure 15. Static pressure nephogram of each section before optimization.
Applsci 15 05950 g015
Figure 16. Static pressure nephogram of each section after optimization.
Applsci 15 05950 g016
Figure 17. Velocity–streamline nephogram of each section before optimization.
Applsci 15 05950 g017
Figure 18. Velocity–streamline nephogram of each section after optimization.
Applsci 15 05950 g018
Figure 19. Turbulent kinetic energy nephogram of each section before optimization.
Applsci 15 05950 g019
Figure 20. Turbulent kinetic energy nephogram of each section after optimization.
Applsci 15 05950 g020
Figure 21. Pressure pulsation at detection points near the volute tongue before and after optimization. (a) p1 pressure pulsation. (b) p2 pressure pulsation. (c) p3 pressure pulsation.
Applsci 15 05950 g021
Figure 22. Comparison of noise at far-field monitoring point before and after optimization.
Applsci 15 05950 g022
Table 1. Initial parameters of the centrifugal fan.
CategoryParameterValue
Structural ParametersBlade inlet angle90°
Blade outlet angle139°
Volute tongue radius13 mm
Number of blades41
Operational ParametersImpeller speed4202 r/min
Rated flow rate500 m3/h
Table 2. Design parameters and boundary conditions.
ParameterSymbolBoundary Conditions
Blade Inlet Angle β i 80°~115°
Blade Outlet Angle β o 129°~149°
Volute Tongue Radius R v , s 16 mm~25 mm
Blade Tip Chamfer Angle θ 10°~40°
Table 3. Comparative analysis of LBWO, NSGA-III, and NSGA-III-LBWO.
CategoryLBWONSGA-IIINSGA-III-LBWO
Core MechanismLogistic chaotic initialization + Levy flight searchNon-dominated sorting + Reference point mechanismHybrid of LBWO and NSGA-III, dynamically generates Pareto offspring
Advantages1. Strong global search
2. High population diversity
1. High-dimensional multi-objective optimization
2. Uniform solution distribution
1. Global–local balance
2. High-quality solutions (verified in engineering applications)
LimitationsSingle-objective, prone to local optimaSlow convergence, weak local searchParameter sensitivity, moderate computational cost
SummaryNSGA-III-LBWO integrates the global search capability of single-target LBWO and the diversity maintenance mechanism of multi-target NSGA-III, realizing the complementary advantages of both.
Table 4. Information of some sample points and calculations.
Design VariablesOptimization Objectives
β i / ° β o / ° R v , s / m m θ / ° P t o t a l / P a η / % L p / d B
99.72141.4923.6513.251237.4656.4856.39
100.57143.8119.5328.71268.5357.456.73
102.94133.6617.9322.981175.3855.1855.85
102.28141.8419.8614.791226.455.4755.63
82.98132.6624.3933.031183.2257.7756.77
104.52129.2219.2514.451074.0452.9153.87
93.33135.7719.0438.951168.3156.4654.11
93.83131.6919.3934.811114.8252.7952.26
84.12135.4220.6816.181223.6759.4156.83
93.19146.3623.7334.011314.6159.0557.64
Table 5. Comparison of predicted results.
ModelRMSEMAER2
Total pressureBP35.8229.180.74
wPSO-BP17.7413.740.93
EfficiencyBP2.301.71<0
wPSO-BP0.580.500.92
Sound pressure levelBP1.811.560.43
wPSO-BP0.700.610.91
Table 6. Comparison of results before and after optimization.
β i / ° β o / ° R v , s / m m θ / ° P t o t a l / P a η / % L p / d B
Prototype fan9013912.8701275.8960.0757.75
Optimized fan98.81147.0617.4739.851310.6860.7456.02
Disclaimer/Publisher’s Note: The statements, opinions and data contained in all publications are solely those of the individual author(s) and contributor(s) and not of MDPI and/or the editor(s). MDPI and/or the editor(s) disclaim responsibility for any injury to people or property resulting from any ideas, methods, instructions or products referred to in the content.

