Article

Centralized Shared Energy Storage Optimization Framework for AC/DC Distribution Systems with Dual-Time-Scale Coordination

1
State Key Laboratory of Intelligent Power Distribution Equipment and System, Tianjin University, Tianjin 300072, China
2
Institute of Energy Storage Science and Engineering, Tianjin University, Tianjin 300354, China
*
Author to whom correspondence should be addressed.
Appl. Sci. 2025, 15(11), 5941; https://doi.org/10.3390/app15115941
Submission received: 18 April 2025 / Revised: 22 May 2025 / Accepted: 23 May 2025 / Published: 25 May 2025

Abstract

Conventional shared energy storage (SES) allocation and coordinated operation mechanism are mismatched with the actual time-varying demand of the distribution system, resulting in low utilization of energy storage and renewable energy sources (RES), which restricts the system operational efficiency and RES integration. To solve this issue, this paper proposes a centralized shared energy storage (CSES) optimization framework for AC/DC distribution systems with dual-time-scale coordination to address this issue. Firstly, optimal scheduling models for AC/DC distribution systems are formulated. Secondly, a novel CSES optimization framework is established where a large-scale CSES directly connects to multiple subnetworks. This framework maximizes RES utilization by coordinating CSES operation, leveraging complementary RES potential. Thirdly, based on dual-time-scale coordination, intraday stage adjustments are made based on the day-ahead scheduling to accommodate and coordinate with source–load changes. Day-ahead SOC trajectory is processed using linear interpolation to obtain intraday SOC trajectory, ensuring that the state of charge (SOC) constraints are satisfied. An alternating direction multiplication method (ADMM) algorithm is used to coordinate the intraday optimization. Finally, case studies on an AC/DC distribution system comprising three IEEE 33-node AC subnetworks show that the proposed strategy can increase the RES utilization rate to 99.31%, 88.10%, and 99.91%, and reduce the operational cost by 16.51%.

1. Introduction

With the rapid development of power electronic technology, the integration of the RES and energy storage system (ESS) has significantly transformed distribution systems [1,2]. The proportion of distributed resources and DC-compatible technologies has increased dramatically, making AC/DC distribution systems particularly advantageous for accommodating diverse generation types and enhancing system flexibility [3,4]. However, AC/DC distribution systems face multiple challenges: large-scale penetration of intermittent RESs, coordinated operation requirements, and the temporal–spatial imbalance of source-load relationships across subnetworks [1]. Conventional individual ESS configurations, while attempting to resolve source–load mismatches locally, often result in suboptimal RES utilization [4]. CSES emerges as a promising alternative that can leverage complementary characteristics to improve system-wide efficiency while addressing coordination challenges [5]. Developing effective optimal scheduling mechanisms that simultaneously enhance RES utilization and meet system coordination needs has become a crucial research direction for next-generation distribution systems.
When solving complex optimization problems, distributed algorithms, particularly the ADMM, have shown significant advantages. Table 1 summarizes the state-of-the-art applications of ADMM in power electronics and power systems with their scale-time differences. The studies in [6,7,8,9,10,11] employ the ADMM method to address optimization problems in AC/DC distribution networks or integrated energy systems, with scales ranging from buildings and 33-node distribution networks to larger, more complex systems, and time scales from minutes to hours. The studies in [12,13,14,15,16], on the other hand, focus on the control of power electronic devices at scales ranging from small subsystems, such as at the controller level, to wind farms with about 30 wind turbines (WT), and on time scales ranging from milliseconds to seconds.
Based on the comparison in Table 1, ADMM offers distinct advantages for the optimization framework, especially for 15-min intraday coordination. As systems become more complex, centralized methods face computational burdens and privacy concerns. ADMM enables the framework to decompose the problem naturally along network boundaries, where subnetworks share only basic power information. This approach preserves operational privacy, reduces communication, and efficiently handles the coupling constraints. ADMM’s mathematical structure works well for the optimization framework, providing good convergence properties while accommodating the time-scale requirements of distribution system operations.
Energy storage is an essential component of modern distribution systems, playing a key role in improving system operational efficiency and economic benefits. Energy storage technologies for power systems can be categorized based on storage medium, ownership structure, and operational architecture. This paper focuses primarily on electrochemical battery energy storage systems (BESS) due to their rapid response characteristics, modular scalability, and declining cost trends [17]. While other storage technologies, such as chemical, solid, gravity, and heat storage, exist, they face geographical constraints or have lower energy density profiles that limit their application in distribution systems [18,19]. In terms of operational architecture, conventional individual ESSs are independently operated and typically serve single network segments. However, traditional individual ESSs face limitations such as capacity surplus or shortage, low operational efficiency, and limited regulation capabilities [20]. SES enables multiple stakeholders to access storage capacity through various market mechanisms. CSES refers to the unified construction of ESSs designed for regulation and use by multiple users. SES involves individual users offering their idle ESS to meet the regulatory needs of other users [21]. Numerous studies have explored the feasibility and advantages of SES in distribution systems.
Previous research on SES has extensively explored economic efficiency and market mechanisms. In [4], Nash bargaining game theory is employed to model interactions in multi-microgrid systems with SES. Other studies have explored multi-time-scale resource allocation, combining long-term contracts with real-time rentals to enhance profitability [22]. While these studies advance economic operation, the challenge of integrating diverse storage types across various timescales persists. The study in [23] detailed a comprehensive three-stage multi-timescale optimization for IES with various generalized energy storage (GES). While our study specifically addresses CSES in AC/DC distribution systems, our parameters focus on AC subnetworks, a DC ring, and CSES SOC within a dual-time-scale (day-ahead/intraday) framework, optimizing power flow and RES utilization. This differs from the multi-energy, multi-GES, three-stage robust optimization in [23] as we concentrate on CSES challenges and ADMM-based RES coordination in AC/DC contexts.
Recognizing the need for coordination in SES operations, research has also focused on optimal scheduling strategies. Innovative mechanisms such as energy sharing clouds for smart microgrids [24] and peer-to-peer energy sharing frameworks for buildings [25] have also been developed. Furthermore, decentralized schemes leveraging blockchain for SES market evaluation have been proposed [26]. Cooperative game-based models have been formulated for local integrated energy systems [27]. To address distributed coordination challenges, modified ADMM algorithms have been proposed in [28]. Optimal scheduling of clustered micro-energy grids with SES has also been investigated using cooperative game models for balanced profit allocation [29]. However, these coordination-centric approaches, while effective in their specific contexts, often inadequately utilize the temporal and spatial complementarity of RES across interconnected AC/DC subnetworks. This limits the potential for maximizing system-wide RES utilization.
In summary, the parameters, performance, and interrelationships of different energy storage operation architectures can be derived as shown in Table 2:
As shown in Table 2, conventional individual ESS primarily serves the owner and lacks a sharing mechanism. SES, while enabling sharing, often aggregates decentralized resources. Users are limited by pre-allocated capacity; individuals participating in the SES can share storage capacity but not the energy stored, thus preventing optimal system coordination. This limitation in sharing capability restricts its application within the framework proposed in this paper. However, in CSES, a unified entity operates a centralized energy storage system, enabling dynamic sharing of both capacity and energy.
In the field of AC/DC distribution system optimal scheduling, research has primarily focused on enhancing operational efficiency and integrating diverse resources. Decentralized operation strategies employing analytical target cascading [30] or ADMM [6,7,8] have been developed to reduce reliance on central controllers. In parallel, efforts have focused on multi-stage energy management, with schemes combining day-ahead network reconfiguration and real-time optimal power flow [31], and developing overvoltage-averse dispatch models for renewable-rich networks [32]. To address uncertainties, particularly from RES, studies have used sophisticated methods such as robust optimization [33] and distributionally robust chance-constrained optimization [34]. Despite these advances in AC/DC distribution system operations, significant research gaps persist: existing approaches lack comprehensive dual-time-scale coordination mechanisms for CSES and do not adequately leverage complementary characteristics across subnetworks.
Building upon these developments and addressing the identified research gaps, this paper proposes a CSES optimization framework for AC/DC distribution systems with dual-time-scale coordination. The primary contributions of this work are as follows:
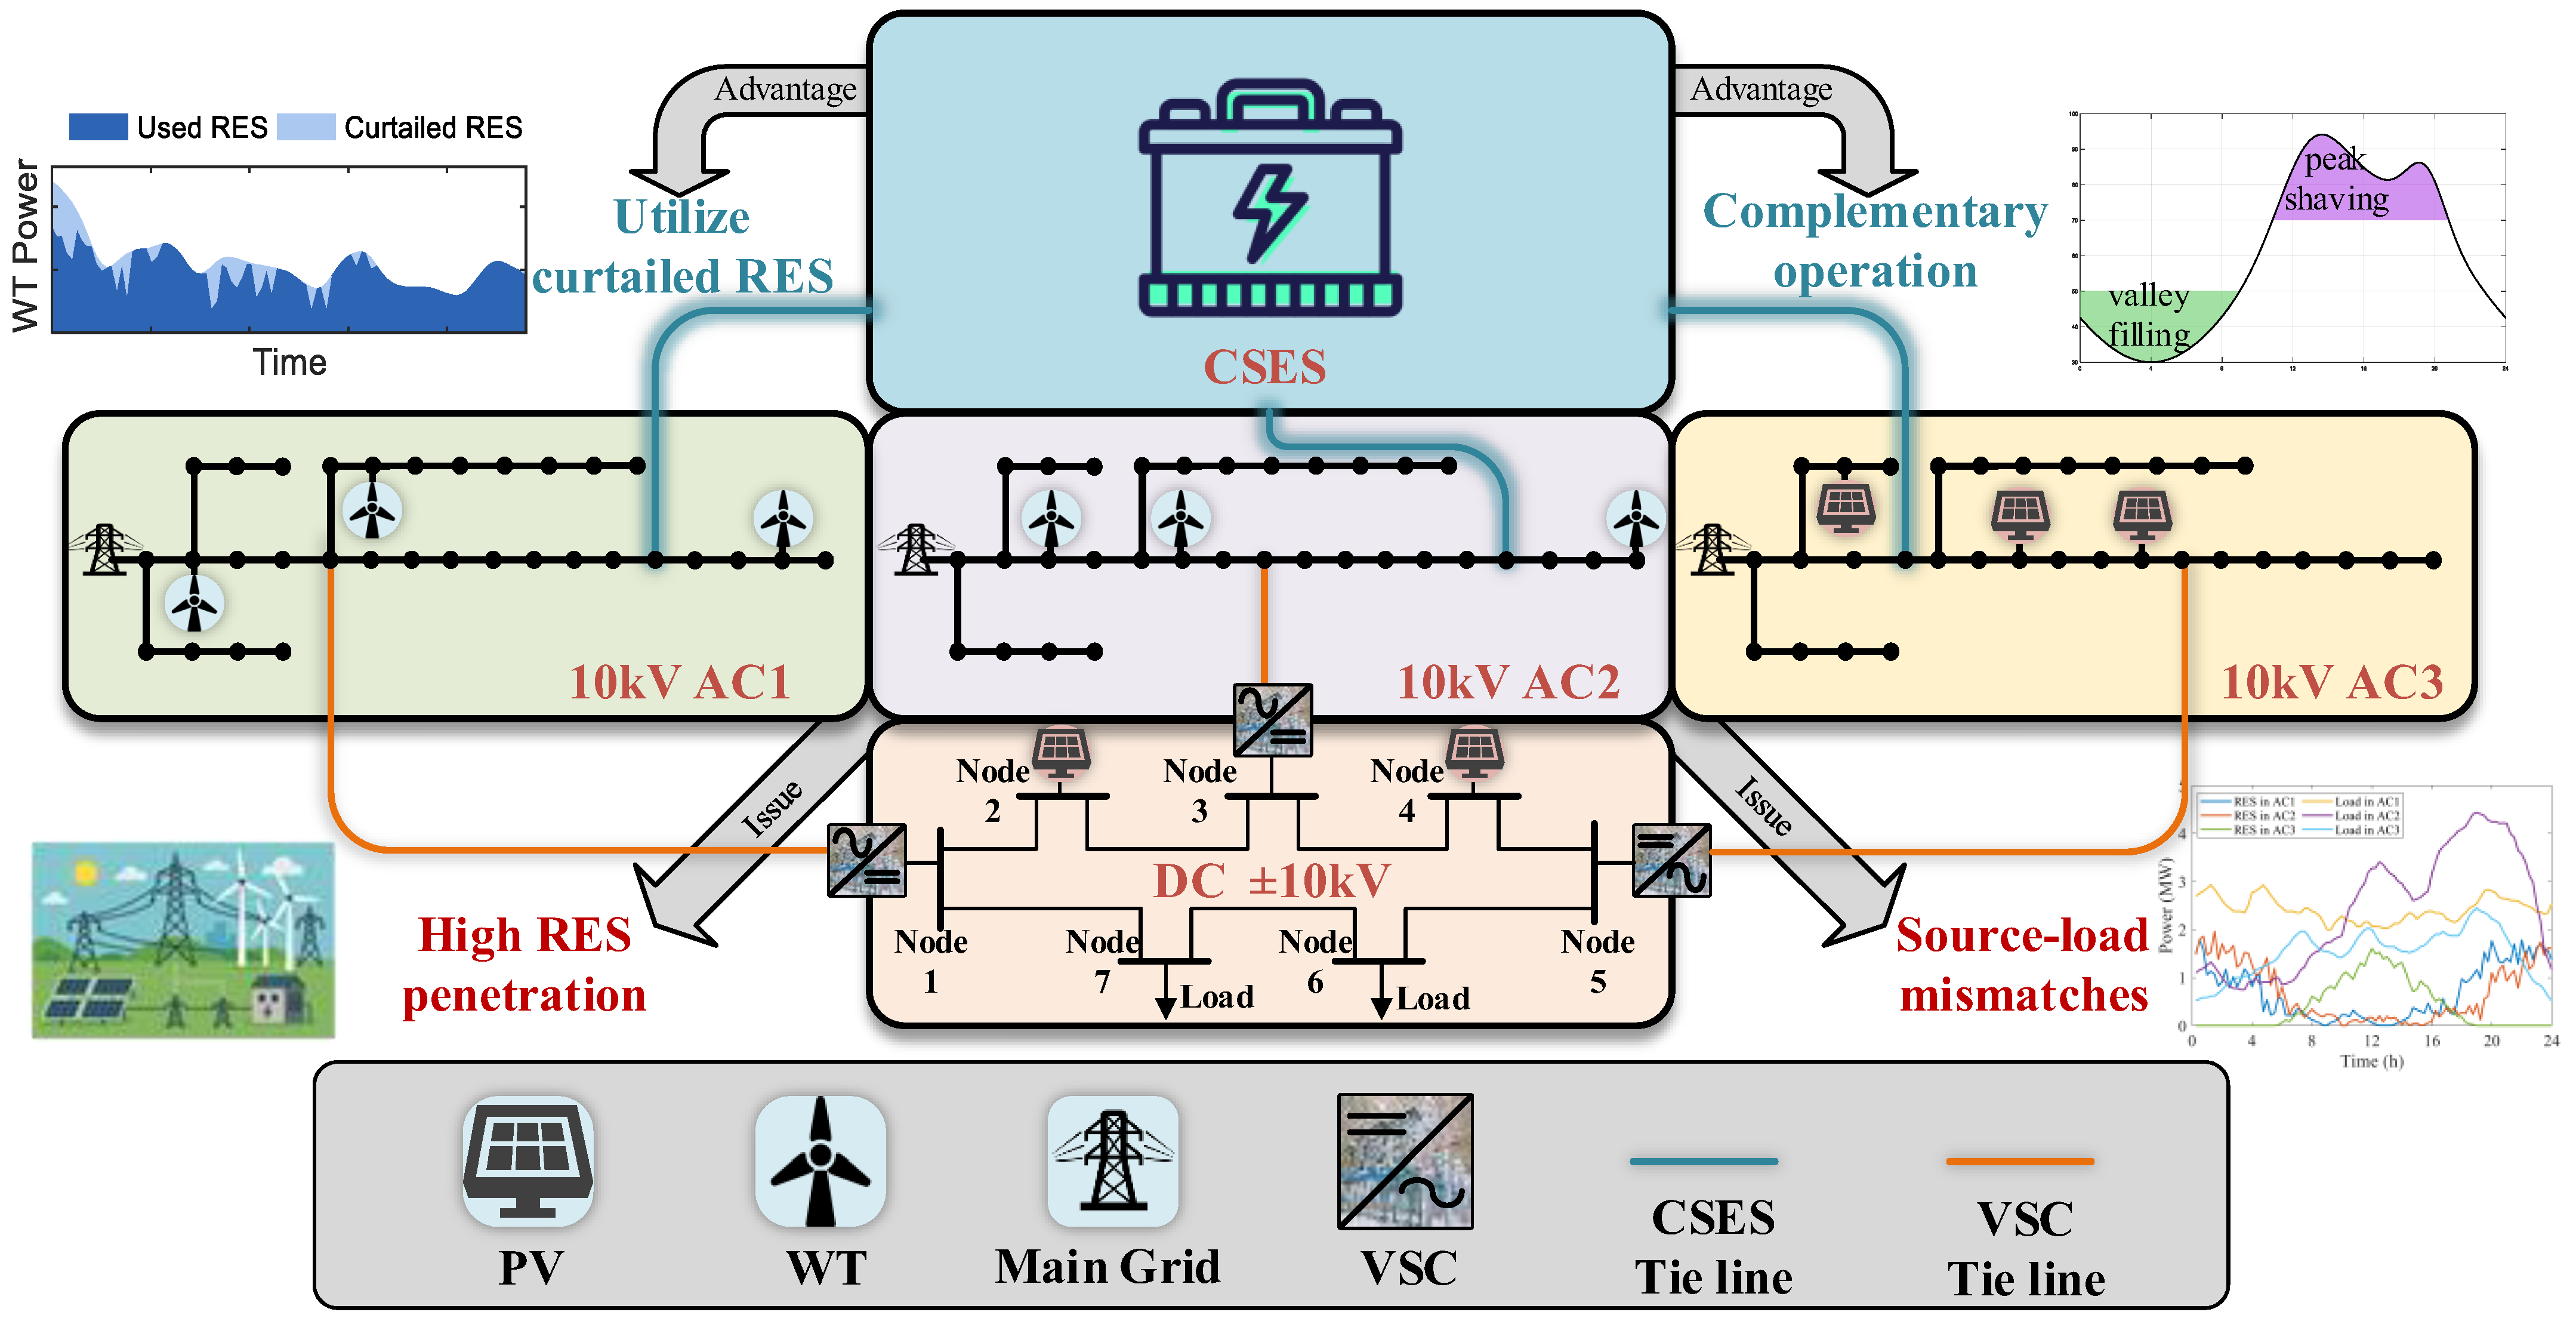
  • A novel CSES optimization framework is established, where a large-scale CSES directly connects to multiple AC subnetworks. By leveraging temporal and spatial differences in RES and load profiles across subnetworks, complementary operation is achieved, thereby effectively enhancing the utilization of RES.
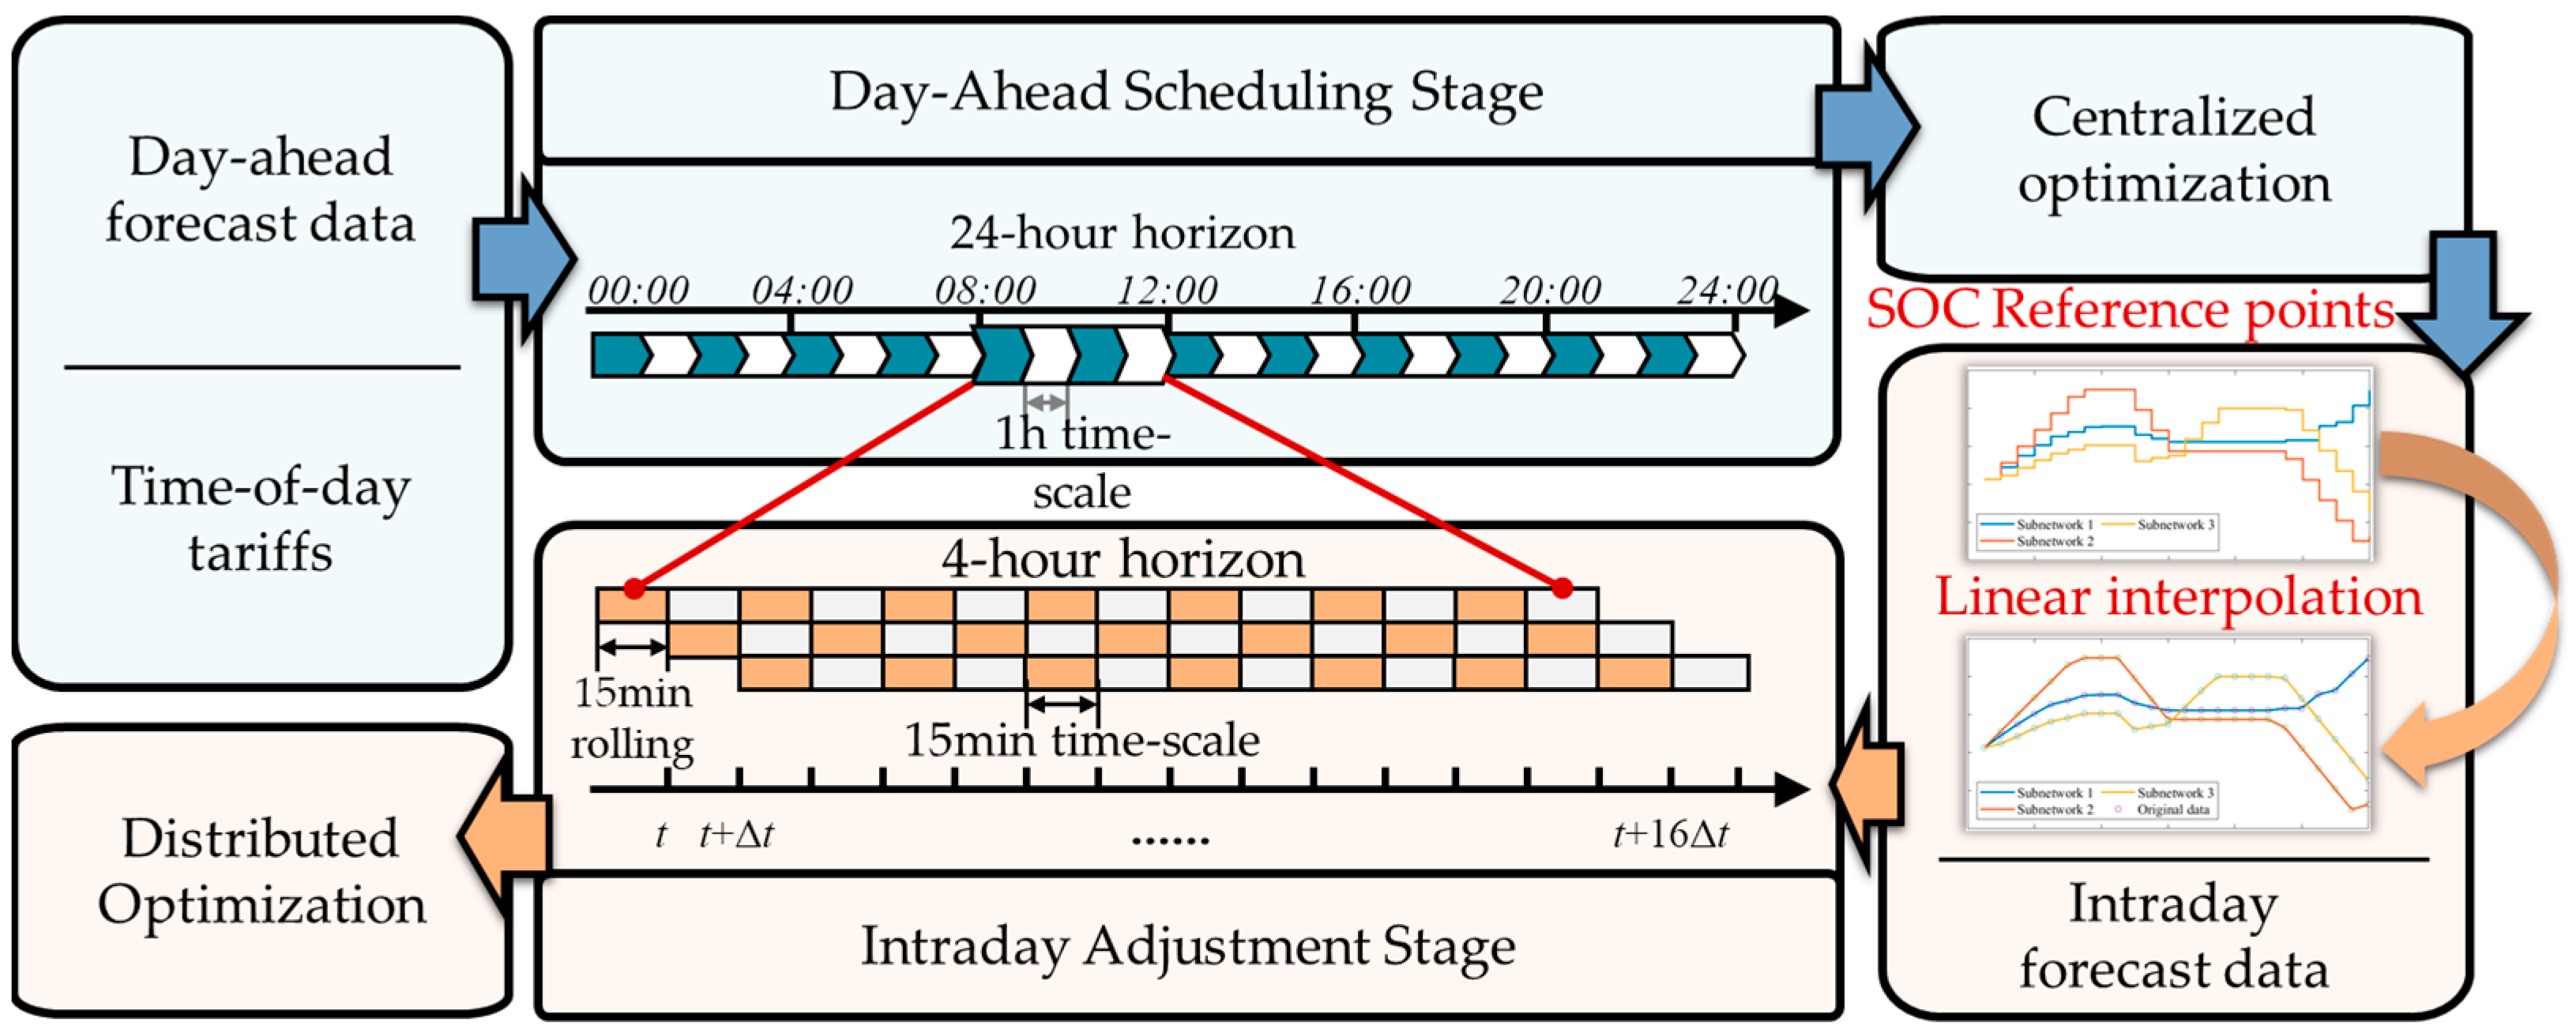
  • A dual-time-scale coordination optimal scheduling with ADMM is proposed, combining day-ahead scheduling with intraday adjustments. Day-ahead SOC trajectory is converted to an intraday SOC trajectory through linear interpolation, maintaining SOC constraint compliance. This approach effectively manages CSES while addressing source–load imbalance between subnetworks.
The remainder of this paper is organized as follows. Section 2 formulates the operation optimization models for AC/DC distribution systems. Section 3 presents the CSES optimization framework with dual-time-scale coordination. Section 4 demonstrates the effectiveness of the proposed method through case studies. Finally, Section 5 concludes the paper and outlines directions for future research.

2. Optimal Scheduling Models for AC/DC Distribution Systems

2.1. Objective Function

The optimal scheduling of AC/DC distribution systems aims to minimize the total operational cost. The objective function consists of multiple components related to different aspects of system operation.

2.1.1. AC Subnetwork Operational Cost

For each AC subnetwork, the operational cost includes both the cost of purchased power from the main grid and the cost associated with network losses, as shown in Equation (1):
C AC , e = t T j B e T R λ t T R P j , t T R + t T i j L e AC λ l o s s r i j AC I ˜ i j , t AC
where B e T R is the set of substation nodes in AC subnetwork e; P j , t T R is the power purchased by AC subnetwork e from the main grid at node j at time t; L e AC is the set of branches in AC subnetwork e; and I ˜ i j , t AC is the squared AC current magnitude on branch ij at time t.

2.1.2. DC Ring Network Operational Benefit

The DC ring network facilitates power exchange between AC subnetworks, generating benefits through energy transfer, as shown in Equation (2):
C DC = t T j B DC λ t VSC , DC P j , t VSC , DC
where P j , t VSC , DC is the power exchanged through the voltage source converter (VSC) at node j at time t; and B DC is the set of DC ring network nodes.

2.1.3. Conventional Individual ESS Operational Cost

The operational cost of conventional individual ESS is shown in Equation (3):
C ESS = e E t T j B e AC c o p ( P j , t c h , ESS + P j , t d c h , ESS )
where P j , t c h , ESS and P j , t d c h , ESS are the charging and discharging power at node j at time t; E is the set of distinct networks (AC subnetworks and DC ring network); and B e AC is the set of nodes in AC subnetwork e.

2.1.4. Integrated Objective Function

The integrated objective function for the optimal scheduling of the AC/DC distribution system is formulated as Equation (4):
min C t o t a l = e E C AC , e C DC + C ESS
This objective function synthesizes the costs and benefits from individual system components, providing a unified objective for optimization strategy.

2.2. AC Subnetwork Constraints

The AC subnetwork operation is subject to various constraints to ensure feasibility and operational integrity.

2.2.1. AC Power Flow Constraints

The AC power flow constraints are modeled using Equations (5)–(8) from [7]:
U ˜ j , t AC U ˜ i , t AC = 2 ( r i j AC P i j , t AC + x i j AC Q i j , t AC ) ( r i j AC 2 + x i j AC 2 ) I ˜ i j , t AC , i j L e AC , t T
P j , t i n j k : j k P j k , t AC + i : i j ( P i j , t AC r i j AC I ˜ i j , t AC ) = 0 , j B e AC , t T
Q j , t i n j k : j k Q j k , t AC + i : i j ( Q i j , t AC x i j AC I ˜ i j , t AC ) = 0 , j B e AC , t T
2 P i j , t AC 2 Q i j , t AC I ˜ i j , t AC U ˜ j , t AC 2 I ˜ i j , t AC + U ˜ j , t AC , i j L e AC , t T
where U ˜ j , t AC and U ˜ i , t AC are the squared AC voltage magnitudes at nodes j and i at time t; P i j , t AC and Q i j , t AC are the active and reactive power flows on branch ij at time t; and P j , t i n j and Q j , t i n j are the injected active and reactive power at node j at time t.

2.2.2. Conventional Individual ESS Constraints

Conventional individual ESSs are typically used in distribution systems where each ESS is subject to fixed capacity and other constraints [6], as detailed in Equations (9)–(14):
0 P j , t c h , ESS μ j , t c h , ESS P j c h , m a x , ESS , j B e AC , t T
0 P j , t d c h , ESS μ j , t d c h , ESS P j d c h , m a x , ESS , j B e AC , t T
μ j , t c h , ESS + μ j , t d c h , ESS 1 , j B e AC , t T
E j , t + 1 ESS = E j , t ESS + η c h P j , t c h , ESS Δ t P j , t d c h , ESS Δ t η d c h , j B e AC , t T
E m i n , ESS E j , t ESS E m a x , ESS , j B e AC , t T
E j , T ESS = E j , 0 ESS , j B e AC
where μ j , t c h , ESS is the charging state 0–1 variable, 0 means not charging, 1 means charging; μ j , t d c h , ESS is the discharging state 0–1 variable, 0 means not discharging, 1 means discharging; and E j , t ESS is SOC at node j at time t.

2.2.3. Power Balance Constraints

The power balance at each node must be maintained according to Equations (15) and (16):
P j , t i n j = P j , t T R + P j , t PV + P j , t WT + P j , t d c h , ESS P j , t c h , ESS P j , t l o a d P j , t VSC , AC , j B e AC , t T
Q j , t i n j = Q j , t T R Q j , t l o a d Q j , t VSC , AC , j B e AC , t T
where P j , t PV is the photovoltaics (PV) output power at node j at time t; P j , t WT is the WT output power at node j at time t; Q j , t T R is the reactive power purchased from the main grid at node j at time t; and P j , t VSC , AC and Q j , t VSC , AC are the VSC active and reactive power on the AC side at node j at time t.

2.2.4. Transmission Power Constraints

The power exchange with the main grid must satisfy Equations (17) and (18):
P T R , m i n P j , t T R P T R , m a x , j B e T R , t T
Q T R , m i n Q j , t T R Q T R , m a x , j B e T R , t T
where P T R , m i n , P T R , m a x , Q T R , m i n , and Q T R , m a x are the lower and upper limits of active and reactive power purchased from the main grid.

2.2.5. RES Output Constraints

Due to the high penetration of RES, the system is unable to fully absorb its generation. RES power curtailment arises from the mismatch between RES output and load demand during periods of high RES generation and low energy consumption.
The PV output power is constrained by Equation (19). When the available PV generation exceeds the system’s consumption capacity, the surplus between P ¯ j , t PV and P j , t PV represents curtailed PV power.
0 P j , t PV P ¯ j , t PV , j B e AC , t T
where P ¯ j , t PV is the maximum available PV output power at node j at time t.
The WT output power is constrained by Equation (20). When the available WT generation exceeds the system’s consumption capacity, the surplus between P ¯ j , t WT and P j , t WT represents curtailed WT power.
0 P j , t WT P ¯ j , t WT , j B e AC , t T
where P ¯ j , t WT is the maximum available WT output power at node j at time t.
When RES output exceeds the difference between load and the minimum transmission power, surplus RES power must be curtailed to maintain supply–demand balance. This challenge can be mitigated by increasing system flexibility resources, such as ESS [35].

2.2.6. Operational Safety Constraints

P i j AC , m i n P i j , t AC P i j AC , m a x , i j L e AC , t T
Q i j AC , m i n Q i j , t AC Q i j AC , m a x , i j L e AC , t T
U j AC , m i n U j , t AC U j AC , m a x , j B e AC , t T
I i j AC , m i n I i j , t AC I i j AC , m a x , i j L e AC , t T

2.3. DC Ring Network Constraints

The DC ring network operation is subject to various constraints to ensure feasibility and operational integrity.
The DC power flow constraints are modeled using Equations (25)–(27) from [6]:
U ˜ j , t DC U ˜ i , t DC = 2 r i j DC P i j , t DC ( r i j DC ) 2 I ˜ i j , t DC i j L DC , t T
P j , t i n j k : j k P j k , t DC + i : i j ( P i j , t DC r i j DC I ˜ i j , t DC ) = 0 , j B DC , t T
2 P i j , t DC I ˜ i j , t DC U ˜ j , t DC 2 I ˜ i j , t DC + U ˜ j , t DC , i j L DC , t T
where U ˜ i , t DC and U ˜ j , t DC are the squared DC voltage magnitudes at nodes i and j at time t; P i j , t DC is the DC power flow on branch ij at time t; L DC is the set of branches in the DC ring network; and I i j , t DC is the squared DC current magnitude on branch ij at time t.
The power balance at each DC node must be maintained according to Equation (28):
P j , t i n j = P j , t PV + P j , t VSC , DC P j , t l o a d , j B DC , t T
DC operational safety constraints and RES output constraints are similar to those of the AC subnetwork, as shown in Equations (19)–(24), but do not contain reactive power constraints, which will not be repeated here.

2.4. VSC Constraints

Each AC subnetwork in the system interacts with the DC ring network through the VSC for power interaction, and in this paper, the VSC current model has been transformed by second-order cone–convex relaxation and linearized by circular constraints [36,37].
The power balance across the VSC must be maintained according to Equations (29) and (30):
P j , t VSC , AC + P j , t VSC , DC = r j VSC I ˜ j , t VSC , j B VSC , t T
Q j , t VSC , AC Q j , t VSC = x j VSC I ˜ j , t VSC , j B VSC , t T
where P j , t VSC , AC and P j , t VSC , DC are the VSC power on the AC and DC sides at node j at time t; I ˜ j , t VSC is the squared current magnitude of VSC at node j at time t; Q j , t VSC , AC is the reactive power on the AC side at node j at time t; and Q j , t VSC is the reactive power provided by the VSC at node j at time t.
The VSC operation must satisfy Equation (31):
U j , t VSC = 3 3 μ M j VSC U j , t VSC , DC Q VSC , m i n Q j , t VSC Q VSC , m a x S j VSC P j , t VSC , DC S j VSC S j VSC Q j , t VSC S j VSC 2 S j VSC P j , t VSC , DC + Q j , t VSC 2 S j VSC 2 S j VSC P j , t VSC , DC Q j , t VSC 2 S j VSC , j B VSC , t T
where U j , t VSC is the equivalent VSC voltage magnitude at node j at time t; U j , t VSC , DC is the voltage magnitude on the DC side at node j at time t; and M j VSC is the modulation index of the VSC at node j and satisfies 0 ≤ M j VSC ≤ 1.
In this study, the DC voltage utilization rate μ is set to 0.866, in accordance with the standard steady-state VSC modeling widely adopted in the AC/DC distribution system optimization literature [31,38,39,40]. Although advanced PWM techniques such as third-harmonic injection can achieve higher values, such strategies are primarily relevant in converter-level control design and are not typically considered in system-level operational optimization studies. Therefore, for consistency and comparability with existing works, we set μ = 0.866 in our system-level optimization models.

3. CSES Optimization Framework with Dual-Time-Scale Coordination

3.1. System Description

With the high penetration of RES, issues such as source–load mismatch and difficulty in RES accommodation have adversely affected the economic and operational efficiency of AC/DC distribution systems. Unlike conventional individual ESS approaches where each subnetwork has its own independent ESS, the proposed CSES framework implements a shared energy storage paradigm where subnetworks collectively utilize a large-scale CSES. By coordinating the charging and discharging operations across multiple subnetworks, the framework exploits the complementary nature of RES patterns. For instance, when excessive RES occurs in one subnetwork, the surplus energy can be stored and later dispatched to other subnetworks experiencing power deficits. This approach enhances overall RES utilization and addresses the source–load mismatch issue.
Figure 1 illustrates the AC/DC distribution system with CSES connecting to N subnetworks through tie lines. The system comprises multiple AC subnetworks connected through a medium-voltage DC ring network [1,30]. Each AC subnetwork is based on the IEEE 33-node topology and contains various components, including distributed PV, WT, as well as local loads. The subnetworks are interconnected via a multi-terminal DC ring network operating at a rated voltage of ±10 kV, which serves as the backbone for energy exchange. All subnetworks share the capacity of the shared energy storage, allowing for more efficient use of storage resources compared to individual approaches. This enables the system to leverage temporal and spatial differences in RES and load across subnetworks.

3.2. Operational Models for CSES

3.2.1. Operational Constraints

Unlike conventional ESS constraints, CSES constraints are more flexible. CSES allows for varying capacities and enables the sharing of stored energy across subnetworks. These constraints can be categorized into power constraints, SOC constraints, and coordination constraints.
A.
Coordination Constraints:
The net power exchange between the CSES and the AC subnetworks is given by Equation (32):
P t CSES = P t d c h , CSES P t c h , CSES
where P t c h , CSES and P t d c h , CSES are the CSES charging and discharging power at time t.
The distribution of this power among subnetworks must satisfy Equation (33):
P t CSES = e E ( P e , t d c h , CSES P e , t c h , CSES ) , t T
where P e , t c h , CSES and P e , t d c h , CSES are the charging and discharging power allocated to subnetwork e at time t.
B.
SOC Constraints:
SOC of the CSES changes according to Equation (34):
E t + 1 CSES = E t CSES + η c h P t c h , CSES Δ t P t d c h , CSES Δ t η d c h , t T
where E t CSES is the SOC of the CSES at time t.
SOC of the CSES must be maintained within safe operational limits:
E m i n , CSES E t CSES E m a x , CSES , t T
Additionally, to ensure sustainable cyclic operation, the final SOC should return to the initial SOC:
E T CSES = E 0 CSES
C.
Power Constraints:
The charging and discharging power of the CSES must satisfy Equations (37)–(39):
0 P e , t c h , CSES μ e , t c h , CSES P e c h , m a x , CSES , e E , t T
0 P e , t d c h , CSES μ e , t d c h , CSES P e d c h , m a x , CSES , e E , t T
μ e , t c h , CSES + μ e , t d c h , CSES 1 , e E , t T
where μ e , t c h , CSES is the charging state 0–1 variable, 0 means not charging, 1 means charging; and μ e , t d c h , CSES is the discharging state 0–1 variable, 0 means not discharging, 1 means discharging. Equation (39) ensures that each subnetwork cannot charge and discharge simultaneously, although the CSES as a whole may be charging with some subnetworks while discharging with others at the same time.
The total charging and discharging power allocated to all subnetworks must not exceed the CSES capacity:
e E P e , t c h , CSES P c h , m a x , CSES
e E P e , t d c h , CSES P d c h , m a x , CSES

3.2.2. Operating Costs for CSES

The objective function related to the CSES operation focuses on operational costs and is calculated separately for each subnetwork, then aggregated to determine the total cost, as in Equation (42):
C CSES = e E C e CSES
where C e CSES represents the operational cost associated with subnetwork e’s utilization of the CSES, which can be expressed as Equation (43):
C e CSES = t T c o p ( P e , t c h , CSES + P e , t d c h , CSES )

3.3. Dual-Time-Scale Coordination

The CSES framework adopts a dual-time-scale approach that combines day-ahead scheduling with intraday adjustments, as shown in Figure 2.
The day-ahead scheduling establishes reference points to ensure that the CSES SOC constraints are met throughout the operational horizon. As actual RES and load patterns are realized, intraday adjustments are made to the pre-established reference points while ensuring that SOC constraints are met. Notably, the SOC reference points obtained from the day-ahead stage are linearly interpolated to obtain time-scale-matched, application-ready SOC trajectories in intraday. These trajectories are then distributed to individual subnetworks for distributed optimal scheduling. These adjustments enable the system to respond to real-time variations in RES while maintaining the overall operational integrity of the CSES.

3.3.1. SOC Linear Interpolation

A day-ahead SOC time series E day e = E 1 e , E 2 e , , E 24 e represents hourly intervals for AC subnetwork e, and an expanded time series E intra e = E 1 , e , E 2 , e , , E 96 , e is generated to represent 15-min intervals through Equation (44):
E j e = ( 1 α ) E k 1 e + α E k 2 e
where j 1 , 2 , , 96 is the index in the expanded time series; k 1 = j 1 4 + 1 is the lower original index; k 2 = min ( j 1 4 + 1 , 24 ) is the upper original index; α = j 1 4 j 1 4 is the interpolation coefficient; Applsci 15 05941 i001 represents the floor function (rounding down); and Applsci 15 05941 i002 represents the ceiling function (rounding up).
This formulation ensures that the expanded time series preserves all original data points ( E 4 k 3 e = E k e for k 1 , 2 , , 24 ) while providing continuous transitions between hourly intervals.
This refined approach prevents temporal SOC constraint violations that might occur due to communication delays in the ADMM algorithm. Additionally, each subnetwork receives only its corresponding SOC reference trajectory, maintaining operational privacy while ensuring system-wide optimization.

3.3.2. ADMM-Based Distributed Algorithm
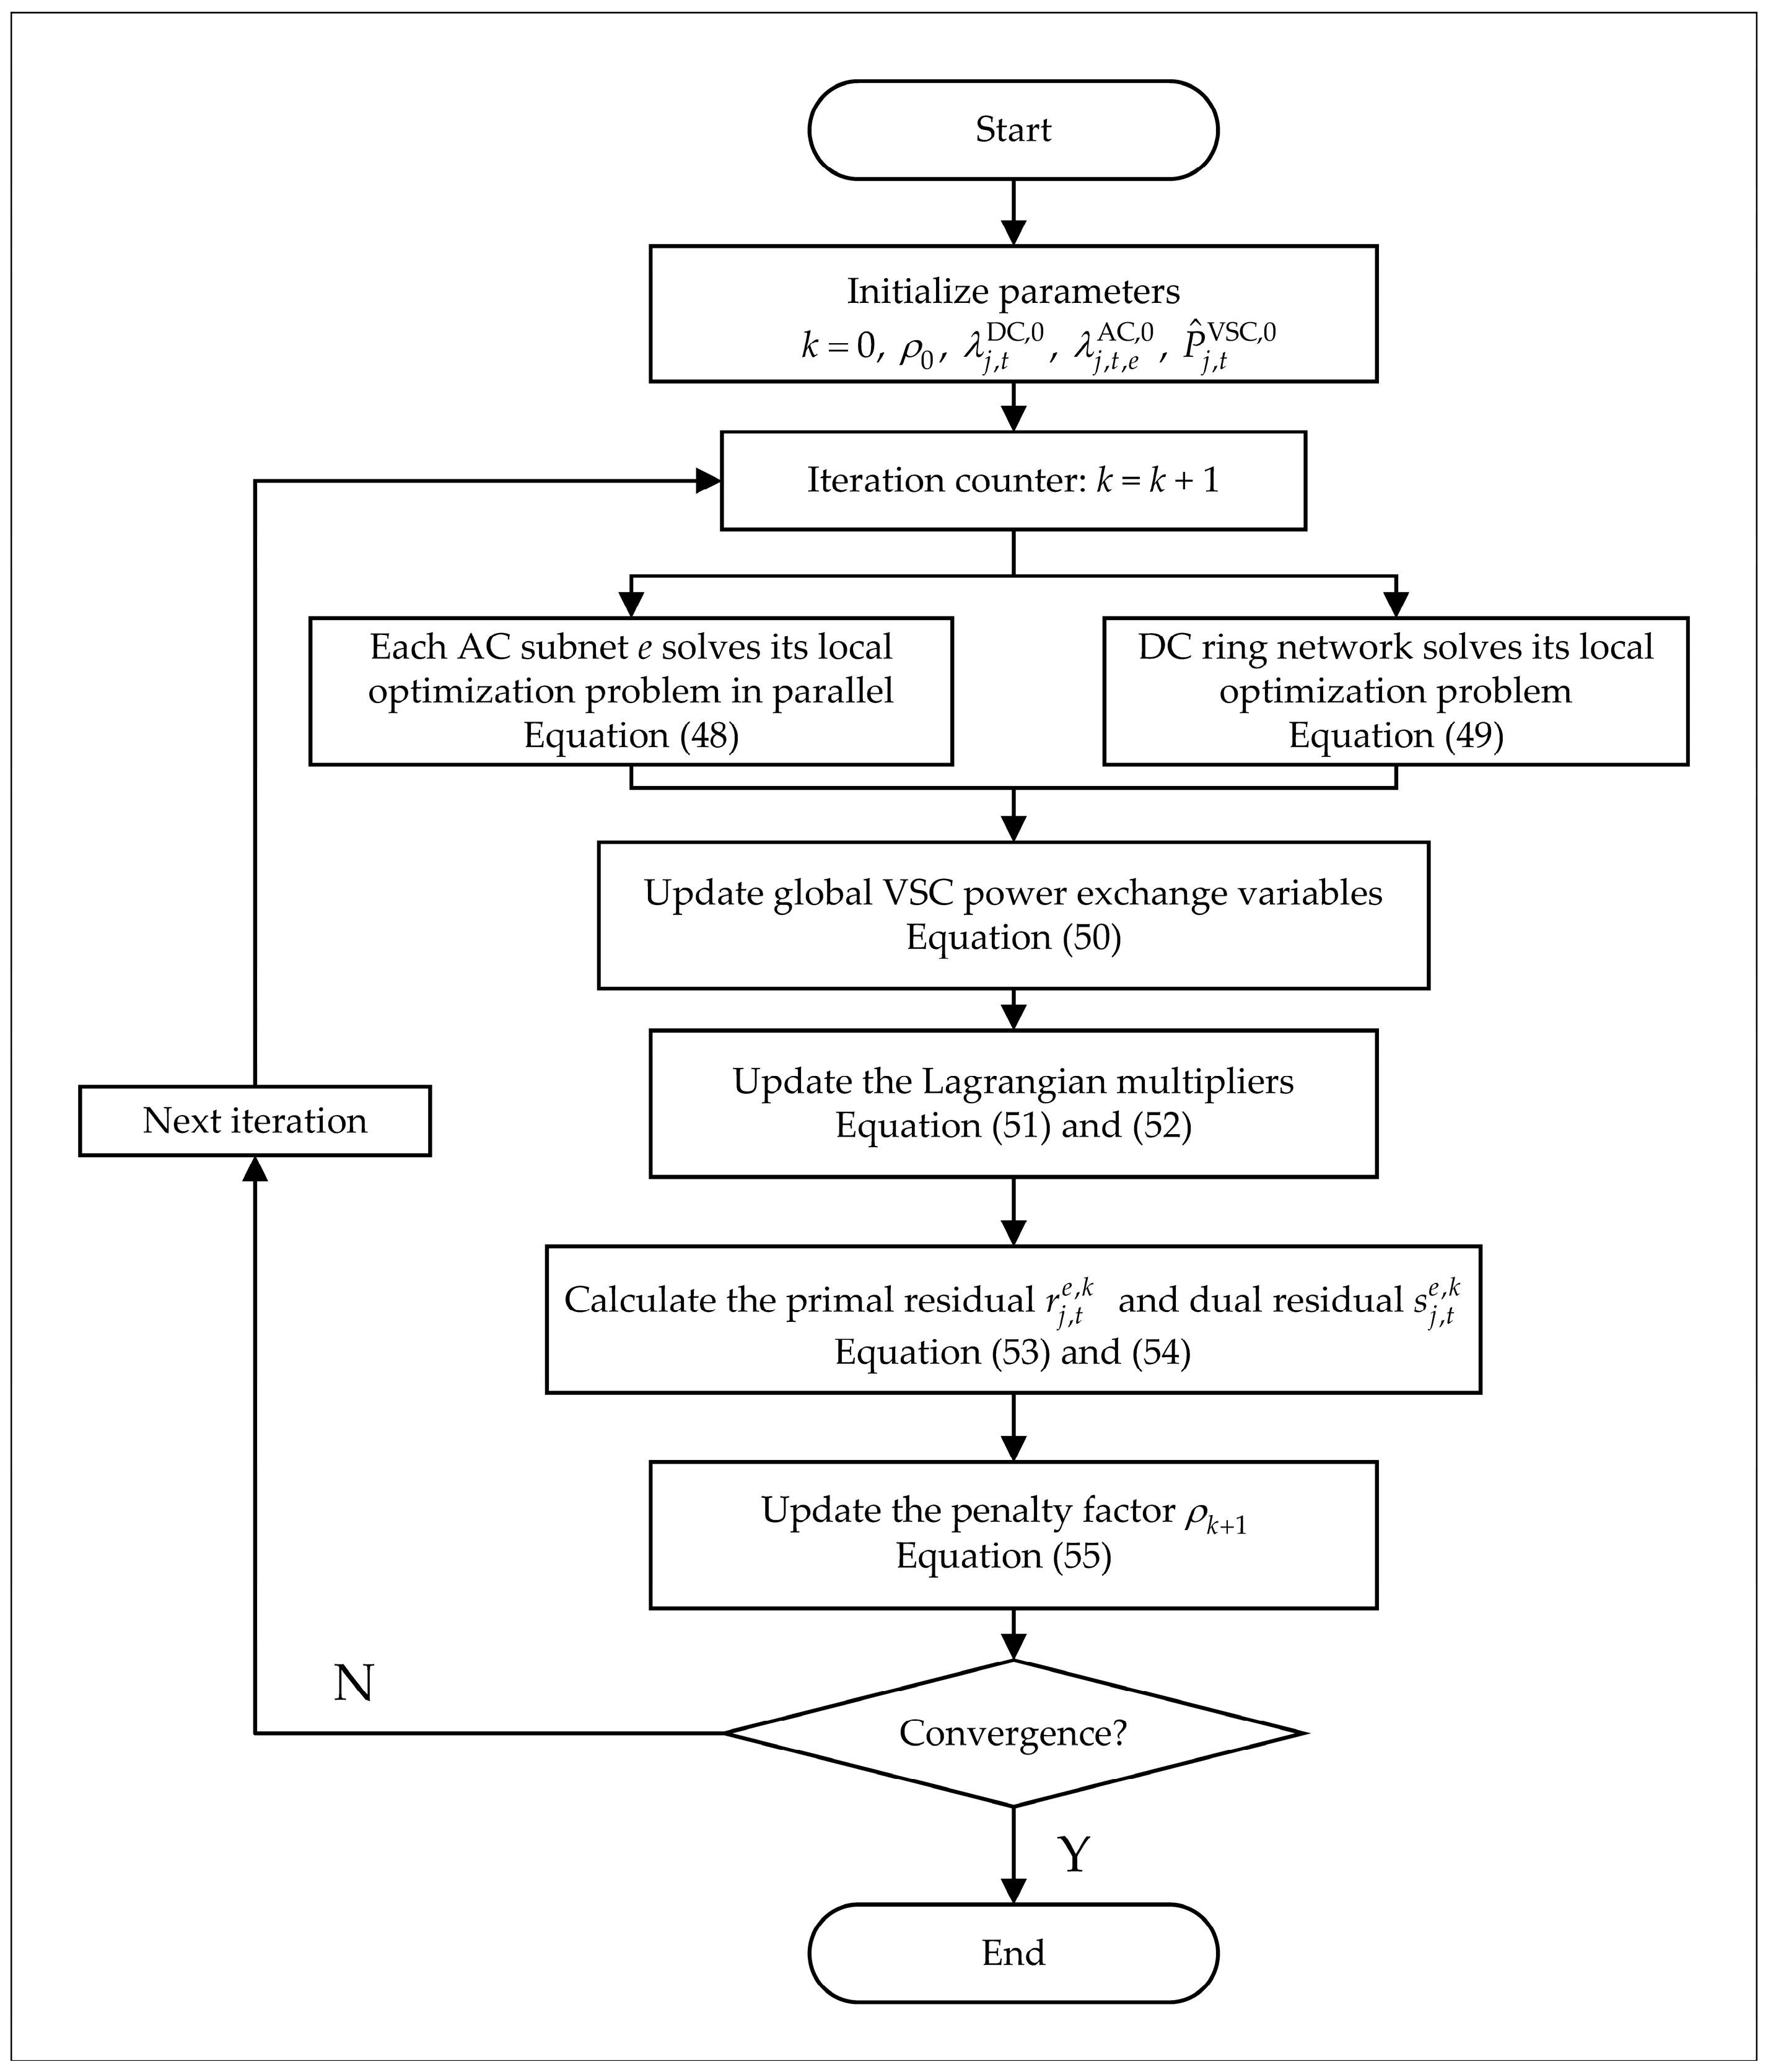
The intraday adjustment problem is complex as it involves multiple AC subnetworks interconnected through a DC ring network, each with its own operational issues and privacy concerns. The ADMM algorithm is particularly suitable as it allows decomposition based on the natural structure of the AC/DC distribution system. The key coupling variables are the power exchanges through VSCs, which must satisfy global power balance constraints.
Let P j , t VSC , e denote the actual VSC power exchange from the perspective of AC subnetwork e, P j , t VSC , DC denote the actual VSC power exchange from the DC ring network perspective, and P ^ j , t VSC denote the global VSC power exchange variables. The coupling constraints can be expressed as Equation (45):
P j , t VSC , e = P j , t VSC , DC , j B VSC , e E , t T
The augmented Lagrangian function is formulated as Equations (46) and (47):
L e = C AC , e + e E j B VSC t T λ j , t , e AC ( P j , t VSC , e P ^ j , t VSC ) + ρ k 2 e E j B VSC t T P j , t VSC , e P ^ j , t VSC 2 2
L DC = C DC + e E j B VSC t T λ j , t DC ( P j , t VSC , DC P j , t VSC , e ) + ρ k 2 e E j B VSC t T P j , t VSC , DC P j , t VSC , e 2 2
where λ j , t , e AC is the Lagrangian multiplier associated with the power consistency constraint for VSC j in AC subnetwork e at time t ; and λ j , t DC is the Lagrangian multiplier associated with the power consistency constraint for VSC j in DC subnetwork at time t .
The iterative process of the ADMM algorithm is shown in Figure 3:
  • Initialize parameters k = 0, ρ 0 ,   λ j , t DC , 0 ,   λ j , t , e AC , 0 ,   P ^ j , t VSC , 0 ;
  • Each subnetwork solves its local optimization problem, as shown in Equations (48) and (49):
    P j , t VSC , e , k + 1 = arg min L e ( P ^ j , t VSC , k , λ j , t , e AC , k )
    P j , t VSC , DC , k + 1 = arg min L DC ( P j , t VSC , e , k + 1 , λ j , t , e DC , k )
  • The DC ring network coordinator updates the global VSC power exchange variables:
    P ^ j , t VSC , k + 1 = P j , t VSC , e , k + 1 + P j , t VSC , DC , k + 1 2
  • The Lagrangian multipliers are updated:
    λ j , t , e AC , k + 1 = λ j , t , e AC , k + ρ ( P j , t VSC , e , k + 1 P ^ j , t VSC , k + 1 )
    λ j , t DC , k + 1 = λ j , t DC , k + ρ ( P j , t VSC , DC , k + 1 P j , t VSC , e , k + 1 )
  • The primal residual r j , t e , k and dual residual s j , t e , k are calculated:
    r j , t e , k = P j , t VSC , e , k + 1 P ^ j , t VSC , k + 1
    s j , t e , k = P ^ j , t VSC , k + 1 P ^ j , t VSC , k
  • An adaptive penalty parameter update strategy is adopted to accelerate convergence, with the penalty factor updated via Equation (55):
    ρ k + 1 = 0.5 ρ k , s j , t e , k 10 r j , t e , k , 2 ρ k , r j , t e , k 10 s j , t e , k , ρ k ,   otherwise  
Initial penalty parameter value (ρ0 = 1 × 10³) is selected based on empirical tuning, with considerations of problem scale and data magnitude.
7.
The convergence criterion is checked:
max { r j , t e , k s j , t e , k } ε ADMM , j B VSC , e E , t T
The iterative process continues until convergence, ensuring that the power consistency constraints in Equation (45) are satisfied. Each AC subnetwork solves its local optimization problem without sharing detailed operational information with other subnetworks. Furthermore, the AC subnetworks only communicate with the DC ring network coordinator, not directly with each other, further enhancing privacy.

4. Results and Discussions

4.1. Case Study

To validate the effectiveness of the proposed CSES optimization framework for AC/DC distribution systems with dual-time-scale coordination, comprehensive case studies are conducted on the AC/DC distribution system illustrated in Figure 1. The network comprises three IEEE 33-node AC subnetworks interconnected through a medium-voltage DC ring network. The simulation is implemented in MATLAB R2020a, with Gurobi 10.0.2 solver employed to solve the optimal scheduling problems.
For the comparative analysis, two BESS configurations with equivalent total capacities (12 MWh) and power ratings (1 MW per subnetwork) are implemented. The CSES connects to node 15 in three AC subnetworks, while the individual ESS deploys two units at nodes 15 and 32 in three AC subnetworks.
Detailed data of the AC network can be found in [41]. The interaction tariff for the DC ring network is set at 80% of the time-of-day tariff. Table 3 shows the parameters of the DC ring network lines. The system parameters are detailed in Table 4. Distributed generation (DG) resources and VSCs are strategically positioned across the distribution system, as detailed in Table 5. The time-of-day tariffs employed in the case studies are presented in Table 6.
Figure 4 demonstrates the forecasted RES and load power profile in each subnetwork at different time scales, with forecast curves derived from [42] and appropriately adjusted for the application to AC/DC distribution systems.
To comprehensively evaluate the proposed methodology, three distinct cases are established:
Case 1: Independent ESS Operation (IE)
In this case, each AC subnetwork operates with its individual ESS independently. The energy storage units are optimized to minimize individual subnetwork operational costs without coordination across the system.
Case 2: Capacity Leasing CSES Operation (CL-CSES)
This case implements CSES with fixed capacity leasing among subnetworks. Each subnetwork is allocated a predetermined shared energy storage capacity, and the complementary characteristics across subnetworks are not considered during the optimization process.
Case 3: Coordinated Optimization CSES Operation (CO-CSES)
The proposed methodology is implemented in this case, featuring coordinated optimization of CSES. This approach leverages the temporal–spatial complementarity of RESs and loads across subnetworks to optimize system-wide performance.

4.2. Analysis of Day-Ahead Optimization

During the day-ahead scheduling phase, three different cases are preliminarily optimized based on 24-h forecast data at a 1-h time scale to arrange electricity purchase plans, ESS, or shared energy storage charging/discharging schedules, serving as a reference for intraday optimization strategies. Notably, the CO-CSES not only generates charging/discharging scheduling plans for each AC subnetwork but also produces a day-ahead SOC trajectory, ensuring that the total SOC of the entire CSES remains within safe limits throughout. As a comparison, the CL-CSES uses the total charging/discharging power of each AC subnetwork obtained from CO-CSES optimization to represent the source–load difference and allocates the total 12 MWh shared energy storage capacity proportionally based on this difference. The results are shown in Table 7.
From Table 7, it can be observed that there are significant differences among the AC subnetworks. The AC1 subnetwork with a source–load difference of 6.9709 MWh receives a relatively low shared energy storage allocation proportion of 22.39%. The AC2 subnetwork has the highest source–load difference, accounting for 42.07% and, thus, receives the largest shared energy storage capacity allocation. And the capacity of the AC3 subnetwork is in the middle. This capacity allocation reflects CL-CSES’s consideration of the actual energy demand of each subnetwork.
Table 8 presents a comparative analysis of various costs across the three cases after day-ahead optimization. The data indicate that Case 3 (CO-CSES) achieves a total operational cost of CNY 40,097.62, representing significant reductions of CNY 4069.44 (9.21%) and CNY 3873.07 (8.81%) compared to Case 1 (IE) and Case 2 (CL-CSES), respectively. A detailed analysis of the cost components shows that the electricity purchase cost of Case 3 is CNY 4533.89 (6.45%) and CNY 4167.37 (5.96%) less compared to Case 1 and Case 2, respectively. These results demonstrate that the CO-CSES can adjust the shared energy storage allocation scheme dynamically according to the source–load characteristics of different subnetworks, reducing reliance on external grids while maintaining the same total energy storage capacity.
Table 9 provides an analysis of RES utilization rates across different AC subnetworks for each case. The data confirm that Case 3 demonstrates notable advantages in overall RES utilization. Specifically, for the AC1 subnetwork, Case 3 achieves 99.57% RES utilization, which is 5.02% and 4.80% higher than Case 1 and Case 2, respectively; for the AC2 subnetwork, Case 3 improves by 5.84% and 2.46% over the other cases; while for the AC3 subnetwork, all cases achieve high utilization rates (all above 98%). These results indicate that the CO-CSES, through centralized coordination of shared energy storage across subnetworks, can achieve higher RES utilization. The improvement is more significant for subnetworks with obvious source–load mismatch (e.g., AC1 and AC2).
Figure 5 presents the power equilibrium for the AC2 subnetwork. Comparative analysis reveals that Case 1 (IE, Figure 5a) and Case 2 (CL-CSES, Figure 5b) primarily differ during 1–5 h charging and 19–22 h discharging periods. CL-CSES provides enhanced power time-shifting capability based on leasing larger shared energy storage capacity, storing more electricity during early morning RES surplus periods and releasing more power during evening peak load hours. However, the fixed capacity leasing model restricts its charging/discharging behavior to patterns similar to IE, merely scaled up in magnitude, thus failing to exploit inter-network complementarity potential.
In contrast, Case 3 (CO-CSES, Figure 5c) effectively leverages the temporal–spatial complementarity of RES through the coordination framework. During 1–6 h RES surplus periods, the system both accommodates RES through VSC power exchange and stores substantial electricity via CSES. During 9–11 h, CSES discharges to replace VSC exchange, while also providing power support during 17 h and 22 h peak load hours to reduce electricity purchases. As demonstrated in Table 8 and Table 9, CO-CSES improves the AC2 subnetwork’s RES utilization rate from 85.23% (IE) to 91.07% while significantly reducing total operational costs.
As shown in Figure 4, source–load imbalances exist across AC subnetworks, necessitating different energy storage scheduling strategies to achieve peak shaving, valley filling, and cost minimization through optimal power allocation. Figure 6 and Figure 7 show the charging/discharging power and SOC trajectories for all AC subnetworks under the three cases.
Figure 4 demonstrates that the AC1 subnetwork has sufficient RES power after 16 h. However, as shown in Figure 6a, inadequate corresponding load results in temporal mismatches, preventing effective time-shifting utilization. Under the CO-CSES (Figure 7b), coordinated optimal scheduling enables surplus energy from the AC1 subnetwork to be stored and subsequently dispatched to power-deficient subnetworks, achieving system-wide optimal allocation.
Under the CL-CSES (Figure 7a), capacity leasing allocation enhances RES utilization with charging/discharging patterns similar to CO-CSES. However, fixed shared energy storage capacity limits CSES utilization efficiency, as evidenced by SOC trajectories failing to reach upper limits during operational cycles. Notably, all cases maintain operational continuity and safety by ensuring consistent initial/final SOC values while observing safe SOC constraints throughout the scheduling period.

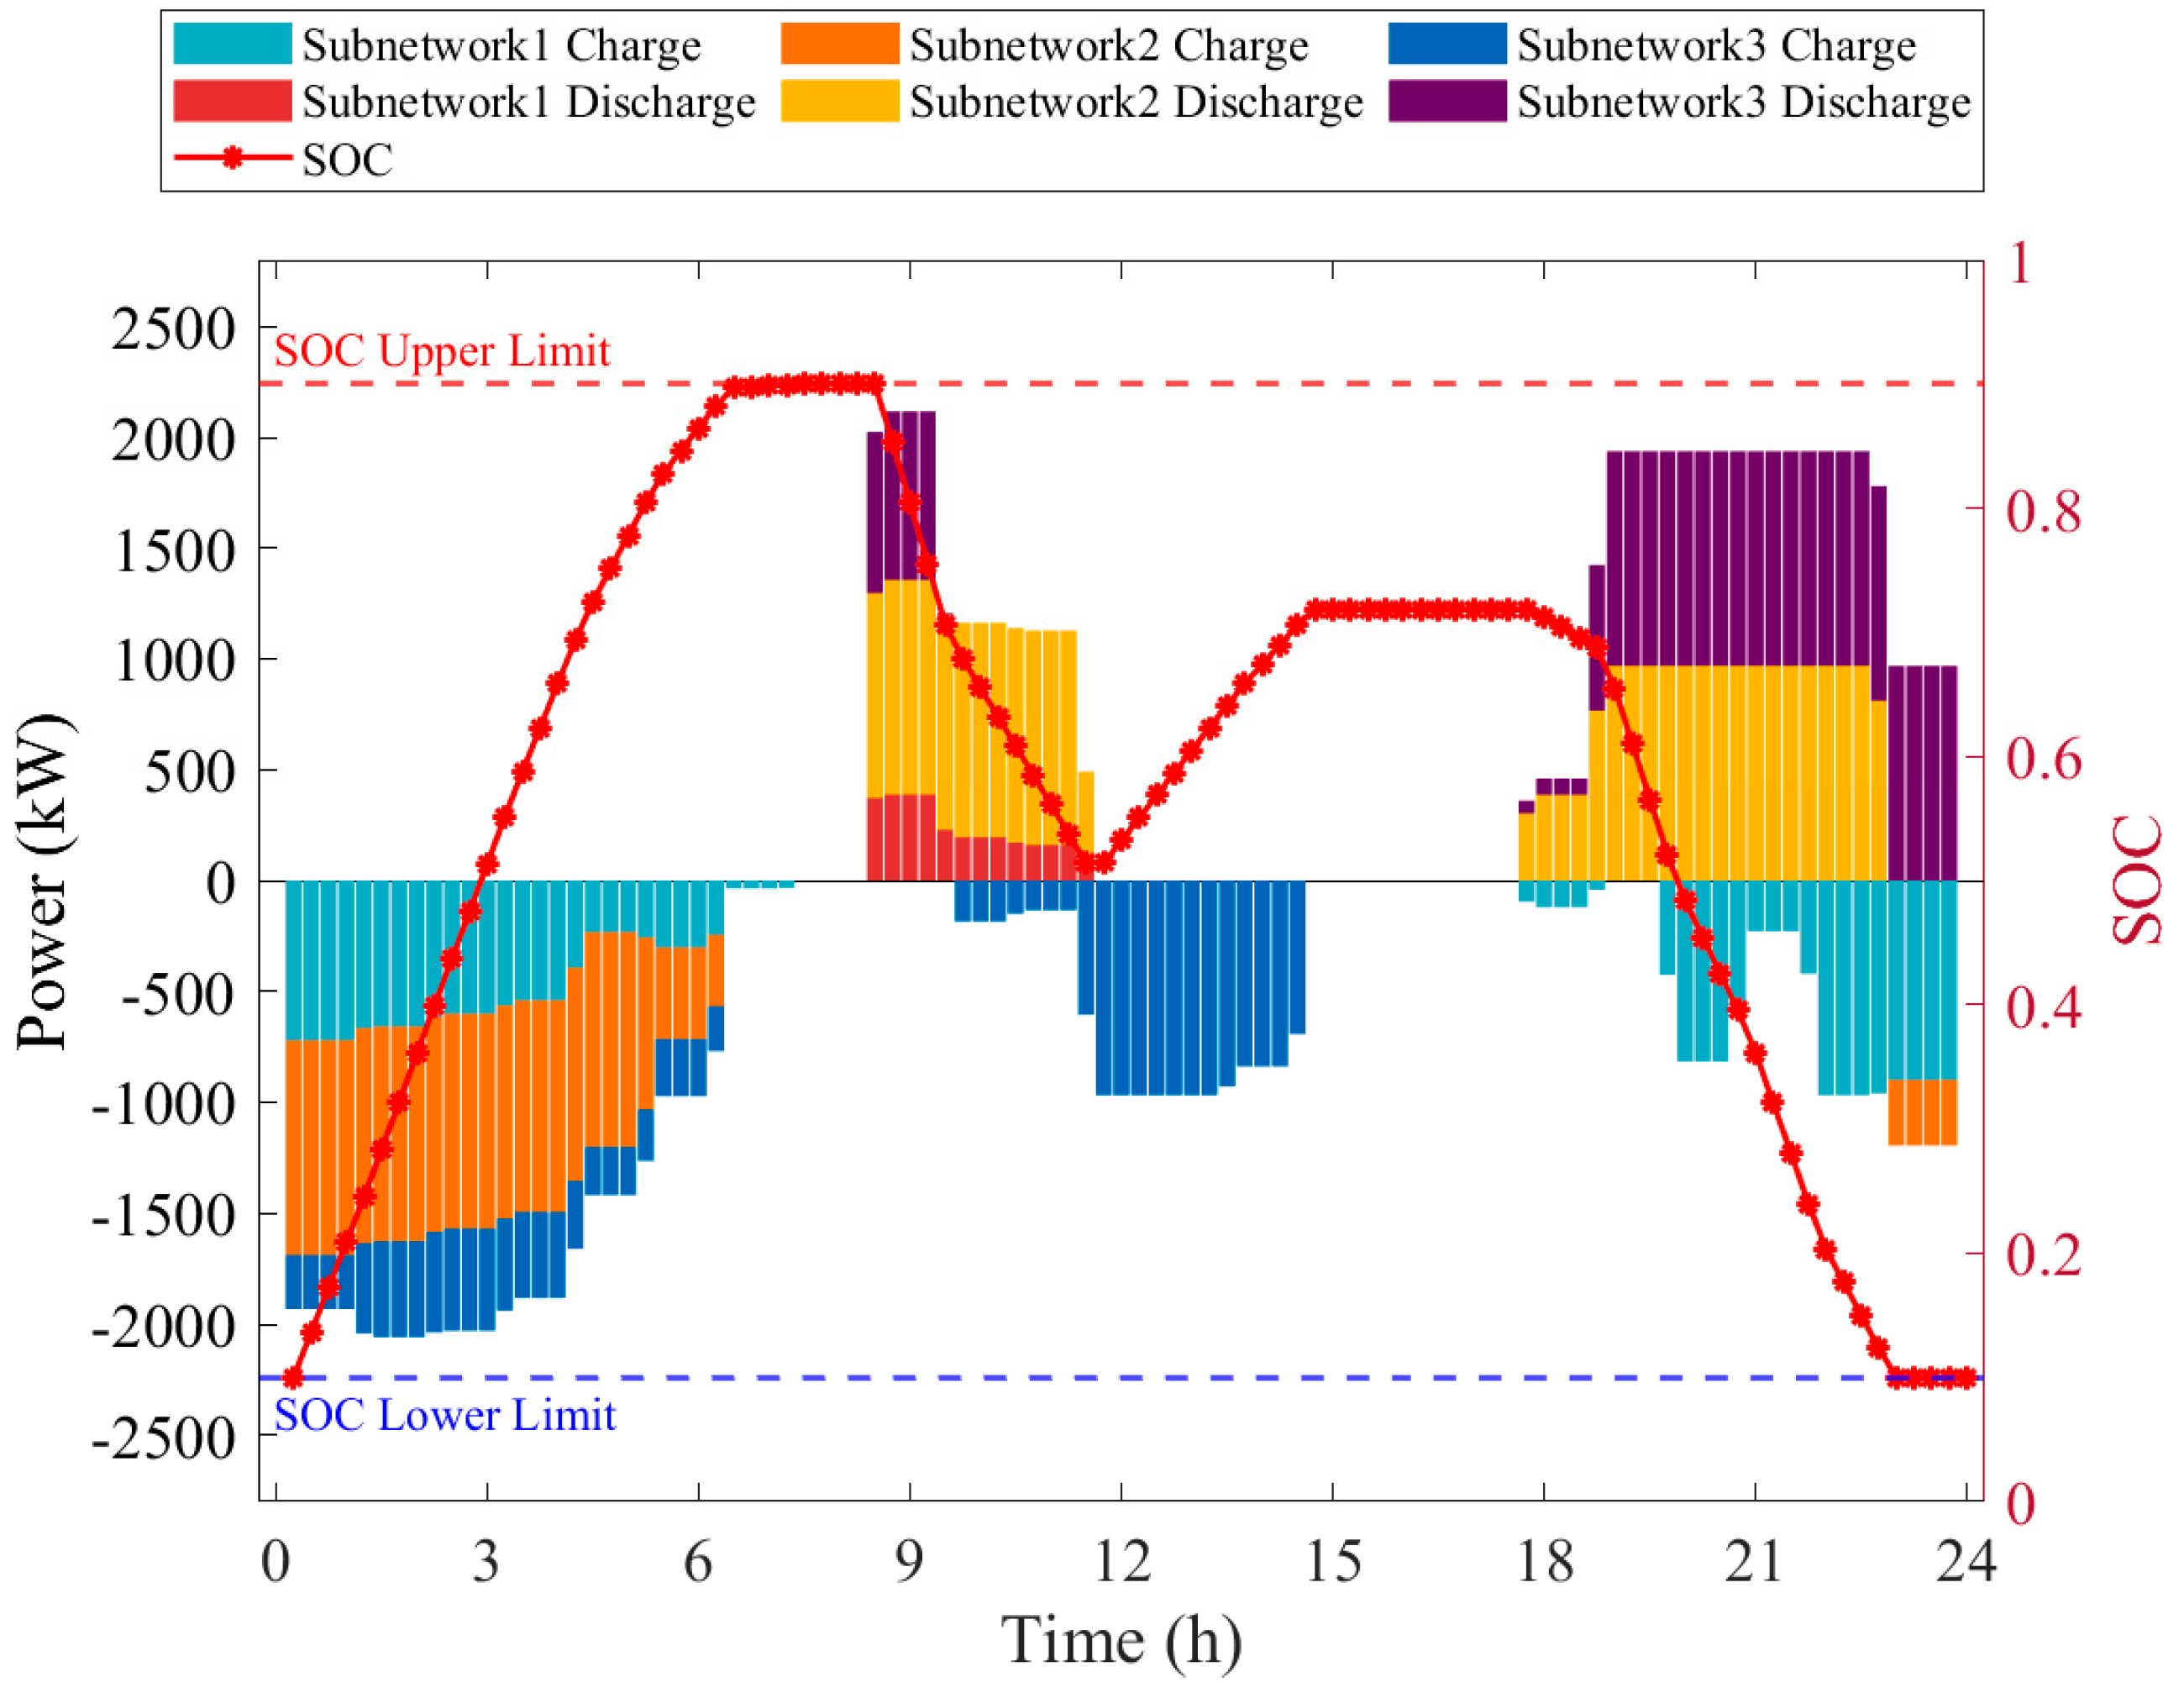
4.3. Analysis of Intraday Optimization

The proposed CO-CSES performs linear interpolation based on the day-ahead SOC trajectories to obtain the intraday SOC trajectory. The SOC trajectories before and after linear interpolation are shown in Figure 8.
Table 10 demonstrates intraday operational costs and benefits under different cases. Different from the day-ahead centralized solution approach, the intraday optimal scheduling problem is solved using the ADMM distributed algorithm to coordinate the operation of subnetworks while preserving privacy, with a time scale of 15 min.
Comparative analysis of Table 8 and Table 10 demonstrates Case 3’s economic advantages in both day-ahead and intraday stages. In the day-ahead stage, Case 3 reduces total operational cost by 9.21% and 8.81% compared to Case 1 and Case 2. In the intraday stage, Case 3 reduces total operational cost by 16.51% and 3.31% compared to Case 1 and Case 2. Cost reduction proves more significant during intraday operations, evidencing CSES coordination advantages under fine time-scale and complex source–load variation. In terms of cost components, the cost of purchased electricity is the main component, and CO-CSES achieves significant reductions in both stages. In the day-ahead stage, the cost of purchased electricity in Case 3 is 6.45% lower than in Case 1; by the intraday stage, this reduction further increases to 11.33%.
Among the electricity purchase costs, the AC2 subnetwork with obvious source–load imbalance accounts for the largest proportion of the electricity purchase cost, while CL-CSES and CO-CSES both have a significant reduction in the electricity purchase cost of the AC2 subnetwork. This difference indicates that shared energy storage has higher flexibility and adaptability in coping with source–load source–loa imbalance. Network loss and ESS operational costs both increase during the intraday stage, reflecting the fact that the system faces more complex load and RES generation fluctuations in actual operation.
Figure 9 illustrates the intraday power equilibrium for each AC subnetwork under CO-CSES at 15-min intervals.
For the AC1 subnetwork (Figure 9a), a relatively stable power pattern can be observed with consistent CSES charging during early morning hours (0–5 h) and evening hours (19–22 h), while discharging operations primarily occur during 8–18 h when RES generation is low. In AC2 subnetwork (Figure 9b), which exhibits the most volatile RES generation profile, CSES operations demonstrate sophisticated temporal management with strategic charging during surplus periods (1–6 h) and discharging during deficit periods (9–12 h, 17–22 h), while VSC exchanges facilitate complementary energy transfer. And AC3 subnetwork (Figure 9c) shows relatively balanced operation with moderate charging/discharging cycling.
To further illustrate the role of CSES in intraday optimal scheduling, charging/discharging patterns and RES utilization are analyzed. Figure 10 shows intraday charging/discharging power and SOC under CO-CSES, and Table 11 shows the intraday RES utilization rate of different cases.
The source–load fluctuations and imbalances in intraday are more severe compared to those in day-ahead scheduling, and the RES utilization under each case has decreased to different degrees. As can be seen from Table 11, Case 1’s AC2 subnetwork has the most obvious decrease and the lowest value in RES utilization, which is consistent with the trend of RES utilization in the day-ahead scheduling. CL-CSES can mitigate this phenomenon due to its larger shared energy storage capacity, but it still struggles to approach the day-ahead optimization results. On the other hand, CO-CSES maintains the highest level of RES utilization in both intraday and day-ahead stages. As shown in Figure 10, the CSES accommodates a large amount of redundant power from the AC2 subnetwork by charging in 0–6 h and then supports other subnetworks with insufficient RES power by discharging. For AC1 and AC3 subnetworks, the coordinated advantages of CO-CSES and VSC interactions enable them to achieve near-complete RES utilization (99.31% and 99.91%, respectively).
Through multi-subnetwork synergy, CO-CSES flexibly coordinates the charging and discharging power allocated to each subnetwork while the total charging and discharging follow the SOC trajectory. This shows that the coordinated optimization strategy based on the dual-time-scale framework can effectively adapt to the uncertainty of RES and maintain a high level of RES utilization while guaranteeing the economy.

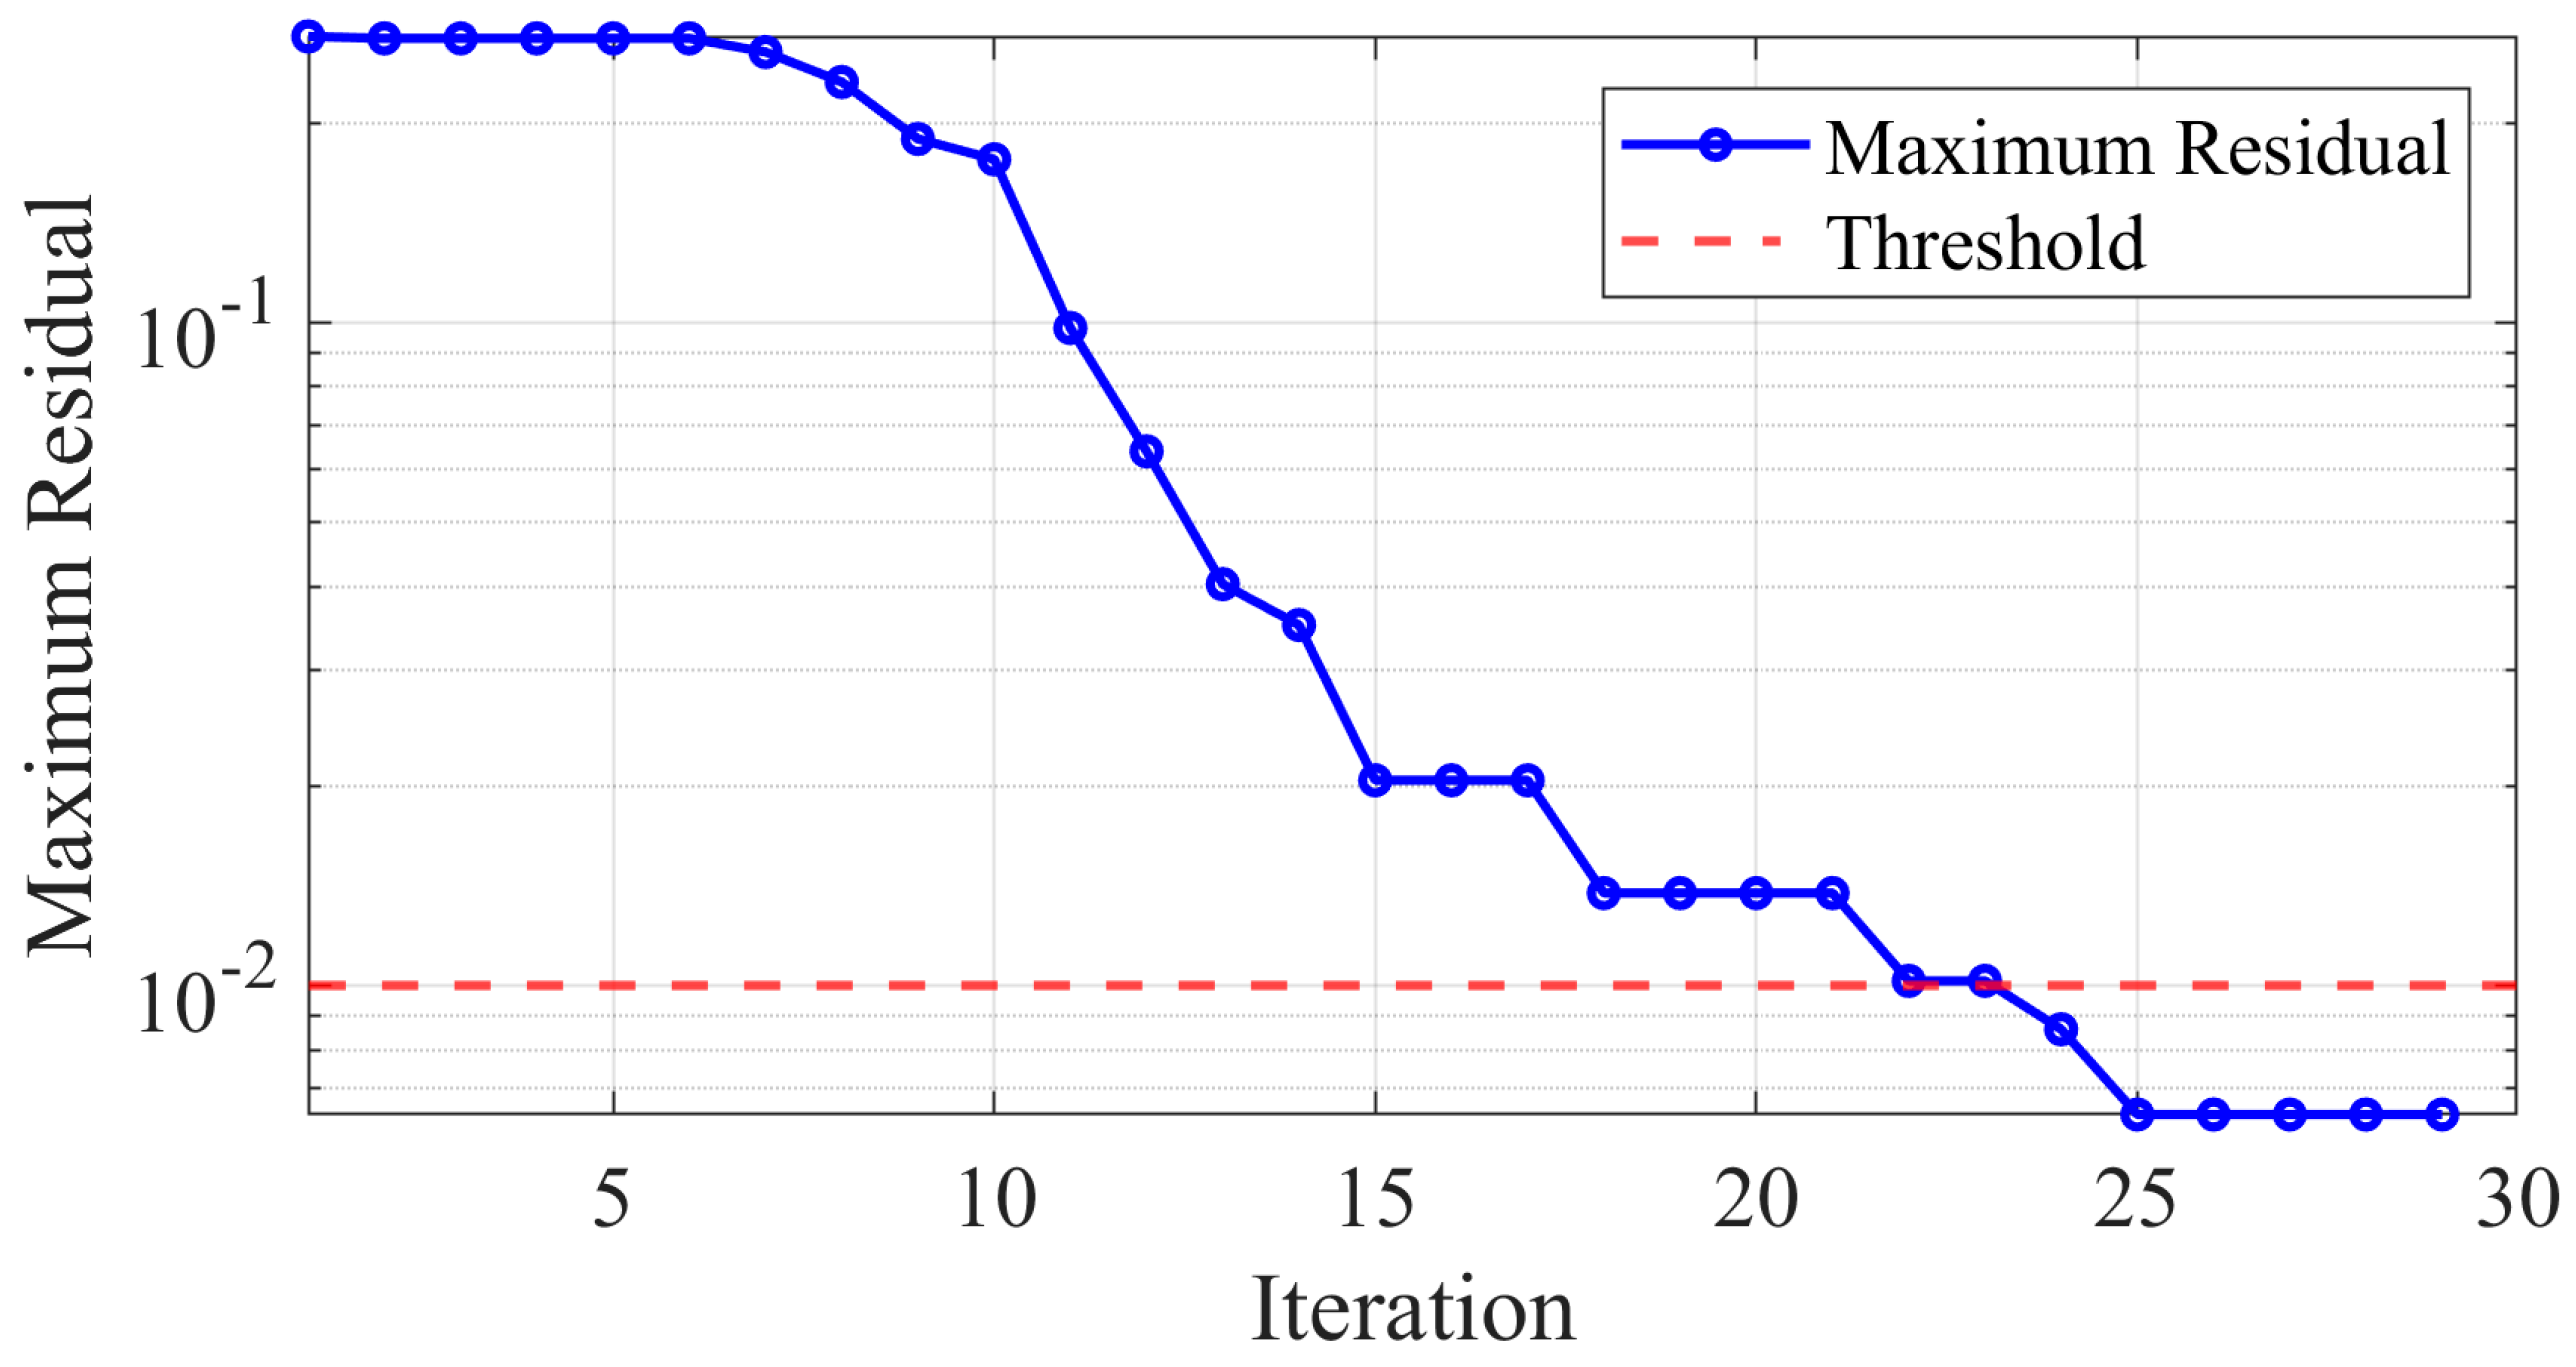
4.4. Analysis of ADMM Effectiveness

To evaluate the effectiveness of the ADMM algorithm employed in this paper, a comparison of centralized and distributed optimization results is conducted. Additionally, the convergence of residuals and objective values with the number of iterations is analyzed.
Table 12 presents the objective values from both approaches. The results show that the objective values of distributed optimization and centralized optimization are nearly identical, indicating that the distributed optimization method employed in this paper meets the required standards for computational accuracy.
Figure 11 presents the convergence behavior of the ADMM algorithm applied to the intraday distributed optimization. The maximum residual values plotted against iterations on a logarithmic scale demonstrate the algorithm’s convergence characteristics. The convergence threshold of 10−2 is reached at approximately iteration 24, with residual values subsequently stabilizing below this threshold for the remaining iterations. This convergence pattern verifies the effectiveness of the ADMM-based approach for coordinating the operational decisions between AC subnetworks and the DC ring network while preserving the privacy requirements. The corresponding objective function trajectories shown in Figure 12a,b for the AC subnetworks and DC ring network, respectively, confirm that the solution quality stabilizes along with the residual convergence. These results indicate that the adopted ADMM algorithm is capable of solving the intraday optimal scheduling problem for AC/DC distribution systems, with its accuracy and computational efficiency meeting the required standards.

5. Conclusions

This paper proposed a CSES optimization framework for AC/DC distribution systems with dual-time-scale coordination to address the challenges of RES integration. The research has successfully achieved its primary objective, with all key tasks outlined in the introduction being completed, including the establishment of the CSES framework, implementation of dual-time-scale coordination, and validation through case studies. The results conclusively demonstrate that the proposed approach effectively addresses the challenges of temporal–spatial imbalance and RES integration in AC/DC distribution systems. The main conclusions are as follows:
  • The proposed CSES framework effectively leverages temporal–spatial complementarity across subnetworks, achieving significant improvements in RES utilization with rates of 99.31%, 88.10%, and 99.91% for AC1, AC2, and AC3 subnetworks, respectively, compared to 96.15%, 71.51%, and 92.47% under independent ESS operation.
  • The dual-time-scale coordination of CSES successfully reduces total operational costs by 16.51% compared to independent ESS operation and 3.31% compared to capacity-leasing CSES allocation while ensuring system-wide optimization.
  • The ADMM-based distributed algorithm achieves solution accuracy within 0.1% deviation of centralized optimization results while protecting privacy.
While this study demonstrates the significant benefits of the proposed CSES framework, certain limitations define its current scope and offer avenues for future work. The current analysis focuses on optimal operational scheduling and does not include detailed dynamic stability or comprehensive reliability assessments of the system with CSES. Furthermore, while RES/load forecasts are used, extreme load imbalances or granular impacts of specific weather events on these forecasts are simplified. Lastly, detailed battery degradation models reflecting long-term impacts of CSES operational patterns and specific BMS-level protections beyond SOC limits were not incorporated. Addressing these aspects would further enhance the practical robustness and applicability of the proposed framework.

Author Contributions

Formal analysis, W.L. and Y.J.; supervision, Q.X. and H.J.; validation, Y.Z. and W.L.; writing—original draft, Y.Z.; writing—review and editing, Y.Z., Q.X. and W.L. All authors have read and agreed to the published version of the manuscript.

Funding

This work was funded by Science and Technology Project of the State Grid Corporation of China (5700-202418337A-2-1-ZX).

Institutional Review Board Statement

Not applicable.

Informed Consent Statement

Not applicable.

Data Availability Statement

The data presented in this study are available upon request from the corresponding author. The data are not publicly available due to privacy.

Conflicts of Interest

The authors declare no conflicts of interest.

Nomenclature

Parameters
TTotal number of time slots in a scheduling day
Δ t Time interval
λ t T R Time-of-day tariffs at time t
λ l o s s Cost coefficient for network losses
λ t VSC , DC Interaction tariff at time t
c o p Operational cost coefficient of ESS
r i j AC , x i j AC Resistance and reactance of AC branch ij
r i j DC Resistance of DC branch ij
r j VSC , x j VSC VSC resistance and reactance at node j
μ DC voltage utilization rate
S j VSC VSC capacity at node j
P j , t l o a d , Q j , t l o a d Active and reactive load at node j at time t
P T R , m i n , P T R , m a x Lower and upper limits of active power purchased
Q T R , m i n , Q T R , m a x Lower and upper limits of reactive power purchased
P i j AC , m i n , P i j AC , m a x Lower and upper limits of active power on branch ij
Q i j AC , m i n , Q i j AC , m a x Lower and upper limits of reactive power on branch ij
U j AC , m i n , U j AC , m a x Lower and upper limits of voltage magnitude at node j
I i j AC , m i n , I i j AC , m a x Lower and upper limits of current on branch ij
P c h , m a x , CSES , P d c h , m a x , CSES Maximum charging and discharging power of the entire CSES
P e c h , m a x , CSES , P e d c h , m a x , CSES Maximum charging and discharging power limit for subnetwork e at time t
P j c h , m a x , ESS , P j d c h , m a x , ESS Maximum charging and discharging power limit for the ESS at node j
E m i n , CSES , E m a x , CSES Minimum and maximum CSES SOC
E m i n , ESS , E m a x , ESS Minimum and maximum ESS SOC
η c h , η d c h Charging and discharging efficiency
ρ k Kth penalty parameter
ε ADMM Convergence threshold

References

  1. Lu, W.; Xiao, Q.; Jia, H.; Jin, Y.; Mu, Y.; Zhu, J.; Shen, C.; Teodorescu, R.; Guerrero, J.M. A Projected Gradient Descent-Based Distributed Optimal Control Method of Medium-Voltage DC Distribution System Considering Line Loss. IEEE Trans. Power Syst. 2025, 40, 1751–1763. [Google Scholar] [CrossRef]
  2. Xiao, Q.; Yu, H.; Jin, Y.; Jia, H.; Mu, Y.; Liu, H.; Li, W.; Teodorescu, R.; Blaabjerg, F. A Novel Fault-Tolerant Operation Approach for Cascaded H-Bridge Converter-Based Battery Energy Storage Systems to Avoid Overcharge. IEEE Trans. Ind. Electron. 2024, 72, 1–10. [Google Scholar] [CrossRef]
  3. Gallegos, J.; Arévalo, P.; Montaleza, C.; Jurado, F. Sustainable Electrification—Advances and Challenges in Electrical-Distribution Networks: A Review. Sustainability 2024, 16, 698. [Google Scholar] [CrossRef]
  4. Han, J.; Fang, Y.; Li, Y.; Du, E.; Zhang, N. Optimal Planning of Multi-Microgrid System with Shared Energy Storage Based on Capacity Leasing and Energy Sharing. IEEE Trans. Smart Grid 2025, 16, 16–31. [Google Scholar] [CrossRef]
  5. Lu, J.; Zheng, W.; Yu, Z.; Xu, Z.; Jiang, H.; Zeng, M. Optimizing Grid-Connected Multi-Microgrid Systems with Shared Energy Storage for Enhanced Local Energy Consumption. IEEE Access 2024, 12, 13663–13677. [Google Scholar] [CrossRef]
  6. Tang, X.; Zheng, J.; Yang, Z.; He, X.; Min, H.; Zhou, S.; Liu, K.; Qin, L. A Fully Decentralized Optimal Dispatch Scheme for an AC–DC Hybrid Distribution Network Formed by Flexible Interconnected Distribution Station Areas. Sustainability 2023, 15, 11338. [Google Scholar] [CrossRef]
  7. Gao, H.; Wang, J.; Liu, Y.; Wang, L.; Liu, J. An Improved ADMM-Based Distributed Optimal Operation Model of AC/DC Hybrid Distribution Network Considering Wind Power Uncertainties. IEEE Syst. J. 2021, 15, 2201–2211. [Google Scholar] [CrossRef]
  8. Zhao, Y.; Xiao, Q.; Lu, W.; Liu, H.; Jia, H.; Li, R.; Zhao, Y.; Hui, H. ADMM Based Multi-Objective Distributed Optimization of AC/DC Distribution System. In Proceedings of the 2024 9th Asia Conference on Power and Electrical Engineering (ACPEE), Shanghai, China, 11–13 April 2024; pp. 398–403. [Google Scholar]
  9. Jin, X.; Wang, X.; Jia, H.; Mu, Y.; Wu, Q.-W.; Wei, W. Peer-to-Peer Multi-Energy Trading Among Heterogeneous Building Prosumers via Asynchronous Distributed Algorithm. IEEE Trans. Smart Grid 2025, 16, 1590–1603. [Google Scholar] [CrossRef]
  10. Jia, N.; Wang, C.; Li, Y.; Liu, N.; Bi, T. Robust Two-Stage Dispatch of Multi-Area Integrated Electric-Gas Systems: A Decentralized Approach. CSEE J. Power Energy Syst. 2025, 11, 850–860. [Google Scholar] [CrossRef]
  11. Pu, Y.; Li, Q.; Luo, S.; Chen, W.; Breaz, E.; Gao, F. Peer-to-Peer Electricity-Hydrogen Trading Among Integrated Energy Systems Considering Hydrogen Delivery and Transportation. IEEE Trans. Power Syst. 2024, 39, 3895–3911. [Google Scholar] [CrossRef]
  12. Huang, S.; Wu, Q.; Guo, Y.; Rong, F. Hierarchical Active Power Control of DFIG-Based Wind Farm with Distributed Energy Storage Systems Based on ADMM. IEEE Trans. Sustain. Energy 2020, 11, 1528–1538. [Google Scholar] [CrossRef]
  13. Li, J.; Liu, J.; Luo, L.; Tian, Z.; Shen, J.; He, D.; Dong, Z. Admm-Based Health-Conscious Energy Management Strategy with Fuel Cell and Battery Degradation Synergy Real-Time Control for Fuel Cell Vehicle. Energy Convers. Manag. 2025, 333, 119812. [Google Scholar] [CrossRef]
  14. Lin, S.-W.; Chu, C.-C. Optimal Distributed ADMM-Based Control for Frequency Synchronization in Isolated AC Microgrids. IEEE Trans. Ind. Appl. 2023, 59, 2458–2472. [Google Scholar] [CrossRef]
  15. Huang, S.; Wu, Q.; Liao, W.; Wu, G.; Li, X.; Wei, J. Adaptive Droop-Based Hierarchical Optimal Voltage Control Scheme for VSC-HVdc Connected Offshore Wind Farm. IEEE Trans. Ind. Inform. 2021, 17, 8165–8176. [Google Scholar] [CrossRef]
  16. Wang, P.; Wu, Q.; Huang, S.; Li, C.; Zhou, B. ADMM-Based Distributed Active and Reactive Power Control for Regional AC Power Grid with Wind Farms. J. Mod. Power Syst. Clean Energy 2022, 10, 588–596. [Google Scholar] [CrossRef]
  17. Rana, M.M.; Uddin, M.; Sarkar, M.R.; Meraj, S.T.; Shafiullah, G.M.; Muyeen, S.M.; Islam, M.A.; Jamal, T. Applications of Energy Storage Systems in Power Grids with and without Renewable Energy Integration—A Comprehensive Review. J. Energy Storage 2023, 68, 107811. [Google Scholar] [CrossRef]
  18. Wong, L.A.; Ramachandaramurthy, V.K.; Taylor, P.; Ekanayake, J.B.; Walker, S.L.; Padmanaban, S. Review on the Optimal Placement, Sizing and Control of an Energy Storage System in the Distribution Network. J. Energy Storage 2019, 21, 489–504. [Google Scholar] [CrossRef]
  19. Rahman, M.M.; Oni, A.O.; Gemechu, E.; Kumar, A. Assessment of Energy Storage Technologies: A Review. Energy Convers. Manag. 2020, 223, 113295. [Google Scholar] [CrossRef]
  20. Dai, R.; Esmaeilbeigi, R.; Charkhgard, H. The Utilization of Shared Energy Storage in Energy Systems: A Comprehensive Review. IEEE Trans. Smart Grid 2021, 12, 3163–3174. [Google Scholar] [CrossRef]
  21. Li, L.; Cao, X.; Zhang, S. Shared Energy Storage System for Prosumers in a Community: Investment Decision, Economic Operation, and Benefits Allocation under a Cost-Effective Way. J. Energy Storage 2022, 50, 104710. [Google Scholar] [CrossRef]
  22. Zhuang, Y.; Li, Z.; Tan, Q.; Li, Y.; Wan, M. Multi-Time-Scale Resource Allocation Based on Long-Term Contracts and Real-Time Rental Business Models for Shared Energy Storage Systems. J. Mod. Power Syst. Clean Energy 2024, 12, 454–465. [Google Scholar] [CrossRef]
  23. Mao, Y.; Cai, Z.; Jiao, X.; Long, D. Multi-Timescale Optimization Scheduling of Integrated Energy Systems Oriented towards Generalized Energy Storage Services. Sci. Rep. 2025, 15, 8549. [Google Scholar] [CrossRef]
  24. Li, S.; Zhu, J.; Dong, H. A Novel Energy Sharing Mechanism for Smart Microgrid. IEEE Trans. Smart Grid 2021, 12, 5475–5478. [Google Scholar] [CrossRef]
  25. Cui, S.; Wang, Y.-W.; Shi, Y.; Xiao, J.-W. A New and Fair Peer-to-Peer Energy Sharing Framework for Energy Buildings. IEEE Trans. Smart Grid 2020, 11, 3817–3826. [Google Scholar] [CrossRef]
  26. Qiu, W.; Jiang, X.; Lin, Z.; Li, L.; Pei, Y.; Tao, Y. A Contract-Based, Decentralized and Privacy-Preserving Computation Scheme of Evaluation Indices of Shared Energy Storage Market for Renewable Energy Accommodation. IEEE Trans. Ind. Appl. 2023, 59, 2546–2562. [Google Scholar] [CrossRef]
  27. Chen, C.; Li, Y.; Qiu, W.; Liu, C.; Zhang, Q.; Li, Z.; Lin, Z.; Yang, L. Cooperative-Game-Based Day-Ahead Scheduling of Local Integrated Energy Systems with Shared Energy Storage. IEEE Trans. Sustain. Energy 2022, 13, 1994–2011. [Google Scholar] [CrossRef]
  28. Yan, D.; Chen, Y. Distributed Coordination of Charging Stations with Shared Energy Storage in a Distribution Network. IEEE Trans. Smart Grid 2023, 14, 4666–4682. [Google Scholar] [CrossRef]
  29. Zhang, H.; Zhou, S.; Gu, W.; Zhu, C.; Chen, X.G. Optimal Operation of Micro-Energy Grids Considering Shared Energy Storage Systems and Balanced Profit Allocations. CSEE J. Power Energy Syst. 2023, 9, 254–271. [Google Scholar] [CrossRef]
  30. Qi, C.; Wang, K.; Fu, Y.; Li, G.; Han, B.; Huang, R.; Pu, T. A Decentralized Optimal Operation of AC/DC Hybrid Distribution Grids. IEEE Trans. Smart Grid 2018, 9, 6095–6105. [Google Scholar] [CrossRef]
  31. Ahmed, H.M.A.; Salama, M.M.A. Energy Management of AC–DC Hybrid Distribution Systems Considering Network Reconfiguration. IEEE Trans. Power Syst. 2019, 34, 4583–4594. [Google Scholar] [CrossRef]
  32. Tong, B.; Zhang, L.; Li, G.; Zhang, B.; Xie, F.; Tang, W. An Overvoltage-Averse Model for Renewable-Rich AC/DC Distribution Networks Considering the Sensitivity of Voltage Violation Probability. IEEE Trans. Sustain. Energy 2025, 16, 613–626. [Google Scholar] [CrossRef]
  33. Fu, Y.; Zhang, Z.; Li, Z.; Mi, Y. Energy Management for Hybrid AC/DC Distribution System with Microgrid Clusters Using Non-Cooperative Game Theory and Robust Optimization. IEEE Trans. Smart Grid 2020, 11, 1510–1525. [Google Scholar] [CrossRef]
  34. Chen, Y.; Lu, Q.; Zeng, K.; Yang, Y.; Xie, P. Flexibility-Oriented AC/DC Hybrid Grid Optimization Using Distributionally Robust Chance-Constrained Method. Energies 2024, 17, 4902. [Google Scholar] [CrossRef]
  35. Bitaraf, H.; Rahman, S. Reducing Curtailed Wind Energy Through Energy Storage and Demand Response. IEEE Trans. Sustain. Energy 2018, 9, 228–236. [Google Scholar] [CrossRef]
  36. Su, Y.; Teh, J. Two-Stage Optimal Dispatching of AC/DC Hybrid Active Distribution Systems Considering Network Flexibility. J. Mod. Power Syst. Clean Energy 2023, 11, 52–65. [Google Scholar] [CrossRef]
  37. Meng, H.; Jia, H.; Xu, T.; Wei, W.; Wang, X. Battery Storage Configuration of AC/DC Hybrid Distribution Networks. CSEE J. Power Energy Syst. 2023, 9, 859–872. [Google Scholar] [CrossRef]
  38. Ahmed, H.M.A.; Eltantawy, A.B.; Salama, M.M.A. A Generalized Approach to the Load Flow Analysis of AC–DC Hybrid Distribution Systems. IEEE Trans. Power Syst. 2018, 33, 2117–2127. [Google Scholar] [CrossRef]
  39. Chowdhury, M.M.-U.-T.; Murari, K.; Hasan, M.S.; Kamalasadan, S. Optimal Power Flow (OPF) Analysis for AC–DC Active Distribution Networks Utilizing Second-Order Cone Programming (SOCP) Approach. IEEE Trans. Ind. Inform. 2025, 21, 3555–3564. [Google Scholar] [CrossRef]
  40. Murari, K.; Padhy, N.P.; Kamalasadan, S. A Backward-Forward Sweep Based Power Flow Algorithm for Generalized AC-DC Distribution Network with Distributed Generations. IEEE Trans. Ind. Appl. 2023, 59, 5032–5047. [Google Scholar] [CrossRef]
  41. Baran, M.E.; Wu, F.F. Network Reconfiguration in Distribution Systems for Loss Reduction and Load Balancing. IEEE Trans. Power Deliv. 1989, 4, 1401–1407. [Google Scholar] [CrossRef]
  42. Qiu, H.; Gu, W.; Xu, Y.; Wu, Z.; Zhou, S.; Pan, G. Robustly Multi-Microgrid Scheduling: Stakeholder-Parallelizing Distributed Optimization. IEEE Trans. Sustain. Energy 2020, 11, 988–1001. [Google Scholar] [CrossRef]
Figure 1. AC/DC distribution system with CSES.
Applsci 15 05941 g001
Figure 2. Dual-time-scale coordination process.
Applsci 15 05941 g002
Figure 3. A flowchart of the ADMM-based distributed algorithm.
Applsci 15 05941 g003
Figure 4. Forecasted RES and load power in each subnetwork. (a) At 1-h time scale for day-ahead scheduling; (b) At 15-min time scale for intraday scheduling.
Applsci 15 05941 g004
Figure 5. Day-ahead power equilibrium of AC2 subnetwork: (a) under IE; (b) under CL-CSES; (c) under CO-CSES.
Applsci 15 05941 g005
Figure 6. Day-ahead ESS charging/discharging power and SOC of each AC subnetwork under IE. (a) AC1; (b) AC2; (c) AC3.
Applsci 15 05941 g006
Figure 7. Day-ahead CSES charging/discharging power and SOC: (a) under CL-CSES; (b) under CO-CSES.
Applsci 15 05941 g007
Figure 8. A comparison of CSES SOC before and after linear interpolation; (a) before; (b) after.
Applsci 15 05941 g008
Figure 9. Intraday power equilibrium under CO-CSES. (a) AC1; (b) AC2; (c) AC3.
Applsci 15 05941 g009
Figure 10. Intraday CSES charging/discharging power and SOC under CO-CSES.
Applsci 15 05941 g010
Figure 11. Relationship between residuals and the number of iterations.
Applsci 15 05941 g011
Figure 12. Relationship between objective values and the number of iterations. (a) AC subnetworks; (b) DC ring network.
Applsci 15 05941 g012
Table 1. State-of-the-art applications of ADMM in power electronics and power systems.
ReferencesApplication AreaTime ResolutionScaleKey FeaturesAdvantages
[6,7,8]AC/DC
distribution
network
Minutes to
hours
33-node or larger
distribution
network
Decentralized
dispatch
Privacy, reduced communication
[9,10,11]Integrated energy
systems (IES)
Minutes to
hours
Buildings to
large-scale
systems
Decoupled
energy sector
Handles temporal
couplings, scalability
[12,13,14,15,16]Power
electronics
Milliseconds to
seconds
Small subsystems to wind farms (around 30 WTs)Reduced communication and computation burdenReal-time control,
scalability
Table 2. A comparison of energy storage operational architecture.
TypeOwnershipSharing MechanismAvailable
Capacity
System Coordination PerformanceRelationship
ESSSingle user
or entity
N/AFixedLowCan be a component of SES
SESMultiple users
or third-party aggregator
Users share idle capacityPre-allocateModerate to lowBroader concept for shared storage
CSESCentral entityDynamic sharing of both
capacity and energy
FlexibleHighSpecific SES type:
unified asset for multiple users
Table 3. Parameters of DC lines.
BranchResistance (Ω)
1–20.3075
2–30.3600
3–40.3825
4–50.5850
5–60.9225
6–70.8475
7–10.4725
Table 4. Parameters of the system.
ParameterValue
Total number of time slots in a scheduling day24/96
Time interval1 h/15 min
Cost coefficient for network losses0.4 CNY/kWh
Operational cost coefficient of ESS0.028 CNY/kWh
Peak efficiency0.9
VSC resistance and reactance0.5 Ω/1.5 Ω
DC voltage utilization rate0.866
Limits of RES power2 MW
VSC rated active and reactive power2 MW/1 MVar
Maximum charging and discharging power of the entire CSES3 MW
Maximum charging and discharging power for the subnetwork1 MW
Maximum charging and discharging power for the ESS0.5 MW
Minimum and maximum CSES SOC0.1/0.9
Minimum and maximum ESS SOC0.1/0.9
Charging and discharging efficiency0.9
ADMM initial penalty parameter1 × 103
ADMM convergence threshold10−2
Table 5. Distribution of DGs and VSCs in the distribution system.
NetworkDG PositionsVSC Positions
AC13, 17, 277
AC24, 7, 189
AC312, 13, 2513
DC2, 41, 3, 5
Table 6. Time-of-day tariffs.
Time PeriodPrice (CNY/kWh)
00:00–07:000.48
07:00–08:000.9
08:00–11:001.35
11:00–18:000.9
18:00–23:001.35
23:00–24:000.48
Table 7. ESS capacity allocation of CL-CSES.
NetworkSource–Load Difference (MWh)Allocation RatioAllocated Capacity (MWh)
AC16.97090.22392.6868
AC213.09710.42075.0480
AC311.06600.35544.2652
Total31.13401.000012.0000
Table 8. Day-ahead operational costs and benefits under different cases.
TypeElectricity
Purchase Cost (CNY)
Network
Loss Cost (CNY)
ESS
Operational Cost (CNY)
DC Network Interaction Benefit (CNY)Total
Operational Cost (CNY)
Case 170,232.532292.63770.5729,128.6844,167.06
Case 269,866.012531.04702.8029,129.1643,970.69
Case 365,698.642663.45871.7529,136.2240,097.62
Table 9. Day-ahead RES utilization rate of different cases among AC subnetworks.
TypeAC1AC2AC3
Case 194.55%85.23%99.07%
Case 294.77%88.61%98.82%
Case 399.57%91.07%98.82%
Table 10. Intraday operational costs and benefits under different cases.
TypeNetworkElectricity
Purchase Cost (CNY)
Network
Loss Cost (CNY)
ESS
Operational Cost (CNY)
DC Network Interaction
Benefit (CNY)
Total
Operational Cost (CNY)
Case 1AC121,766.04992.05209.5429,860.1660,530.71
AC238,939.16749.10317.37
AC325,532.861639.21245.55
Case 2AC119,617.78962.31149.1329,846.1552,266.82
AC233,597.38741.70293.22
AC325,958.94556.41236.10
Case 3AC119,521.93716.05198.4929,859.7850,538.56
AC231,061.621538.19366.77
AC325,888.00797.85309.43
Table 11. Intraday RES utilization rate of different cases among AC subnetworks.
TypeAC1AC2AC3
Case 196.15%71.51%92.47%
Case 297.04%79.74%99.63%
Case 399.31%88.10%99.91%
Table 12. Objective values comparison of centralized and distributed optimization.
ObjectiveCentralized (CNY)Distributed (CNY)Deviation
e E C AC , e 79,531.3579,523.650.01%
C DC 29,884.7529,859.780.08%
C CSES 874.68874.680.00%
C t o t a l 50,521.2850,538.560.03%
Disclaimer/Publisher’s Note: The statements, opinions and data contained in all publications are solely those of the individual author(s) and contributor(s) and not of MDPI and/or the editor(s). MDPI and/or the editor(s) disclaim responsibility for any injury to people or property resulting from any ideas, methods, instructions or products referred to in the content.

