Abstract
Satellite network awareness is a key technology for obtaining the status of onboard resources and supporting efficient network management. However, the dynamic characteristics of the network topology results in dynamic transmission delays of awareness data, while the instability of satellite-ground links poses challenges in selecting awareness reporting nodes. Therefore, a dynamic reporting nodes selection method for network awareness based on active-passive integrated network telemetry (DRNSM-APINT) is proposed. Specifically, an APINT model is built which can dynamically select the optimal reporting node and reduce awareness time through the bidirectional aggregation of telemetry packets along the service path. To address the requirements of various services, flexible division strategy through virtual boundaries and the integration of APINT models are combined to achieve customized selection of multiple reporting nodes on each path. Additionally, a lightweight Q-learning algorithm is proposed to dynamically solve the above issue with lower computational complexity. The simulation results demonstrate that the DRNSM-APINT method can decrease the awareness time by 34.5% and improve the overall awareness performance by 17.1%, thereby significantly enhancing the timeliness performance and dynamic characteristics of network awareness.
1. Introduction
With the continuous expansion of the low-Earth-orbit (LEO) satellite network, awareness of the status of multi-dimensional heterogeneous network resources can provide basic data support for delivering high-quality network services, and has become the key technology for the operation and maintenance of satellite network. However, the high dynamism of satellite network topology, coupled with the instability of inter-satellite links (ISLs) and satellite-ground links (SGLs), can result in substantial delays in the transmission of awareness data, reducing the real-time performance of network awareness [1]. Meanwhile, traditional terrestrial network awareness methods cannot meet the differentiated and dynamic service awareness requirements of satellite networks [2]. Therefore, efficient network awareness methods have emerged as a key area of focus in the ongoing development of LEO satellite networks.
Network awareness primarily consists of measurement and reporting process. Measurement mainly involves collecting the resource status information of nodes and transmitting awareness data in the network. Reporting refers to the process of aggregating awareness data and transmitting them to the ground control center [3]. Research on resource-aware optimization methods for terrestrial network has lasted for decades. However, to the best of our knowledge, there are no relevant studies on LEO satellite network scenarios. Additionally, most studies of terrestrial networks have typically concentrated on expanding the awareness scope [4] and optimization of awareness overhead [5], while there is a lack of research focusing on the flexibility and the timeliness of awareness method [6]. For example, Yang et al. [7] employed an active telemetry method for giant satellite constellations, meaning that both the measurement and reporting processes utilize separate links or frequency bands for transmission. By optimizing resource allocation during the awareness process, the volume of awareness data transmitted was enhanced. However, this method occupied substantial on-board resources, thereby increasing awareness overhead and the complexity of the constellation. In order to minimize the awareness overhead, in-band network telemetry (INT) technology has been proposed as a lightweight passive telemetry approach [8]. It conveys awareness data by utilizing the additional fields appended to the service data packet headers [9]. The transmission route of the service concurrently serves as the awareness path, enabling operations such as reading, writing, and deleting awareness data through programmable technology [10], which is suitable for multi-service concurrent scenarios in large-scale satellite network [11]. Liu et al. [12] proposed utilizing the Euler path planning algorithm to decrease the redundancy of INT paths, thereby optimizing the telemetry paths within LEO constellations. Meanwhile, regarding the reporting process, the awareness method based on INT often reports after the target node separates the awareness and service data. For long-distance paths with multi-hop, a multi node reporting method based on fixed hop intervals can also be adopted to mitigate cumulative costs and enhance the timeliness performance of reporting.
Unlike terrestrial networks, the unique, complex, and dynamic characteristics of satellite network pose three main challenges to awareness technology: (1) The real-time challenge brought by the large delay in the transmission path during the network measurement process [13]. Due to the high-speed movement of satellite nodes and the considerable distance between satellites, the propagation delay is relatively significant when compared to terrestrial networks [14]. Moreover, under different path length, the delay generated by each node increases further through multi-hop accumulation, greatly affecting the real-time awareness and reducing the accuracy of awareness data [15]. (2) The instability of the SGL results in a limited number of optional reporting nodes and poor dynamic selection of reporting nodes. The SGLs of nodes have short duration and poor stability leading to a limited number of reporting nodes that can be selected on the path. At this point, the awareness data must either wait on the satellite or switch to another reporting node, thereby increasing the reporting time. (3) The high complexity of dynamic awareness caused by the dual heterogeneity of network topology and services. The dynamism of the topology reduces the timeliness of awareness and increases the difficulty of overall network awareness. The dynamism of services enhances the complexity of adjusting awareness methods in different time-varying scenarios. The fixed measurement and reporting strategy exhibits limited flexibility when it comes to optimizing the measurement process or the selection of reporting nodes in dual dynamic scenarios, making it impossible to be adjusted adaptively based on actual awareness requirements.
In response to the challenges of network awareness in LEO satellite networks, a dynamic reporting nodes selection method for network awareness based on active-passive integrated network telemetry (DRNSM-APINT) is proposed, which can flexibly adjust the telemetry mechanism and dynamically select the optimal number and position of reporting nodes for different services. Specifically, the method proposes an active-passive integrated network telemetry (APINT) model. Unlike the existing active and passive telemetry systems, which are both initiated by a single node, in this method, passive telemetry and active telemetry are initiated by the source and target nodes, respectively, converging toward the center of the path to shorten the awareness path. The optimal location for the reporting node is selected based on constraints related to the transmission time of ISLs and the status of SGLs, thereby reducing the time of measurement and reporting, and enhancing the timeliness of awareness in single-node reporting scenarios. Furthermore, considering that the single-node reporting mechanism in LEO satellite network cannot meet the awareness timeliness requirements of multi-hop and long-distance paths, an optimized selection method for multiple reporting nodes is proposed. The concept of virtual boundaries is introduced to divide the awareness path. Additionally, within each segment, the APINT model is utilized to select the optimal reporting nodes. Then, by comparing the effective-ness of selecting multiple reporting nodes across various virtual boundary partitioning scenarios, the most suitable number of reporting nodes for the current awareness path is determined, thereby enabling optimized and flexible selection of multiple reporting nodes. However, due to variations in path hops, distance of ISLs and SGLs, and the characteristics of these links among different services, the optimal number of reporting nodes for each service path varies in multi-service scenarios. Consequently, it is necessary to dynamically devise an optimal reporting scheme for each service, which further complicates the solution process. Considering the varying selection requirements for reporting nodes across diverse service scenarios, based on the model-free characteristic and the strong adaptability to dynamic scenarios of Q-learning, a lightweight Q-learning algorithm based on a pre-planned virtual boundary is proposed. The boundary is divided using the equal division method, and the selection of virtual boundaries for each service path is pre planned through dynamic boundary floating. The method can exclude discontinuous boundary combinations, decrease the number of search iterations required in Q-learning, and simplify the complexity of the algorithm’s solution process. Simultaneously, based on the proposed lightweight Q-learning algorithm, the optimal number and position of reporting nodes for different paths in multi-service scenarios are dynamically solved, achieving efficient awareness timeliness and flexible dynamic selection of reporting nodes in LEO satellite networks.
The main contributions of this paper are as follows:
- (1)
- An APINT model is built for LEO satellite networks. Combining active and passive telemetry, the awareness path is shortened. Additionally, the optimal location for the reporting node is selected based on constraints related to the transmission time and status of SGLs, thereby reducing awareness time and enhancing awareness timeliness.
- (2)
- A dynamic reporting nodes selection method of network awareness based on active-passive integrated network telemetry (DRNSM-APINT) is proposed, introducing the concept of virtual boundaries to divide the awareness path into segments, and using the APINT model to find the optimal reporting node of each segment. By comparing the selection results of reporting nodes across various virtual boundary settings scenarios, the best reporting solution was chosen for the current awareness path, solving the problem of flexible selection of multiple reporting nodes.
- (3)
- A multi-reporting nodes selection algorithm based on lightweight Q-learning for various services is proposed. The dynamic pre-planning of virtual boundaries mitigates the computational complexity of Q-learning solutions. The proposed lightweight Q-learning algorithm dynamically determines the optimal number and location of reporting nodes for different service paths, achieving efficient timeliness of awareness and flexible selection of reporting nodes in dual time-varying scenarios of service and path.
The remainder of this paper is organized as follows: Section 2 introduces the composition of LEO satellite network and presents the APINT model. Section 3 provides the details of optimized selection method for multiple reporting nodes. Section 4 introduces a lightweight Q-learning algorithm based on pre-planned virtual boundary. Section 5 validates the proposed method through simulation experiments. Section 6 provides a brief summary of the paper.
2. Composition of LEO Satellite Network and APINT Model
2.1. Composition of LEO Satellite Network
The composition of LEO satellite network is shown in Figure 1. A group of LEO satellites in the same layer and orbit constructs the satellite network through ISLs, and wireless communication is used for the transmission of inter-satellite services between nodes. When flying over the service area, satellites establish links with ground gateway stations or user terminals through SGLs, allowing for the backhaul of network awareness data.
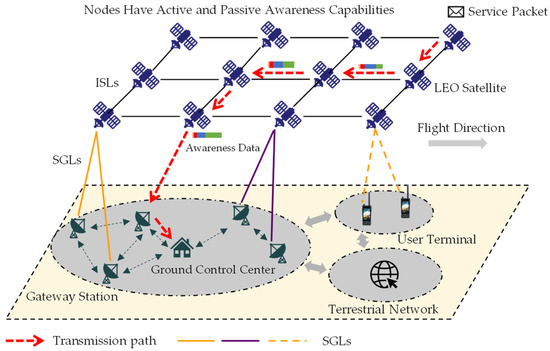
Figure 1.
LEO satellite network scenario.
The LEO satellites in the network are represented as with satellites. The set of ground gateway stations is represented as . Considering the dynamic features of the network topology, a specific time range is divided into several time slots , each with a duration of . Within each time slot, the network topology remains stable, but it experiences dynamic changes between different time slots. At the same time, the task tuple is used to represent each service flow, where is the set of service identifiers, is the set of service transmission paths, and represents the time from the initiation of service transmission to its reception at the gateway station. Table 1 lists the commonly used symbols in this article.

Table 1.
List of variables.
2.2. Propagation and Transmission Delay
In the LEO satellite network, each service is transmitted from the source node to the target node with the assumption that the topology remains unchanged during the transmission process. The service transmission path has satellites, and the propagation delay between the nodes is given by:
where represents the inter-satellite distance from node to node , and . Additionally, is the propagation rate on the link. The time consumed during the process of node sending data packet to the next node is referred as the transmission delay:
where represents the size of the data for the -th service sent by the node , and is the transmission rate of the switch on the satellite.
2.3. APINT Model
The awareness of target objects in the network mainly include various resources used by nodes to provide network services, such as bandwidth, computing, storage, and queue resources, as well as ISL status information [16]. Each node in the network has awareness capability [17]. Based on programmable technology, active telemetry and passive telemetry can be performed, and the awareness process can be designed, modified, and operated [18].
2.3.1. Passive Telemetry
The passive telemetry approach based on INT is employed within the network, where node resource status information is inscribed as metadata into telemetry packets as service flows through. The awareness data transmit with the service, and the service transmission path can be regarded as an awareness path [19]. The INT packet mainly consists of a telemetry packet header and telemetry data, where the telemetry packet header is a specified 12-byte content, and the telemetry data are primarily composed of the aggregated metadata from each node [20]. Due to the small length of INT packet, it can be directly placed in the header of the service packet without occupying payload space. After editing and integrating the resource status information of each node, the written metadata typically have a length of 4 to 8 bytes [11]. represents the maximum cumulative number of hops that telemetry data can contain, which can be set and modified according to actual needs, with a common value of 8 hops. When the path length exceeds , subsequent nodes will no longer write metadata to the telemetry data or reset the telemetry data and cumulative number of hops after reporting the current telemetry data.
In addition, the CPU processing time consumed by the node to read the telemetry packet header and write metadata into the telemetry data is denoted as . Since the average length of the metadata is relatively short, the time taken to write the metadata is much smaller than the node’s propagation delay and transmission delay, making a constant value. Therefore, the time consumed by each node for passive telemetry during the process of inserting awareness data, and transmitting them along with the service to the next node is as follows:
2.3.2. Active Telemetry
Each node in the network also has the capability to actively send telemetry packets to other nodes along the path for active telemetry. Additionally, the nodes along the path can also perform metadata writing operations on the telemetry data. The propagation delay of active telemetry packet for each node is consistent with Equation (1). The active telemetry packet contains only a portion of the service packet header information, telemetry packet header, and telemetry data. The data length of active telemetry packet is relatively small, which means the transmission delay of the node can be set as a constant value . Therefore, the time consumed by the node to complete active awareness is as follows
2.3.3. Reporting Process
The set of distance from each satellite on the current service awareness path to the nearest ground gateway station is . The propagation time for the SGL is as follows:
where represents the wireless transmission rate. Unlike terrestrial network, few nodes in the network can establish stable SGLs at any given moment. Therefore, nodes can only be recognized as potential reporting nodes when stable SGLs exist. represents the time when the current service starts transmitting until the ground gateway station receives the service. The starting transmission time can be defined as , and the time interval of the available link between node and the gateway station is , where and , respectively, represent the moments when the node starts establishing the link and when the link is disconnected, and data reporting can only occur within this interval.
2.3.4. Integrated Network Telemetry
Based on passive telemetry, active telemetry, and the reporting process, along with the time constraints of inter-satellite transmission time and available SGLs intervals, an APINT model is proposed. The telemetry and reporting process of APINT is illustrated in Figure 2.
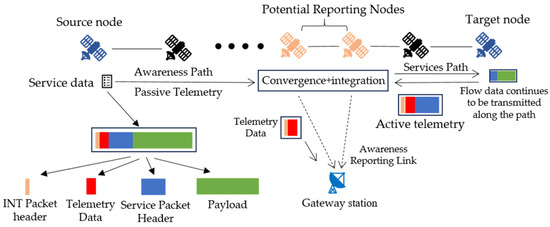
Figure 2.
Telemetry and reporting process of APINT.
When the service starts its transmission, the INT packet is placed in the header of the service packet for passive telemetry. At the same time, the target node sends active telemetry packets in the reverse direction along the service transmission path, towards the source node. During the transmission process, each node can perform metadata writing operations. Then, the INT packets and active telemetry packets converge at a certain node along the path, and the awareness information is integrated on the satellite and transmitted back to the ground along the SGL, while the service continues to transmit along the path to the target node. To avoid impacting the normal transmission of service, the arrival time of active telemetry packets sent in the reverse direction at the aggregation node should be earlier than the arrival time of the service, which means the selection of aggregation nodes on the awareness path is subject to the time constraints, as follows:
where is the aggregation node, with . is the source node and is the target node. Multiple nodes may satisfy the above constraints, and these nodes are all potential selectable reporting nodes, denoted as . The time for the awareness data arrives at the potential reporting nodes is:
However, due to the dynamic and unstable characteristics of the SGLs within satellite networks, only the potential reporting nodes capable of establishing stable SGLs are able to report awareness data. Furthermore, by combining the available SGL intervals of potential reporting nodes, it is possible to determine whether the awareness data can be reported. In this case, three situations exist:
- (1)
- If the awareness data arrive at the potential reporting node before the establishment of the SGL, the awareness data must wait on the satellite until the SGL is successfully established, then the data can be transmitted back to the ground.
- (2)
- If the awareness data arrive at the potential reporting node within the visible link time range of the SGL, and there are no issues of link disconnection during the transmission period, the awareness data can be directly transmitted back to the ground.
- (3)
- If the awareness data arrives when the SGL is already disconnected, the awareness data must wait on the satellite until the next available SGL is established for transmission [21], which results in significant reporting delays.
In summary, the time taken for the awareness data to ultimately reach the gateway station is:
where is the potential satellite-ground transmission time for potential reporting nodes calculated based on Equation (5). represents the time for the next available SGL establishment for the potential reporting node. For each potential reporting node, the awareness time is calculated and the node with the minimum value is selected as the optimal reporting node. The target optimization function is as follows:
where is the transmission time constraints, and potential available reporting nodes on the awareness path can be discovered. and are the awareness time for each potential reporting node.
3. Dynamic Multi-Reporting Nodes Selection Method
In LEO satellite networks, the length of the end-to-end service path is relatively long, and the single-node reporting method can lead to significant awareness delay and overhead due to multi-hop accumulation. Therefore, multiple reporting nodes need to be selected for segmented reporting. When the INT method is applied to terrestrial networks, a fixed hop interval approach is commonly employed to select multiple reporting nodes, due to the relative stability of terrestrial network nodes and links. However, when applied to satellite networks, such methods may result in significant cumulative awareness delays due to unstable ISLs and may also prevent timely reporting of awareness data due to the intermittency of SGLs. In this section, a dynamic multi-reporting nodes selection method of network awareness based on the APINT model is proposed, which can select the optimal number and location of reporting nodes for the awareness path.
The procedure for selecting multi-reporting nodes is illustrated in Figure 3. The selection of the optimal reporting node requires consideration of both the number of reporting nodes and the length of their respective intervals, as both factors jointly influence the telemetry time of the awareness path and the specific location of the reporting node. The issue of selecting multiple reporting nodes can be converted into an interval partitioning optimization problem.
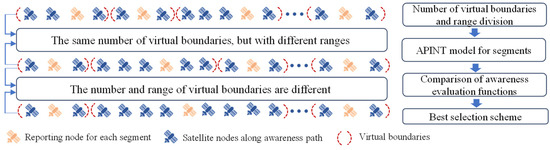
Figure 3.
Procedure for multi-reporting nodes selection.
Therefore, the concept of virtual boundaries is introduced, dividing the multi-hop path into segments, with the set of virtual boundaries for all segments represented as , where the number of satellites in each segment is . Using each segment as the optimization object, the best reporting node is searched for within each segment based on the APINT model. Specifically, upon reaching the virtual boundary starting point of the segment, the service initiates passive telemetry along the route. Conversely, upon reaching the virtual boundary endpoint, it sends active telemetry packets, which are aggregated and reported at the optimal reporting node within the segment. Then the service proceeds to transmit and enter the subsequent segment, repeating the process until it arrives at the target node.
However, the division of different virtual boundaries results in different reporting node selection results, necessitating the selection of the optimal solution from numerous results. Therefore, by considering the awareness time within segments, awareness overhead of segments, and the number of reporting nodes, an awareness evaluation function is constructed. The optimal telemetry and reporting solution for the path is determined by the minimum number of reporting nodes and their respective locations, as indicated by the awareness evaluation function across various scenarios involving different virtual boundary segmentations. The optimization objective function is:
where , , and are the corresponding optimization weights, with . The function of is the normalization function. is the average awareness time of segments. is the average awareness overhead of segments. The specific calculation is as follows.
The telemetry and reporting time for each segment after selecting the optimal reporting node based on the APINT model are . Then, the average telemetry and reporting time for the segments along the entire path is:
Meanwhile, the identifiers of the nodes within each segment are denoted as , and the awareness overhead generated by passive and active telemetry within the segment is as follows:
where and , respectively, represent the lengths of the passive telemetry header and the primary telemetry header. represents the awareness overhead generated during the metadata’s transmission process of node within the segment, and its calculation equation is as follows:
where is the length of the metadata generated by node , and represents the number of hops required for node to reach the reporting node.
4. A Multi-Reporting Nodes Selection Algorithm Based on Lightweight Q-Learning for Various Services
The dynamic selection method for multiple reporting nodes can determine the optimal reporting solution for any service path. However, differences in path hops, distances of ISLs, and available statuses of SGLs among various services further enhance the dynamism and complexity of multi-reporting nodes selection in concurrent multi-service scenarios. Therefore, it is necessary to develop a dynamic solving algorithm to select the optimal reporting solution for various service scenarios. The difficulty of this problem lies in not only adaptively adjusting to the unique characteristics of different service paths, but also reducing the computational complexity of solving the reporting solution within each service path.
Traditional mathematical solving algorithms, such as dynamic programming and linear programming methods, rely on precise environmental models. For multi-service scenarios, such methods necessitate continuous re-modeling and are incapable of facilitating dynamic strategy updates. Machine learning and other artificial intelligence algorithms require substantial data support and lack proactive exploration mechanisms. Q-learning is a model-free reinforcement learning algorithm based on finite Markov decision processes that learns directly from interactions with the environment of uncertain or unknown settings [22]. It is particularly suitable for solving dynamic and complex problems and supports the timeliness of the decision-making process.
In response to the above problems, the Q-learning algorithm is introduced to dynamically solve the dynamic selection problem of multiple reporting nodes in multiple service scenarios. However, during the dynamic partitioning of virtual boundaries, the Q-learning algorithm may encounter the problem of non-adjacent virtual boundary combinations, meaning that the virtual boundaries are discontinuous and the segments fail to achieve comprehensive coverage of nodes along the path. The Q-learning-based dynamic optimization algorithm traverses the effects of all potential actions on state and generates the corresponding -value table. As the number of virtual segments grows, the scope of search and calculation exhibits an exponential expansion, posing a significant challenge to the limited computational capabilities of satellite.
A Q-learning algorithm based on virtual boundary preplanning is proposed, which can optimize the Q-learning search process and reduce the number of iterations. The algorithm flow is shown in Figure 4. Specifically, considering that the flexible selection method for multiple reporting nodes requires awareness of all nodes, and the APINT model needs to start telemetry from the starting points of the virtual boundaries of the segments separately, the virtual boundaries of the sub segments must be adjacent, with no nodes present between them. Meanwhile, the APINT model can expand the awareness range, and to enhance the average telemetry duration of segments, the lengths of these segments are relatively similar. Thus, the equal division method for virtual boundary initialization division is used. The number of satellites within the path is , and the satellite number of each segment is , with . Then, starting from the end of the first segment and the starting point of the second segment, the boundary nodes float back and forth within a certain range , where is the range adjustment factor, which can dynamically adjust the virtual boundary. The process is repeated, and each segment boundary can float based on . Considering that the number of nodes within the segment after dynamic adjustment is:
when is fixed, , which means is monotonically decreasing with respect to . Therefore, to ensure the search scope and maximize both the floating range and the number of segment nodes, the floating range can be set as follows:
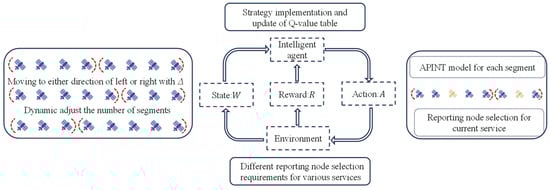
Figure 4.
Q-learning algorithm based on virtual boundary preplanning.
At the same time, by dynamically adjusting the number of reporting nodes , repeating the virtual boundary partitioning and dynamic floating process mentioned above, the optimization of the Q-learning search process can be achieved. Taking the division of the virtual boundary as state . The increase or decrease in the number of segments and the changes to the virtual boundaries are regarded as the action space . The reward function based on the awareness evaluation function can be constructed as:
where is the awareness evaluation function under the new state , where is the regularization penalty coefficient, and represents the number of segments and the division of virtual boundaries in the new state. The -values are updated using , and the update formula is as follows:
where is the learning rate; is the update rate, and , . The pseudocode of the algorithm is presented in Algorithm 1:
| Algorithm 1: Dynamic selection of multiple reporting node based on the improved Q-learning |
| Input: Number of services, ; transmission path of each service, ; maximum number of segments for each service, ; 1 for i 1 to do 2 for j 1 to do (adjust the number of segments) 3 Divide equally into segments with virtual boundary ; |
| 4 Calculate floating range with Equation (15), and the number of potential combinations of virtual boundary is ; 5 for k 1 to do 6 Adjust the virtual boundary with to generate new , which is the state 7 for h 1 to do (using APINT model for each segment) 8 Find potential reporting nodes within segment using Equation (6); 9 Identify the optimal reporting nodes in subsegment based on Equations (8) and (9), which is the action ; 10 Calculate telemetry and reporting time, as well as awareness overhead within subsegment; 11 end 12 Calculate the awareness evaluation function as the reward based on Equation (10); 13 Update the Q value table by using Equation (17); 14 end 15 Find the best virtual boundary division range and the best reporting node location; 16 end 17 Compare the maximum Q-values associated with the optimal virtual boundary divisions in scenarios with different number of segments; 18 Output the optimal reporting nodes’ number, location, awareness time, awareness overhead of current service; 19 end Output: Generate optimal reporting node selections for various services. |
5. Simulation Results and Analysis
In this section, the proposed DRNSM-APINT method will be evaluated through simulation methods. A network of 1584 satellites has been simulated, with the structure similar to the first shell of Starlink, at an average orbital altitude of 550 km. There are 72 orbital planes, each containing 22 satellites. The network comprises 300 traffic services, with an average path length of 20 hops. The telemetry packet is placed at the head of the service packet and the telemetry header has a fixed size of 32 bytes. The maximum cumulative hop for telemetry data is 8 hops. Each node can insert 4 to 8 bytes of metadata, with an insertion time of 0.01 ms, and the propagation time for the active telemetry packet is uniformly set to 0.08 ms.
To the best of our knowledge, limited studies have been conducted on satellite network measurement and selection of reporting nodes. Therefore, this paper adopts the latest methods in terrestrial network awareness research for application in satellite network scenarios, and compares them with the methods presented in this paper.
- (1)
- Flexible and active network telemetry scheme (FAINT): telemetry packets can be actively gathered and measured from nodes along the path, as specified, through the utilization of programmable technology [23].
- (2)
- INT method for segmented routing (SRINT): hop-by-hop awareness of each node along the path utilizing the INT method [20].
- (3)
- Energy-efficient data aggregation method (EEDA): the nodes are selected where there is relatively high remaining of bandwidth on the SGLs for reporting [24].
Figure 5 shows a comparison of the awareness time among the FAINT, SRINT, EEDA, and APINT model at different length of segments. From the figure, it can be seen that due to the FAINT method initiating active telemetry from the reporting node and requiring round-trip collection, the awareness time exhibits a notable increase as the number of hops grows, and is significantly higher than that of the other methods. The SRINT method employs INT to reduce the awareness time, but the awareness time remains relatively higher under the mechanism of target node reporting. The EEDA method selects nodes with abundant resources for reporting, thereby sacrificing a portion of the awareness time. The awareness time of the APINT method is notably shorter than that of the other comparative methods, and the increase in awareness time remains steady as the hop increases. When the hop length is 9, the awareness time of the APINT model is reduced by 34.5% compared to FAINT, 13.7% compared to SRINT, and 8.4% compared to the EEDA method, indicating a significant improvement in awareness timeliness.
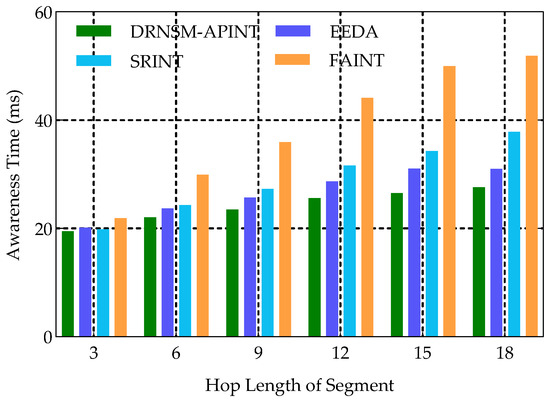
Figure 5.
Comparison of awareness time across different methods.
Figure 6 illustrates the comparison of awareness evaluation function values (EFV) and the awareness overhead under varying numbers of reporting nodes based on the DRNSM-APINT method. As can be seen from Figure 6a, when the path length is less than 10, the EFV corresponding to a single reporting node scenario is smaller. The DRNSM-APINT will prioritize selecting the optimal single reporting node for reporting. Figure 6b illustrates that within the path length interval of 11 to 16, the EFV is minimal in the scenario with two reporting nodes, followed by the scenario with three reporting nodes. And the EFV under single reporting node scenario is the highest. The DRNSM-APINT will prioritize selecting two reporting nodes. From Figure 6c, it can be observed that when the length of path further increases from 18 to 30, the DRNSM-APINT will give priority to deploying three reporting nodes. The corresponding EFV is smaller compared to scenarios where there are two or four reporting nodes. To sum up, the DRNSM-APINT can flexibly and dynamically adjust the number of reporting nodes based on varying service path lengths, and determine the optimal location of the reporting nodes in corresponding scenarios.

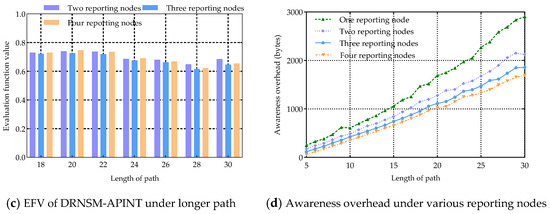
Figure 6.
Comparison of awareness EFV and the awareness overhead of DRNSM-APINT.
Figure 6d shows the awareness overhead associated with various reporting node scenarios across different path lengths. The graph reveals that an increase in the number of reporting nodes leads to a reduction in segment length, subsequently decreasing the awareness overhead caused by accumulation of awareness data within the segments. However, it is noticeable that when there are three or four reporting nodes, the difference in awareness overhead between the two scenarios is small, indicating that the same awareness effect can be achieved by reducing the number of reporting nodes.
Figure 7 shows the performance comparison of the optimal reporting scheme selected by the DRNSM-APINT and other different reporting node selection algorithms. The FHINT method, based on the official INT specification [11], conducts periodic reporting after a fixed number of hops. The SRINT and EEDA method are the same as before.
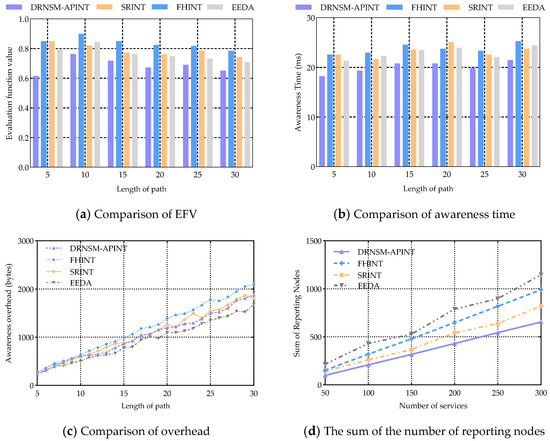
Figure 7.
Performance comparison across various methods.
Figure 7a presents a comparison of EFV across four methods. Specifically, the DRNSM-APINT algorithm selects varying numbers of reporting nodes across different paths. Therefore, the EFV values presented in the figure represent the optimal solutions achieved by the DRNSM-APINT algorithm in various scenarios. From the figure, it can be seen that the FHINT method has the highest EFV, while the SRINT and EEDA methods have smaller EFV. The EFV of DRNSM-APINT algorithm is lower than that of the comparison algorithm under various path scenarios. Taking the 20 hops as an example, DRNSM-APINT can reduce EFV by 17.1% compared to FHINT, 12.3% compared to SRINT, and 8.2% compared to EEDA. This indicates that the DRNSM-APINT method can maintain better awareness performance across different path scenarios.
Figure 7b compares the average awareness time of segments obtained through different methods. It can be seen that the awareness time reported periodically by the FHINT method is generally large, but the fluctuation is small. The SRINT method is limited by the size of the onboard awareness data, resulting in differences in the number of service hops and significant fluctuations in awareness time. EEDA aims to maximize reporting capability, which may result in an increase in some segment links, thereby increasing awareness time. The awareness time of DRNSM-APINT is significantly lower than other compared methods. Taking the 20 hops as an example, DRNSM-APINT reduces awareness time by 17.4% compared to FHINT, 12.4% compared to SRINT, and 13% compared to EEDA, indicating that the proposed method can significantly reduce awareness time. Meanwhile, the DRNSM-APINT has relatively small time fluctuations, indicating that the algorithm has good robustness in complex dynamic scenes.
Figure 7c presents a comparison of the awareness overhead associated with various methods. From the figure, there is no significant difference among the four methods when the service path is short. However, as the path length increases, the overhead of the FHINT method gradually increases, while the overhead of the SRINT and DRNSM-APINT algorithms is relatively close, and the EEDA method is the smallest. This is because DRNSM-APINT adopts active-passive joint telemetry method, which introduces additional telemetry packet headers and increases the awareness overhead. EEDA sacrifices some awareness time to achieve low overhead measurement and reporting, while DRNSM-APINT still has lower overhead than the other two methods.
Figure 7d compares the total number of reporting nodes selected by the four methods across varying numbers of services. From the figure, it can be seen that the number of reporting nodes of EEDA is the largest. This is due to the fact that the method strives to select as many idle nodes with abundant resources as possible for reporting, leading to a substantial and fluctuating number of reporting nodes. The number of reporting nodes for FHINT and SRINT methods is relatively small. The DRNSM-APINT can select fewer reporting nodes than the other comparison methods. When the number of services is 300, the total number of reporting nodes in DRNSM-APINT decreases by 34% compared to FHINT, 20.1% compared to SRINT, and 42.8% compared to EEDA, which can significantly optimize the number of reporting nodes.
Figure 8 presents a comparison of the number of combinations of virtual segment divisions using various methods. The combinations of virtual segment divisions affect the calculation complexity of DRNSM-APINT. The traditional solving algorithm traverses all possible segment partitions along the path, encompassing scenarios where segments are discontinuous. Therefore, with the growth of the path, the number of partition combinations grows exponentially. In this case, the number of combinations can be calculated as the second type of Stirling number [25], and the calculation equation is , where is the number of satellites and is the number of reporting nodes. The Q-learning algorithm also traverses all the possible outcomes, but it can optimize the problem into a combinatorial planning task of continuous segments division based on the reward function. The calculation formula of combination quantity is . The dynamic partitioning of continuous segments division is conducted using a heuristic algorithm, resulting in a further reduction of the number of combinations to , but it is easy to getting trapped in local optimal solutions. The lightweight Q-Learning algorithm based on virtual boundary preplanning that proposed in this paper, combined with the APINT model’s feature of being less influenced by the segment range in selecting reporting nodes, can markedly decrease the number of combinations. Compared with Q-Learning and heuristic algorithm, this method can reduce the number of combinations by one or two orders of magnitude. Meanwhile, considering that the figure only illustrates the calculation complexity involved in selecting reporting nodes within a single service path, the algorithm proposed in this paper demonstrates significant lightweight capabilities in massive service scenarios, alleviating the computational burden in large-scale satellite constellation.
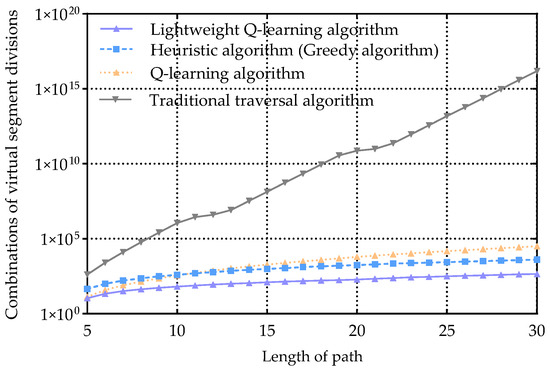
Figure 8.
Comparison of virtual segment division combinations.
6. Conclusions
In this paper, to address the problems of poor timeliness awareness and limited flexibility in selecting reporting nodes within LEO satellite networks, a dynamic reporting nodes selection method of network awareness based on active-passive integrated network telemetry is proposed. This method combines active and passive telemetry on the awareness path and constructs an APINT model to select the optimal reporting node based on the constraints of the inter satellite transmission time and status of SGLs. Furthermore, the awareness path is divided into multi segments, and the APINT model is used to select the optimal reporting node for each segment, achieving flexible selection of multiple reporting nodes. To enable dynamic selection of reporting nodes across various service paths in multiple service scenarios, a lightweight Q-learning algorithm is proposed. Through the pre-planning of virtual boundaries, the computational complexity of Q-learning is reduced, and the optimal number of reporting nodes on each service path is dynamically determined. Through simulation, it was found that the proposed method has good performance and can be flexibly applied to the multi-service scenarios in LEO satellite networks.
Author Contributions
Conceptualization, H.D. and T.D.; methodology, H.D.; software, H.D. and S.W.; validation, H.D. and Z.L.; formal analysis, T.D.; investigation, T.D.; resources, S.W.; data curation, D.Z.; writing—original draft preparation, H.D.; writing—review and editing, Q.Z. and D.Z.; visualization, H.D.; supervision, T.D.; project administration, T.D.; funding acquisition, T.D. All authors have read and agreed to the published version of the manuscript.
Funding
This work was funded in part by the National Natural Science Foundation of China (62331027), and in part by the Young Elite Scientists Sponsorship Program by CAST (2022QNRC001).
Institutional Review Board Statement
Not applicable.
Informed Consent Statement
Not applicable.
Data Availability Statement
The data that support the findings of this study are available from the corresponding author upon reasonable request.
Conflicts of Interest
Author Hang DI, Tao Dong, Zhihui Liu, Shuotong Wei, Qiwei Zhang and Dingyun Zhang were employed by the company Space Star Technology Co., Ltd.,. The remaining authors declare that the research was conducted in the absence of any commercial or financial relationships that could be construed as a potential conflict of interest.
References
- Fu, S.; Wu, B.B.; Wu, S.H. Multi-resources management in 6G-oriented terrestrial-satellite network. China Commun. 2021, 18, 24–36. [Google Scholar] [CrossRef]
- Zeng, G.; Zhan, Y.; Xie, H.; Jiang, C. Resource Allocation for Networked Telemetry System of Mega LEO Satellite Networks. IEEE Trans. Commun. 2022, 70, 8215–8228. [Google Scholar] [CrossRef]
- Mekki, M.; Arora, S.; Ksentini, A. A Scalable Monitoring Framework for Network Slicing in 5G and Beyond Mobile Networks. IEEE Trans. Netw. Serv. 2022, 19, 413–423. [Google Scholar] [CrossRef]
- Dong, C.Y.; Xu, X.; Liu, A.J.; Liang, X.H. Load balancing routing algorithm based on extended link states in LEO constellation network. China Commun. 2022, 19, 247–260. [Google Scholar] [CrossRef]
- Hohemberger, R.; Castro, A.G.; Vogt, F.G. Orchestrating In-Band Data Plane Telemetry with Machine Learning. IEEE Commun. Lett. 2019, 23, 2247–2251. [Google Scholar] [CrossRef]
- Hohemberger, R.; Lorenzon, F.L.; Rossi, F. Optimizing Distributed Network Monitoring for NFV Service Chains. IEEE Commun. Lett. 2019, 23, 1332–1336. [Google Scholar] [CrossRef]
- Yang, K.C.; Long, S.; Shi, Q.L. SketchINT: Empowering INT with tower sketch for per-flow per switch measurement. IEEE TPDS 2023, 34, 2876–2894. [Google Scholar]
- Kim, C.; Sivaraman, A.; Katta, N.; Bas, A. In-band Network Telemetry via Programmable Data Planes. In Proceedings of the ACM SIGCOMM Conference Posters and Demos, London, UK, 17–21 August 2015. [Google Scholar]
- Castro, A.G.; Lorenzon, A.F.; Rossi, F.D. Near-Optimal Probing Planning for In-Band Network Telemetry. IEEE Commun. Lett. 2021, 25, 1630–1634. [Google Scholar] [CrossRef]
- Bosshart, P.; Daly, D.; Izzard, M. Programming Protocol-Independent Packet Processors. ACM SIGCOMM Comput. Commun. Rev. 2013, 44, 87–95. [Google Scholar] [CrossRef]
- P4.org. In-Band Network Telemetry (INT) Data Plane Specification. Available online: https://p4.org/p4-spec/docs/INT_v2_1.pdf (accessed on 11 November 2020).
- Liu, J.C.; Tao, Z.; Ma, J.J. SDN-based in-band network telemetry for low-orbit satellite networks. In Proceedings of the International Conference on Intelligent Computing and Wireless Optical Communications (ICWOC), Chongqing, China, 16–18 June 2023. [Google Scholar]
- Mostafaei, H.; Afridi, S. P4flow: Monitoring traffic flows with programmable networks. IEEE Commun. Lett. 2021, 25, 3546–3550. [Google Scholar] [CrossRef]
- Zeng, G.M.; Zhan, Y.F.; Xie, H.R. Channel Allocation for Mega LEO Satellite Networks in the MEO–LEO Networked Telemetry System. IEEE IoT J. 2023, 10, 2545–2556. [Google Scholar]
- Liu, J.; Shi, Y.; Fadlullah, Z.M. Space-Air-Ground Integrated Network: A Survey. IEEE Commun. Surv. Tutor. 2018, 20, 2714–2741. [Google Scholar] [CrossRef]
- Zhou, D.; Sheng, M.; Bao, C.X. Mission-Driven Resource Scheduling in Satellite-Terrestrial Networks: From Perspective of Collaboration and Reconfiguration. IEEE Trans. Commun. 2025. [Google Scholar] [CrossRef]
- Cao, J.M.; Liu, Y.; Zhou, Y. TurboNet: Faithfully Emulating Networks with Programmable Switches. IEEE Trans. Netw. 2022, 30, 1395–1409. [Google Scholar] [CrossRef]
- Saquetti, M.; Canofre, R.; Lorenzon, A.F. Toward In-Network Intelligence: Running Distributed Artificial Neural Networks in the Data Plane. IEEE Commun. Lett. 2021, 25, 3551–3555. [Google Scholar] [CrossRef]
- Wang, R.H.; Lin, Y.S.X.; Chen, A.D. SD-INT: Towards Lightweight Network-Wide Passive INT in the Self-Driving Way. In Proceedings of the 2023 IEEE 31st International Conference on Network Protocols (ICNP), Reykjavik, Iceland, 10–13 October 2023. [Google Scholar]
- Zheng, Q.T.; Tang, S.F.; Chen, B.F. Highly-Efficient and Adaptive Network Monitoring: When INT Meets Segment Routing. IEEE Trans. Netw. Serv. Manag. 2021, 18, 2587–2597. [Google Scholar] [CrossRef]
- Cao, Y.R.; Shi, Y.P.; Liu, J.J. Optimal Satellite Gateway Placement in Space-Ground Integrated Network for Latency Minimization with Reliability Guarantee. IEEE Wirelss Commun. Lett. 2018, 7, 174–177. [Google Scholar] [CrossRef]
- Chen, T.J.; Liu, J.; Qiang, Y. Efficient Uplink Transmission in Ultra-Dense LEO Satellite Networks with Multiband Antennas. IEEE Wirelss Commun. Lett. 2022, 26, 1373–1377. [Google Scholar] [CrossRef]
- Liu, Y.; Xia, Y.; Zhang, W.T. SFANT: A SRv6-Based Flexible and Active Network Telemetry Scheme in Programming Data Plane. IEEE Trans. Netw. Sci. Eng. 2024, 11, 2415–2425. [Google Scholar] [CrossRef]
- Reddy, K.N.; Shukla, A.; Sivasubramanian, S. Energy-Efficient IoT Data Aggregation Framework Using Low-Power Wide-Area Networks. In Proceedings of the 2024 International Conference on IoT, Communication and Automation Technology, Gorakhpur, India, 23–24 November 2024. [Google Scholar]
- Boyadzhiev, K.N. Close Encounters with the Stirling Numbers of the Second Kind. Math. Mag. 2012, 85, 252–266. [Google Scholar] [CrossRef]
Disclaimer/Publisher’s Note: The statements, opinions and data contained in all publications are solely those of the individual author(s) and contributor(s) and not of MDPI and/or the editor(s). MDPI and/or the editor(s) disclaim responsibility for any injury to people or property resulting from any ideas, methods, instructions or products referred to in the content. |
© 2025 by the authors. Licensee MDPI, Basel, Switzerland. This article is an open access article distributed under the terms and conditions of the Creative Commons Attribution (CC BY) license (https://creativecommons.org/licenses/by/4.0/).