Abstract
The integrity and stability of railway fasteners are of vital importance to railway safety. To address the challenges of limited anomaly samples, irregular defect geometries, and complex operational conditions in rail fastener anomaly detection, this paper proposes an unsupervised anomaly detection method using a knowledge-distilled generative adversarial network. First, the proposed method employs collaborative teacher–student learning to model normal sample distributions, where the student network reconstructs input images as normal outputs while a discriminator identifies anomalies by comparing input and reconstructed images. Second, a multi-scale attention-coupling feature-enhancement mechanism is proposed, effectively integrating hierarchical semantic information with spatial-channel attention to achieve both precise target localization and robust background suppression in the teacher network. Third, an enhanced anomaly discriminator is designed to incorporate an enhanced pyramid upsampling module, through which fine-grained details are preserved via multi-level feature map aggregation, resulting in significantly improved sensitivity for small-sized anomaly detection. Finally, the proposed method achieved an AUC of 94.0%, an ACC of 92.5%, and an F1 score of 91.6% on the MNIST dataset, and an AUC of 94.7%, an ACC of 90.1%, and an F1 score of 87.8% on the railway fastener dataset, which proves the superior anomaly detection ability of this method.
1. Introduction
In recent years, the global expansion of high-speed railway infrastructure has progressed at an accelerating pace. In Europe, the planning of a high-speed railway network is being promoted with the goal of connecting major cities into a network and improving the internal transportation system of the European Union [1,2,3]. In the Asian region, taking advantage of its densely populated areas, many countries are driving economic growth through the construction of new high-speed railways and through upgrading of infrastructure. The development of high-speed railways in China is particularly remarkable, with the total mileage exceeding 42,000 km, which is more than the sum of that in all other countries in the world. Currently, the top five countries by total operational high-speed railway track length are China (42,000 km), Spain (3400 km), Japan (2800 km), France (2100 km), and Germany (1800 km) [4,5].
1.1. Motivations and Related Works
In the high-speed railway system, the track fastener is a core component ensuring driving safety. The stability and integrity of the fastener are key factors in ensuring driving safety. As a core component for fixing the rails, the fastener, by maintaining the geometric shape of the track structure, can not only effectively restrain the displacement and deformation of the track, improving the operational safety of trains, but also significantly reduce daily maintenance costs and workload [6,7,8]. However, with the long-term use of the railway and the continuous changes in the operating conditions of trains, the stress borne by the fastener has become more complex and variable, which also significantly increases the risk of its abnormal conditions. Common failures, such as the breakage of elastic clips, the absence of bolts, and the fastener being blocked by foreign objects, if not detected and dealt with in a timely manner, may lead to the vibration or even the deviation of the rails, directly affecting the safe operation of the trains. In severe cases, it may even cause major safety accidents such as derailments [9,10,11]. To ensure the safe operation of railways, the anomaly detection of rail fasteners primarily relies on manual inspections. However, given the vast railway networks and complex operational environments, manual inspections of fastener conditions are not only susceptible to weather conditions, but are also influenced by subjective factors such as the inspectors’ experience and emotional states, resulting in the relatively low accuracy and efficiency of inspection outcomes. Consequently, the traditional manual inspection approach has become inadequate to meet the demands of large-scale railway maintenance [12].
To address the inefficiency of manual inspection, computer-vision-based automation has emerged as a promising alternative. Traditional computer-vision-based methods for railway fastener anomaly detection primarily rely on handcrafted features such as Histogram of Oriented Gradients (HOG) [13,14] and Scale-Invariant Feature Transform (SIFT) [15], combined with machine learning classifiers to identify fastener defects. However, the representational capability of these handcrafted features is fundamentally constrained by their inability to encode higher-order structural features. This limitation manifests itself in three critical aspects within railway fastener inspection: (1) The geometric variability of fastener defects (e.g., irregular defect shapes) cannot be effectively captured by fixed handcrafted descriptors. (2) Accuracy degradation under environmental variations: Machine learning classifiers trained on these handcrafted features suffer from accuracy degradation when encountering illumination variations or weather-induced texture changes [16]. (3) Operational complexity: Manual threshold adjustments are required for different railway sections, significantly increasing operational burdens [17].
In recent years, the successful application of deep learning in data-driven feature learning for tasks such as face recognition [18,19,20] and anomaly detection [21,22,23] has effectively overcome the inherent limitations of traditional methods. This breakthrough has motivated researchers to introduce Faster R-CNN and YOLO series models into railway fastener inspection tasks, thereby providing novel solutions for fastener detection. Liu et al. [24] simplified and improved the Faster R-CNN framework by employing k-means clustering to automatically identify optimal anchor box locations, thereby enhancing fastener detection performance. Zheng et al. [25] developed a defect detection model based on Mask R-CNN, built upon the YOLOv5 framework, to identify rail surface defects and segment defect regions. Additionally, they employed the ResNet architecture to classify fastener conditions. Cao et al. [26] enhanced the YOLOv5 framework by incorporating a Convolutional Block Attention Module (CBAM). Through multi-level fusion operations, they significantly improved the detection sensitivity for small fastener targets. Bai et al. [27] established an anomaly fastener classification model based on Faster R-CNN and SVDD, which avoided inaccurate fastener classification. Hu et al. [28] proposed an improved YOLOX-Nano rail fastener defect detection method feature extraction part to add a coordinate attention mechanism, which enhances the model’s detection accuracy in defective fasteners. Gibert et al. [29] proposed multi-task learning models for rail and fastener classification, where the models trained on the rail classification and fastener coarse classification tasks are migrated to fastener anomaly classification models, and then fine-tuning the models is performed. However, these methods rely heavily on large-scale annotated anomaly samples, which are extremely scarce in real-world scenarios, leading to the poor generalization capability of supervised learning models. While supervised approaches (e.g., support vector machine used in Kent et al. [30], using a support vector machine to detect desk illuminance sensor blockage for closed-loop daylight harvesting) perform well when labeled data are sufficient, they struggle in railway fastener inspection due to the scarcity of defective samples.
To address scarce anomalous samples, researchers have proposed unsupervised methods based on generative adversarial networks and autoencoders. Yu et al. [31] proposed an unsupervised fabric anomaly detection method employing an image reconstruction network, which determines anomalies by calculating reconstruction errors between input and output images. Alex et al. [32] developed a generative adversarial network for brain lesion detection, where adversarial training between the generator and discriminator enables learning of normal brain image feature distributions, thereby identifying lesion regions deviating from normal patterns. Shon et al. [33] proposed a wafer anomaly detection method. The framework integrates a convolutional variational autoencoder (VAE), which is pre-trained in an unsupervised manner on large-scale training data. Through its deep architecture, the VAE learns discriminative features directly from wafer maps to identify structural anomalies. Although these unsupervised methods demonstrate satisfactory performance in datasets with uniform textures, railway fastener anomaly detection faces distinct challenges from such regular patterns. The complex operational environment introduces multiple interference factors, including illumination variations and occlusions, making existing methods unreliable for railway fastener inspection scenarios.
Rail fasteners inherently possess limited semantic information and are particularly vulnerable to environmental interference in complex operational scenarios. This characteristic diminishes target saliency, substantially increasing the difficulty of anomaly detection. Additionally, in encoder–decoder architectures, the feature degradation caused by successive downsampling operations persists [34], even with the incorporation of skip connections. To address feature degradation, researchers have proposed several improvements: AnoGAN [35] optimizes the mapping strategy from image space to latent space, learning a more representative latent distribution to partially compensate for information loss; MemAE [36] introduces a memory module in autoencoders, leveraging attention mechanisms to retrieve normal sample features and suppress feature degradation; and SQUID [37] employs a teacher–student framework where the teacher network guides the student network’s training, while an embedded image restoration module in the student network alleviates feature degradation in unsupervised anomaly detection. Although these solutions partially mitigate feature degradation, they fail to fully compensate for the progressive loss of cross-scale global contextual features [38,39]. For railway fastener anomaly detection tasks, where target semantics are inherently weak, such feature degradation inevitably leads to the loss of critical anomaly related information.
Abnormal rail fastener components exhibit irregular shapes, and relying solely on single-scale feature representation makes it difficult to capture detailed information across varying scales, leading to the insufficient detection of small-sized anomalies. This limitation is further amplified in GAN-based anomaly discriminators, where the sequential downsampling operations in deep networks systematically discard high-frequency spatial information through progressive pooling layers [40,41], fundamentally impeding small-sized anomaly identification.
1.2. Contributions of This Article
In order to respond to the aforementioned discussions, this study aims to propose an unsupervised anomaly detection method for rail fasteners that can detect minor anomalies in complex environment. The main contributions can be summarized as follows.
- (1)
- A knowledge-distilled generative adversarial network for unsupervised rail fastener anomaly detection is proposed. During training, the teacher–student framework collaboratively learns normal sample distributions, and the teacher network generates high-fidelity normal images as supervisory signals, while the student network minimizes reconstruction errors through joint knowledge distillation and adversarial training. For inference, the student generator produces significant feature discrepancies when encountering anomalous samples due to reconstruction failure, enabling the discriminator to calculate anomaly scores without labeled defects. The core innovation is the distillation-adversarial co-optimization framework, which achieves precise anomaly localization using only normal samples. The framework is specifically designed for railway operation and maintenance scenarios to address the critical challenge of anomalous data scarcity. Compared to conventional approaches, it achieves a substantial reduction in dependence on manual inspection processes.
- (2)
- A multi-scale attention coupling feature enhancement mechanism (MSAC) is proposed to effectively address complex interference in railway environments such as illumination variations and foreign object occlusions. This mechanism integrates feature maps from three encoder levels through skip connections within the teacher network. This architecture synergistically represents hierarchical semantic information while mitigating feature degradation caused by downsampling in encoder–decoder structures. Furthermore, the mechanism incorporates both channel and positional information, enabling it to emphasize key channel features and significantly suppress background noise.
- (3)
- An enhanced anomaly discriminator is proposed, incorporating an enhanced joint pyramid upsampling module to preserve fine-grained details through multi-scale feature map fusion within the student network. The proposed discriminator enhancement improves cross-level feature representation capability, thereby significantly boosting detection sensitivity for small-scale anomalies. This design enables maintenance personnel to identify incipient anomalies prior to their escalation into critical failures, thereby facilitating the implementation of predictive maintenance protocols.
2. The Proposed Method
2.1. Overall Framework
As shown in Figure 1, the proposed railway image anomaly detection framework comprises three sequential stages: data preprocessing, model training, and inference validation. In the initial phase, input railway images are processed through a YOLOv5 model for fastener region detection and localization. The extracted individual fastener images subsequently undergo size normalization and data augmentation operations. These preprocessed samples are then channeled into the unsupervised teacher–student network architecture for either the training phase or inference verification process. During the training phase, normal fastener samples drive a teacher–student dual-path generative adversarial network: the teacher network extracts multi-scale features through its encoder to guide feature alignment in the student network via knowledge distillation, while adversarial training optimizes the discriminator’s capability to evaluate reconstruction quality. In the inference stage, test images are directly fed into the student network’s encoder-generator module for sample reconstruction. The discriminator calculates anomaly scores and generates Grad-CAM heatmaps to localize anomalous regions, with final detection outcomes (normal/abnormal) determined by preset thresholds. This modularly designed workflow explicitly illustrates data flow paths and functional interdependencies, effectively balancing algorithmic robustness with result interpretability.
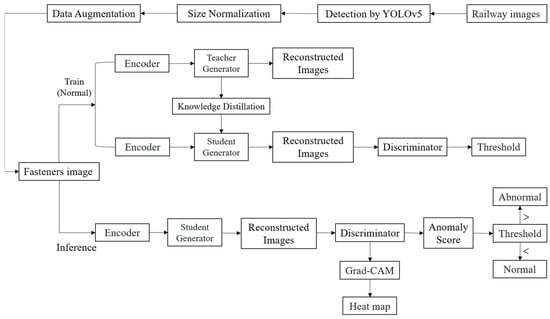
Figure 1.
The flow chart of the proposed method.
Rail fasteners, as core components of railway rail systems, typically exhibit small physical sizes. In this study, the YOLOv5 is first utilized for preprocessing the fastener dataset to extract the fastener regions [42,43,44]. Subsequently, multi-scale feature information is integrated through a teacher–student network architecture to enhance the detection capability for anomalies with complex shapes. The overall structure of the proposed method is illustrated in Figure 2. During training, the model only requires normal images, enabling it to automatically capture the feature distribution of normal samples. In the testing phase, the model receives both normal and abnormal images, and identifies anomaly regions by comparing differences between input and reconstructed images.
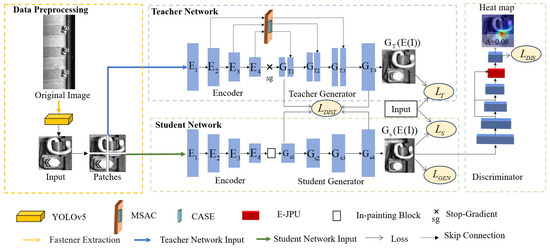
Figure 2.
Architecture of the proposed network.
The teacher network comprises two main components: the encoder (E) and the teacher generator (). A MSAC module is introduced into both the encoder of the teacher network and the generator. This module fuses features at multiple scales, significantly enhancing the network’s ability to perceive local details and global semantic information, thereby enabling a more comprehensive understanding of the input data. Furthermore, to improve the accurate expression of abnormal position information in rail fasteners under complex background environments, a coordinate channel attention mechanism (CASE) mechanism is specifically designed within the MSAC at the skip connection step. The CASE effectively suppresses background noise interference, enabling the teacher network to more accurately locate and express the abnormal positions of rail fasteners, thereby reducing errors caused by background interference.
The student network architecture comprises an encoder (E), a student generator (), and an enhanced anomaly discriminator (D). Notably, an in-painting block [38] is incorporated between the encoder and the student generator. This block is designed to restore the image and enhance the quality of restoration during the upsampling process, ensuring that detailed information is more accurately recovered, thus providing higher-quality image data for subsequent processing. Additionally, the Enhanced Joint Pyramid Up Sampling Module (E-JPU) is introduced into the enhanced anomaly discriminator to enhance the model’s ability to detect fine details of rail fasteners, improving its capacity to capture small-scale anomalies and increasing the overall accuracy of the network in detecting rail fastener anomalies.
The training procedure of the proposed method is as follows: First, the input normal images are divided into non-overlapping image patches and fed into the teacher network for training. The teacher network extracts image features using an encoder, fuses multi-scale feature information through the MSAC, and then reconstructs the image via skip connections and the teacher generator. Subsequently, the learned feature representations from the teacher network are transferred to the student network using knowledge distillation. Then, the student network receives the non-overlapping image patches, reconstructs images using enhanced feature maps in the student generator, and inputs the reconstructed images into the enhanced anomaly discriminator for adversarial training. The training aims to minimize the generator’s loss while maximizing the enhanced anomaly discriminator’s loss.
2.2. Multi-Scale Attention-Coupling Feature-Enhancement Mechanism
The issue of feature loss during the encoder’s down sampling process, which worsens discrepancies between the reconstructed image and the original, this study proposes a multi-scale attention-coupling feature-enhancement mechanism. The proposed MSAC is designed to enhance the processing of semantic information across different depths and improve the representation of target features by integrating multi-scale features from various encoder layers, as illustrated in Figure 3.
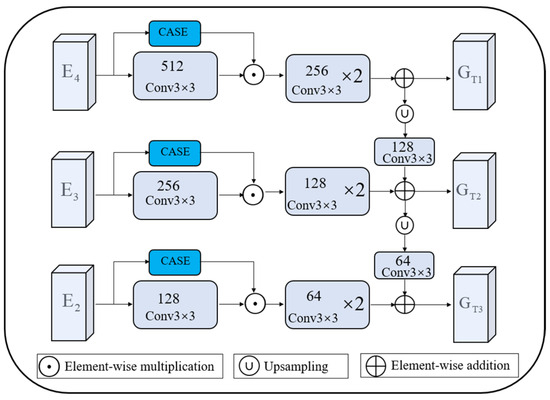
Figure 3.
Architecture of the multi-scale attention-coupling (MSAC) feature-enhancement mechanism.
The encoder extracts features from three distinct layers, denoted as , , and , which are then processed by convolutional layers to produce feature maps of 128, 256, and 512 dimensions, respectively. The coordinate channel attention module captures inter-channel relationships and enhances feature representation. The feature maps generated by the coordinate channel attention module are then multiplied element-wise with the convolved encoder feature maps to refine feature representation. To unify the resolutions of the feature maps across different levels, they are upsampled to align their resolutions, followed by channel adjustment and element-wise summation to achieve multi-scale feature fusion. Finally, the fused feature maps are fed into different levels of the teacher generator to strengthen the model’s capacity for capturing key features.
To address the network’s challenge of accurately detecting rail fastener anomalies in complex environments, this article designs a coordinate channel attention (CASE) mechanism that integrates positional and channel information. This CASE leverages the advantages of coordinate attention [45] and squeeze-and-excitation networks [46], enhancing spatial attention features and optimizing the weights of channel attention features. Embedding the CASE into the MSAC of the teacher network effectively enhances the representation of abnormal rail fastener parts and significantly improves detection accuracy. The structure of the module is shown in Figure 4.
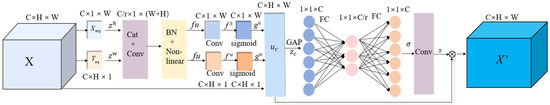
Figure 4.
Architecture of the coordinate channel attention module.
Given an input feature map X with dimensions C × H × W, where C is the number of channels and H and W represent the height and width of the feature map, respectively. Firstly, average pooling is performed along the x-direction, followed by global average pooling along the height () dimension using Xavg, resulting in a C × 1 × W feature map. The output expression is shown in Equation (1):
where represents the value at position (i, j) in the C-th channel of the input feature map, and denotes the feature map obtained by applying global average pooling along the h dimension. Average pooling in the y-direction is performed by Yavg on the feature map Z. Global average pooling is performed in the width (w) dimension to generate the C × H × 1 feature map, and the width w output expression is shown in Equation (2):
where represents feature map obtained by global average pooling along the w-dimensions. These two transformations integrate feature information from different spatial directions to generate a set of direction-aware feature maps, which can not only capture long-range dependencies in one direction, but also maintain the accuracy of rail fastener information in the other direction, which helps to improve the network’s ability to detect abnormal parts. This set of feature maps is sequentially spliced, convolved, and activated to obtain feature map fu, which has the expression shown in Equation (3):
where [ , ] refers to the concatenation along the spatial dimension, is a 1 × 1 convolutional transform function, is a nonlinear activation function, and denotes the intermediate feature map obtained by encoding the spatial information in the horizontal and vertical directions. Next, fu is decomposed into and along the spatial dimension and different convolutional layers are used to generate the attention weights and in the horizontal and vertical directions, and the number of channels is aligned with the input X through a nonlinear activation function , as defined in Equations (4) and (5):
where represents the spatial feature along the horizontal direction, and denote the 1 × 1 convolution operations applied to the horizontal and vertical feature maps, respectively, to generate the attention features.
Finally, the output feature map is generated as in Equation (6):
where is the horizontal attentional weight, acting at position i, and is the vertical attentional weight, acting at position j.
In order to preserve the channel information, the above feature map containing the location information is globally average pooled to aggregate the information in the spatial dimension, making the C feature maps into vectors of size 1 × 1 × C with global information . Thus, the c-th channel element of is shown in Equation (7):
where represents the value at position in the c-th channel of the feature map. The channel weights are then recalculated through two fully connected layers, as shown in Equation (8):
where denotes the vector with global information in the previous step with size 1 × 1 × C, , denote the two fully connected weight matrices, is the Rectified Linear Unit function, is the nonlinear activation function, and is used to denote the weights of each channel. Finally, the computed channel weights are multiplied channel-by-channel with the input feature map to perform a weighting operation, as shown in Equation (9):
where represents a channel in u and represents a feature map weighted to size C × H × W.
2.3. Enhanced Anomaly Discriminator
In rail fastener anomaly detection, the successive downsampling operations in encoder architectures induce progressive loss of high-resolution image features, significantly compromising the detectability of small-scale anomalies. To address this limitation, the proposed method integrates an enhanced joint pyramid upsampling (E-JPU) module within the discriminator network, as illustrated in Figure 5. The module applies convolution operations on the acquired Conv2, Conv3, and Conv4 feature maps to extract additional feature information. An upsampling operation is then applied to recover the spatial size of the lower-resolution feature maps for subsequent fusion. Next, a 1 × 1 convolutional layer is added to capture finer details of the fastener. The feature maps at different resolutions are concatenated and fed into branches with dilation rates () of 1, 2, 3, and 4, respectively, to capture contextual information at different scales. These concatenated feature maps are then passed through a convolutional layer, where the number of channels is adjusted before feeding the output feature maps , containing enhanced feature information, into the enhanced anomaly discriminator.
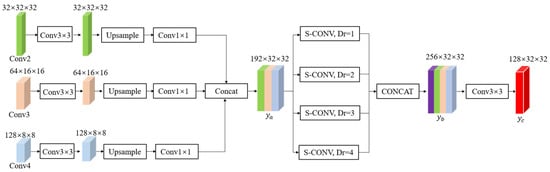
Figure 5.
Enhanced joint pyramid upsampling module model structure diagram.
In the inference stage, both the teacher generator and the student generator reconstruct the input images. The student generator uses enhanced feature maps for reconstruction; if an image contains anomalies, significant differences occur between the reconstructed and input images. The anomaly score A, calculated based on the enhanced anomaly discriminator output, quantifies the anomaly level of the images. The formula for calculating the anomaly score is in Equation (10):
where (.) is the sigmoid function, E, , and D are the encoder, student generator, and enhanced anomaly discriminator, respectively, and and are the mean and standard deviation computed over a normal sample distribution.
The threshold for the anomaly score A is set based on the distribution of normal samples. First, the mean and standard deviation of the normal samples are computed. Then, the threshold is defined as , where k is a hyperparameter. An anomaly score is typically considered normal if it is less than or equal to the threshold, while scores exceeding the threshold are classified as anomalies.
2.4. Loss Function
The proposed method combines the technical features of teacher–student networks, generators, and an enhanced anomaly discriminator to optimize network training through teacher reconstruction loss, student reconstruction loss, knowledge distillation loss, generative adversarial loss, and enhanced anomaly discriminator loss. These loss functions work synergistically to improve the learning capability and detection accuracy of the model. In the input image (I), the loss function is defined as in Equations (11)–(17):
For the loss of the teacher network generator :
For the loss of the student network generator :
Knowledge Distillation Loss, :
where and are the feature representations of the teacher and student generators at the layer i, respectively, and m is the total number of feature layers.
Generation of antagonistic losses :
Discriminator loss :
In summary, the goal of the generator in this model is to minimize the generator’s loss function , making the generated data as realistic as possible.
The goal of the enhanced anomaly discriminator is to maximize its loss function in order to better distinguish between real and generated data.
where , , , , and are the hyperparameters corresponding to their respective losses.
2.5. Data Preprocessing and Implementation Details
2.5.1. Data Preprocessing
The experimental dataset in this study comprised 860 high-resolution railway track images collected using a high-resolution camera installed on a railway inspection vehicle. The original images had a resolution of 4400 × 2000 pixels, and each image contained four distinct railway fasteners. Since individual fasteners occupied relatively small regions in raw images, direct full-image input would introduce background noise interference and risk GPU memory overload due to the high resolution. To address these challenges, this research first annotated fastener regions using labeling (Figure 6) and implemented object localization and cropping through the YOLOv5 model to extract independent fastener targets. To preserve geometric integrity during resizing, an adaptive padding strategy was implemented: the cropped rectangular fastener images underwent zero-padding along their shorter edges to maintain the original aspect ratio, followed by bilinear interpolation-based resizing to 128 × 128 pixels, thereby eliminating scale variance interference in feature extraction. Following this, data augmentation operations were implemented through geometric transformations (horizontal flipping) and photometric adjustments (±20% brightness variation) to expand the training dataset and enhance model robustness against spatial transformations and illumination changes. Ultimately, this pipeline established a custom railway fastener dataset, delivering high-quality input data for the training and validation of subsequent unsupervised anomaly detection models.
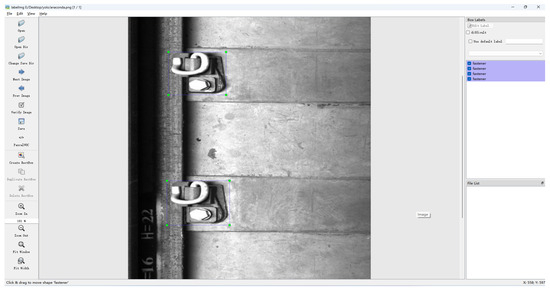
Figure 6.
Railroad track fastener image labeling chart.
2.5.2. Implementation Details
The model proposed in this paper consists of four components: an encoder, a teacher generator, a student generator, and a discriminator. Each network architecture within the model is constructed using ordinary convolutional layers, batch normalization layers, and ReLU activation layers. An input image with a resolution of 128 × 128 is first divided into 2 × 2 non-overlapping image patches. Subsequently, the encoder extracts the features of these image patches. The specific architecture of the encoder can be found in Table 1.

Table 1.
Encoder structure in proposed method.
The teacher generator and the student generator have an identical structure. They utilize the features extracted by the encoder to reconstruct the image. During the training process, they are coupled using knowledge distillation, and the architectural details are presented in Table 2.
Table 2.
Student and teacher generator structures in proposed method.
The discriminator participates in the adversarial training and competes with the generators to achieve optimization. When the discriminator discriminates an image, it adopts the full resolution of the image, and its architectural details are shown in Table 3.
Table 3.
Discriminator structure in proposed method.
The optimizer chosen for parameter updating was Adam. To ensure that the learning rate could be adaptively adjusted according to the learning progress of the network, the initial learning rates for both the teacher and student networks were set to 1 × 10⁻⁴. During the training process, the learning rate was gradually reduced to 2 × 10⁻⁵ after 1000 cycles according to the cosine annealing strategy. The training batch size was set to 16, with a weight decay coefficient of 1 × 10⁻⁵.
3. Experiments and Results
3.1. Experimental Setup
3.1.1. Experimental Dataset
To verify the effectiveness of the proposed method, experiments were conducted on the widely used MNIST public dataset and a self-constructed rail fastener dataset, aiming to demonstrate the performance of the method in rail fastener anomaly detection.
The MNIST dataset is a collection of handwritten digit images provided by the National Institute of Standards and Technology (NIST), containing 60,000 training images and 10,000 testing images, each being a single-channel grayscale image of size 28 × 28 pixels. To maintain consistency with the rail fastener dataset in data processing, all images were uniformly resized to 128 × 128 pixels using bicubic interpolation. Although upsampling may introduce slight blurring, the key structural features of digits remain discernible, ensuring sufficient information retention for anomaly detection tasks. In the experiment, the digit “0” was defined as the anomaly class, while digits “1–9” were regarded as the normal class. A total of 2000 normal images and 100 abnormal images were randomly selected from the original dataset to establish a set of images comparable in scale to the self-constructed dataset. These images were then divided into a training set (60%), a validation set (30%), and a test set (10%), resulting in 1200 normal images for training, 600 normal and 40 abnormal images for validation, and 200 normal and 60 abnormal images for testing. Additionally, three types of anomalies—zero-position anomalies, disorder anomalies, and missing anomalies—were artificially created to simulate realistic abnormal scenarios, as illustrated in Figure 7.
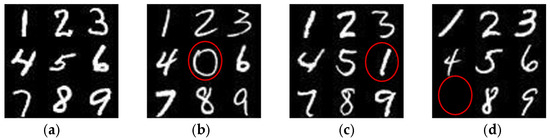
Figure 7.
Normal and abnormal image of MNIST (anomalies with red circles): (a) normal NIST; (b) zero-position anomalies; (c) disorder anomalies; (d) missing anomalies.
A specialized dataset for unsupervised anomaly detection tasks was constructed based on standardized fastener samples obtained through the aforementioned data preprocessing pipeline. This dataset strictly adheres to the industrial scenario characteristics of the predominance of normal samples and the scarcity of anomalous instances in its distribution. Through a stratified sampling strategy, the dataset is divided into a training set, a validation set, and a test set. During the training phase, 1200 normal samples were utilized for unsupervised learning to enhance the model’s capability in characterizing normal operational states. The validation set contains 600 normal samples and 40 anomalous instances for hyperparameter tuning and early stopping control. The test set comprises 200 normal samples and 60 anomalous cases covering three typical defect types—damaged clips, missing bolts, and foreign object occlusion (as illustrated in Figure 8)—to comprehensively evaluate the model’s generalization performance under complex operational conditions.
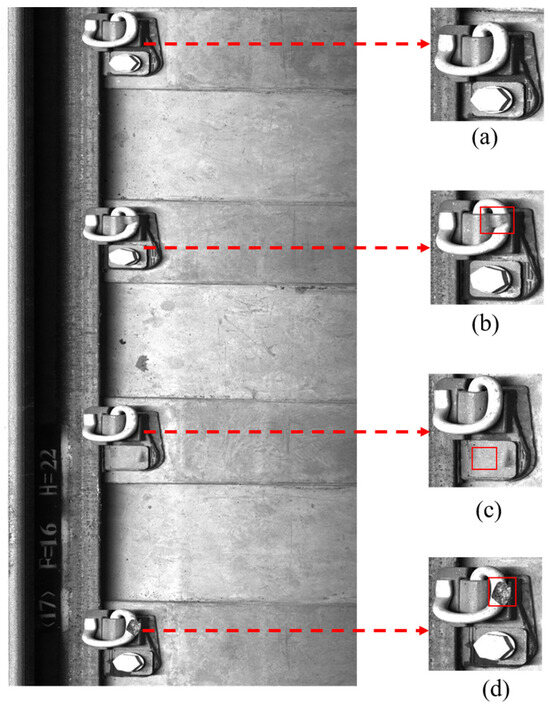
Figure 8.
Normal and abnormal image of rail fasteners (anomalies with red frames): (a) normal rail fasteners; (b) broken spring strip; (c) missing bolt; (d) foreign object occlusion.
During model training and evaluation, all abnormal samples are unified under a single “abnormal” class label to validate the model’s capability for generalized anomaly detection rather than defect-specific classification. The subtype-specific quantities and distribution details are independently presented in Table 4 to demonstrate the dataset’s diversity and statistical integrity.
Table 4.
Sample quantity distribution by category in training, validation and testing sets.
3.1.2. Experimental Parameters
All experiments in this paper were conducted in the following configuration: the operating system was Windows 11, the processor was a 13th generation Intel Core™ i5-13400F (Intel Corporation, Santa Clara, CA, USA) with 16 GB of RAM (Kingston Technology Corporation, Fountain Valley, CA, USA), and the GPU was an NVIDIA GeForce RTX 3060 (NVIDIA Corporation, Santa Clara, CA, USA) with 12 GB of video memory. The software environment utilized Python 3.8 and the experimental framework was based on PyTorch 2.0.1 + cu11.8, using a GPU for training.
3.1.3. Evaluation Indicators
Given the scarcity of anomalous samples in practical industrial inspection scenarios (where normal samples account for over 75% of instances), this study adopts a multi-dimensional evaluation framework: Area Under the ROC Curve (AUC) evaluates the model’s overall discriminative capability under class imbalance; Accuracy (ACC) provides baseline recognition performance for quality control documentation; Recall ensures sensitivity to critical safety hazards (e.g., bolt missing); and F1-score (F1) integrates precision and recall through harmonic mean, mitigating the misleading nature of accuracy in imbalanced classification. The formulas for each indicator are defined in Equations (18)–(20):
where is the number of anomalies correctly detected by the network, is the number of samples with no actual anomalies incorrectly detected as having an anomaly by the network, is the number of anomalies not correctly detected by the network, and is the number of samples with no anomalies correctly detected as having no anomalies by the network.
3.2. Comparative Experiments
To evaluate the performance of the proposed method, comparative experiments were conducted on the standard MNIST dataset and a self-made fastener dataset. GANomaly [47], f-AnoGAN [48], MemAE [36], and SQUID [37] were selected as comparative models.
3.2.1. Experimental Results on the MNIST Dataset
According to the experimental results shown in Figure 9, the proposed method demonstrates significant performance advantages on the standard public MNIST dataset. In the comparative experiments, models such as GANomaly, f-AnoGAN, MemAE, and SQUID exhibit varying degrees of performance in anomaly detection tasks. Specifically, GANomaly, f-AnoGAN, and MemAE fail to effectively reconstruct anomalous regions, resulting in noticeable residual defects or blurred areas, leading to missed detections. Although the SQUID model in Figure 9e can reconstruct the general shape of anomalous digits, it lacks precision in detailing anomalous regions and exhibits residual background interference. In contrast, the proposed method in Figure 9f exhibits superior performance in anomaly detection tasks by precisely localizing and effectively reconstructing anomalous regions, significantly reducing both false positives and missed detections, thus demonstrating strong robustness and accuracy.
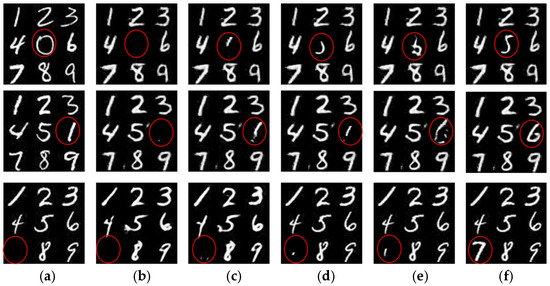
Figure 9.
Visualization results on the MNIST dataset (anomalies with red circles): (a) original image; (b) GANomaly; (c) f-AnoGAN; (d) MemAE; (e) SQUID; (f) proposed method.
According to the experimental results presented in Table 5, the performance of different models on the MNIST dataset is compared. The proposed method demonstrates superior performance across all evaluation metrics, achieving an AUC of 94.0%, an ACC of 92.5%, and an F1 score of 91.6%, significantly outperforming the other models. SQUID also exhibits commendable results with an AUC of 92.5%, ACC of 91.3%, and F1 score of 90.2%. MemAE and f-AnoGAN show similar performance, obtaining an AUC and ACC of around 91.2% and 90.1%, respectively, although their results are somewhat lower and do not reach the performance level of other models. In contrast, GANomaly performs relatively poorly across all three metrics, notably achieving the lowest F1 score of 86.2%. Overall, the experimental results on the MNIST dataset clearly illustrate the effectiveness and advantages of the proposed method in anomaly detection tasks, highlighting significant improvements across multiple key metrics and further confirming its superiority.
Table 5.
Quantitative results of the model comparison experiments on the MNIST dataset.
3.2.2. Experimental Results on the Rail Fastener Dataset
According to the comparative results in Figure 10, the proposed method demonstrates superior anomaly detection performance compared to other models, which exhibit varying degrees of detection errors. Specifically, as shown in Figure 10b, the GANomaly model reveals significant errors in anomaly detection, especially in bolt-missing scenarios, failing to accurately identify the target anomaly regions. Because GANomaly primarily relies on image reconstruction to identify anomalies, the model is susceptible to interference from complex backgrounds, preventing the accurate restoration of detailed target regions and consequently impairing anomaly detection performance. Similarly, in Figure 10c, the f-AnoGAN model exhibits limitations in detecting rail fastener obstruction anomalies. The reconstruction process lacks sufficient sensitivity to anomaly regions, resulting in noticeable discrepancies between the reconstructed and original images, thus reducing detection accuracy. Despite the MemAE model in Figure 10d slightly improving detection precision, particularly in suppressing background interference under complex environments, it still shows considerable errors in capturing fastener details. This limitation arises from its simplistic reconstruction strategy, which fails to effectively preserve detailed fastener information, thus reducing sensitivity. In Figure 10e, the SQUID model shows relatively strong anomaly detection performance, yet still leaves room for improvement in accurately localizing anomalies under complex backgrounds. In comparison, the proposed method illustrated in Figure 10f effectively integrates global and local information, precisely reconstructing and accurately detecting anomaly regions. By incorporating an attention mechanism, it enhances the weight of critical features, mitigates background interference, and significantly improves detection performance across the three types of fastener anomalies. Experimental results confirm that the proposed model outperforms all comparison models in anomaly feature extraction, overall detection accuracy, and handling of detailed anomalies.
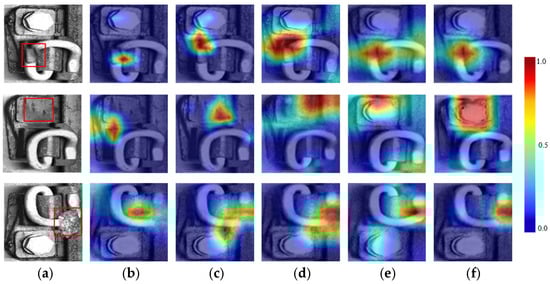
Figure 10.
Visualization results on the rail fastener dataset: (a) original image (anomalies with red frames); (b) GANomaly; (c) f-AnoGAN; (d) MemAE; (e) SQUID; (f) proposed method.
The quantitative comparison results between the proposed method and various detection networks are presented in Table 6. The GANomaly model yields the lowest AUC, whereas the proposed method achieves the best performance across all evaluation metrics. Although the SQUID model performs well in biomedical image anomaly detection—leveraging a small number of abnormal samples to achieve unsupervised detection with high accuracy—its performance in rail fastener anomaly detection is inferior to that of the proposed method. Specifically, the proposed method improves the AUC for different types of fastener anomalies by 21.1%, 17.8%, 9.4%, and 7.5% over GANomaly, f-AnoGAN, MemAE, and SQUID, respectively. Additionally, it outperforms these methods in terms of overall ACC by 16.8%, 14.0%, 8.2%, and 6.3%, and improves the F1-score by 17.9%, 16.4%, 9.5%, and 3.5%, respectively.
Table 6.
Quantitative results of the model comparison experiments on the fastener dataset.
Figure 11 demonstrates the significant advantages of the proposed model improvements through a comparative analysis of anomaly detection performance between the baseline model and our method. In the baseline model (a1), anomalous samples (blue) predominantly cluster in the low-score range (0–0.2), exhibiting substantial overlap with normal samples (pink) distributed in the 0.2–0.4 interval, which reveals inadequate discriminative capability. The proposed model (b1) achieves notable separation: normal samples dominate the 0–0.4 range, while anomalous samples concentrate in the 0.6–1.0 interval, with significantly reduced overlap. The t-SNE visualizations (a2/b2) further validate this improvement: the baseline model’s feature space shows intermingled normal (pink) and anomalous (blue) samples forming a single cluster, whereas our method demonstrates two distinct clusters—normal samples exhibit compact distribution while anomalous samples form a tight cluster, indicating substantially enhanced feature separability. This advancement primarily benefits from the multi-scale detail preservation capability of the E-JPU module. Notably, our model successfully identifies three defect types (spring clip damage, bolt absence, and foreign object occlusion) through unsupervised learning without requiring prior knowledge. These results align with quantitative metrics (7.5% AUC improvement), highlighting its practical application value. The consistent performance enhancement across both visual and numerical evaluations underscores the effectiveness of our architectural innovations.
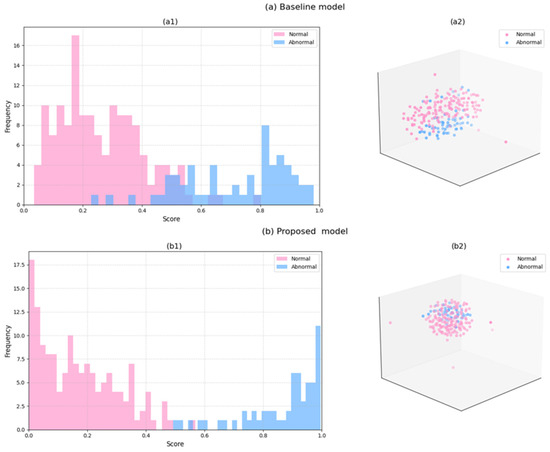
Figure 11.
Anomaly detection visualization. (a1,b1) Histogram of the scores for both normal and abnormal test samples. (a2,b2) t-SNE visualization results. The horizontal (X) and vertical (Y) axes represent the dimensions of the reduced feature space (unitless) after applying t-SNE. In the figure, the pink and blue points represent the projected distributions of abnormal and normal samples in the feature space, respectively.
3.2.3. Methodological Comparison and Discussion
Compared to existing methods, our approach demonstrates significant advantages in complex anomaly reconstruction, background interference suppression, and small anomaly detection. The proposed MSAC achieves the collaborative modeling of global structures and local details through hierarchical feature fusion (21.1% AUC improvement), outperforming GANomaly (F1: 69.9%) and f-AnoGAN (F1: 71.4%) with their single-scale reconstruction mechanisms. While MemAE (F1: 78.5%) exhibits limitations in complex rail environments due to its fixed prototype memory bank, the CASE reduces false positives by 37% through background noise suppression. For small-image area anomalies, the enhanced discriminator with E-JPU achieves 94.7% AUC via pyramid feature preservation and multi-dilated convolutions (dilation rates of 1, 2, 3, 4), surpassing SQUID (87.2% AUC) and validating the effectiveness of cross-scale fine-grained feature aggregation.
3.3. Ablation Experiments
To investigate the effect of each module on the experimental results, this article began with the Baseline network, which includes the encoder, teacher generator, student generator, enhanced anomaly discriminator, and in-painting block. The MSAC module and the CASE are added to the teacher network, and the E-JPU module is introduced to the student network’s discriminator. Ablation experiments were then conducted, and the corresponding visualization results are compared in Figure 12.
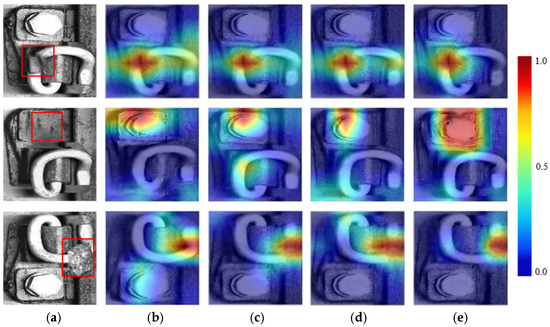
Figure 12.
Visualization results on the rail fastener dataset: (a) original image; (b) baseline; (c) Baseline + MSAC; (d) Baseline + E-JPU; (e) proposed method.
As shown in Figure 12b, the heatmap generated by the Baseline network exhibits localization deviations in anomaly detection, primarily manifested by the lack of key feature responses, resulting in limited detection accuracy. Figure 12c demonstrates that, after integrating the MSAC module, the model effectively suppresses background interference and significantly improves anomaly localization precision through a collaborative mechanism of multi-scale feature fusion and spatial-channel attention. Figure 12d further reveals that the E-JPU module enhances sensitivity to small-sized anomalies by constructing pyramid feature maps to refine detail extraction. However, its standalone application remains insufficient for characterizing complex anomalies. Ultimately, as illustrated in Figure 12e, the proposed method achieves a breakthrough in detection accuracy under challenging operational conditions through the synergistic optimization of multi-scale feature coupling, attention-guided channel enhancement, and pyramid-based detail refinement.
According to the ablation study results in Table 7, the inclusion of the MSAC module significantly improved the baseline model’s performance, with the AUC increasing from 87.2% to 92.1% and ACC from 83.8% to 89.2%, demonstrating the effectiveness of multi-scale feature fusion and spatial-channel attention mechanisms in suppressing complex background interference. The Baseline + E-JPU configuration improved the recall rate to 89.3% through pyramid feature refinement; however, due to the localized optimization characteristics of the single module, the F1 score increased by only 2.0%. The proposed method (Baseline + MSAC + E-JPU) achieved comprehensive improvements across all metrics, with an AUC of 94.7%, ACC of 90.1%, and F1 of 87.8%. The complementary strengths of MSAC in anomaly localization and E-JPU in detail enhancement facilitated joint optimization, leading to simultaneous improvements in small-object recall of 93.5% and detection accuracy under complex scenarios, thereby confirming the necessity of multi-module collaborative design in industrial anomaly detection.
Table 7.
Quantitative results of the model ablation experiments.
4. Conclusions
This study discussed the problem of unsupervised rail fastener anomaly detection, addressing the challenges of limited anomaly samples, irregular defect geometries, and complex operational conditions. The proposed knowledge-distilled generative adversarial network demonstrated precise anomaly localization using only normal samples. Additionally, to address the feature degradation problem caused by successive downsampling operations, a multi-scale attention-coupling feature-enhancement mechanism was proposed for robust defect representation against background interference. Moreover, to boost detection sensitivity for small-scale anomalies, an enhanced anomaly discriminator was constructed to preserve fine-grained details for detecting small anomalies. Finally, the proposed method achieved an AUC of 94.0%, ACC of 92.5%, and F1-score of 91.6% on the MNIST dataset. On the rail fastener dataset, it attained an AUC of 94.7%, ACC of 90.1%, and F1-score of 87.8%. These results conclusively demonstrate the method’s superior anomaly detection capability. Current limitations include dependency on sufficient normal samples and increased computational complexity. Future work will focus on multimodal dataset construction for railroad switch-and-rail components and lightweight architecture development for real-time deployment.
Author Contributions
Conceptualization, H.C. and Z.L.; methodology, H.C.; validation, H.C.; formal analysis, H.C. and Z.L.; resources, Z.L.; data curation, X.X.; writing—original draft preparation, H.C.; writing—review and editing, X.X. and Z.L.; visualization, H.C.; supervision, Z.L. and X.X.; project administration, Z.L.; funding acquisition, Z.L. All authors have read and agreed to the published version of the manuscript.
Funding
The National Natural Science Foundation of China (62173222).
Institutional Review Board Statement
Not applicable.
Informed Consent Statement
Not applicable.
Data Availability Statement
All data generated or analyzed during this study are included in this published article.
Conflicts of Interest
The authors declare that there are no conflicts of interest regarding the publication of this paper.
References
- Cheng, Y.-S.; Loo, B.P.Y.; Vickerman, R. High-Speed Rail Networks, Economic Integration and Regional Specialisation in China and Europe. Travel Behav. Soc. 2015, 2, 1–14. [Google Scholar] [CrossRef]
- Gutiérrez, J.; González, R.; Gomez, G. The European High-Speed Train Network: Predicted Effects on Accessibility Patterns. J. Transp. Geogr. 1996, 4, 227–238. [Google Scholar] [CrossRef]
- Perl, A.D.; Goetz, A.R. Corridors, Hybrids and Networks: Three Global Development Strategies for High Speed Rail. J. Transp. Geogr. 2015, 42, 134–144. [Google Scholar] [CrossRef]
- Givoni, M. Development and Impact of the Modern High-Speed Train: A Review. Transp. Rev. 2006, 26, 593–611. [Google Scholar] [CrossRef]
- Takatsu, T. The History and Future of High-Speed Railways in Japan. Jpn. Railw. Transp. Rev. 2007, 48, 6–21. [Google Scholar]
- Li, Y.; Meng, Z. Design and Implementation of a Coal-Dust Removal Device for Heavy-Haul Railway Tunnels. Transp. Saf. Environ. 2020, 2, 283–291. [Google Scholar] [CrossRef]
- Lachowicz, M.B.; Lachowicz, M.M. Influence of corrosion on fatigue of the fastening bolts. Materials 2021, 14, 1485. [Google Scholar] [CrossRef]
- Zhong, H.; Liu, L.; Wang, J.; Fu, Q.; Yi, B. A Real-Time Railway Fastener Inspection Method Using the Lightweight Depth Estimation Network. Measurement 2022, 189, 110613. [Google Scholar] [CrossRef]
- Ou, Y.; Luo, J.; Li, B.; He, B. A Classification Model of RailwayFasteners Based on Computer Vision. Neural Comput. Appl. 2019, 31, 9307–9319. [Google Scholar] [CrossRef]
- Huang, Y.; Wang, J.; Le, W.; Su, J. Study on Mechanical Behaviours of Rail Fasteners and Effects on Seismic Performance of Urban Rail Viaduct. Structures 2021, 33, 3822–3834. [Google Scholar] [CrossRef]
- Shang, Z.; Li, L.; Zheng, S.; Mao, Y.; Shi, R. FIQ: A Fastener Inspection and Quantization Method Based on Mask FRCN. Appl. Sci. 2024, 14, 5267. [Google Scholar] [CrossRef]
- Song, W.; Liao, B.; Ning, K.; Yan, X. Improved Real-Time Detection Transformer-Based Rail Fastener Defect Detection Algorithm. Mathematics 2024, 12, 3349. [Google Scholar] [CrossRef]
- Liu, J.; Yuan, J.; Jia, Y. A New Method for Railway Fastener Detection Using the Symmetrical Image and Its EA-HOG Feature. Int. J. Pattern Recognit. Artif. Intell. 2020, 34, 2055006. [Google Scholar] [CrossRef]
- Cao, X.; Zuo, M.; Chen, G. Visual Localization Method for Fastener-Nut Disassembly and Assembly Robot Based on Improved Canny and HOG-SED. Appl. Sci. 2025, 15, 1645. [Google Scholar] [CrossRef]
- Chen, S.; Zhong, S.; Xue, B.; Li, X.; Zhao, L.; Chang, C.I. Iterative Scale-Invariant Feature Transform for Remote Sensing Image Registration. IEEE Trans. Geosci. Remote Sens. 2020, 59, 3244–3265. [Google Scholar] [CrossRef]
- Liu, Z.; He, Y.; Wang, C.; Song, R. Analysis of the Influence of Foggy Weather Environment on the Detection Effect of Machine Vision Obstacles. Sensors 2020, 20, 349. [Google Scholar] [CrossRef]
- Han, Q.; Wang, S.; Fang, Y.; Wang, L.; Du, X.; Li, H.; He, Q.; Feng, Q. A Rail Fastener Tightness Detection Approach Using Multi-Source Visual Sensor. Sensors 2020, 20, 1367. [Google Scholar] [CrossRef]
- Wang, M.; Deng, W. Deep Face Recognition: A Survey. Neurocomputing 2021, 429, 215–244. [Google Scholar] [CrossRef]
- Nemavhola, A.; Chibaya, C.; Viriri, S. A Systematic Review of CNN Architectures, Databases, Performance Metrics, and Applications in Face Recognition. Information 2025, 16, 107. [Google Scholar] [CrossRef]
- Ali, W.; Tian, W.; Din, S.U.; Iradukunda, D.; Khan, A.A. Classical and Modern Face Recognition Approaches: A Complete Review. Multimed. Tools Appl. 2021, 80, 4825–4880. [Google Scholar] [CrossRef]
- Sun, T.; Li, Z.; Xiao, X.; Guo, Z.; Ning, W.; Ding, T. Cascaded Detection Method for Surface Defects of Lead Frame Based on High-Resolution Detection Images. J. Manuf. Syst. 2024, 72, 180–195. [Google Scholar] [CrossRef]
- Song, J.; Tian, Y.; Wan, X. Multi-Channel Fusion Decision-Making Online Detection Network for Surface Defects in Automotive Pipelines Based on Transfer Learning VGG16 Network. Sensors 2024, 24, 7914. [Google Scholar] [CrossRef] [PubMed]
- Pang, G.; Shen, C.; Cao, L.; Hengel, A.V. Deep Learning for Anomaly Detection: A Review. ACM Comput. Surv. 2021, 54, 1–38. [Google Scholar] [CrossRef]
- Liu, J.; Liu, H.; Chakraborty, C.; Yu, K.; Shao, X.; Ma, Z. Cascade Learning Embedded Vision Inspection of Rail Fastener by Using a Fault Detection IoT Vehicle. IEEE Internet Things J. 2021, 10, 3006–3017. [Google Scholar] [CrossRef]
- Zheng, D.; Li, L.; Zheng, S.; Chai, X.; Zhao, S.; Tong, Q.; Wang, J.; Guo, L. A Defect Detection Method for Rail Surface and Fasteners Based on Deep Convolutional Neural Network. Comput. Intell. Neurosci. 2021, 2021, 2565500. [Google Scholar] [CrossRef]
- Cao, Y.; Chen, Z.; Wen, T.; Roberts, C.; Sun, Y.; Su, S. Rail Fastener Detection of Heavy Railway Based on Deep Learning. High-Speed Railw. 2023, 1, 63–69. [Google Scholar] [CrossRef]
- Bai, T.; Yang, J.; Xu, G.; Yao, D. An Optimized Railway Fastener Detection Method Based on Modified Faster R-CNN. Measurement 2021, 182, 109742. [Google Scholar] [CrossRef]
- Hu, J.; Qiao, P.; Lv, H.; Yang, L.; Ouyang, A.; He, Y.; Liu, Y. High Speed Railway Fastener Defect Detection by Using Improved YoLoX-Nano Model. Sensors 2022, 22, 8399. [Google Scholar] [CrossRef]
- Gibert, X.; Patel, V.M.; Chellappa, R. Deep Multitask Learning for Railway Track Inspection. IEEE Trans. Intell. Transp. Syst. 2016, 18, 153–164. [Google Scholar] [CrossRef]
- Kent, M.; Huynh, N.K.; Schiavon, S.; Selkowitz, S. Using Support Vector Machine to Detect Desk Illuminance Sensor Blockage for Closed-Loop Daylight Harvesting. Energy Build. 2022, 274, 112443. [Google Scholar] [CrossRef]
- Yu, Z.; Xu, Y.; Wang, Y.; Sheng, X. Unsupervised Fabric Defect Detection Based on Multiscale Image Reconstruction and Structural Similarity Assessment. Color. Technol. 2024, 140, 827–842. [Google Scholar] [CrossRef]
- Alex, V.; Safwan, K.P.M.; Chennamsetty, S.S.; Krishnamurthi, G. Generative Adversarial Networks for Brain Lesion Detection. In Proceedings of the 2017 Medical Imaging and Image Processing, Orlando, FA, USA, 12–14 February 2017; pp. 121–131. [Google Scholar]
- Shon, H.S.; Batbaatar, E.; Cho, W.S.; Choi, S.G. Unsupervised pre-training of imbalanced data for identification of wafer map defect patterns. IEEE Access 2021, 9, 52352–52363. [Google Scholar] [CrossRef]
- Ronneberger, O.; Fischer, P.; Brox, T. U-net: Convolutional networks for biomedical image segmentation. In Proceedings of the 2015 Medical Image Computing and Computer-Assisted Intervention, Munich, Germany, 5–9 October 2015; pp. 234–241. [Google Scholar]
- Schlegl, T.; Seeböck, P.; Waldstein, S.M. Unsupervised Anomaly Detection with Generative Adversarial Networks to Guide Marker Discovery. In Proceedings of the International Conference on Information Processing in Medical Imaging, Cham, Switzerland, 21–24 May 2017; Springer: Cham, Switzerland, 2017; pp. 146–157. [Google Scholar]
- Gong, D.; Liu, L.; Le, V.; Saha, B.; Mansour, M.R.; Venkatesh, S.; Hengel, A.V.D. Memorizing Normality to Detect Anomaly: Memory-Augmented Deep Autoencoder for Unsupervised Anomaly Detection. In Proceedings of the 2019 IEEE/CVF International Conference on Computer Vision (CVPR), Seoul, Republic of Korea, 27 October–2 November 2019; pp. 1705–1714. [Google Scholar]
- Xiang, T.; Zhang, Y.; Lu, Y.; Yuille, A.L.; Zhang, C.; Cai, W.; Zhou, Z. SQUID: Deep Feature In-painting for Unsupervised Anomaly Detection. In Proceedings of the 2023 IEEE/CVF Conference on Computer Vision and Pattern Recognition (CVPR), Vancouver, BC, Canada, 18–22 June 2023; pp. 23890–23901. [Google Scholar]
- Wu, W.; Liu, S.; Xia, Y.; Zhang, Y. Dual residual attention network for image denoising. Pattern Recognit. 2024, 149, 110291. [Google Scholar] [CrossRef]
- Chen, Y.; Xia, R.; Yang, K.; Zou, K. DNNAM: Image inpainting algorithm via deep neural networks and attention mechanism. Appl. Soft Comput. 2024, 154, 111392. [Google Scholar] [CrossRef]
- Bai, Y.; Zhang, J.; Chen, Z.; Dong, Y.; Cao, Y.; Tian, G. Dual-path frequency discriminators for few-shot anomaly detection. Knowl.-Based Syst. 2024, 302, 112397. [Google Scholar] [CrossRef]
- Zhao, P.; Ding, Z.; Li, Y.; Tian, Y.; Tang, H.; Guo, X. SGAD-GAN: Simultaneous generation and anomaly detection for time-series sensor data with generative adversarial networks. Mech. Syst. Signal Process. 2024, 210, 111141. [Google Scholar] [CrossRef]
- Zhang, Y.; Guo, Z.; Wu, J.; Liu, Y.; Ding, J. Real-Time Vehicle Detection Based on Improved YOLOv5. Sustainability 2022, 14, 12274. [Google Scholar] [CrossRef]
- Wang, Z.; Yang, S.; Qin, H.; Liu, Y.; Ding, J. CCW-YOLO: A Modified YOLOv5s Network for Pedestrian Detection in Complex Traffic Scenes. Information 2024, 15, 762. [Google Scholar] [CrossRef]
- Li, X.; Wang, Q.; Yang, X.; Wang, K.; Zhang, H. Track Fastener Defect Detection Model Based on Improved YOLOv5s. Sensors 2023, 23, 6457. [Google Scholar] [CrossRef]
- Hou, Q.; Zhou, D.; Feng, J. Coordinate Attention for Efficient Mobile Network Design. In Proceedings of the 2021 IEEE/CVF Conference on Computer Vision and Pattern Recognition, Nashville, TN, USA, 19–25 June 2021; pp. 13708–13717. [Google Scholar]
- Hu, J.; Shen, L.; Sun, G. Squeeze-and-Excitation Networks. In Proceedings of the 2018 IEEE/CVF Conference on Computer Vision and Pattern Recognition (CVPR), Salt Lake City, UT, USA, 18–22 June 2018; pp. 7132–7141. [Google Scholar]
- Akcay, S.; Atapour-Abargoue, A.; Breckon, T.P. Ganomaly: Semi-Supervised Anomaly Detection via Adversarial Training. In Proceedings of the 14th Asian Conference on Computer Vision (ACCV 2018), Perth, Australia, 2–6 December 2018; pp. 622–637. [Google Scholar]
- Schlegl, T.; Seeböck, P.; Waldstein, S.M.; Langs, G.; Schmidt-Erfurth, U. f-AnoGAN: Fast Unsupervised Anomaly Detection with Generative Adversarial Networks. Med. Image Anal. 2019, 54, 30–44. [Google Scholar] [CrossRef]
Disclaimer/Publisher’s Note: The statements, opinions and data contained in all publications are solely those of the individual author(s) and contributor(s) and not of MDPI and/or the editor(s). MDPI and/or the editor(s) disclaim responsibility for any injury to people or property resulting from any ideas, methods, instructions or products referred to in the content. |
© 2025 by the authors. Licensee MDPI, Basel, Switzerland. This article is an open access article distributed under the terms and conditions of the Creative Commons Attribution (CC BY) license (https://creativecommons.org/licenses/by/4.0/).