Article

Primary Stability Assessment of Patient-Specific Transfemoral Osseointegrated Implants During Static Load-Bearing Exercise: A Comparative Analysis

Department of Engineering, University of Palermo, Viale delle Scienze Ed.8, 90128 Palermo, Italy
*
Author to whom correspondence should be addressed.
Appl. Sci. 2025, 15(11), 5913; https://doi.org/10.3390/app15115913 (registering DOI)
Submission received: 27 March 2025 / Revised: 13 May 2025 / Accepted: 22 May 2025 / Published: 24 May 2025

Abstract

:
The long-term effectiveness of osseointegrated implants is heavily dependent on the short-term stability, primarily achieved immediately after surgery through a mechanical connection between the bone and the implant. The most common implant designs nowadays are straight and rely on screw or press-fit fixtures. Despite the promising results achieved by current transfemoral implants, the incidence of early failures and complications is still high. Starting from the hypothesis that a patient-specific approach could lead to better primary stability immediately post-surgery, this study aims to investigate the effect of implant design on primary stability. This was performed by analyzing two patient-specific implants, customized according to the medullary canal morphology, and a simple straight implant as the reference standard. To quantitatively assess the primary stability, a comparative computational analysis was conducted to examine the effective contact area, the relative micromotion, and the stress distribution at the interface between the bone and the implant stem during a static load-bearing exercise. The results showed that implants that follow the curvature of the residual femur provide lower micromotion values and a wider contact area, with a reduction of up to 30.4% and an increase of 10.8%, respectively, compared to the straight design, leading to a more homogeneous load distribution. Patient-specific prosthetic implants allow a more homogenous contact distribution that could lead to higher primary stability by reducing micromotion at the bone–implant interface concerning the straight profile, lowering the risk of loosening related to the short-term stability.

1. Introduction

The osseointegration (OI) process is widely used as a long-term anchoring method for several applications, such as in maxillofacial reconstruction, arthroplasty, or dental applications [1]. In the last 30 years, OI was adopted to treat limb amputation by providing a stable fixation between the stump and the prosthetic limb. Recently, new implant solutions have been developed by exploiting OI to allow the connection between the residual bone of an amputee limb and the external prosthetic components [2,3,4,5]. The OI phenomenon consists of bone ingrowth around the implant; the effectiveness of bone augmentation guarantees the achievement of good long-term stability (secondary stability) [2,4,5,6,7,8,9]. Primary stability could be defined as a short-term condition and is achieved through the mechanical connection between the prosthesis and the bone [4,6,10]. More recently, press-fit implants have been developed, for which the primary stability relies on the geometric interference [2,5,8,11,12]. However, excessive interference could lead to adverse events such as periprosthetic fracture and implant failure [7,13,14]. Conversely, an unstable press-fit condition could involve an elevated risk of mobilization in the short or long term [7,8,12,15,16,17,18,19]. In the literature, the effectiveness of primary stability is evaluated by assessing the relative micromotion between the prosthetic implant and the surrounding bone [10,13,15,17]. Micromotion at the bone–implant interface is a critical biomechanical factor influencing the success of osseointegration. It is well established that the type of new tissue formed at the bone–implant interface is directly influenced by the level of micromotions. Specifically, elevated micromotions exceeding 50 µm are known to promote the development of fibrous tissue rather than desirable bone tissue, resulting in suboptimal long-term stability [15,20,21,22]. The range from 50 to 150 µm is considered the threshold of acceptable micromotions for achieving favorable osseointegration [13,14,17,20]. For this reason, the morphological matching between the stem and medullary canal plays a fundamental role in obtaining good stability [13,14,23]. In this perspective, the hypothesis that a description of the geometry closer to the real shape of the medullary canal could lead to better surface matching between the stem and the bone and to reduced relative micromotion immediately post-surgery is considered in this study.
Several studies investigated the primary stability at the bone–implant interface through experimental, radiological, and clinical assessments, supplying after-surgery evaluations [10,13,24,25,26]. Both short- and long-term evaluations could be achieved by computational studies and are widely used to quantify the relative motion that may occur at the bone–implant interface, providing valuable information for preclinical evaluations and new prosthesis designs [2,6,13,15,16,17,20,27,28].
Only a few computational models have been developed to investigate the press-fitted transfemoral osseointegrated implants [6,29,30,31,32]. Moreover, most of them approximate the interface between the bone and the implant as totally or partially bonded, simulating the various conditions of OI and not considering the relative micromotion [18,29,30,31,33,34,35,36]. Prochor et al. have assessed the micromotion at the bone–implant interface, investigating the influence of the geometry (length and diameter) on the primary stability, but considering only a straight profile, without assessing the influence of the anatomical shape of the medullary canal [6].
The main goal of this study is to determine if a patient-specific implant design enhances immediate post-operative primary stability. We therefore compared two implants customized on the basis of medullary canal morphology with a standard straight implant as the reference. We want to investigate if a patient-specific approach that exploits the implant design to increase the performance in terms of primary stability can improve the bone formation and produce a more homogeneous stress distribution, which may contribute to the reduction in the bone loosening risk. To quantify the effect of the design on the primary stability, a finite element analysis was carried out to compare the patient-specific designs versus the standard straight one by assessing the effective contact area, the contact pressure, and if the relative micromotions at the bone–implant interface cross the value of 50 µm.

2. Materials and Methods

The workflow consisted of three successive steps detailed below: the CT scan segmentation, where the 3D bone model of the patient is obtained; the CAD modeling, to create the patient-specific designs and to replicate the surgical procedure; and a finite element analysis, to assess the performance of the prosthesis.

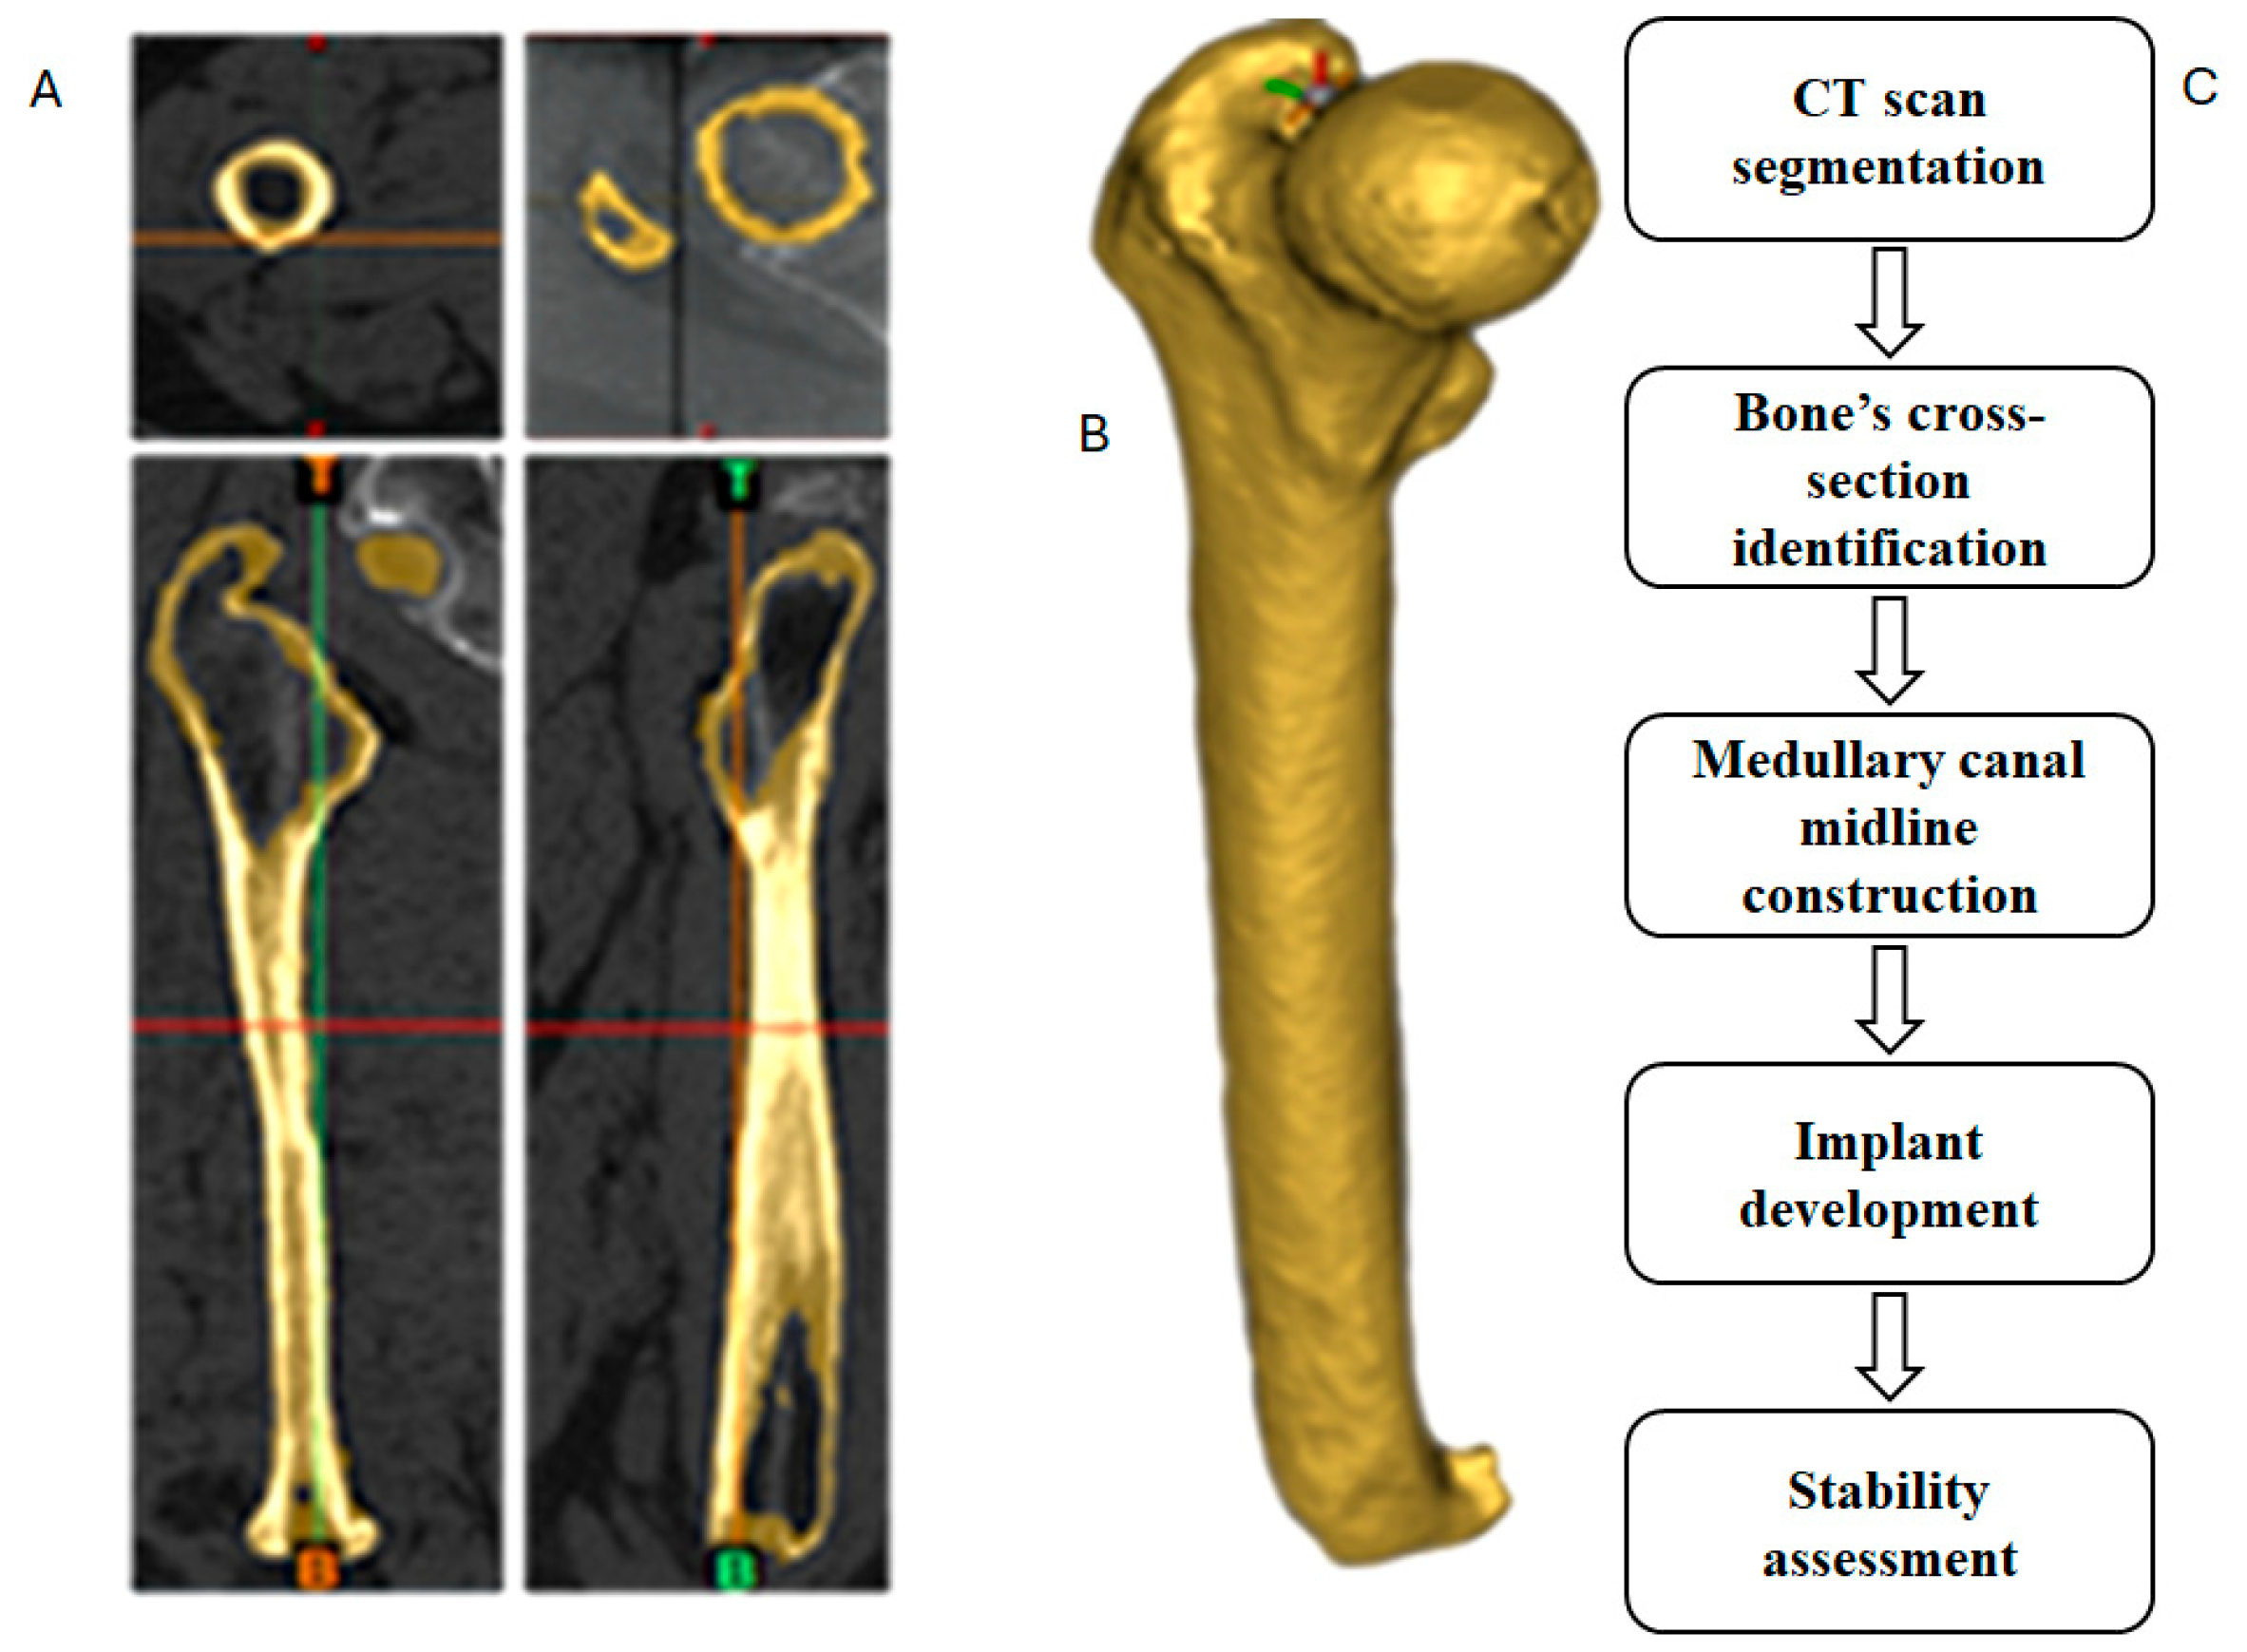
2.1. CT Scan Segmentation
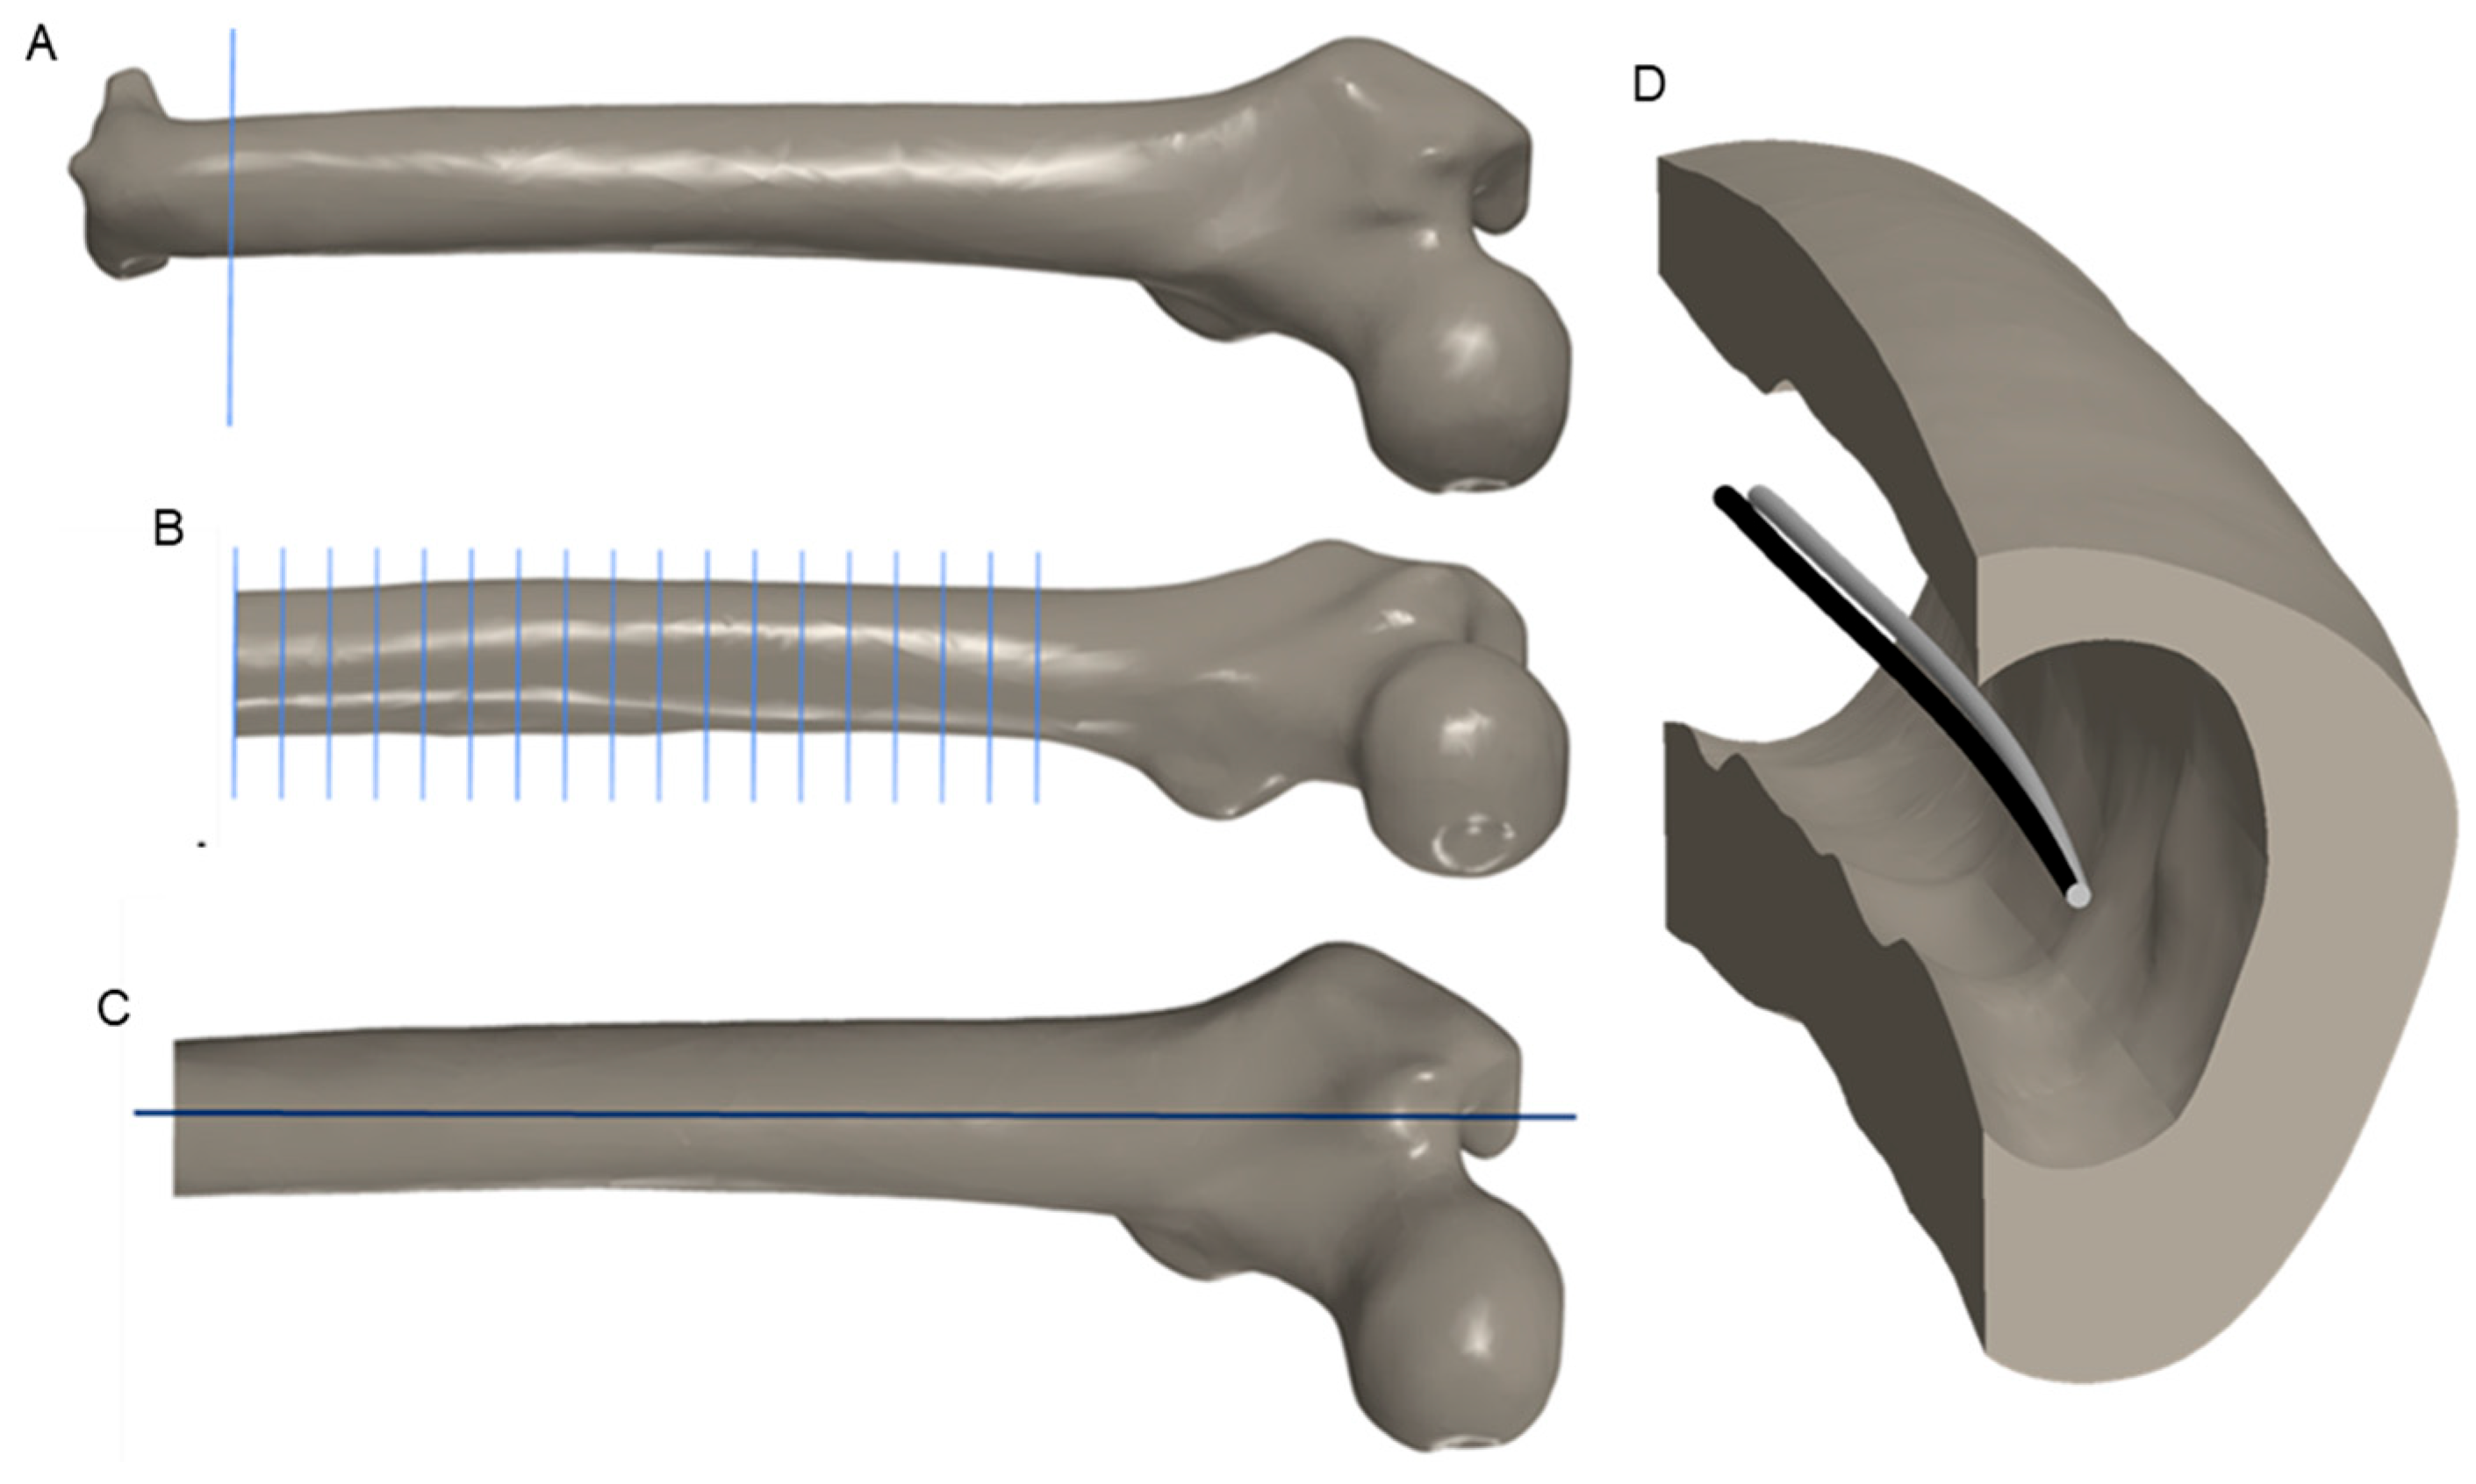
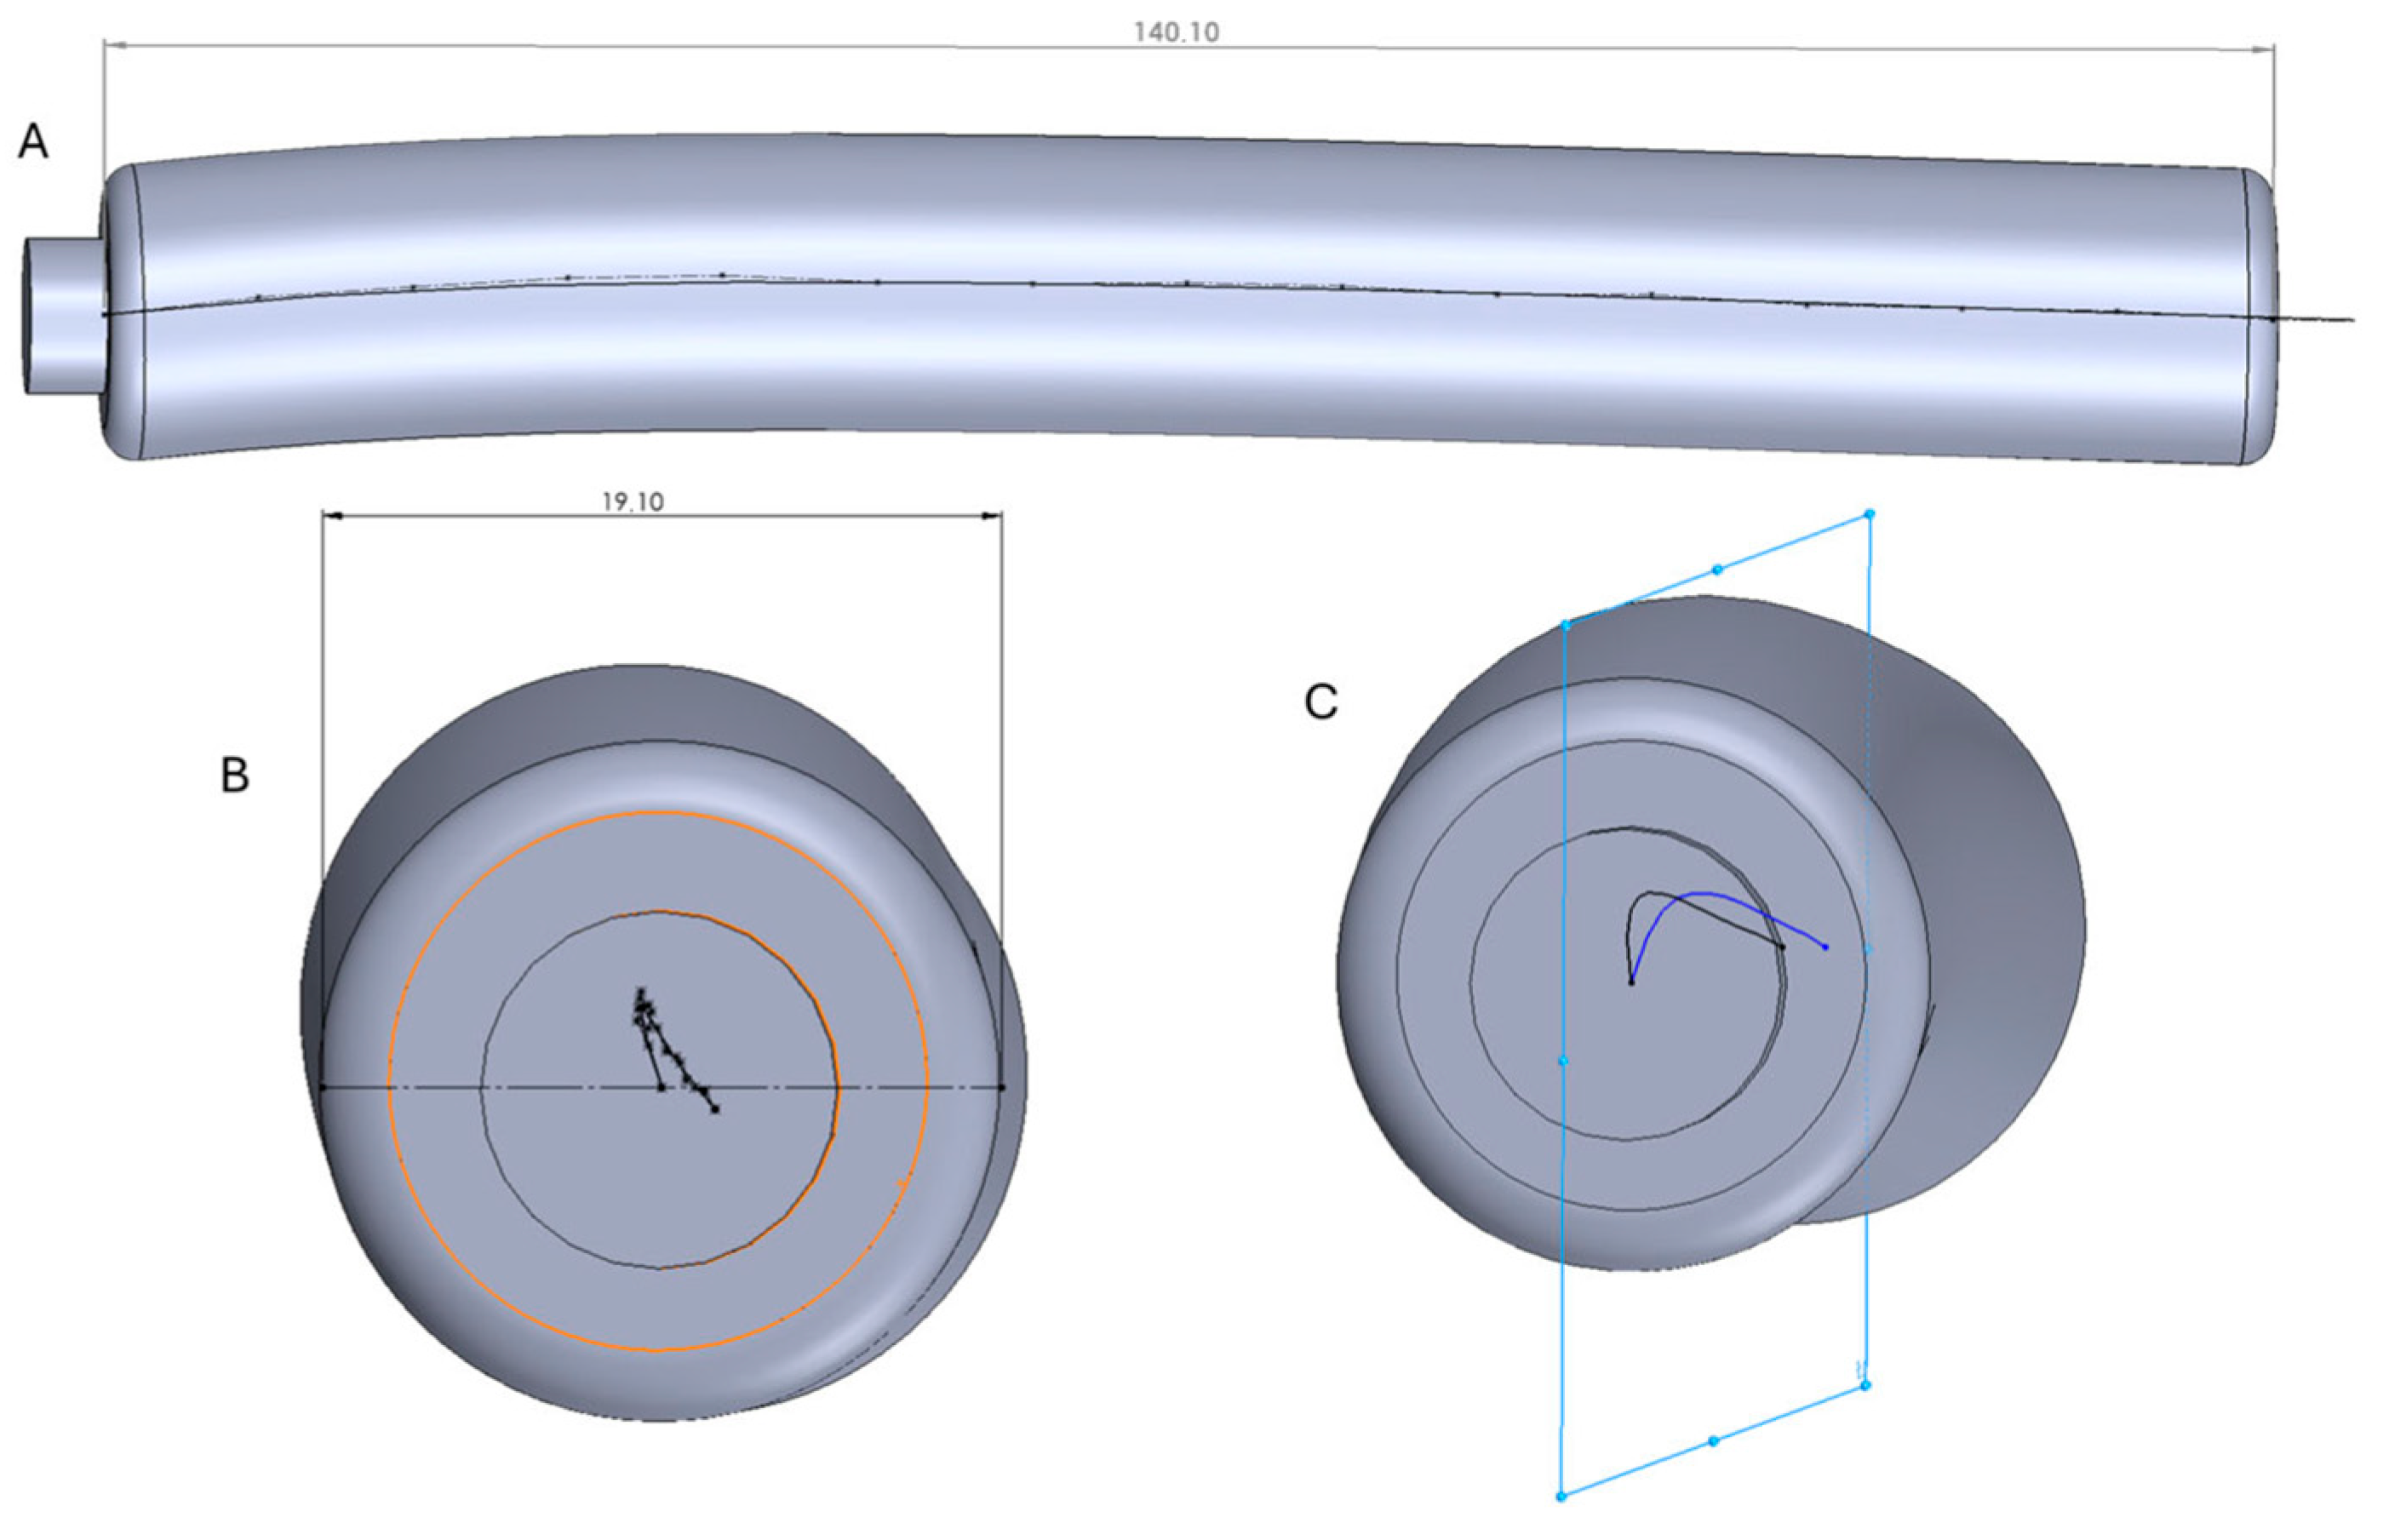
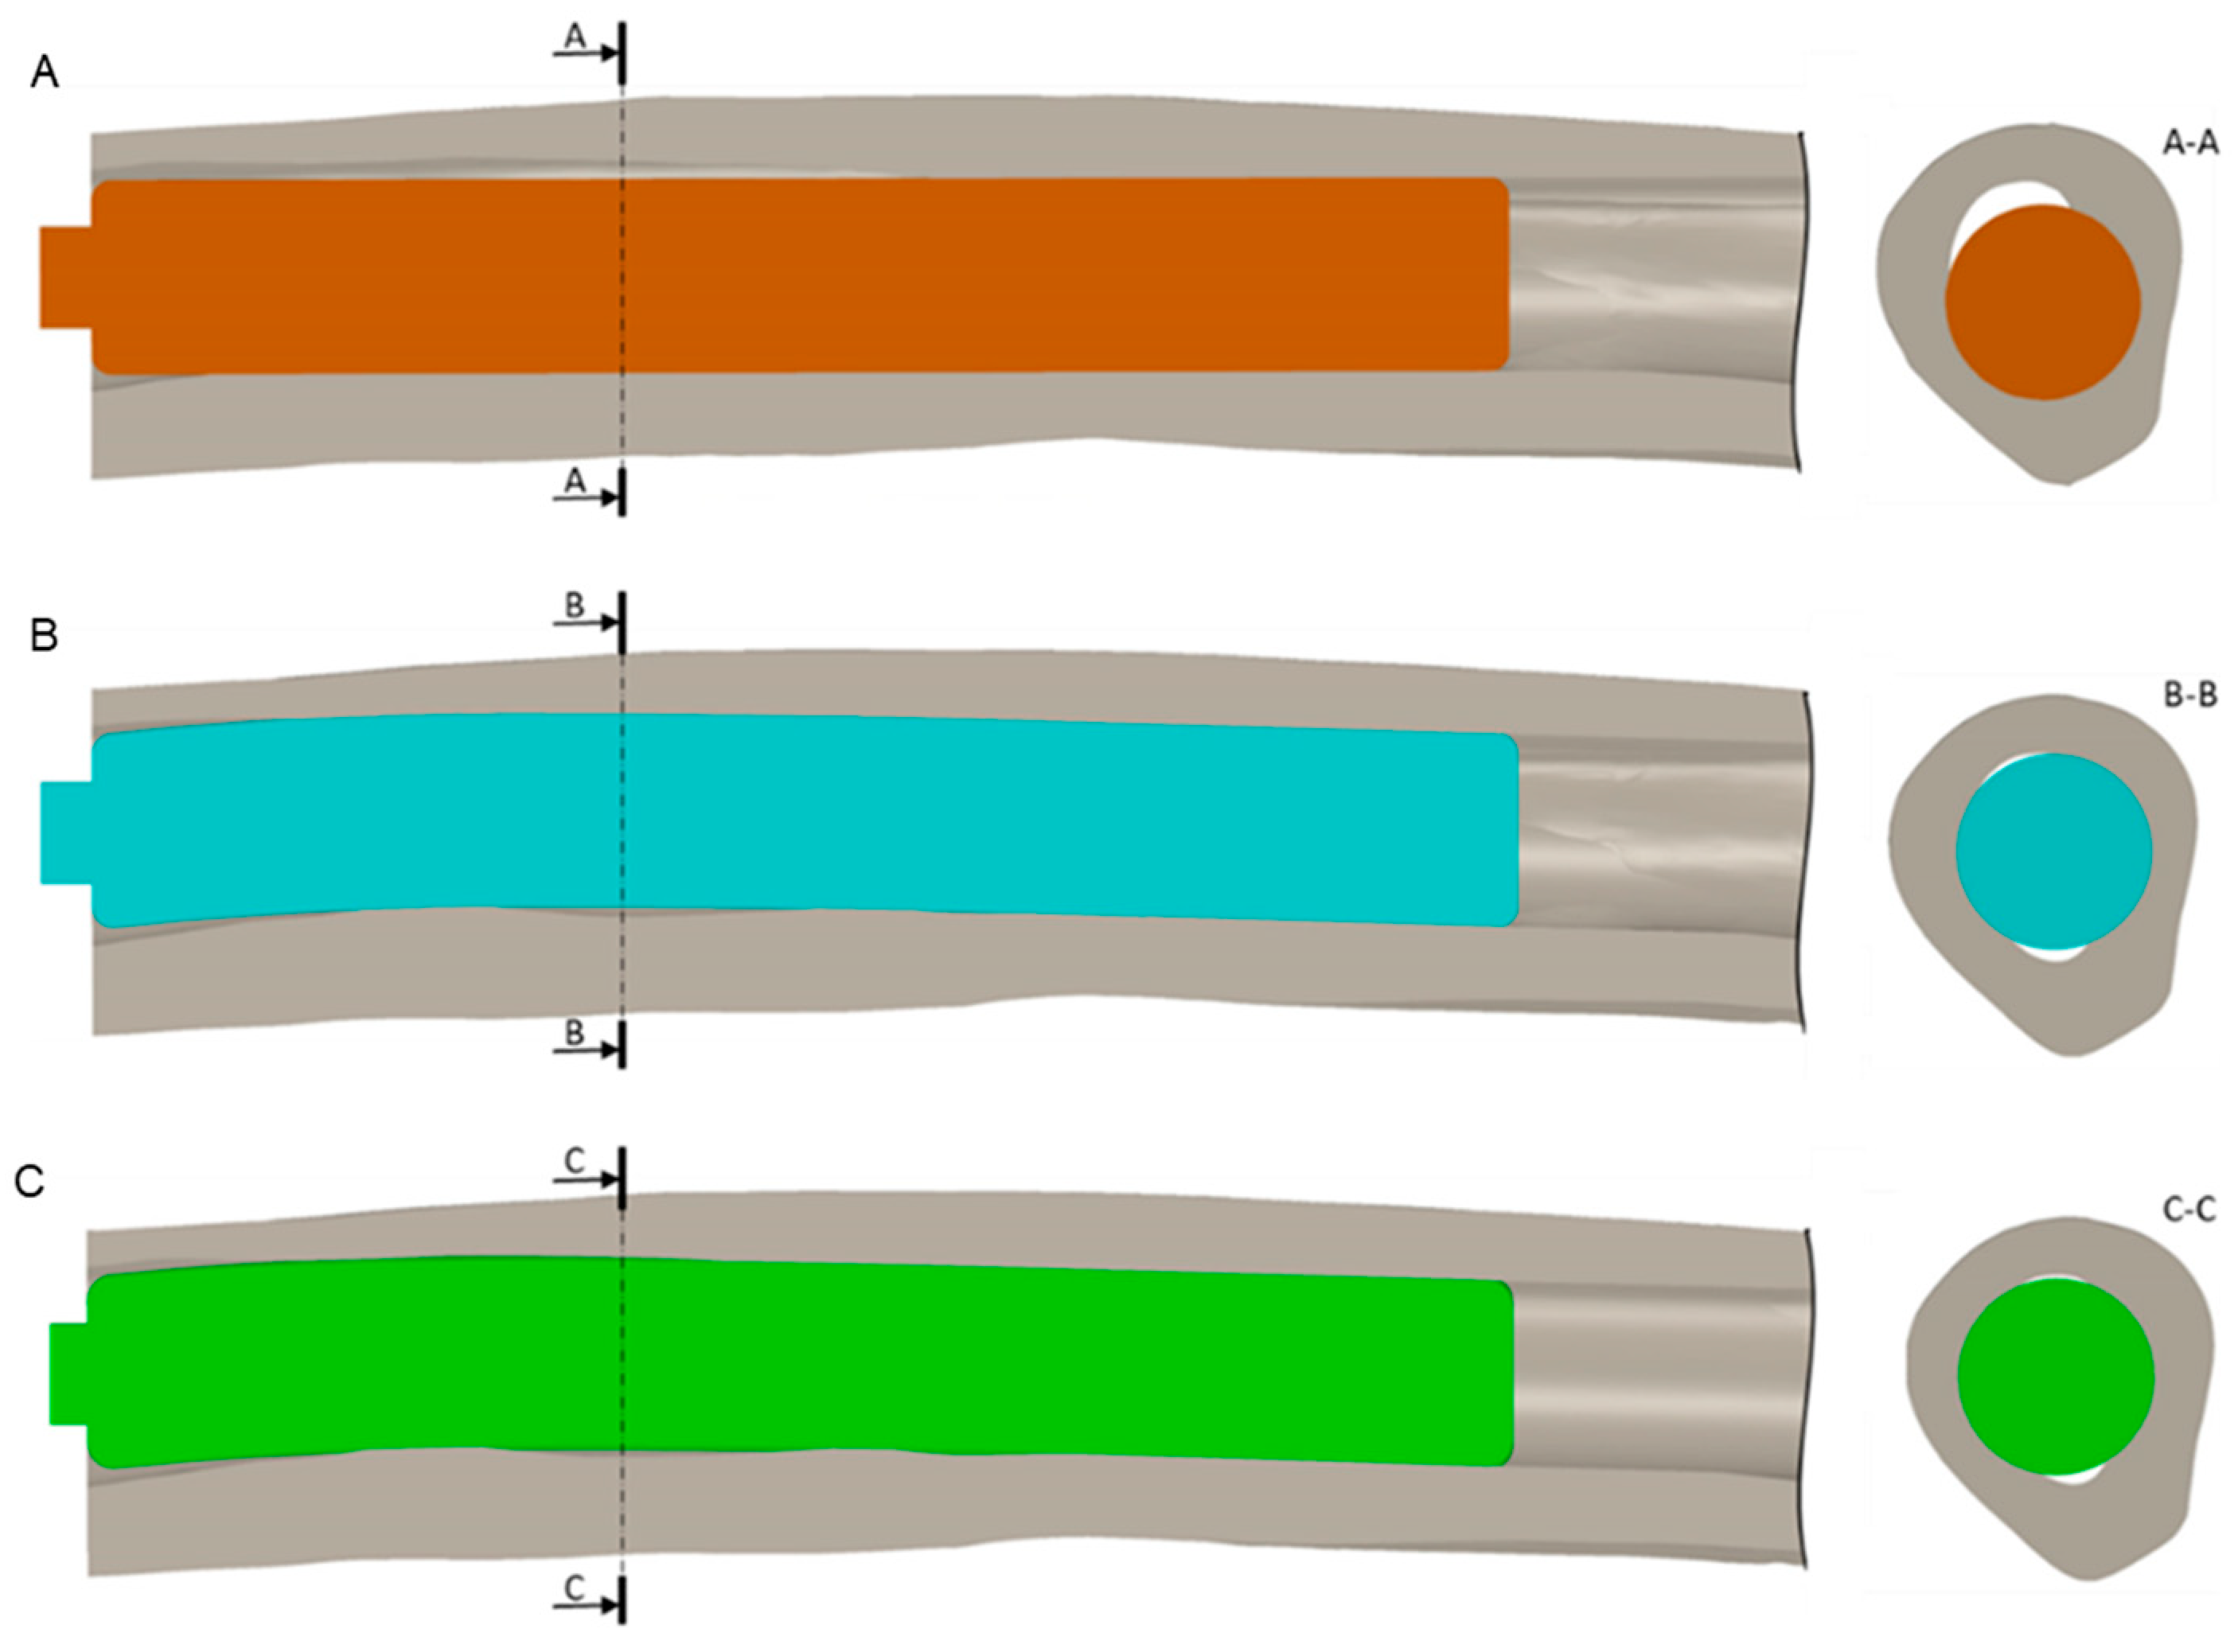
The development of a patient-specific intramedullary femoral stem started from the CT scan of the residual bone of a transfemoral amputee subject, with a pixel resolution of 0.78 × 0.78 mm and a slice thickness of 1.25 mm. The DICOM images of the region of interest were imported into the software Mimics 21.0 (Materialise NV—Leuven, Belgium), where the semi-automatic segmentation process was applied. To differentiate bone from the soft tissue, a threshold from 660 to 1500 HU was adopted during segmentation. The obtained 3D model of the cortical bone is shown in Figure 1.

2.2. CAD Modeling

The abovementioned 3D model of the femur was then imported into Solidworks 2020 (Dassault Systèmes, Vélizy-Villacoublay, France) to prepare the bone as prescribed by the surgical procedure and to identify the medullary canal midline that was used to design the patient-specific stems [2,3]. Several methodologies could be used to identify the medullary canal surface and midline [37]. In this work, firstly, the CAD model of the residual femur was modified by removing the callus at the distal part (Figure 2A). Then, the centroids of eighteen transverse sections, 10 mm apart, as shown in Figure 2B, were calculated and then interpolated with a spline to create the medullary canal midline curve. Moreover, the interpolated 3D spline was projected on the sagittal plane (Figure 2C) of the femur to obtain a planar representation of the medullary canal midline curve (Figure 2D). These curves were used to prepare two different versions of the bone, simulating the surgical procedure performed for the lower limb amputation treatment [2,38,39], reaming along the 3D spline and its planar projection, with a diameter of 19 mm.
Two implants were created by extruding a circular section, with a diameter of 19.1 mm, along the 3D and 2D medullary canal midline curves, obtaining the patient-specific design (PSD) and the planar patient-specific design (PPSD) stems, respectively. The PSD and the two curves used to obtain the implants are presented in Figure 3.
A 0.1 mm interference resulted between the bone and the implant, a typical value reported in the literature [6,20,25]. In addition, the same procedure of bone preparation and stem design was also performed by following a straight segment orthogonal to the cut plane, which represents a standard implant with a straight design (SD). The implants were designed with a length of 140 mm, as used for commercially available transfemoral prostheses [12,40]. The abutment, commonly used in these implants to connect an intramedullary component to the external prosthetic limb, was added at the distal part of the prostheses, where the load will be applied. In the end, three bone–implant assemblies were obtained by matching the PSD, PPSD, and SD stems and the residual bone, respectively (Figure 4).

2.3. FE Analysis

The CAD assemblies were imported into Abaqus CAE 2020 (Dassault Systèmes, Vélizy-Villacoublay, France), and implicit non-linear static analyses were performed [15,17,41].

2.3.1. Material Properties
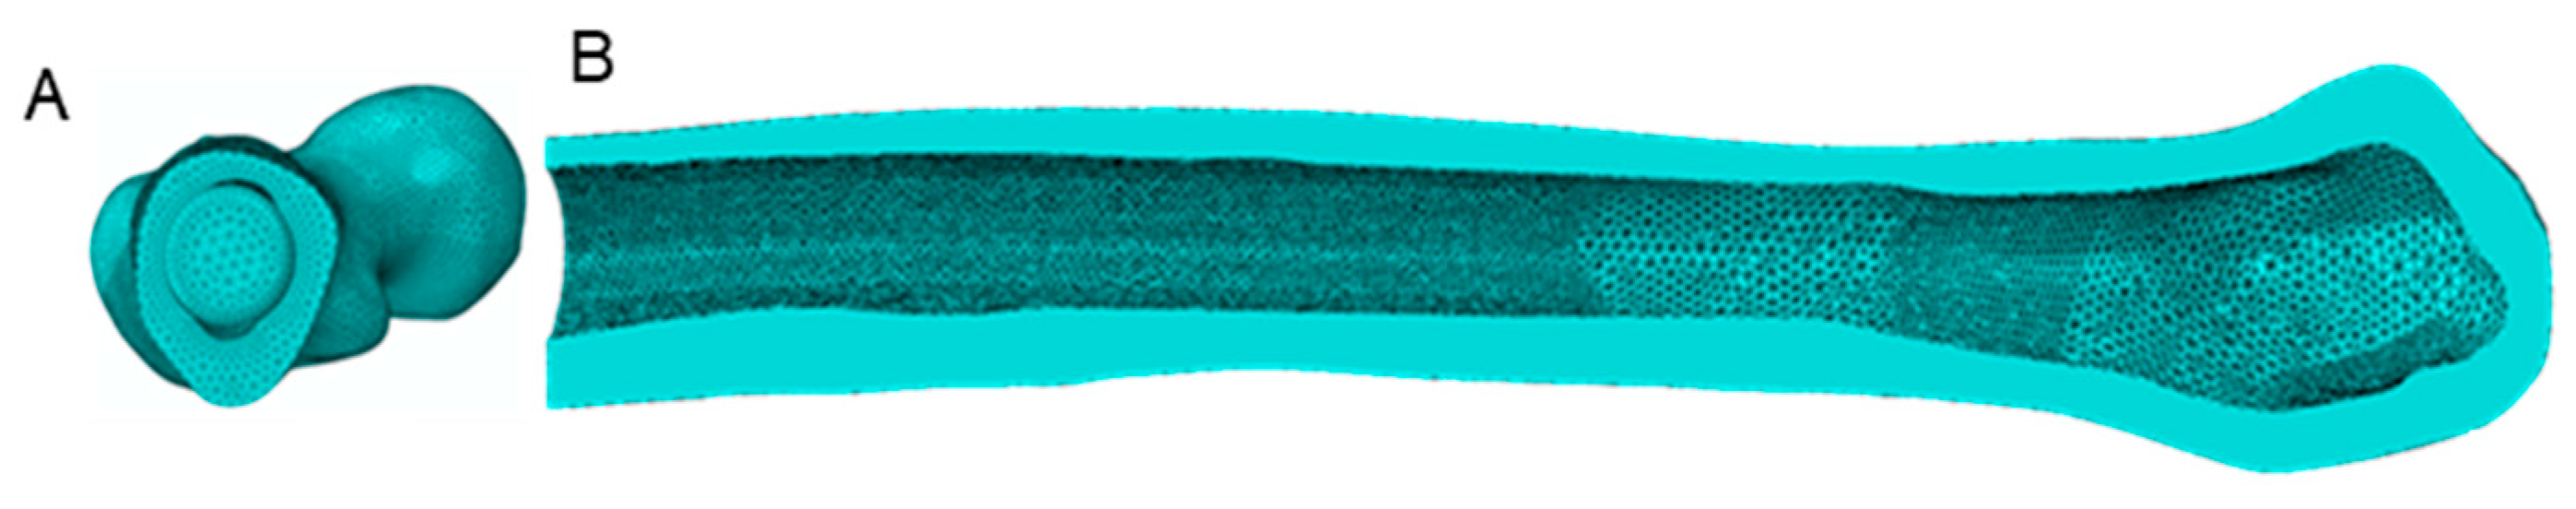
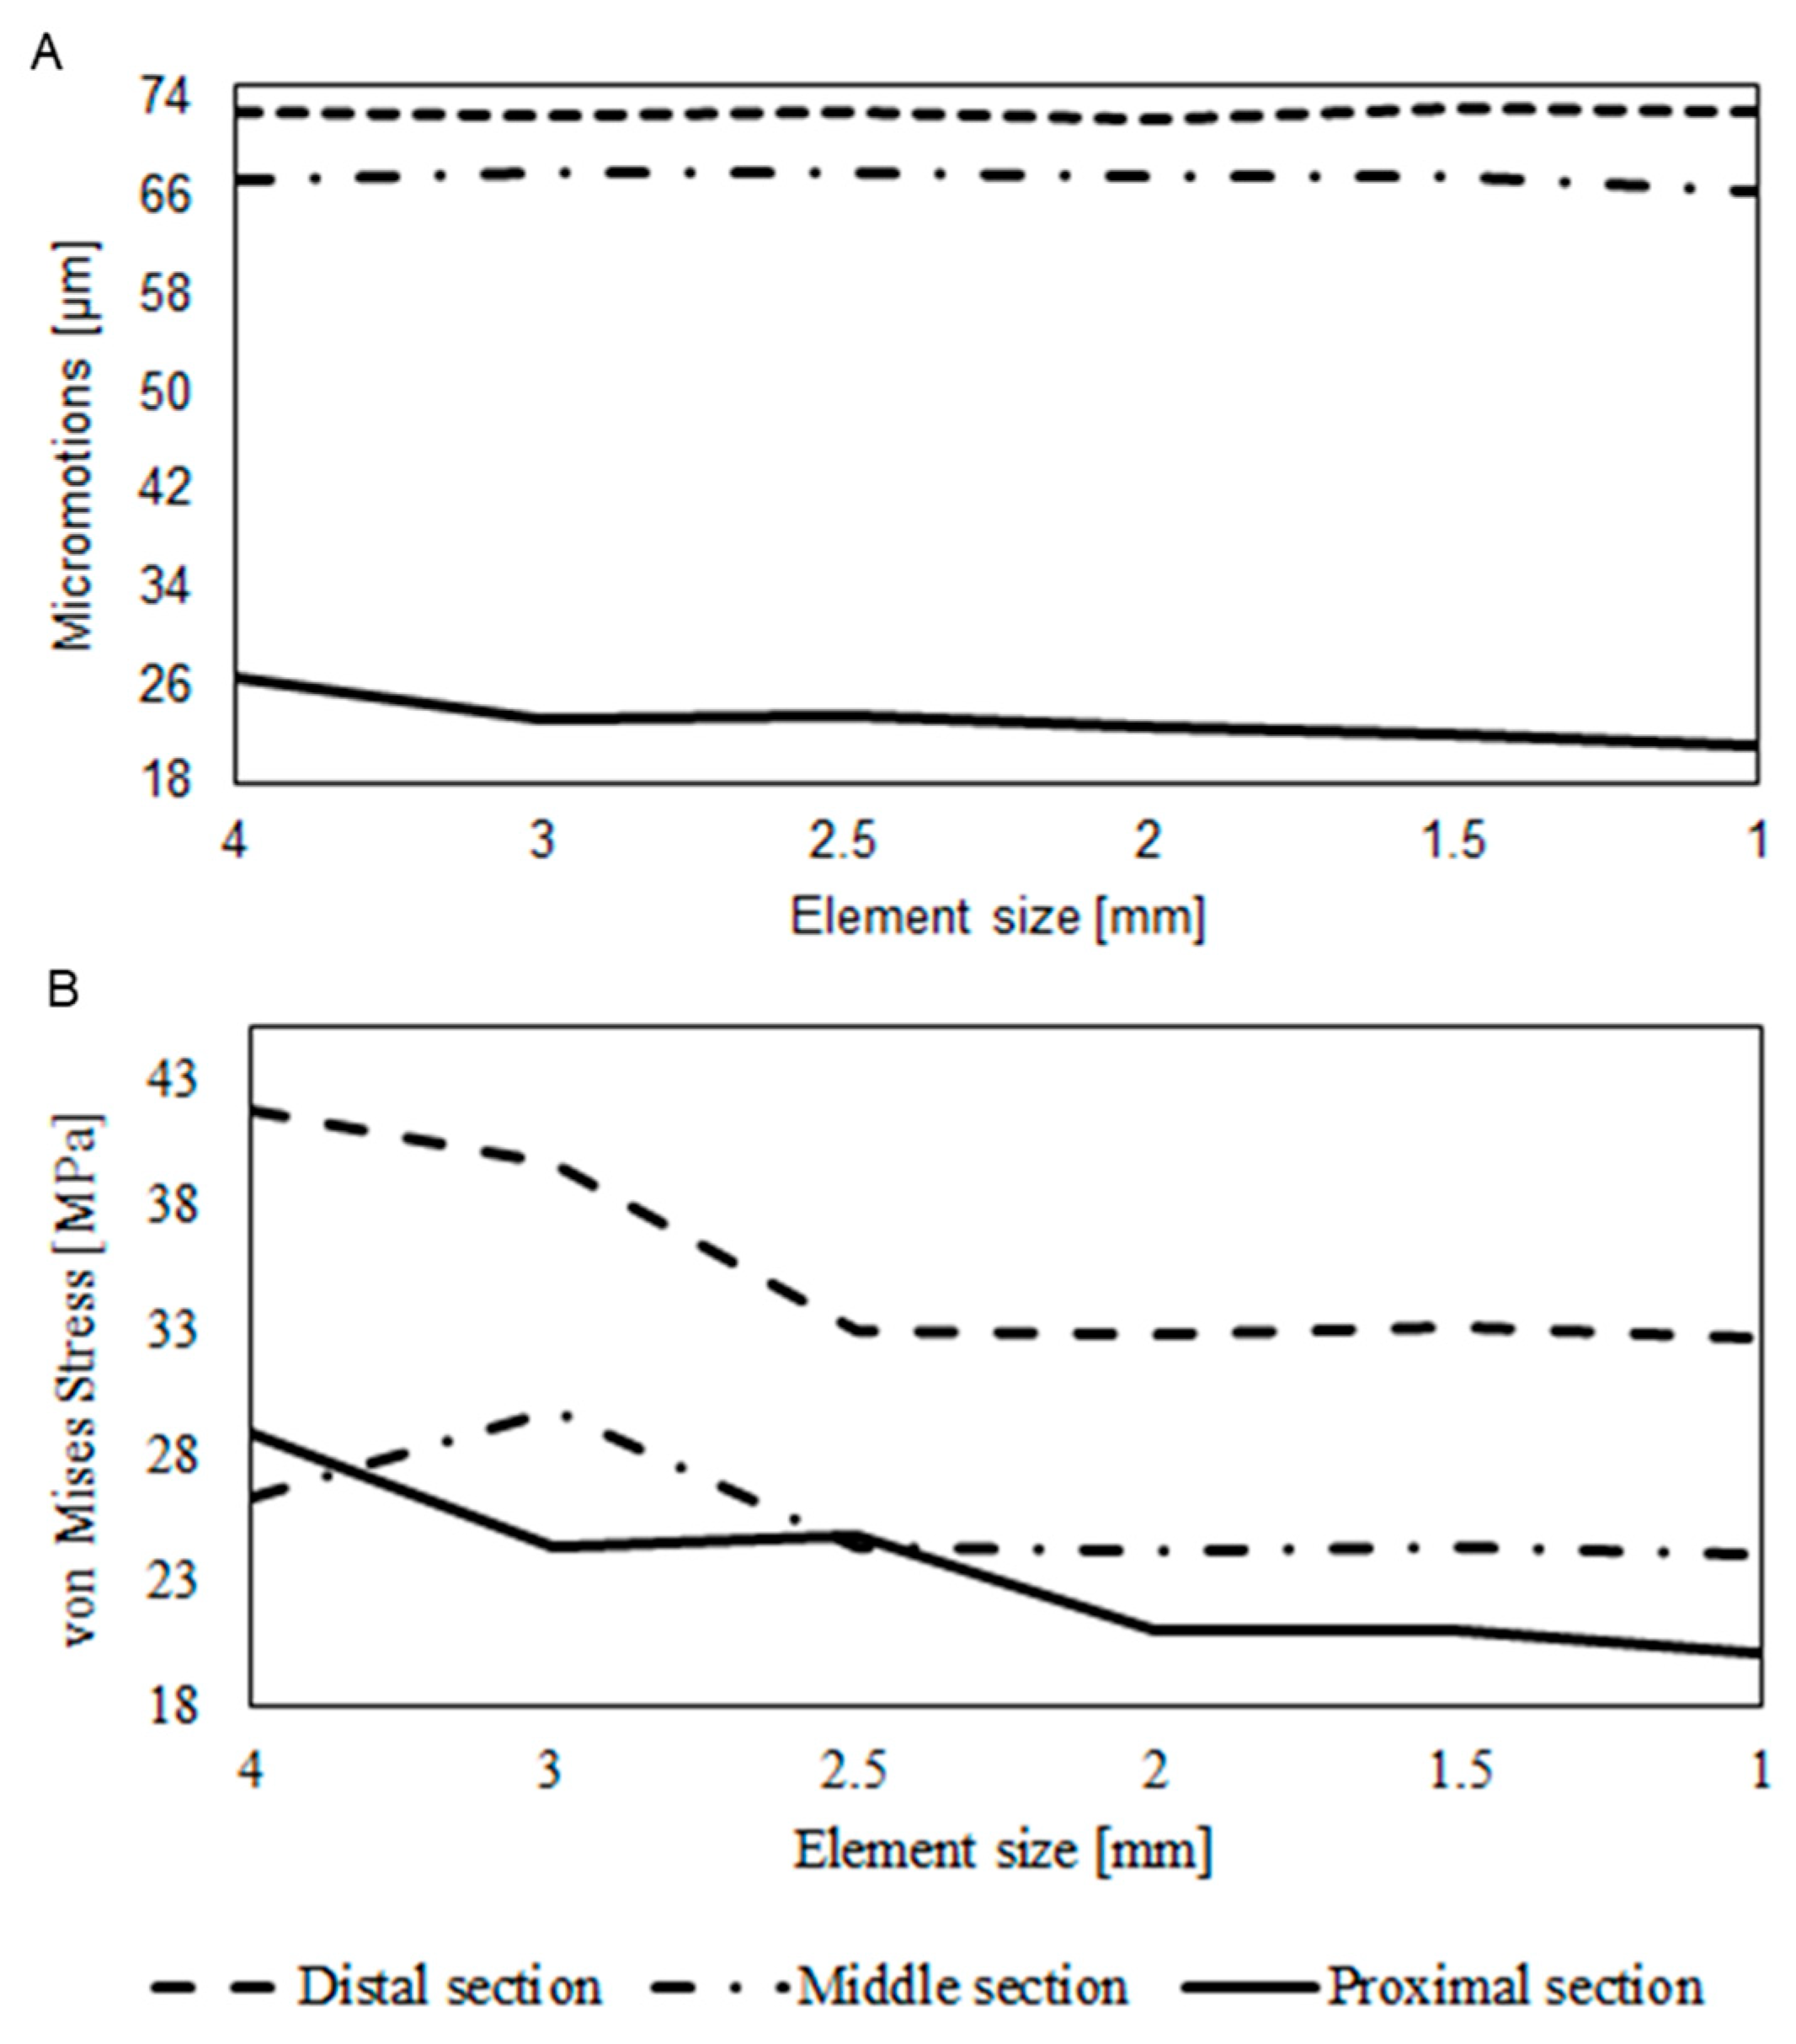
The prosthetic implants, made using titanium grade 5 (TI6Al4V), were considered an isotropic material with elastic behavior, as commonly reported in the literature [6,18,23]. Since our interest is focused on the behavior of the bone around the implant stem, only the cortical bone was considered and modeled as an orthotropic material [23,34,42]. The adopted material properties are presented in Table 1.

2.3.2. Mesh

A second-order 10-node tetrahedral element (C3D10HS) was used to mesh both the femur and the implant, as shown in Figure 5 [6,22,31,34]. A mesh sensitivity analysis assessing the maximum micromotions and von Mises stress in the distal, middle, and proximal sections, respectively, at 0, 50, and 100% of the implant length, was conducted.
The variation in the micromotions and the contact pressure, along with the element size, is reported in Figure 6. The final meshes resulted in an average element size of 2 mm with a refinement at the bone-implant interface of 1 mm, for a final number of approximately 600,000 elements.
All the simulations were conducted on a workstation equipped with Windows 10, an Intel Xeon E5-2670V3 (Intel corporation, Santa Clara, CA, USA), and 128 GB of RAM. The mean time required to complete a simulation was approximately 8 h.

2.3.3. Boundary Conditions
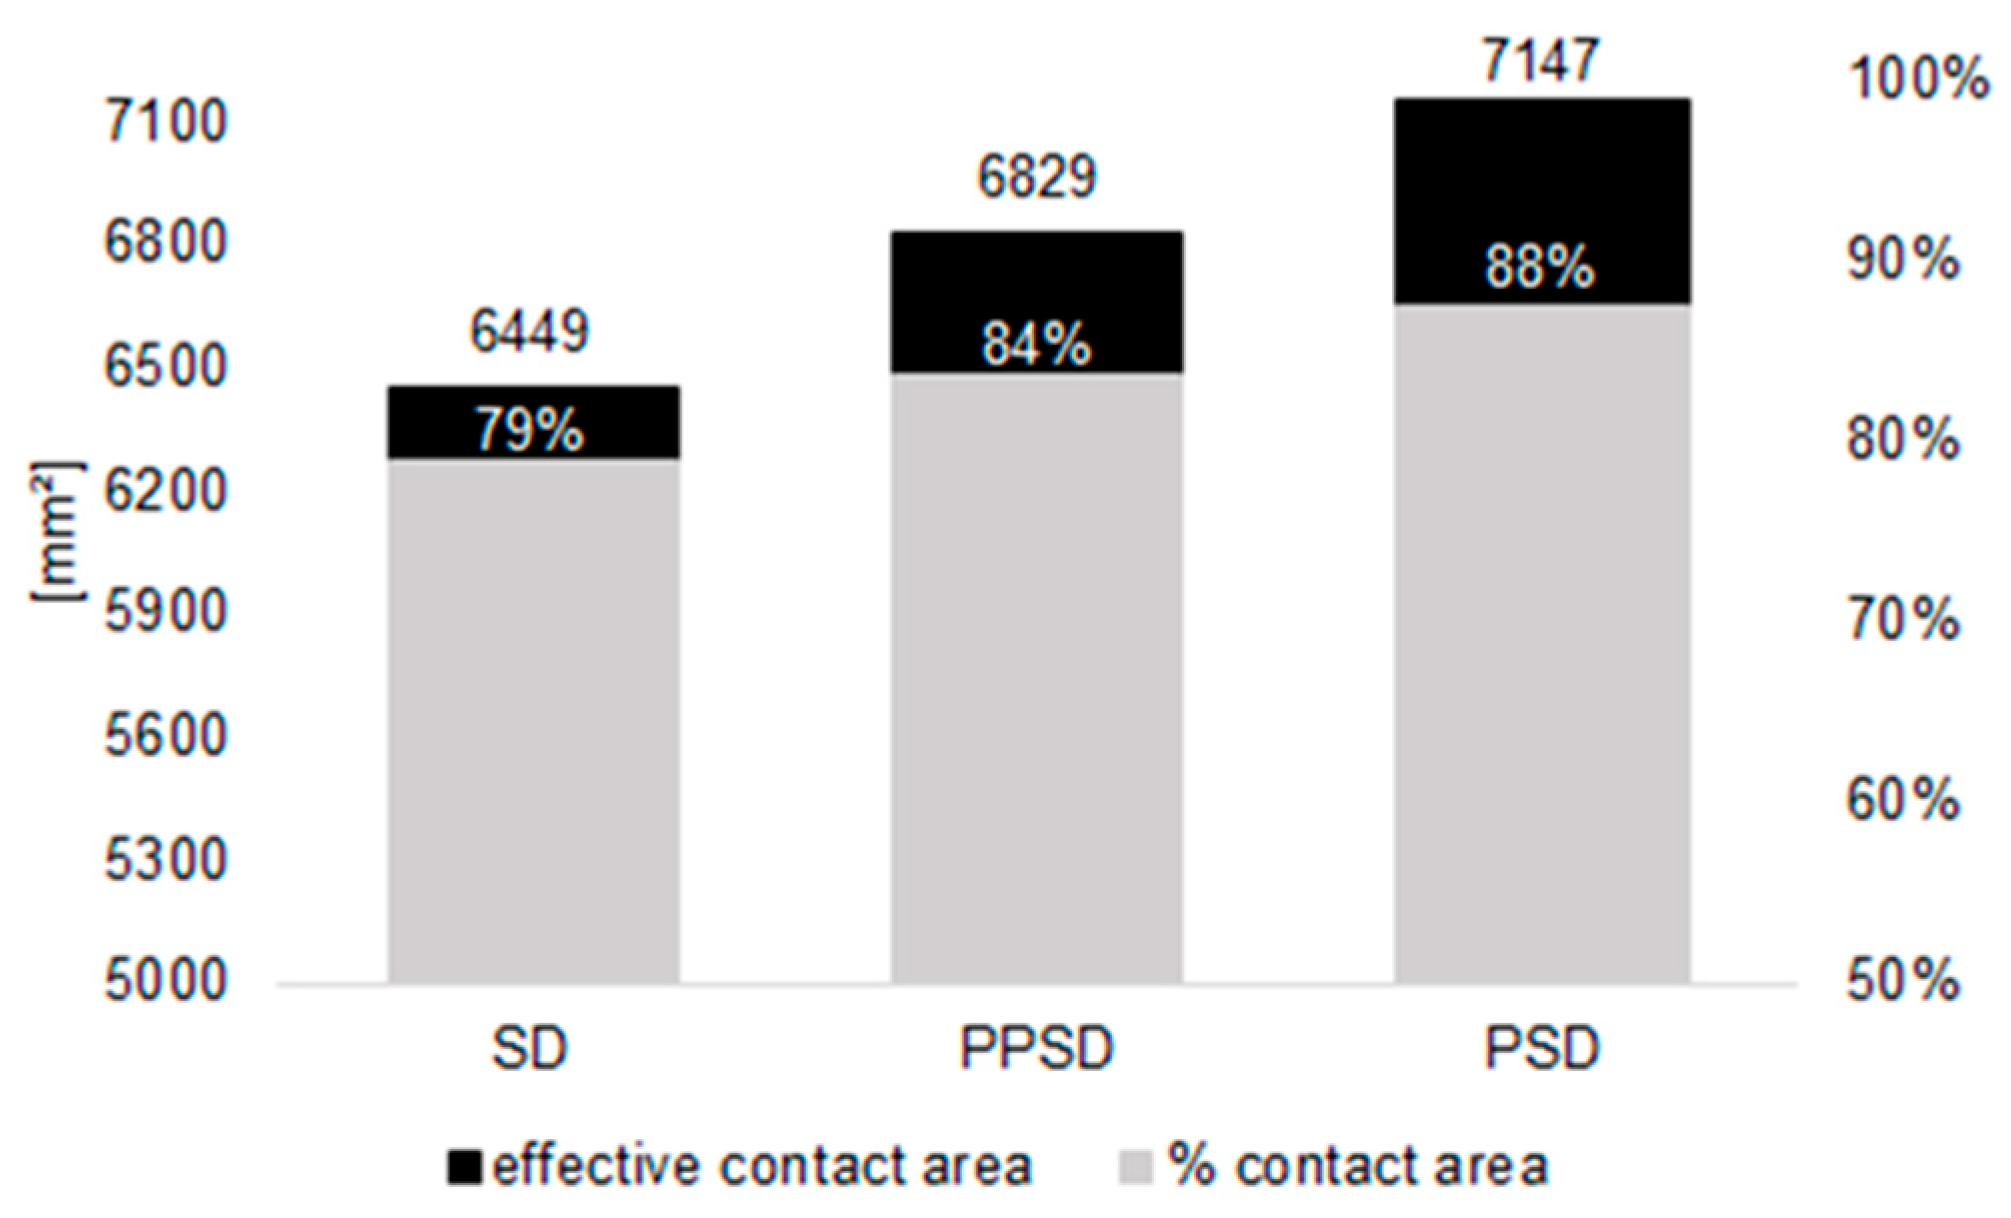
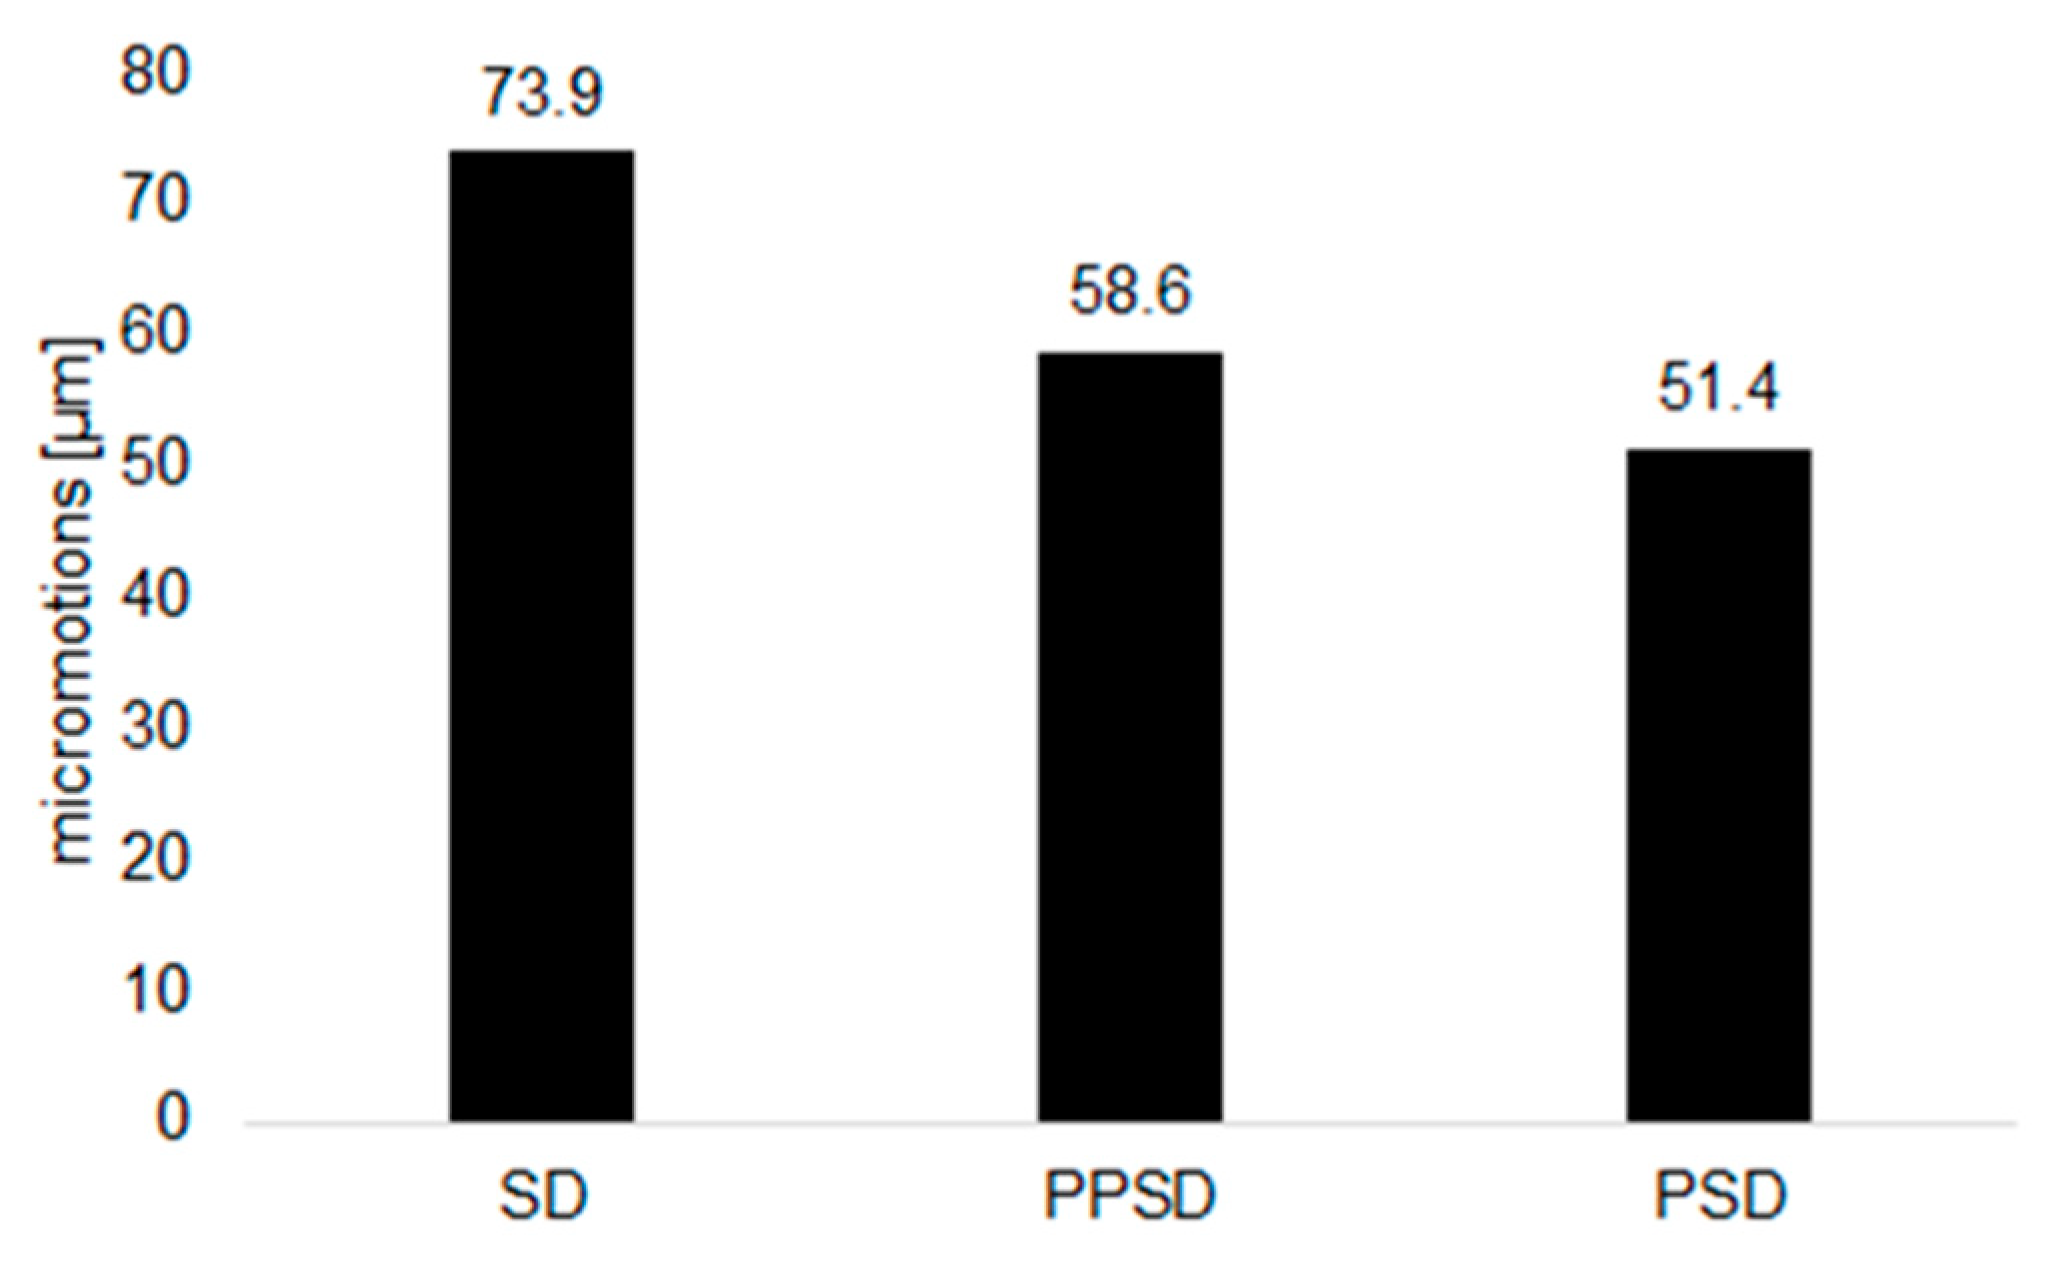
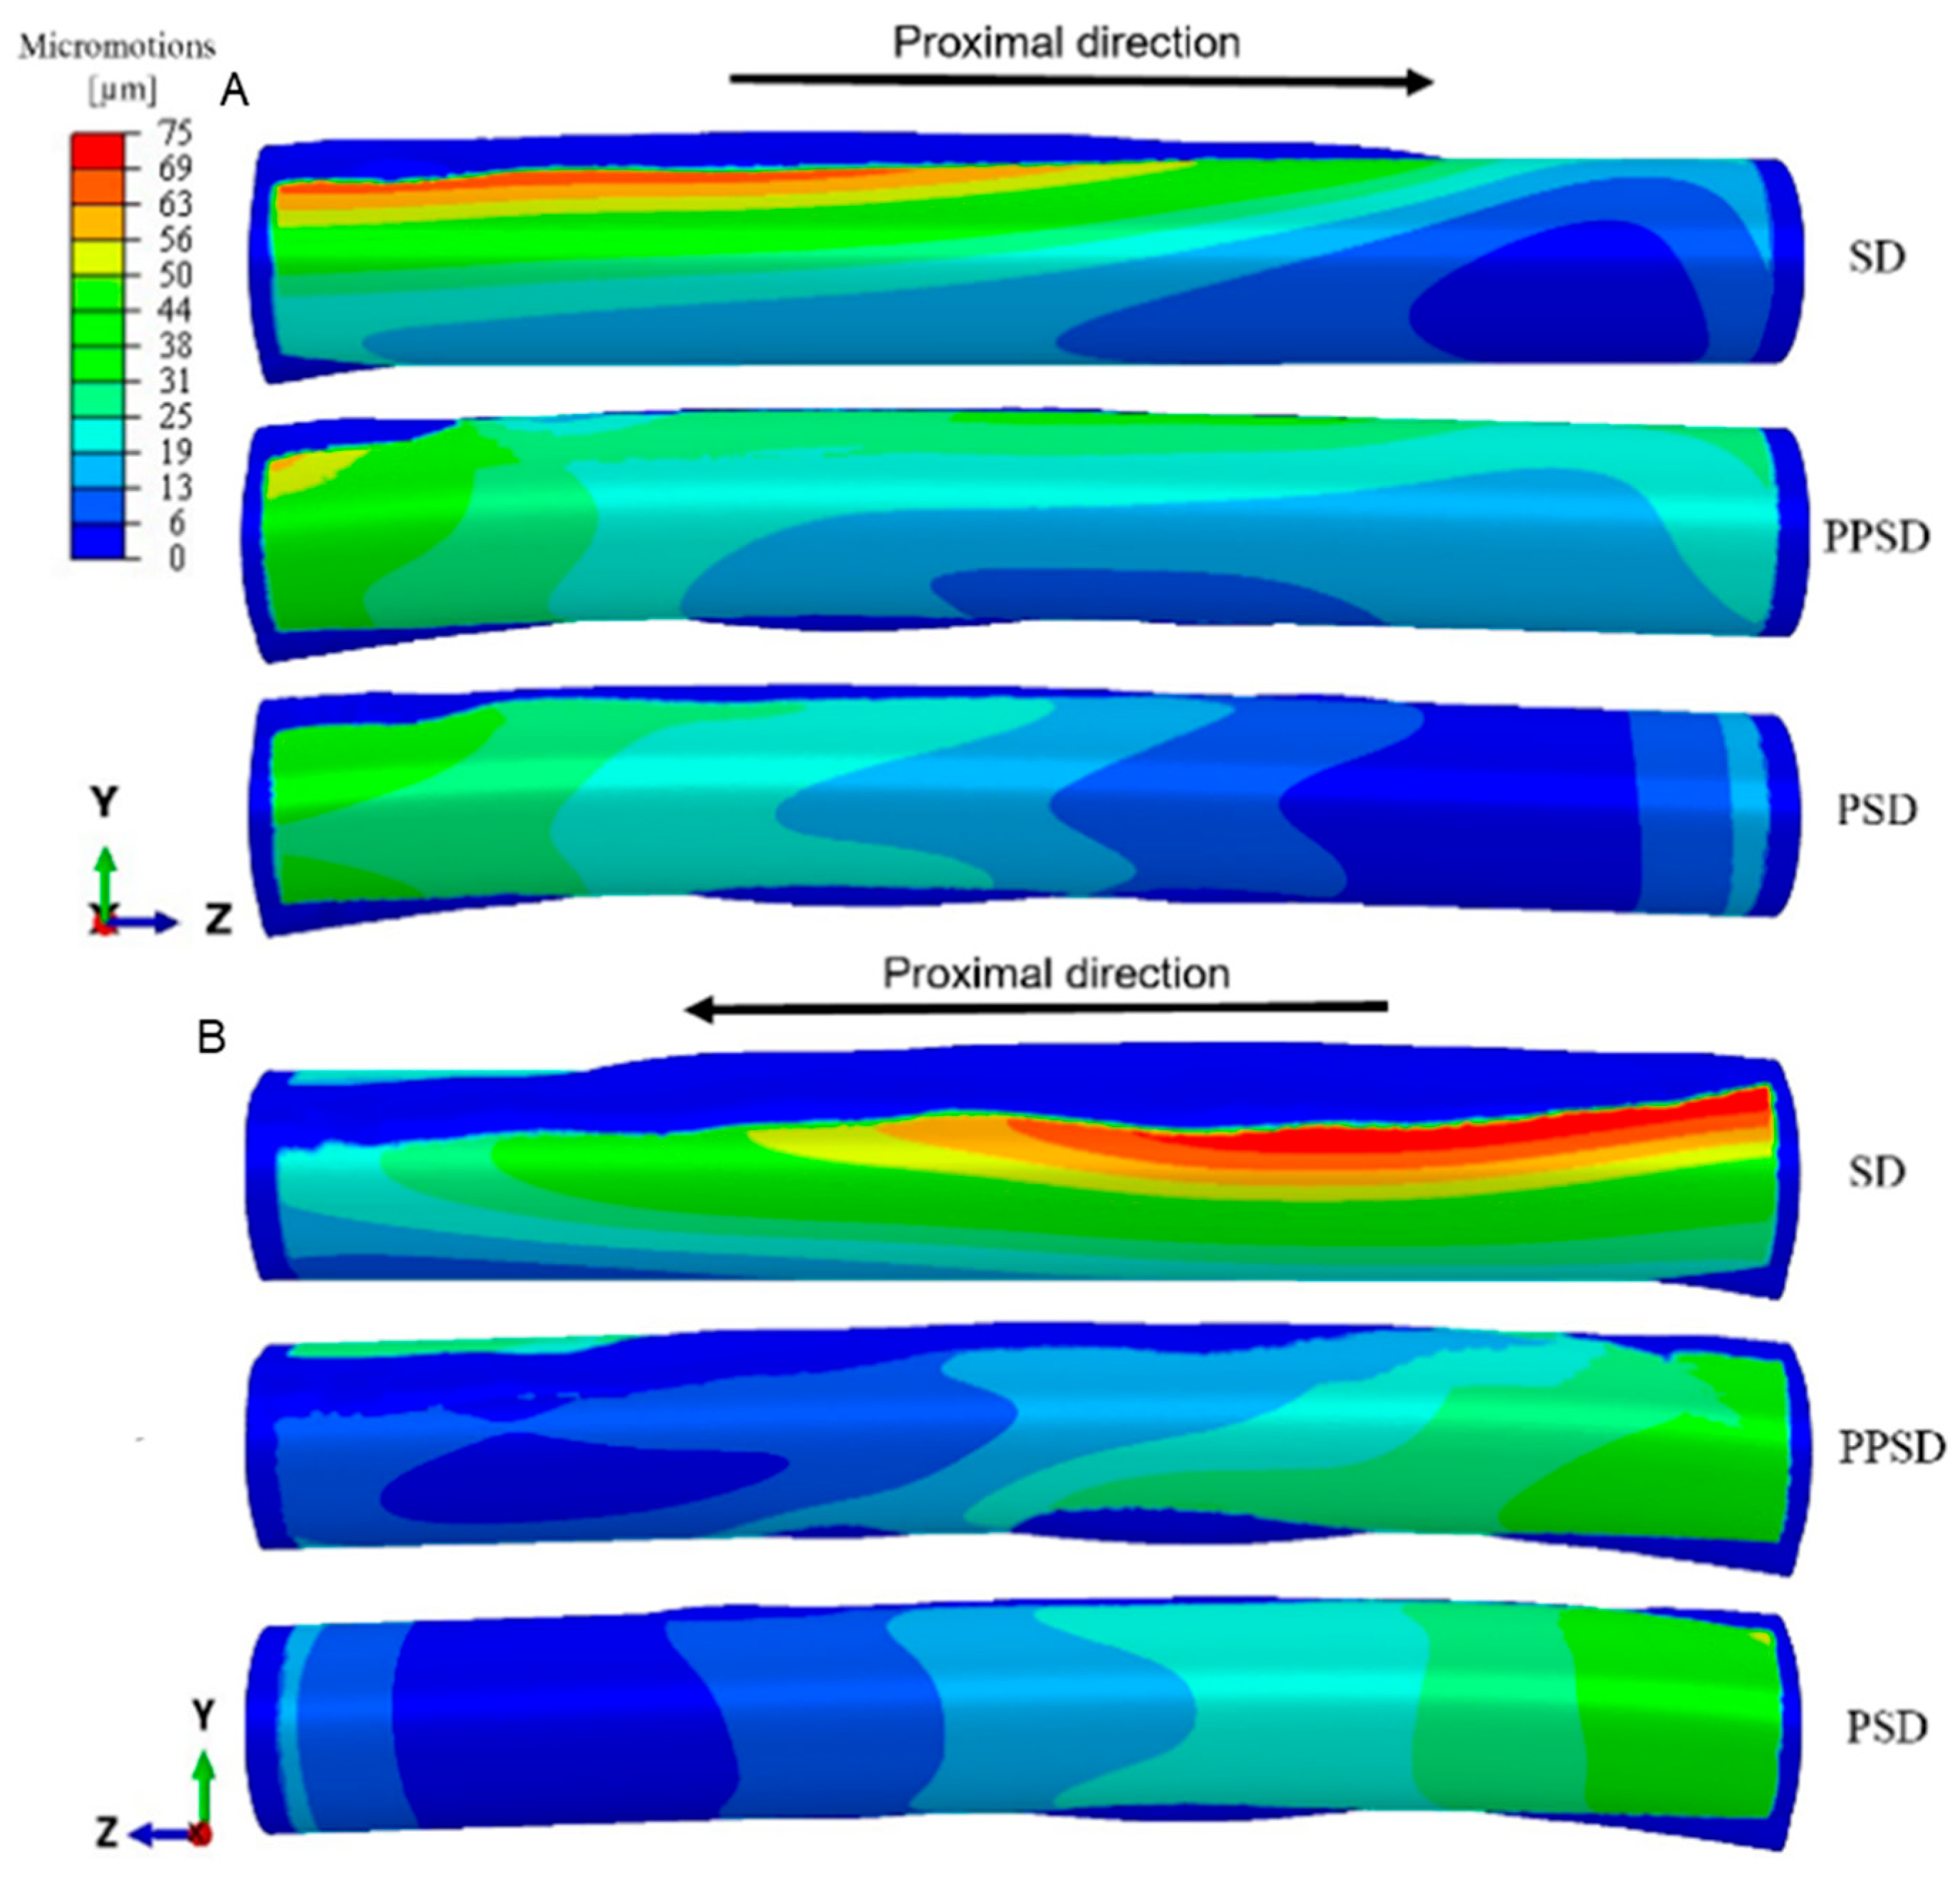
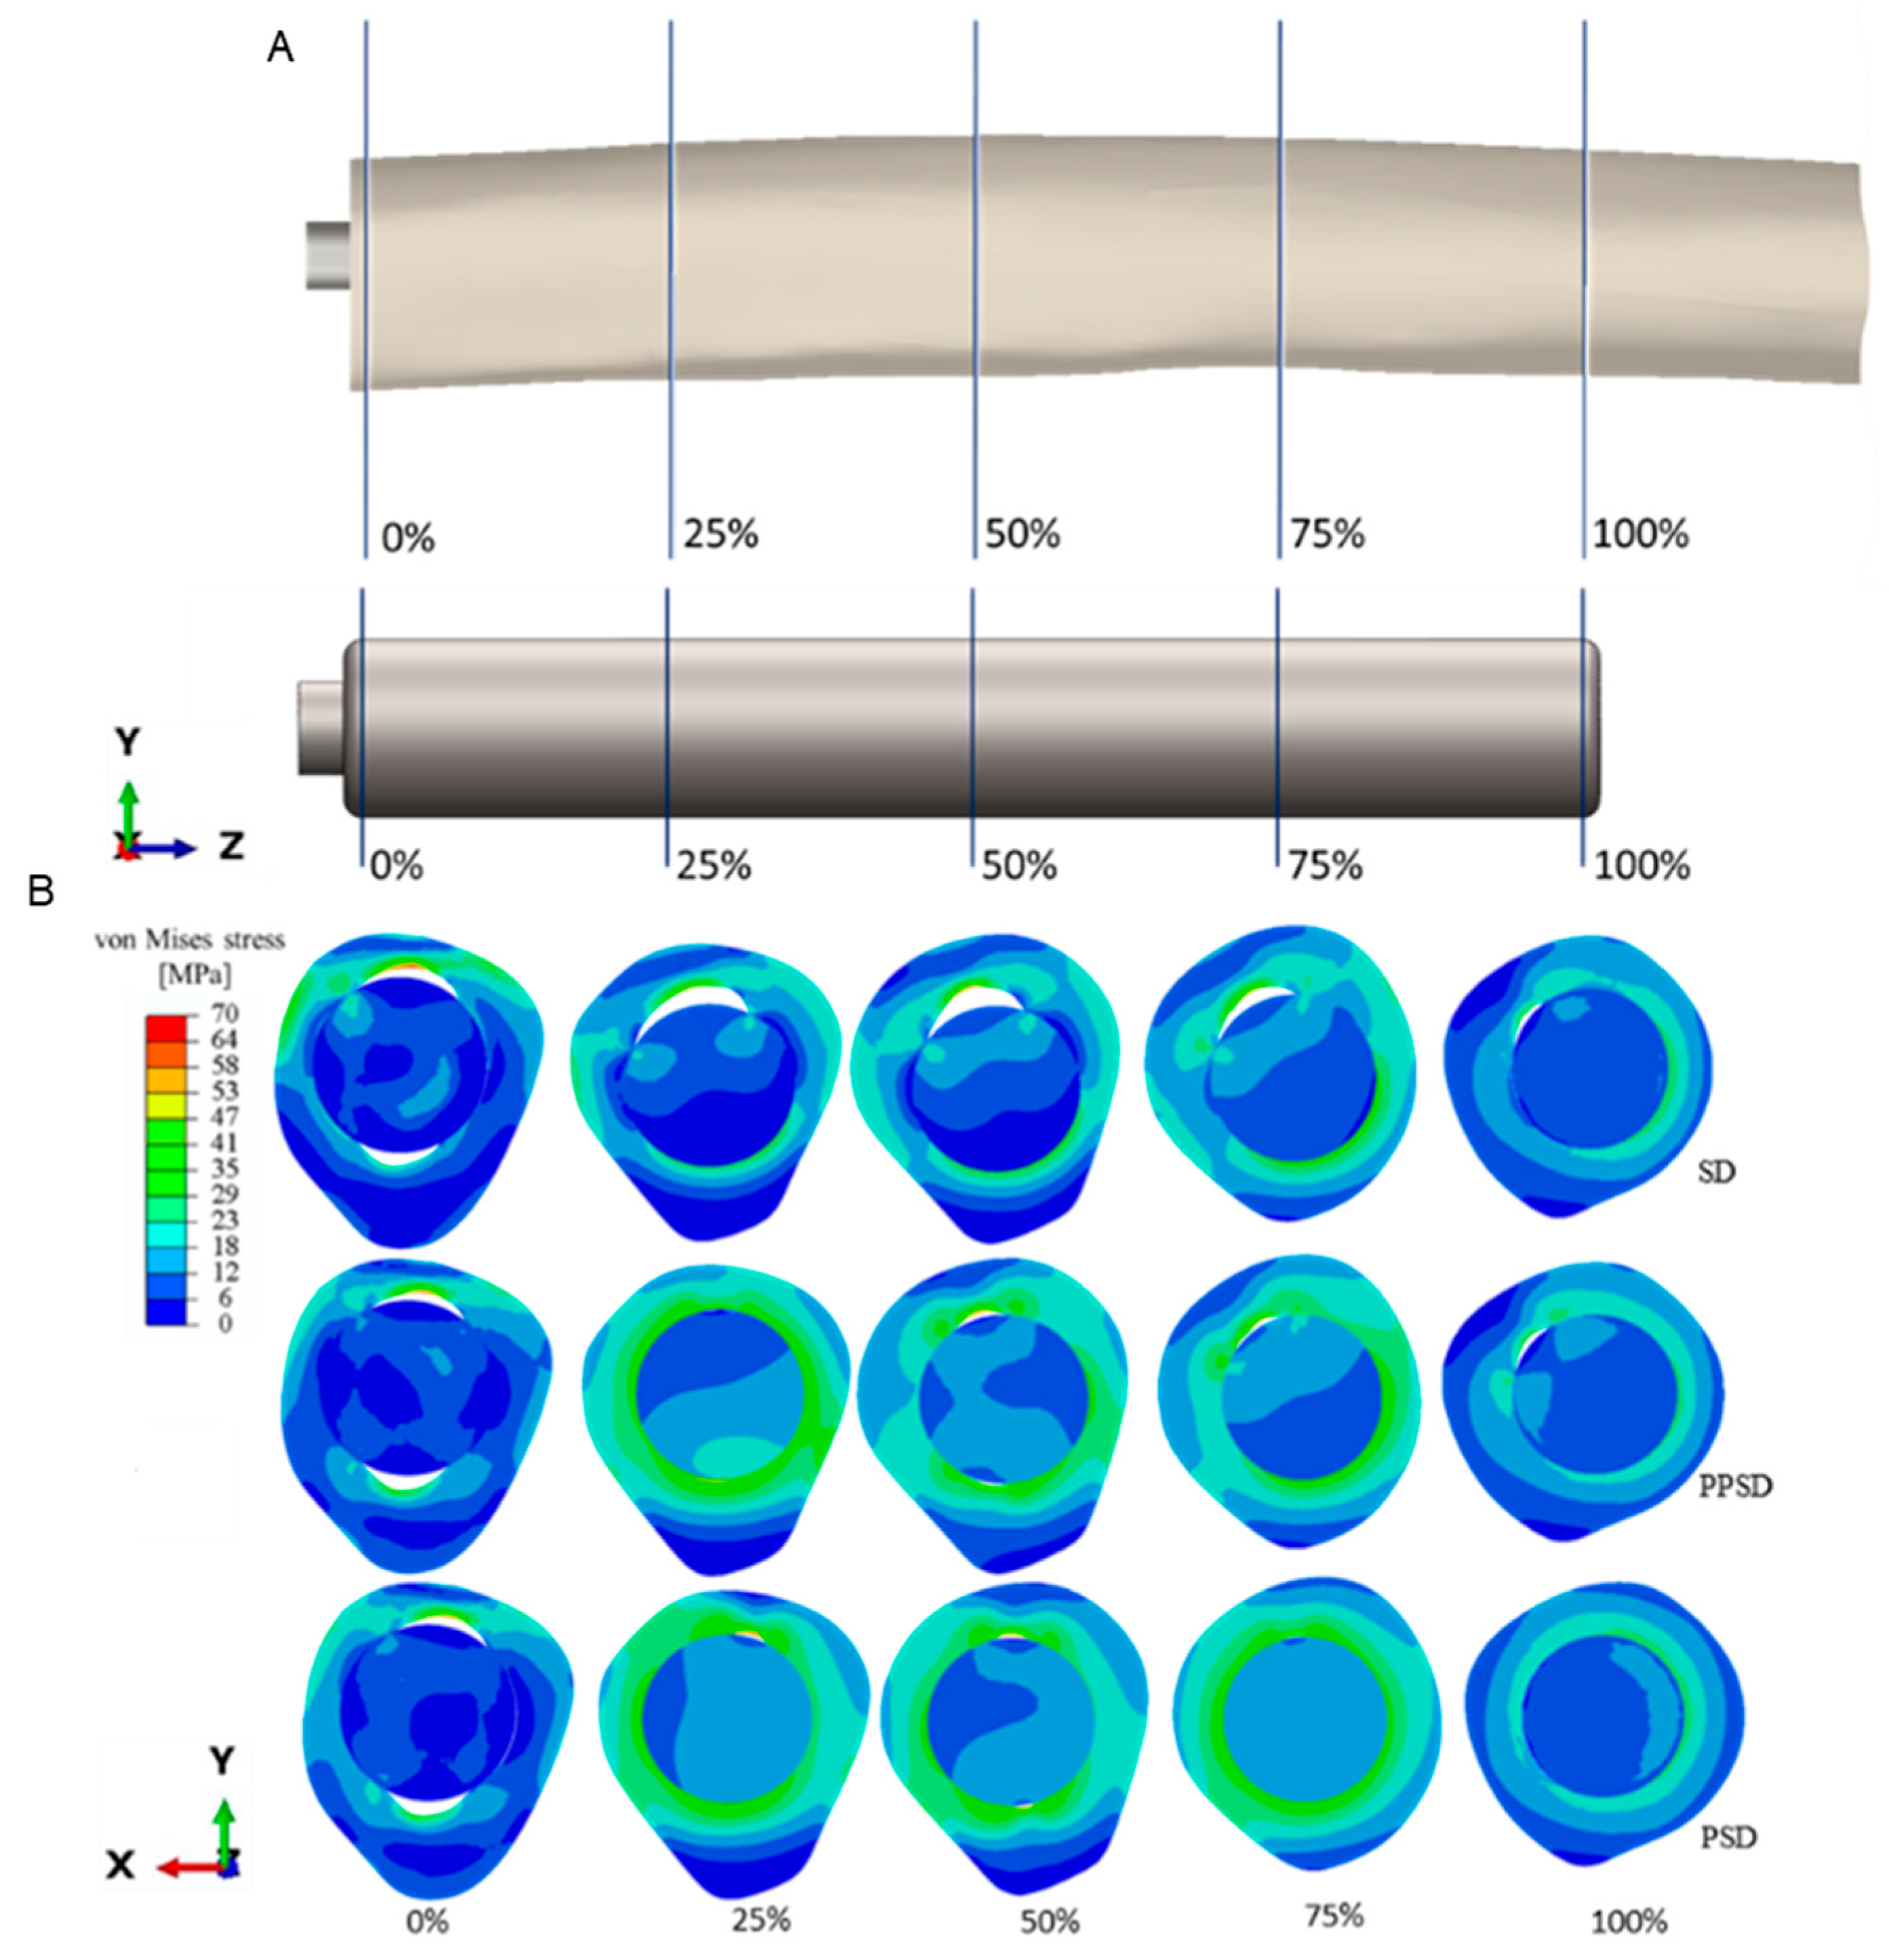
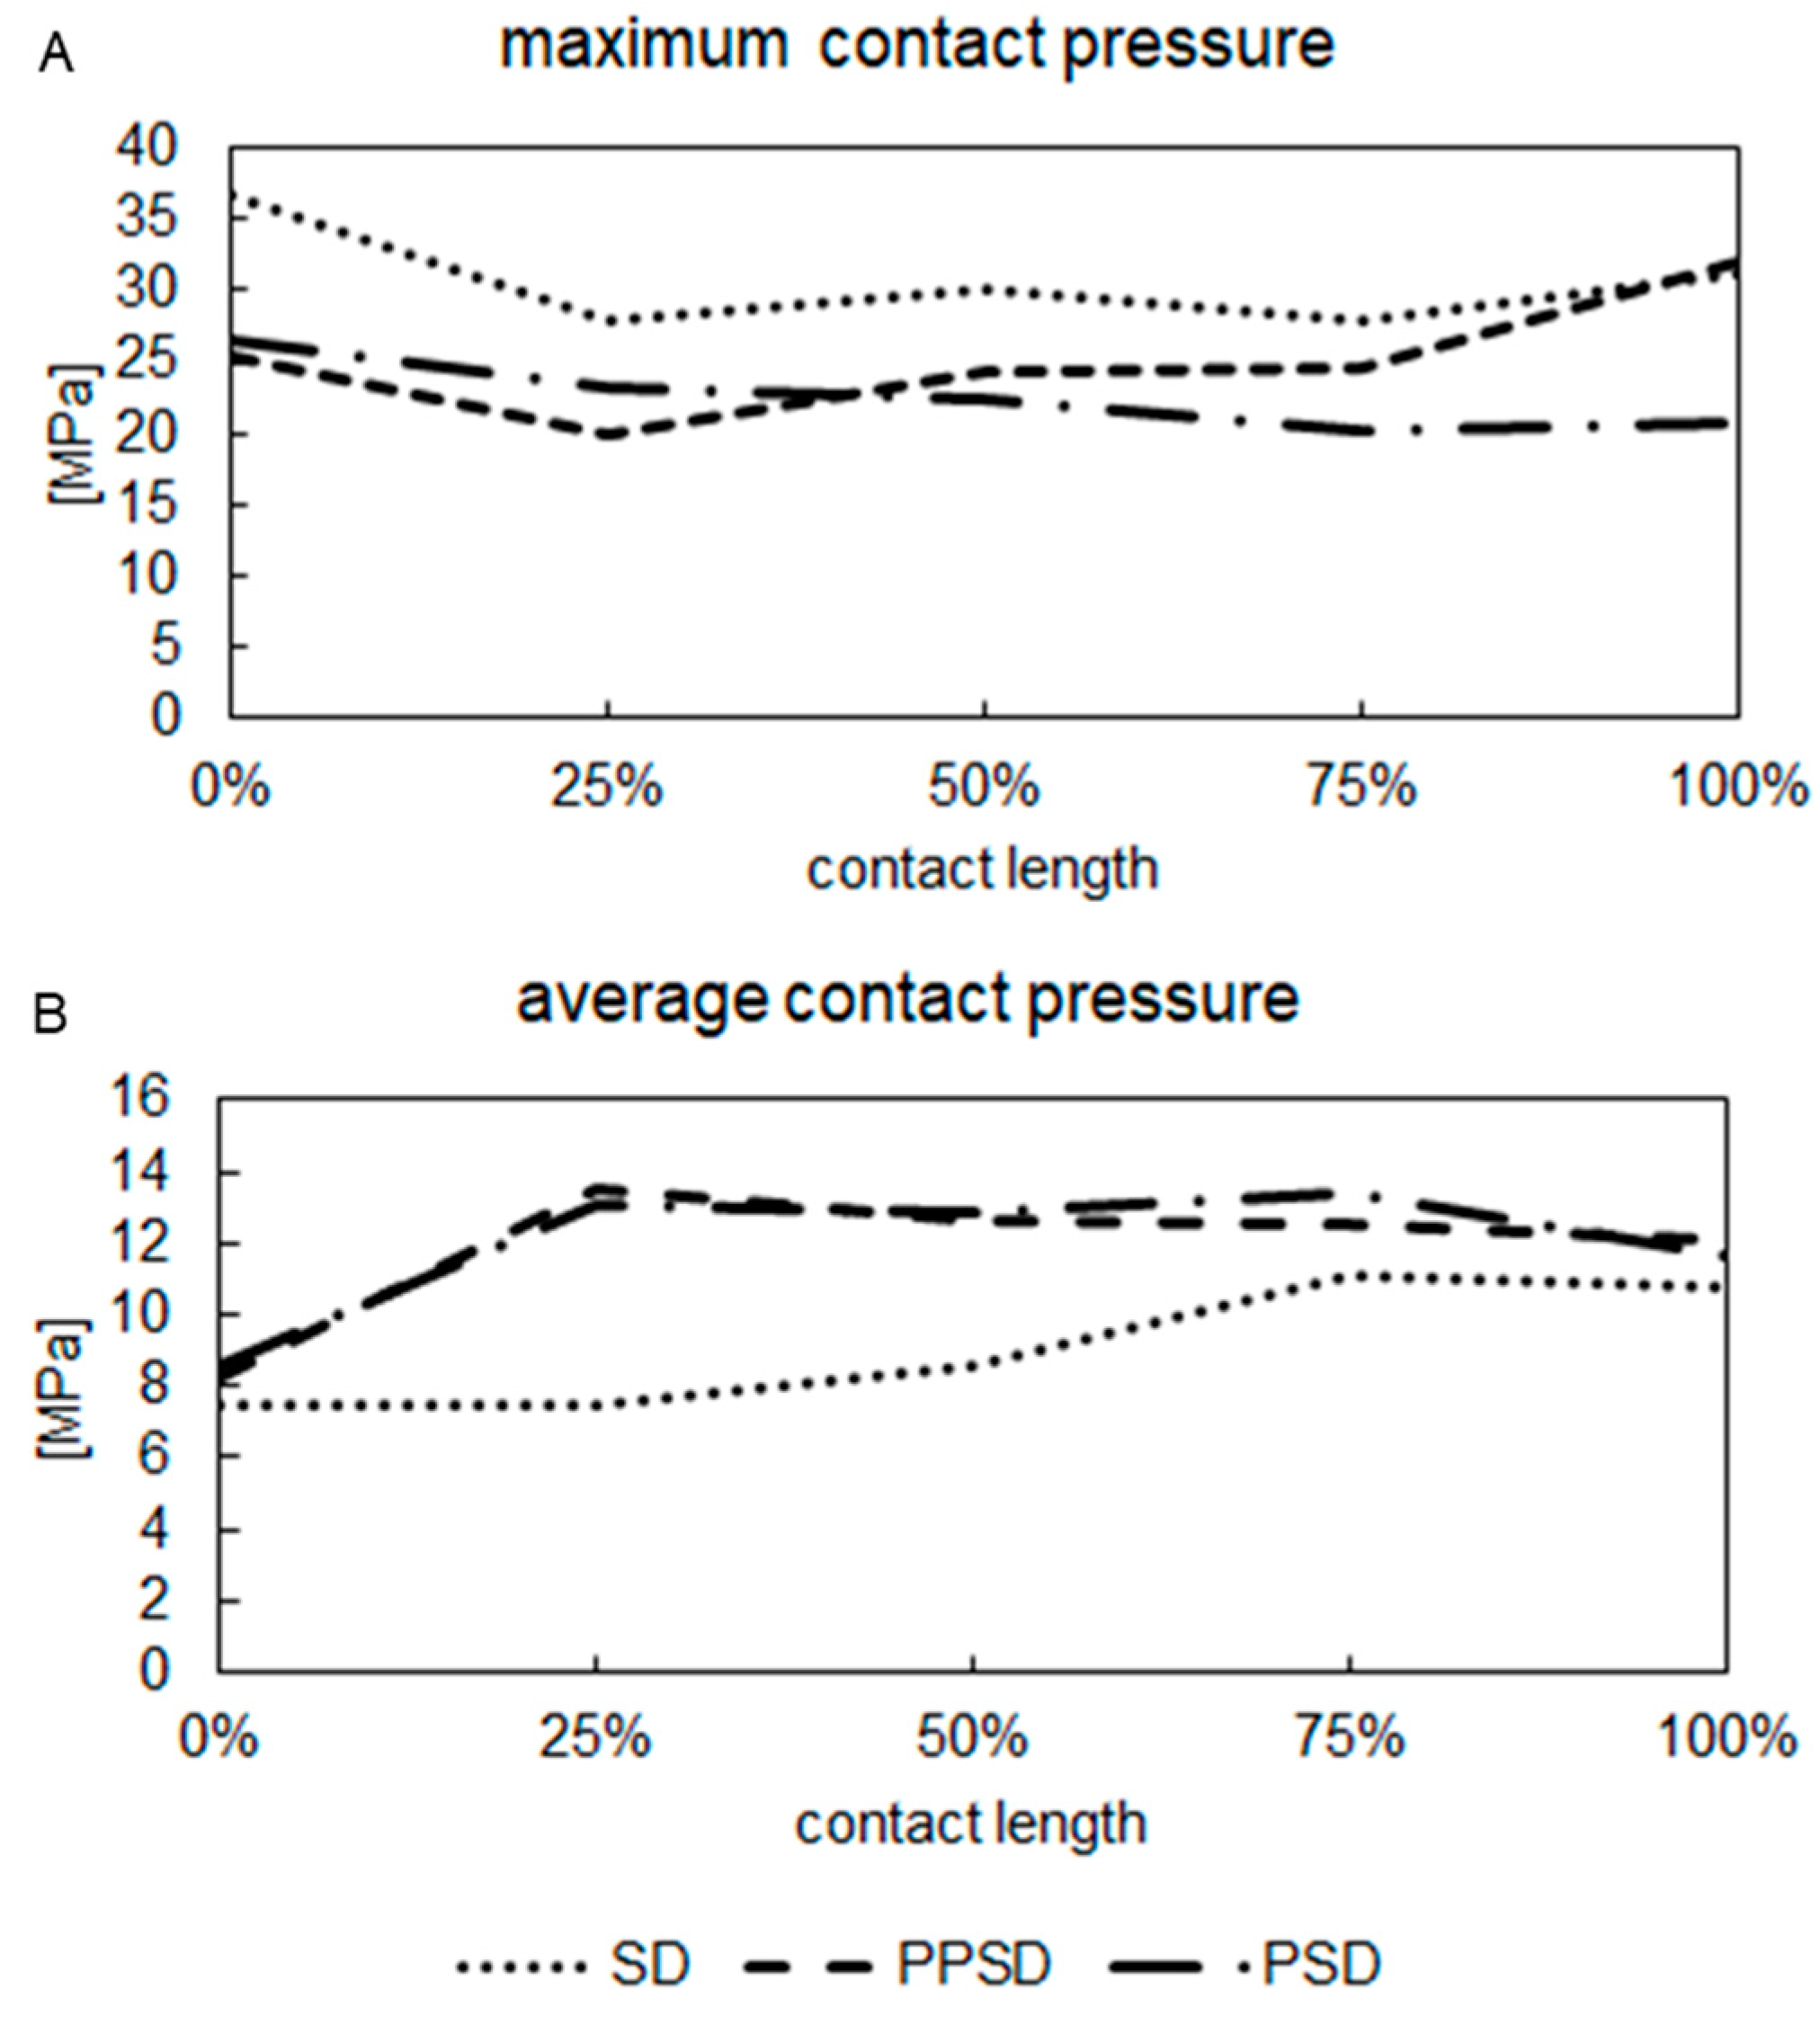
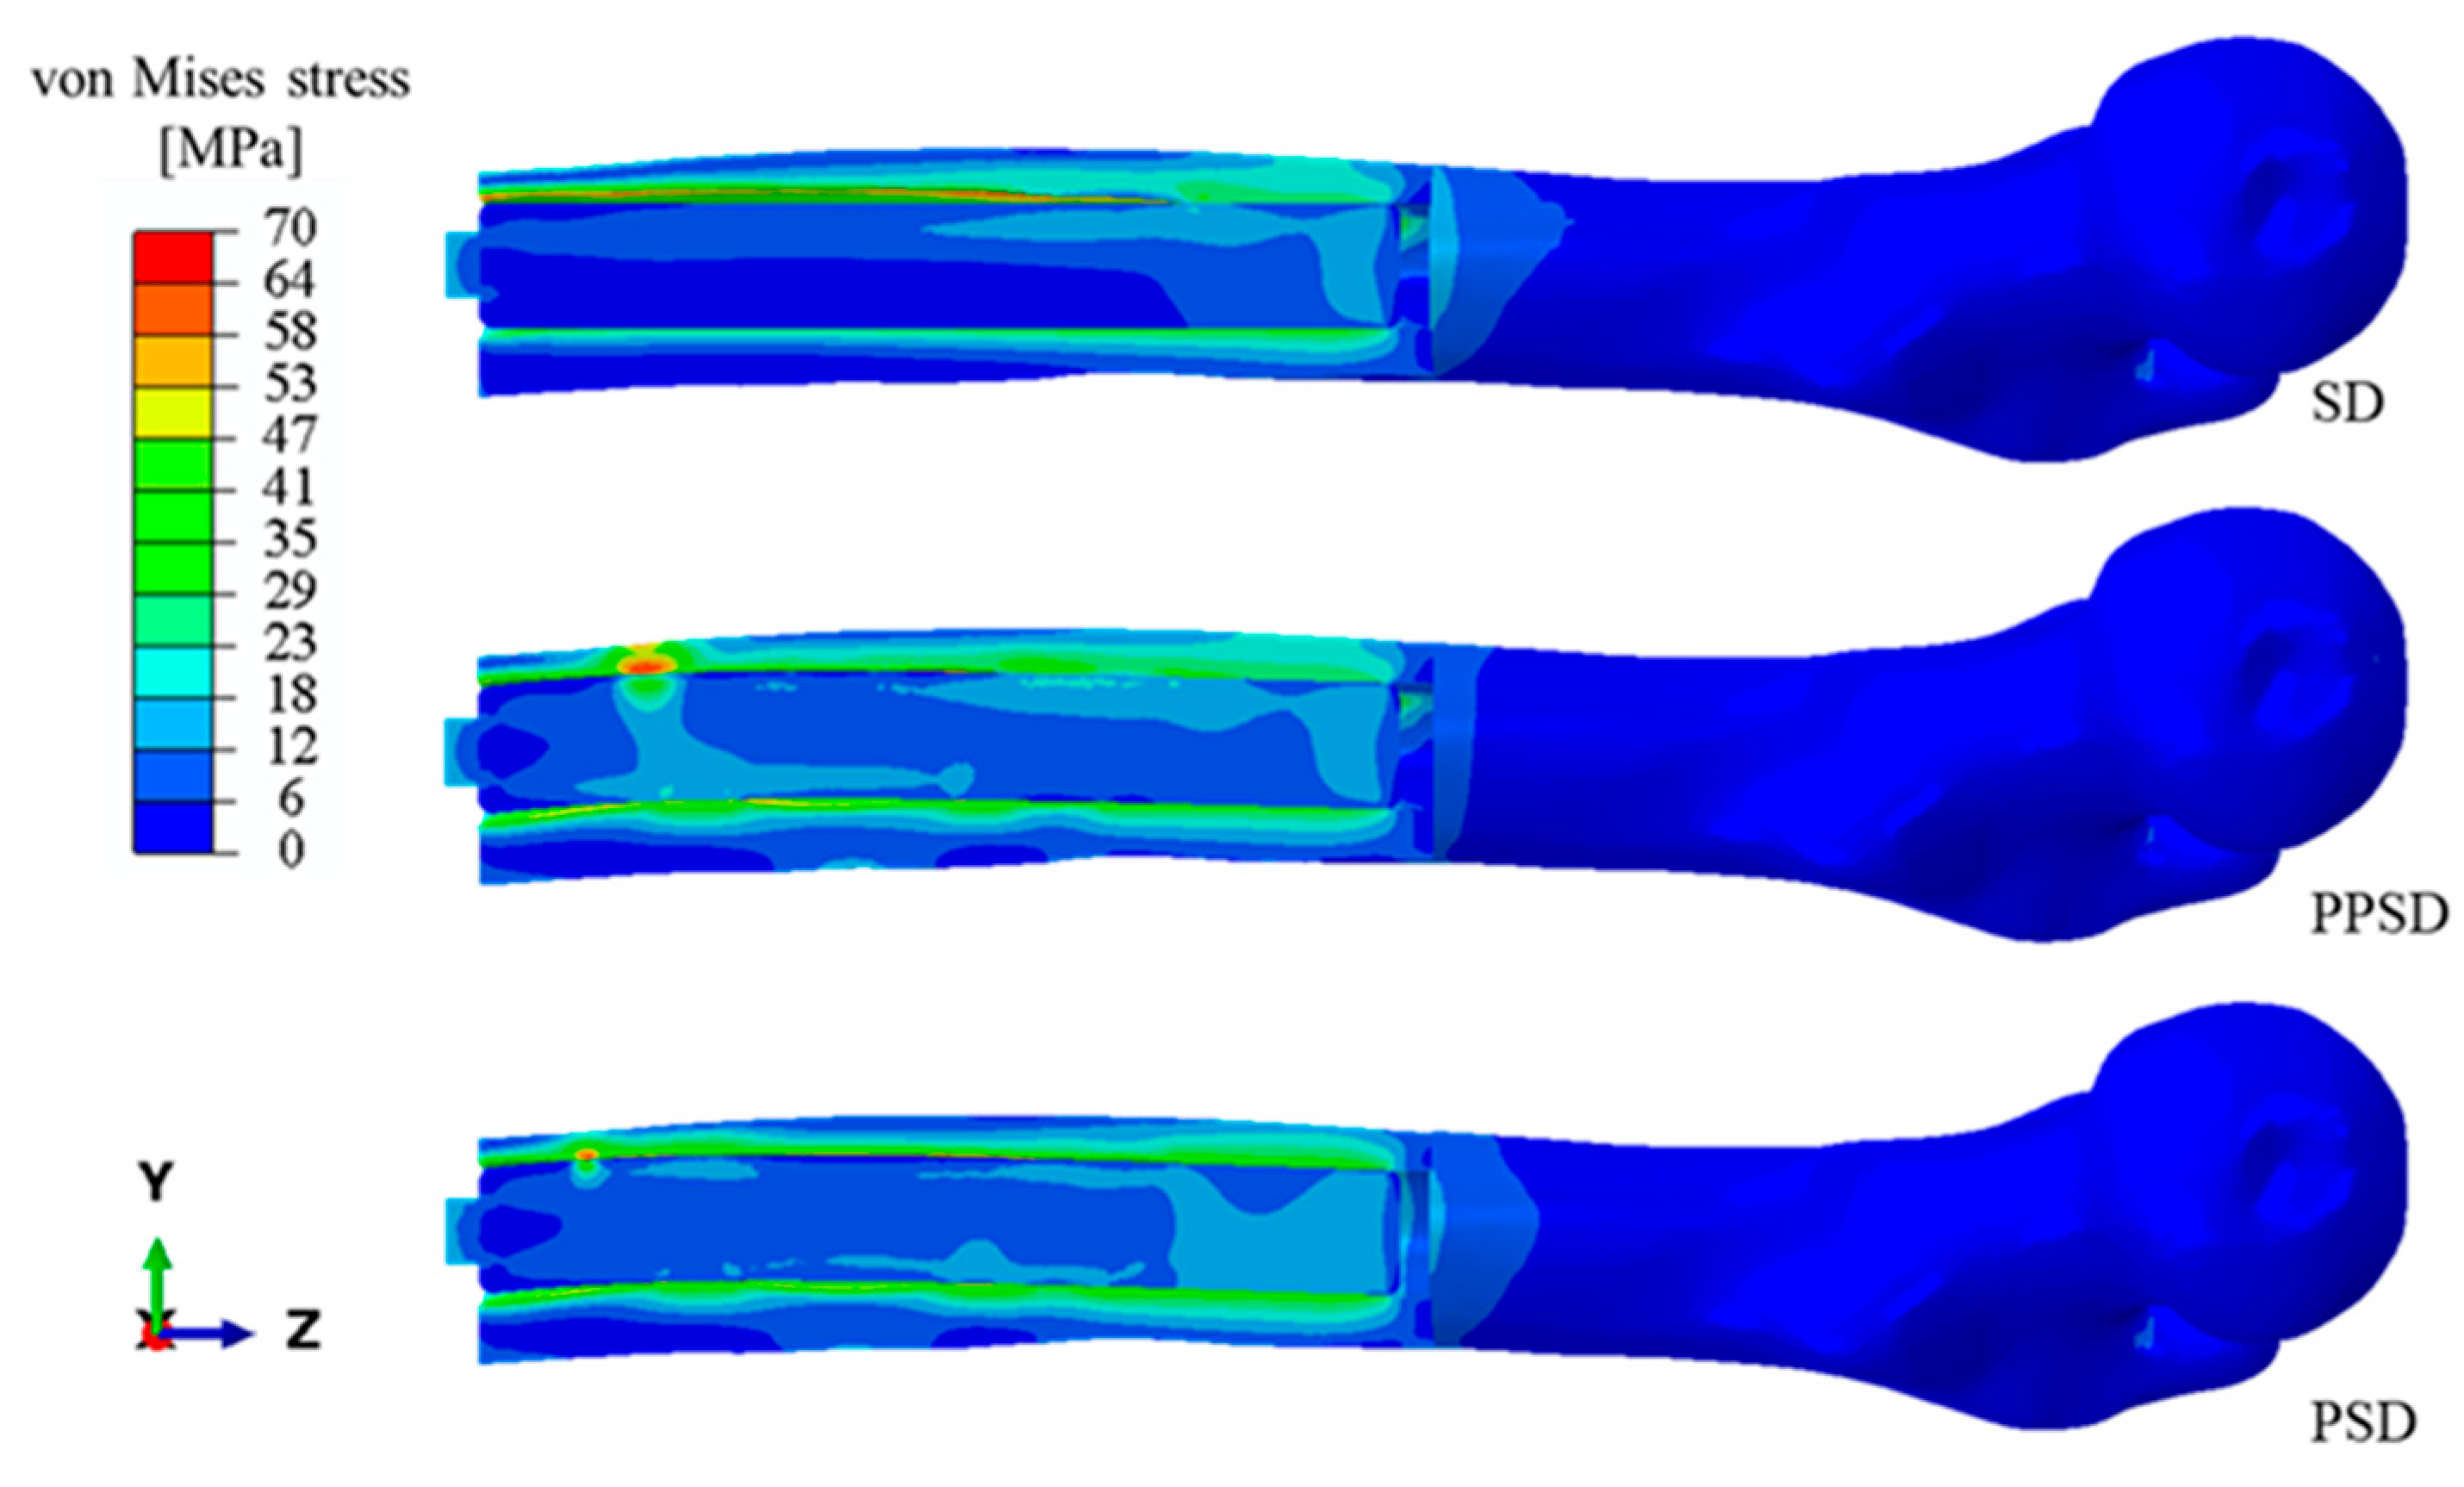
Each analysis was performed following two subsequential steps: pre-loading due to the press-fit condition and compression loading. In the first step, the press-fit condition was achieved by enabling Abaqus 2020 built-in function interference fit [7,20,45]. In the compression loading step, a load of 1000 N linearly applied along the anatomical axis was considered [6,16,19,46], while the bone was fixed on the proximal part [6,18,31,35]; the boundary conditions are depicted in Figure 7. The adopted compression load represents a static load-bearing exercise usually performed to stimulate bone growth. The use of a compression load along the bone axis is justified by the fact that a simple bathroom scale is used to assess the weight fraction applied by the patient during the load-bearing exercise. The friction condition at the bone–stem interface was modeled with a penalty method using the finite sliding surface-to-surface formulation, with a friction coefficient of 0.29, as reported in the literature [15,24,41,45]. All analyses were performed using contact control with a compenetrating tolerance of 0.2% [22]. All contact parameters used in the model are summarized in Table 2.

3. Results

To evaluate the performance in terms of primary stability and the possible effect on secondary stability, different results were extracted. Because the three implants designed did not have identical bone–stem surfaces, as clearly shown in Figure 4, the effective area of the bone–implant interface and the percentage of the effective contact surface, with respect to the total stem surface, of the implants were calculated. The values are reported in Figure 8.
The primary stability was calculated by evaluating the micromotions under a load of 1000 N representing the static load-bearing exercise carried out during the rehabilitation. Micromotions were evaluated using Abaqus 2020 built-in function CSLIP, reported in the Abaqus manual as the tangential relative motion between the nodes of the bone and the implant. The CSLIP value was evaluated at the contact surfaces along two perpendicular directions, identified as CSLIP1 and CSLIP2 [24,47]. The micromotion at the bone–implant interface was calculated as the result of the tangential relative displacements (CSLIP1 and CSLIP2) for each node-n, as defined in Equation (1):
C S L I P n = C S L I P 1 n 2 + C S L I P 2 n 2
The primary stability was evaluated by assessing the micromotion values at the bone–stem interface to check if micromotions cross the value of 50 µm, which represents the minimum value where fibrous tissue, instead of bone tissue, is formed, with the risk of compromising long-term stability [15,20,21,22]. The maximum micromotions for the three implant designs are shown in Figure 9. The micromotion maps’ distribution along the contact surface is reported in Figure 10, where it is possible to see how the amount of surface under slip conditions is different for the three implants. There is a wide zone of the SD with micromotions over 50 µm.
The implant that has shown lower values of maximum micromotions was the PSD design, with a peak value of 51.4 µm. For the PPSD design, a peak of 58.6 µm was recorded. The worst results were achieved with the SD implant, which shows a maximum value of 73.9 µm. The von Mises stress distributions (Figure 11) and the maximum and average contact pressure (Figure 12) of five cross-sections at five distinct levels of the contact length, from 0 to 100%, were assessed.
From those distributions, it is possible to observe that the von Mises stress distribution for the SD implant, as shown in Figure 11, is irregular in all the analyzed sections; instead, the PPSD and PSD implants show a more regular distribution of the von Mises stress in the cortical bone. Figure 13 shows the distribution of the von Mises stress for a section along the sagittal plane, where it is possible to see how a thicker portion of cortical bone participates in the load transfer.

4. Discussion

Osseointegration serves as a long-term anchoring method in diverse applications, including limb amputation. Primary stability, achieved through mechanical connection, is evaluated via the assessment of bone–implant micromotions. The magnitude of these micromotions is a key factor in successful osseointegration. While micromotions exceeding 50 µm may promote fibrous tissue formation, a range of 50–150 µm is generally considered acceptable. Consequently, precise morphological matching between the implant stem and the medullary canal is crucial for ensuring adequate stability. The purpose of this research is to establish if a customized implant design, based on the medullary canal, increases immediate post-operative primary stability. In particular, two curved patient-specific intramedullary stems and a straight one, used as a reference model, were designed. To assess the primary stability, micromotions at the bone–implant interface were calculated in a virtual model of the residual bone under an axial load of 1000 N.
Different performances in terms of micromotion values and distributions were calculated for each stem. Micromotions are higher in the distal part (Figure 10), having all the implants at their maximum micromotion value in the first portion of the contact area. In detail, the PSD prosthesis’ maximum micromotion just overcame 50 µm with a value of 51.4 µm that was registered in a small region of the distal part of the contact surface, and a no-slip area was found in the proximal part of the contact area. On the other hand, the micromotion distributions of the SD showed a wide area, about half of the contact length, where the micromotions exceed 50 µm, with values that range from 56 to a maximum of 73.9 µm. The PPSD implant showed a maximum value of 58.6 µm in a reduced area similar to the PSD, a strong asymmetric distribution of the micromotions, unlike the PSD. This suggests that the patient-specific approach could have positive implications in long-term stability, suggesting that the PSD implant, as well as the PPSD one, can prevent the formation of fibrous tissue related to an excessive relative motion between the bone and the implant, as well as the PPSD. On the other hand, due to higher micromotions, the SD implant can more probably lead to the formation of fibrous tissue and consequent incomplete bone ingrowth [13,15,20,21,22]. By the examination of the contact pressure at different sections (Figure 12), it can be stated that the SD implant causes the highest maximum contact pressure among the evaluated stems, but the average contact pressure is the lowest, suggesting that for the PSD and PPSD, more bone is involved in the interference, leading to a better press fit and a more homogeneous distribution of the contact pressure. Taking a closer look at the von Mises distribution (Figure 11 and Figure 13), useful indications could be extrapolated about the stress distribution. Specifically, the von Mises stress maps appear more homogeneously distributed in the whole contact zone for the PSD and PPSD, engaging a thicker portion of cortical bone in the load transferred from the implant to the bone. Also, stress distribution could provide some information for long-term stability; in fact, the stress distribution and the micromotion of the patient-specific implants suggest that a homogenous bone remodeling could occur with no fibrous tissue formation, preventing possible adverse events such as the risk of implant loosening [6,13,18,21,28,30,35,36,48].
A close comparison of the results reported in this study can be carried out with the works of Prochor et al., 2019 [6], in which the primary stability was investigated using the same load condition adopted in our work, finding similar values compared to our results for the micromotions at 1000 N (76.02 µm [6]). Moreover, the von Mises stress values obtained in our study are comparable with the results reported by Prochor 2017 [34]. For the von Mises stress distribution, some studies reported unloaded zones and bone resorption in the distal part of the bone–implant interface both in the computational study [18] and the radiological assessment [49], confirming that the distal portion of the bone receives less load, as found in this study.
Although the present study met its purposes, some limitations should be acknowledged to improve and refine future research. Currently, the literature does not provide enough experimental data that would help the setup of more reliable numerical models. The limited indications that can be extrapolated concern original studies that are usually focused on several anatomical parts, such as the hip [6,16,17,22,34,41,43] or the knee [24].
No anisotropy related to the implant material, which may derive from the manufacturing process, is considered due to the high difference in stiffness between bone and implant and the fact that our focus is on the bone stress [10]. For this reason, our result represents a preliminary work with a comparative purpose. From a methodological point of view, in this study, the cortical bone was modeled as an orthotropic material, according to similar works in the literature [10,30,34,43], but could be modeled with other numerical models, such as the micro-plane model [50], used for new materials that have similar behavior.

5. Conclusions

In this study, a comparative analysis among three different transfemoral osseointegrated implants was performed. A straight stem and two patient-specific implants were analyzed: the first one was designed by exactly following the medullary canal midline curve, and the second one was designed by projecting this curve on the sagittal plane. Specifically, equipping a residual femur with a stem designed following the medullary canal midline allows obtaining a lower value in micromotion (51.4 µm) at the bone–implant interface for 1000 N, compared to a stem realized following a straight line (73.9 µm) or a planar projection of the medullary canal midline (58.6 µm). Moreover, the patient-specific implants have shown a wider contact area, with an increment, concerning the SD, of 11% and 6% for the PSD and PPSD, respectively. This results in a larger part of bone volume participating in the interference and so involved in the load transferred, leading to a relevant increase in the average contact pressure. These results show the effectiveness, in terms of primary stability, of a patient-specific approach and suggest that an implant designed from the bone morphology can reduce the risk of fibrous tissue formation and homogenize the stress distribution and consequently help to reduce the bone loosening.
The approach used in this study could be effectively used for other anatomical districts [51], contributing to spreading the patient-specific prosthesis design, as suggested in different review works [2,8,13,39]. In conclusion, the results obtained in this study provide some preliminary indications that could be useful in designing patient-specific intramedullary prostheses starting from CT images of an amputee patient.

Author Contributions

Conceptualization: A.V., T.I., and A.I.M.; data curation: A.V., G.M., and V.R.; methodology: A.V., T.I., and A.I.M.; software: A.V. and A.I.M.; supervision: A.C., T.I., G.M., and V.N.; writing—original draft: A.V. and A.I.M.; writing—review and editing: A.C., T.I., V.N., and V.R. All authors have read and agreed to the published version of the manuscript.

Funding

This research received no external funding.

Institutional Review Board Statement

Not applicable.

Informed Consent Statement

Not applicable.

Data Availability Statement

The raw data supporting the conclusions of this article will be made available by the authors on request.

Acknowledgments

The authors thank the MeTACOs (Trattamento delle amputazioni mediante osteointegrazione) project for the support in the conceptualization of this work.

Conflicts of Interest

The authors declare no conflicts of interest.

Abbreviations

The following abbreviations are used in this manuscript:
OIOsseointegrated
PPSDPlanar patient-specific design
PSDPatient-specific design
SDStraight design

References

  1. Brånemark, R.; Brånemark, P.-I.; Rydevik, B.; Myers, R.R. Osseointegration in Skeletal Reconstruction and Rehabilitation: A Review. J. Rehabil. Res. Dev. 2001, 38, 175–181. [Google Scholar] [PubMed]
  2. Hoellwarth, J.S.; Tetsworth, K.; Rozbruch, S.R.; Handal, M.B.; Coughlan, A.; Al Muderis, M. Osseointegration for Amputees: Current Implants, Techniques, and Future Directions. JBJS Rev. 2020, 8, e0043. [Google Scholar] [CrossRef] [PubMed]
  3. Al Muderis, M.; Khemka, A.; Lord, S.J.; Van De Meent, H.; Frolke, J.P.M. Safety of Osseointegrated Implants for Transfemoral Amputees: A Two-Center Prospective Cohort Study. J. Bone Jt. Surg. Am. Vol. 2016, 98, 900–909. [Google Scholar] [CrossRef]
  4. Pitkin, M. Design Features of Implants for Direct Skeletal Attachment of Limb Prostheses. J. Biomed. Mater. Res. A 2013, 101, 3339–3348. [Google Scholar] [CrossRef]
  5. Thesleff, A.; Brånemark, R.; Håkansson, B.; Ortiz-Catalan, M. Biomechanical Characterisation of Bone-Anchored Implant Systems for Amputation Limb Prostheses: A Systematic Review. Ann. Biomed. Eng. 2018, 46, 377–391. [Google Scholar] [CrossRef] [PubMed]
  6. Prochor, P.; Sajewicz, E. The Influence of Geometry of Implants for Direct Skeletal Attachment of Limb Prosthesis on Rehabilitation Program and Stress-Shielding Intensity. Biomed. Res. Int. 2019, 2019, 6067952. [Google Scholar] [CrossRef]
  7. Damm, N.B.; Morlock, M.M.; Bishop, N.E. Influence of Trabecular Bone Quality and Implantation Direction on Press-Fit Mechanics. J. Orthop. Res. 2017, 35, 224–233. [Google Scholar] [CrossRef]
  8. Safari, R. Lower Limb Prosthetic Interfaces: Clinical and Technological Advancement and Potential Future Direction. Prosthet. Orthot. Int. 2020, 44, 384–401. [Google Scholar] [CrossRef]
  9. Di Paolo, S.; Barone, G.; Alesi, D.; Mirulla, A.I.; Gruppioni, E.; Zaffagnini, S.; Bragonzoni, L. Longitudinal Gait Analysis of a Transfemoral Amputee Patient: Single-Case Report from Socket-Type to Osseointegrated Prosthesis. Sensors 2023, 23, 4037. [Google Scholar] [CrossRef]
  10. Ovesy, M.; Voumard, B.; Zysset, P. A Nonlinear Homogenized Finite Element Analysis of the Primary Stability of the Bone–Implant Interface. Biomech. Model. Mechanobiol. 2018, 17, 1471–1480. [Google Scholar] [CrossRef]
  11. Hebert, J.S.; Rehani, M.; Stiegelmar, R. Osseointegration for Lower-Limb Amputation: A Systematic Review of Clinical Outcomes. JBJS Rev. 2017, 5, e10. [Google Scholar] [CrossRef] [PubMed]
  12. Atallah, R.; van de Meent, H.; Verhamme, L.; Frölke, J.P.; Leijendekkers, R.A. Safety, Prosthesis Wearing Time and Health-Related Quality of Life of Lower Extremity Bone-Anchored Prostheses Using a Press-Fit Titanium Osseointegration Implant: A Prospective One-Year Follow-up Cohort Study. PLoS ONE 2020, 15, e0230027. [Google Scholar] [CrossRef] [PubMed]
  13. Gao, X.; Fraulob, M.; Haïat, G. Biomechanical Behaviour of Bone-Implant Interface: A Review Biomechanical Behaviours of the Bone-Implant Interface: A Review. J. R. Soc. Interface 2019, 16, 20190259. [Google Scholar] [CrossRef]
  14. Le Béguec, P.; Sieber, H.-P. The Concept of “Press-Fit”. In Revision of Loose Femoral Prostheses: With a Stem System Based on the “Press-Fit” Principle: A Concept and a System of Implants: A Method and Its Results; Le Béguec, P., Sieber, H.-P., Eds.; Springer: Paris, France, 2007; pp. 19–27. ISBN 978-2-287-39629-8. [Google Scholar]
  15. Viceconti, M.; Muccini, R.; Bernakiewicz, M.; Baleani, M.; Cristofolini, L. Large-Sliding Contact Elements Accurately Predict Levels of Bone-Implant Micromotion Relevant to Osseointegration. J. Biomech. 2000, 33, 1611–1618. [Google Scholar] [CrossRef] [PubMed]
  16. Viceconti, M.; Pancanti, A.; Dotti, M.; Traina, F.; Cristofolini, L. Effect of the Initial Implant Fitting on the Predicted Secondary Stability of a Cementless Stem. Med. Biol. Eng. Comput. 2004, 42, 222–229. [Google Scholar] [CrossRef]
  17. Reggiani, B.; Cristofolini, L.; Varini, E.; Viceconti, M. Predicting the Subject-Specific Primary Stability of Cementless Implants during Pre-Operative Planning: Preliminary Validation of Subject-Specific Finite-Element Models. J. Biomech. 2007, 40, 2552–2558. [Google Scholar] [CrossRef]
  18. Tomaszewski, P.K.; van Diest, M.; Bulstra, S.K.; Verdonschot, N.; Verkerke, G.J. Numerical Analysis of an Osseointegrated Prosthesis Fixation with Reduced Bone Failure Risk and Periprosthetic Bone Loss. J. Biomech. 2012, 45, 1875–1880. [Google Scholar] [CrossRef]
  19. Lee, W.C.C.; Doocey, J.M.; Brånemark, R.; Adam, C.J.; Evans, J.H.; Pearcy, M.J.; Frossard, L.A. FE Stress Analysis of the Interface between the Bone and an Osseointegrated Implant for Amputees—Implications to Refine the Rehabilitation Program. Clin. Biomech. 2008, 23, 1243–1250. [Google Scholar] [CrossRef]
  20. Ramamurti, B.S.; Orr, T.E.; Bragdon, C.R.; Lowenstein, J.D.; Jasty, M.; Harris, W.H. Factors Influencing Stability at the Interface between a Porous Surface and Cancellous Bone: A Finite Element Analysis of a Canine in Vivo Micromotion Experiment. J. Biomed. Mater. Res. 1997, 36, 274–280. [Google Scholar] [CrossRef]
  21. Saravana Kumar, G.; George, S.P. Optimization of Custom Cementless Stem Using Finite Element Analysis and Elastic Modulus Distribution for Reducing Stress-Shielding Effect. Proc. Inst. Mech. Eng. Part H 2017, 231, 149–159. [Google Scholar] [CrossRef]
  22. Pettersen, S.H.; Wik, T.S.; Skallerud, B. Subject Specific Finite Element Analysis of Implant Stability for a Cementless Femoral Stem. Clin. Biomech. 2009, 24, 480–487. [Google Scholar] [CrossRef] [PubMed]
  23. Hériveaux, Y.; Le Cann, S.; Fraulob, M.; Vennat, E.; Nguyen, V.H.; Haïat, G. Mechanical Micromodeling of Stress-Shielding at the Bone-Implant Interphase under Shear Loading. Med. Biol. Eng. Comput. 2022, 60, 3281–3293. [Google Scholar] [CrossRef] [PubMed]
  24. Conlisk, N.; Howie, C.R.; Pankaj, P. Quantification of Interfacial Motions Following Primary and Revision Total Knee Arthroplasty: A Verification Study versus Experimental Data. J. Orthop. Res. 2018, 36, 387–396. [Google Scholar] [CrossRef] [PubMed]
  25. Solitro, G.F.; Whitlock, K.; Amirouche, F.; Santis, C. Measures of Micromotion in Cementless Femoral Stems-Review of Current Methodologies. Biomater. Biomech. Bioeng. 2016, 3, 85–104. [Google Scholar] [CrossRef]
  26. Ingrassia, T.; Nigrelli, V.; Ricotta, V.; Nalbone, L.; D’Arienzo, A.; D’Arienzo, M.; Porcellini, G. A New Method to Evaluate the Influence of the Glenosphere Positioning on Stability and Range of Motion of a Reverse Shoulder Prosthesis. Injury 2019, 50, S12–S17. [Google Scholar] [CrossRef]
  27. Ingrassia, T.; Nigrelli, V.; Pecorella, D.; Bragonzoni, L.; Ricotta, V. Influence of the Screw Positioning on the Stability of Locking Plate for Proximal Tibial Fractures: A Numerical Approach. Appl. Sci. 2020, 10, 4941. [Google Scholar] [CrossRef]
  28. Park, J.; Park, S.; Kang, I.; Noh, G. Biomechanical Effects of Bone Quality and Design Features in Dental Implants in Long-Term Bone Stability. J. Comput. Des. Eng. 2022, 9, 1538–1548. [Google Scholar] [CrossRef]
  29. Tomaszewski, P.K.; Verdonschot, N.; Bulstra, S.K.; Rietman, J.S.; Verkerke, G.J. Simulated Bone Remodeling around Two Types of Osseointegrated Implants for Direct Fixation of Upper-Leg Prostheses. J. Mech. Behav. Biomed. Mater. 2012, 15, 167–175. [Google Scholar] [CrossRef]
  30. Newcombe, L.; Dewar, M.; Blunn, G.W.; Fromme, P. Effect of Amputation Level on the Stress Transferred to the Femur by an Artificial Limb Directly Attached to the Bone. Med. Eng. Phys. 2013, 35, 1744–1753. [Google Scholar] [CrossRef]
  31. Helgason, B.; Pálsson, H.; Rúnarsson, T.P.; Frossard, L.; Viceconti, M. Risk of Failure during Gait for Direct Skeletal Attachment of a Femoral Prosthesis: A Finite Element Study. Med. Eng. Phys. 2009, 31, 595–600. [Google Scholar] [CrossRef]
  32. Ghaziani, A.O.; Soheilifard, R.; Kowsar, S. The Effect of Functionally Graded Materials on Bone Remodeling around Osseointegrated Trans-Femoral Prostheses. J. Mech. Behav. Biomed. Mater. 2021, 118, 104426. [Google Scholar] [CrossRef] [PubMed]
  33. Taylor, C.E.; Henninger, H.B.; Bachus, K.N. Finite Element Analysis of Transhumeral and Transtibial Percutaneous Osseointegrated Endoprosthesis Implantation. Front. Rehabil. Sci. 2021, 2, 744674. [Google Scholar] [CrossRef] [PubMed]
  34. Prochor, P. Finite Element Analysis of Stresses Generated in Cortical Bone during Implantation of a Novel Limb Prosthesis Osseointegrated Fixation System. Biocybern. Biomed. Eng. 2017, 37, 255–262. [Google Scholar] [CrossRef]
  35. Tomaszewski, P.K.; Verdonschot, N.; Bulstra, S.K.; Verkerke, G.J. A Comparative Finite-Element Analysis of Bone Failure and Load Transfer of Osseointegrated Prostheses Fixations. Ann. Biomed. Eng. 2010, 38, 2418–2427. [Google Scholar] [CrossRef]
  36. Lu, S.; Vien, B.S.; Russ, M.; Fitzgerald, M.; Chiu, W.K. Novel Osseointegration Implant Optimization—Australasian Congress on Applied Mechanics. In Proceedings of the ACAM10: 10th Australasian Congress on Applied Mechanics, Online, 1–3 December 2021; pp. 66–78. [Google Scholar]
  37. Cirello, A.; Ingrassia, T.; Marannano, G.; Mirulla, A.I.; Nigrelli, V.; Petrucci, G.; Ricotta, V. A New Automatic Process Based on Generative Design for CAD Modeling and Manufacturing of Customized Orthosis. Appl. Sci. 2024, 14, 6231. [Google Scholar] [CrossRef]
  38. Li, Y.; Felländer-Tsai, L. The Bone Anchored Prostheses for Amputees—Historical Development, Current Status, and Future Aspects. Biomaterials 2021, 273, 120836. [Google Scholar] [CrossRef]
  39. Al Muderis, M.; Aschoff, H.H.; Bosley, B.; Raz, G.; Gerdesmeyer, L.; Burkett, B. Direct Skeletal Attachment Prosthesis for the Amputee Athlete: The Unknown Potential. Sports Eng. 2016, 19, 141–145. [Google Scholar] [CrossRef]
  40. Frölke, J.P.M.; Leijendekkers, R.A.; van de Meent, H. Osseointegrierte Prothese Für Patienten Nach Amputation: Multidisziplinärer Behandlungsansatz in Den Niederlanden. Unfallchirurg 2017, 120, 293–299. [Google Scholar] [CrossRef]
  41. Bernakiewicz, M.; Viceconti, M. The Role of Parameter Identification in Finite Element Contact Analyses with Reference to Orthopaedic Biomechanics Applications. J. Biomech. 2002, 35, 61–67. [Google Scholar] [CrossRef]
  42. Stenlund, P.; Trobos, M.; Lausmaa, J.; Brånemark, R.; Thomsen, P.; Palmquist, A. Effect of Load on the Bone around Bone-Anchored Amputation Prostheses. J. Orthop. Res. 2017, 35, 1113–1122. [Google Scholar] [CrossRef]
  43. Russell, R.D.; Huo, M.H.; Rodrigues, D.C.; Kosmopoulos, V. Stem Geometry Changes Initial Femoral Fixation Stability of a Revised Press-Fit Hip Prosthesis: A Finite Element Study. Technol. Health Care 2016, 24, 865–872. [Google Scholar] [CrossRef] [PubMed]
  44. Ashman, R.B.; Cowin, S.C.; Van Buskirk, W.C.; Rice, J.C. A Continuous Wave Technique for the Measurement of the Elastic Properties of Cortical Bone. J. Biomech. 1984, 17, 349–361. [Google Scholar] [CrossRef] [PubMed]
  45. Yu, H.Y.; Cai, Z.B.; Zhou, Z.R.; Zhu, M.H. Fretting Behavior of Cortical Bone against Titanium and Its Alloy. Wear 2005, 259, 910–918. [Google Scholar] [CrossRef]
  46. Vertriest, S.; Coorevits, P.; Hagberg, K.; Brånemark, R.; Häggström, E.; Vanderstraeten, G.; Frossard, L. Static Load Bearing Exercises of Individuals with Transfemoral Amputation Fitted with an Osseointegrated Implant: Reliability of Kinetic Data. IEEE Trans. Neural Syst. Rehabil. Eng. 2015, 23, 423–430. [Google Scholar] [CrossRef]
  47. Dassault Systèmes Simulia Corp. ABAQUS/Standard User’s Manual, Version 2021; Simulia: Johnston, RI, USA, 2021. [Google Scholar]
  48. Mirulla, A.I.; Pinelli, S.; Zaffagnini, S.; Nigrelli, V.; Ingrassia, T.; Di Paolo, S.; Bragonzoni, L. Numerical Simulations on Periprosthetic Bone Remodeling: A Systematic Review. Comput. Methods Programs Biomed. 2021, 204, 106072. [Google Scholar] [CrossRef]
  49. Thomson, S.; Thomson, A.; Tetsworth, K.; Lu, W.; Zreiqat, H.; Al Muderis, M. Radiographic Evaluation of Bone Remodeling Around Osseointegration Implants among Transfemoral Amputees. J. Orthop. Trauma. 2019, 33, 303–308. [Google Scholar] [CrossRef]
  50. Benfratello, S.; Cirello, A.; Palizzolo, L.; Sanfilippo, C.; Valenza, A. Experimental Analysis and Numerical Modelling of the Mechanical Behavior of a Sisal-Fiber-Reinforced Geopolymer. Appl. Sci. 2024, 14, 5216. [Google Scholar] [CrossRef]
  51. Abdelaal, O.; Darwish, S.; El-Hofy, H.; Saito, Y. Patient-Specific Design Process and Evaluation of a Hip Prosthesis Femoral Stem. Int. J. Artif. Organs 2019, 42, 271–290. [Google Scholar] [CrossRef]
Figure 1. CT scan of the region of interest that was used during the segmentation (A), and the reconstructed CAD model (B) with the steps of the workflow (C).
Applsci 15 05913 g001
Figure 2. The original CAD model of the femur with the callus and the cutting plane selected to remove it (A), the cross-sections adopted to identify the centroids (B), the sagittal plane of the femur (C), the 3D medullary canal midline (black), and its projection on the sagittal plane (white) (D).
Applsci 15 05913 g002
Figure 3. The CAD model of the PSD with the medullary canal highlighted in black in the longitudinal (A) and frontal (B) view and the two curves (C), the medullary canal midline (black) and its projection on the sagittal plane (blue) used to design the PPSD.
Applsci 15 05913 g003
Figure 4. A sectional view along the sagittal plane of the straight design (A), the planar patient-specific design (B), and the patient-specific design (C) bone–implant assembly. The transverse views A-A, B-B, and C-C show the difference in the contact surface among the three implants.
Applsci 15 05913 g004
Figure 5. The final mesh of the bone–implant assembly (A) and a sectional view of the bone, along the sagittal plane, (B) that shows the mesh refinement on the contact surface.
Applsci 15 05913 g005
Figure 6. Variations in the micromotions (A) and the von Mises stress (B), with the element size, at the bone–implant interface for three different cross-sections.
Applsci 15 05913 g006
Figure 7. The final assembly with the constraints and the force applied.
Applsci 15 05913 g007
Figure 8. The effective contact area of the bone–implant interface and the percentage of contact area with respect to the entire stem surface.
Applsci 15 05913 g008
Figure 9. Maximum micromotions at the bone–implant interface.
Applsci 15 05913 g009
Figure 10. Micromotions distribution at the bone–implant interface from a left (A) and a right (B) view of the surfaces.
Applsci 15 05913 g010
Figure 11. Positions of the analyzed sections on the bone–implant assembly, with a detail of their positions on the implant’s stem (A) and the respective von Mises stress distribution for the SD, PPSD, and PSD (B).
Applsci 15 05913 g011
Figure 12. The maximum (A) and average (B) contact pressures at five sections of the bone–implant interface.
Applsci 15 05913 g012
Figure 13. Maps of von Mises stress distribution along the sagittal plane for the analyzed implants.
Applsci 15 05913 g013
Table 1. Implant’s material properties.
ExEyEzGxyGyzGxzνxyνyzνxz
Cortical bone12 GPa13.4 GPa20 GPa4.53 GPa6.23 GPa5.61 GPa0.3760.2350.222
Ti6Al4V110 GPa//////////0.3////
Sources: [21,43,44].
Table 2. Parameters used to define the contact.
Contact element
surface to surface
Contact formulation
finite sliding
Normal behaviour
“Hard” penalty
Normal stiffness
600 N/mm
Tangential behaviour
penalty
Friction coefficient
0.29
Elastic slip
0.005 mm
Interference Ø
0.1 mm
Contact control
0.20%
Line search control iterations
5
Sources: [15,41,45].
Disclaimer/Publisher’s Note: The statements, opinions and data contained in all publications are solely those of the individual author(s) and contributor(s) and not of MDPI and/or the editor(s). MDPI and/or the editor(s) disclaim responsibility for any injury to people or property resulting from any ideas, methods, instructions or products referred to in the content.

