1. Introduction
The microvascular network of the oral mucosa is a vital component of oral and systemic health, playing a key role in nutrient delivery, immune response, and tissue repair. Capillaries are particularly sensitive to pathological changes, and alterations in their morphology—such as variations in caliber, length, and density—are often early indicators of both localized and systemic diseases. For instance, conditions such as diabetes, hypertension, and smoking-related disorders have been linked to significant changes in capillary structure, making the assessment of microvascular health a critical aspect of clinical diagnosis and monitoring [
1,
2,
3,
4,
5,
6]. In this context, the ability to accurately and efficiently measure capillary parameters is essential for advancing our understanding of microvascular pathologies and improving patient outcomes.
In recent years, automated capillary analysis has gained significant traction in medical research, particularly in the assessment of nailfold capillaroscopy, where both commercial software solutions (e.g., Capillary.io) [
7] and research grade software [
8,
9] are widely used for quantifying microvascular parameters in systemic sclerosis and other connective tissue diseases [
10,
11,
12,
13]. These tools have demonstrated high reproducibility and efficiency in clinical settings, reducing the dependency on manual measurements. However, similar advancements in oral mucosa capillaroscopy remain scarce. The oral mucosa presents unique challenges, such as higher mobility, variable tissue transparency, and complex capillary architectures, which complicate the development of automated analysis tools. To date, no commercial software exists for oral mucosa capillaroscopy, leaving manual methods as the primary approach for microvascular assessment in this region. This gap underscores the pioneering role of our neural network-based software, which represents the first automated solution specifically designed for oral mucosa capillaroscopy.
Given these limitations, traditionally the evaluation of capillary morphology in oral mucosa has relied on manual methods, which involve direct measurement and analysis by trained observers. While these approaches have provided valuable insights [
14], they are inherently limited by their time-consuming nature, susceptibility to human error, and inter-observer variability. These limitations become particularly pronounced in large-scale studies or clinical settings, where the need for rapid and reproducible measurements is paramount.
In recent years, a software capable of automatically measuring the parameters of each individual frame of videocapillaroscopy has been developed at the University of Palermo, in collaboration with the Odontostomatological Clinic of the Paolo Giaccone University Hospital [
15]. This software utilizes a neural network specifically trained for this purpose [
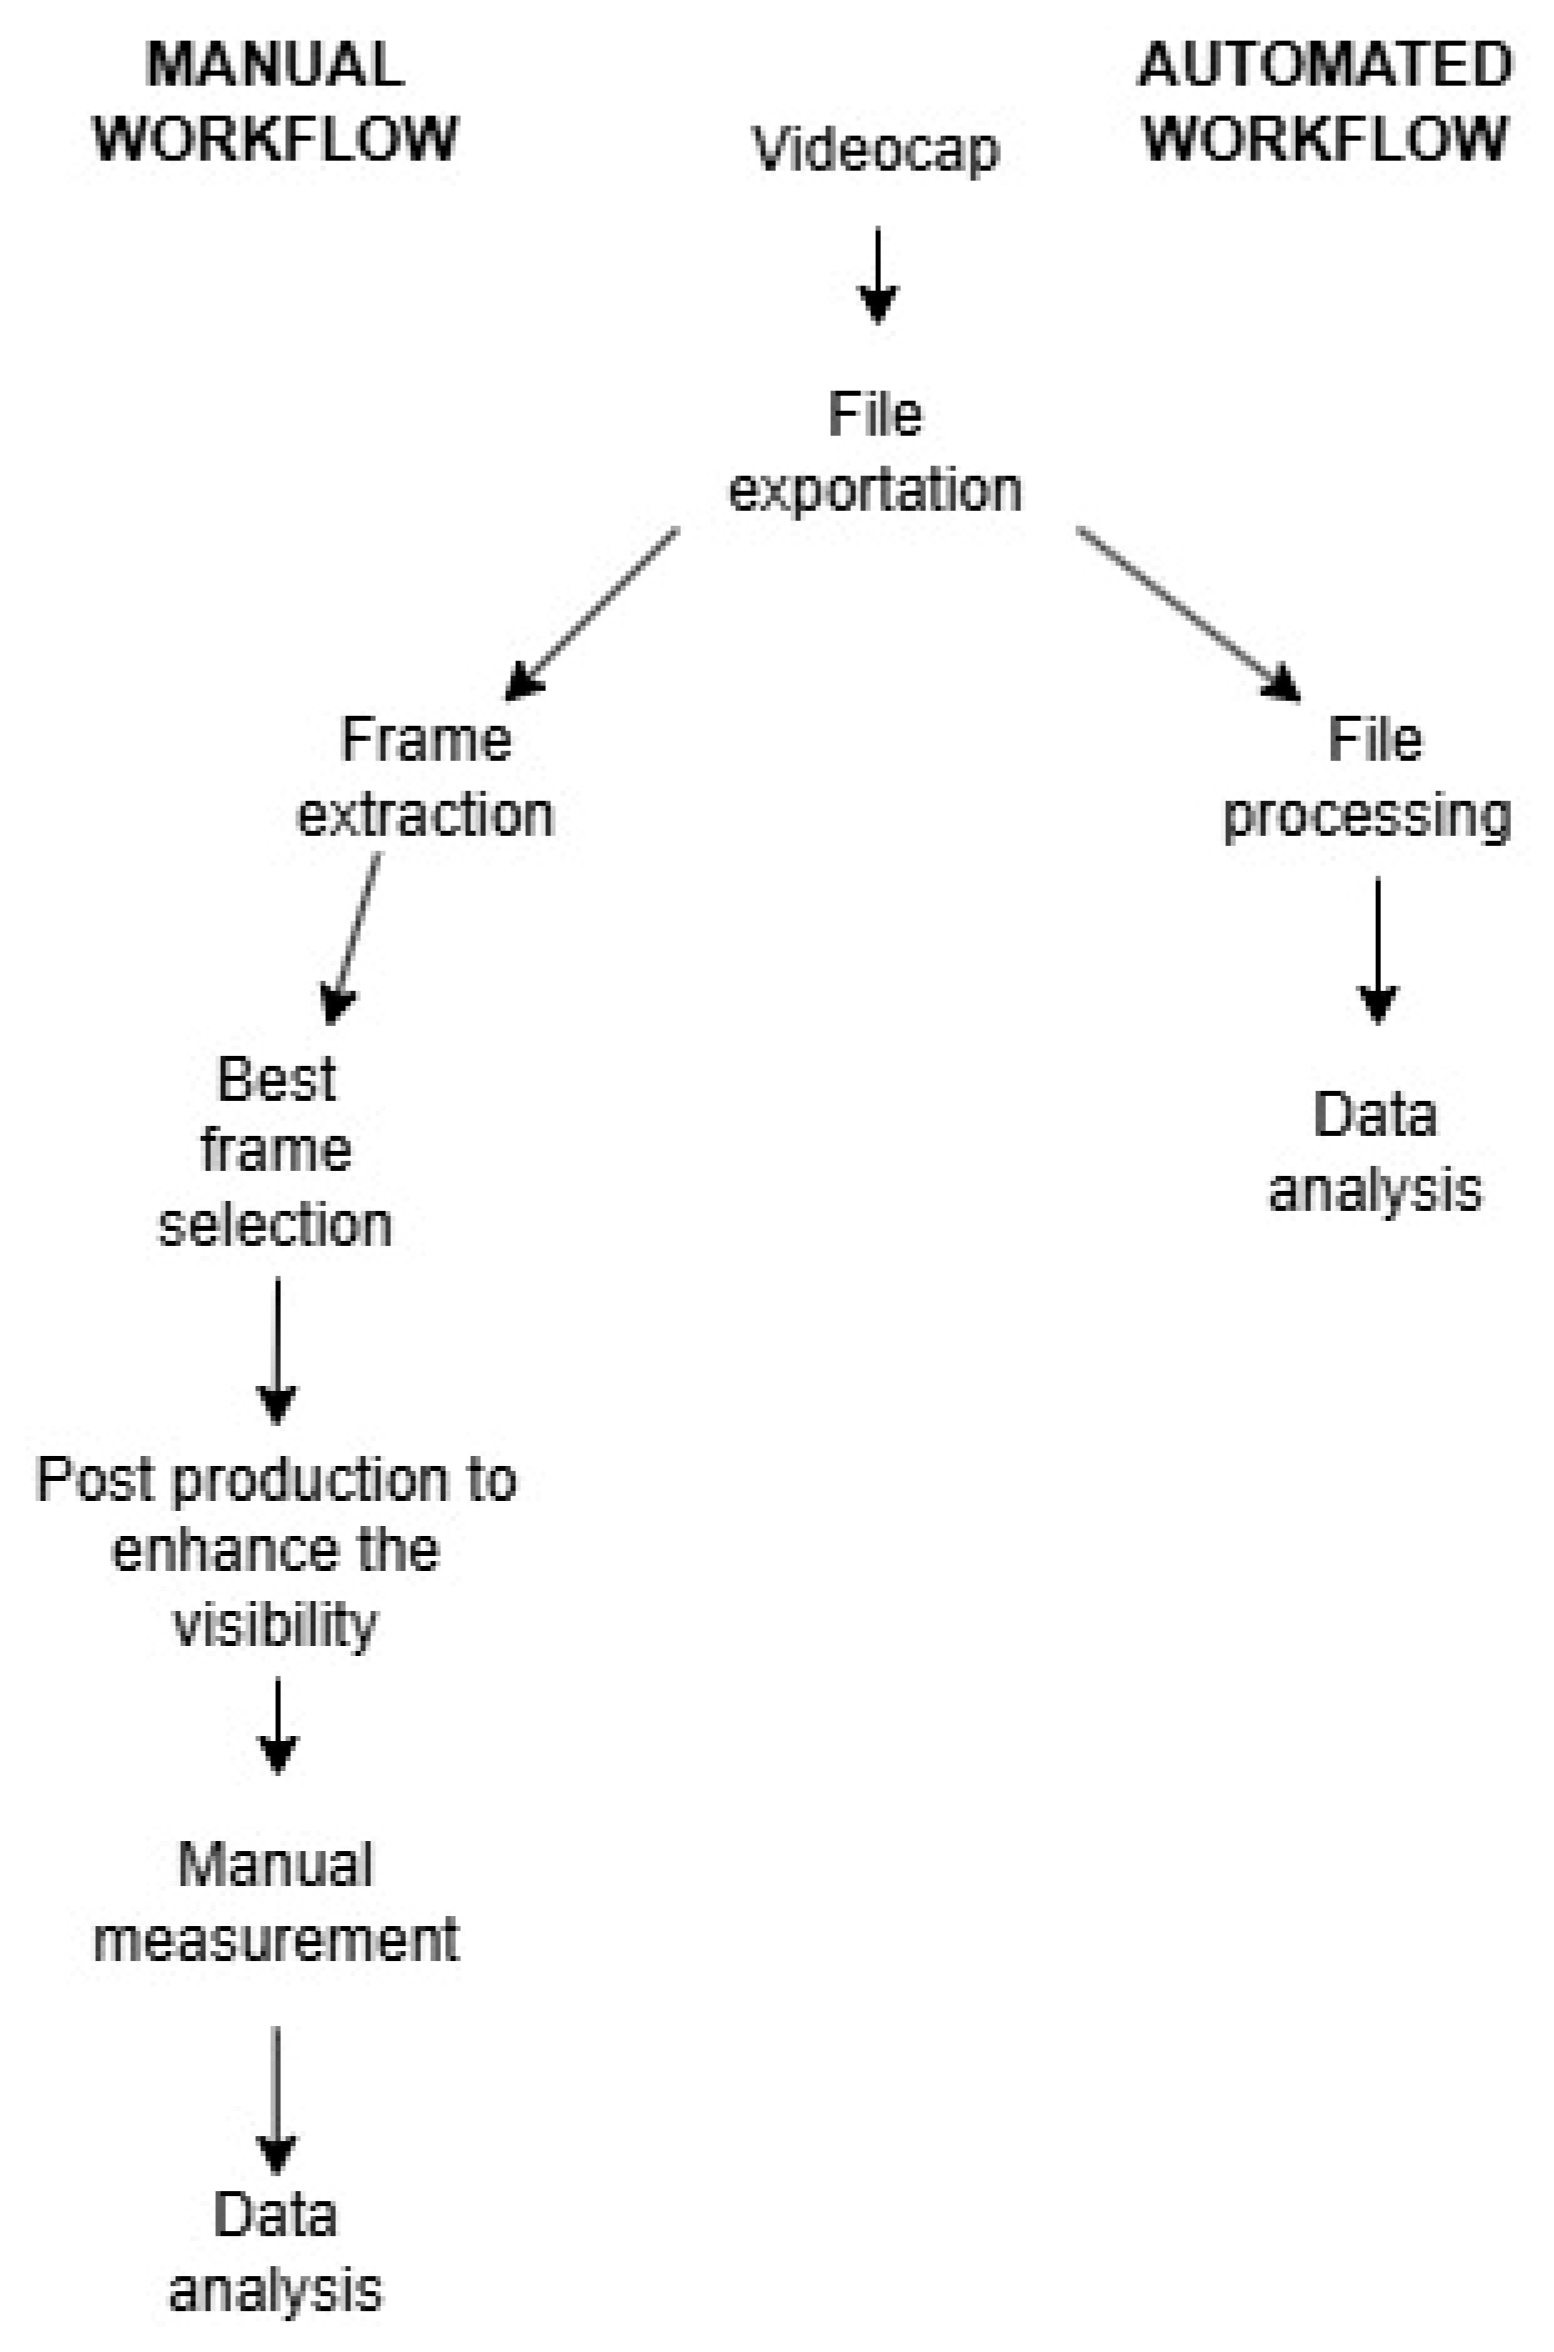
16]. At the end of the brief processing operation, both the average values for all frames in the video and the values for each individual frame are provided. This approach undoubtedly ensures an extraordinarily high level of data homogeneity compared to the manual method, where the best available frame was selected and measurements were performed only on that single frame. A static image often fails to capture all the information present even in just 1 s of video, where greater variability can be observed. The lack of operator dependence and the repeatability, synonymous with objectivity, significantly elevate the quality standard of this methodology, both in clinical practice and research (
Figure 1).
This study compares the two methods, the manual and the automatic one. Using videocapillaroscopy, we conducted a detailed analysis of capillary parameters across four distinct anatomical sites in ten healthy subjects: the right buccal mucosa, left buccal mucosa, lower labial mucosa, and upper labial mucosa. The primary objective was to evaluate the agreement between the automated and manual methods, with a particular focus on identifying any systematic biases or discrepancies. By doing so, this study aims to provide valuable insights into the reliability and accuracy of automated tools for microvascular assessment, while also contributing to the broader effort to integrate advanced computational techniques into clinical and research practice.
In addition to its methodological contributions, this study has important implications for the field of microvascular research. The oral mucosa, with its accessibility and rich microvascular network, serves as an ideal model for studying systemic microvascular changes. By improving our ability to measure and analyze capillary morphology (
Figure 2), this research has the potential to enhance our understanding of a wide range of diseases, from periodontal disorders to systemic conditions such as diabetes, autoimmune conditions, and cardiovascular disease. Furthermore, the development of reliable automated methods could pave the way for more widespread use of microvascular assessment in clinical settings, enabling earlier detection and more effective management of microvascular pathologies.
In summary, this pilot study seeks to bridge the gap between traditional manual methods and emerging automated approaches for assessing capillary morphology. By providing a detailed comparison of these methods, we aim to shed light on the potential of automated tools to improve the efficiency, accuracy, and reproducibility of microvascular analysis. At the same time, this research underscores the importance of continued innovation and validation in the development of computational tools for medical imaging and diagnostics.
2. Materials and Methods
2.1. Study Design and Data Source
This pilot study utilized pre-existing videocapillaroscopy data from healthy subjects, which had been collected as part of previous research conducted at the Clinical Odontostomatology Department of the University of Palermo. The data included high-resolution videocapillaroscopy recordings of the oral mucosa from 10 healthy participants, with measurements taken at four distinct anatomical sites: the right buccal mucosa, left buccal mucosa, lower labial mucosa, and upper labial mucosa. The original studies were approved by the Ethics Committee of the University of Palermo (Protocol No. 01/2021), and all participants had provided written informed consent for the use of their data in future research. The use of these pre-existing data allowed for a robust comparison between the automated and manual methods without the need for additional recruitment or invasive procedures.
2.2. Videocapillaroscopy Data
The videocapillaroscopy recordings were obtained using the Horus HS100, Adamo SRL Italy, device, which features a 150× zoom lens, 640 × 480 pixels resolution, and a frame rate of 120 FPS. Each recording focused on a specific oral site and lasted approximately 20 s, providing detailed visualization of the microvascular network. The videos were exported in AVI format and stored for subsequent analysis. The data had been previously annotated and analyzed manually as part of the original studies, ensuring a reliable baseline for comparison with the automated method.
2.3. Automated Method
The automated method for capillary analysis was based on a neural network trained at the University of Palermo. The neural network was designed to identify and measure capillary structures in the videocapillaroscopy images, with a focus on three key parameters: capillary caliber, length, and density. The software used for the automated analysis was developed using a deep learning framework and was trained on a dataset of manually annotated capillary images to ensure accuracy. The neural network was optimized to handle variations in image quality and capillary morphology, making it suitable for use in clinical and research settings.
Starting with the videos acquired by the medical specialists involved in this work, our dataset was generated from 10 frames drawn randomly from each video and at least one second apart to ensure adequate differences. The processing pipeline was created by the co-authored group of computer scientists and is based mostly on consolidated public domain techniques.
Avoiding capillaries close to the edges of each frame, the software elaborated all remaining vessels. Apart from choosing the above features useful for pathology detection and comparing automatic and manual results, we conveniently avoided further collaboration between these two groups of researchers so as not to influence the development and validation of the proposed methodology.
Labeling was performed manually using the LabelMe 5.8.1 software developed by MIT [
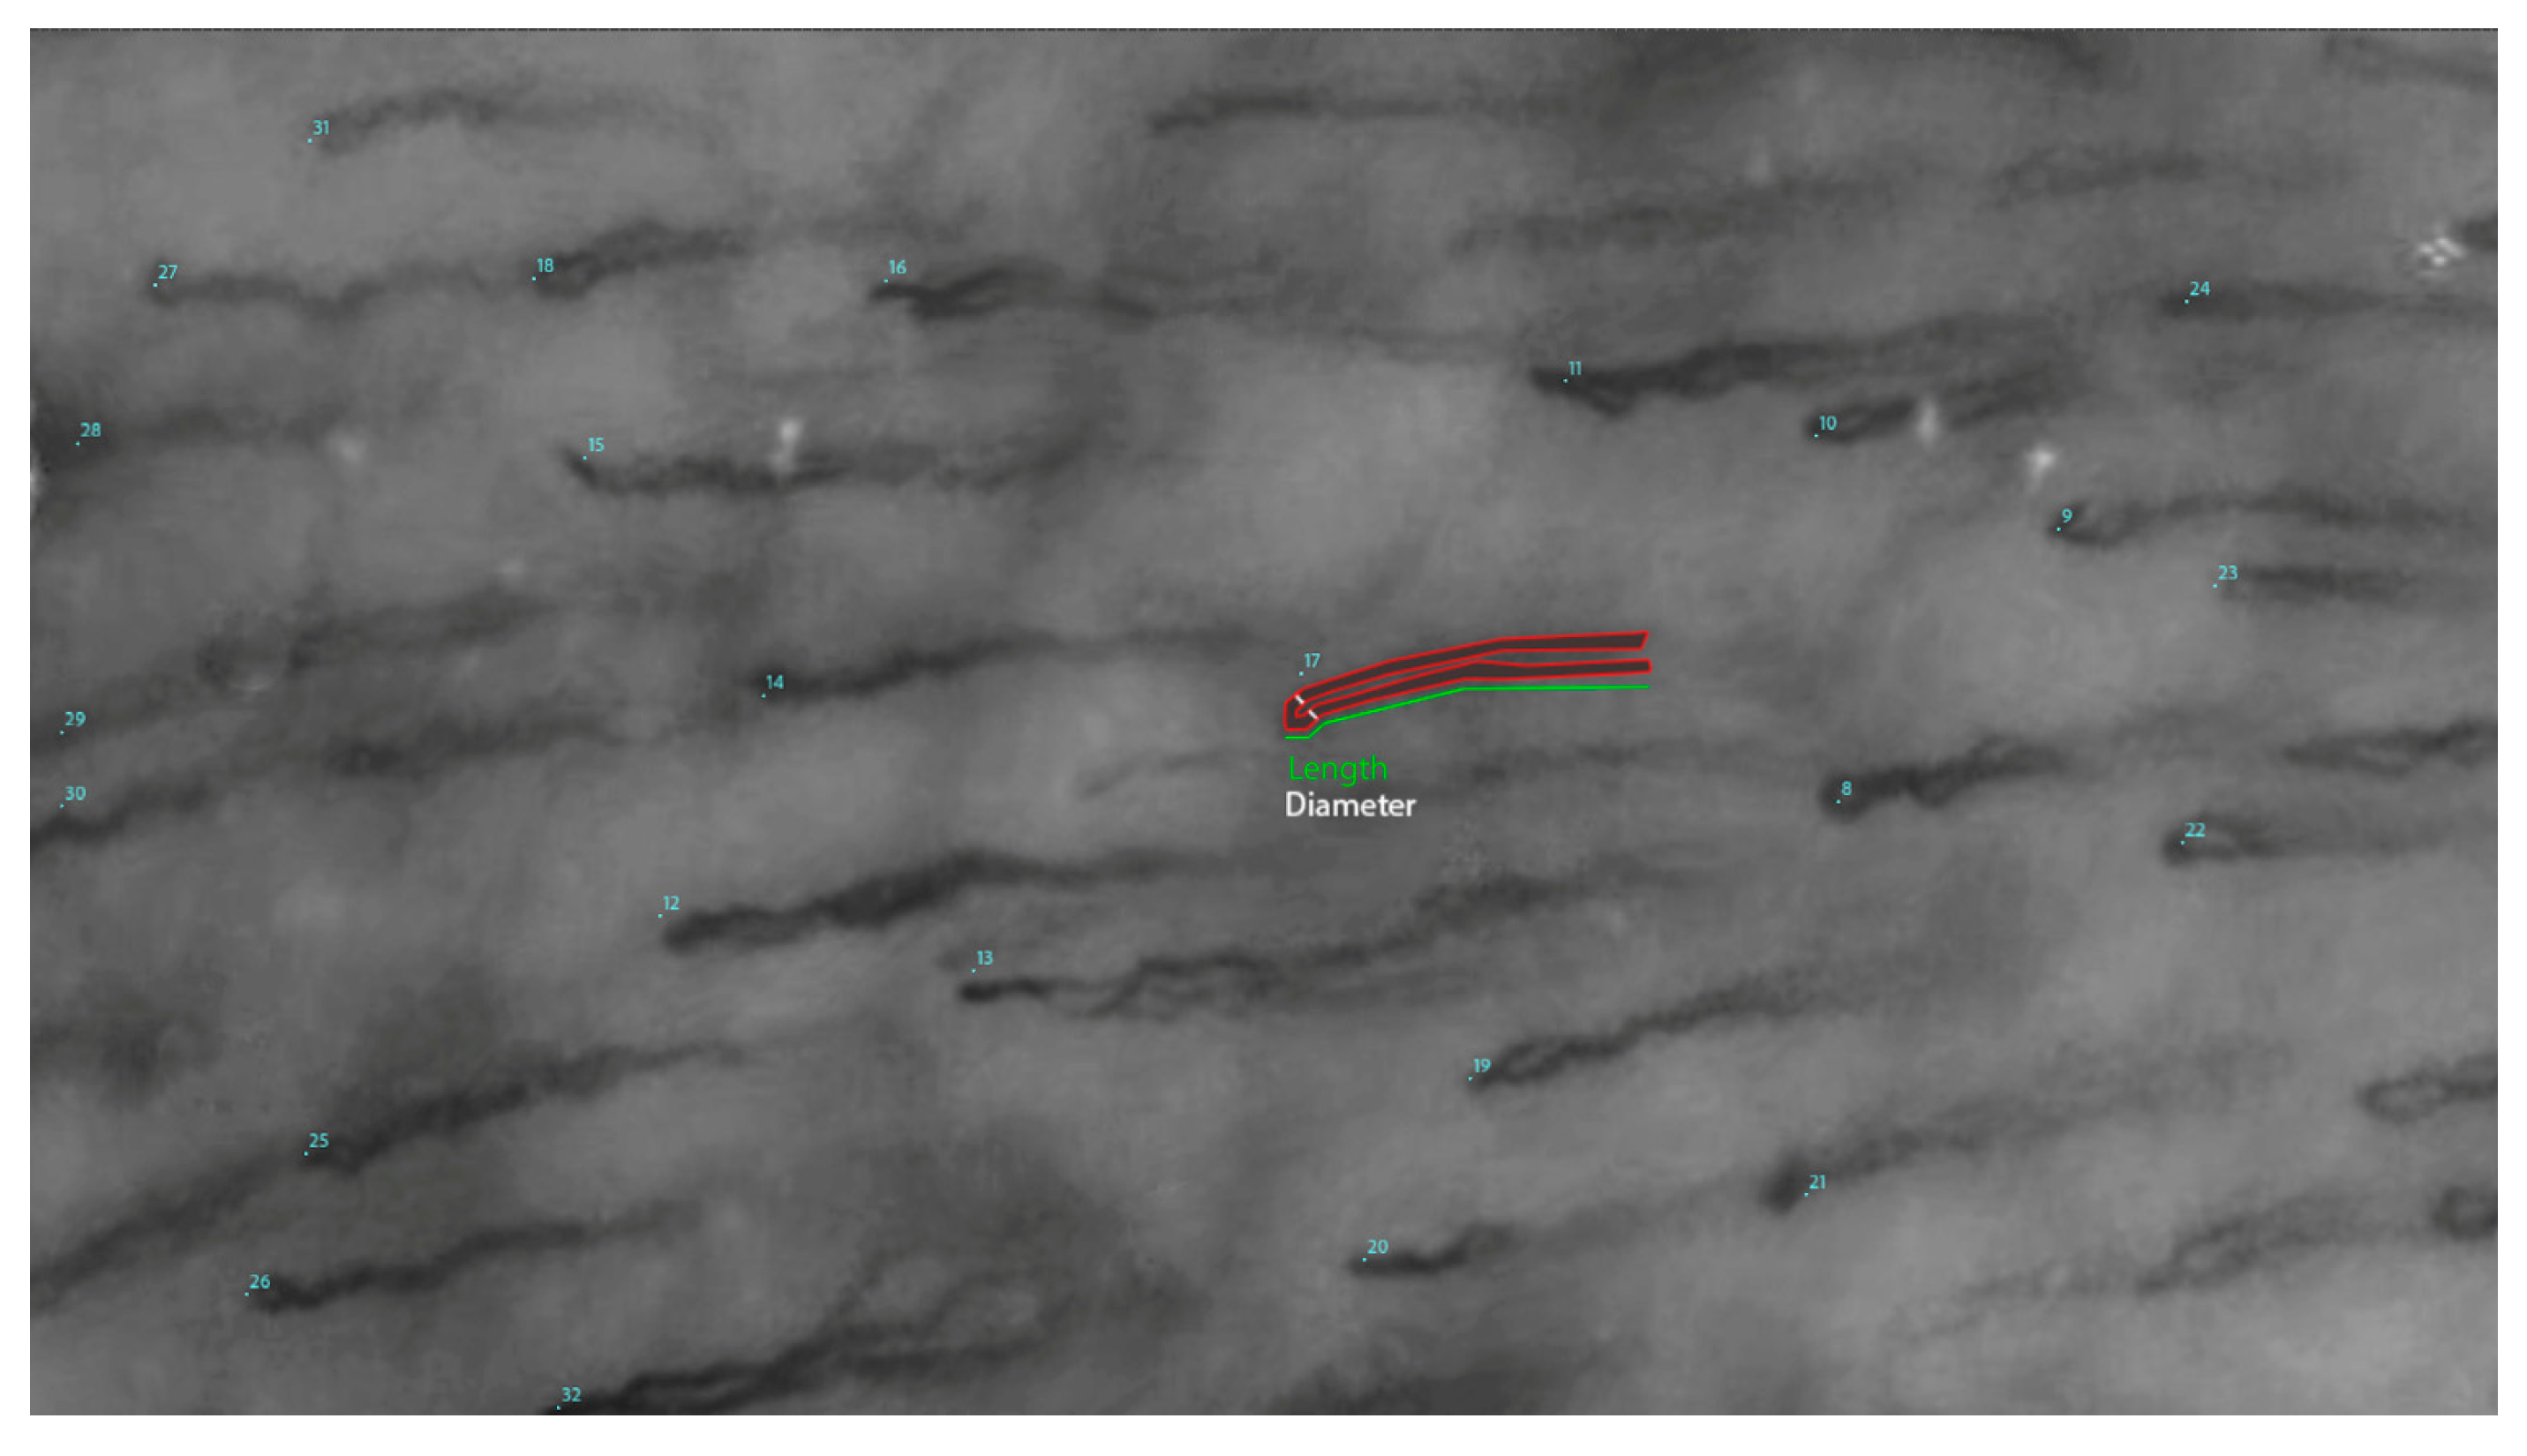
17]. In particular, each vessel was associated with a sequence of dots starting at one end of the vessel and ending at the other. These dots were located to follow the perceived path of blood within the vessel itself and then joined together by interpolation. Subsequent segmentation, formatted in the Common Objects in COntext developed by Microsoft (Redmond, WA, USA) [
18], was achieved through the deep learning framework Detectron2 developed by Meta AI Research (
Figure 3) [
19]. The choice of Detectron2 is due to its high scalability across a wide range of CPUs and GPUs. This approach makes use of a backbone network to extract image features and a region proposal network module to generate a set of regions of interest within each frame. The components inside the regions of interest are then classified through a SoftMax function in PyTorch 2.7.0 developed by the Linux Foundation [
20]. Mathematical morphology by means of OpenCV 4.11.0 [
21] is used on just identified single capillaries to smooth their contours, removing any small protuberances. The ellipse that best approximates the appearance of each capillary is useful for calculating the elongation and direction. Finally, the maximum value of the transformed distance orthogonal to the direction of the capillary provides the caliber measurement.
Considering that the dataset is well balanced in its classes and the great diversity in the available videos that show various real pathologies, we did not find it necessary to implement data augmentation. The dataset was divided into 70% for training and the remaining 30% for validation.
2.4. Manual Method
For the manual method, capillary parameters were measured by trained observers using ImageJ software (v1.54, NIH) [
22]. The observers were blinded to the automated measurements to avoid bias. The manual analysis involved identifying capillary loops in the videocapillaroscopy images and measuring their caliber, length, and density using the software’s built-in tools. Each measurement was performed twice by the same observer to ensure intra-observer reliability, and the average value was used for analysis. For a single site, the entire process typically takes an experienced operator approximately 10–15 min.
2.5. Differences with Commercial Nailfold Analysis Tools
Unlike commercial nailfold capillaroscopy systems that rely on static image analysis, our neural network-based software performs frame-by-frame processing of entire videocapillaroscopy sequences. This comprehensive approach enables the following:
Systematic evaluation of all captured frames rather than selected snapshots.
Dynamic tracking of capillary behavior across the temporal dimension.
Robust averaging of measurements to account for natural vascular variability.
Specifically designed for oral mucosa assessment, the algorithm demonstrates particular effectiveness in managing the buccal and labial regions’ unique challenges—including tissue mobility, variable transparency, and complex capillary architectures. By processing complete video recordings at 120 FPS, our solution captures transient morphological features that would be missed by conventional single-frame analysis, while simultaneously reducing selection bias inherent in manual methods. This represents the first implementation of full-video computational analysis in oral mucosa capillaroscopy, addressing both clinical needs and research requirements for comprehensive microvascular assessment.
2.6. Parameters Analyzed
The following parameters were assessed for each capillary:
Capillary caliber: The diameter of the capillary loop, measured in micrometers (µm).
Capillary length: The length of the capillary loop, measured in micrometers (µm).
Capillary density: The number of capillaries per square millimeter (capillaries/mm2).
2.7. Statistical Analysis
Statistical analysis was performed using XLSTAT software (2024.4.0.1424, Lumivero, Denver, CO, USA) [
23]. The agreement between the automated and manual methods was evaluated using Bland–Altman analysis, which provides a graphical representation of the differences between the two methods and calculates the bias (mean difference) and limits of agreement (mean difference ± 1.96 × standard deviation of the differences). Additionally, a paired
t-test was used to compare the mean values of capillary caliber, length, and density between the two methods. Normality of the data was assessed using the Shapiro–Wilk test, and a
p-value < 0.05 was considered statistically significant.
2.8. Ethical Considerations
The use of pre-existing videocapillaroscopy data was conducted in accordance with the Declaration of Helsinki and the original ethical approval granted by the Ethics Committee of the University of Palermo (Protocol No. 01/2021). All participants had provided written informed consent for the use of their data in future research.
3. Results
3.1. Caliber
The comparison between the automated and manual methods for measuring capillary caliber revealed significant differences across all examined sites.
In the right buccal mucosa, the automated method yielded a mean value of 19.996 ± 1.30 µm, compared to 17.645 ± 3.05 µm for the manual method, with a mean difference of 2.352 µm (p = 0.038).
In the left buccal mucosa, the automated method recorded a mean of 19.534 ± 1.08 µm, while the manual method reported 16.682 ± 2.09 µm, with a mean difference of 2.852 µm (p = 0.001).
In the lower labial mucosa, the automated method showed a mean of 18.533 ± 1.81 µm, compared to 16.169 ± 2.61 µm for the manual method, with a mean difference of 2.364 µm (p = 0.031).
In the upper labial mucosa, the automated method displayed a mean of 18.647 ± 0.900 µm, versus 16.082 ± 2.59 µm for the manual method, with a mean difference of 2.565 µm (p = 0.008).
Across all sites, the automated method tended to overestimate capillary caliber compared to the manual method, with mean differences ranging between 2.352 µm and 2.852 µm. This discrepancy may be attributed to the software’s greater sensitivity in detecting capillary structures or to a potential systematic overestimation. Despite these differences, both methods demonstrated a normal distribution of the data, as confirmed by the Shapiro–Wilk test (p > 0.05). The results suggest that, although the automated method is faster and potentially less prone to human error, it may require further calibration to enhance measurement reliability, particularly in clinical contexts where precision is critical.
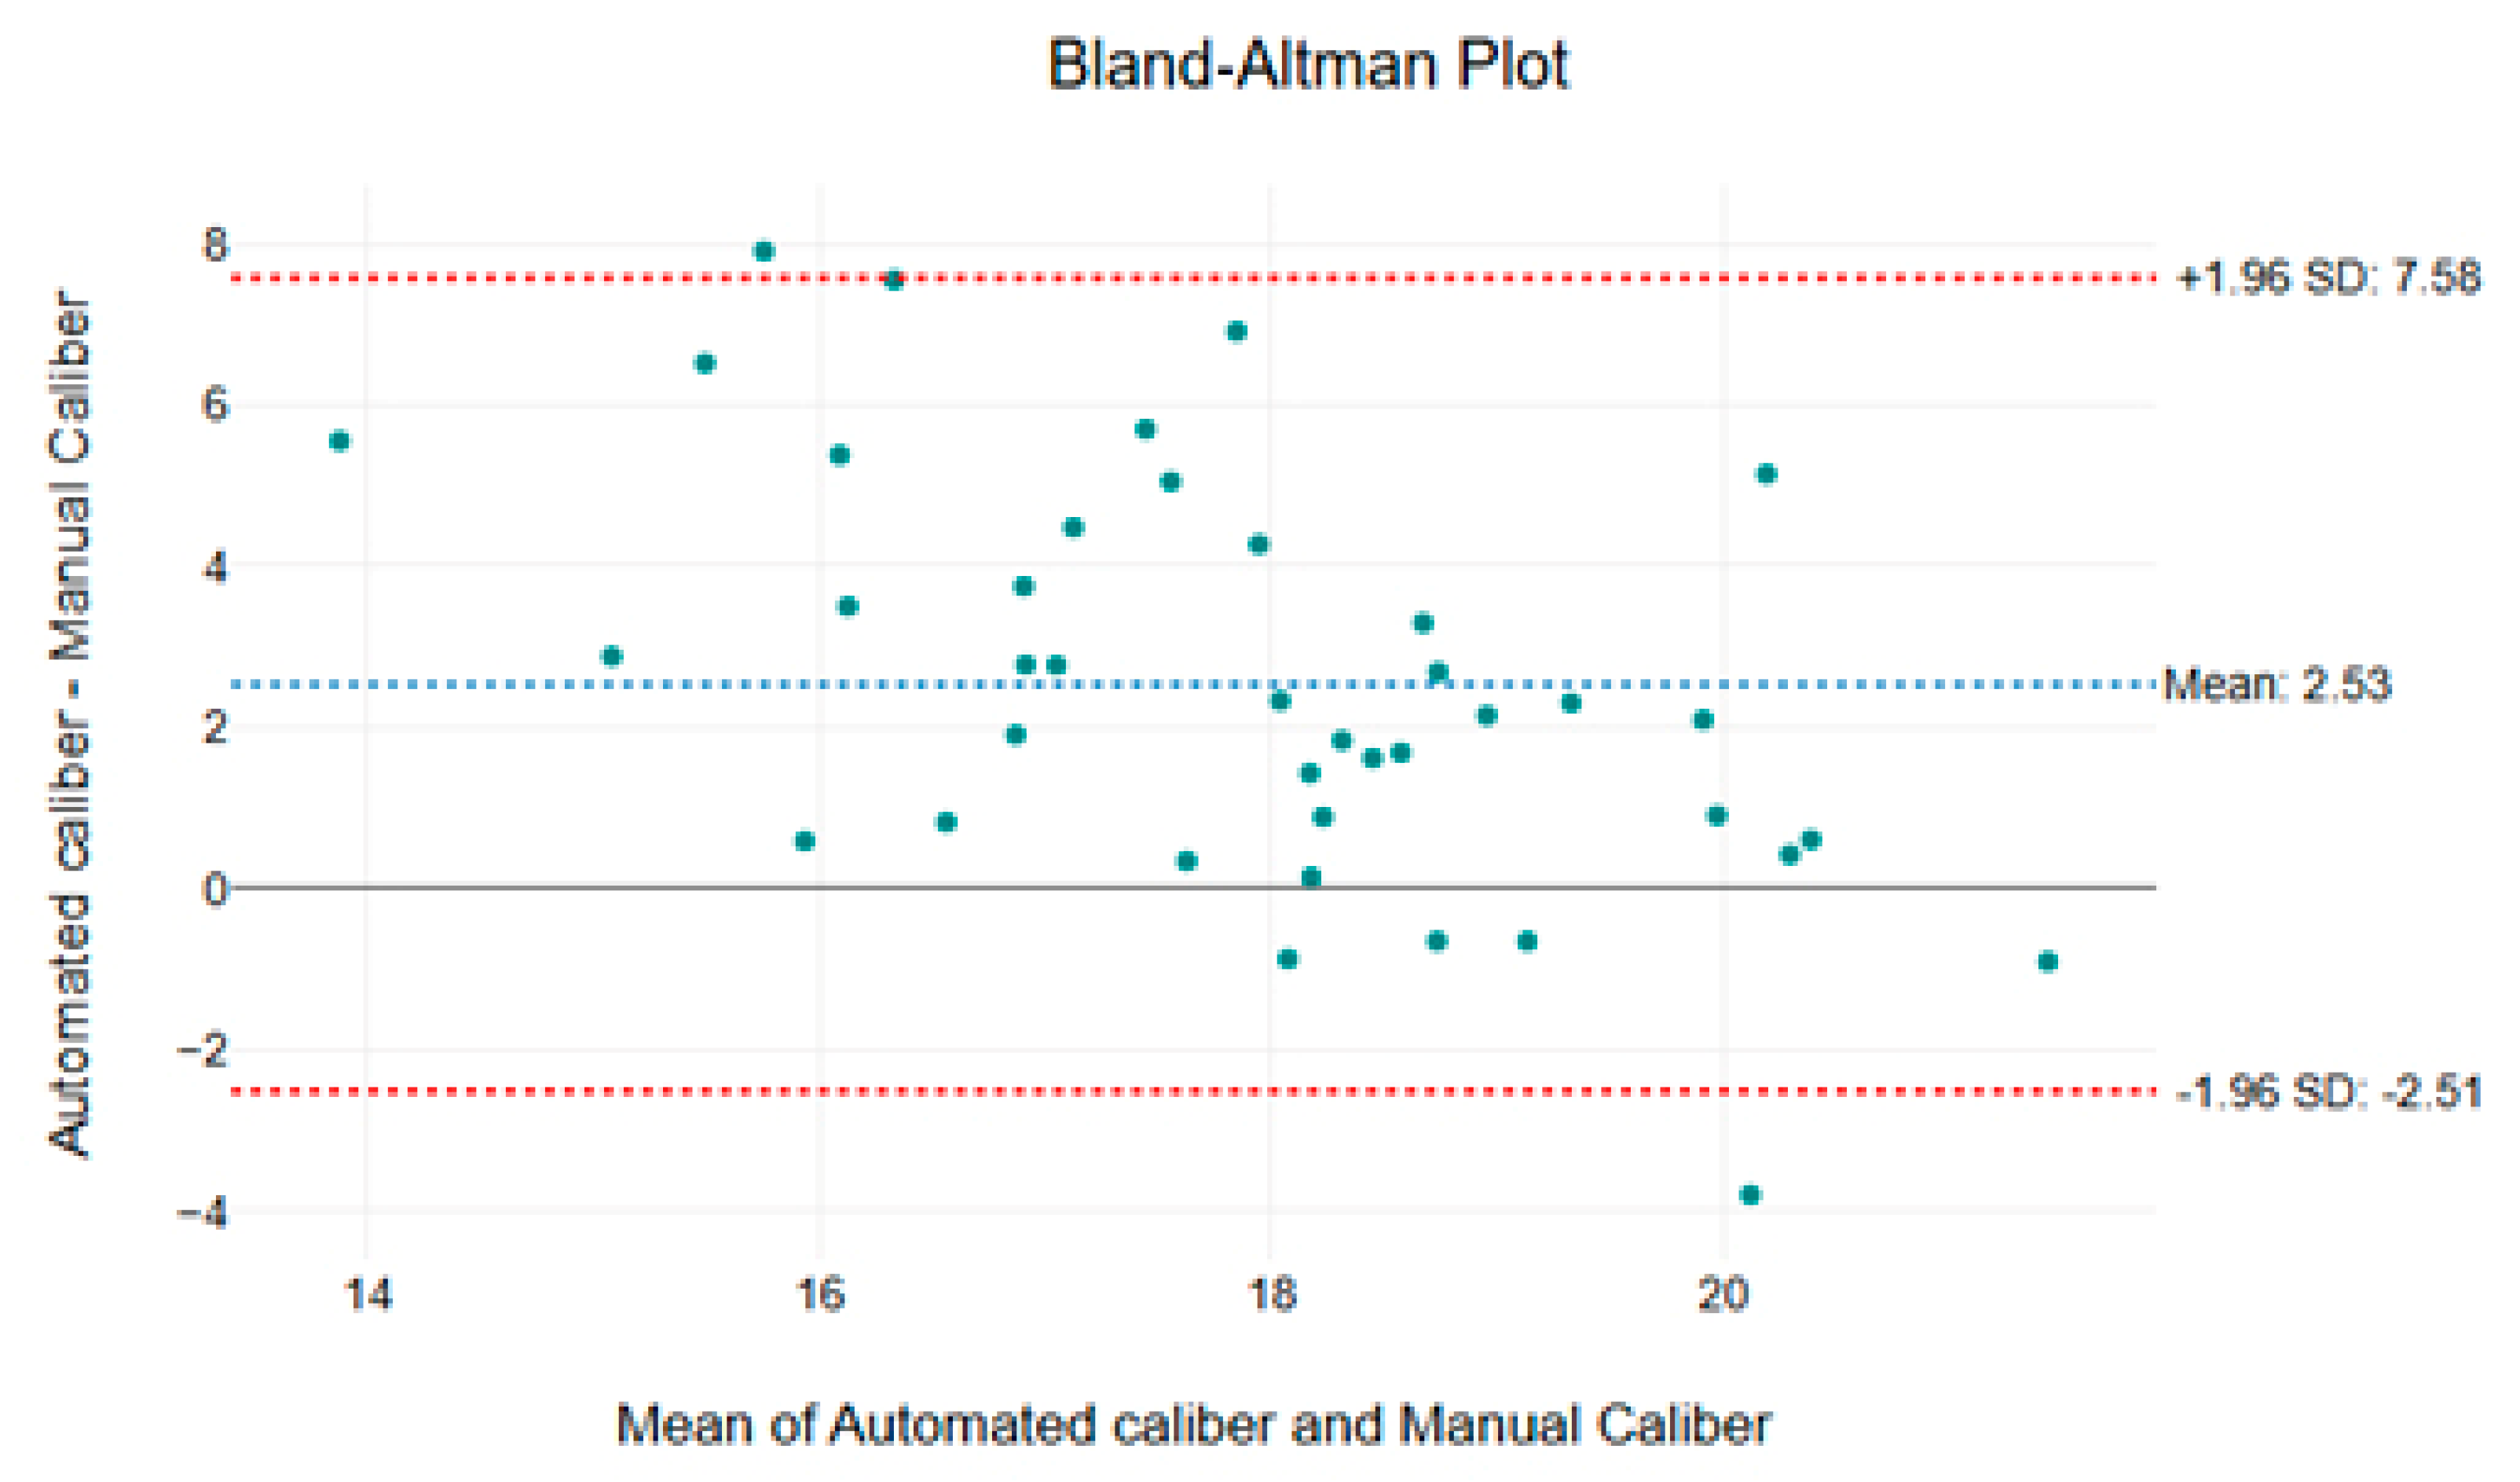
The Bland–Altman plot (
Figure 4) reveals that the mean difference between the two methods is 2.53 µm, confirming the tendency of the automated approach to overestimate capillary caliber compared to the manual measurement. Furthermore, the limits of agreement (±1.96 SD) range from −2.51 µm to 7.58 µm, indicating variability between the two approaches. Although most data points fall within these limits, some measurements exhibit larger discrepancies, suggesting that the automated method may have a systematic bias or greater sensitivity in detecting capillary structures.
3.2. Density
The comparison between the automated and manual methods for measuring capillary density revealed no statistically significant differences in most of the examined sites, although some variability was observed.
In the right buccal mucosa, the automated method yielded a mean density of 21.605 ± 6.01 capillaries/mm2, compared to 18.631 ± 4.02 capillaries/mm2 for the manual method, with a mean difference of 2.974 capillaries/mm2 (p = 0.210).
In the left buccal mucosa, the automated method recorded a mean density of 20.132 ± 8.95 capillaries/mm2, while the manual method reported 18.906 ± 2.80 capillaries/mm2, with a mean difference of 1.226 capillaries/mm2 (p = 0.684).
In the lower labial mucosa, the automated method showed a mean density of 26.063 ± 9.37 capillaries/mm2, compared to 21.881 ± 5.80 capillaries/mm2 for the manual method, with a mean difference of 4.182 capillaries/mm2 (p = 0.246).
In the upper labial mucosa, the automated method displayed a mean density of 25.973 ± 6.30 capillaries/mm2, versus 20.645 ± 5.44 capillaries/mm2 for the manual method, with a mean difference of 5.328 capillaries/mm2 (p = 0.058).
Across all sites, the automated method tended to report higher capillary density values compared to the manual method, with mean differences ranging between 1.226 capillaries/mm2 and 5.328 capillaries/mm2. However, these differences were not statistically significant (p > 0.05), except for the upper labial mucosa, where the p-value approached significance (p = 0.058). The data for both methods followed a normal distribution in all sites, as confirmed by the Shapiro–Wilk test (p > 0.05), except for the manual measurements in the upper labial mucosa, which showed a non-normal distribution (p = 0.004).
These results suggest that, while the automated method tends to produce slightly higher density values, the differences are not statistically significant in most cases. This indicates that the automated method may be a reliable alternative to the manual method for assessing capillary density, although further calibration and validation may be necessary to ensure consistency, particularly in sites where the manual method shows non-normal distribution or where the differences approach statistical significance.
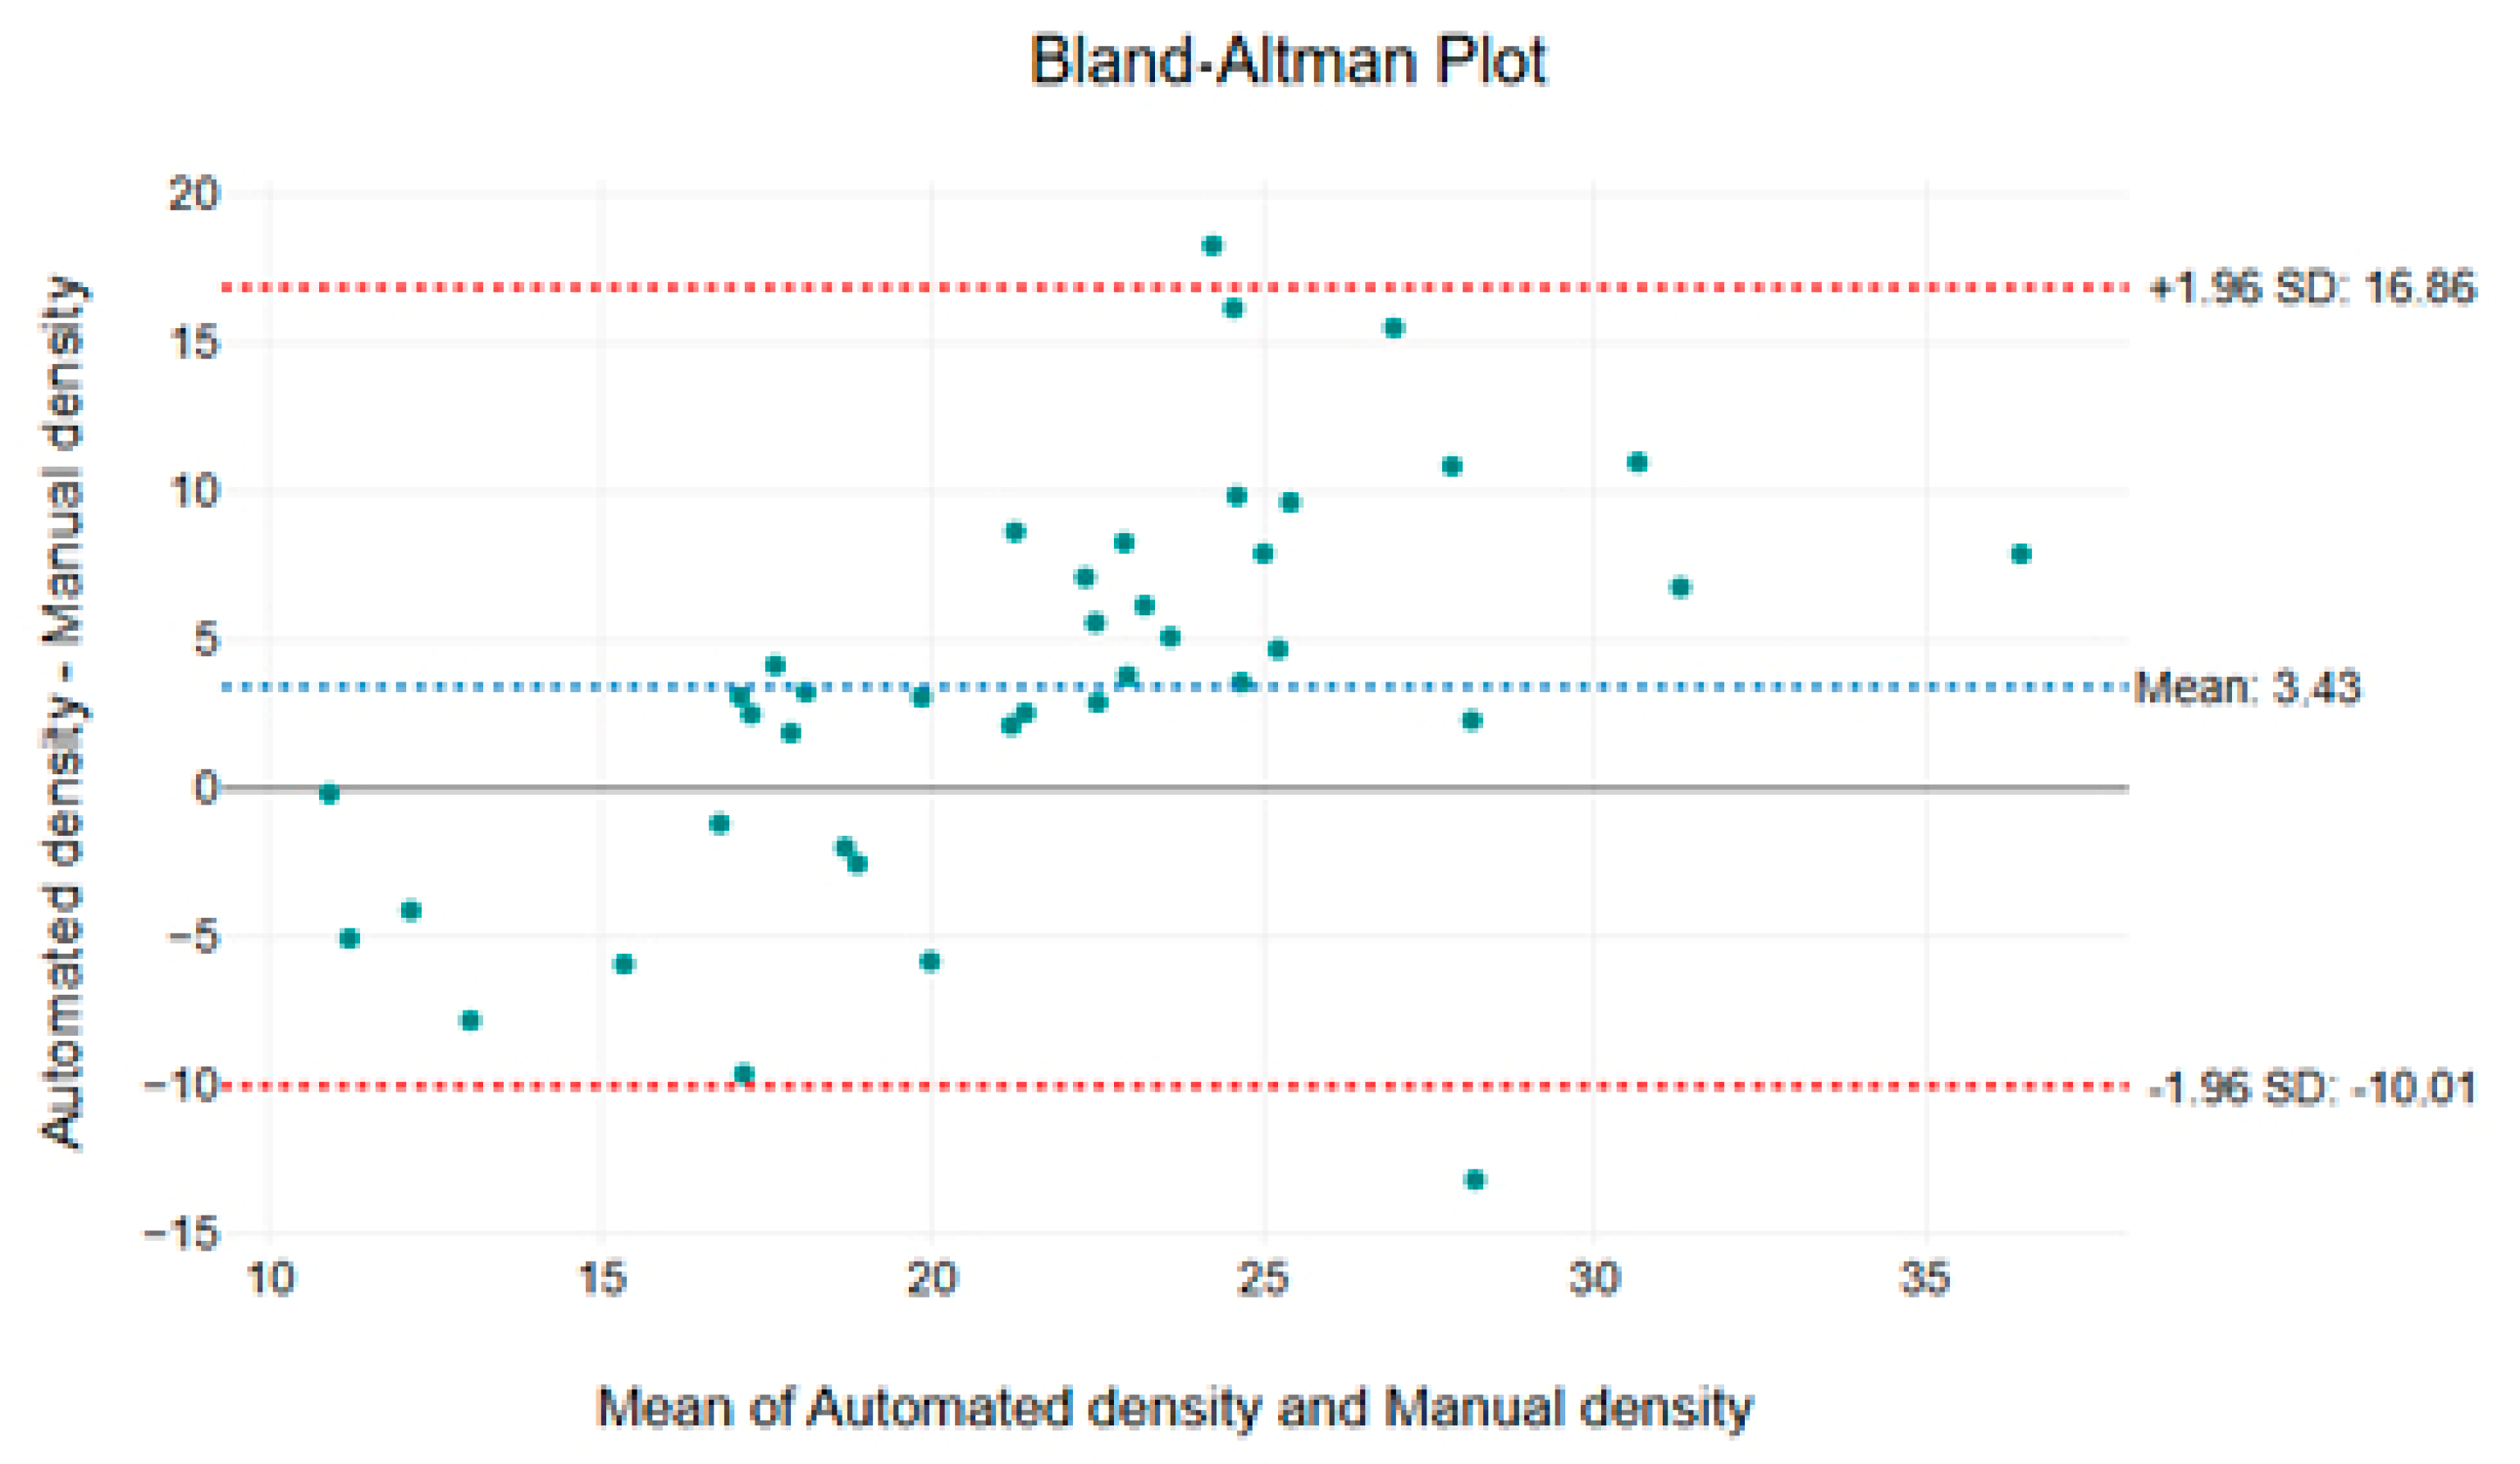
The mean difference between the two methods is 3.43 capillaries/mm
2, indicating a slight tendency of the automated method to report higher density values. However, the limits of agreement (±1.96 SD), ranging from −10.01 to 16.86 capillaries/mm
2, demonstrate that the variability remains within an acceptable range for most measurements (
Figure 5). Importantly, the majority of data points fall within these limits, with only a few outliers, suggesting that the automated method provides a consistent and reliable alternative to manual assessment.
3.3. Length
The comparison between the automated and manual methods for measuring capillary length revealed significant differences across all examined sites.
In the right buccal mucosa, the automated method yielded a mean length of 344.186 ± 93.62 µm, compared to 241.200 ± 51.30 µm for the manual method, with a mean difference of 102.986 µm (p = 0.007).
In the left buccal mucosa, the automated method recorded a mean length of 330.220 ± 64.24 µm, while the manual method reported 239.900 ± 36.40 µm, with a mean difference of 90.320 µm (p = 0.001).
In the lower labial mucosa, the automated method showed a mean length of 310.951 ± 63.78 µm, compared to 185.300 ± 32.78 µm for the manual method, with a mean difference of 125.651 µm (p < 0.0001).
In the upper labial mucosa, the automated method displayed a mean length of 312.346 ± 71.26 µm, versus 186.700 ± 42.61 µm for the manual method, with a mean difference of 125.646 µm (p = 0.000).
Across all sites, the automated method consistently reported longer capillary lengths compared to the manual method, with mean differences ranging between 90.320 µm and 125.651 µm. These differences were statistically significant (p < 0.05) in all cases, indicating a systematic overestimation by the automated method. The data for both methods followed a normal distribution in all sites, as confirmed by the Shapiro–Wilk test (p > 0.05), supporting the use of parametric statistical tests.
These results suggest that the automated method tends to overestimate capillary length compared to the manual method. This discrepancy could be attributed to differences in how the software identifies and measures capillary structures, potentially including more complex or tortuous segments that the manual method might exclude. Further calibration of the automated method may be necessary to align its measurements more closely with those obtained manually, particularly in clinical settings where precision is critical.
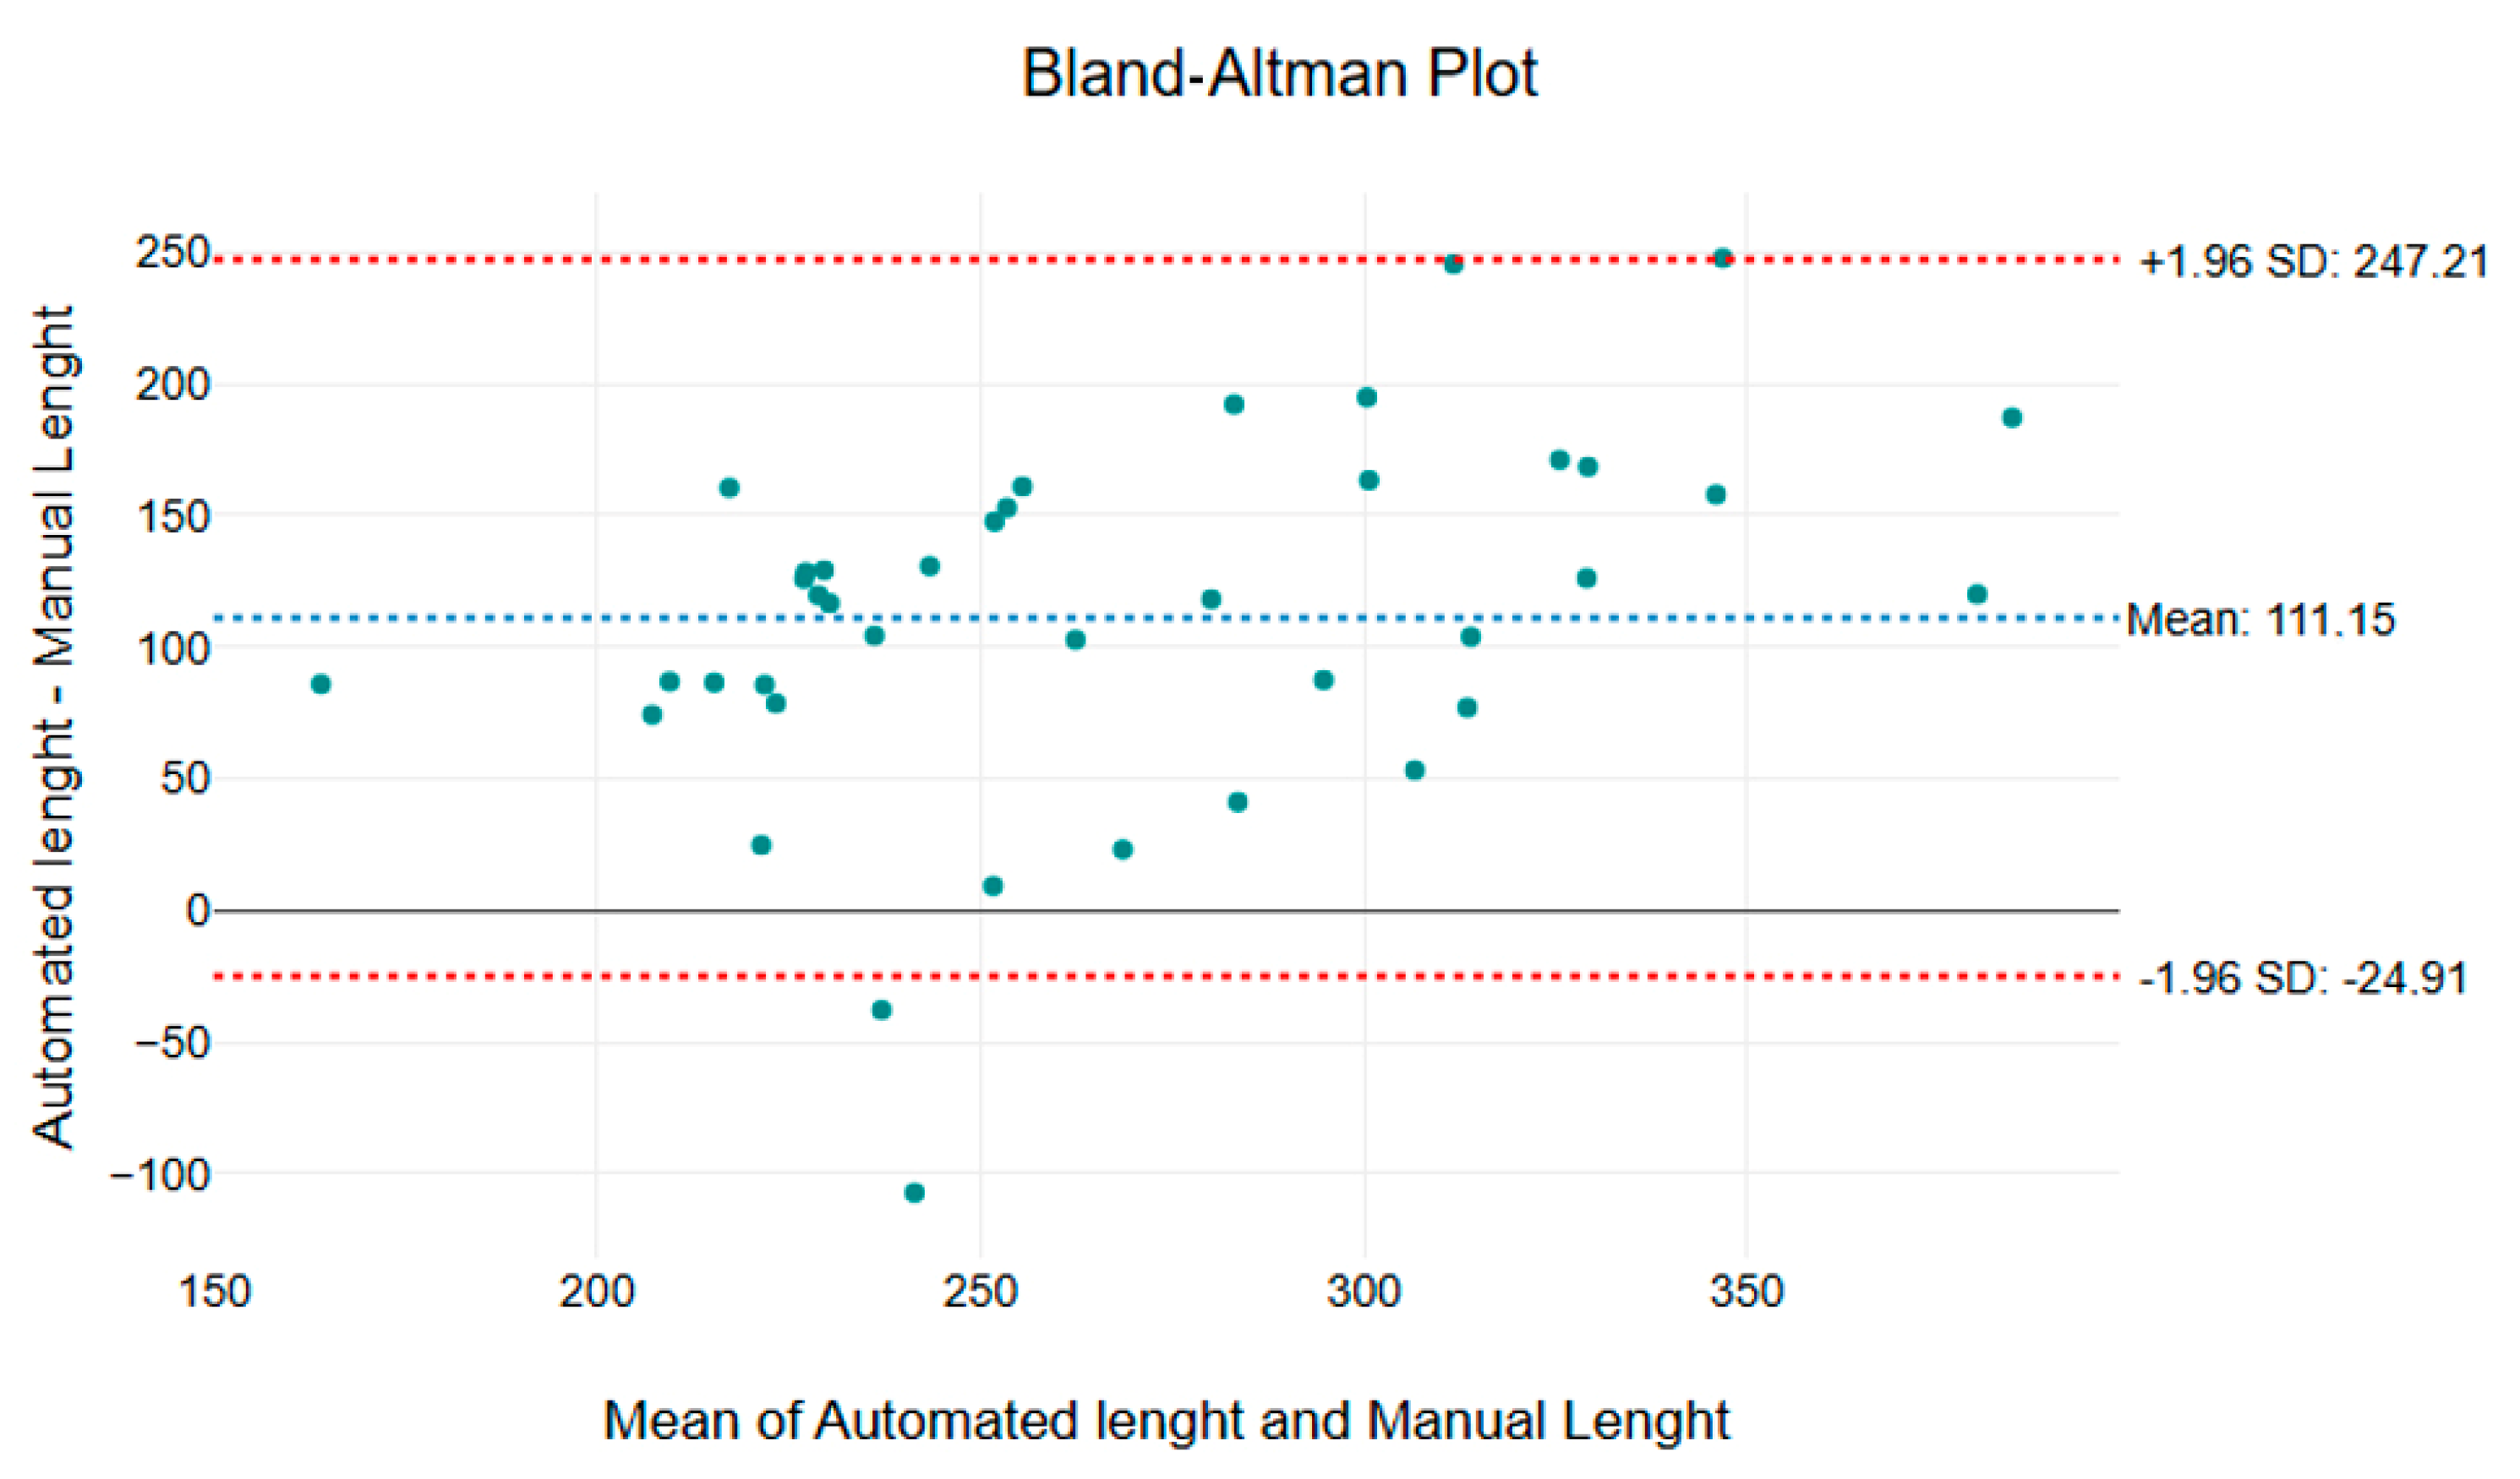
The mean difference between the methods is 111.15 µm, with limits of agreement (±1.96 SD) ranging from −24.91 µm to 247.21 µm (
Figure 6). The systematic overestimation by the automated method could be due to the intrinsic variability of capillary length, which depends on factors such as the orientation of the capillaries relative to the surface and the inclination of the videocapillaroscope. This variability can occur even when the examination is performed by an experienced operator, as capillary length measurements may fluctuate throughout a video sequence due to micro-movements and changes in focus.
Although the majority of data points fall within the limits of agreement, the automated method appears to be more sensitive to detecting elongated or tortuous capillary structures. This highlights the importance of careful calibration and interpretation, particularly when comparing automated and manual measurements in dynamic imaging conditions.
4. Discussion
This study compared the performance of an automated method, based on a neural network trained at the University of Palermo, with a traditional manual method for assessing capillary morphology and measurements in the oral mucosa. The analysis focused on three key parameters—capillary caliber, length, and density—using pre-existing videocapillaroscopy data from healthy subjects [
24]. The results revealed significant differences between the two methods, particularly in the measurement of capillary caliber and length, while showing good agreement for capillary density. These findings provide valuable insights into the strengths and limitations of automated tools for microvascular analysis and have important implications for both research and clinical practice.
4.1. Capillary Caliber and Length
The automated method consistently overestimated capillary caliber and length compared to the manual method. This systematic overestimation could be attributed to the way the neural network identifies and processes capillary structures. Unlike manual measurements, which rely on human judgment to define the boundaries of capillary loops, the automated method may include more complex or tortuous segments that the manual approach might exclude. Additionally, the neural network’s sensitivity to subtle variations in image quality or capillary morphology could contribute to the observed discrepancies. These results are consistent with previous studies conducted with the same methodology that have reported similar overestimations in automated measurements of microvascular parameters [
25], highlighting the need for further refinement of the algorithms used in such tools. To remedy the overestimation of capillary caliber and length, it is possible to take advantage of the fact that these measurements are consistently higher and therefore can be reduced accordingly. Re-training the entire network with these new measurements will make the response of the automatic methodology stable. Video analysis on a present mid-range computer (i.e., equipped with the newest i7 processor and possibly supported by a graphics card, 32 GB of RAM) should take approximately two seconds for every second of the video.
4.2. Capillary Density
In contrast to the findings for caliber and length, the automated and manual methods showed good agreement in the assessment of capillary density. This suggests that the neural network performs well in quantifying the number of capillaries per unit area, a parameter that is less sensitive to the precise definition of capillary boundaries. The agreement in capillary density measurements is particularly encouraging, as this parameter is often used as a key indicator of microvascular health in both research and clinical settings. The ability of the automated method to accurately measure capillary density could make it a valuable tool for large-scale studies or clinical applications where efficiency and reproducibility are critical.
4.3. Role of Videocapillaroscopy
Videocapillaroscopy played a central role in this study, providing high-resolution images that enabled detailed visualization and quantification of capillary structures. The use of pre-existing data from healthy subjects ensured a robust baseline for comparison between the automated and manual methods. However, the variability in image quality and capillary morphology across different sites and subjects also highlighted the challenges associated with automating microvascular analysis. Future studies could explore the use of additional preprocessing steps or advanced image enhancement techniques to improve the consistency and reliability of automated measurements.
4.4. Implications for Clinical Practice
The systematic overestimation of capillary caliber and length by the automated method underscores the importance of careful validation and calibration before such tools can be widely adopted in clinical practice. While the automated method offers significant advantages in terms of speed and efficiency, its current limitations suggest that it may be best suited for preliminary screening or research applications, where manual verification of results is feasible. In clinical settings, where precise measurements are essential for diagnosis and monitoring, further refinement of the neural network and its algorithms will be necessary to ensure accuracy and reliability.
4.5. Future Directions
This study highlights several areas for future research. First, the neural network could be retrained using a larger and more diverse dataset, including images from subjects with various microvascular pathologies, to improve its ability to handle complex capillary structures. Second, the development of standardized protocols for image acquisition and preprocessing could help reduce variability and improve the consistency of automated measurements. Finally, longitudinal studies comparing the performance of automated and manual methods over time could provide valuable insights into the long-term reliability and stability of automated tools.
4.6. Limitations
This study has several limitations. First, the use of pre-existing data from healthy subjects may limit the generalizability of the findings to populations with microvascular pathologies. Second, the sample size was relatively small, which may have affected the statistical power of the analysis. Finally, the manual measurements, while performed by trained observers, are still subject to human error and variability, which could have influenced the results.
