Abstract
In high-altitude cold regions, significant diurnal and seasonal temperature variations intensify freeze-thaw damage to rocks, critically impacting slope stability. This study examines a Xinjiang mine slope to assess freeze-thaw effects through laboratory experiments on three lithologies under varying freeze-thaw cycles. Mechanical parameters were determined via the Hoek–Brown criterion, and FLAC3D simulations analyzed stress-deformation characteristics and safety factor trends, validated against field monitoring. After 90 cycles, the results show progressive degradation: uniaxial compressive strength declined by 29.7–45.8%, elastic modulus by 42.7–63.3%, Poisson’s ratio by 16.0–42.1%, cohesion by 71.7–77.1%, internal friction angle by ~52.0%, and tensile strength by 79.3–83.6%. The slope safety factor decreased exponentially (44.5% reduction). Both simulations and monitoring revealed “step-like” displacement growth, with minor discrepancies attributed to modeling assumptions. These findings provide critical insights for safe mining operations in cold regions, highlighting the severe mechanical deterioration induced by freeze-thaw cycles and its implications for slope stability.
1. Introduction
With the continuous development of mineral resources in western China, a large number of high and steep mine slopes have been created. Under the cyclical freeze-thaw action, the damage to the rock body of the slope is exacerbated, which ultimately leads to the slopes’ instability. For example, in 2013, the rock mass deterioration caused by the freeze-thaw cycles in Karma mine in Tibet resulted in the slope instability and collapse of 2 million cubic meters, which resulted in significant loss of life and property [1]. The freeze-thaw damage characteristics of the rock mass of the slopes in the alpine area play a critical role in the slopes stability. Therefore, the study on the freeze-thaw damage characteristics of rock mechanical parameters is crucial for the protection of slope stabilities in high-altitude cold areas.
In recent years, scholars have conducted considerable research on the freeze-thaw damage characteristics of rock mass. For example, Sun et al. [2] investigated the development of pores and cracks in sandstone and granite under freeze-thaw cycles by using nuclear magnetic resonance, three-dimensional X-ray microscopy, etc. Ma et al. [3] conducted dynamic compression tests on muddy sandstone with different numbers of freeze-thaw cycles and found that the uniaxial dynamic compressive strength of the rock was inversely proportional to the freeze-thaw damage variables. Takarl et al. [4] conducted freeze-thaw cycle experiments on saturated granite and explored the correlation between the uniaxial compressive strength, permeability, longitudinal wave velocity of rocks, and the number of freeze-thaw cycles. Li et al. [5] investigated the effects of freeze-thaw cycles on the mechanical properties of soil–rock mixtures and slope stability in open-pit coal mine dump sites through experimental and numerical simulation methods. Their study revealed that increasing freeze-thaw cycles significantly reduced both the strength of soil–rock mixtures and slope stability. Furthermore, they proposed relevant damage evolution models and stability prediction methods. Zhang Fengrui et al. [6] found that with the increase in the number of freeze-thaw cycles, the creep deformation and rate of the rock increased significantly, and the duration of each creep stage gradually shortened by conducting creep tests and fine visual characterization on granite specimens under different numbers of freeze-thaw cycles. M. Deprez et al. [7] elucidated the influence mechanisms of freeze-thaw cycles on the physico-mechanical properties of rocks through laboratory experiments and in situ field tests, with analysis conducted from a mesoscopic perspective. Liu et al. [8] investigated the micro-pore evolution and macro-mechanical property degradation of grout-reinforced fractured sandstone under freeze-thaw cycles using nuclear magnetic resonance (NMR) and triaxial compression tests. B. Ullah et al. [9] utilized acoustic emission signals and energy evolution during uniaxial compression tests to predict failure and assess microcrack evolution in sandstone, marble, and granite subjected to freeze-thaw weathering, revealing that freeze-thaw cycles exerted negligible influence on the transition from tensile to shear cracks but promoted further propagation of tensile cracks. Zhang Huimei et al. [10] studied the variation of physical and mechanical parameters of rock samples with the number of freeze-thaw cycles and peripheral pressure by conducting conventional triaxial experiments on red sandstone under different numbers of freeze-thaw cycles. Muhammad Ali et al. [11] conducted unconfined compression and split tensile strength tests on both cement-treated sand and natural soft shale under freeze-thaw cycles to investigate the effects of freeze-thaw action on parameters including unconfined compressive strength and initial small-strain Young’s modulus. Yang Xiurong et al. [12] conducted triaxial creep experiments on gneiss with different numbers of freeze-thaw cycles and found that with the increase in freeze-thaw cycles, the deterioration of each creep parameter of the rock increased linearly. K. Abdolghanizadeh et al. [13] investigated the effects of freeze-thaw cycles on sandstone fracture toughness through CT scanning technology, revealing that the fracture toughness decreased non-linearly with both the increasing number of freeze-thaw cycles and elevated freezing temperatures. Yu Jin et al. [14] investigated the impact of the number of freeze-thaw cycles and the surrounding rock on the deformation modulus and damage mode of sandstone by the indoor triaxial compression test. M. Hori et al. [15] developed a micromechanical model to characterize porous brittle materials under freeze-thaw cycles, conducted degradation analysis and simulated the deterioration processes, ultimately achieving the prediction of irreversible deformations caused by freeze-thaw-induced performance degradation in such materials. Jiang et al. [16] observed an increase in voids and cracks in rock mass and a decrease in fracture toughness with the increase in the number of freeze-thaw cycles through the large-scale drop hammer impact test under freeze-thaw cycles and numerical simulation analysis using ABAQUS. M. Mutlutürk et al. [17] developed a functional model to describe the deterioration of rock integrity parameters under repeated freeze-thaw cycles. Amin Jamshidi et al. [18] proposed a novel rock mechanics prediction parameter (PMPP) to forecast the strength of granite after freeze-thaw (F-T) cycles. Overall, freeze-thaw cycles tend to weaken the physical and mechanical properties of rocks to different degrees.
As for the slopes’ stability in high-altitude and cold regions, Liu Shuai et al. [19] conducted freeze-thaw tests on a “three-section” slope scaling model, investigated the damage characteristics of the slope’s locked section under freeze-thaw conditions, and combined numerical simulation to explore the damage disaster mechanism. Shima Kawamura et al. [20] conducted similarity simulation experiments on cold-region slopes, monitored and analyzed the relevant parameters of the model, and found that regional moisture content plays a significant role in the process of slope instability caused by freeze-thaw cycles. Anning et al. [21] analyzed the response of slopes during the freeze-thaw process and predicted the trend of slope displacement after multiple freeze-thaw cycles by numerical simulation using FLAC3D and field monitoring. Shin et al. [22] identified a critical slope in a cold region through field tests and laboratory experiments, and evaluated the governing factors of slope stability via numerical simulation. Zeng Taorui et al. [23] derived a transfer coefficient method formula suitable for stability analysis on freeze-thaw slopes based on the Mohr–Coulomb strength criterion. Luo Huaiting et al. [24] improved the traditional freeze-thaw model of slope stability and developed a formula to calculate the stability coefficient of combined open-pit slopes under freeze-thaw cycles. Subramanian et al. [25] proposed a slope stability assessment method based on 2D numerical simulation, incorporating seasonal climatic effects such as freeze-thaw action and snowmelt infiltration-induced variations in soil moisture content. Shen Hao et al. [26] explored the influence degree of freeze-thaw cycles on different types of slopes’ stability by numerical simulation using MIDAS GTS NX (2021) software. These studies have provided valuable insights into the slopes’ stability under freeze-thaw cycles. However, the impact of freeze-thaw cycles varies with different types of rocks, and consequently, their influence on the slopes’ stability also differs.
Therefore, this paper aims to conduct indoor mechanical experiments on three rock specimens under different numbers of freeze-thaw cycles based on the geological characteristics of the site, to study the freeze-thaw damage characteristics of their mechanical parameters, and to determine the mechanical parameters of the rock body using the Hoek−Brown strength criterion. On this basis, the FLAC3D 6.00 software will be employed to investigate the stability of slopes under different numbers of freeze-thaw cycles. The findings will be compared and analyzed alongside field S-SAR (Slope-Synthetic Aperture Radar) monitoring results to assess the impact of freeze-thaw cycles on slope stability.
2. Project Overview
The mine is located in the Tianshan Mountains of Xinjiang, China, characterized by a cold, arid climate with perennial snow cover. Seasonal temperatures average below 0 °C during winter, spring, and autumn, reaching extreme lows of −40 °C. Summer temperatures typically range from 5 °C to 15 °C, peaking at 20 °C, while nighttime averages fluctuate between −3 °C and 5 °C, resulting in significant diurnal temperature variations.
The mining area exhibits a distinct “double-slope valley” geological structure, where the eastern and western slopes serve as mining benches, and the northern and southern slopes function as waste dumps. Key parameters of the eastern slope include an open-pit boundary of 593 m × 385 m, mining elevations spanning from 3320 m to 3680 m, a closed-loop elevation of 3428 m, and a total vertical height of 653 m from the pit base to the summit. The eastern slope features 12 m high benches, combined into 24 m or 36 m composite sections, with an overall slope angle of 46~48°. Open-pit mining has concluded, and current operations focus on remnant ore extraction. The main distribution of strata in the mining area is the Lower Carboniferous Dahalajunshan Formation, Akshakh Formation, and Quaternary System, with slope lithologies dominated by dacite, interspersed with magnetite and skarn [27]. In the process of periodic temperature change, the shallow rock on the surface is in the cycle of freezing and melting, which leads to the increase in slope deformation and the gradual decrease in slope stability, and poses significant risks to safe mining practices.
3. Mechanical Parameters of Rock Mass Under the Influence of Freeze-Thaw Cycles
To investigate the variations of mechanical parameters of rocks under freeze-thaw (F-T) cycles, large rock blocks of dacite, magnetite, and skarn were collected from the mining site. Standard cylindrical specimens of Φ50 mm × 100 mm were prepared in accordance with the Standard for Test Methods of Engineering Rock Masses (GB/T 50266-2013) [28]. A total of 126 standard specimens were fabricated for this experimental investigation. These specimens were subsequently subjected to laboratory uniaxial and triaxial compression tests under F-T cycling conditions. Representative rock blocks and prepared specimens are illustrated in Figure 1.
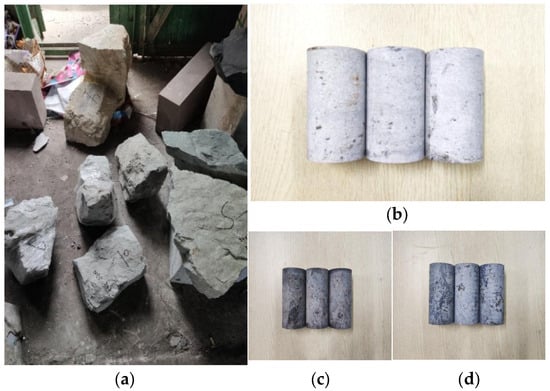
Figure 1.
Rock sample collection and processing. (a) Collected rock mass; (b) dacite specimen; (c) magnetite specimen; (d) skarn specimen.
3.1. Experimental Plan
A JS-DW-40 ultra-low temperature freezer (manufactured by Zhejiang Jiesheng Refrigeration Technology Co., Ltd., Shaoxing, China) (Figure 2a) is used to conduct freeze-thaw (F-T) cycles to the specimens. Specimens of each lithology (dacite, magnetite, and skarn) were subjected to 0, 30, 60, and 90 F-T cycles under temperature conditions from −40 °C to 20 °C; two groups of freeze-thaw conditions were set for each type of rock sample. The experimental procedure was as follows:
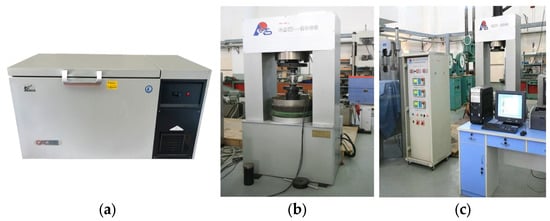
Figure 2.
Experimental equipment. (a) JS-DW-40 ultra-low temperature freezer. (b) GAW-2000 electro-hydraulic servo rigid pressure tester. (c) TAW-2000 electro-hydraulic servo three-axis testing machine.
- (1)
- Specimens were immersed in pure water for 48 h to achieve full saturation, and the saturated mass mp of specimens was measured after surface moisture was wiped off. Then, the specimens were placed in a −40 °C freezer for 8 h. Subsequently, the frozen specimens were transferred to 20 °C pure water for thawing over 8 h, ensuring complete submersion. This constituted one complete F-T cycle.
- (2)
- Specimens were subjected to freeze-thaw (F-T) cycles between −40 °C and 20 °C for different cycle times. After completing the cycles, specimens were wiped to remove surface water, and weighed. Longitudinal wave velocity (Vp) was measured using an ultrasonic rock parameter analyzer. Damage features (e.g., spalling, cracking) were inspected, and the failure process was systematically recorded.
Uniaxial compression tests were performed using a GAW-2000 electro-hydraulic servo-controlled rigid testing machine (manufactured by CCTI, Changchun, China) (Figure 2b) after freeze-thaw cycles. The rock failure in the uniaxial test is mainly brittle fracture. A slower loading speed can obtain parameters such as peak strength more accurately. Therefore, the test preloading is carried out first. The testing machine is loaded at a rate from 300 N/s to 1 KN. After the test data stabilize, it is converted to deformation control and loaded at a rate of 0.06 mm/min until the rock sample breaks and loses its bearing capacity. For triaxial tests, a TAW-2000 electro-hydraulic servo system (manufactured by CCTI, Changchun, China) (Figure 2c) was utilized. Three cases were applied by confining pressures of 5, 10, and 15 MPa. During the test, confining pressure is first applied to the preset value. After the confining pressure loading is completed, a constant confining pressure is maintained and the axial pressure is gradually applied in the displacement control mode until the rock sample fails. Due to the stabilizing effect of confining pressure in triaxial testing, a relatively faster loading rate of 0.1 mm/min can be adopted without compromising specimen integrity.
3.2. Uniaxial Compressive Mechanical Properties of Rock Specimens Under Freeze-Thaw Cycles
Low temperatures induce the freezing of pore water into ice within rock masses, which generates volumetric expansion, leading to progressively increasing frost heave pressure. This process drives the propagation of existing fissures and nucleation of new cracks, resulting in severe microstructural damage. Consequently, the strength and deformation characteristics of the rock are significantly degraded. The complete stress–strain curves for dacite, magnetite, and skarn under varying freeze-thaw (F-T) cycles are presented in Figure 3.
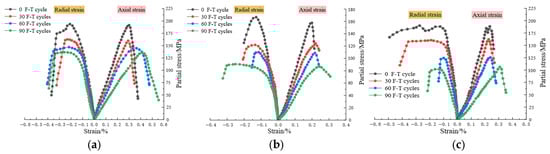
Figure 3.
Stress–strain curves of rocks under uniaxial compression conditions. (a) Dacite; (b) magnetite; (c) skarn.
As shown in Figure 3, the stress–strain curves of the three rock types demonstrate notable similarities. Specimens subjected to 0 and 30 freeze-thaw cycles exhibited a longer elastic phase with no distinct yielding stage, showing pronounced brittle failure characteristics. This phenomenon can be attributed to the relatively low damage degree in specimens after 0 and 30 freeze-thaw cycles. However, for specimens subjected to 60 and 90 freeze-thaw cycles, failure does not occur abruptly. Instead, after experiencing a yielding stage prior to peak stress, the rock strength gradually decreases post-peak with an extended softening phase. This behavior arises from the combined effects of enhanced micro-pores and newly generated cracks formed by water–ice phase transitions during repeated freeze-thaw cycles; progressive crack propagation under frost heave pressure; cumulative damage accumulation leading to increased ductility; and transitional rock behavior from brittle to plastic failure modes with cycle intensification. Mechanical parameters derived from uniaxial compression tests under varying F-T cycles are summarized in Table 1.

Table 1.
Rock mechanical parameters of uniaxial compression under different freeze-thaw times.
The damage morphology of the three rock specimens under uniaxial compression testing is shown in Figure 4. As can be seen, the damage morphology of the three rock specimens mainly includes tensile damage, conical damage, and diagonal shear damage, with tensile damage being predominant. The specimens demonstrate progressive proliferation of fracture cracks and intensified localized spalling phenomena with increasing freeze-thaw cycles.
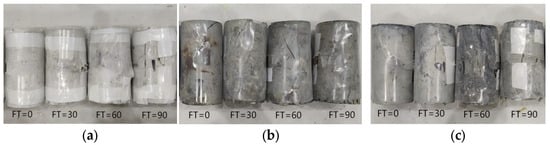
Figure 4.
Failure modes of rocks under uniaxial compression and different numbers of freeze-thaw cycles. (a) Dacite; (b) magnetite; (c) skarn.
3.3. Conventional Triaxial Compression Testing of Rocks
Conventional triaxial compression tests were conducted on dacite, magnetite, and skarn specimens under confining pressures of 5 MPa, 10 MPa, and 15 MPa. The corresponding stress–strain curves for the three rocks under triaxial loading conditions are provided in Figure 5.
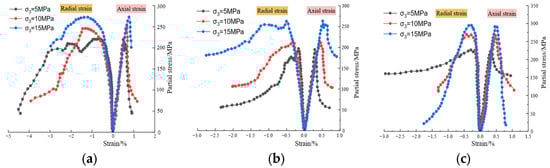
Figure 5.
Triaxial compressive stress–strain curves of rocks under different circumferential pressure conditions. (a) Dacite; (b) magnetite; (c) skarn.
As shown in Figure 5, the stress–strain curves of the three types of rocks under triaxial compression exhibit the following overall characteristics: the compaction stage is relatively short or almost absent, the linear elastic stage is prolonged, and a rapid stress drop occurs in the post-peak residual stage, demonstrating pronounced characteristics of hard rocks. With increasing confining pressure, the peak strength and peak axial strain at failure were observed to progressively increase, accompanied by enhanced ductility during failure. The mechanical parameters derived from triaxial compression tests for all three rock types are summarized in Table 2.
Table 2.
Mechanical parameters of rock triaxial compression under different circumferential pressure conditions.
3.4. Determination of Mechanical Parameters of Rock Mass Considering Freezing and Thawing Effects
To obtain the mechanical parameters of rock masses under freeze-thaw cycles, the Hoek–Brown criterion was adopted to degrade the rock mechanical parameters under laboratory test conditions. The generalized Hoek–Brown failure criterion for jointed rock masses is defined as follows:
where σ1 is the major principal stress at failure, σ3 is the minor principal stress at failure, σc is the uniaxial compressive strength of intact rock , s, and are empirical parameters reflecting the structural and quality characteristics of the rock mass.
In 2002, the geological strength index (GSI) was introduced by E. Hoek et al. to comprehensively account for rock mass and structural plane characteristics, with the incorporation of a disturbance parameter D. A methodology for calculating , s, and using GSI and D was proposed, as formulated in Equation (2):
where GSI is the geological strength index, is the intact rock material constant, and D is the engineering disturbance factor.
The Standard for Engineering Classification of Rock Mass (GB/T 50218-2014) [29] specifies that when the integrity index () cannot be obtained through field measurements, it may be determined using the volumetric joint count () of the rock mass. The empirical relationship between and is provided in Table 3.
Table 3.
Relationship between and .
Hou et al. [30] systematically measured and statistically analyzed the rock discontinuities in the mining study area. The volumetric joint count () of the rock slope was determined as 2.11, resulting in an integrity coefficient () of 0.83.
An empirical relationship between the geological strength index (GSI) and P-wave velocity (Vp) was conducted by Li Shuobiao et al. [31] based on the statistical analysis of extensive rock engineering data, expressed as follows:
where Vp is the longitudinal wave velocity of rock and Vpm is the longitudinal wave velocity of rock mass.
Rock specimens subjected to predetermined F-T cycles were tested by the ZBL-U5200 non-metallic ultrasonic tester for P-wave velocity and the data were averaged to ensure reliability.
The P-wave velocities (Vp) and geological strength index (GSI) values of the three rock types under varying freeze-thaw (F-T) cycles are summarized in Table 4.
Table 4.
GSI values of the three types of rocks at different freeze-thaw times.
The intact rock material constant mi was determined as 22 for dacite, and 26 for both skarn and magnetite [32].
For undisturbed rock masses, the disturbance coefficient D is assigned a value of 0. However, severely disturbed or damaged rock masses (e.g., those affected by large-scale blasting or F-T cycling in this open-pit mine) were assigned D = 1.0.
According to the Technical Specification for Slope Engineering in Non-Coal Surface Mines (GB 51016-2014) [33], the mechanical parameters of the rock mass can be calculated using the following formula.
Rock compression can be calculated by the following formula:
where is the rock compressive strength.
The tensile strength of the rock can be calculated by the following formula:
where is the tensile strength of the rock mass.
The deformation modulus of the rock mass can be calculated by the following Equation:
where is the deformation modulus of the rock mass and is the deformation modulus of the intact rock.
Meanwhile, Hoek–Brown-derived Expressions (6) and (7) for the shear strength indexes, internal friction angle φ and cohesion c, by establishing a quantitative relationship between the Mohr–Coulomb and Hoek–Brown criteria [34], as follows:
where is the ratio of maximum confining pressure to uniaxial compressive strength, is the maximum confining pressure, H is the slope height, and is the rock mass weight.
According to Equations (3)–(11), the mechanical parameters of rock masses under varying F-T cycles were calculated and summarized in Table 5. After 90 F-T cycles, significant degradation was observed: uniaxial compressive strength (UCS) decreased by 29.7–45.8%, elastic modulus (EM) by 42.7–63.3%, Poisson’s ratio by 16.0–42.1%, cohesion by 71.7–77.1%, internal friction angle by approximately 52.0%, and tensile strength by 79.3–83.6%.
Table 5.
Mechanical parameters of slope rock mass under different freeze-thaw times.
A comparison between the cohesion (c) and internal friction angle (φ) obtained from conventional triaxial compression tests and those from the Hoek–Brown criterion revealed that the post-reduction cohesion measures approximately 1/5 of the initial value while the reduced internal friction angle constitutes about 3/5 of the original magnitude, which aligns well with the reduction coefficients recommended in the Chinese “Standard for Engineering Rock Mass Classification” (GB/T 50218-2014) [29], thereby validating the rationality of determining the geological strength index (GSI) through integrated field discontinuity surveys and acoustic wave measurements.
Based on the Hoek–Brown strength criterion, the mechanical parameters of three types of rock masses under different numbers of freeze-thaw (F-T) cycles were determined. These parameters were subsequently incorporated into FLAC3D to numerically simulate slope stability under various F-T cycling conditions.
4. Stability Analysis of Slopes Under Freeze-Thaw Cycles
4.1. Construction of the Model
To investigate the impacts of freeze-thaw (F-T) cycles on slope stability, a 3D model of the eastern mine slope was constructed by integrating geological data from the P2N, P4N, and P8N cross-sections, borehole logs, and contour maps of the mining area. The geometry of the slope was 476 m long, 490 m wide, and 502 m high generated by 3Dmine (2020) software. Rock mass mechanical parameters incorporating F-T effects (for dacite, magnetite, and skarn) were subsequently imported into FLAC3D to analyze the slope stability under varying F-T cycles. As illustrated in Figure 6, the 3D geological model employs color-coded lithologies: magenta for dacite, blue for magnetite, and maroon for skarn. The points P1–P6 are six monitoring points, whose locations are essentially consistent with the six observation points in field monitoring. The model base was subjected to fixed constraints, while the surrounding boundaries were assigned normal constraints.
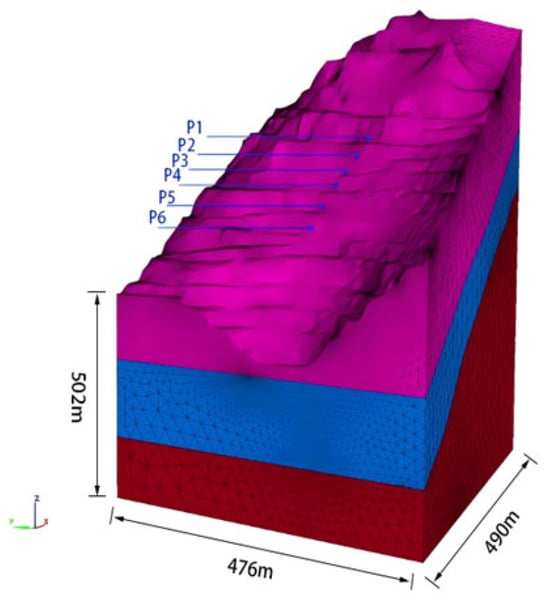
Figure 6.
Three-dimensional geological model map of the slope.
Slope stability under 0, 30, 60, and 90 freeze-thaw (F-T) cycles was analyzed using the strength reduction method. The initial stress field of the model was defined as the gravitational field with g = 9.8 m/s2. For the strength reduction analysis, the following procedure was applied to determine the cohesion (c) and internal friction angle (φ):
4.2. The Influence of Freeze-Thaw Cycles on Slope Stresses
The nephogram of maximum principal stress for the slope after undergoing 0, 30, 60, and 90 freeze-thaw (F-T) cycles is presented in Figure 7.
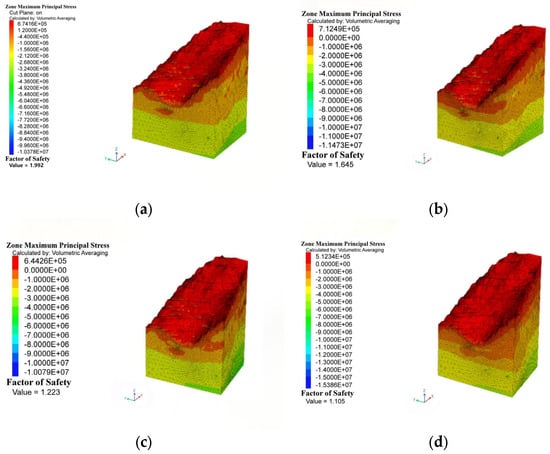
Figure 7.
The maximum principal stresses of slopes with different numbers of freezing and thawing. (a) F-T = 0; (b) F-T = 30; (c) F-T = 60; (d) F-T = 90.
As illustrated in Figure 7, stress redistribution was observed with increasing freeze-thaw (F-T) cycles, accompanied by stress concentration phenomena at the slope toe and crest regions. Comparative analysis between the initial gravitational stress field and post-90-cycle F-T conditions revealed a significant stress amplification, with the maximum tensile stress increasing by 0.73 MPa. Progressive stability degradation at both the toe and crest was attributed to the F-T-induced deformation of near-surface geomaterials, coupled with the sustained propagation of tensile stresses within the slope body.
4.3. The Influence of Freeze-Thaw Cycles on Slope Displacement
According to engineering experience, the primary displacement direction during slope landslide disasters is characterized by an inward sliding movement toward the interior of the slope. The displacement nephogram of X-direction toward the interior of the slope plots for the slope under 0, 30, 60, and 90 F-T cycles was generated in Figure 8. With increasing F-T cycles, progressive amplification of X-direction displacements was observed at both the slope toe and crest. This behavior originates from the freeze-thaw damage mechanism in the natural water-bearing slope: repeated water−ice phase transitions within rock masses under temperature fluctuations induced strength degradation, volumetric expansion, and subsequent displacement accumulation.
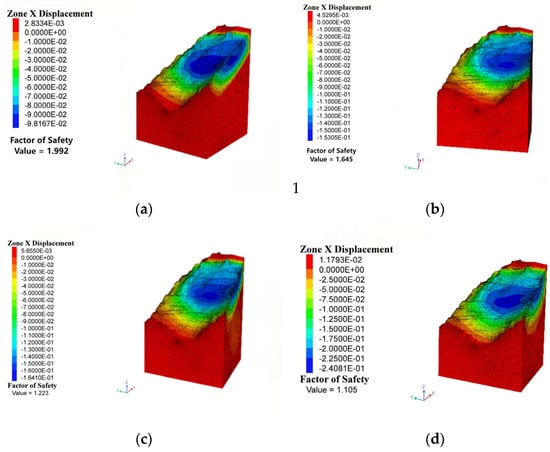
Figure 8.
X-direction displacement nephogram under different freeze-thaw cycle conditions. (a) F-T = 0; (b) F-T = 30; (c) F-T = 60; (d) F-T = 90.
In the non-F-T scenario (Figure 8a), localized displacements were concentrated near the slope crest under gravitational loading, while the overall slope remained stable. Comparative analysis of Figure 8a (0 cycles) and Figure 8d (90 cycles) revealed a significant displacement intensification, with the maximum X-direction displacement reaching −240 mm (negative values indicating downslope movement) at the mid-lower slope section.
The curves of X-direction displacement versus time steps for six observation points on the slope under the conditions of F-T = 0, 30, 60, and 90 freeze-thaw cycles are shown in Figure 9.
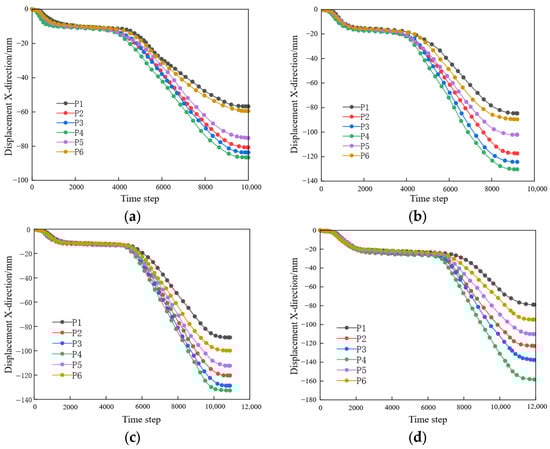
Figure 9.
Curves of X-direction displacement versus time step. (a) F-T = 0; (b) F-T = 30; (c) F-T = 60; (d) F-T = 90.
As shown in Figure 9, the deformation curves of the monitoring points exhibit a tripartite evolutionary pattern. The initial deformation stage was characterized by minor negative displacements in the simulation results. The subsequent quasi-stable stage exhibited negligible displacement increments under sustained loading. The final accelerated stage demonstrated rapid displacement accumulation culminating in failure, collectively defining a triphasic deformation pattern.
4.4. The Influence of Freeze-Thaw Cycles on the Plastic Zones of Slopes
The plastic zones of the slope profiles under varying freeze-thaw (F-T) cycles are presented in Figure 10. In the initial state (0 F-T cycles), the plastic zones exhibited a dispersed distribution with limited potential failure areas, indicating stable slope conditions. With the increasing of F-T cycles, the plastic zones progressively expanded and coalesced spatially. At F-T = 90, a fully developed shear band penetrated the slope profile, signifying complete slope failure.
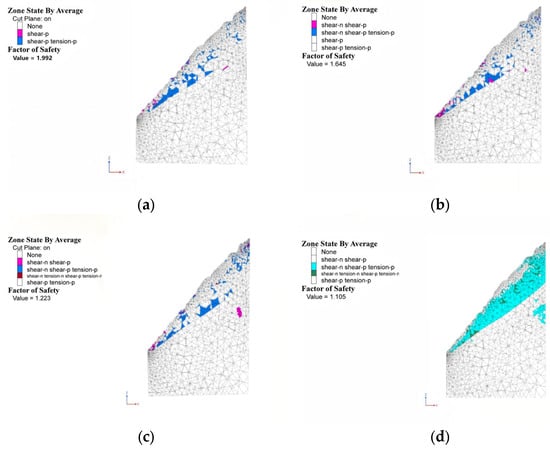
Figure 10.
Slices of the plastic zones of the slope for different numbers of freeze- thaw cycles. (a) F-T = 0; (b) F-T = 30; (c) F-T = 60; (d) F-T = 90.
4.5. The Influence of Freeze-Thaw Cycles on the Slope Safety Factor
The safety factor (Fs) of the slope was analyzed using the strength reduction method. The results demonstrated a progressive reduction in stability: Fs = 1.992 at 0 F-T cycles, 1.645 at 30 cycles, 1.223 at 60 cycles, and 1.105 at 90 cycles. A negative exponential correlation between the Fs and F-T cycle number (n) was identified, expressed as Fs = 1.48 exp(−n/91.89) + 0.52 (see Figure 11).
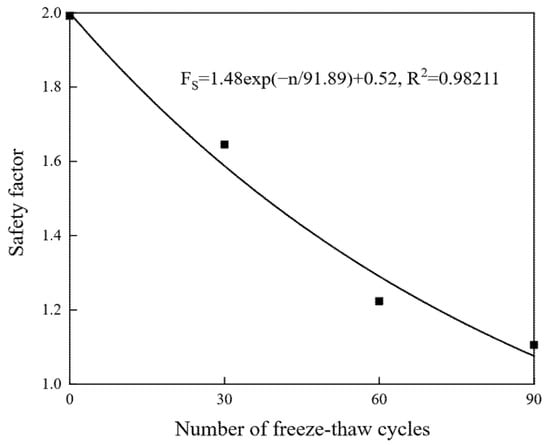
Figure 11.
Relationship between the safety factor and number of F-Ts.
A progressive reduction in the safety margin and stability of the slope was observed with increasing F-T cycles.
5. Monitoring of Slope Displacements Under Freeze-Thaw Cycles
To ensure comprehensive coverage of critical zones, an S-SAR trailer-mounted slope radar was strategically deployed on the elevation bench of 3548 m in the western mine slope, accounting for on-site power supply, network availability, and antenna coverage constraints. This system enabled real-time monitoring of the eastern slope. Six monitoring points were selected within the radar coverage area, corresponding to critical slope simulation zones. The geodetic coordinates and spatial distribution of these points are detailed in Table 6 and illustrated in Figure 12.
Table 6.
Map of coordinates of observation points.
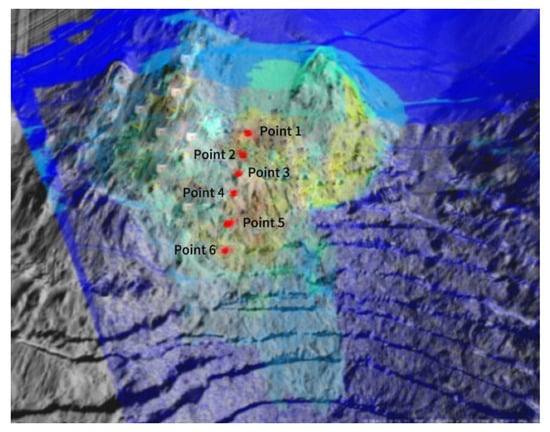
Figure 12.
Cloud map of the radar monitoring area with observation points.
The monitoring period was selected from 3 January 2021 to 3 January 2023 based on radar operational continuity. Displacement-time curves for the monitoring points are shown in Figure 13, revealing a progressive acceleration in deformation rates with prolonged freeze-thaw (F-T) exposure. The displacement evolution exhibited a triphasic “stepped growth” pattern:
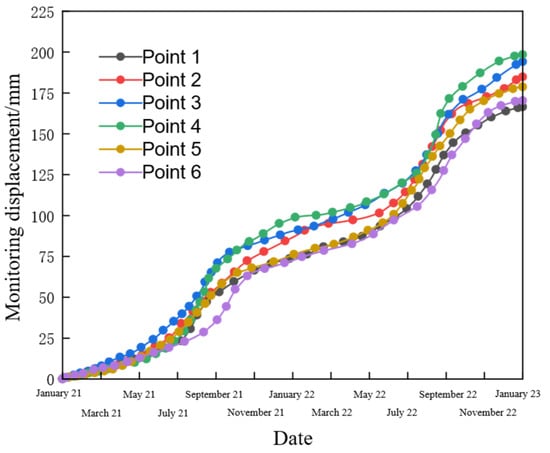
Figure 13.
Displacement change curve of observation points.
- Stage 1 was characterized by low deformation rates (<0.1 mm/day), minimal cumulative displacement increments, and negligible volumetric changes.
- Stage 2 demonstrated abrupt rate intensification (peaking at 1.2–1.8 mm/day) during annual June–September intervals. This period coincided with active F-T cycling in the slope, where water–ice phase transitions induced frost cracking and mechanical parameter degradation (cohesion reduction: 71.7–77.1%; friction angle decline: ~52.0%). Superimposed gravitational and blasting vibration loads triggered pronounced displacement surges.
- Stage 3 displayed moderated deformation rates (0.3–0.6 mm/day) as pore water refreezing generated frost heave pressures, propagating fractures while destabilizing the slope. Despite residual displacement accumulation, the deceleration trend indicated partial stabilization under post-failure stress redistribution.
The stepped growth pattern observed in field-monitored displacements exhibited similarities to numerical simulations but with notable discrepancies. This discrepancy arises from (i) the static F-T cycle representation in simulations (single damage state post-cycling) versus dynamic field conditions where cyclic damage progressively accumulates with annual F-T repetitions; (ii) temperature differentials between laboratory-controlled F-T minima (−40 °C) and actual field conditions (−25.6 °C), inducing divergent frost cracking intensities; (iii) oversimplified stress initialization in simulations (gravitational field only) neglecting transient loads from rainfall infiltration and blasting vibrations (PPV > 15 mm/s) during monitoring; and (iv) homogeneous F-T effect assumptions in models, disregarding spatial heterogeneity of freeze-thaw penetration depths (field-measured: 2.3 m avg.) and localized saturation variations.
6. Conclusions
In this paper, uniaxial compression tests and conventional triaxial tests of rocks under different freeze-thaw cycles were carried out, and the influence of freeze-thaw cycles on the mechanical parameters of rock masses was analyzed. The GSI was determined by combining the on-site structural plane investigation and the acoustic wave method. The mechanical parameters of the rock mass were gained based on the Hoek–Brown criterion, and the rationality of the method was verified by combining the indoor triaxial experiments. The results were used in the stability analysis of slopes to study the characteristics of stress and deformation changes under freeze-thaw cycles, as well as the changes in safety coefficients. The results were compared and analyzed with on-site monitoring data, leading to the following conclusions:
- (1)
- As the number of freeze-thaw cycles increased, the uniaxial compressive strength, modulus of elasticity, Poisson’s ratio, internal friction angle, and cohesion of the three rock types decreased. Compared to the mechanical parameters without considering freeze-thaw effects, the uniaxial compressive strength of the three rock types decreased by 29.7~45.8%, the modulus of elasticity decreased by 42.7~63.3%, the Poisson’s ratio decreased by 16.0~42.1%, the cohesion decreased by 71.7~77.1%, the internal friction angle decreased by approximately 52.0%, and the tensile strength decreased by 79.3~83.6%.
- (2)
- Through numerical simulation, it was found that the deformation and stress of the slope increase with the number of freeze-thaw cycles. At F-T = 90, the maximum X-direction displacement of the slope increased by 240 mm, and the maximum tensile stress increased by approximately 0.73 MPa. Judging from the six observation points of the numerical simulation, this is similar to the on-site observation results. The safety coefficient of the slope decreases exponentially with the number of freeze-thaw cycles, reaching Fs = 1.105 at F-T = 90, indicating that the slope is in an unsafe state. Compared to the safety coefficient without considering freeze-thaw effects, the safety coefficient decreased by 44.5%. Therefore, freeze-thaw cycles can easily lead to slope instability.
- (3)
- Both the numerical simulation results and the field monitoring results show that the slope displacements exhibit a “stepwise” growth pattern overall. However, there are slight differences between the two results, primarily due to factors such as loading methods, environmental conditions, and assumptions.
It should be pointed out that although the reduction in rock mechanical parameters based on the Hoek–Brown strength criterion has high computational efficiency, it may overly simplify the evolution process of anisotropic damage of rock mass under the action of freeze-thaw cycles. In particular, it fails to distinguish the differential damage between the complete rock mass block and the structural plane, and does not reflect the microstructure damage mechanism caused by phase transformation. Furthermore, the accuracy of analyzing slope stability by combining indoor tests and numerical simulations has a certain gap compared with the actual situation.
Future research will explore the following aspects to further refine the theoretical framework of freeze-thaw rock mechanics and enhance engineering applicability:
- (1)
- Refining the relationship between freeze-thaw damage mechanisms and Hoek–Brown parameters by establishing a modified Hoek–Brown–F-T empirical formula, thereby achieving synergistic innovation across theory, experimentation, and modeling.
- (2)
- Investigating micro- and meso-scale damage in rocks subjected to freeze-thaw cycles to elucidate the progressive deterioration mechanisms at different structural levels.
- (3)
- Developing and applying a constitutive model that quantitatively reflects the degree of rock damage induced by freeze-thaw cycling, enabling more accurate stability predictions for engineering applications.
- (4)
- These advancements will contribute to a more comprehensive understanding of freeze-thaw-induced rock degradation and its implications for slope stability in cold regions.
Author Contributions
All authors contributed to the study’s conception and design. W.T. funding acquisition, supervision, writing—review; Z.L. (Zelong Li) investigation, formal analysis and writing—original draft; Z.L. (Zhentao Li) methodology, investigation; S.W. experiment, writing—review and editing; E.S. numerical simulation. Q.G. experiment, writing—review and editing. All authors have read and agreed to the published version of the manuscript.
Funding
This study was supported by the National Key R&D Program of China (No. 2023YFC2907302).
Institutional Review Board Statement
Not applicable.
Informed Consent Statement
Not applicable.
Data Availability Statement
The original contributions presented in this study are included in the article. Further inquiries can be directed to the corresponding authors.
Conflicts of Interest
The authors declare no conflicts of interest.
References
- Xiao, Y. Study on the Mining-Induced Response and Time-Dependent Disaster Process of Multi-Field Coupling in Alpine Slope Rock Mass. Ph.D. Thesis, University of Science and Technology Beijing, Beijing, China, 2021. [Google Scholar]
- Sun, Y.; Zhai, C.; Xu, J.; Cong, Y.; Qin, L.; Zhao, C. Characterisation and evolution of the full size range of pores and fractures in rocks under freeze-thaw conditions using nuclear magnetic resonance and three-dimensional X-ray microscopy. Eng. Geol. 2020, 271, 105616. [Google Scholar] [CrossRef]
- Ma, Q.; Ma, D.; Yao, Z. Influence of freeze-thaw cycles on dynamic compressive strength and energy distribution of soft rock specimen. Cold Reg. Sci. Technol. 2018, 153, 10. [Google Scholar] [CrossRef]
- Takarli, M.; Prince, W.; Siddique, R. Damage in granite under heating/cooling cycles and water freeze-thaw condition. Int. J. Rock Mech. Min. Sci. 2008, 45, 1164. [Google Scholar] [CrossRef]
- Li, R.; Guo, Y.; Zhou, W.; Lu, X.; Zhang, Z.; Tian, Y.; Qi, X. Freeze-thaw damage characteristics of soil-rock mixtures in open-pit coal mines and stability analysis of slopes in discharge sites based on partial flow code. Appl. Sci. 2024, 14, 11585. [Google Scholar] [CrossRef]
- Zhang, F.; Jiang, A.; Yang, X.; Shen, F. Experimental and modeling study on shear creep behavior of granite under freeze-thaw cycles. Rock Soil Mech. 2020, 41, 509. [Google Scholar]
- Deprez, M.; De Kock, T.; De Schutter, G.; Cnudde, V. A Review on Freeze-Thaw Action and Weathering of Rocks. Earth-Sci. Rev. 2020, 203, 103143. [Google Scholar] [CrossRef]
- Liu, S.; Zhang, J.; Yu, Z.; Zhang, T.; Zhang, J. An experimental study on physical and mechanical properties of fractured sandstone grouting reinforcement body under freeze-thaw cycle. Appl. Sci. 2025, 15, 2801. [Google Scholar] [CrossRef]
- Ullah, B.; Zhou, Z.; Cai, X.; Lu, J.; Zhao, C.C. Failure Prediction and Microcracks Development Based on Acoustic Emission and Energy Evolution for Different Rocks Treated with Freeze–Thaw Weathering. Bull. Eng. Geol. Environ. 2023, 82, 471. [Google Scholar] [CrossRef]
- Zhang, H.; Xia, H.; Yang, G.; Zhang, M.; Peng, C.; Ye, W.; Shen, Y. Experimental study on the effects of freeze-thaw cycles and confining pressure on physical and mechanical properties of rocks. J. China Coal Soc. 2018, 43, 441. [Google Scholar]
- Ali, M.; Zubair, A.; Farooq, Z.; Farooq, K.; Masoud, Z. Prediction of Small-Strain Elastic Stiffness of Natural and Artificial Soft Rocks Subjected to Freeze-Thaw Cycles. J. Rock Mech. Geotech. Eng. 2025, in press. [CrossRef]
- Yang, X.; Jiang, A.; Wang, S.; Zhang, F. Experimental study on creep characteristics of gneiss under freeze-thaw cycles. Rock Soil Mech. 2019, 40, 4331–4340. [Google Scholar]
- Abdolghanizadeh, K.; Hosseini, M.; Saghafiyazdi, M. Effect of Freezing Temperature and Number of Freeze–Thaw Cycles on Mode I and Mode II Fracture Toughness of Sandstone. Theor. Appl. Fract. Mech. 2020, 105, 102428. [Google Scholar] [CrossRef]
- Yu, J.; Fu, G.; Chen, X.; Guo, X. Experimental study on mechanical properties of sandstone after freezing-thawing cycles under triaxial confining pressure unloading. Chin. J. Rock Mech. Eng. 2015, 34, 2001. [Google Scholar]
- Hori, M.; Morihiro, H. Micromechanical Analysis on Deterioration Due to Freezing and Thawing in Porous Brittle Materials. Int. J. Eng. Sci. 1998, 36, 511–522. [Google Scholar] [CrossRef]
- Jiang, Y.; Lei, Z.; Zhu, Z.; Li, J.; Niu, C.; Ying, P. Effects of freeze-thaw cycles on dynamic fracture initiation characteristics of surrounding rock with pure I type fracture under impact loads. Explos. Shock Waves 2021, 41, 043104. [Google Scholar]
- Mutlutürk, M.; Altindag, R.; Türk, G. A Decay Function Model for the Integrity Loss of Rock When Subjected to Recurrent Cycles of Freezing–Thawing and Heating–Cooling. Int. J. Rock Mech. Min. Sci. 2004, 41, 237–244. [Google Scholar] [CrossRef]
- Jamshidi, A. Predicting the Strength of Granitic Stones after Freeze–Thaw Cycles: Considering the Petrographic Characteristics and a New Approach Using Petro-Mechanical Parameter. Rock Mech. Rock Eng. 2021, 54, 2829–2841. [Google Scholar] [CrossRef]
- Liu, S.; Yang, G.; Pan, Z. Study on damage and catastrophic mechanisms of the locked section of a “three-stage” rock slope in a freeze-thaw environment. Chin. J. Rock Mech. Eng. 2024, 43, 2781–2795. [Google Scholar]
- Kawamura, S.; Miura, S. Failure of Volcanic Slopes in Cold Regions and Its Prediction. Procedia Earth Planet. Sci. 2014, 9, 143–152. [Google Scholar] [CrossRef]
- An, N.; Wan, B.; Hou, Y.; Jiang, Y. Influence of freeze-thaw action on slope of China-Russia eastern natural gas pipeline crossing section. Sci. Technol. Eng. 2023, 23, 14211. [Google Scholar]
- Shin, Y.; Choi, J.C.; Quinteros, S.; Svendsen, I.; L’Heureux, J.-S.; Seong, J. Evaluation and Monitoring of Slope Stability in Cold Region: Case Study of Man-Made Slope at Øysand, Norway. Appl. Sci. 2020, 10, 4136. [Google Scholar] [CrossRef]
- Zeng, T.; Wang, L.; Zhu, H. Stability analysis of silty soil slope under freeze-thaw cycles based on modified transfer coefficient method. Sci. Technol. Eng. 2019, 19, 206. [Google Scholar]
- Luo, H. Study on freeze-thaw strength test and stability of soil slope in open-pit mine. Coal Sci. Technol. 2017, 45, 23–27. [Google Scholar]
- Siva Subramanian, S.; Ishikawa, T.; Tokoro, T. Stability Assessment Approach for Soil Slopes in Seasonal Cold Regions. Eng. Geol. 2017, 221, 154–169. [Google Scholar] [CrossRef]
- Shen, H.; Xu, S.; Zhang, H.; Tian, Y. Study on the influence of freeze-thaw cycles on different types of slopes in open-pit mines. Coal Technol. 2022, 41, 111. [Google Scholar]
- Li, Z. Research on Slope Stability Monitoring and Deformation Law of Hejing Beizhan Iron Mine in Xinjiang. Ph.D. Thesis, University of Science and Technology Beijing, Beijing, China, 2023. [Google Scholar]
- GB/T 50266-2013; Ministry of Housing and Urban-Rural Development of the People’s Republic of China. Standard for Test Methods of Engineering Rock Masses. China Planning Press: Beijing, China, 2013. [Google Scholar]
- GB/T 50218-2014; Ministry of Housing and Urban-Rural Development of the People’s Republic of China. Standard for Classification of Engineering Rock Masses. Standards Press of China: Beijing, China, 2014.
- Hou, Z. Study on Freeze-Thaw Mechanical Characteristics and Stability of Fractured Rock Mass in Mine Slopes in High-Altitude Cold Regions. Ph.D. Thesis, University of Science and Technology Beijing, Beijing, China, 2022. [Google Scholar]
- Li, S.; Xue, Y. Improvement and application of Hoek-Brown criterion. Chin. J. Rock Mech. Eng. 2016, 35, 2732. [Google Scholar]
- Zhu, H.; Zhang, Q.; Zhang, L. Research progress and application review of Hoek-Brown strength criterion. Chin. J. Rock Mech. Eng. 2013, 32, 1945. [Google Scholar]
- GB 51016-2014; Ministry of Housing and Urban-Rural Development of the People’s Republic of China. Technical Code for Slope Engineering of Non-Coal Open-Pit Mines. China Planning Press: Beijing, China, 2014.
- Wu, S.; Zhang, M.; Zhang, S.; Jiang, R. Determination method of equivalent Mohr-Coulomb strength parameters based on modified Hoek-Brown criterion. Rock Soil Mech. 2019, 40, 4165. [Google Scholar]
Disclaimer/Publisher’s Note: The statements, opinions and data contained in all publications are solely those of the individual author(s) and contributor(s) and not of MDPI and/or the editor(s). MDPI and/or the editor(s) disclaim responsibility for any injury to people or property resulting from any ideas, methods, instructions or products referred to in the content. |
© 2025 by the authors. Licensee MDPI, Basel, Switzerland. This article is an open access article distributed under the terms and conditions of the Creative Commons Attribution (CC BY) license (https://creativecommons.org/licenses/by/4.0/).