
Optimal Lower Step Height of Tunnel Excavation Designs by Using the Non-Dominated Sorting Genetic Algorithm-II

Abstract
Featured Application
Abstract
1. Introduction
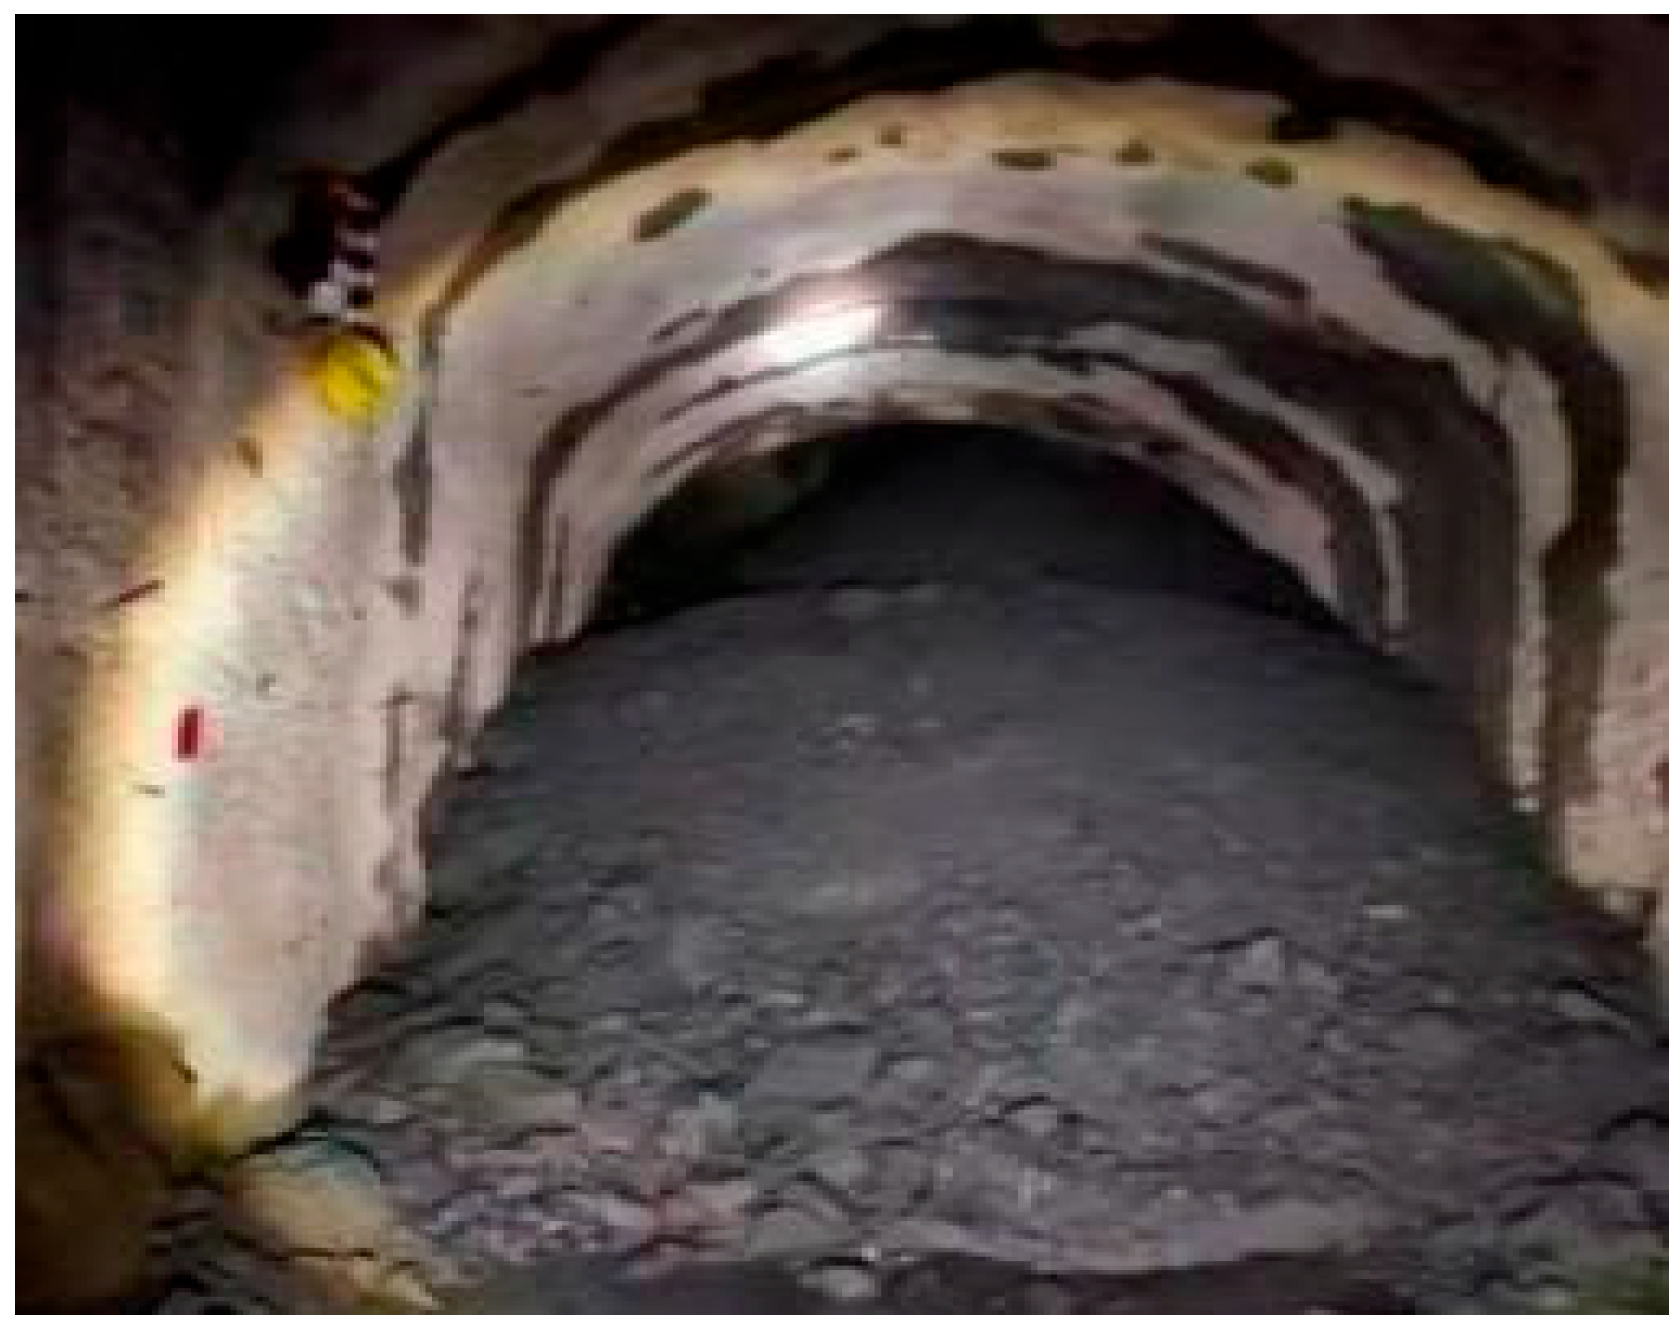
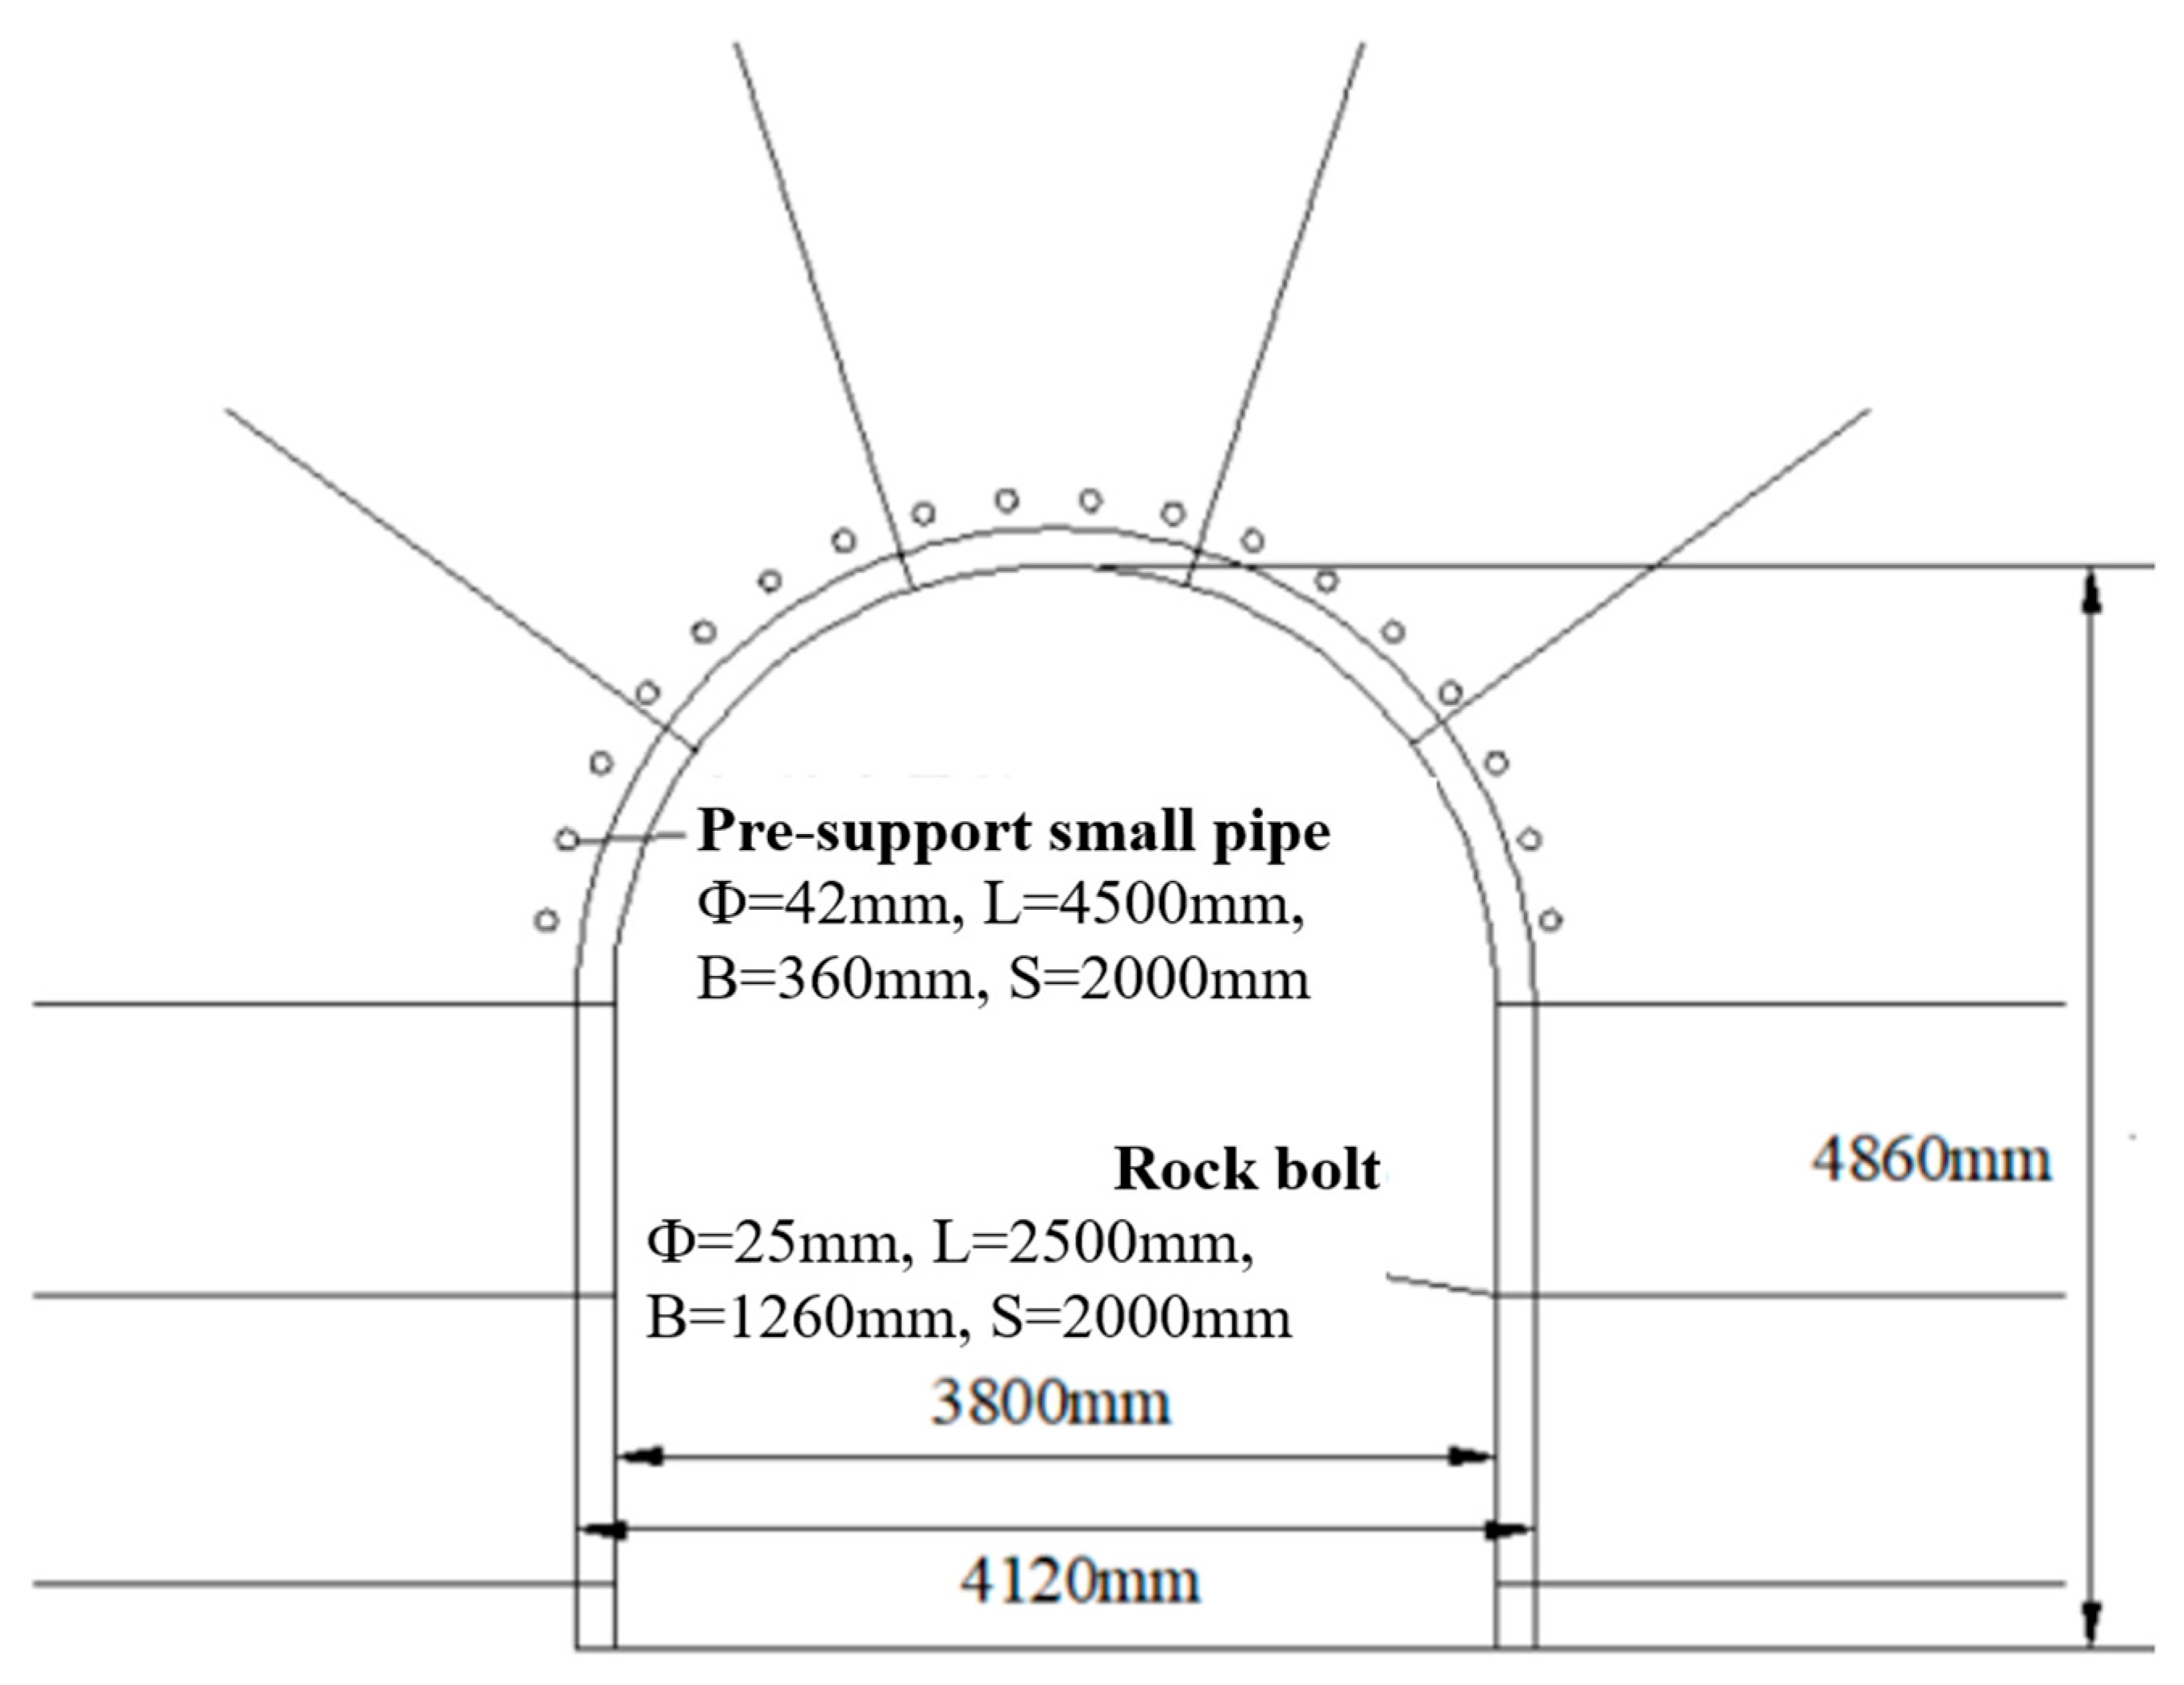
2. Project Overview
3. Tunnel Deformation Theory
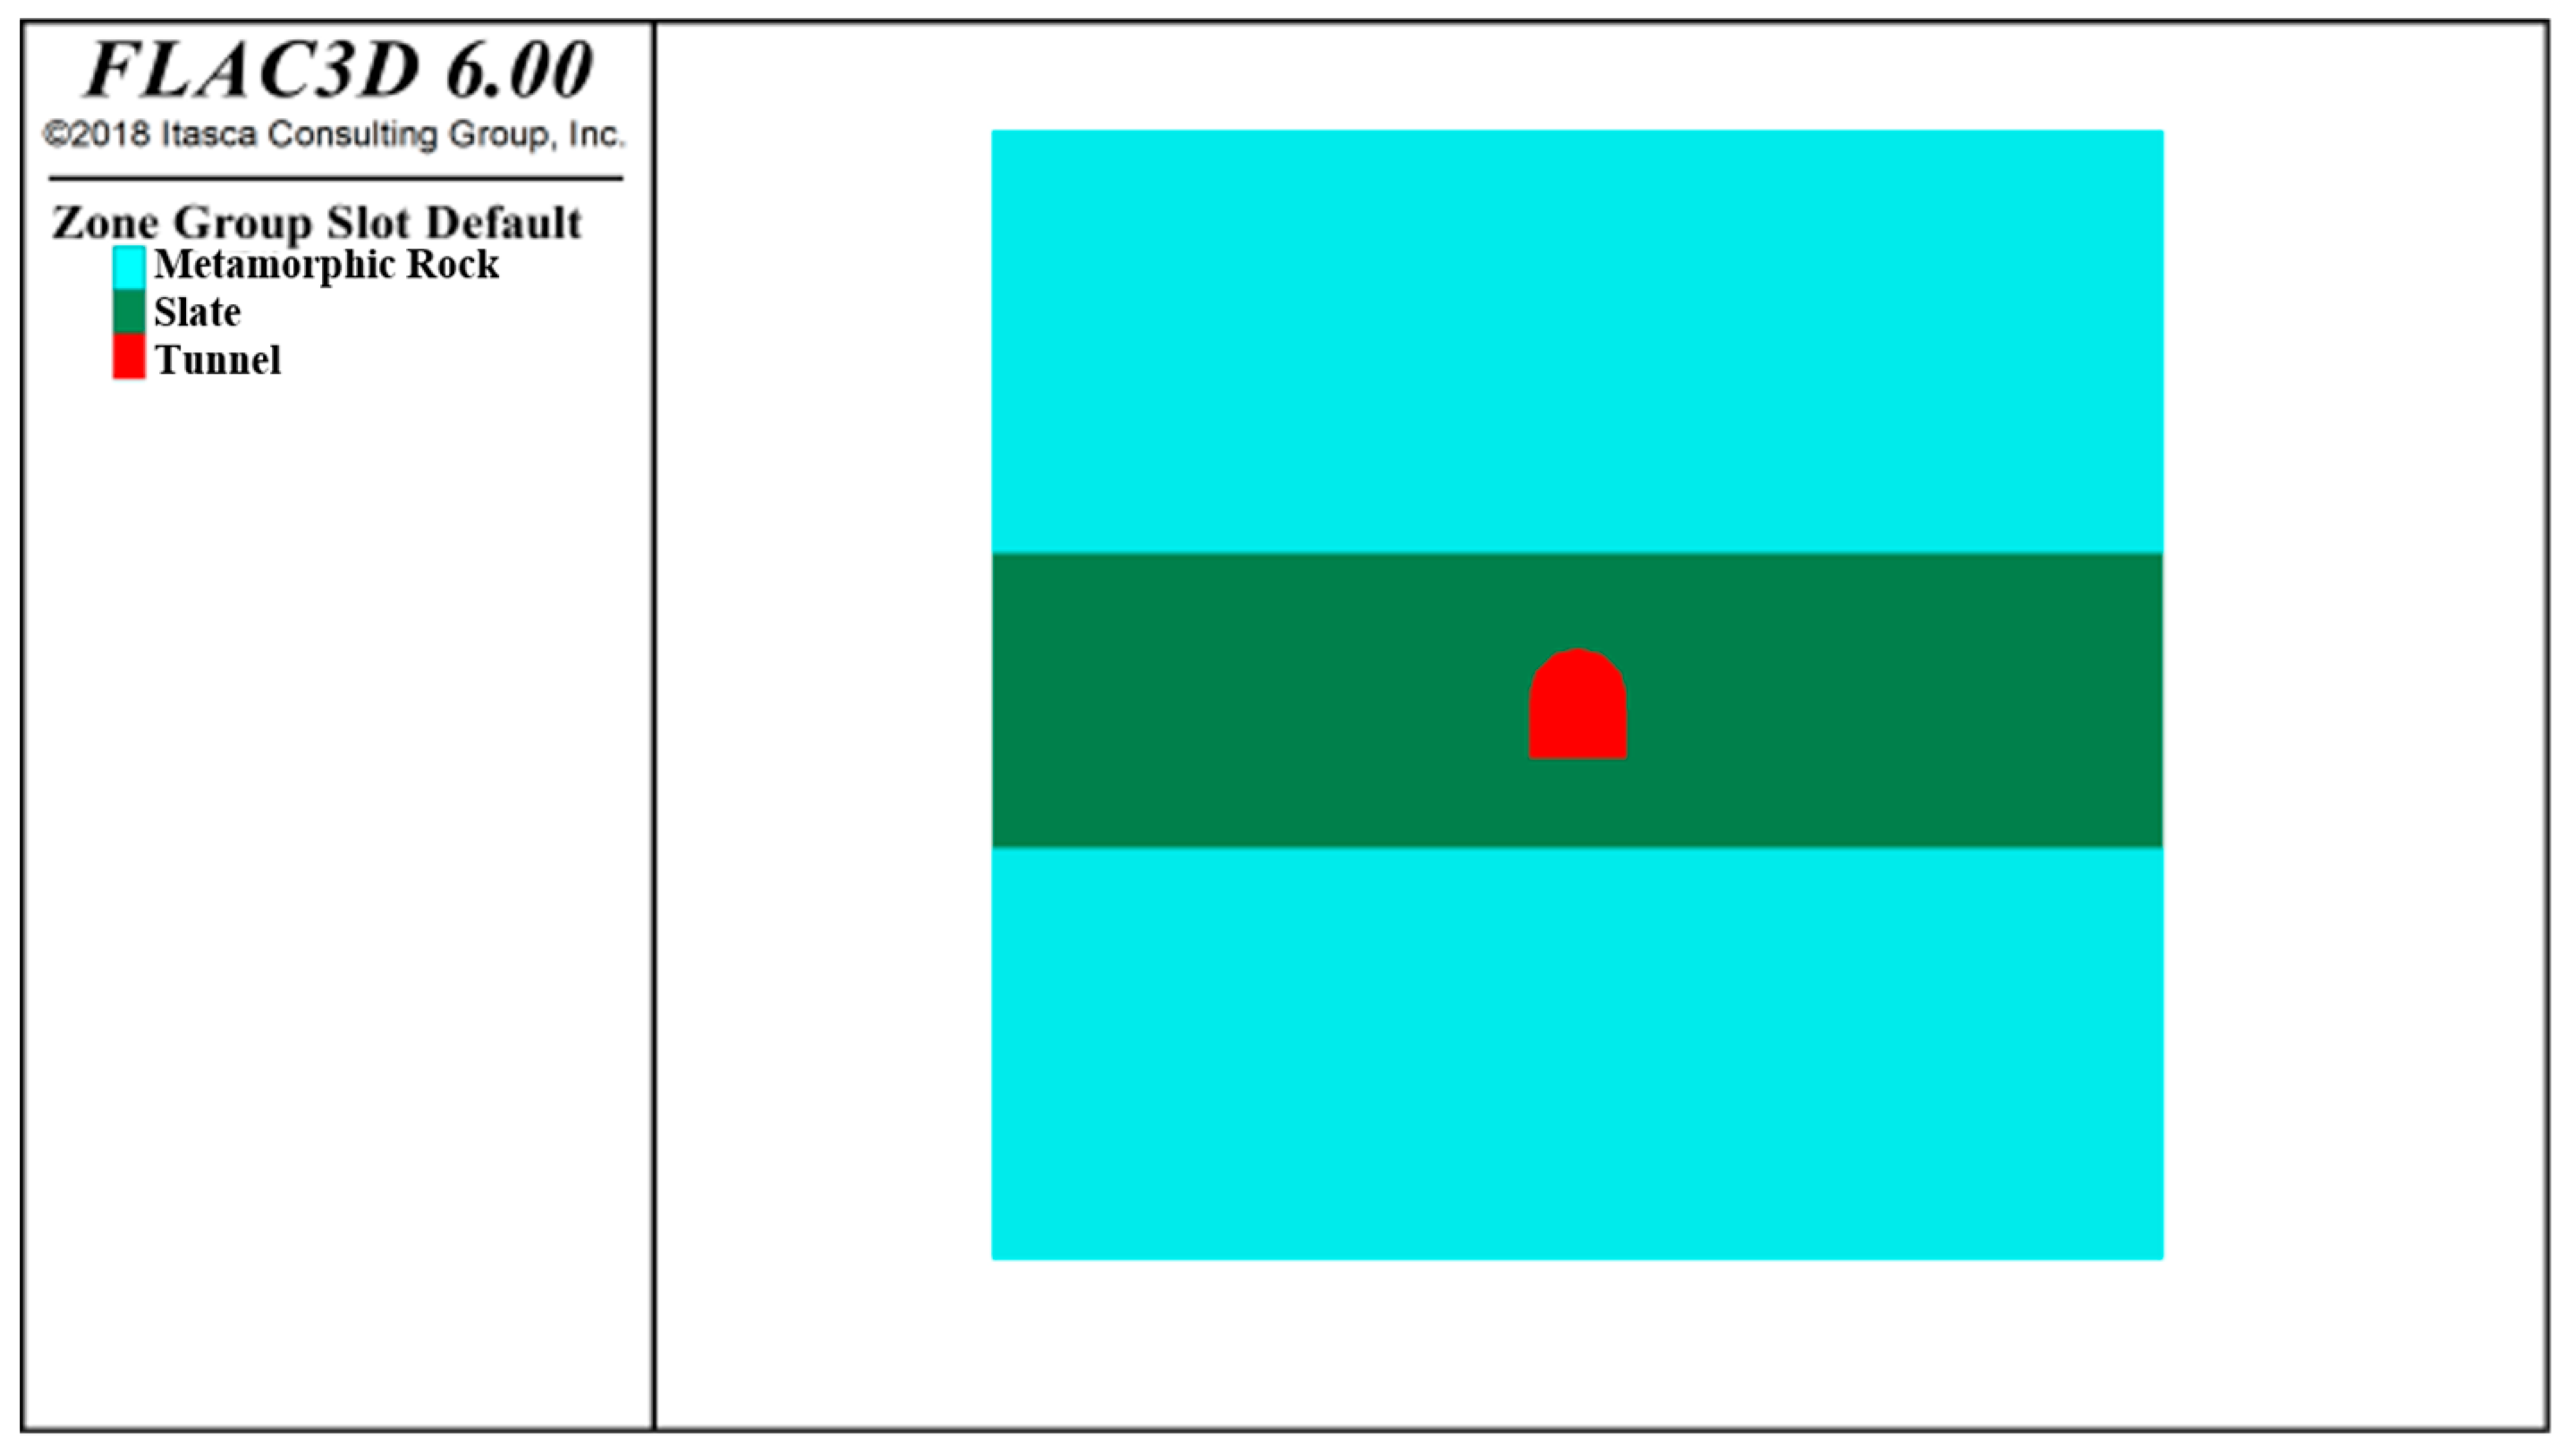
4. Numerical Simulation Analysis
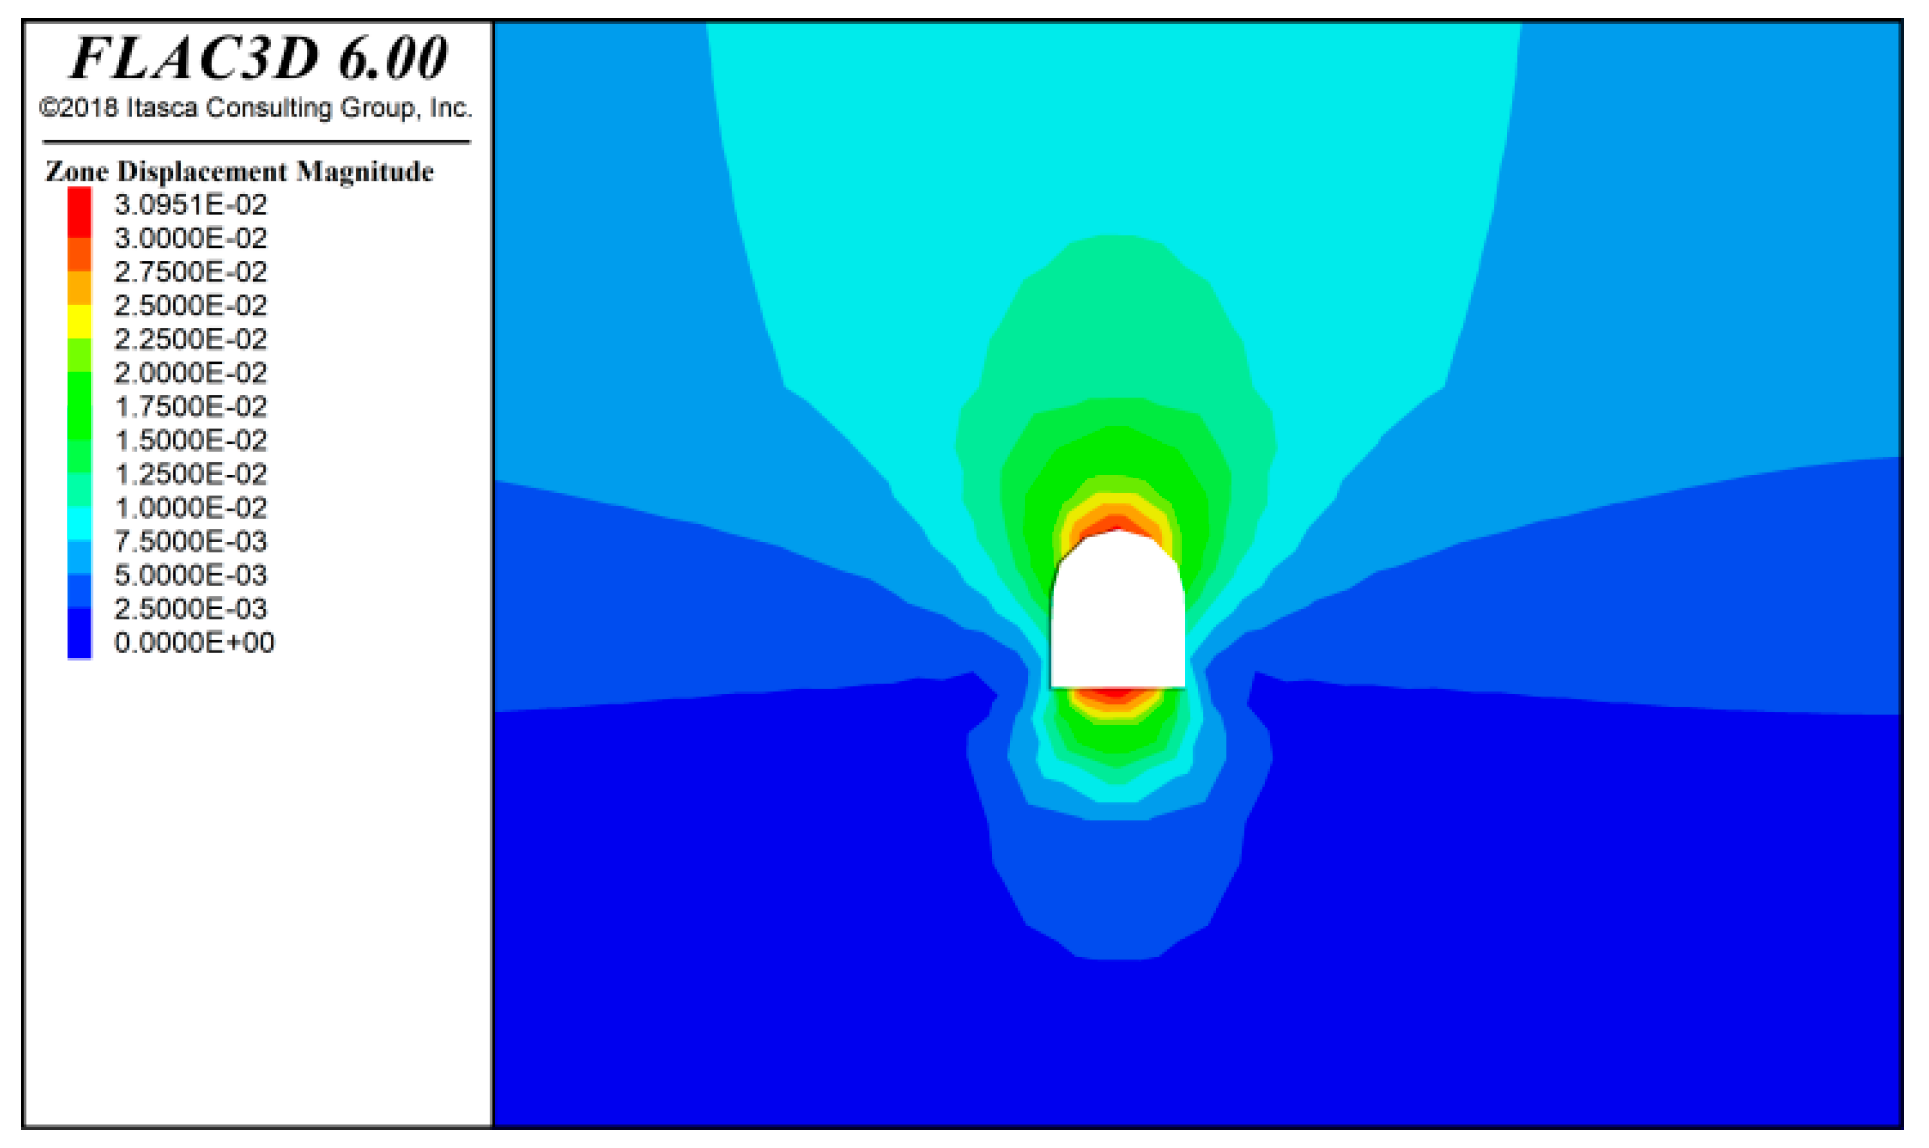
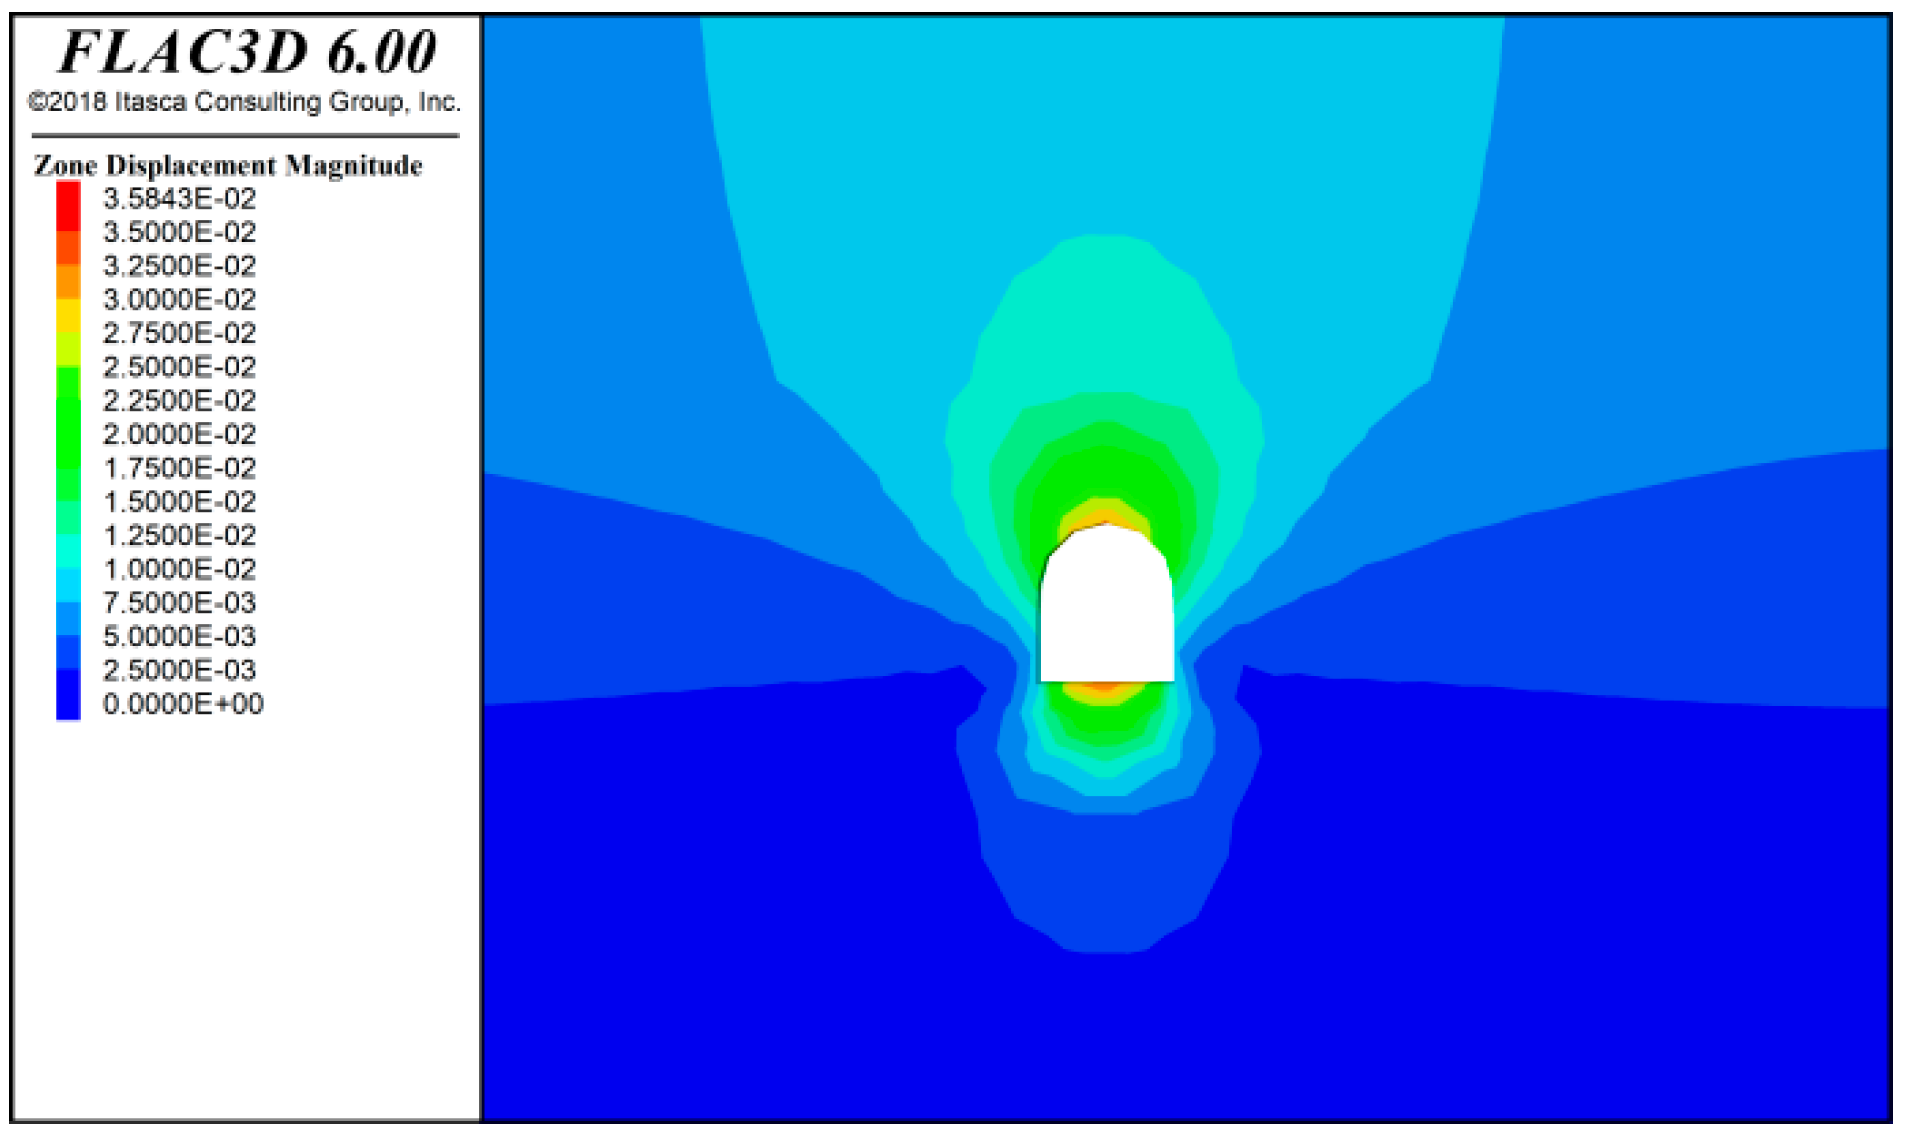
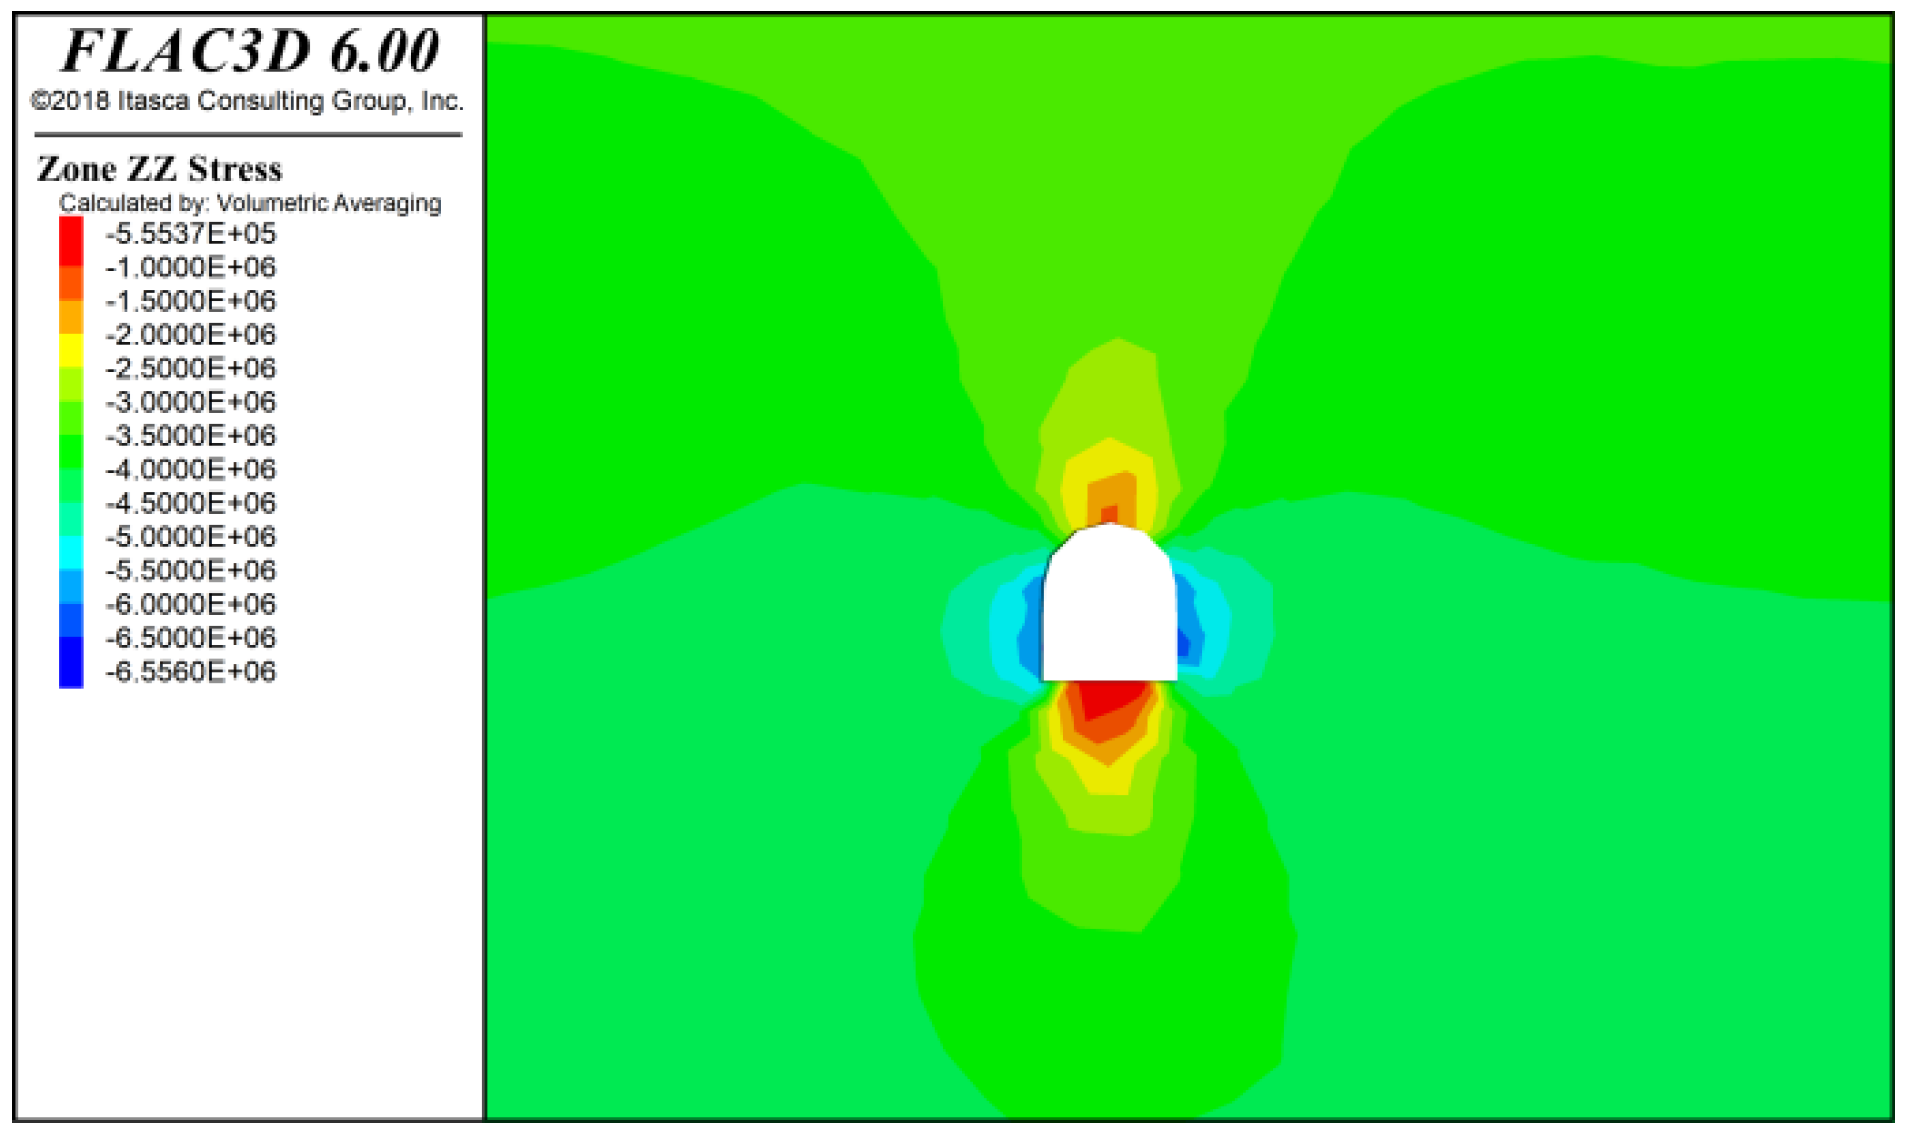
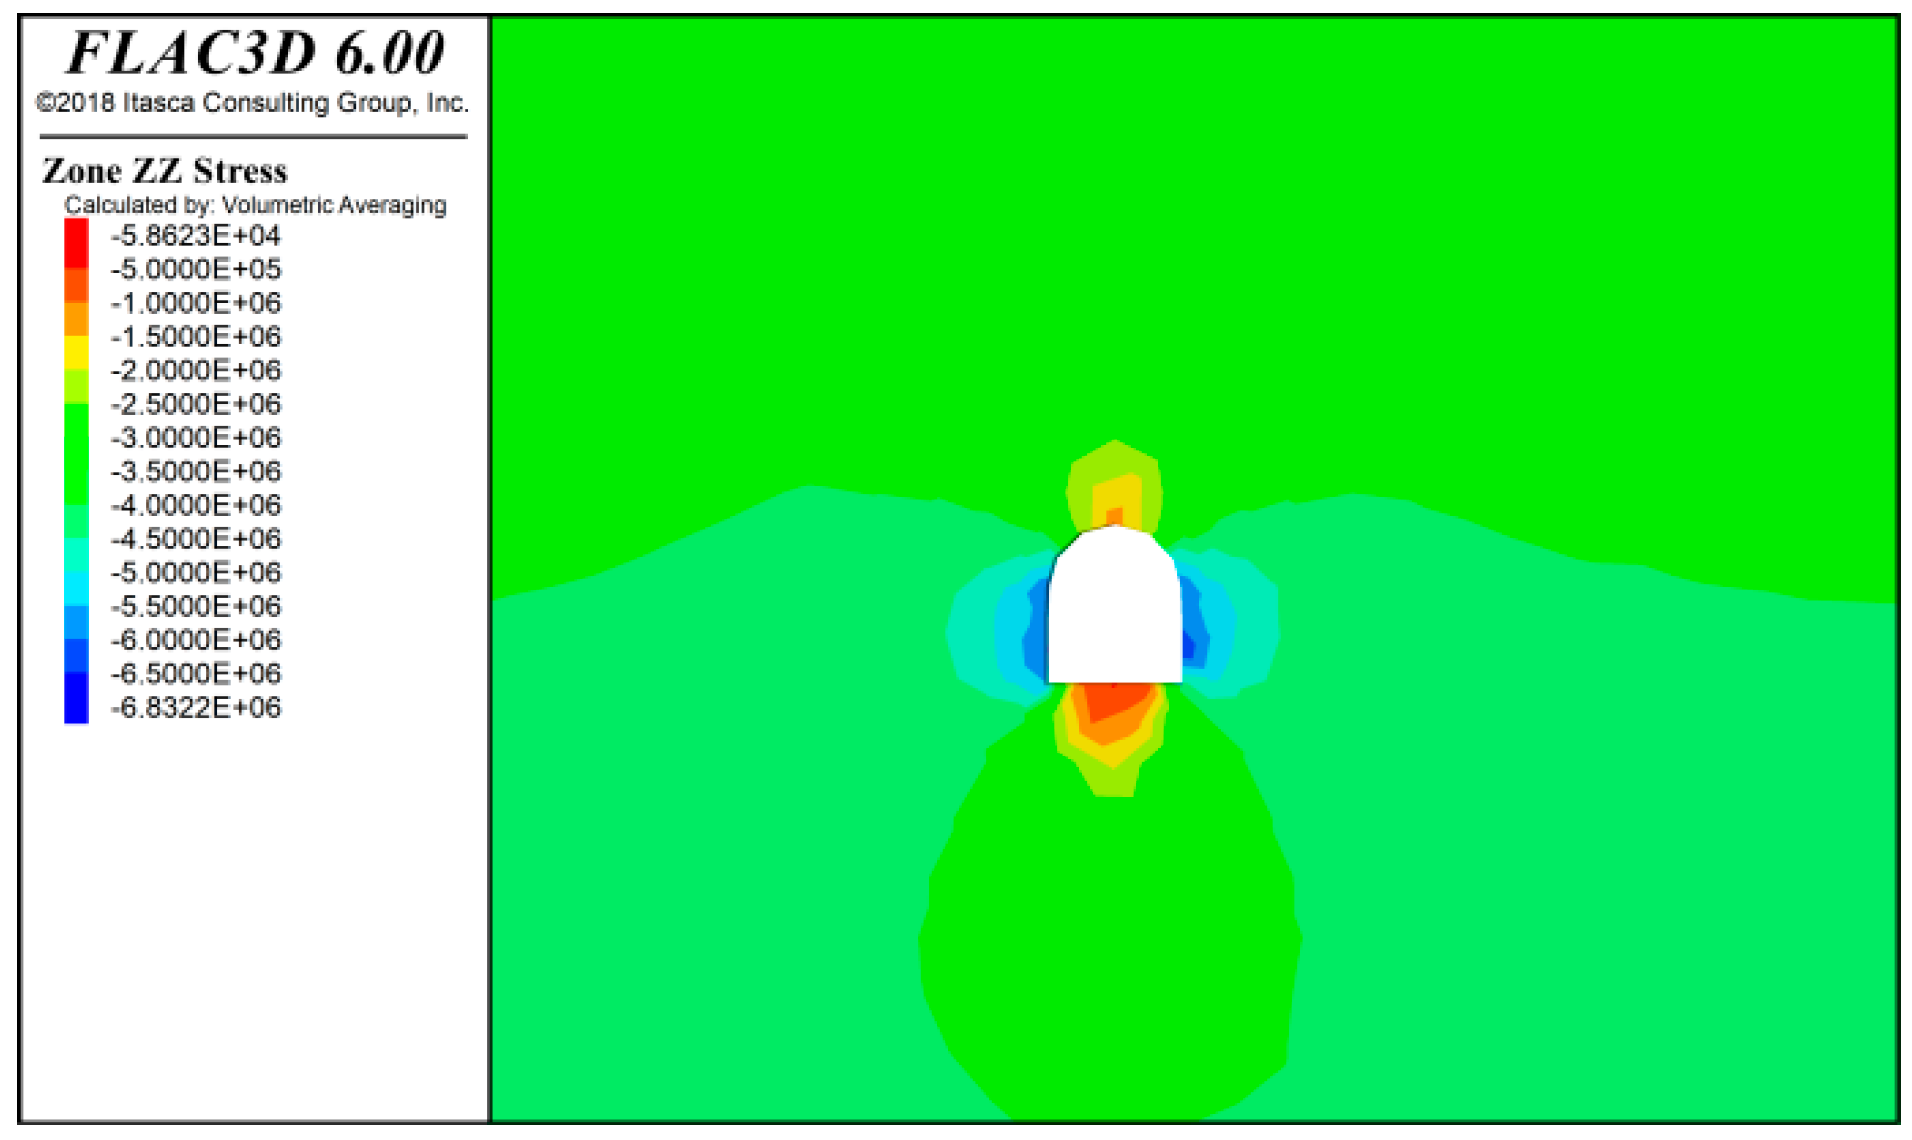
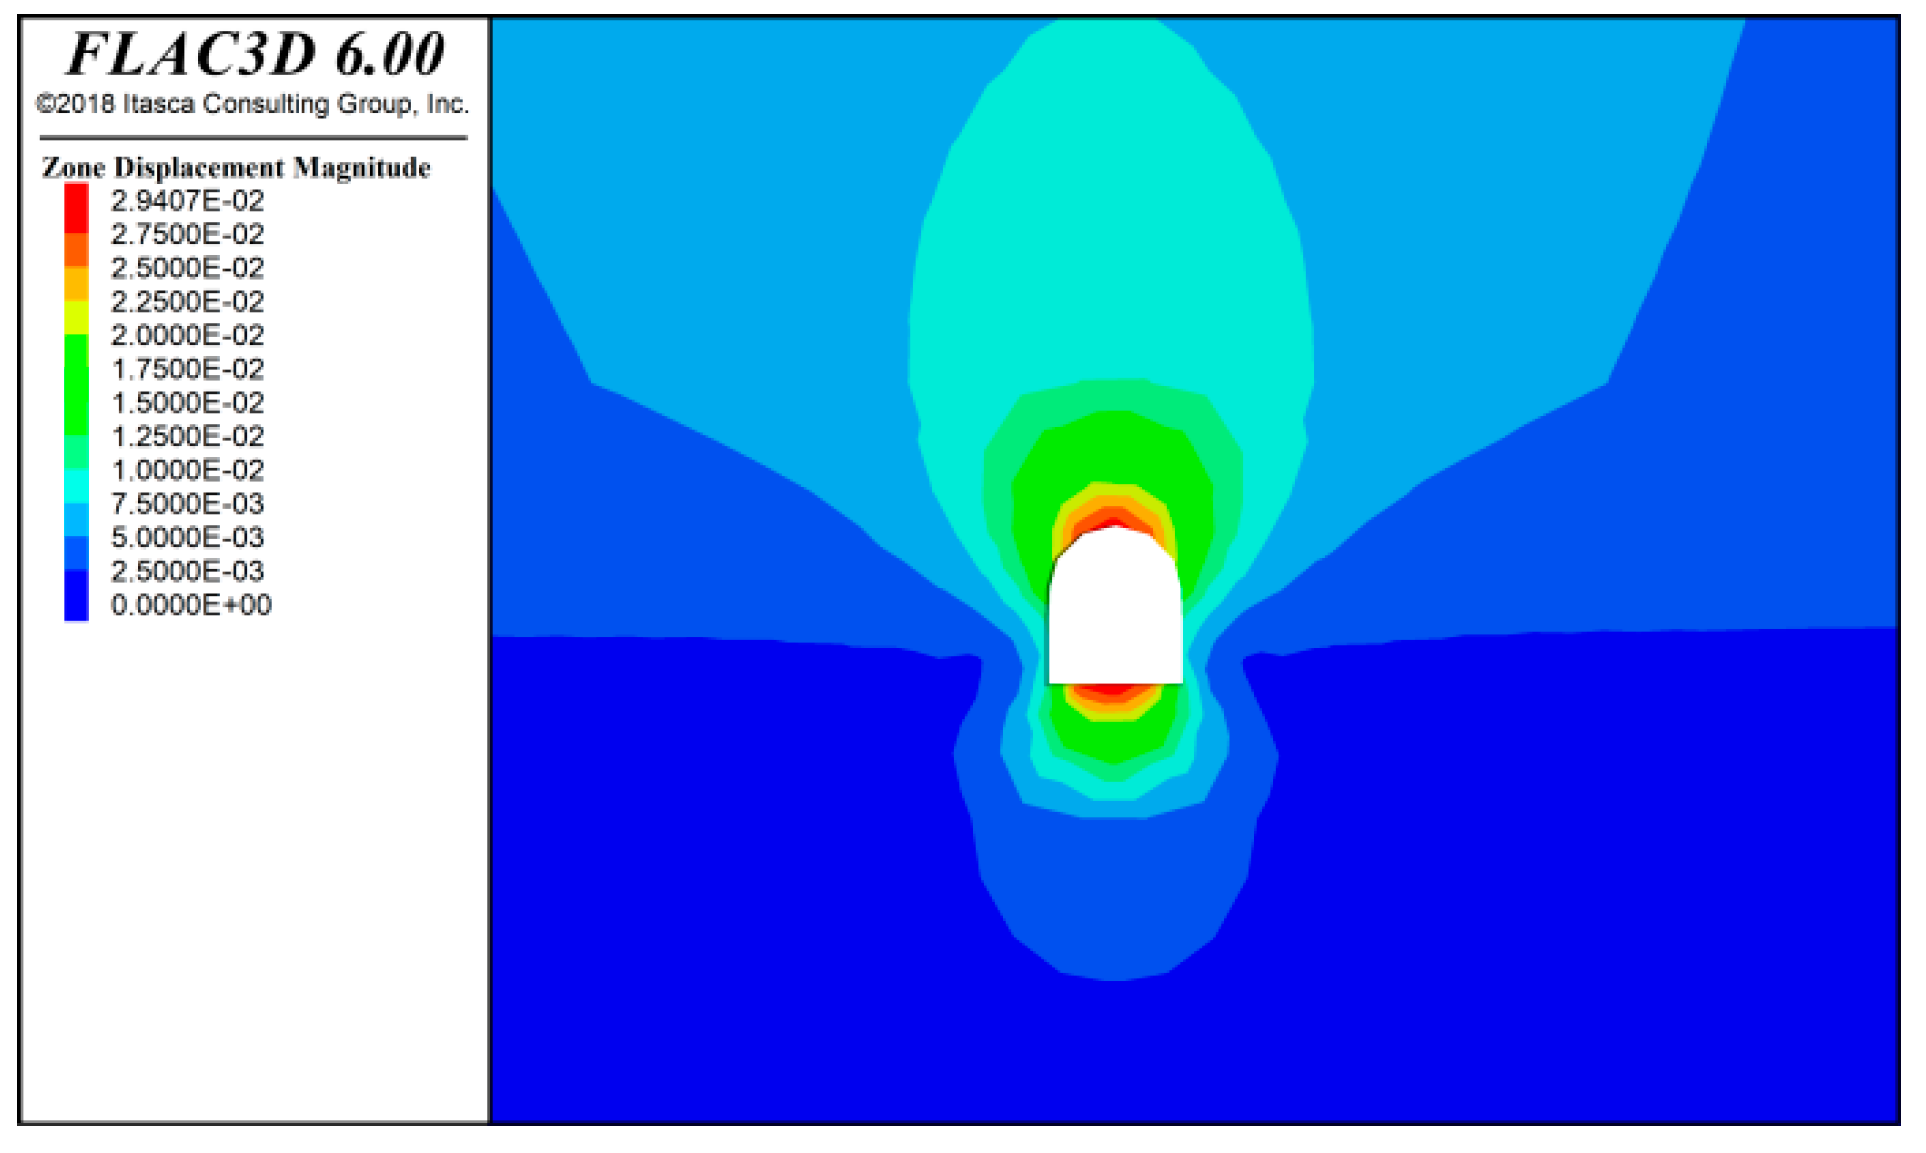
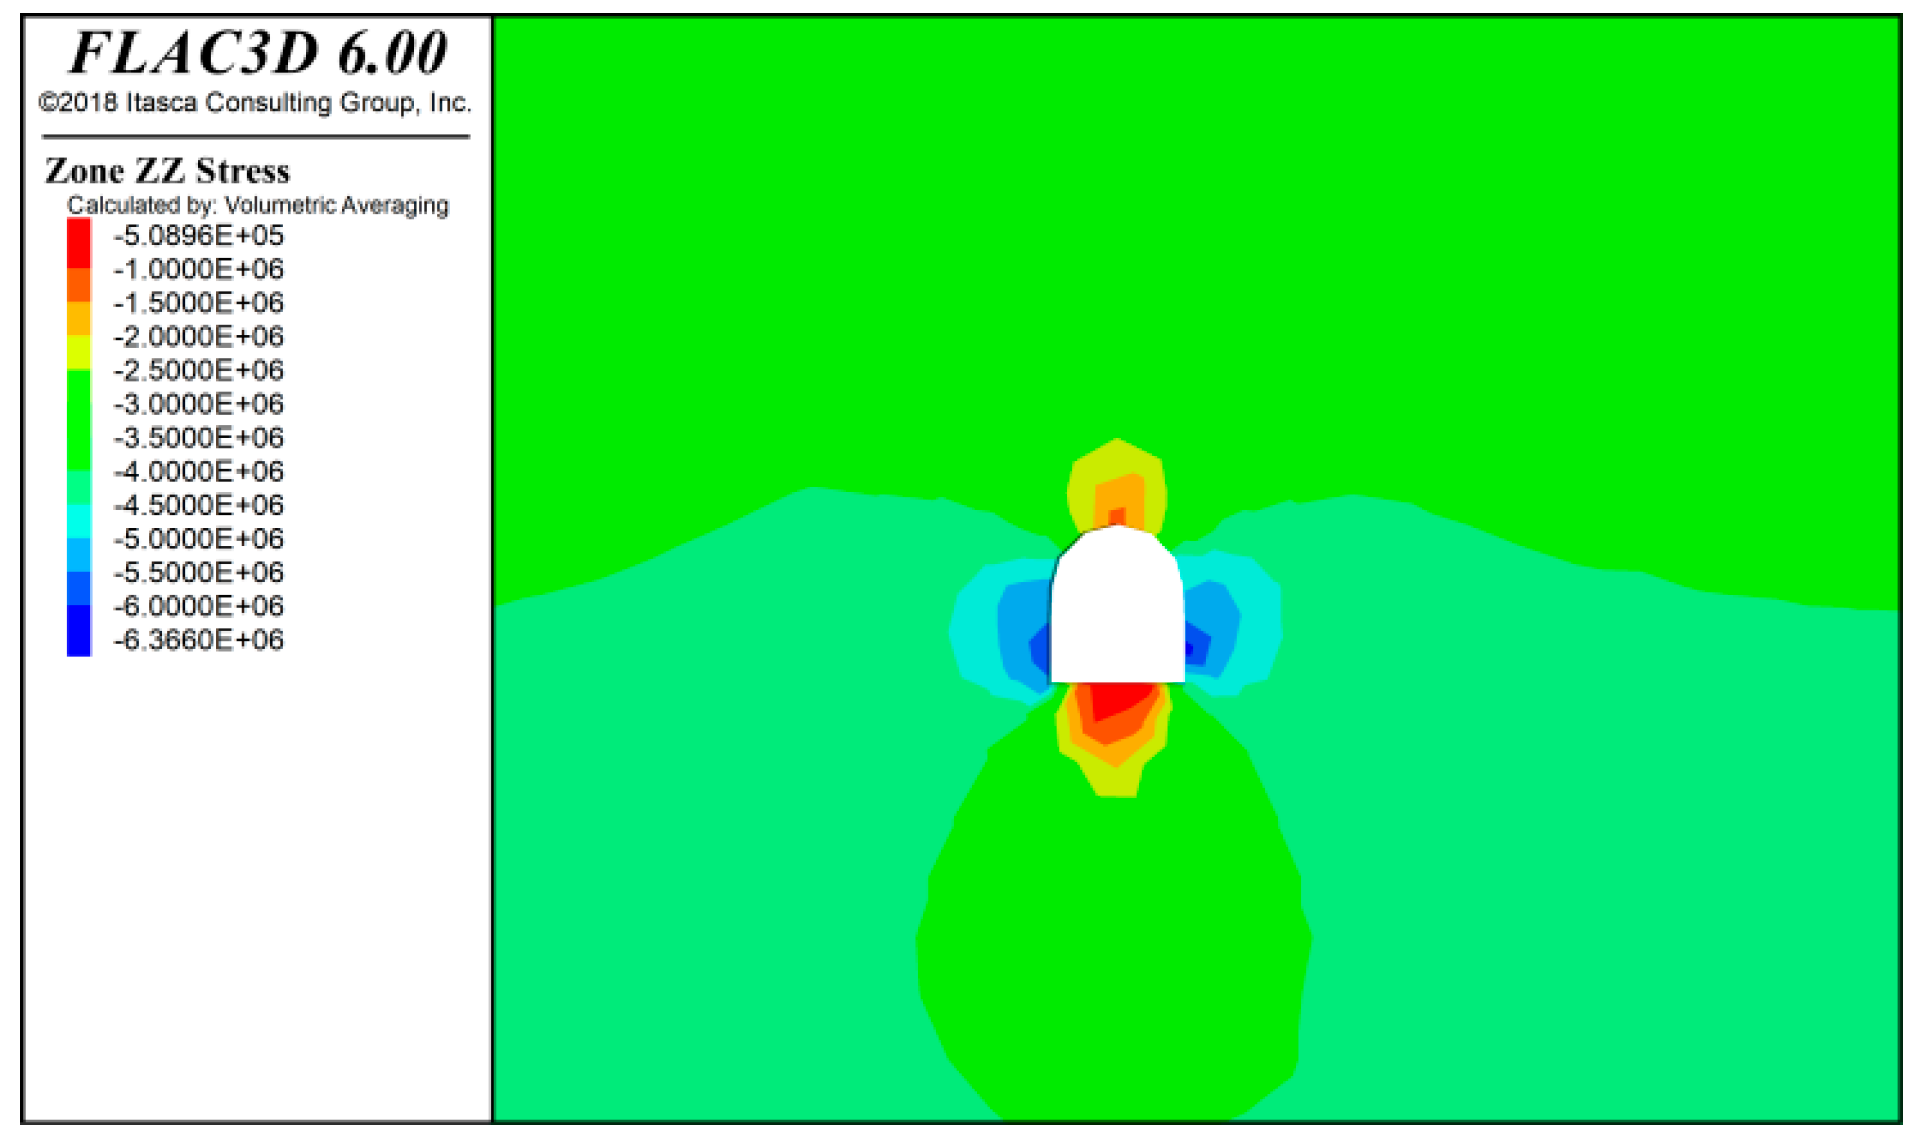
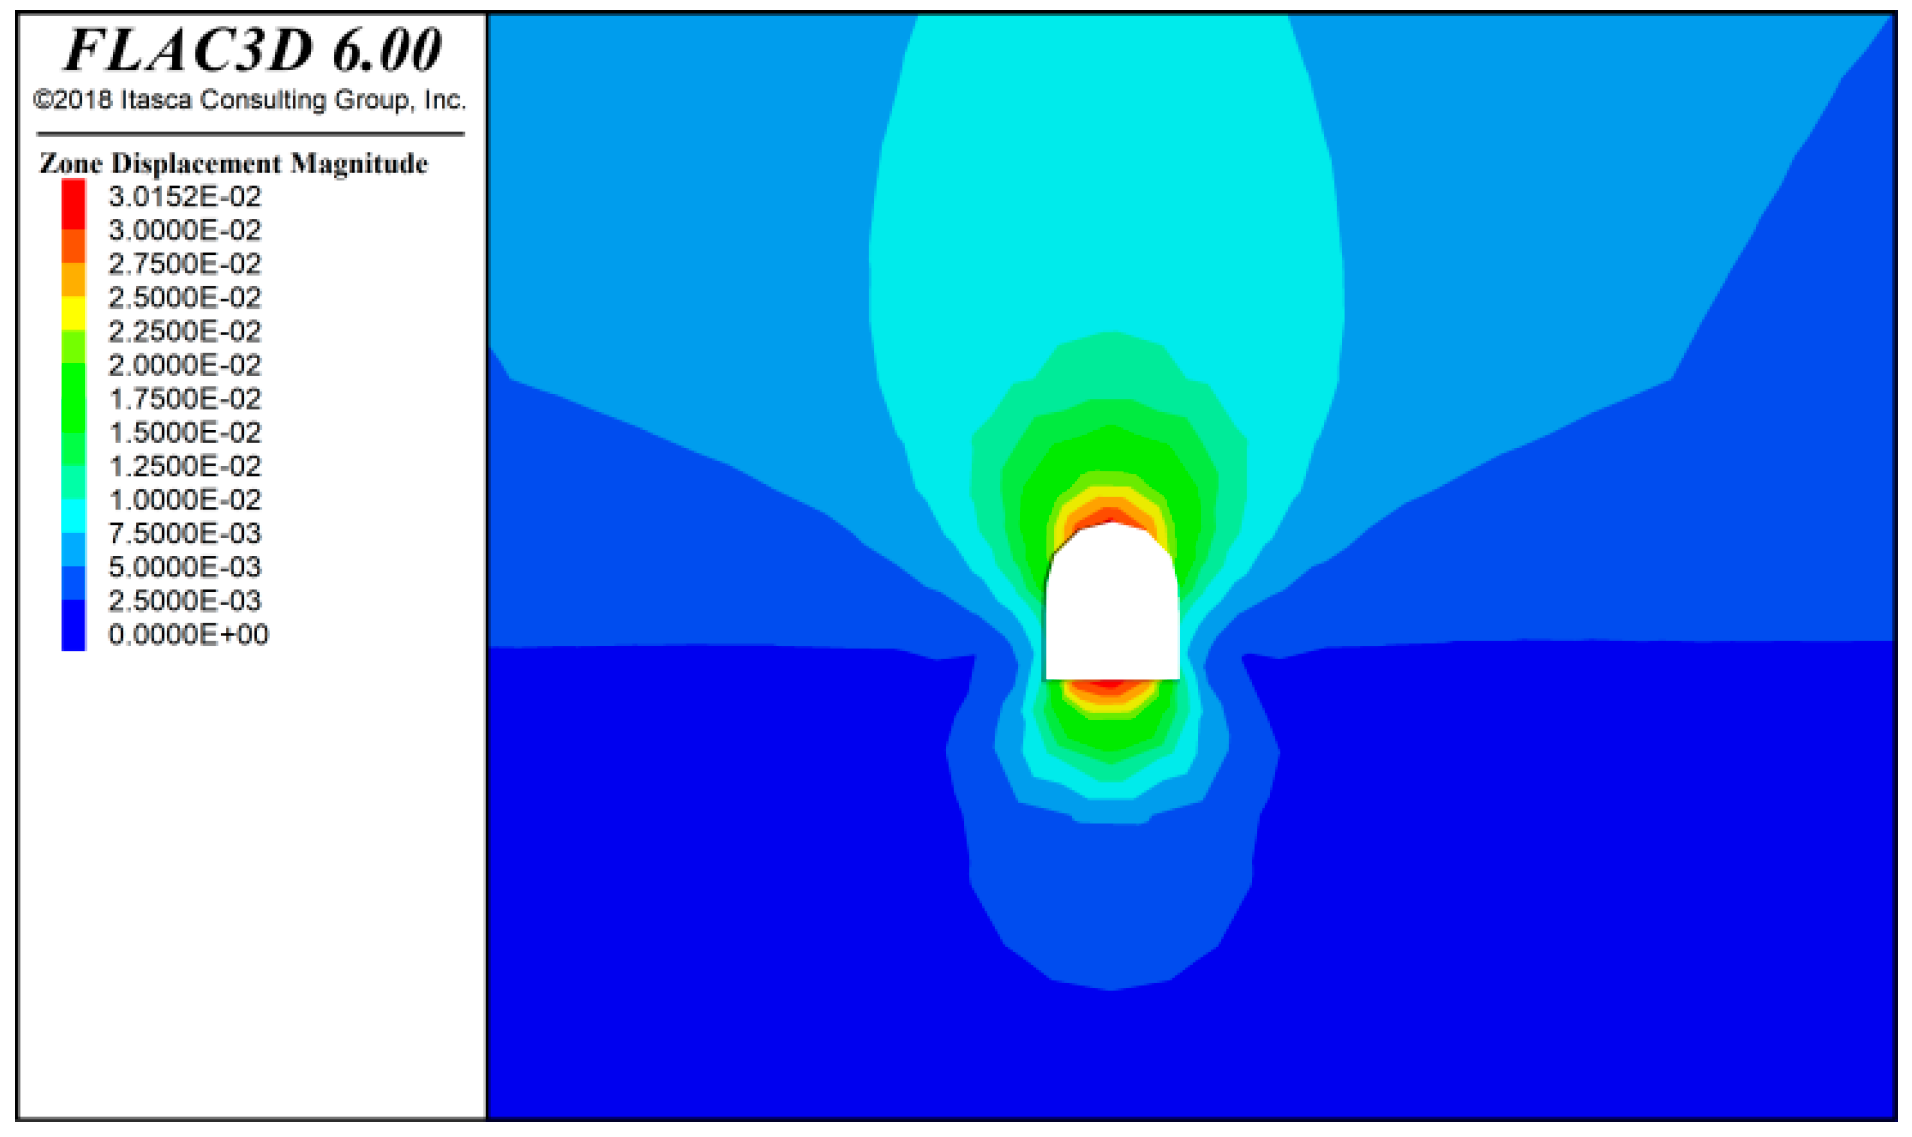
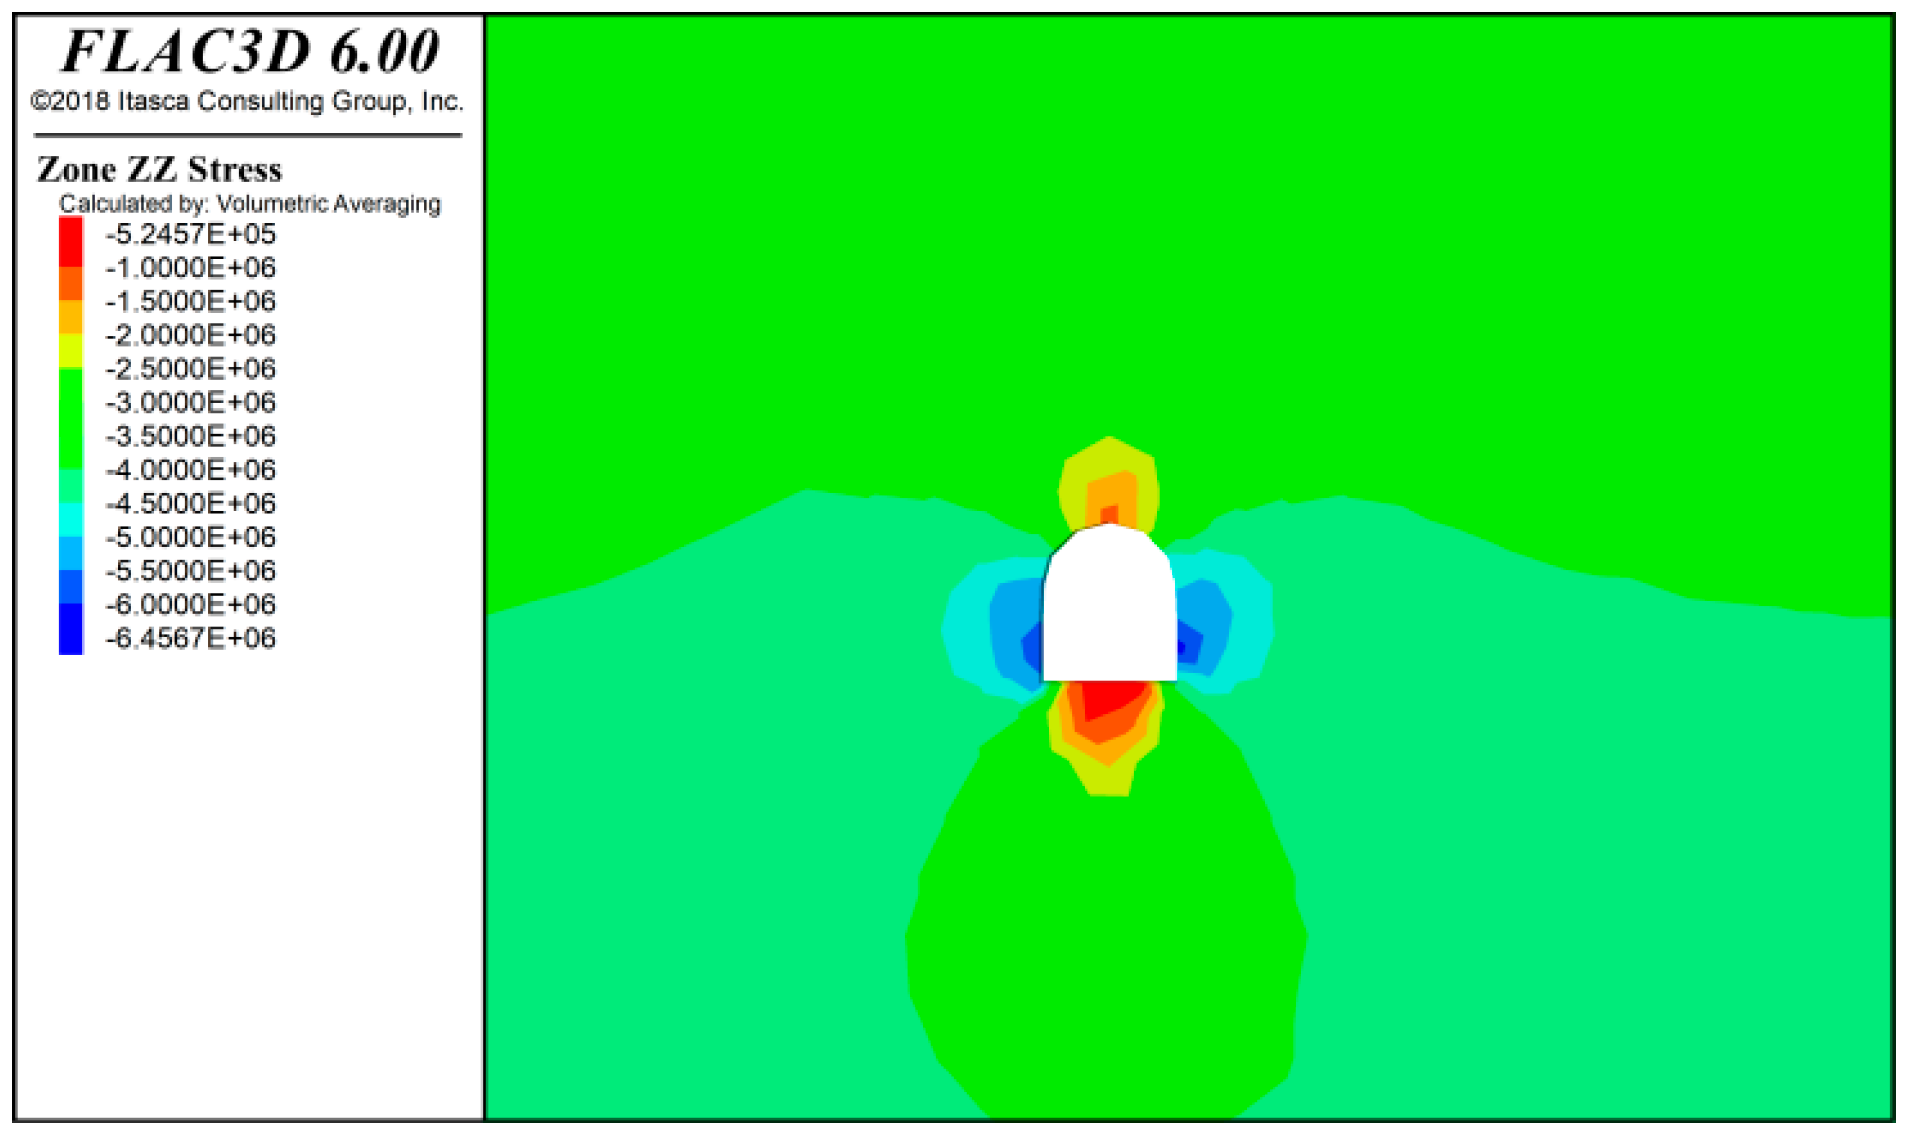
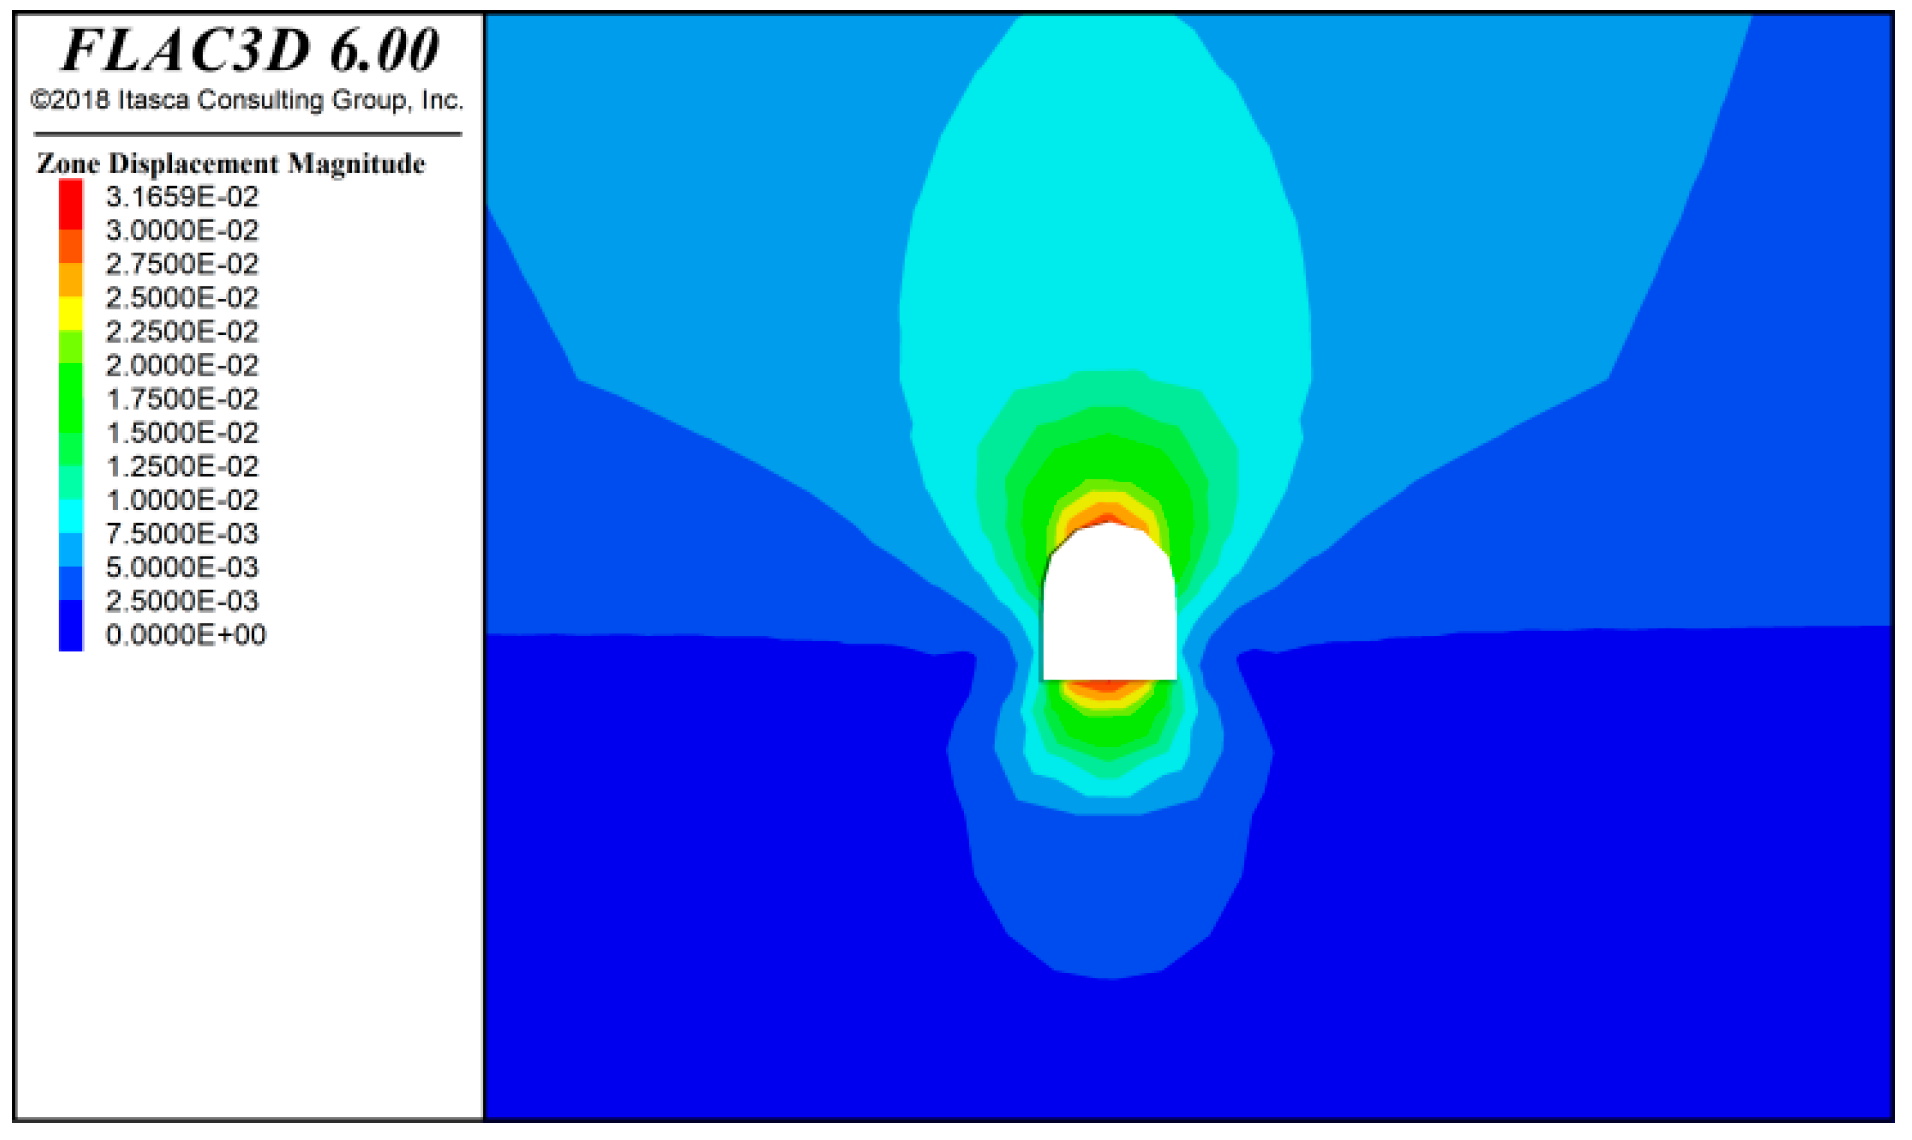
4.1. Analysis of Full-Face Excavation Results
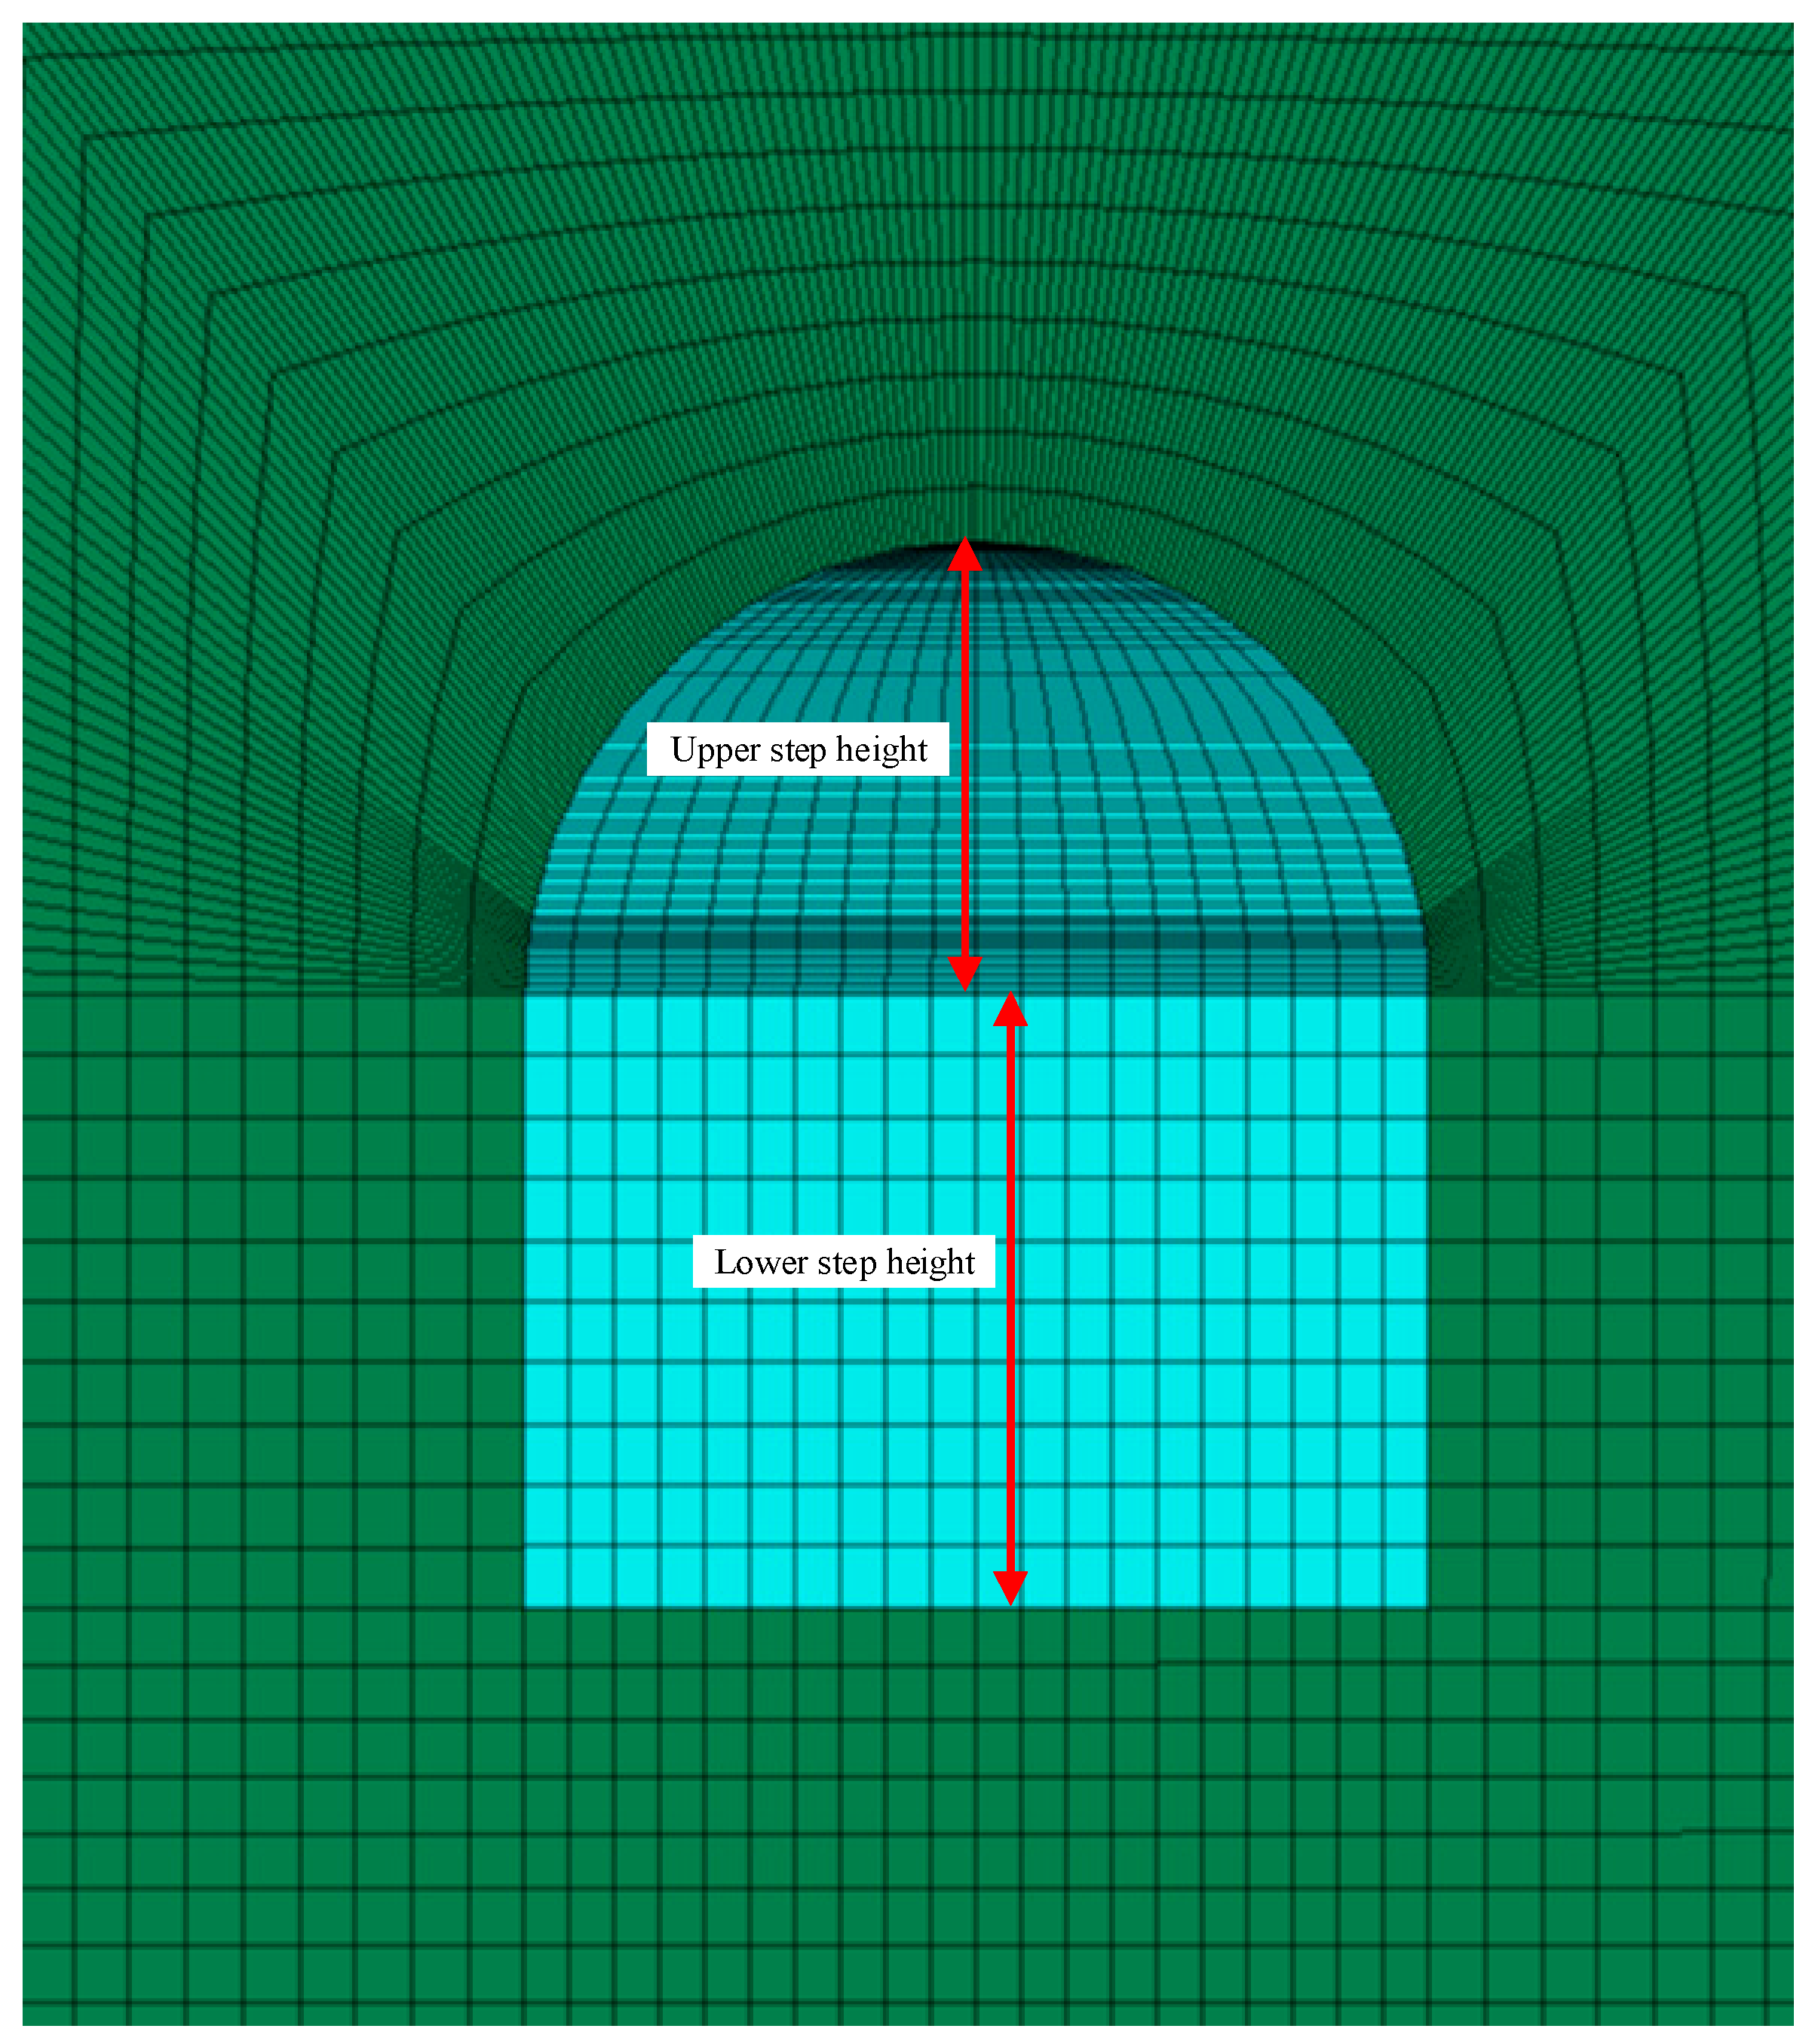
4.2. Determining the Step Height Parameters Based on the NSGA-II Multi-Objective Optimization Algorithm
4.2.1. Step Height Parameter Optimization Problem
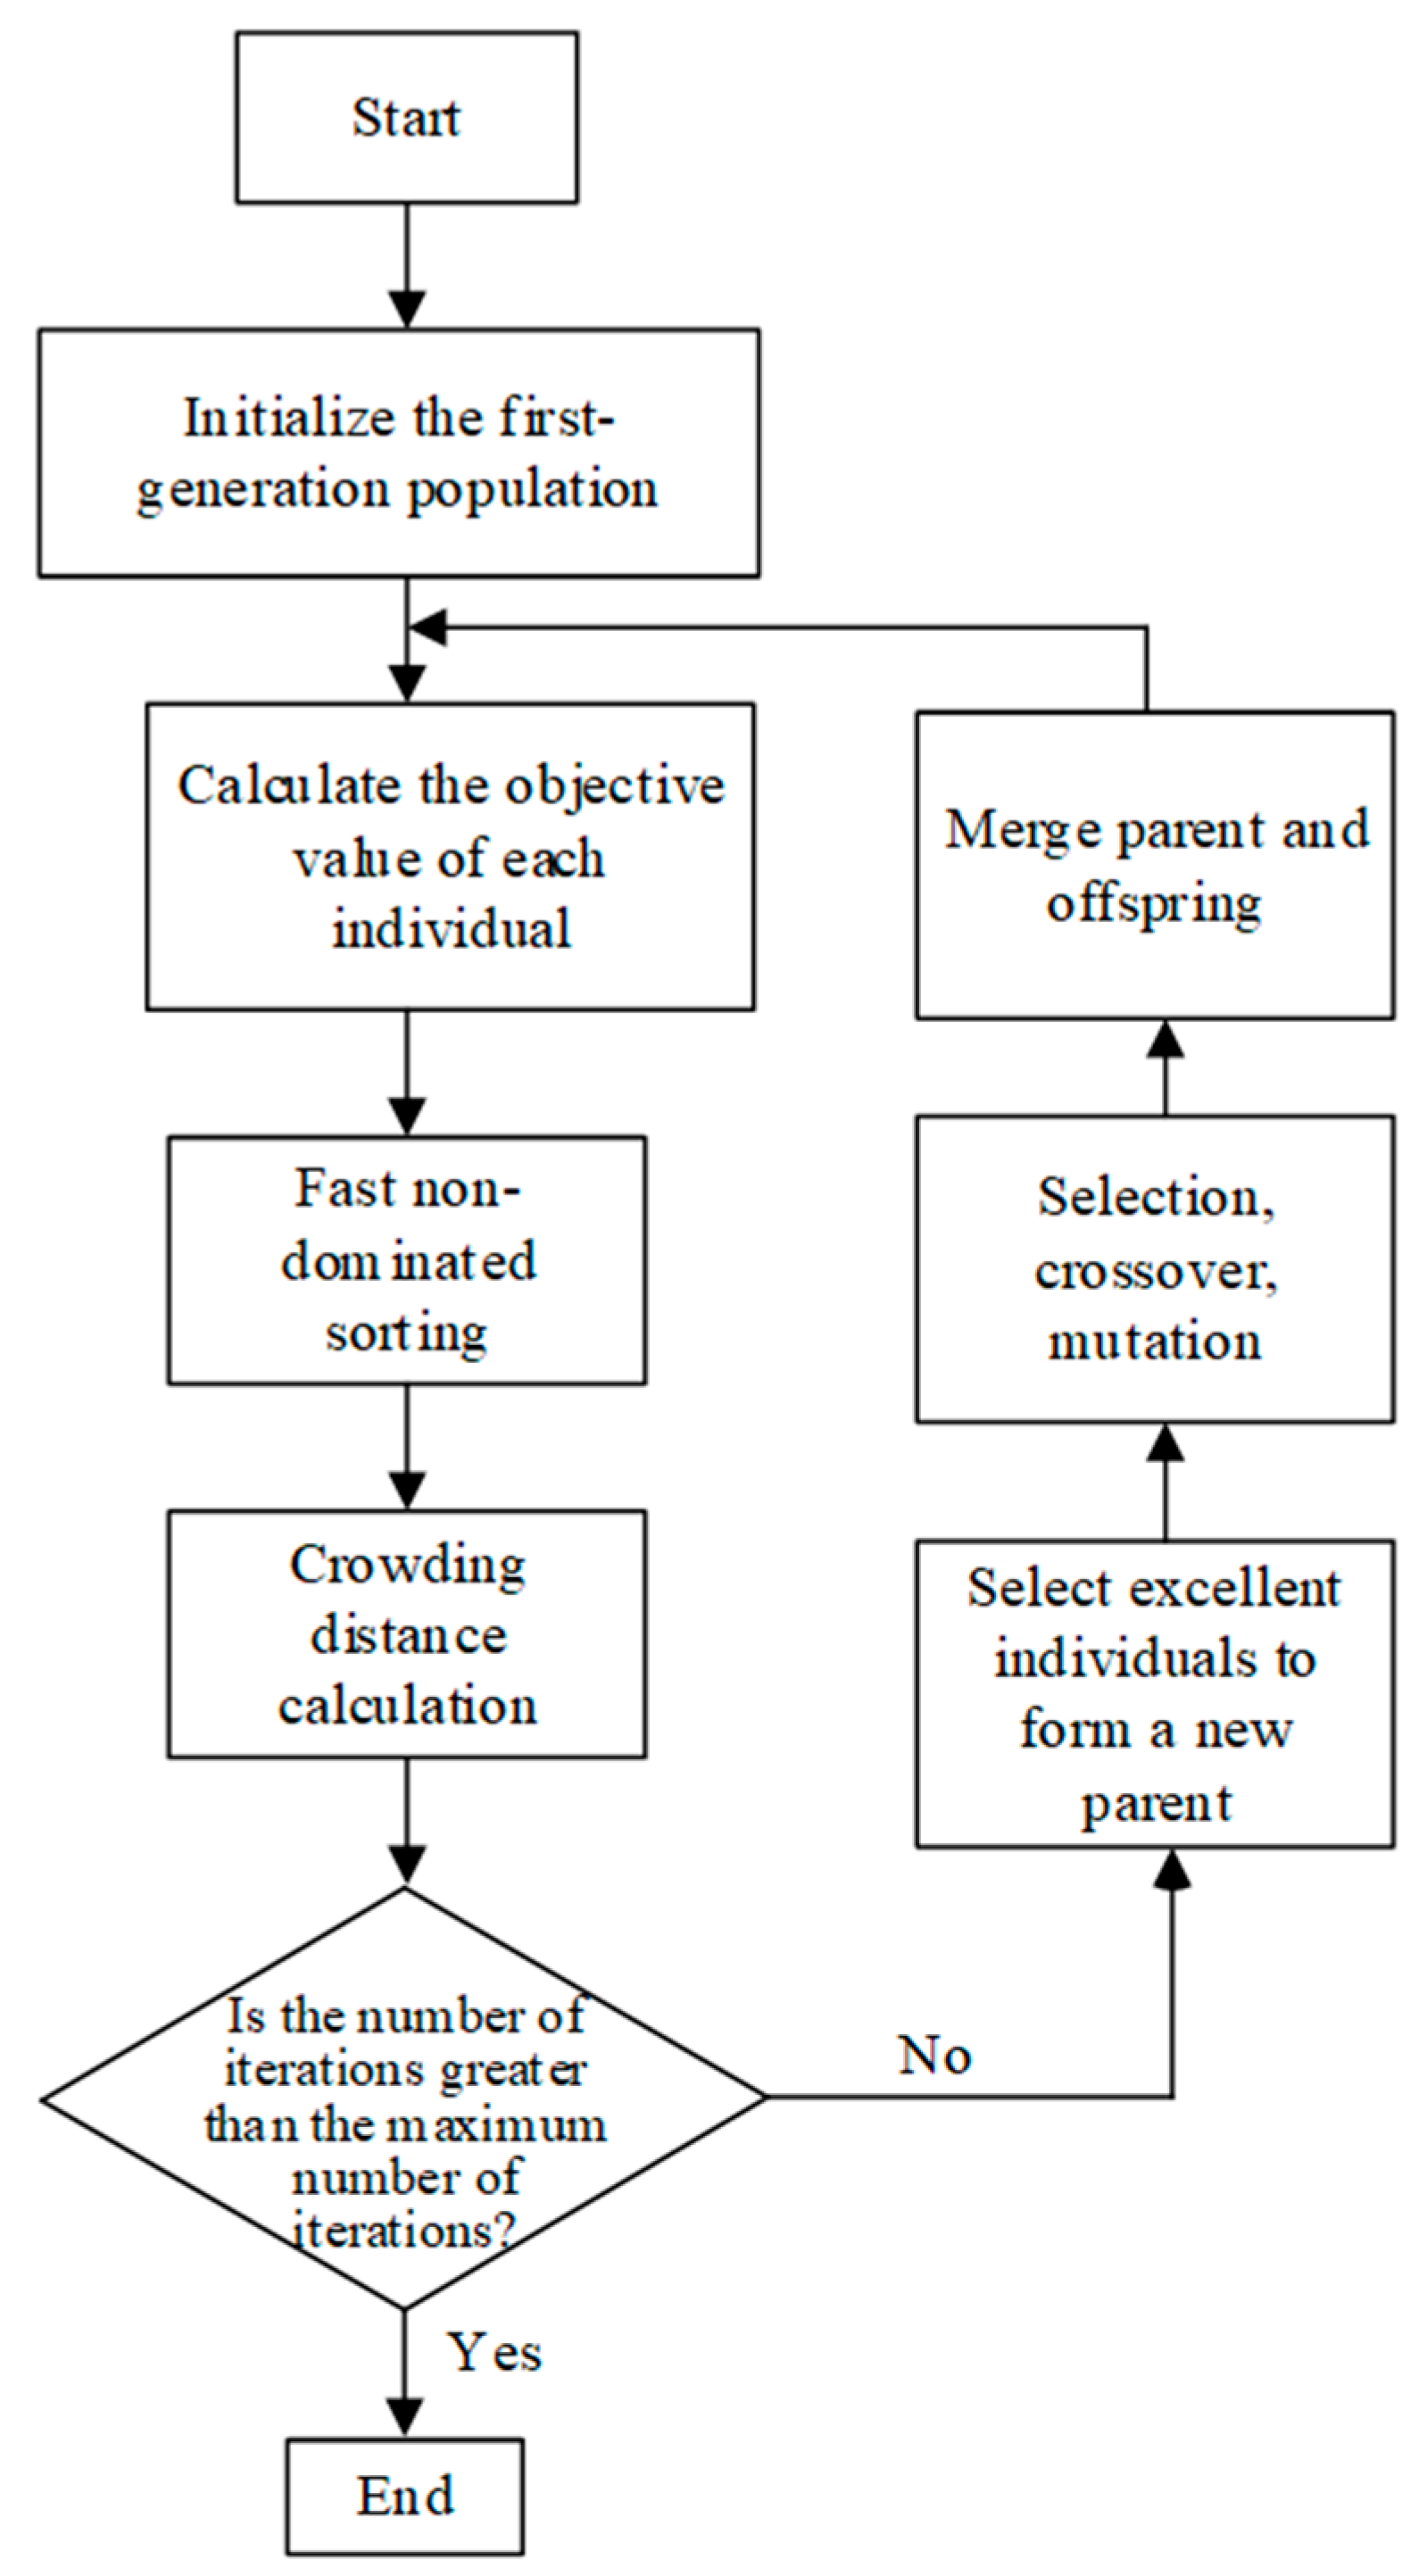
4.2.2. NSGA-II Optimization Algorithm
4.2.3. Determining the Optimal Step Parameters Based on the NSGA-II Optimization Algorithm
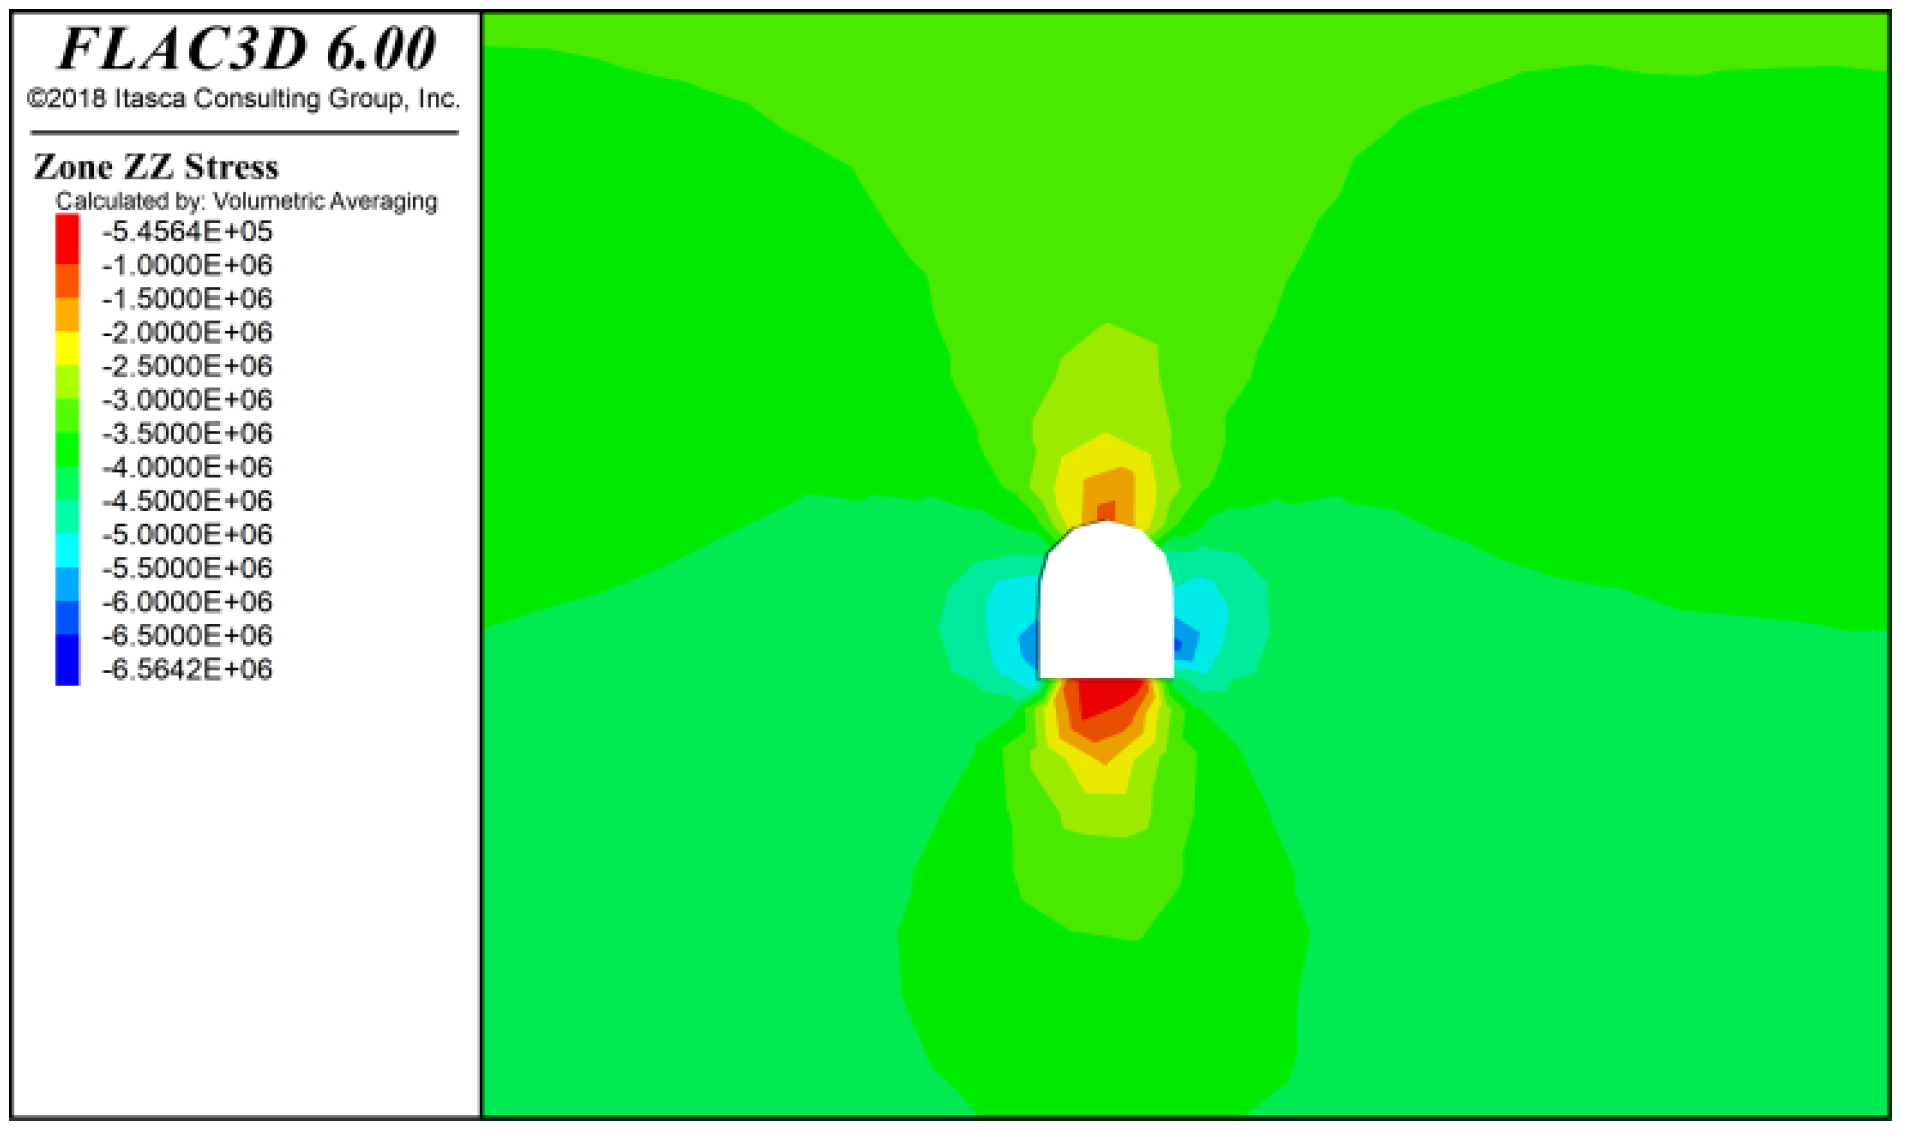
4.2.4. Analysis of Calculation Results
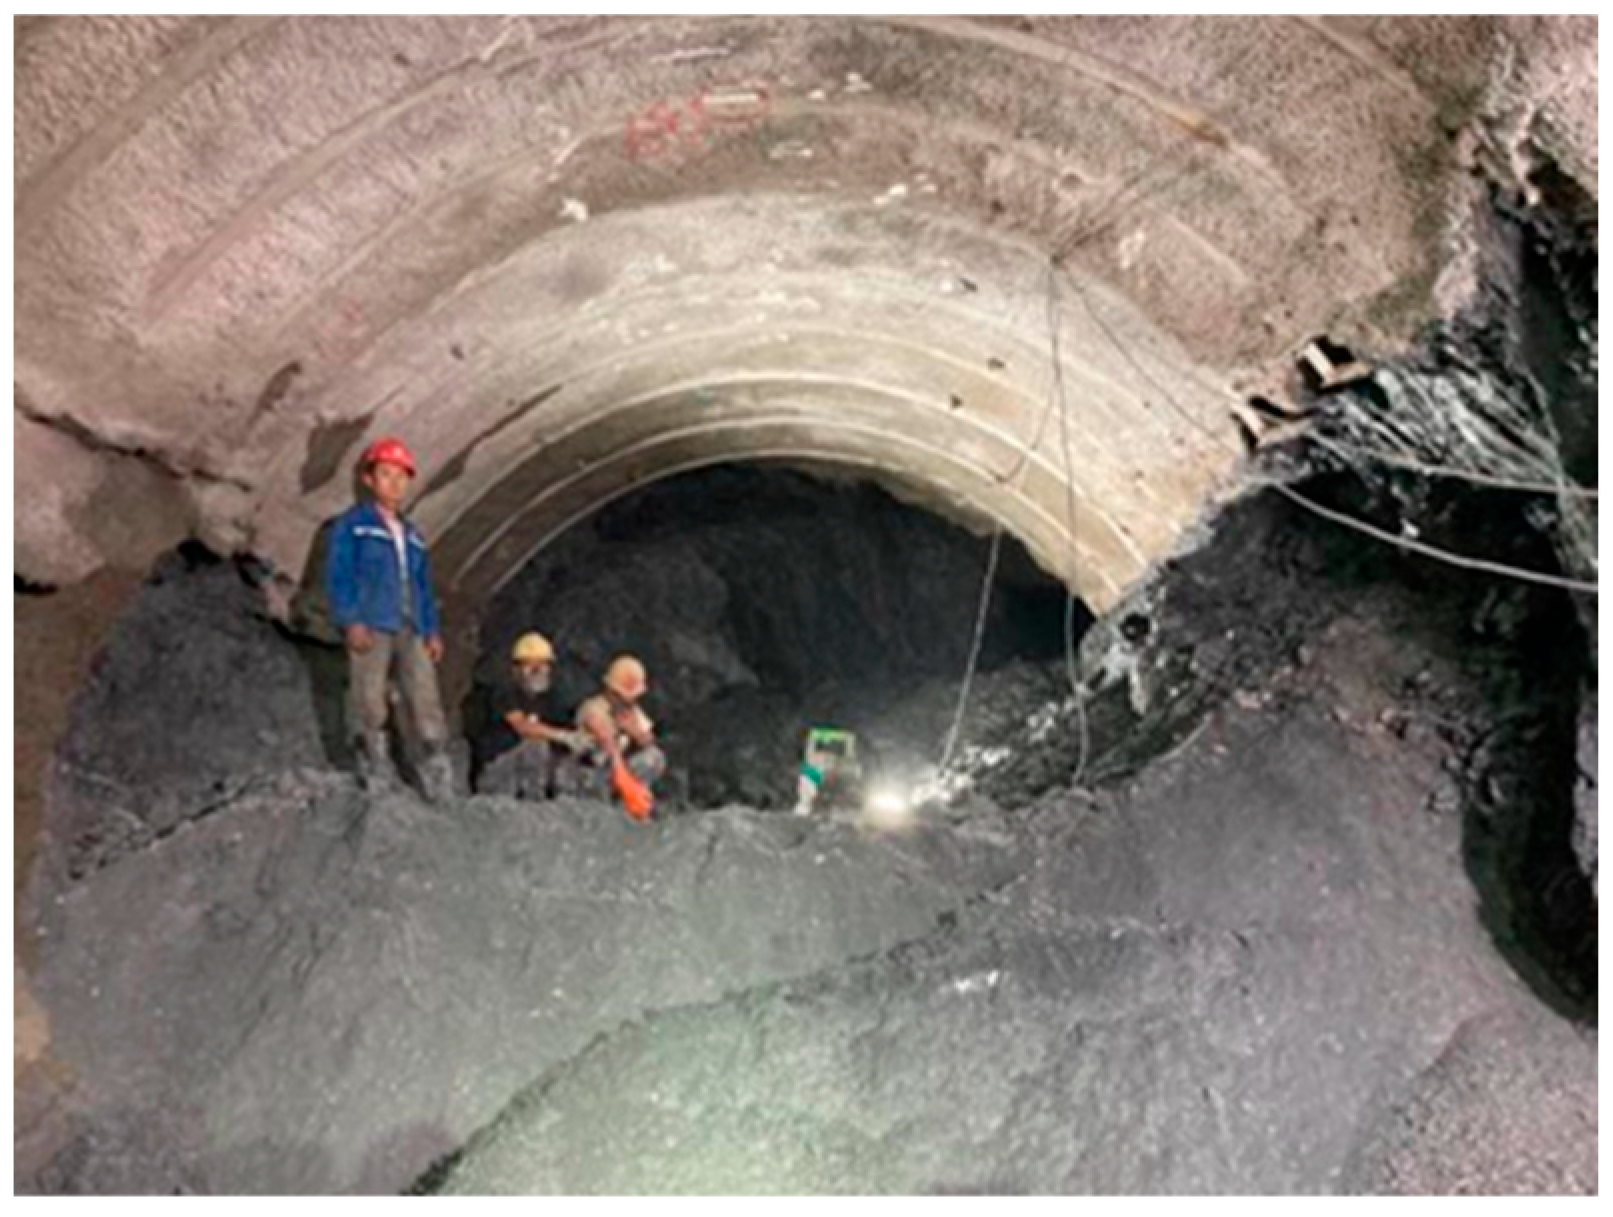
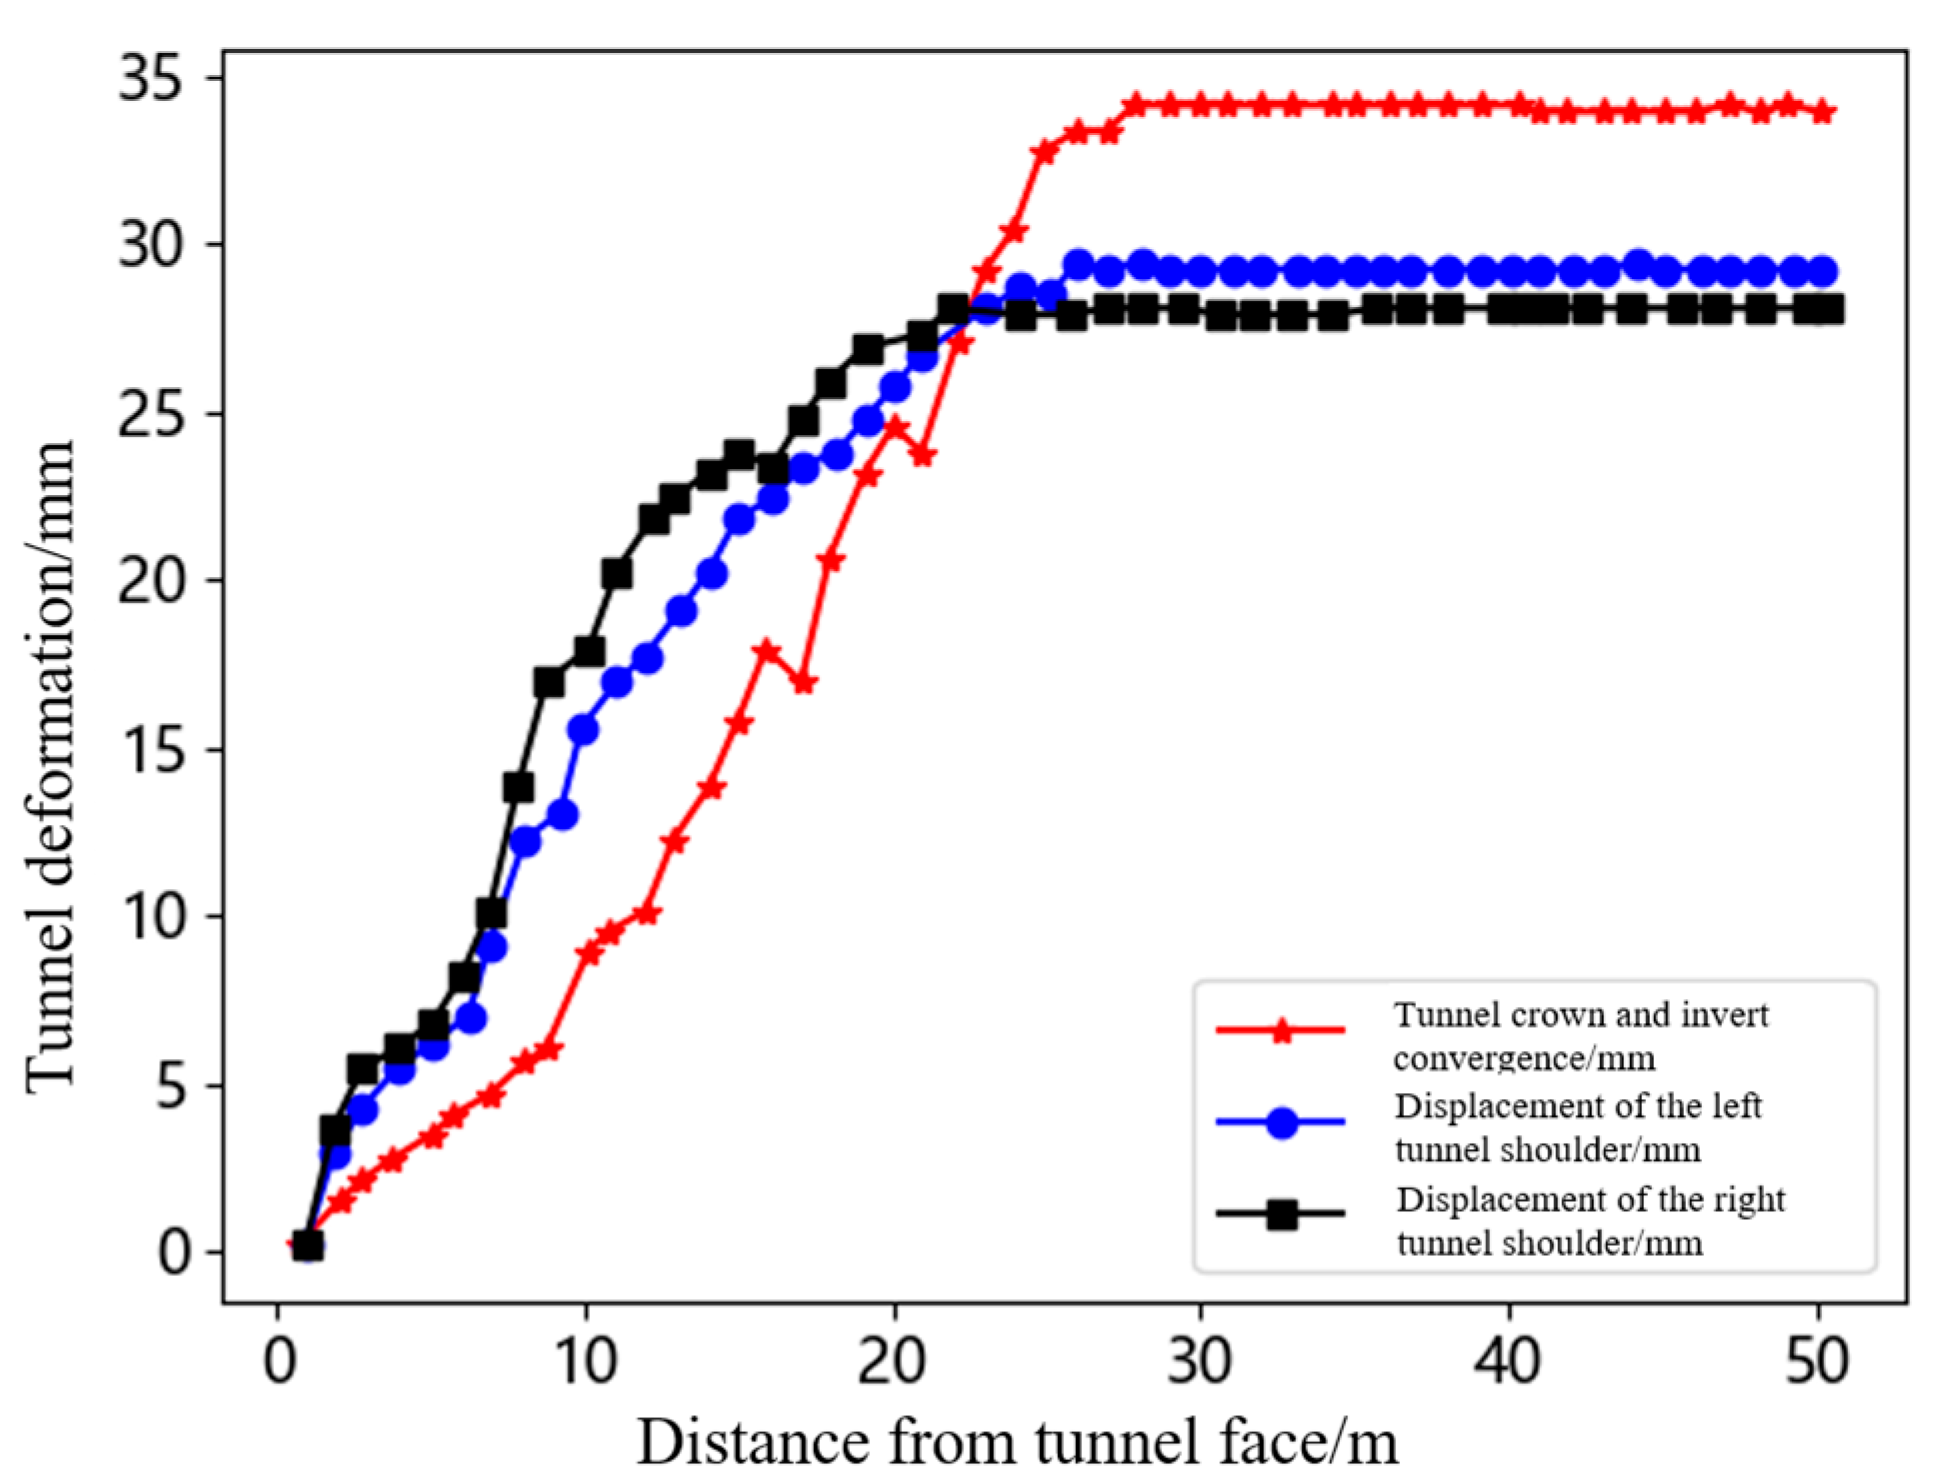
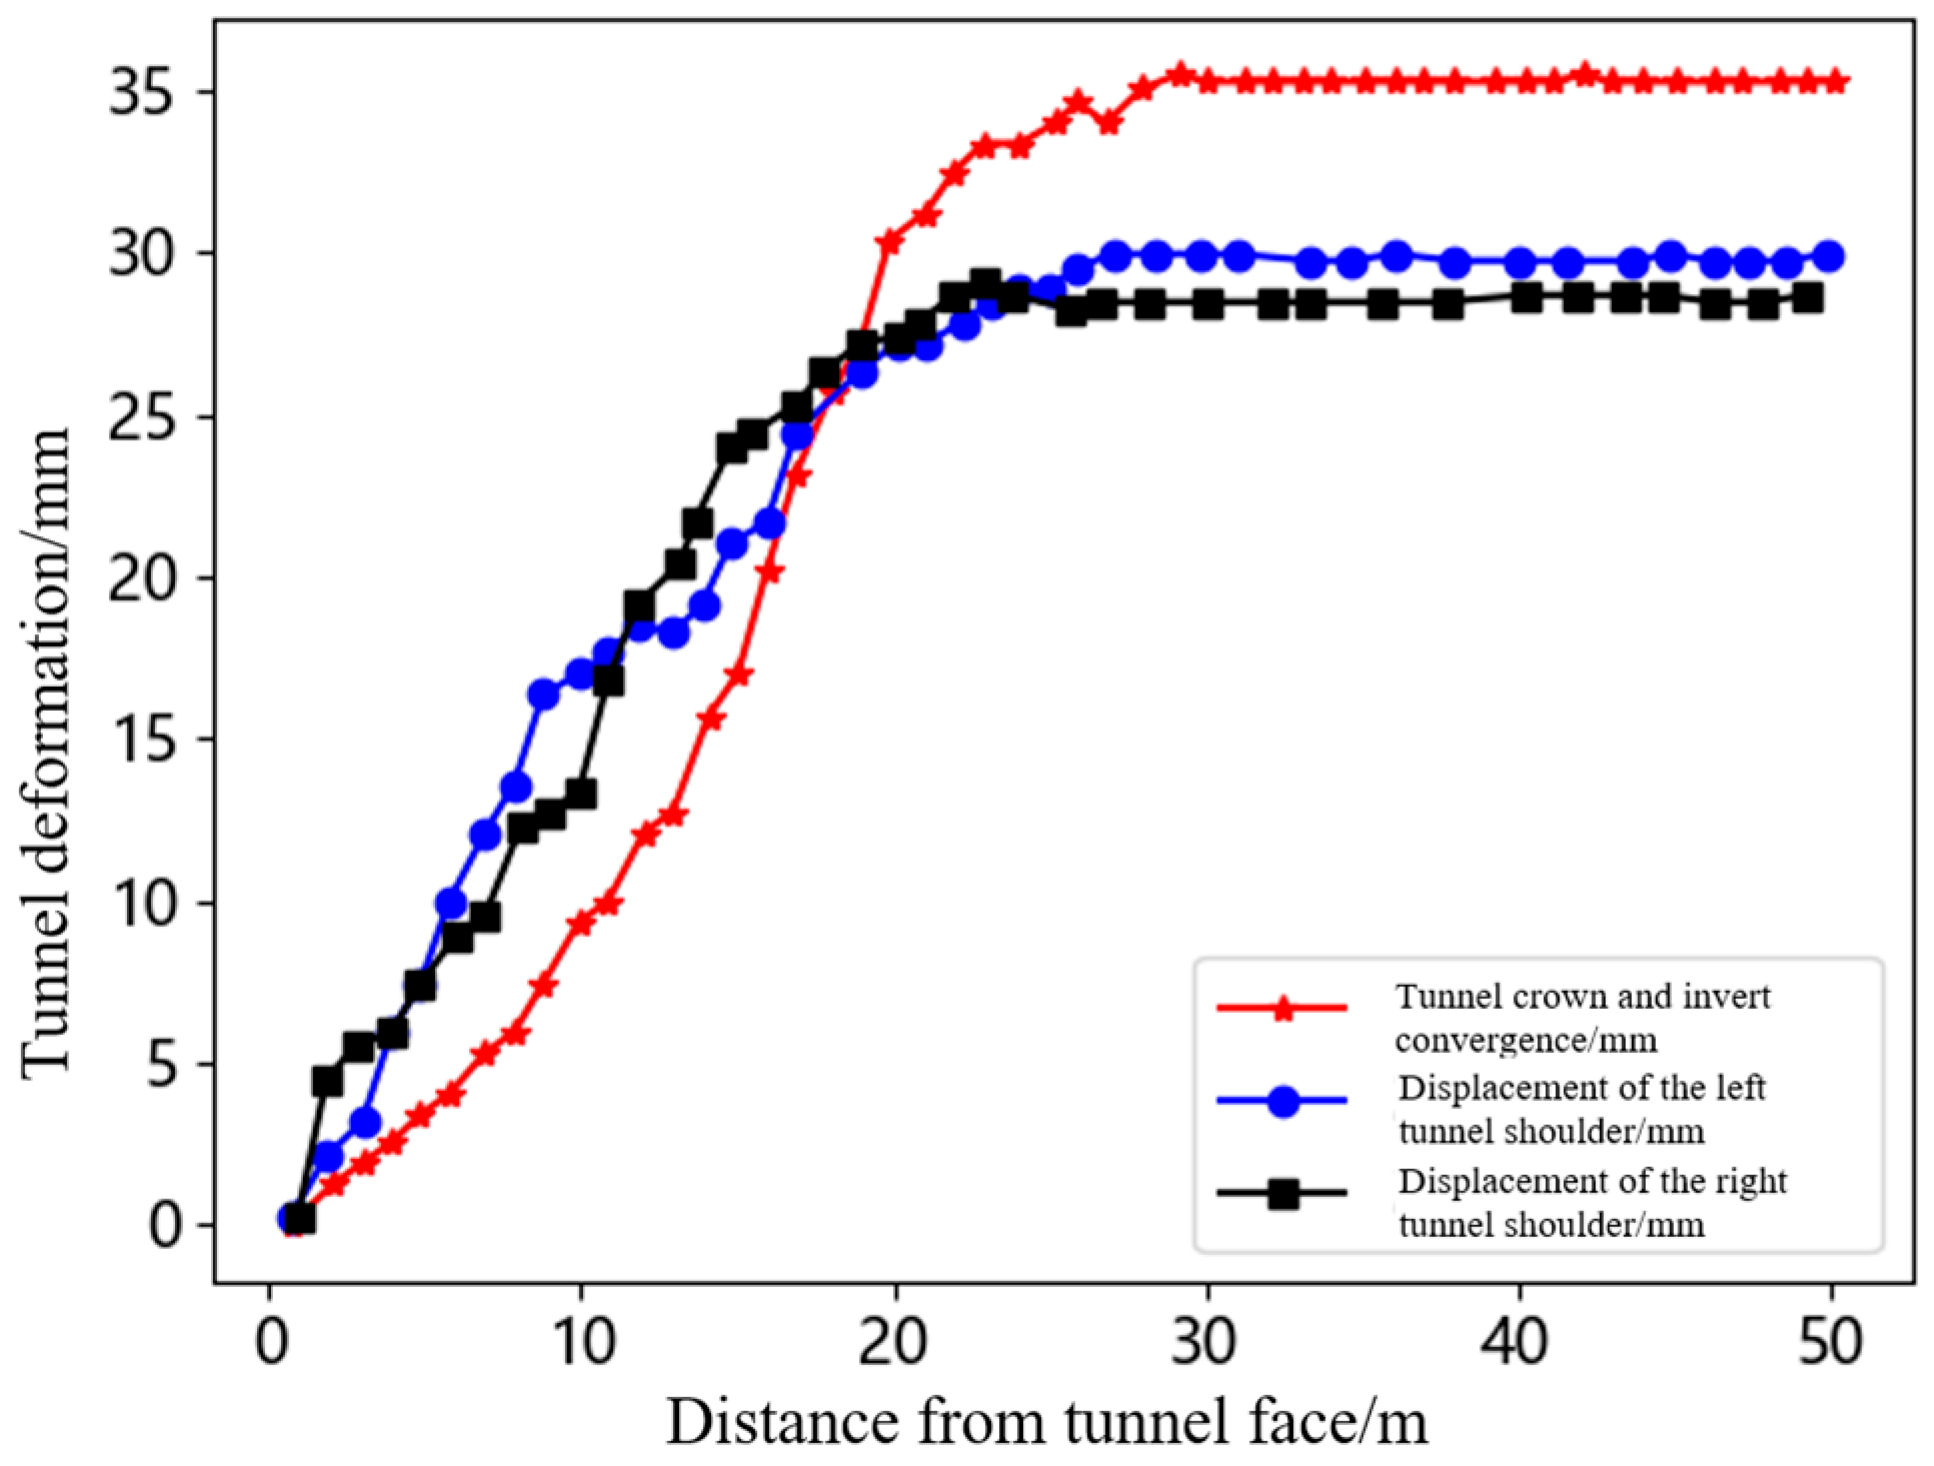
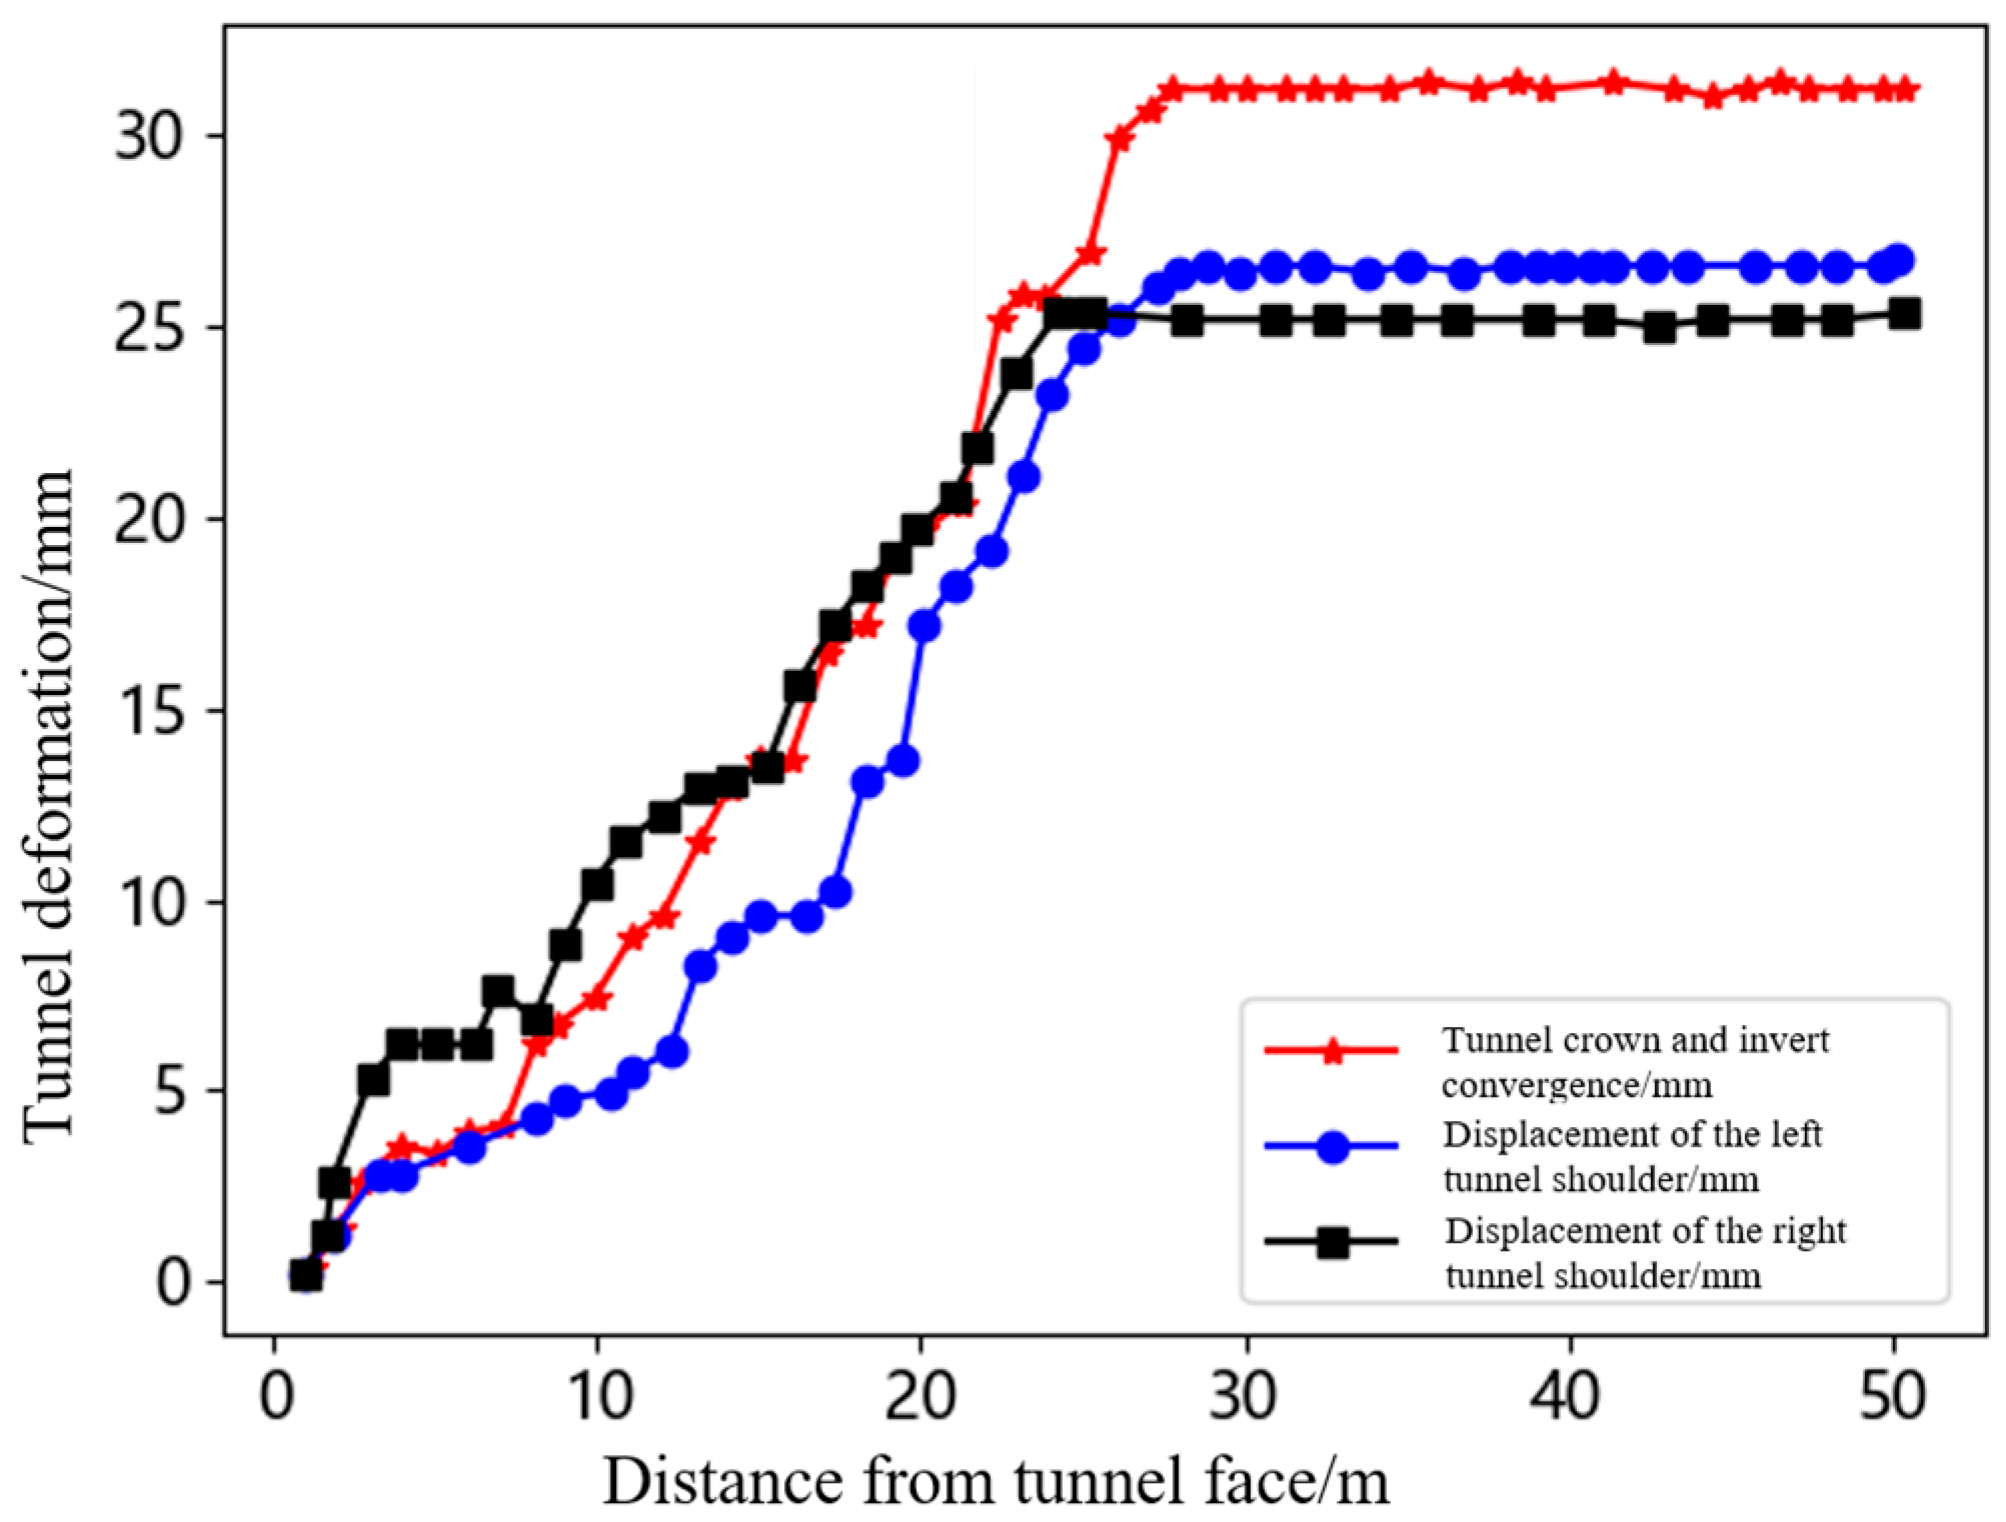
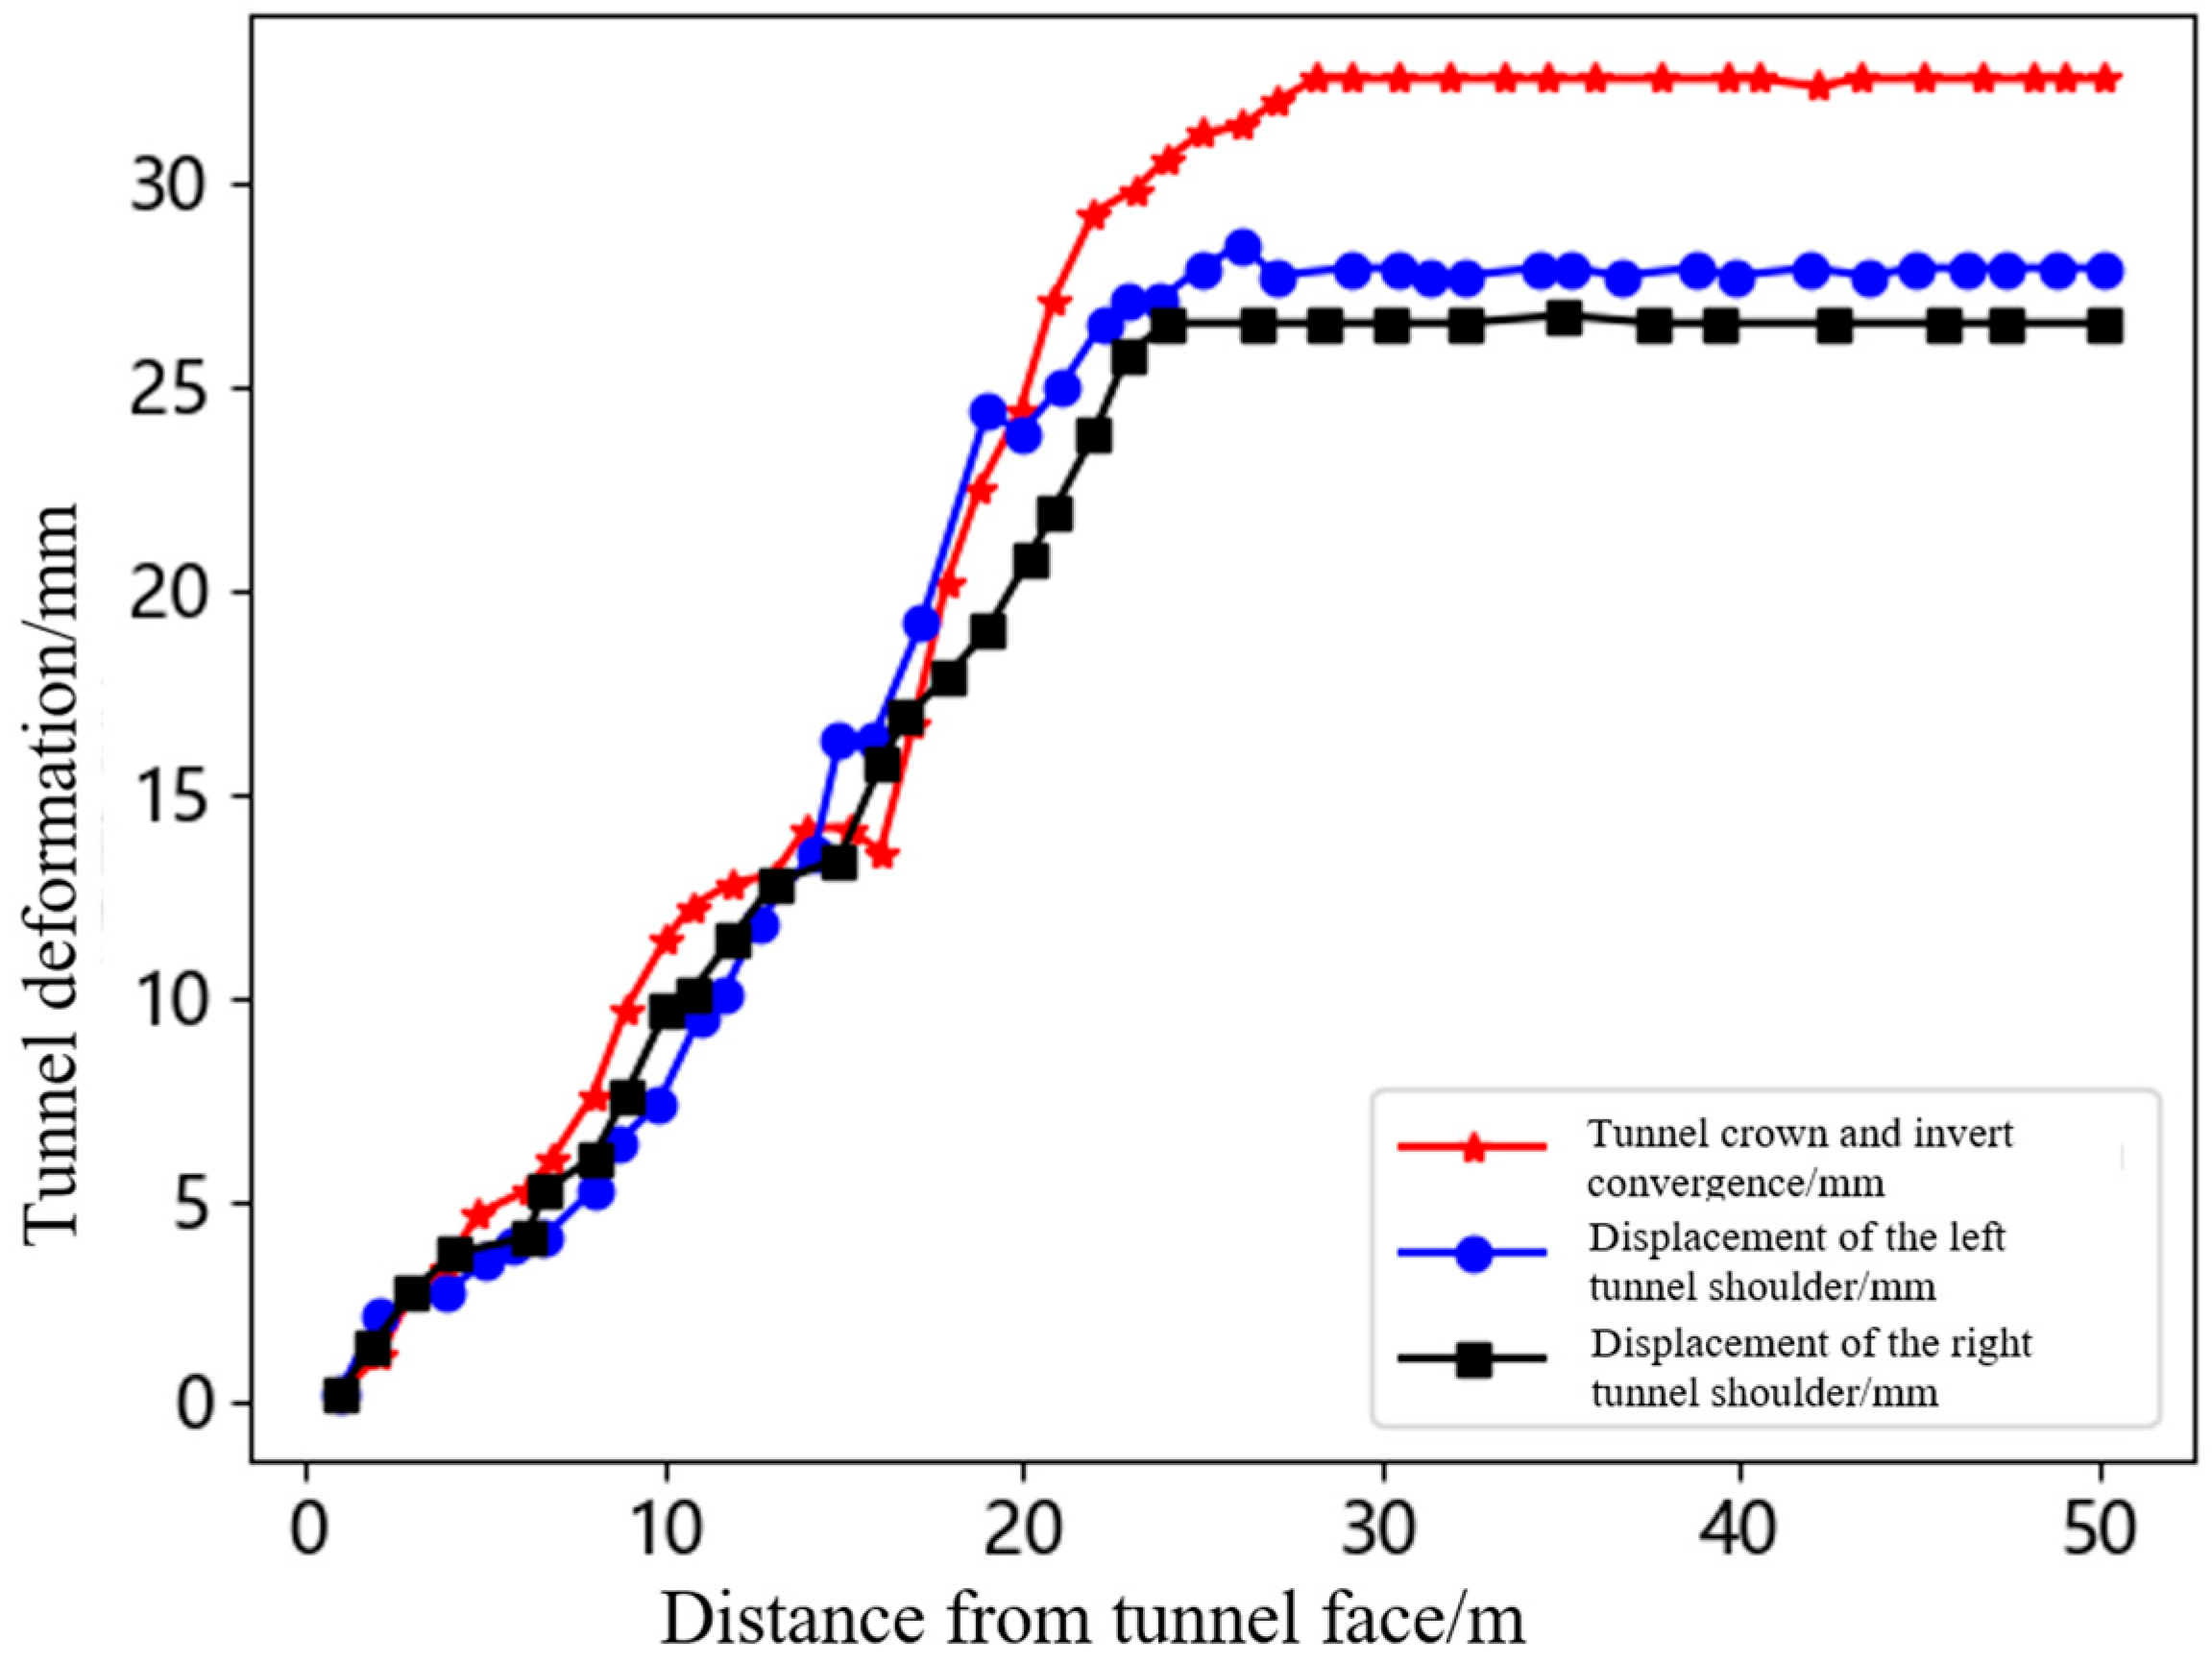
5. Field Engineering Practice
6. Discussion
7. Conclusions
Author Contributions
Funding
Institutional Review Board Statement
Informed Consent Statement
Data Availability Statement
Conflicts of Interest
References
- She, G.; Duan, J.; Ma, G.; Zhang, J. Selection Analysis of Shield Tunneling in Shenzhen with Uneven Soft and Hard Strata. Hans J. Civ. Eng. 2020, 09, 1357–1363. [Google Scholar] [CrossRef]
- Su, Y.; Su, Y.; Zhao, M.; Vlachopoulos, N. Tunnel Stability Analysis in Weak Rocks Using the Convergence Confinement Method. Rock Mech. Rock Eng. 2021, 54, 559–582. [Google Scholar] [CrossRef]
- Huang, J.; Huang, M.; Tan, Z. Phased Control Standards of Primary Support Deformation of East Tianshan Tunnel Crossing Fault Fracture Zone. Tunn. Constr. 2022, 42, 155–165. (In Chinese) [Google Scholar]
- Lunardi, P. Design and Construction of Tunnels—Analysis of Controlled Deformation in Rock and Soils (ADECO-RS); Springer: Milano, Italy, 2008. [Google Scholar]
- Shen, Y.; Zhang, X.; Chang, M.; Pan, X.; Li, W.; Tao, W.; Zhao, H.; Shen, Y.; Zhang, X.; Chang, M.; et al. Shaking table test on segmental tunnel lining with variable stiffness passing through fault rupture zone. Chin. J. Civ. Eng. 2024, 7, 1–15. (In Chinese) [Google Scholar]
- Huang, J.; Yang, Y.; Cai, Q.; Cai, C. Research on multiple risk network of railway tunnel construction crossing fault fracture zone. J. Railw. Sci. Eng. 2021, 18, 2780–2787. (In Chinese) [Google Scholar]
- Woodcock, N.H.; Mort, K. Classification of fault breccias and related fault rocks. Geol. Mag. 2008, 145, 435–440. [Google Scholar] [CrossRef]
- Jie, Y.; Dong, J. Analysis of Longitudinal Deformation and Stress Characteristics of Tunnel Crossing fault Fracture Zone. China J. Highw. Transp. 2021, 34, 211–224. (In Chinese) [Google Scholar]
- Zhang, Y.; Xu, Z.; Xie, Y.; Qiu, J.; Yang, T.; Xie, Y. Analysis of Surrounding Rock Sensitivity and Settlement Control of Tunnel in Fault Fracture Zone. Sci. Technol. Eng. 2023, 23, 3493–3501. (In Chinese) [Google Scholar]
- Wang, L.; Han, K.; Guo, C.; Xie, T.; Luo, J. The face stability of shield tunnel traversing the fault fracture zone. China Civ. Eng. J. 2020, 53, 93–98. (In Chinese) [Google Scholar]
- Yang, J.; Shen, K.; Zhou, J.; Xue, Y. Mechanism and prevention of tunnel collapse through water-rich fault fracture zone. J. Eng. Geol. 2023, 31, 248–257. (In Chinese) [Google Scholar]
- Zhao, X. Construction Parameters Optimization for Double⁃sidewalls Guiding⁃hole Method of Shallow Buried Urban Subway Tunnel in Loess Formation. Railw. Eng. 2022, 62, 119–121+131. (In Chinese) [Google Scholar]
- Fu, H.; An, P.; Li, K.; Li, J.; Cheng, G.; Zhang, J. Analysis on the Process of Tunnel Passing through High-pressure Fault Fractured Zone With Abundant Water Rich. Mod. Tunn. Technol. 2020, 57, 458–465. (In Chinese) [Google Scholar]
- Huang, F.; Dong, G.; Li, T.; Gao, X.; Peng, Y. Study on discrete element simulation of tunnel surrounding rock stability with fault fracture. Sci. Technol. Eng. 2020, 20, 7429–7440. (In Chinese) [Google Scholar]
- Liang, B.; Yang, S.; Ren, Z.; Zhao, F. Research on Anti-seismic Technology of Super Large Section Highway Tunnel in Fault Fracture Zone. Mod. Tunn. Technol. 2020, 57, 136–142. (In Chinese) [Google Scholar]
- Yu, H.; Li, T.; Chen, Z.; Yan, X. Stochastic analysis of fault dislocation induced by tunnel excavation considering distribution characteristics of joints in fracture zones. Chin. J. Geotech. Eng. 2018, 46, 746–754. (In Chinese) [Google Scholar]
- Thomas, A. Sprayed Concrete Lined Tunnels, 2nd ed.; CRC Press: Boca Raton, FL, USA, 2019; p. 288. [Google Scholar]
- Lunardi, P. The underground as a resource and reserve for new spaces; ADECO-RS as an effective tool to be able to realize them (part 1). In Proceedings of the World Tunnel Congress, Cassani G World Tunnel Congress, Iguassu Falls, Brazil, 9–15 May 2014. [Google Scholar]
- Guo, Y.; Chen, Y.; Jiang, Y.; Yin, Z.; Hu, T. Study on Stability Control Measures for Large Deformation of Carbonaceous Slate at Diversion Tunnel of Guzeng Hydropower Station. Pearl River 2020, 41, 58–64. (In Chinese) [Google Scholar]
- Yan, J. The Construction Technology of Section Tunnel of Building Little Hydroelectric Station in LiangShan. West-China Explor. Eng. 2009, 21, 132–134. (In Chinese) [Google Scholar]
- Ghaderi, A.; Abbaszadeh Shahri, A.; Larsson, S. An artificial neural network based model to predict spatial soil type distribution using piezocone penetration test data (CPTu). Bull. Eng. Geol. Environ. 2019, 78, 4579–4588. [Google Scholar] [CrossRef]
- Rangarajan, S.; Rahardjo, H.; Satyanaga, A.; Li, Y. Influence of 3D subsurface flow on slope stability for unsaturated soils. Eng. Geol. 2024, 339, 107665. [Google Scholar] [CrossRef]
- Abbaszadeh Shahri, A.; Kheiri, A.; Hamzeh, A. Subsurface Topographic Modeling Using Geospatial and Data Driven Algorithm. ISPRS Int. J. Geo-Inf. 2021, 10, 341. [Google Scholar] [CrossRef]
- Abbaszadeh Shahri, A.; Malehmir, A.; Juhlin, C. Soil classification analysis based on piezocone penetration test data. Eng. Geol. 2015, 189, 32–47. [Google Scholar] [CrossRef]
- Ghaderi, A.; Abbaszadeh Shahri, A.; Larsson, S. A visualized hybrid intelligent model to delineate Swedish fine-grained soil layers using clay sensitivity. CATENA 2022, 214, 106289. [Google Scholar] [CrossRef]
- Abbaszadeh Shahri, A.; Chunling, S.; Larsson, S. A hybrid ensemble-based automated deep learning approach to generate 3D geo-models and uncertainty analysis. Eng. Comput. 2024, 40, 1501–1516. [Google Scholar] [CrossRef]
- Demin, V.; Khalikova, E.; Rabatuly, M.; Amanzholov, Z.; Zhumabekova, A.; Syzdykbaeva, D.; Bakhmagambetova, G.; Yelzhanov, Y. Research into mine working fastening technology in the zones of increased rock pressure. Min. Miner. Depos. 2024, 18, 27–36. [Google Scholar] [CrossRef]
- Imashev, A.; Suimbayeva, A.; Zhunusbekova, G.; Adoko, A.C.; Issakov, B. Assessing stability of mine workings driven in stratified rock mass. Min. Miner. Depos. 2024, 18, 82–88. [Google Scholar] [CrossRef]
- Soomro, M.A.; Mangnejo, D.A.; Bhanbhro, R.; Memon, N.A.; Memon, M.A. 3D finite element analysis of pile responses to adjacent excavation in soft clay: Effects of different excavation depths systems relative to a floating pile. Tunn. Undergr. Space Technol. 2019, 86, 138–155. [Google Scholar] [CrossRef]
- Aygar, E.B. Evaluation of new Austrian tunnelling method applied to Bolu tunnel’s weak rocks. J. Rock Mech. Geotech. Eng. 2020, 12, 541–556. [Google Scholar] [CrossRef]
- Barla, G. Full-face excavation of large tunnels in difficult conditions. J. Rock Mech. Geotech. Eng. 2016, 8, 294–303. [Google Scholar] [CrossRef]
- Zhou, P.; Jiang, Y.; Zhou, F.; Gong, L.; Qiu, W.; Yu, J. Stability Evaluation Method and Support Structure Optimization of Weak and Fractured Slate Tunnel. Rock Mech. Rock Eng. 2022, 55, 6425–6444. [Google Scholar] [CrossRef]
- Wang, B.; Wang, J.; Wu, D.; Zhao, Y.; Zhang, B.; Li, Z. Study on application of yielding supporting system for large-deformation in soft rock highway tunnel. J. Railw. Sci. Eng. 2016, 13, 1985–1993. (In Chinese) [Google Scholar]
- Wang, Z.; Ma, W. Classification of the loosening zones and estimation of the loosening pressures of tunnels in layered jointed rock strata. Sci. Prog. 2022, 105, 368504221098886. [Google Scholar] [CrossRef] [PubMed]
- Sun, H.; Song, S.; Lu, W.; Ren, Q.; Li, X.; Miao, X. Safety design of tunnel lining structure considering bond-slip failure mechanism. Arab. J. Geosci. 2022, 15, 489. [Google Scholar] [CrossRef]
- Wang, M.; Zhang, X.; Li, Y.; Yang, H. A semi-analytical method for stress-strain analysis of tunnels under dip-slip faulting based on an elastic-plastic foundation beam model. Soil Dyn. Earthq. Eng. 2024, 179, 108506. [Google Scholar] [CrossRef]
- Bernard, E.; Thomas, A. Fibre reinforced sprayed concrete for ground support. Tunn. Undergr. Space Technol. 2020, 99, 103302. [Google Scholar] [CrossRef]
- Carranza-Torres, C.; Diederichs, M. Mechanical analysis of circular liners with particular reference to composite supports. Tunn. Undergr. Space Technol. 2009, 24, 506–532. [Google Scholar] [CrossRef]
- Zhang, Y.; Zhang, Q.-Y.; Duan, K.; Yu, G.-Y.; Jiao, Y.Y. Reliability analysis of deep underground research laboratory in Beishan for geological disposal of high-level radioactive waste. Comput. Geotech. 2020, 118, 103328. [Google Scholar] [CrossRef]
- Verma, S.; Pant, M.; Snasel, V. A comprehensive review on NSGA-II for multi-objective combinatorial optimization problems. IEEE Access 2021, 9, 57757–57791. [Google Scholar] [CrossRef]
- Lotfinejad, P.; Tarkashvand, A.; Sanaieian, H. A computational approach for integration of greenhouse and “Shanashir” to enhance thermal comfort of occupants, utilizing NSGA-II algorithm. Build. Environ. 2025, 273, 112717. [Google Scholar] [CrossRef]
- Deng, W.; Zhang, X.; Zhou, Y.; Liu, Y.; Zhou, X.; Chen, H.; Zhao, H. An enhanced fast non-dominated solution sorting genetic algorithm for multi-objective problems. Inf. Sci. 2022, 585, 441–453. [Google Scholar] [CrossRef]
- Doerr, B.; Ivan, T.; Krejca, M.S. Speeding Up the NSGA-II With a Simple Tie-Breaking Rule. In Proceedings of the AAAI Conference on Artificial Intelligence, Philadelphia, PA, USA, 25 February–4 March 2025; Institut Polytechnique de Paris: Paris, France, 2024. [Google Scholar] [CrossRef]
- El Hafdaoui, H.; Khallaayoun, A.; AIMajeed, S. Controlled Non-Dominated Sorting Genetic Algorithms for Multi-Objective Op-timal Design of Standalone and Grid-Connected Renewable Energy Systems in Integrated Energy Sectors. IEEE Access 2025, 13, 14658–14685. [Google Scholar] [CrossRef]
- Bakhshi Ani, A.; Ale Ebrahim, H. Modeling and Multi-objective Optimization of a Packed Bed Reactor for Sulfur Dioxide Removal by Magnesium Oxide Using Non-dominated Sorting Genetic Algorithm II. Chem. Biochem. Eng. Q. 2021, 35, 251–266. [Google Scholar] [CrossRef]
- Pazooki, F.; Zibafar, A.; Rahmati Lish, M. Optimization and design of general aviation aircrafts wing using non-dominated sorting genetic algorithms II. J. Aeronaut. Eng. 2021, 23, 100–115. [Google Scholar] [CrossRef]
- Liu, B.; Lin, H.; Chen, Y.; Liu, J.; Guo, C. Deformation stability response of adjacent subway tunnels considering excavation and support of foundation pit. Lithosphere 2022, 2022, 7227330. [Google Scholar] [CrossRef]
- Song, F.; Rodriguez-Dono, A.; Olivella, S. Hydro-mechanical modelling and analysis of multi-stage tunnel excavations using a smoothed excavation method. Comput. Geotech. 2021, 135, 104150. [Google Scholar] [CrossRef]
- Huang, M.; Li, H.; Yu, J.; Zhang, C.; Ni, Y. On the simplified method for evaluating tunnel response due to overlying foundation pit excavation. Transp. Geotech. 2023, 42, 101048. [Google Scholar] [CrossRef]
- Li, S.; Zhang, Y.; Cao, M.; Wang, Z. Study on excavation sequence of pilot tunnels for a rectangular tunnel using numerical sim-ulation and field monitoring. Rock Mech. Rock Eng. 2022, 55, 3507–3523. [Google Scholar] [CrossRef]
- Bian, W.H.; Yang, J.; Zhu, C.; Wang, K.X.; Xu, D.M. Application of excavation compensation method for enhancing stability and efficiency in shallow large-span rock tunnels. J. Cent. S. Univ. 2024, 31, 3242–3263. [Google Scholar] [CrossRef]
- Martiane, W.; Indrawan, I.G.B.; Anggara, F. Determination of Excavation Method and Support System for Sultan Alimuddin—Kakap Tunnel Based on Surface Geology Mapping and Excavation Face. IOP Conf. Ser. Earth Environ. Sci. 2024, 1416, 012009. [Google Scholar] [CrossRef]
- Sun, Y.; Xu, S.; Xu, C.; Huang, W.; He, J.; Rong, Y.; Zheng, F.; Ding, L. Study on the Stress and Deformation of Surrounding Rock and Support Structure of Super Large Section Tunnels Based on Different Excavation Methods. Appl. Sci. 2024, 14, 7025. [Google Scholar] [CrossRef]


| Rock Layer Name | Bulk Modulus K (Gpa) | Shear Modulus G (Gpa) | Tensile Strength σt (Mpa) | Cohesion C (Mpa) | Internal Friction Angle φ (°) | Density ρ (kg·m−3) |
|---|---|---|---|---|---|---|
| Metamorphic Rock | 8.91 | 7.01 | 5.46 | 6.20 | 30 | 2500 |
| Slate | 0.36 | 0.16 | 0.03 | 0.6 | 26 | 2255 |
| Tunnel | 0.36 | 0.16 | 0.03 | 0.6 | 26 | 2255 |
Disclaimer/Publisher’s Note: The statements, opinions and data contained in all publications are solely those of the individual author(s) and contributor(s) and not of MDPI and/or the editor(s). MDPI and/or the editor(s) disclaim responsibility for any injury to people or property resulting from any ideas, methods, instructions or products referred to in the content. |
© 2025 by the authors. Licensee MDPI, Basel, Switzerland. This article is an open access article distributed under the terms and conditions of the Creative Commons Attribution (CC BY) license (https://creativecommons.org/licenses/by/4.0/).
Share and Cite
Niu, S.; Wu, J.; Zhao, J.; Pei, J. Optimal Lower Step Height of Tunnel Excavation Designs by Using the Non-Dominated Sorting Genetic Algorithm-II. Appl. Sci. 2025, 15, 5854. https://doi.org/10.3390/app15115854
Niu S, Wu J, Zhao J, Pei J. Optimal Lower Step Height of Tunnel Excavation Designs by Using the Non-Dominated Sorting Genetic Algorithm-II. Applied Sciences. 2025; 15(11):5854. https://doi.org/10.3390/app15115854
Chicago/Turabian StyleNiu, Shaoqing, Jinwen Wu, Jinchang Zhao, and Junjie Pei. 2025. "Optimal Lower Step Height of Tunnel Excavation Designs by Using the Non-Dominated Sorting Genetic Algorithm-II" Applied Sciences 15, no. 11: 5854. https://doi.org/10.3390/app15115854
APA StyleNiu, S., Wu, J., Zhao, J., & Pei, J. (2025). Optimal Lower Step Height of Tunnel Excavation Designs by Using the Non-Dominated Sorting Genetic Algorithm-II. Applied Sciences, 15(11), 5854. https://doi.org/10.3390/app15115854