Article

Hand Dynamics in Healthy Individuals and Spinal Cord Injury Patients During Real and Virtual Box and Block Test

by
Verónica Gracia-Ibáñez
1,
Ana de los Reyes-Guzmán
2,
Margarita Vergara
1,
Néstor J. Jarque-Bou
1 and
Joaquín-Luis Sancho-Bru
1,*
1
Departamento de Ingeniería Mecánica y Construcción, Universitat Jaume I, 12071 Castellón, Spain
2
Unidad de Biomecánica y Ayudas Técnicas, Hospital Nacional de Parapléjicos, 45071 Toledo, Spain
*
Author to whom correspondence should be addressed.
Appl. Sci. 2025, 15(11), 5842; https://doi.org/10.3390/app15115842
Submission received: 13 April 2025 / Revised: 8 May 2025 / Accepted: 19 May 2025 / Published: 22 May 2025

Abstract

Virtual reality (VR) is a promising tool in spinal cord injury (SCI) rehabilitation, particularly through virtual adaptations of functional tests like the Box and Block test (BBT). However, a comprehensive dynamic comparison between real and virtual BBT is lacking. This study investigates the kinematic and electromyographic (EMG) differences between healthy individuals and SCI patients performing both real (RBBT) and virtual (VBBT) versions of the BBT. An electromagnetic motion-tracking system, an instrumented glove, and surface EMG electrodes were used to capture hand trajectories, joint angles, and forearm muscle activation. The analysis included cycle-averaged and temporal kinematic and EMG parameters. Our findings reveal that both groups showed increased trajectory length and velocity peaks during the VBBT, with more pronounced increases in SCI patients. Unlike healthy individuals, SCI patients also showed increased finger and thumb flexion during VBBT. Cycle-averaged EMG values were lower in healthy participants during VBBT, likely due to reduced motor demands and lack of real grasping. Conversely, SCI patients exhibited higher muscle activity, suggesting impaired coordination and compensatory overactivation. Healthy individuals showed consistent temporal kinematic synergies and muscle activation, whereas they were altered in SCI patients, especially during reaching. These findings highlight the need for rehabilitation strategies to improve motor control and feedback integration.

1. Introduction

Serious games using virtual reality (VR) for rehabilitation purposes have gained popularity in recent years. The Leap Motion Controller® (Ultraleap, Bristol, UK) has become popular for such upper-extremity (UE) applications because of its affordability and ease of use compared to immersive VR headsets [1,2]. This technology has been especially applied in stroke rehabilitation [3,4,5]. Studies evaluating effectiveness in stroke rehabilitation vary widely in pathological conditions, sample sizes, rehabilitation protocols, and methodologies. However, they consistently demonstrate positive outcomes, underscoring their value as a highly effective tool [1]. These studies commonly feature virtual games, developed as engaging therapeutic exercises. Patient progress is typically assessed after multiple sessions using qualitative measures such as the Action Research Arm Test, Wolf Motor Function Test, or QuickDASH. However, there is notable variability in the virtual tasks, number of sessions, and assessment methods employed. Some studies incorporate quantitative functional indicators, such as dexterity (measured with tests like the Box and Block Test (BBT)), range of motion, or strength, before and after rehabilitation sessions to evaluate improvement [4,6,7]. Beyond stroke, studies using the Leap Motion Controller (LMC) for rehabilitation are relatively limited but include burn patients [6], spinal cord injury (SCI) patients [8,9,10], Parkinson’s disease (PD) patients [7], or children with cerebral palsy [11].
A standardized approach to assess VR’s training effectiveness is to integrate a validated test directly into the game, enabling consistent tracking within the virtual environment itself [10,12]. The most common approach is using the BBT, which evaluates functionality by assessing manual dexterity within the activity domain, as outlined by the International Classification of Functioning, Disability, and Health. In patients with Parkinson’s disease, this virtual BBT (VBBT) has been implemented with immersive glasses, yielding excellent results in terms of rehabilitation effectiveness and patient acceptance [13]. VBBT has shown a strong correlation in test scores with real BBT (RBBT) in both stroke patients [14,15], as well as in those with SCI [8]. These investigations compare the number of blocks transferred within a particular time, consistently showing that fewer blocks are transferred in the virtual environment compared to the physical version while still demonstrating a strong correlation with RBBT [13,15]. This trend may be attributed to several factors, including the need for users to adapt to the virtual interface and the different feedback mechanisms present in virtual environments. A notable finding from these studies is that performance improves over time as participants adapt to the virtual interface, with the learning curve being comparable for both the affected and non-affected hands [4].
Few studies have leveraged the hand-tracking capability of the VR systems to analyse trajectory patterns and their smoothness. Everard et al. [14] computed smoothness indexes from hand trajectories, finding significantly smoother movements in healthy individuals compared to stroke patients. Salas–Monedero et al. [16] quantified movement patterns in SCI patients after robotic rehabilitation training, assessing smoothness and movement efficiency through hand kinematics obtained by performing virtual trajectories with LMC. Although the training focused on the UE rather than the hand, they hypothesized improvements in hand movement and precision. Reduced trajectory length and velocity peaks supported their hypothesis of improved motor control, though BBT performance, measured by number of blocks transferred, remained unchanged, likely due to the short duration of the training. However, the VR systems have not been used to track the hand movement (i.e., detailed kinematics of the hand joints), probably because of limitations in accuracy and reliability [17].
To the best of our knowledge, no studies have conducted a comprehensive biomechanical dynamic analysis of the VBBT that includes not only hand trajectories but also hand kinematics and muscular activation. Prior research has not captured hand movement during the use of the VBBT, aside from incidentally obtaining wrist range of motion for the evaluation of tracking capacities of LMC [8]. Due to the limitations of the LMC hand-tracking system, using external devices to measure hand kinematics with accuracy while performing RBBT and VBBT could provide valuable insights into differences in kinematic parameters and patterns due to the game environment and health condition. Furthermore, thorough dynamic analysis should extend beyond kinematics alone. When comparing the RBBT and VBBT, differences in muscle activation are expected due to the lack of strength feedback in virtual environments. Interestingly, training with LMC has been shown to improve pinch strength [4,5,6], suggesting that muscle activations are worth analysing to determine if they differ due to health conditions. Despite the growing interest in the VBBT across various platforms, no comprehensive dynamic studies have yet been conducted to examine the full scope of hand kinematics and muscle activation, particularly in SCI patient populations, to better understand the implications of using these tests in virtual environments. This study aims to fill this gap by comparing detailed biomechanical signals, including hand trajectories, hand joint kinematics, and forearm muscular activation, of healthy participants and four patients with SCI, while performing RBBT and VBBT. By comparing these multidimensional signals, this research seeks to provide a more complete understanding of how virtual reality affects motor control and muscle engagement compared to real-world tasks. Understanding these differences is essential for refining virtual rehabilitation tools and ensuring they accurately mimic real-world motor demands.

2. Materials and Methods

2.1. Experimental Study

Kinematic and muscle-activation data were collected while participants performed both the real Box and Block test and its virtual version, as used in previous works [8,10]. The study involved nine healthy participants and four neurologically affected participants with SCI (hereafter referred to as patients) who were recruited from the National Hospital for Paraplegics in Toledo (Spain) [8,10,18,19]. All participants provided informed consent. The study received ethical approval from the local Ethics Committee from Complejo Hospitalario Toledo (No. 372, Date: 30 April 2019) and from the Human Research Ethics Committee from the Universitat Jaume I (CEISH; reference number: CD/27/2022). Specific informed consent was obtained for open-access publication of photographs that could allow participant identification. SCI patients were recruited by hospital clinicians. Healthy participants were recruited from university and hospital staff and students.
Four patients with cervical SCI and UE motor function impairment participated in the study. All patients had an injury at a metameric level between C4 and C8, with an American Spinal Injury Association Impairment Scale (AIS) grade ranging from A to D as defined by the International Standards for the Neurological Classification of Spinal Cord injury [20], which was specifically assessed through the upper limb motor score of the right arm (UER) and the Spinal Cord Independence Measure scale (SCIM). Exclusion criteria of patients included vertebral deformities, joint restrictions, prior upper limb surgery, balance disorders, dysmetria due to associated neurologic or orthopaedic disorders, or visual acuity defects. The UER and the SCIM scale were obtained through an assessment conducted by the clinical staff, evaluating the strength of five muscle groups of the dominant UE. Each muscle group was rated on a scale from 0 (no function) to 5 (normal function), with a total possible score of 25 points. For healthy participants, the inclusion criteria required right-handedness and no history of neuromuscular problems or upper arm injuries. Only right-handed participants were included to minimize variability in motor performance due to limb dominance. The demographic characteristics of the sample analysed are provided in Table 1.
All participants were positioned in front of a height-adjustable table. Healthy participants sat on a chair facing the table, while patients sat in their wheelchairs. An electromagnetic Micro Sensor 1.8 of the Viper motion-tracking system (Polhemus, Colchester, VT, USA), sampling at 100 Hz, was placed on the back of the hand to capture its trajectory using the x, y, z Cartesian coordinates of the microsensor relative to the Polhemus Source origin (Figure 1). A CyberGlove (Cyberglove Systems LLC; San Jose, CA, USA), sampling at 100 Hz, was placed on their right hand to measure 16 hand joint angles following a previously validated protocol [21]. Additionally, seven LX230 integral dry reusable surface electromyography (sEMG) wireless electrodes (Biometrics Ltd., Newport, UK), sampling at 1000 Hz, were placed on the forearm. The electrodes were secured with double-sided die-cut tapes (T350; Vicon Motion Systems Ltd., Oxford, UK) at seven locations selected to capture representative muscle activation during daily activities, as outlined in a previous study [22]. The selected electrode sites target muscle groups essential for BBT movements (wrist and finger flexion/extension, radial/ulnar deviation, and thumb control), ensuring functionally relevant EMG data for grasping, transporting, and releasing blocks. A customized software developed in C++ was used to synchronize the Viper, CyberGlove, and sEMG signals. First, participants performed the RBBT after practicing beforehand to familiarize themselves with the test. Then they performed the test by following instructions to move the maximum number of cubes from the right to the left compartments in 60 s. Afterward, they performed the VBBT using the virtual test implemented in LMC [10]. Participants were provided time to familiarize themselves with the virtual environment until they felt ready to proceed. In patients, if fewer than five cubes were moved during the 60 s, the test was restarted without time limit to ensure that at least five cubes were successfully moved per participant. This approach minimized the number of repetitions required, helping to avoid fatigue and frustration. Figure 1 illustrates this setup, showing a participant instrumented and performing the experiment. The RBBT (bottom left) and the VBBT (bottom right) can be seen in Figure 1, where the fixed placement of the source and the orientation of the +/− X, Y, and Z axes (top) are also shown.

2.2. Data Preprocessing

All analyses were conducted using custom algorithms developed in Matlab 2023b (The MathWorks, Natick, MA, USA).

2.2.1. Kinematic Data

Hand trajectory data (x, y, and z position) were filtered with a second-order two-way low-pass Butterworth filter with a cut-off frequency of 5 Hz.
Sixteen hand joint angles were obtained from the CyberGlove data, as described in [21], from a reference posture defined as the hand flat on the table with fingers fully extended and closed: metacarpophalangeal flexion (MCP1 to MCP5, thumb to little finger), interphalangeal flexion of the thumb (IP1), proximal interphalangeal flexion of fingers (PIP2 to PIP5), flexion and abduction of the carpometacarpal joint of the thumb (CMC1), relative abduction between MCPs joints of adjacent fingers (index–middle, middle–ring, ring–little), and palmar arching. All hand joint angles were filtered with a second-order two-way low-pass Butterworth filter with a cut-off frequency of 5 Hz. Joint angles were amplitude-normalised using the mean active range of motion of healthy individuals, distinguishing flexion (+)/extension (–) and abduction (+)/adduction (–) from the reference posture [23]. To achieve this, angles corresponding to extension/adduction were divided by the absolute value of the maximum range of extension/adduction, while angles corresponding to flexion/abduction were divided by the absolute value of the maximum range of flexion/abduction. The 16 normalised joint angles were then combined into five parameters that describe the hand kinematic synergies [24]: Thumb_F (average flexion of CMC, MCP, and IP joints), MCPs_F (average MCP flexion of fingers 2–4), PIPs_F (average PIP flexion of fingers 2–4), Thumb_A (thumb abduction), and Fingers_A (average fingers abduction). As a result of this process, these kinematic synergies were normalised to a scale ranging from −1 (maximal extension/adduction) to 1 (maximal flexion/abduction) [24].

2.2.2. sEMG Data

To obtain sEMG waveform parameters, the sEMG signals were processed using a fourth-order Butterworth band-pass filter (25–500 Hz) and a fourth-order Butterworth band-stop filter (49.5–50.5 Hz), using zero-phase filtering. To obtain muscle activation, the signals were also rectified and smoothed using Gaussian smoothing [22], and then normalised to the maximum recorded value for each participant across all movement cycles (five RBBT and five VBBT).

2.2.3. Data Segmentation and Selection

In this study, a movement cycle refers to participant’s action of picking up a cube from the right compartment of the box, placing it in the left compartment, and returning to pick up the next cube from the right compartment in both the RBBT and VBBT. Movement cycles were automatically segmented with manual review and visual correction applied when necessary: each movement cycle begins and ends when the hand grasps a cube from the container, which corresponds to the lowest hand height, i.e., the highest positive Z-coordinate value in the global coordinate system (Figure 1).
All kinematic and sEMG data were segmented by movement cycle, with their durations rescaled from 0 to 100. Data were resampled to 100 values, except for sEMG waveform parameter, which were not resampled. For sEMG waveform parameter computation, time labels were adjusted (not resampled): They were scaled by dividing by the number of frames recorded to facilitate comparison and then multiplied by 100. The last five movement cycles per participant were selected for the subsequent analyses to ensure consistency despite variations in the number of recorded cycles, since all participants completed at least five cycles. Two types of parameters were analysed for both kinematic and sEMG data: cycle-averaged parameters, representing single-value metrics extracted from each cycle (e.g., median, range), and frame-by-frame temporal parameters, capturing the evolution throughout each cycle.

2.3. Kinematic Data Analysis

2.3.1. Cycle-Averaged Kinematic Parameters Definition

Two trajectory-related parameters were calculated for each movement cycle: Smoothness Metric (SM), which is the number of peaks detected in the velocity profile obtained per trajectory, and Efficiency Metric (EM), as the length of the trajectory, both computed in accordance with [16], as defined in Equations (1) and (2), respectively, where xi, yi, zi represent the Cartesian coordinates at frame i, t is the time difference between two frames, and L is the total trajectory length.
S M = i = 2 L 1 δ v i                       δ v i = 1 ,         i f   v i 1 <   v i >   v i + 1 0 ,                 o t h e r w i s e                                                           v i = x ˙ i 2 + y ˙ i 2 + z ˙ i 2         x ˙ i = x i x i 1 t ,     y ˙ i = y i y i 1 t ,     z ˙ i = z i z i 1 t
E M = i = 2 L x i x i 1 2 + y i y i 1 2 + z i z i 1 2
Ten additional parameters were obtained from the five hand kinematic synergies (Thumb_F, MCPs_F, PIPs_F, Thumb_A, Fingers_A) for each movement cycle. These parameters captured central tendency and dispersion using the median and range, as the Shapiro–Wilk test indicated non-normal distribution. The range, defined as the difference between maximum and minimum values, was used instead of the interquartile range because the parameters were normalised to reference maximal and minimal values [23]. These parameters are labelled to reflect the metric: KinematicSynergy_M for the median and KinematicSynergy_R for the range (e.g., Thumb_F_M and Thumb_F_R for median and range of Thumb_F, respectively).

2.3.2. Cycle-Averaged Kinematic Parameters Analysis

First, repeatability within participants was checked for the 12 cycle-averaged kinematic parameters (two related to trajectory and ten related to kinematic synergies) using the most appropriate tests depending on data normality, including the Intraclass Correlation Coefficient and Concordance Correlation Coefficient, and Cohen’s Weighted Kappa for ordinal data. Repeatability was confirmed for nearly all parameters. Based on graphical inspection and the limited sample size, each participant’s values were averaged across the five movement cycles.
Then, due to the reduced number of participants, non-parametric statistical analyses were performed. To examine differences between test conditions in each health condition group, the Friedman test was applied to each cycle-averaged kinematic parameter with factor test condition (RBBT/VBBT) for each health condition group (healthy and patient). Finally, to examine differences between health conditions in each test condition group, the Kruskal–Wallis test (the non-parametric equivalent to Analysis of Variance (ANOVA)) was applied to each cycle-averaged kinematic parameter with factor health condition (healthy/patient) for each test condition group (RBBT and VBBT).

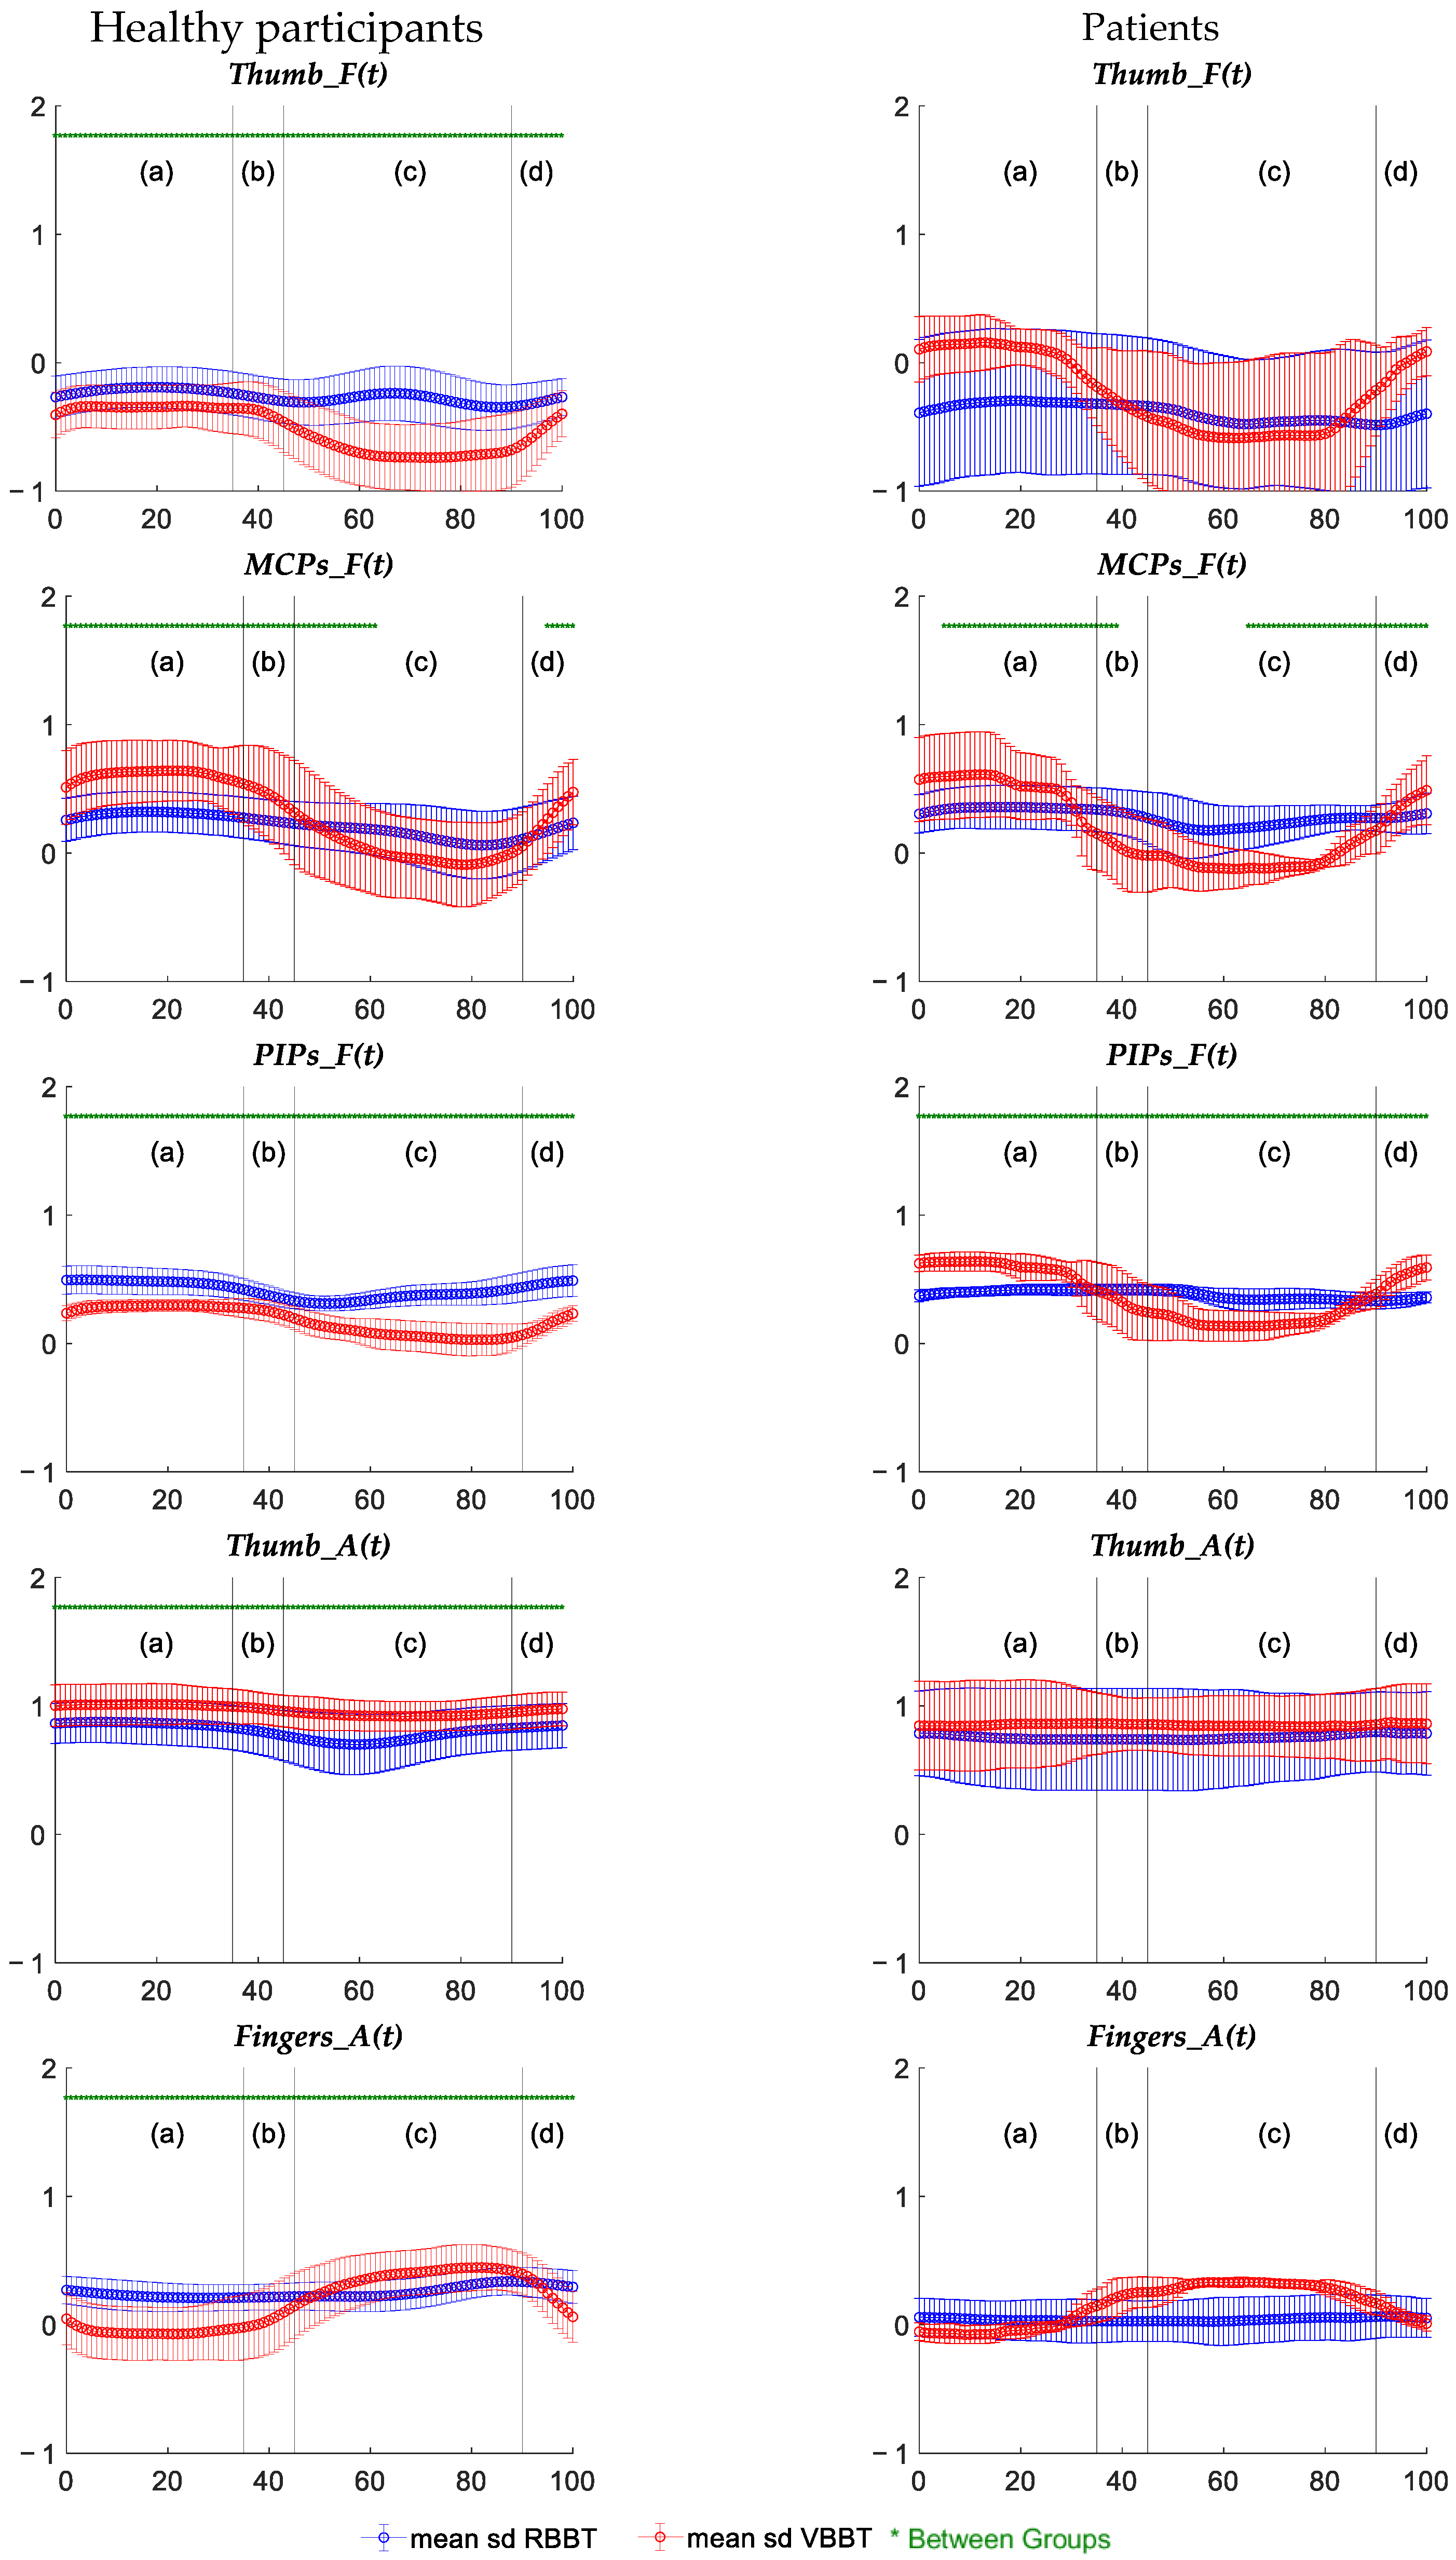
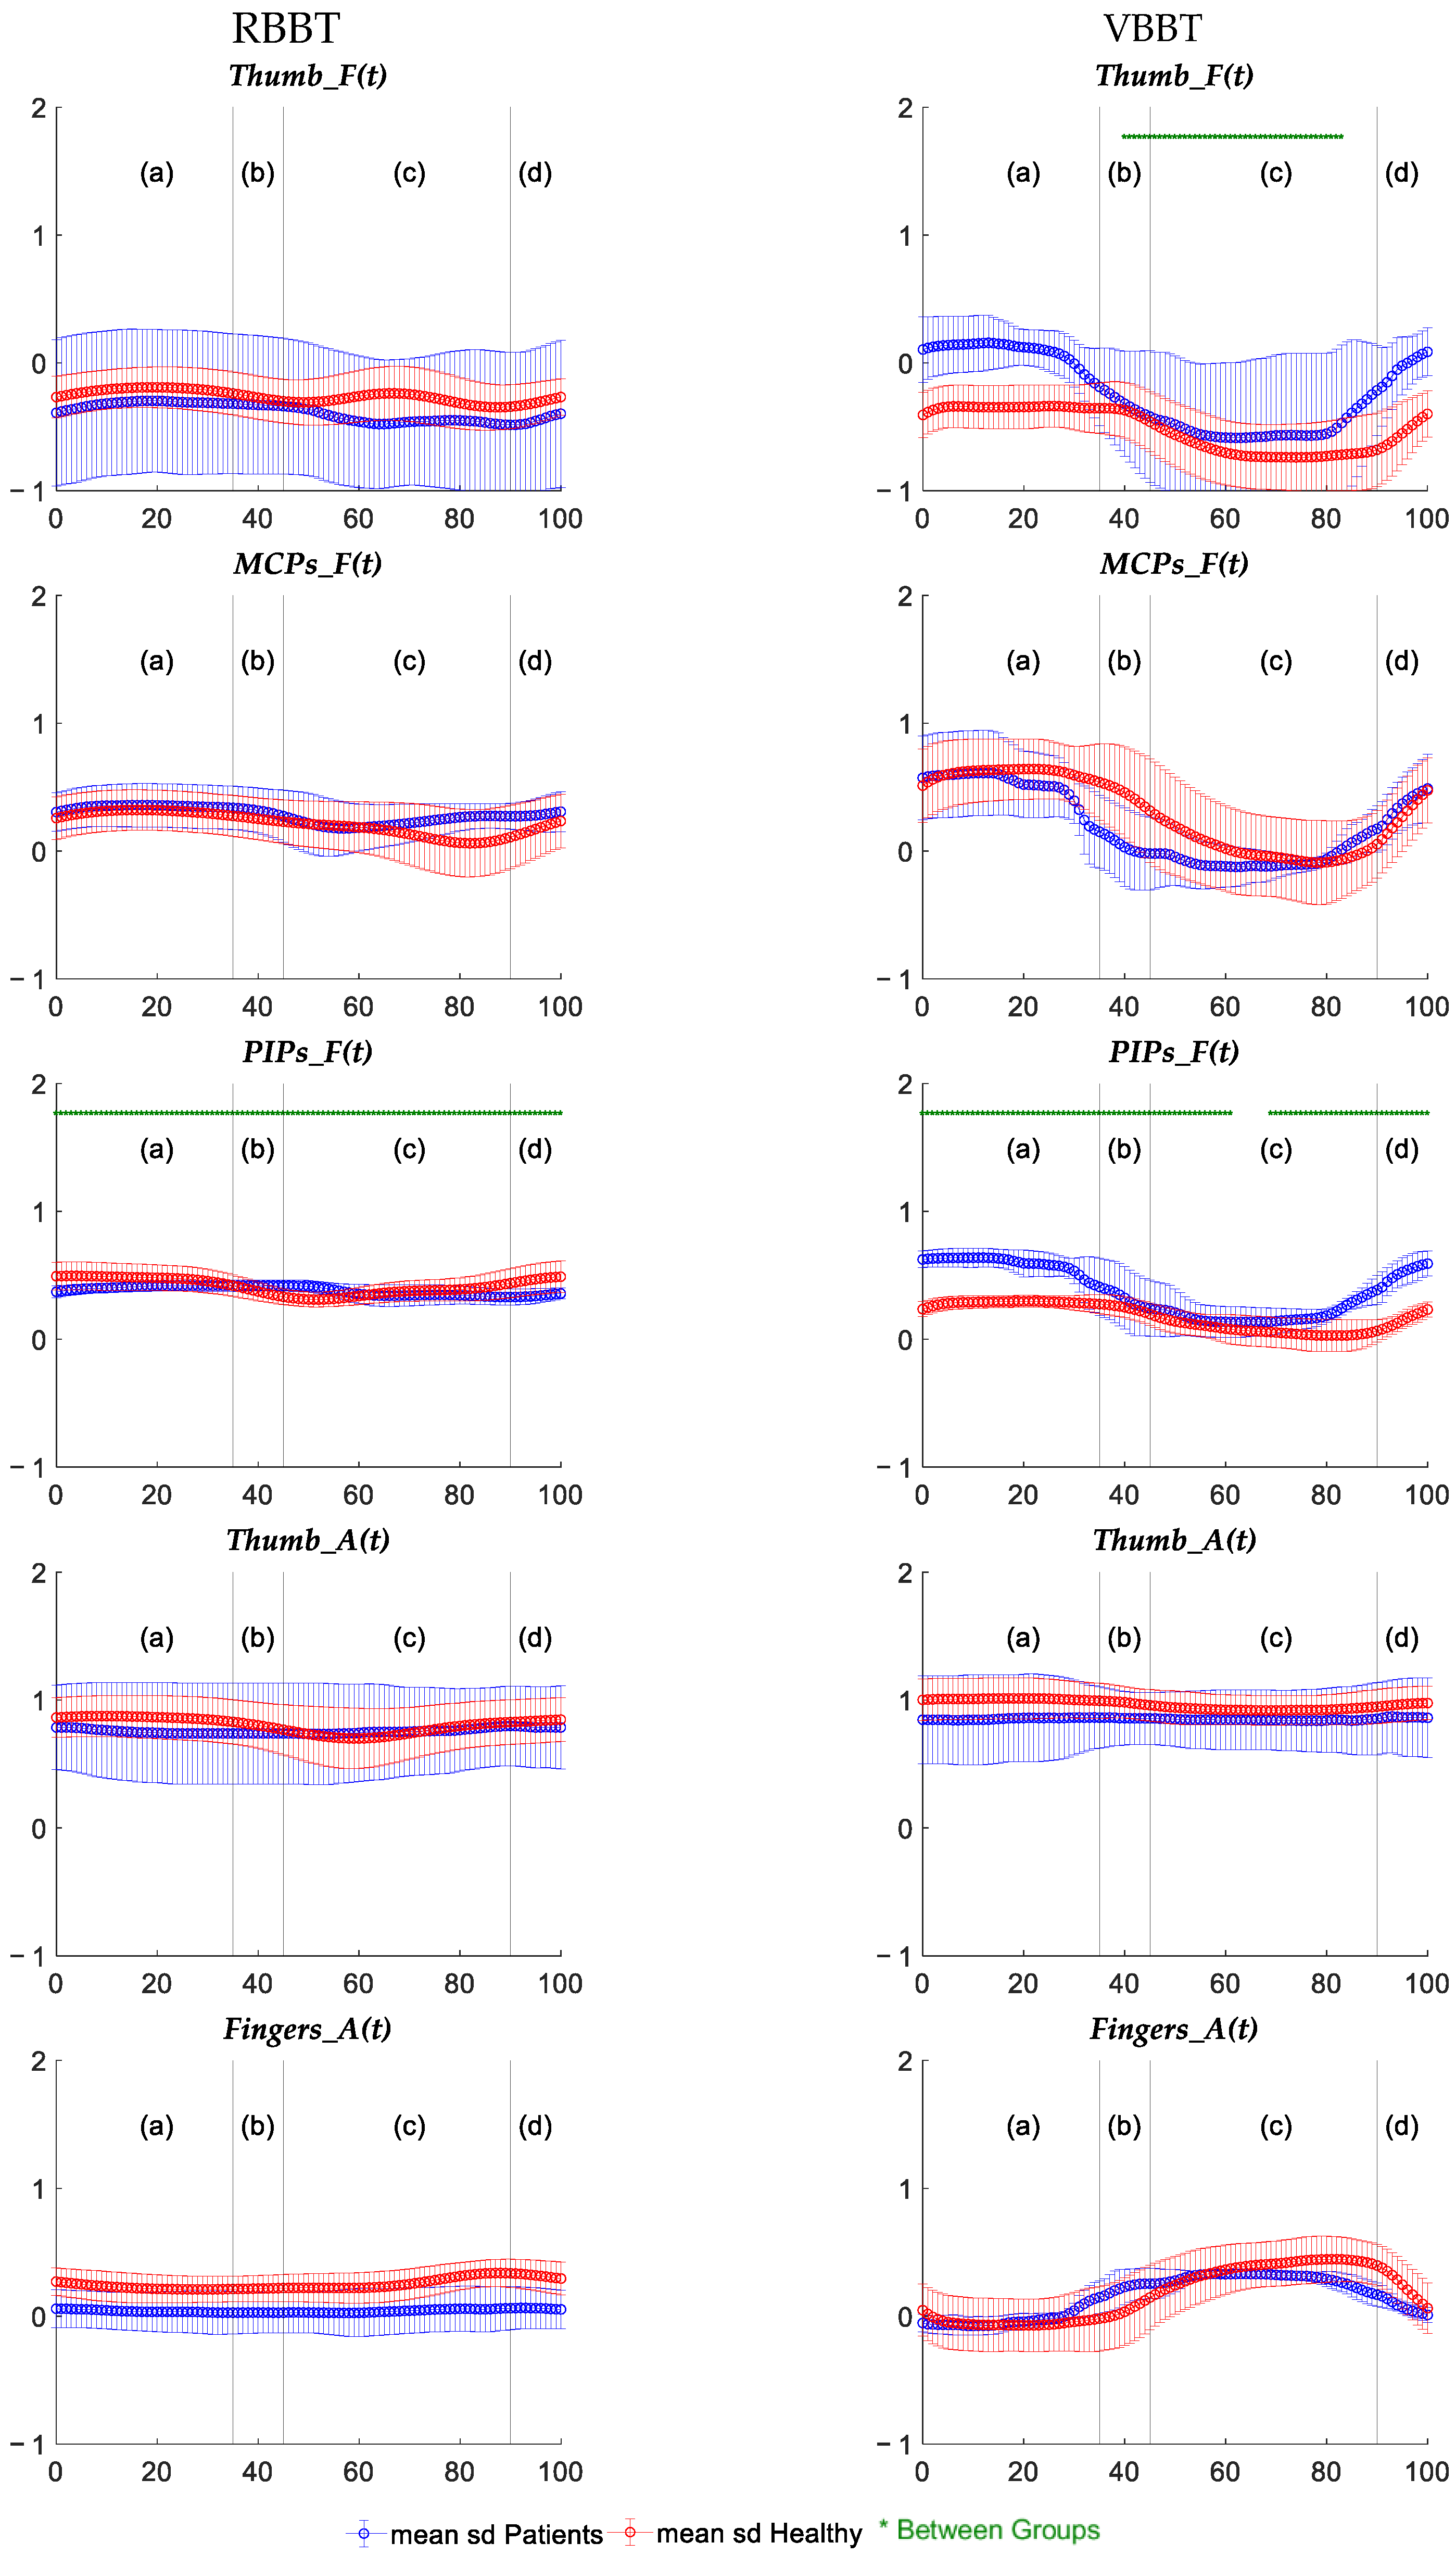
2.3.3. Temporal Kinematic Analysis

The temporal evolution of the kinematic synergies (Thumb_F(t), MCPs_F(t), PIPs_F(t), Thumb_A(t), Fingers_A(t)) was studied to analyse the existence of temporal patterns and the factors on which they depend. A linear mixed-effects model (LME) was applied, followed by an ANOVA on the LME. This is a flexible approach that can account for complex correlation structures and random effects, and, as demonstrated by Macey et al. [25], it is applicable for studying temporal evolution. Intrasubject repeatability was confirmed through visual inspection for all participants except for one patient in VBBT. This patient’s data were excluded from the temporal analysis. Then, the five movement cycles were averaged by taking the mean at each normalised time point.
Then, two analyses were performed. First, to examine differences between RBBT and VBBT within each health condition group, 10 LME models were applied: kinematic synergy (five parameters × two health conditions) as the dependent variable, time (t) and test condition (BBT/VBBT) as fixed factors, and including participant as random effect so that results reflect only the fixed effects after accounting for inter-individual variability. Second, to examine differences due to health conditions within each test condition group, 10 LME models were applied: kinematic synergy (five parameters × two test conditions) as the dependent variable, time (t) and health condition (healthy/patient) as fixed factors, introducing participants as random effect. A post-hoc study was then conducted in each of the 20 analyses to examine differences between groups at each time step to determine whether differences associated with the factor emerge during specific movement phases (cube reach, cube transport, cube release, or hand return).

2.4. Electromyographic Data Analysis

2.4.1. Cycle-Averaged sEMG Parameters Definition

Two cycle-averaged sEMG parameters based on the signal waveform were calculated for each movement cycle: NZC and EWL, as defined in Equations (3) and (4), respectively, where xi represents the filtered sEMG signal (in mV) at frame i, and L is the total signal length.
N Z C = i = 1 L N Z C i                     N Z C i = 1 ,         i f   x i > 0   a n d   x i + 1 < 0 o r       x i < 0   a n d   x i + 1 > 0         0 ,                 o t h e r w i s e                                  
E W L = i = 2 L x i   x i 1 p                     p = 0.75 ,       i f   i 0.2 L   a n d   i 0.8 L 0.50 ,                 o t h e r w i s e                                        
These parameters were rescaled between 0 and 1 per sensor for each participant using Equations (5) and (6). In these equations, k represents the sensor ID (1 to 7), and maxk and mink represent the maximum and minimum values of the respective parameter (NZC or EWL) for sensor k, which is obtained across all movement cycles for each participant.
N Z C k n o r m a l i z e d = N Z C k N Z C m i n k N Z C m a x k N Z C m i n k
E W L k n o r m a l i z e d = E W L k E W L m i n k E W L m a x k E W L m i n k
Fourteen additional sEMG cycle-averaged parameters were computed for each movement cycle based on muscular activation. As with kinematic synergies, the median and range values of muscular activation (MA) were calculated for each of the seven forearm sensors. These parameters are labelled as MAk_M (median) and MAk_R (range), where k represents the sensor ID.

2.4.2. Cycle-Averaged sEMG Parameters Analysis

As with the cycle-averaged kinematic parameters, the normality of the distribution of the 16 cycle-averaged sEMG parameters (two based on signal waveform and 14 based on muscular activation) was checked (Shapiro–Wilk test), and values across repetitions (five movement cycles) were averaged after verifying repeatability for each participant and test condition. Statistical analysis followed the same procedure, using Friedman tests to evaluate differences based on test condition within each group and Kruskal–Wallis tests to examine differences due to health condition within each test condition.

2.4.3. Temporal sEMG Analysis

Temporal evolution of the muscular activation from each of the seven sensors (labelled as MAk(t), where k is the sensor ID) was analysed following the same procedure used as for the temporal evolution of hand kinematic synergies. The same analytical procedure was followed, this time using the muscular activations (MAk(t)) as dependent variables instead of the five kinematic synergies. In this case, data from the patient excluded from the kinematic temporal evolution analysis were also excluded after visual inspection, and normalised activation signals were averaged across the selected movement cycles for the remaining participants.

3. Results

Table 2 provides a summary of the main statistically significant differences identified in the analysis, both between test conditions (RBBT vs. VBBT) and between participant groups (healthy vs. SCI patients). These findings and their implications are elaborated in the subsequent subsections.

3.1. Kinematic Data Analysis Results

3.1.1. Cycle-Averaged Kinematic Parameters Related to Trajectory: Smoothness and Efficiency

Figure 2 shows the results for both the SM and EM metrics. Figure 2a compares differences within each health condition group (healthy and patient) based on the test condition (RBBT/VBBT). Both groups showed significantly higher values during the VBBT for both metrics. Figure 2b examines differences within each test condition based on health condition. In this comparison, patients consistently exhibited significantly higher values than healthy participants for both metrics.

3.1.2. Cycle-Averaged Kinematic Parameters Related to Kinematic Synergies: Median and Ranges

Figure 3a compares differences within each health condition group due to the test condition, and Figure 3b compares differences within each test condition group due to health condition. From the graphs, it can be observed that both patients and healthy participants perform the task by flexing their fingers, while the thumb remains extended and abducted. In general, no significant differences were identified between health conditions, except for a smaller range in PIP flexion and finger abduction in patients during RBBT, and a higher median PIP flexion during VBBT. However, significant differences were found between RBBT and VBBT in both health conditions for all parameters. Note that values in Figure 3 are expected to fall within the range [−1, 1], with negative values representing extension/adduction and positive values representing flexion/abduction relative to the neutral posture. However, because of normalisation to maximum values across subjects, values may occasionally exceed 1 if participants surpass these maximums, as seen in thumb abduction.

3.1.3. Temporal Kinematic Analysis Results

Table 3 summarizes the results for the two temporal analyses performed. For healthy participants, all kinematic synergies showed significant differences as the test condition and time had an effect on all of them (there is a temporal pattern), except for thumb flexion/extension. This effect of time was significantly influenced by the test condition, meaning that there is a distinct temporal pattern depending on whether the test is performed in the real or virtual environment, except for thumb abduction. For patients, only abductions were not affected by the test condition. Unlike healthy participants, SCI patients showed no consistent temporal patterns in kinematic synergies (time had no effect), likely due to the underlying pathology or the small sample size.
During RBBT, significant differences due to health condition were found only for fingers’ PIP flexion and abduction. A temporal pattern was identified for all kinematic synergies (time had an effect on them), except for abductions, with this time effect significantly influenced by the health condition. In VBBT, health condition differences were noted only in thumb and finger PIP flexion. Similarly, a temporal pattern was identified for all kinematic synergies, except for thumb abduction, with this time effect influenced by health condition.
Figure 4 and Figure 5 illustrate the temporal evolution (mean and SD) of the kinematic synergies, alongside post-hoc results for differences at each frame between groups for the two temporal analyses performed. Four movement phases have been considered in all time plots: cube transport (a), cube release (b), hand return (c), and cube reach (d). Each graph of Figure 4 compares test conditions, while in Figure 5, the graphs compare health conditions.
For healthy participants, the temporal evolutions shown in Figure 4 align with a kinematic pattern for each test condition (RBBT and VBBT), except for Thumb_F(T), according to the results in Table 3. For patients, the time evolution shown in Figure 4 does not correspond to any specific temporal pattern. However, the figure shows that the temporal evolutions of the patients differ from those of the healthy individuals, especially in the case of VBBT in Thumb_F(t) and PIPs_F(t), particularly during the initial transport phase and in cube reaching. Differences found due to the test condition globally in both health condition groups (Table 3) are reflected at each frame, except in MCPs_F(t) during the hand-returning phase. Surprisingly, no phase-wise differences were observed in Thumb_F(t) among patients, possibly due to the small sample size.
Figure 5 illustrates the temporal patterns for flexion-extension kinematic synergies reported in Table 3, in both test condition groups, being different depending on health condition. In contrast, no temporal patterns have been found in Table 3 for abductions, except for finger abduction in VBBT, which is also affected by health conditions. Differences found due to health condition globally (Table 3) are reflected at each frame in VBBT, except while transporting and reaching the cube for Thumb_F(t), and in RBBT, except for Fingers_A(t) in any phase. The health condition does not appear at specific frames but still influences overall time evolution, explaining the global differences.

3.2. Electromyographic Data Analysis Results

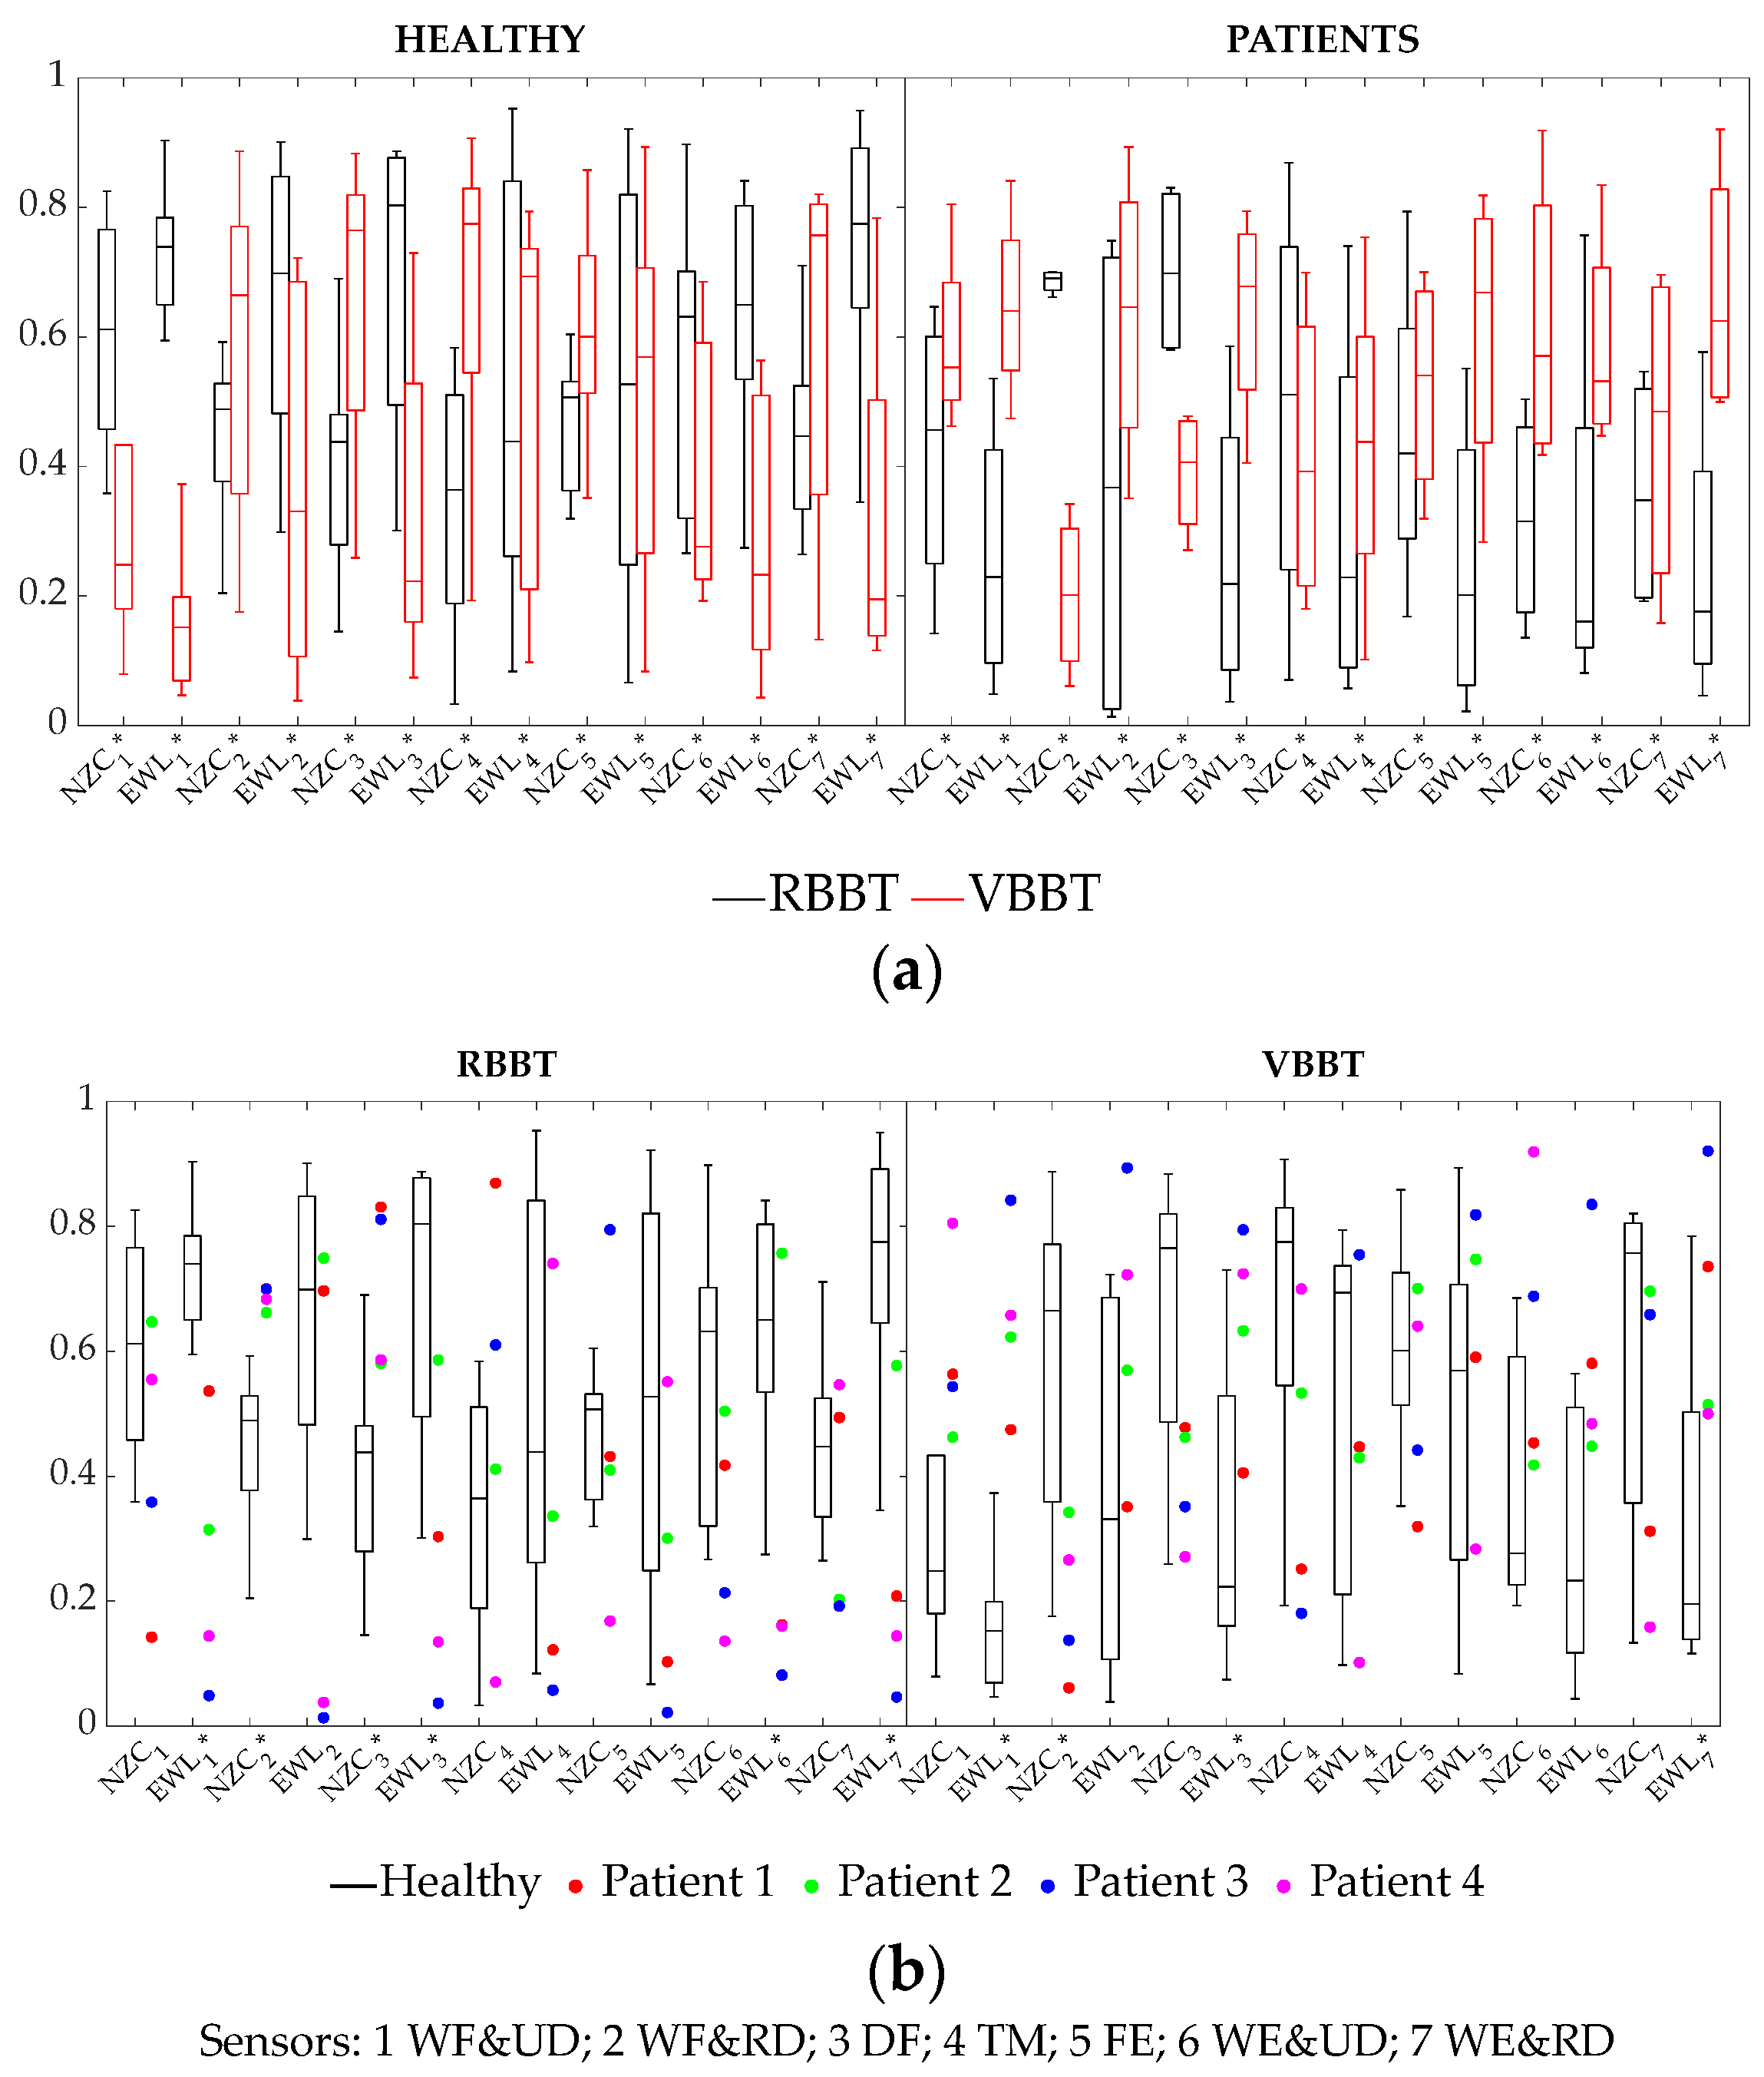
3.2.1. Cycle-Averaged sEMG Parameters Based on Signal Waveform

Figure 6a compares differences within each health condition group due to the test condition, and Figure 6b compares differences within each test condition due to health condition. Significant differences were observed for all parameters in both health conditions, depending on the test condition. Patients consistently exhibited higher values during the VBBT than the RBBT for all EWL parameters and for all NZC values, except for wrist flexion and radial deviation (sensor 2) and digit flexion (sensor 3). In contrast, healthy participants showed lower values in all EWL parameters except for thumb motion (sensor 4) and finger extension (sensor 5). Healthy participants also showed higher NZC values during VBBT compared to RBBT for all sensors, as in patients, except in this case for wrist flexion-extension with ulnar deviation (sensors 1 and 6). Significant differences were found in some EWL and NZC values between health conditions.

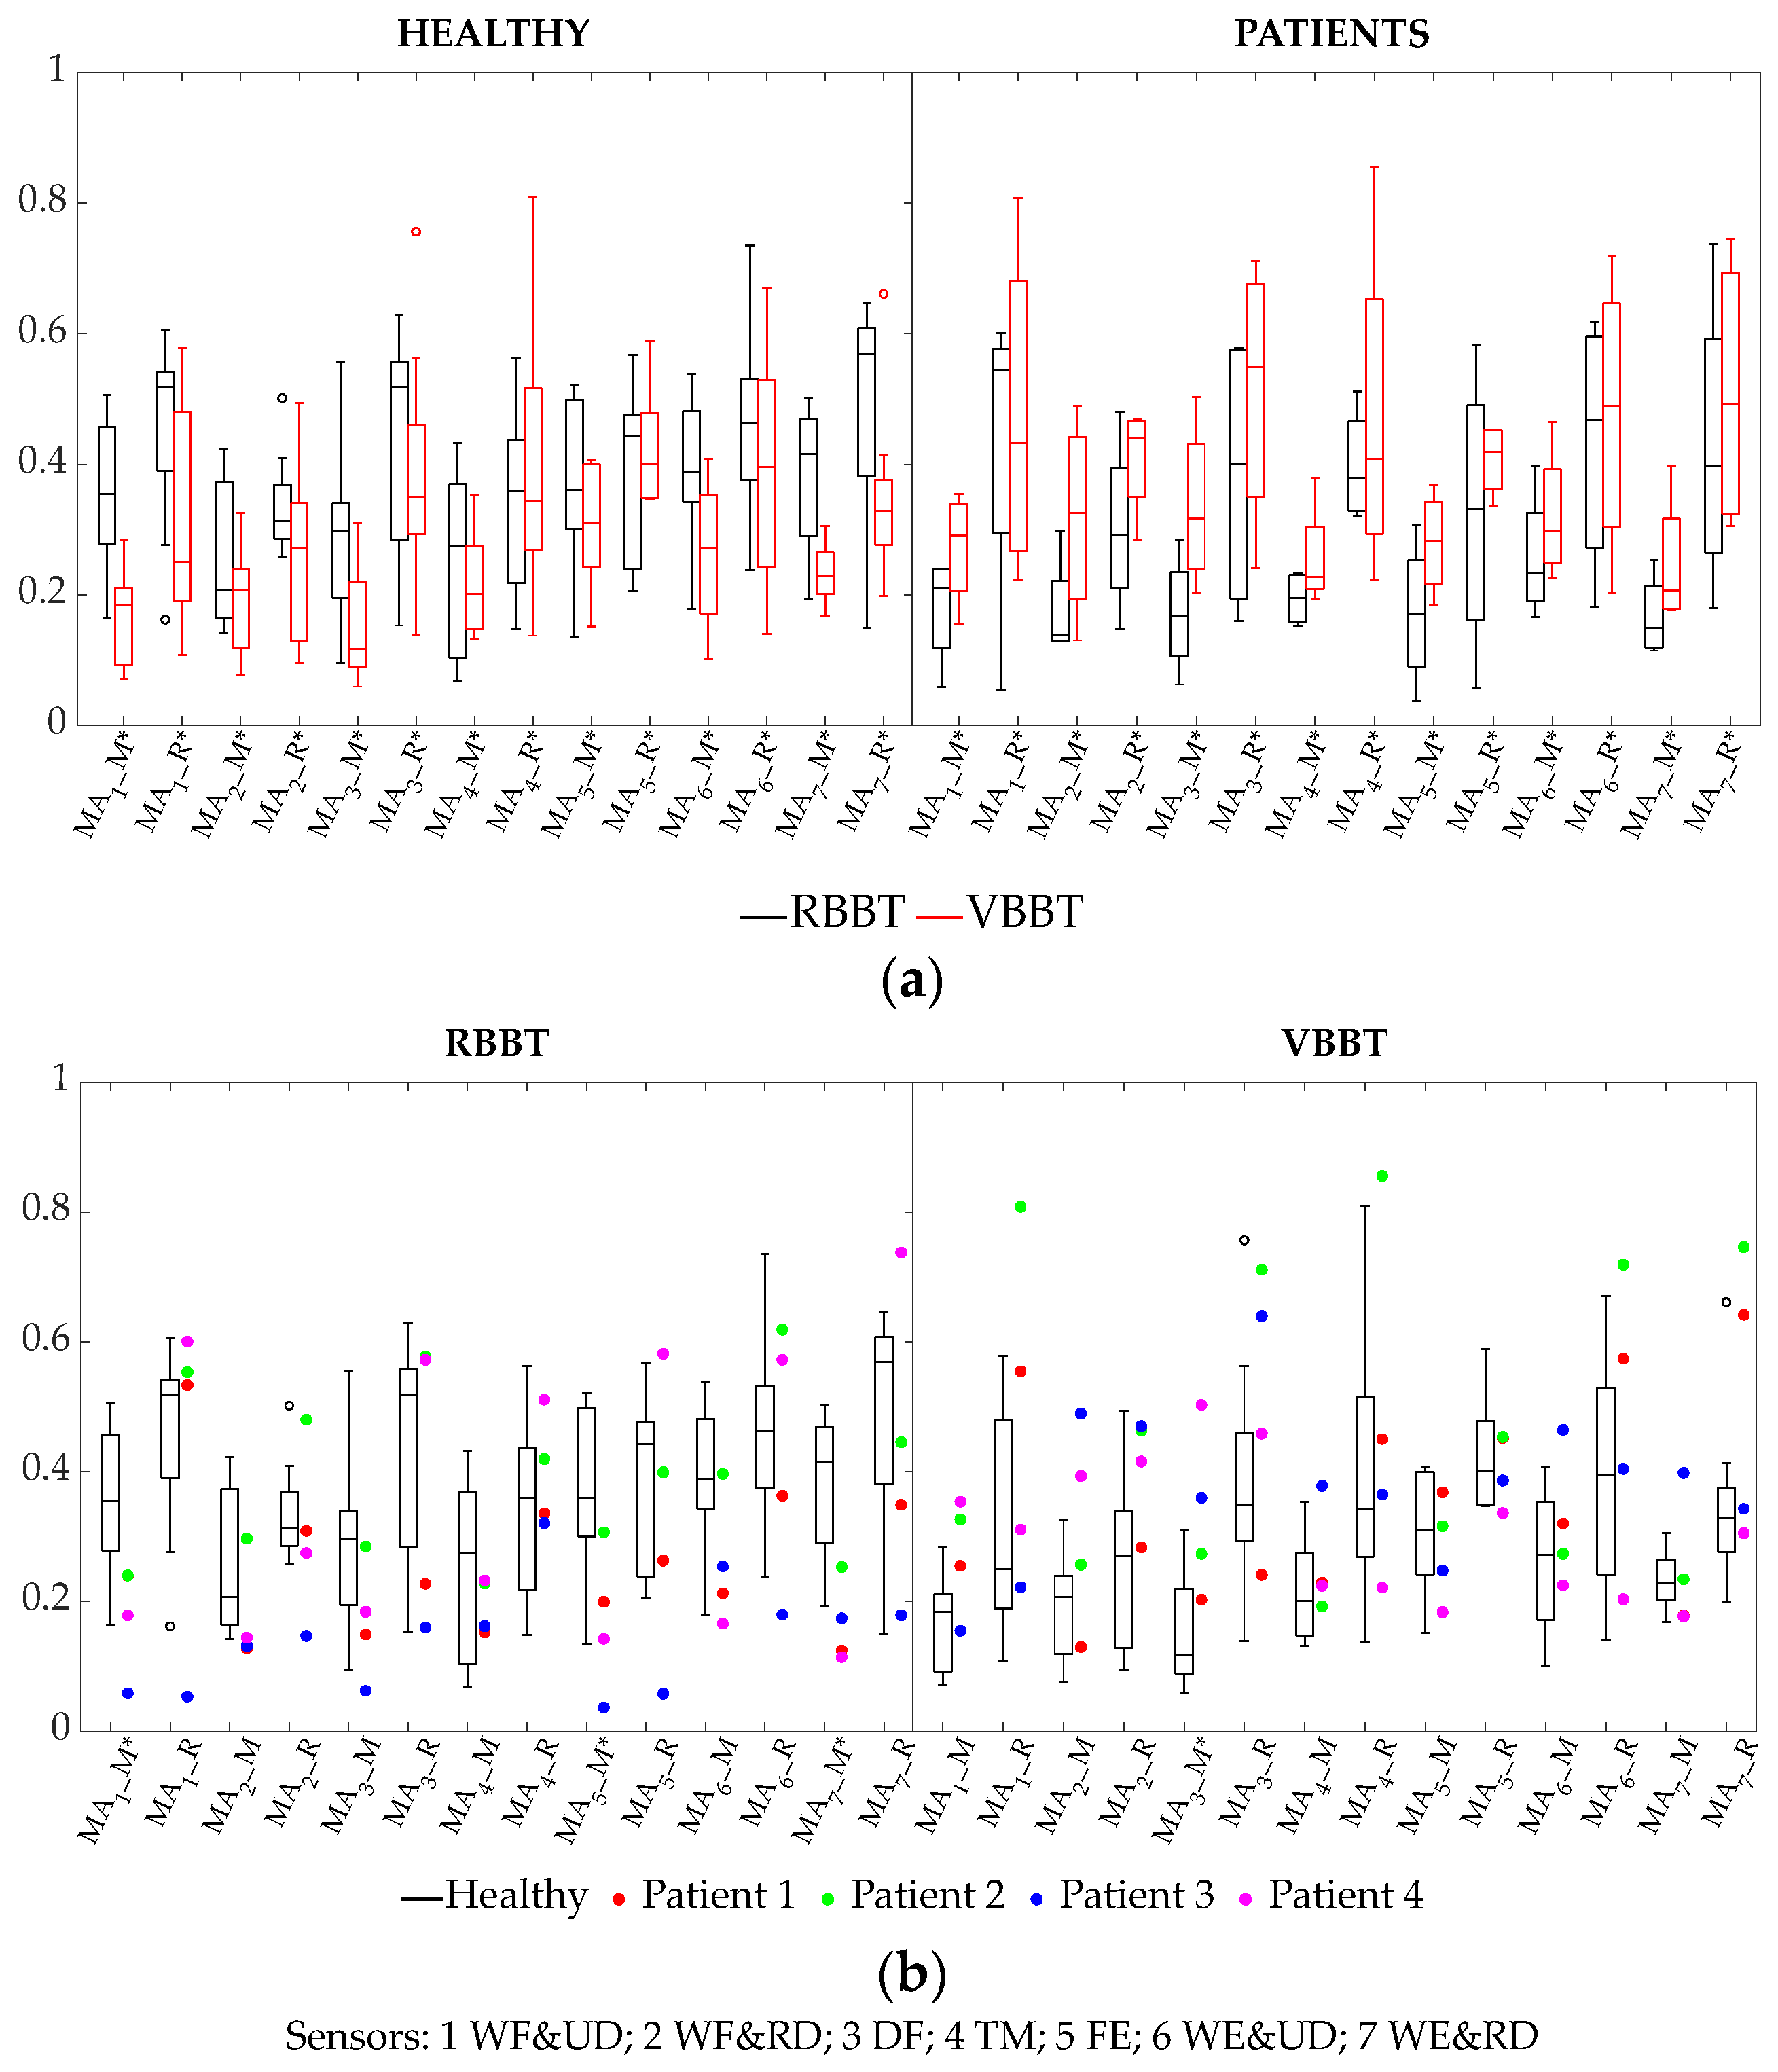
3.2.2. Cycle-Averaged Muscular Activation Parameters: Median and Ranges

Figure 7 shows the results for the cycle-averaged muscular activations. Figure 7a compares differences within each health condition group due to test condition, and Figure 7b compares the differences within each test condition due to health conditions. Similar to the results for sEMG waveform parameters, significant differences were observed for all parameters in both health conditions for all parameters depending on the test condition. As expected, values in healthy participants are consistently lower when performing the VBBT. Conversely, all values are higher in patients with the VBBT, except for the range in wrist flexion and ulnar deviation (sensor 1). Generally, no significant differences were identified between health conditions, except for a lower median activation in patients for wrist flexion and ulnar deviation (sensor 1), finger extension (sensor 5), and wrist extension and radial deviation (sensor 7) when performing the RBBT, and higher median activation in patients for digit flexion (sensor 3) in VBBT.

3.2.3. Temporal Analysis of Muscular Activation

Table 4 shows the results for the two temporal analyses conducted on muscular activation. For healthy participants, muscular activation showed significant differences due to test condition in wrist flexion and ulnar deviation (sensor 1), wrist flexion and radial deviation (sensor 2), thumb movement (sensor 4), and wrist extension and ulnar deviation (sensor 7). Time influenced all sensors (there is a temporal pattern), except for thumb movement (sensor 4). This time effect was significantly influenced by whether the test is performed in real or virtual, meaning that there is a distinct temporal pattern depending on test condition, except for wrist flexion and ulnar deviation (sensor 2) and finger extension (sensor 5). For patients, the test condition affected only wrist flexion and ulnar deviation (sensor 2) and digit flexion, and as for kinematic synergies, no temporal patterns were observed in muscular activation (time had no effect), unlike in healthy participants, likely due to pathology or limited sample size.
In RBBT, significant differences due to health condition were found only for finger extension (sensor 5) and for wrist extension and ulnar deviation (sensor 7). No temporal pattern was identified for any muscular activation (time had no effect on them), except for wrist extension and ulnar deviation (sensor 7), with this time effect significantly influenced by health condition. In VBBT, health condition differences were noted only in wrist flexion and ulnar deviation (sensor 2) and digit flexion (sensor 3). A temporal pattern was identified for muscular activation in wrist flexion and ulnar deviation (sensor 2), digit flexion (sensor 3), thumb movement (sensor 4), and wrist extension and ulnar deviation (sensor 7), with this time effect influenced by health condition.
Figure 8 and Figure 9 illustrate the temporal evolution (mean and SD) of muscular activation, alongside post-hoc results for differences at each frame between groups for the two temporal analyses performed. The same four phases as in kinematics are considered. For healthy participants, the temporal evolutions of the muscle activation shown in Figure 8 align with a muscular activation pattern for each test condition (RBBT and VBBT), except for thumb movement (sensor 4), as reported in Table 4. For patients, the muscular activation evolution shown in Figure 8 does not correspond to any specific temporal pattern. However, the figure shows that the temporal evolutions of the patients differ from those of the healthy individuals not only in the waveform, but also in their smoothness with signals with peaks, specially for the VBBT.
Notably, Table 4 revealed almost no temporal patterns for muscle activation in RBBT, despite these being influenced by the health condition. This is likely due to the evolution of patients disrupting the presence of a temporal pattern, which is present in healthy participants. Figure 9 illustrates how muscle activations are consistently higher in healthy participants during RBBT. In contrast, the health condition significantly affects only MA5(t) and MA7(t), with differences observed across all frames except during the phase of hand return, and occasionally in other regions for MA5(t). In VBBT, differences found in MA2(t) and MA3(t) due to health conditions globally are also reflected at each frame. In contrast to RBBT, muscle activations are consistently lower in healthy participants during VBBT. Temporal patterns found in Table 4 for MA2(t), MA3(t), MA4(t), and MA7(t) affected by health condition are reflected.

4. Discussion

This study presents a comprehensive dynamic analysis, encompassing both kinematics and muscle activation, in healthy individuals and four SCI patients performing both real and virtual versions of the BBT. The goal is to deepen our understanding of how VR impacts motor control and muscle engagement. While numerous studies evaluate pre- and post-rehabilitation improvements with VR, there is a notable gap in research examining how VR affects mobility and muscular demands during use. Addressing this gap is crucial for designing VR-based rehabilitation games that replicate the physical demands of real-world tasks. Such alignment is essential for promoting occupational rehabilitation aimed at improving daily living activities, as emphasized by the World Health Organization [26].
Parameters related to hand trajectory during the BBT were analysed, building on previous studies that used these metrics obtained from kinematics recorded on a virtual platform where trajectories are performed prior to and after rehabilitation to detect motor control improvements achieved through motor-assisted rehabilitation in SCI patients [16]. Such rehabilitation has been shown to enhance smoothness by reducing velocity peaks (SM) and improve efficiency by shortening trajectory length (EM). This study reveals that, for both healthy participants and patients, virtual reality results in longer trajectories (EM) and higher velocity peaks (SM), likely due to challenges in controlling the virtual environment experienced by both groups. When comparing health conditions, patients exhibit worse outcomes—longer trajectories and higher peaks—during both the real and virtual BBT, reflecting the motor control difficulties faced by this population [8]. Effective virtual rehabilitation should aim to reduce these parameters (EM and SM) to levels more comparable to those of healthy participants. Additionally, efforts should be made to bring the virtual environment closer to real-world conditions. Incorporating tactile feedback or other sensory cues could improve the motor control and interaction experience, making the rehabilitation process more effective and realistic.
Differences in kinematic synergies are observed between real and virtual BBT in both groups (healthy participants and patients) across all synergies. Notably, while the virtual test leads to greater thumb abduction in all participants, it induces increased thumb and PIP joint flexion in patients, contrary to the behaviour seen in healthy participants with fingers more relaxed and extended. This increased motor control difficulty in the virtual BBT, as indicated by trajectory parameters, likely results in greater difficulty grasping the cubes, requiring different thumb and finger flexion synergies, likely due to the absence of the tactile feedback that is present in the real BBT. When analysing the groups separately based on whether the test is real or virtual, the real BBT shows minimal range differences due to health conditions. However, in the virtual BBT, patients adopt a more flexed PIP position. This increased flexion may reflect greater motor control challenges for patients due to the absence of tactile feedback during the virtual test or may be attributed to the common hand-closing tendency observed in SCI patients, commonly associated with spasticity or impaired neuromuscular control [27,28].
As an innovative contribution, this study analyses the temporal evolution of kinematic synergies during a movement cycle in the BBT, identifying phases where consistent patterns emerge. Figure 4 highlights patterns for healthy participants across all kinematic synergies, except for Thumb_F(t), with notable differences depending on whether the task involves RBBT or VBBT. The inexistence of a clear pattern in thumb flexion might be due to higher variability in thumb synergies in healthy patients during manipulability [24]. The figure also includes a frame-by-frame analysis. These global differences in kinematic synergies due to the test condition are reflected at each frame, except for MCPs_F(t) during cube release. The temporal evolution of kinematic synergies for patients is also presented in the figure, but no clear temporal patterns emerge in their case. It is evident that the temporal evolutions of patients differ markedly from healthy individuals, particularly in VBBT for Thumb_F(t) and PIPs_F(t), especially during the initial transport phase and while grasping the cube. This difference may stem from the fact that, in patients with SCI, spasticity or a tendency toward a closed-hand posture is common due to muscle weakness in the extensors [29]. This forces patients to compensate by using greater thumb flexion and PIP joint movement to achieve and maintain a grip on the cube. This behaviour may be exacerbated by the lack of tactile feedback, leading to less precise movements, which affects patients more significantly. Figure 5 also highlights temporal patterns for flexion-extension kinematic synergies for both RBBT and VBBT, which are different depending on health condition.
Cycle-averaged sEMG parameters derived from signal waveforms (NZC and EWL) revealed that healthy participants exhibited lower values during VBBT compared to RBBT across some parameters, likely due to the reduced sensory-motor demands and altered interaction dynamics in the virtual environment. In contrast, patients demonstrated higher values in many parameters, particularly in EWL across all sensors and in all NZC except for wrist flexion and radial deviation, digit flexion, and thumb movement. This could stem from impaired coordination and reliance on excessive muscle activity to stabilize movements when grasping a virtual cube in the absence of sensory feedback. Patients show smaller EWL values in RBBT but higher EWL values in VBBT across most sensors, while NZC values in patients are lower for some sensors in RBBT but higher for others in VBBT. These differences may reflect the increased motor control challenges faced by patients in adapting to the virtual environment, where the absence of tactile feedback and reliance on visual and proprioceptive inputs could lead to altered and less efficient muscle-activation strategies. This highlights how the test condition significantly influences motor performance in patients compared to healthy individuals.
Consistent with the results of sEMG waveform-based parameters, the analysis of muscle activity revealed significant differences for all parameters in both health conditions, depending on the test condition. Values in healthy participants were consistently lower during the VBBT, which was expected given the absence of a real grasping action. Conversely, most values were higher in patients during the VBBT. This discrepancy may stem again from the greater motor control challenges patients face in the virtual environment, potentially leading to increased muscle activation to compensate for reduced tactile feedback and coordination difficulties. Although no general differences were observed when analysing each test condition group comparing health condition, patients showed lower median activation in some movements during RBBT, reflecting reduced motor efficiency and higher activation in digit flexion during VBBT, likely due to compensatory effort from the lack of tactile feedback in the virtual environment. These observations highlight the importance of tailoring virtual rehabilitation strategies to address these differential motor demands.
This study extends the analysis of temporal patterns to muscle activation, complementing insights from kinematic synergies. Healthy participants exhibit consistent patterns of muscle activation across sensors (Figure 8 and Figure 9), except for thumb movement (sensor 4), reflecting their adaptability to motor demands. Global differences due to test conditions (e.g., MA1(t), MA2(t), MA4(t), MA7(t)) are consistently observed across frames. Despite no patterns being found for patients, the temporal evolutions of the patients differ from those of the healthy individuals, limiting their ability to maintain smooth activation. Variability in VBBT aligns with kinematic findings of increased peaks and less smooth trajectories, reflecting compensatory movements due to impaired motor control and the absence of tactile feedback. Healthy participants exhibit higher activations in RBBT.
These results emphasize the importance of rehabilitation approaches to enhance motor control and feedback integration, aiming to align patient performance with healthy patterns. Drawing upon previous studies where kinematic data from the LMC has been effectively employed to classify daily activities through machine learning during grasping tasks [30], it could be plausible that hand tracking with appropriate machine-learning techniques could be used to detect kinematic patterns. Future research could leverage hand kinematics recorded directly from the LMC during rehabilitation exercises to analyse and classify levels of improvement, enabling adaptive difficulty adjustment. This approach would eliminate the need for external devices, such as the CyberGlove used in this study, to identify kinematic differences. However, while LMC-based kinematics provide valuable insights, electromyographic signals also offer critical information that requires external sensors to capture, emphasizing their complementary role in rehabilitation assessment.
One limitation of this study is the fixed order in which test conditions were administered, which could potentially influence the results, particularly in the sEMG measurements. Future studies should consider randomizing the order of RBBT and VBBT to minimize potential order effects and reduce the influence of learning or fatigue bias. Another limitation is the inclusion of only right-handed participants, which may limit the generalizability of the findings to left-handed individuals, who may exhibit different motor control patterns.

Author Contributions

V.G.-I., A.d.l.R.-G., M.V. and J.-L.S.-B. conceptualized the research question. V.G.-I., A.d.l.R.-G., M.V. and N.J.J.-B. developed the experimental protocol and collected the data. V.G.-I. performed the formal analysis and drafted the original manuscript. J.-L.S.-B., M.V. and N.J.J.-B. contributed to the writing, review, and editing phases. A.d.l.R.-G. supervised patient eligibility for recruitment and reviewed the manuscript. V.G.-I., A.d.l.R.-G. and M.V. collaborated on the funding acquisition. All authors have read and agreed to the published version of the manuscript.

Funding

This research was funded by the Universitat Jaume I of Castelló (SPAIN), grant number UJI-A2021-03, by MCIN/AEI/10.13039/501100011033 and “ERDF A way of making Europe” through project PGC2018-095606-B-C21, as well as by projects DPI2016-77167-R and PID2020-117361RB-C22 and by Generalitat Valenciana through project CIAICO/2023/067.

Institutional Review Board Statement

The study was conducted in accordance with the Declaration of Helsinki, and approved by the Ethics Committee of Complejo Hospitalario de Toledo (protocol code No. 372, 30 April 2019), and by the Human Research Ethics Committee of Universitat Jaume I (reference number CD/27/2022).

Informed Consent Statement

Written informed consent was obtained from all participants involved in the study, healthy participants, and patients with SCI to publish this paper.

Data Availability Statement

The data presented in this study are available upon request from the corresponding author.

Acknowledgments

The authors acknowledge the use of ChatGPT (OpenAI, GPT-4) for language revision support.

Conflicts of Interest

The authors declare no conflict of interest.

References

  1. Aguilera-Rubio, A.; Alguacil-Diego, I.M.; Mallo-López, A.; Cuesta-Gómez, A. Use of the Leap Motion Controller® System in the Rehabilitation of the Upper Limb in Stroke. A Systematic Review. J. Stroke Cerebrovasc. Dis. 2022, 31, 106174. [Google Scholar] [CrossRef] [PubMed]
  2. Kintschner, N.R.; Liporace, T.L.; Blascovi-Assis, S.M.; Corrêa, A.G.D. The Use of Leap Motion in Manual Dexterity Testing by the Box and Blocks Test: A Review Study; Open Access Book: The Hague, The Netherlands, 2022. [Google Scholar] [CrossRef]
  3. Baranyi, R.; Körber, Y.; Galimov, P.; Parandeh, Z.; Grechenig, T. Rehafox–A therapeutical approach developing a serious game to support rehabilitation of stroke patients using a leap motion controller. Clin. eHealth 2023, 6, 85–95. [Google Scholar] [CrossRef]
  4. Iosa, M.; Fusco, A.; Castagnoli, M.; Fusco, F.R.; Pratesi, L. Leap motion controlled videogame-based therapy for rehabilitation of elderly patients with subacute stroke: A feasibility pilot study. Top. Stroke Rehabil. 2015, 22, 306–316. [Google Scholar] [CrossRef]
  5. Fong, K.N.K.; Tang, Y.M.; Sie, K.; Yu, A.K.H.; Lo, C.C.W.; Ma, Y.W.T. Task-specific virtual reality training on hemiparetic upper extremity in patients with stroke. Virtual Real. 2022, 26, 453–464. [Google Scholar] [CrossRef]
  6. Wu, Y.T.; Chen, K.H.; Ban, S.L.; Tung, K.Y.; Chen, L.R. Evaluation of leap motion control for hand rehabilitation in burn patients: An experience in the dust explosion disaster in Formosa Fun Coast. Burns 2019, 45, 157–164. [Google Scholar] [CrossRef]
  7. Fernández-González, P.; Carratalá-Tejada, M.; Monge-Pereira, E. Leap motion controlled video game-based therapy for upper limb rehabilitation in patients with Parkinson’s disease: A feasibility study. J. Neuroeng. Rehabil. 2019, 16, 133. [Google Scholar] [CrossRef]
  8. Reyes-Guzmán, A.D.L.; Lozano-Berrio, V.; Alvarez-Rodríguez, M.; López-Dolado, E.; Ceruelo-Abajo, S.; Talavera-Díaz, F.; Gil-Agudo, A. RehabHand: Oriented-tasks serious games for upper limb rehabilitation by using Leap Motion Controller and target population in spinal cord injury. NeuroRehabilitation 2021, 48, 365–373. [Google Scholar] [CrossRef]
  9. Nattah, M.M.A.A.; Tiberti, S.; Segaletti, L. Semi-Immersive Virtual Reality Exercise Therapy for Upper Limb Rehabilitation in Patients With Spinal Cord Injury Using the Leap Motion Controller. Cureus 2024, 16, e52261. [Google Scholar] [CrossRef] [PubMed]
  10. Alvarez-Rodríguez, M.; López-Dolado, E.; Salas-Monedero, M.; Lozano-Berrio, V. Concurrent Validity of a Virtual Version of Box and Block Test for Patients with Neurological Disorders. World J. Neurosci. 2019, 10, 79–89. [Google Scholar] [CrossRef]
  11. Daliri, M.; Moradi, A.; Fatorehchy, S.; Bakhshi, E.; Moradi, E.; Sabbaghi, S. Investigating the Effect of Leap Motion on Upper Extremity Rehabilitation in Children with Cerebral Palsy: A Randomized Controlled Trial. Dev. Neurorehabil. 2023, 26, 244–252. [Google Scholar] [CrossRef]
  12. Everard, G.; Otmane-Tolba, Y.; Rosselli, Z.; Pellissier, T.; Ajana, K.; Dehem, S. Concurrent validity of an immersive virtual reality version of the Box and Block Test to assess manual dexterity among patients with stroke. J. Neuroeng. Rehabil. 2022, 19, 7. [Google Scholar] [CrossRef] [PubMed]
  13. Oña, E.D.; Jardón, A.; Cuesta-Gómez, A.; Sánchez-Herrera-baeza, P.; Cano-De-la-cuerda, R.; Balaguer, C. Validity of a Fully-Immersive VR-Based Version of the Box and Blocks Test for Upper Limb Function Assessment in Parkinson’s Disease. Sensors 2020, 20, 2773. [Google Scholar] [CrossRef] [PubMed]
  14. Everard, G.; Burton, Q.; Sype, V.V.D.; Bibentyo, T.N. Extended reality to assess post-stroke manual dexterity: Contrasts between the classic box and block test, immersive virtual reality with controllers, with hand-tracking, and mixed-reality tests. J. Neuroeng. Rehabil. 2024, 21, 36. [Google Scholar] [CrossRef] [PubMed]
  15. Cho, S.; Kim, W.S.; Paik, N.J.; Bang, H. Upper-Limb Function Assessment Using VBBTs for Stroke Patients. IEEE Comput. Graph. Appl. 2016, 36, 70–78. [Google Scholar] [CrossRef]
  16. Salas-Monedero, M. Smoothness and Efficiency Metrics Behavior after an Upper Extremity Training with Robic Humanoid Robot in Paediatric Spinal Cord Injured Patients. Appl. Sci. 2023, 13, 4979. [Google Scholar] [CrossRef]
  17. Guna, J.; Jakus, G.; Pogačnik, M.; Tomažič, S.; Sodnik, J. An Analysis of the Precision and Reliability of the Leap Motion Sensor and Its Suitability for Static and Dynamic Tracking. Sensors 2014, 14, 3702–3720. [Google Scholar] [CrossRef]
  18. Teruel, M.A. Picking cubes: A rehabilitation tool for improving the rehabilitation of gross manual dexterity. Adv. Intell. Syst. Comput. 2019, 806, 265–273. [Google Scholar] [CrossRef]
  19. Reyes-Guzmán, A.D.L.; García, F.; Alvarez-Rodríguez, M.; Lozano-Berrio, V.; Domingo-García, A.M.; Ceruelo-Abajo, S. Low-cost virtual reality. A new application for upper extremity motor rehabilitation in neurological pathology: Pilot study. Ann. Rehabil. Medicine 2022, 56, 173–181. [Google Scholar] [CrossRef]
  20. Rupp, R. International Standards for Neurological Classification of Spinal Cord Injury: Revised 2019. Top. Spinal Cord Inj. Rehabil. 2021, 27, 1–22. [Google Scholar] [CrossRef]
  21. Gracia-Ibáñez, V.; Vergara, M.; Buffi, J.H.; Murray, W.M.; Sancho-Bru, J.L. Across-subject calibration of an instrumented glove to measure hand movement for clinical purposes. Comput. Methods Biomech. Biomed. Eng. 2017, 20, 587–597. [Google Scholar] [CrossRef]
  22. Jarque-Bou, N.J.; Vergara, M.; Sancho-Bru, J.L.; Roda-Sales, A.; Gracia-Ibáñez, V. Identification of forearm skin zones with similar muscle activation patterns during activities of daily living. J. Neuroeng. Rehabil. 2018, 15, 91. [Google Scholar] [CrossRef] [PubMed]
  23. Gracia-Ibáñez, V.; Vergara, M.; Sancho-Bru, J.L.; Mora, M.C.; Piqueras, C. Functional range of motion of the hand joints in activities of the International Classification of Functioning, Disability and Health. J. Hand Ther. 2017, 30, 337–347. [Google Scholar] [CrossRef] [PubMed]
  24. Gracia-Ibáñez, V.; Sancho-Bru, J.L.; Vergara, M.; Jarque-Bou, N.J.; Roda-Sales, A. Sharing of hand kinematic synergies across subjects in daily living activities. Sci. Rep. 2020, 10, 11097. [Google Scholar] [CrossRef] [PubMed]
  25. Macey, P.M.; Schluter, P.J.; Macey, K.E.; Harper, R.M. Detecting variable responses in time-series using repeated measures ANOVA: Application to physiologic challenges. F1000Research 2016, 5, 563. [Google Scholar] [CrossRef]
  26. World Health Organization. Towards a Common Language for Functioning, Disability and Health ICF The International Classification of Functioning, Disability and Health; World Health Organization: Geneva, Switzerland, 2002. [Google Scholar]
  27. Gohritz, A.; Fridén, J. Management of Spinal Cord Injury-Induced Upper Extremity Spasticity. Hand Clin. 2018, 34, 555–565. [Google Scholar] [CrossRef]
  28. Miall, R.C.; Rosenthal, O.; Ørstavik, K.; Cole, J.D.; Sarlegna, F.R. Loss of haptic feedback impairs control of hand posture: A study in chronically deafferented individuals when grasping and lifting objects. Exp. Brain Res. 2019, 237, 2167–2184. [Google Scholar] [CrossRef]
  29. Calabro, F.J.; Perez, M.A. Bilateral reach-to-grasp movement asymmetries after human spinal cord injury. J. Neurophysiol. 2016, 115, 157–167. [Google Scholar] [CrossRef]
  30. Razavian, R.S.; Mehrabi, N.; McPhee, J. A model-based approach to predict muscle synergies using optimization: Application to feedback control. Front. Comput. Neurosci. 2015, 9, 121. [Google Scholar] [CrossRef]
Figure 1. Experimental setup showing a participant instrumented and performing the task. The RBBT and the VBBT are shown at the bottom left and bottom right, respectively.
Applsci 15 05842 g001
Figure 2. (a) Box-and-whisker plots of trajectory parameters: Efficiency Metric (EM, representing trajectory length) and Smoothness Metric (SM, representing the number of velocity peaks detected per trajectory) for healthy (left) and patient (right) groups, comparing test conditions (RBBT and VBBT). (b) Plots of trajectory parameters for real (left) and virtual (right) BBT, comparing health conditions (healthy and patient). Significant differences (p < 0.05) are indicated by an asterisk (*) following the name of the variable.
Applsci 15 05842 g002
Figure 3. (a) Box-and-whiskers plots of the two kinematic parameters (_M: median and _R: range) for the five kinematic synergies (Thumb_F, MCPs_F, PIPs_F, Thumb_A, Fingers_A) for healthy (left) and patient (right) groups. (b) Plots of these parameters for real (left) and virtual (right) BBT. Significant differences (p < 0.05) are marked with an asterisk * after the name of the variable.
Applsci 15 05842 g003
Figure 4. Mean and standard deviation of kinematic synergies over time for each health condition group. To indicate statistical differences at each frame, a small green asterisk (*) is shown in the upper area of the figure in accordance with the legend. Due to the figure size, asterisks may appear as small dots, and if differences occur across consecutive frames, they may resemble line segments. If no global differences due to test condition (RBBT/VBBT) are observed across participants (Table 3), no asterisks indicating significant differences at each frame between groups are displayed. Time has been divided into four phases: Cube Transport (a), Cube Release (b), Hand Return (c), and Cube Reach (d).
Applsci 15 05842 g004
Figure 5. Mean and standard deviation of the kinematic synergies over time for each test condition group. To indicate statistical differences at each frame, a small green asterisk (*) is shown in the upper area of the figure in accordance with the legend. Due to the figure size, asterisks may appear as small dots, and if differences occur across consecutive frames, they may resemble line segments. If no global differences due to health condition (healthy/patient) are observed across participants (Table 3), no asterisks indicating significant differences at each frame between groups are displayed. Time has been divided into four phases: Cube Transport (a), Cube Release (b), Hand Return (c), and Cube Reach (d).
Applsci 15 05842 g005
Figure 6. (a) Box-and-whiskers plots of the two cycle-averaged sEMG parameters based on signal waveform (NZC, EWL) for each of the seven sensors for healthy (left) and patients (right) groups. (b) Box-and-whiskers plots of the same parameters for real (left) and virtual (right) BBT. Sensor locations approximately corresponded to (1) wrist flexion and ulnar deviation, (2) wrist flexion and radial deviation, (3) digit flexion, (4) thumb extension and abduction/adduction, (5) finger extension, (6) wrist extension and ulnar deviation, and (7) wrist extension and radial deviation [22]. Significant differences (p < 0.05) are indicated by an asterisk (*) following the corresponding variable name.
Applsci 15 05842 g006
Figure 7. (a) Box-and-whiskers plots of the two cycle-averaged muscular activation parameters (Median, Range) for the seven sensors for healthy (left) and patient (right) groups. (b) Plots of same parameters for real (left) and virtual (right) BBT. Significant differences (p < 0.05) are marked with an asterisk * after the name of the variable.
Applsci 15 05842 g007
Figure 8. Mean and standard deviation of muscular amplitude over time for each health condition group. To indicate statistical differences at each frame, a small green asterisk (*) is shown in the upper area of the figure in accordance with the legend. Due to the figure size, asterisks may appear as small dots, and if differences occur across consecutive frames, they may resemble line segments. If no global differences due to test condition (RBBT/VBBT) are observed across participants (Table 4), no asterisks indicating significant differences at each frame between groups are displayed. Time is divided into four phases: Cube Transport (a), Cube Release (b), Hand Return (c), and Cube Reach (d).
Applsci 15 05842 g008
Figure 9. Mean and standard deviation of muscular amplitude over time for each test condition group. To indicate statistical differences at each frame, a small green asterisk (*) is shown in the upper area of the figure in accordance with the legend. Due to the figure size, asterisks may appear as small dots, and if differences occur across consecutive frames, they may resemble line segments. If no global differences due to health condition (healthy/patient) are observed across participants (Table 4), no asterisks indicating significant differences at each frame between groups are displayed. Time has been divided into four phases: Cube Transport (a), Cube Release (b), Hand Return (c), and Cube Reach (d).
Applsci 15 05842 g009
Table 1. Demographics and functional characteristics of the study sample.
VariablesSample Analysed
Healthy (n = 9)SCI Patients (n = 4)
Sex (Male) *1 (11.11%)4 (100.00%)
Age (Years) +33.33 ± 13.1234.75 ± 13.07
Etiology Injury (Traumatic)-4 (100%)
Time Since Injury (Months)-7.50 ± 3.00
Injury Level-C4:1 (25.00%)
-C5:1 (25.00%)
-C6:1 (25.00%)
-C8:1 (25.00%)
AIS Classification
A-2 (50.00%)
B-1 (25.00%)
C--
D-1 (25.00%)
SCIM-III100.00 ± 00.00 a53.50 ± 25.30 a
Upper Extremity Motor Score25.00 ± 00.00 a17.50 ± 6.45 a
a (p < 0.01); * categorical variables are expressed as frequency and percentage in parentheses; + continuous variables are expressed as mean and standard deviation.
Table 2. Summary of statistically significant differences in kinematic and electromyographic (EMG) parameters between test conditions (RBBT vs. VBBT) and participant groups (healthy vs. SCI). For brevity, H is used for healthy group and P for SCI patients’ group.
Kinematics—Cycle-Averaged Parameters
Differences Between Tests Within Each Sample
SampleTests
Trajectory Smoothness (SM)HVBBT > RBBT
PVBBT > RBBT
Trajectory Length (EM)HVBBT > RBBT
PVBBT > RBBT
Thumb Flexion (Median)HRBBT > VBBT
PVBBT > RBBT
Thumb Flexion (Range)HVBBT > RBBT
PVBBT > RBBT
MCP Flexion (Median)HVBBT > RBBT
PRBBT > VBBT
MCP Flexion (Range)HVBBT > RBBT
PVBBT > RBBT
PIP Flexion (Median)HRBBT > VBBT
P-
PIP Flexion (Range)HVBBT > RBBT
PVBBT > RBBT
Thumb Abduc. (Median)HVBBT > RBBT
PVBBT > RBBT
Thumb Abduc. (Range)HRBBT > VBBT
P-
Fingers Abduc. (Median)HRBBT > VBBT
P-
Fingers Abduc. (Range)HVBBT > RBBT
PVBBT > RBBT
Differences Between Samples Within Each Test
TestSamples
Trajectory Smoothness (SM)RBBTP > H
VBBTP > H
Trajectory Length (EM)RBBTP > H
VBBTP > H
PIP Flexion (Median)RBBT-
VBBTP > H
PIP Flexion (Range)RBBTH > P
VBBT-
Finger Abduction (Range)RBBTH > P
VBBT-
Kinematics—Temporal Patterns
Patterns Across Participants Within Each Sample
MCP Flexion (t)
PIP Flexion (t)
Thumb Abduc. (t)
Fingers Abduc. (t)
HDistinct temporal patterns per test type (VBBT ≠ RBBT)
P-
Patterns Across Participants Within Each Test
Thumb Flexion (t)RBBTDistinct temporal patterns
VBBTDistinct temporal patterns per sample
(H ≠ P)
MCP Flexion (t)RBBTDistinct temporal patterns
VBBTDistinct temporal patterns
PIP Flexion (t)RBBTDistinct temporal patterns per sample
(H ≠ P)
VBBTDistinct temporal patterns per sample
(H ≠ P)
Fingers Abduc. (t)RBBT-
VBBTDistinct temporal patterns
EMG—Cycle-Averaged Parameters
Differences Between Tests Within Each Sample
SampleTests
EWL (sensors 1, 2, 3, 6, 7)HRBBT > VBBT
PVBBT > RBBT
EWL (sensors 4, 5)HVBBT > RBBT
PVBBT > RBBT
NCZ (sensors 1, 6)HRBBT > VBBT
PVBBT > RBBT
NCZ (sensors 2, 3, 4)HVBBT > RBBT
PRBBT > VBBT
NCZ (sensors 5, 7)HVBBT > RBBT
PVBBT > RBBT
MA median (sensors 1, 2, 3, 4, 5, 6, 7)HRBBT > VBBT
PVBBT > RBBT
MA range (sensors 1, 2, 3, 4, 5, 6, 7)HRBBT > VBBT
PVBBT > RBBT
Differences Between Samples Within Each Test
TestSamples
EWL (sensors 1, 3, 7)RBBTH > P
VBBTP > H
EWL (sensor 6)RBBTH > P
VBBT-
NCZ (sensor 2)RBBTP > H
VBBTH > P
NCZ (sensor 3)RBBTP > H
VBBT-
MA median (sensors 1, 5, 7)RBBTH > P
VBBT-
MA median (sensor 3)RBBT-
VBBTP > H
EMG—Temporal Patterns
Patterns Across Participants Within Each Sample
MA1 (t), MA2 (t), MA7 (t)HDistinct temporal patterns per test type (VBBT ≠ RBBT)
P-
MA3 (t), MA5 (t), MA6 (t)HDistinct temporal patterns
P-
Patterns Across Participants Within Each Test
MA2 (t), MA3 (t)RBBT-
VBBTDistinct temporal patterns per sample
(H ≠ P)
MA4 (t)RBBT-
VBBTDistinct temporal patterns
MA7 (t)RBBTDistinct temporal patterns per sample
(H ≠ P)
VBBTDistinct temporal patterns
Table 3. Factors showing significant differences (p < 0.05), indicated with an asterisk (*), in the two temporal analyses performed on the kinematic synergies. First, one LME analysis per kinematic synergy for each health condition, with time (t), test condition (TC: RBBT and VBBT), and their interaction (t:TC) as fixed factors. Second, one LME analysis per kinematic synergy for each test condition, with time (t), health condition (HC: healthy and patients), and their interaction (t:HC) as fixed factors.
Kinematic Synergy
Thumb_F(t)MCPs_F(t)PIPs_F(t)Thumb_A(t)Fingers_A(t)
Health condition groupsFactorsFactorsFactorsFactorsFactors
tTCt:TCtTCt:TCtTCt:TCtTCt:TCtTCt:TC
Healthy ********** ***
Patient ** ** ** *
Test condition groupsFactorsFactorsFactorsFactorsFactors
tHCt:HCtHCt:HCtHCt:HCtHCt:HCtHCt:HC
RBBT* ** **** * **
VBBT**** **** * *
Table 4. Factors with significant differences (p < 0.05, marked with an asterisk) in the two LME analyses of muscular activation. The first LME analysis was conducted separately for each sensor and health condition, with time (t), test condition (TC: RBBT and VBBT), and their interaction (t:TC) as fixed factors. The second LME analysis was conducted for each sensor and test condition, with time (t) and health condition (HC: healthy and patients) and their interaction (t:HC) as fixed factors. Sensors: 1 WF&UD; 2 WF&RD; 3 DF; 4 TM; 5 FE; 6 WE&UD; 7 WE&RD.
Muscular Amplitude
MA1(t)MA2(t)MA3(t)MA4(t)MA5(t)MA6(t)MA7(t)
Health condition groupsFactors Factors Factors Factors Factors Factors Factors
tTCt:TCtTCt:TCtTCt:TCtTCt:TCtTCt:TCtTCt:TCtTCt:TC
Healthy***** * * * * * ****
Patient * *
Test condition groupsFactors Factors Factors Factors Factors Factors Factors
tHCt:HCtHCt:HCtHCt:HCtHCt:HCtHCt:HCtHCt:HCtHCt:HC
RBBT * * * * * ****
VBBT ******* * * * *
Disclaimer/Publisher’s Note: The statements, opinions and data contained in all publications are solely those of the individual author(s) and contributor(s) and not of MDPI and/or the editor(s). MDPI and/or the editor(s) disclaim responsibility for any injury to people or property resulting from any ideas, methods, instructions or products referred to in the content.

