Abstract
Human gait motions differ depending on the age of the person. Previous studies have estimated age categories of walkers or have used age analysis for security or commercial surveillance purposes using images. However, few studies have estimated age from gait parameters alone. We estimated the age of people using kernel regression analysis based on their height, weight, and representative gait parameters, i.e., walking features that are interpretable with relative ease. Samples were obtained from 75 Japanese women aged 20–70 in a database. Through a variable selection based on sensitivity analysis, the established model estimated the ages of the women with a correlation coefficient of 0.78 with their actual ages, and the mean absolute error was 9.99 years. The sensitive variables included the minimum foot clearance, body weight, walking velocity, step width, and stride length. Estimation errors were significantly greater for elderly adults than for young people. Specifically, the mean absolute error for people in their 20s was years, whereas that for those over 60 was years. The proposed method uses gait parameters that can be measured with wearable devices, such as inertial measurement units; therefore, it offers an accessible approach to estimating a walker’s age with moderate certainty and promoting healthcare awareness in daily life.
1. Introduction
Human gait patterns vary with age [1,2,3,4,5,6,7,8,9,10,11,12,13,14,15,16]. For example, Ko et al. [1] demonstrated that several gait parameters change with age: step width increases, while gait speed and stride length decrease. DeVita and Hortobagyi [2] reported that the ratios of joint torques and power at the hip, knee, and ankle differed between young and elderly participants, even when walking at the same speed. Aboutorabi et al. [3] reviewed prior studies and summarized age-related changes in gait, including step width, stride length, and walking speed. Moreover, strategies for maintaining gait stability during normal walking differ between young and older adults [13,15].
These findings suggest that a person’s age can be estimated based on a combination of gait parameters, similarly to how gait or motion patterns are recognized using combinations of low-level kinematic features [17,18,19,20]. For example, Xu et al. [17] classified the level of proficiency of runners based on multivariate biomechanical variables. Estimating age from observable walking characteristics—referred to as “walking age”—has potential applications in healthcare and public services, such as assistive systems for older adults. For instance, knowing the approximate age of pedestrians could inform the planning and deployment of support systems in public facilities, including guidance robots and assistive carts [21,22]. Additionally, understanding which age group one’s gait resembles may help individuals maintain or improve their physical health through self-awareness and lifestyle adjustments.
The majority of previous studies can be classified into two categories: classification into age groups and estimation of specific numerical age. Thus far, many studies have addressed age-classification problems [23,24,25,26,27,28]. For example, Begg et al. [23] used a support vector machine to classify young and old adults based on gait features extracted from images. Nabila et al. [24] proposed a method to separate young and elderly people using their silhouette images. Davis [25] classified the gait characteristics of children and adults. These studies aimed to classify the age of walkers into a few categories and did not estimate the actual age of the walkers.
In contrast, the study by Makihara et al. [29] estimated the ages of individuals ranging from 2 to 94 years using Gaussian process regression applied to frequency spectra derived from video frames or sequential images. Li et al. [30] combined classification and regression analyses to estimate the age of walkers. Sakata et al. [31] used convolutional neural networks to estimate the gender and age of people based on walking. In some of these studies [23,24,29,30], walking people were monitored using cameras. In contrast, a competition was held to estimate the age and gender of walkers by analyzing their motion data measured by a set of inertial measurement units (IMUs) [32]. Various algorithms were adopted in this competition by different teams; however, methods based on gait parameters were rarely used, and details regarding these methods were not clearly described.
Few studies have attempted to predict a person’s actual age as a numeric value from their gait characteristics. For example, Davis [25] used step length, stride width, and stride frequency to classify the ages of children (3–5 years) and adults (30–52 years). Begg et al. [23] used minimum foot clearance to classify younger and elderly adults. Chuen et al. [27] classified the ages of children and adults using stride length, stride frequency, head length, body length, head-to-body ratio, leg length, and stature. As shown in these studies, gait parameters have been used to classify ages; however, few studies estimate chronological age from gait parameters alone. In other words, while previous studies have shown that it is possible to classify individuals into broadly separated age groups, they have not addressed how accurately age differences can be quantified—such as the extent to which a 5- or 10-year age gap can be distinguished. There has been little effort to explore the limits of resolution or precision in age estimation from gait characteristics. This lack of investigation into the upper bounds of estimation accuracy forms one of the core motivations of the present study. Understanding how accurately human age can be estimated from gait parameters would offer valuable insights as part of the literature on gait analysis.
As illustrated in Figure 1, we apply kernel regression analysis to predict the age of individuals using gait-related variables—such as mediolateral and anterior velocities, stride length, step width, swing duration, and minimum foot clearance—in combination with self-reported height and weight. The gait parameters are semantically well-defined and can lead to explainable age estimators. Furthermore, many of them can be measured using a wearable device equipped with an IMU.
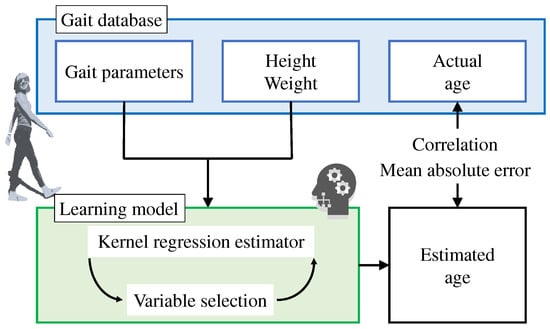
Figure 1.
Study scheme. We estimated age based on the height, weight, and gait parameters of walkers using kernel regression analysis. Adapted from [33].
In many previous studies, camera images have been utilized for applications such as customer surveys in supermarkets and security surveillance. However, IMUs, such as those used in smartphones and smartwatches, are suitable for collecting information on an individual’s daily life over a long period of time [34,35,36,37,38,39]. Methods for the accurate estimation of gait parameters using IMUs have been studied [40,41,42], but these methods are beyond the scope of this paper. Most of the representative gait parameters can be accurately estimated using a set of IMUs worn on the human body [42]. This study aims to evaluate how effectively an ensemble of gait parameters can be used to assess chronological age. We also used parameters that were self-reported by people, such as their height and weight, because the potential applications of this method, such as a monitoring system for daily activities, operate with the consent of users. Such a system may help people monitor their physical health in their daily lives, as opposed to being utilized for security or commercial-surveillance purposes.
This study is an extension of our previous work [33], where the ages of walkers were estimated using a kernel regression model with gait parameters and the height and weight of walkers as explanatory variables. In this study, we select effective explanatory variables based on a sensitivity analysis [43] and refine the model. The refined model is then compared with the model in [33] and a multiple linear-regression model to discuss the efficacy of our approach.
2. Methods
2.1. Gait Data
We utilized a gait database [44] that contains time-series three-dimensional coordinates of skeletal landmarks, recorded by a motion-capture system during straight-line walking under normal gait conditions. This database provides ten non-successive gait cycles for individual participants. Participants walked on a straight 10 m path barefoot at a comfortable speed. We used five gait cycles starting with left-heel contact for 30 women aged over 60 years, 30 women aged 20–30 years, and 15 women aged 35–50 years. In total, we used 375 samples collected from 75 healthy women. Note that the database does not include an equal number of participants for each age category. Furthermore, it comprises a larger number of female participants; hence, we only adopted the data of women. Gait parameters may have a different association with age between men and women [45].
We conducted a multiple linear regression analysis to establish a baseline performance. According to a power analysis using G*Power [46], the required sample size for testing individual regression coefficients in a two-tailed t-test, with , , and a medium effect size (), is 55. The number of samples in our dataset exceeds this requirement.
2.2. Parameters to Estimate Chronological Age
We employed height, weight, and seven widely examined gait features: peak mediolateral and anterior velocities of the center of mass (CoM), step width, stride length, cadence, swing phase duration, and minimum foot clearance observed during typical walking. Many of these parameters have been shown to distinguish between different age groups [23,25,27], and are thus expected to serve as predictors of age. Table 1 presents the means and standard deviations of these parameters.

Table 1.
Means and standard deviations of participant height, weight, and gait parameters.
As shown in Figure 2, step width refers to the mediolateral distance separating the right and left toes. Stride length is defined as the forward distance covered between two consecutive placements of the left foot. Cadence represents the number of steps taken per minute.
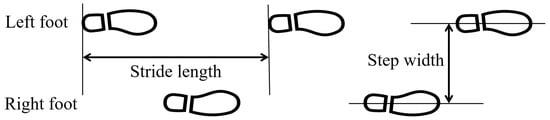
Figure 2.
Step width and stride length.
As shown in Figure 3, swing duration is the proportion of the gait cycle that accounts for the swing phase. The gait cycle presents the normalization of two successive steps. In this study, it starts (0%) and ends (100%) at the moments of left heel contact.
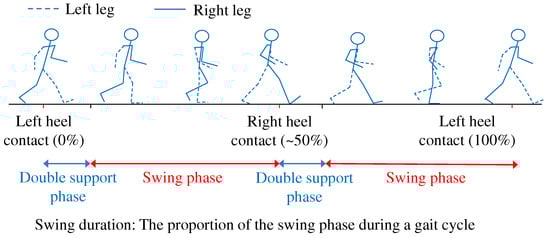
Figure 3.
Proportion of swing phase and double-support phase periods during the gait cycle.
As shown in Figure 4, minimum foot clearance is the distance between the foot and the ground when the foot is parallel to the ground in the swing phase. Minimum foot clearance is considered an important indicator of tripping risk, and its association with age has been reported in previous studies [23,47,48]. While these studies suggest that minimum foot clearance does not change monotonically with age, it remains a relevant parameter because it reflects key biomechanical aspects of gait. Specifically, minimum foot clearance is influenced by knee and hip joint flexion/extension as well as muscle strength and gait speed [49,50], making it a meaningful descriptor of gait characteristics related to age.
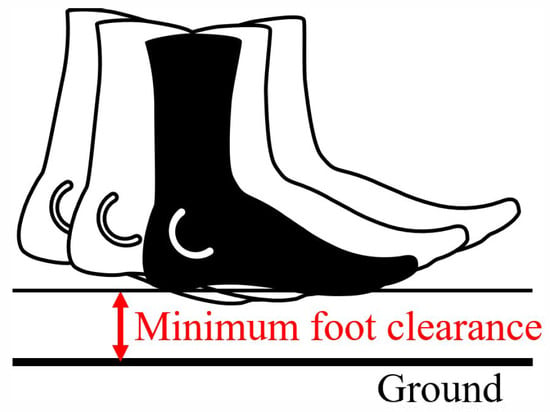
Figure 4.
Minimum foot clearance. Distance between the sole and ground when the swinging foot is parallel to the ground.
The step widths, stride lengths, and velocities were normalized to the body height of each participant. Furthermore, the height, weight, and gait parameters were normalized to be z-scores across all the participants.
2.3. Kernel Regression Analysis
Kernel regression analysis, a type of nonlinear regression, is employed to estimate age. Given that the explanatory variables (gait parameters) and the target variable (age) are not expected to have a simple linear correlation, a nonlinear approach was selected. Among nonlinear machine learning methods, kernel regression is particularly well-suited to our objectives and constraints; it can be applied to datasets of moderate size and is designed for continuous value estimation rather than classification. That said, the aim of this study is not to compare various machine learning algorithms, and kernel regression is not intended to be the exclusive solution.
In kernel regression analysis, the objective variable is expressed as a linear combination of kernel functions. The regression coefficients are determined by minimizing the squared error between the observed and estimated values of the objective variable. In this study, we estimated the ages of individuals in the database using Gaussian kernels, with height, weight, and gait parameters as explanatory variables. The Gaussian kernel is one of the most commonly used kernel functions and is generally employed unless there is a specific reason to choose an alternative.
The kernel function expresses the similarity between two explanatory vectors, and , and is computed as follows:
where is L2 norm. Here, and denote the gait parameters and the weight and height of participants for two specific samples. This function measures the similarity between two ensembles of explanatory variables, which leads to a substantial difference from multiple linear-regression analyses that can examine the effect of each variable independently. Let n be the number of samples in the training dataset; the Gram matrix is computed by
where is the vector of explanatory variables for sample j. The value of the objective variable y corresponding to any sample in the training dataset is estimated by
where y is represented by a linear sum of kernel functions and is their weight. The squared error between the observed and estimated values for a sample is
is determined to minimize the sum of squared errors among all samples in the training dataset. When , the sum of squared errors is
The least-squares solution of is
Typically, kernel regression analysis regularizes the Gram matrix to improve its generalization ability for untrained data. The sum of squared errors after regularization is computed as follows:
where () is a hyperparameter. For the minimization problem, the derivatives of this function related to must be zero:
Let be a unit matrix with an order of . is obtained as follows:
The regularization parameter () in the kernel regression analysis was determined via cross-validation from the candidate values {0.001, 0.01, 0.1, 1}. To achieve this, the 375 samples were divided into five subsets, ensuring that each subset contained only one sample from each participant. One subset was designated as the test set, while the other four were used for training. A model was created using the training data, and we estimated the participant ages using the test data. The correlation between the actual ages in the test data and the corresponding ages estimated via kernel regression analysis was calculated. This procedure was repeated five times, rotating each of the five groups to serve as the test dataset once. We then determined the value, such that the mean correlation coefficient among the five groups was maximized. Note that the optimal value differs among models with different sets of explanatory variables.
2.4. Variable Selection Based on Sensitivity Analysis
Once the regression model () is established, the sensitivity of each explanatory variable is computed for variable selection [43]. We denote as the mean absolute estimation error for . To compute the sensitivity of each explanatory variable, the age of each individual is estimated using by averaging the values of variables other than the explanatory variable that is being examined. A simple regression analysis is performed on the observed and estimated values of the participant ages, and the slope of the regression line is computed. This slope represents the sensitivity of the explanatory variable. The same estimation is repeated for all explanatory variables to obtain their respective sensitivities.
The explanatory variable with the lowest sensitivity is removed from . A new kernel regression model is then created using the remaining explanatory variables. If the mean absolute error for is smaller than , is accepted and is discarded. Otherwise, is accepted. The process of variable selection is also performed on , and this continues until the best model is determined, where j is smaller than the number of explanatory variables for .
3. Results
Herein, we compare the results of the estimation obtained from four models: (1) multiple linear-regression model using a step-wise variable selection method, (2) a kernell regression model using all explanatory variables, (3) kernell regression model established after variable selection, and (4) kernell regression model established after variable selection without self-declared height and weight. The multiple linear-regression model was computed using the stepwise function of MATLAB (2022b, MathWorks Inc., Natick, MA, USA). Training and testing for these models was conducted using five-fold cross validation. The age of each sample was estimated by the model trained on the dataset excluding itself. Table 2 summarizes the correlation coefficients and mean absolute errors of estimation for the four types of models. Mean absolute error was also used in earlier studies to evaluate the accuracy of age estimation [29,30,31,32].
Table 2.
Correlation coefficient and mean absolute error between the actual and estimated ages of the walkers. S.D. is the standard deviation among the five trials obtained through five-fold cross validation.
3.1. Results of Multiple Regression Analysis
Figure 5a shows the relationship between the ages estimated by multiple regression analysis and the actual ages of the walkers. The adjusted value was 0.415. Table 3 presents the partial regression coefficients of the significant explanatory variables with . Since all explanatory variables were standardized as z-scores, the coefficients reflect their relative contributions to age estimation. The selected variables included height, weight, mediolateral velocity of the CoM, step width, and stride length. The estimated ages were moderately correlated with the actual ages in the dataset, with a correlation coefficient of 0.65. The mean absolute error was 12.9 ± 0.40 years. Estimated ages ranged from 12 to 93 years, whereas the actual ages ranged from 20 to 75 years. The maximum absolute error was 38.3 years.
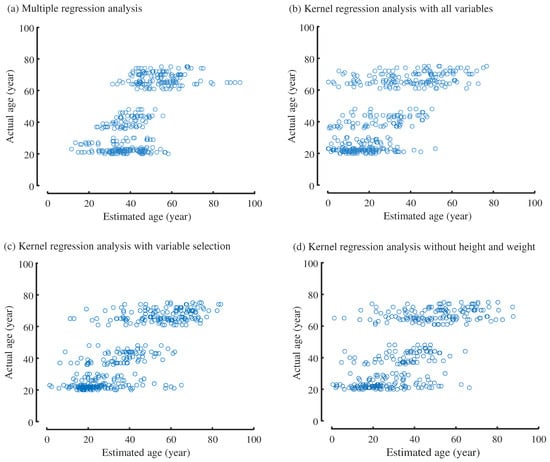
Figure 5.
Scatter plot of actual and estimated ages of walkers by different estimation models. (a) Multiple regression analysis. (b) Kernel regression analysis involving all the explanatory variables. (c) Kernel regression analysis with selected variables. (d) Kernel regression analysis without height and weight.
Table 3.
Partial regression coefficients of multiple regression model.
3.2. Results of Kernel Regression Model Including All the Explanatory Variables
Figure 5b shows the scatter plot of the actual ages and those estimated by the kernel regression model using all the gait parameters as well as height and weight as explanatory variables. The correlation coefficient between the estimated and actual ages was 0.65, and the mean absolute error of age was 17.7 ± 0.63 years.
Estimated ages were between 0–77 years, whereas the actual ages of the walkers ranged between 20–75 years. The maximum absolute error was 66.7 years.
3.3. Results of Kernel Regression Model with Selected Variables
Ages estimated via kernel regression analysis using selected variables are shown in Figure 5c. The selected explanatory variables include weight, minimum foot clearance, anterior velocity of the CoM, step width, and stride length, as listed in Table 4. The estimated ages exhibited a correlation coefficient of 0.78 with the biological ages of the people in the data set. The mean absolute error of age ± S.D. was 9.99 ± 1.09 years, the maximum absolute error was 53.7 years, and the minimum was 0.04 years. Estimated ages ranged between 1.5–84 years.
Table 4.
Sensitivity of explanatory variables. Gradients of regression lines between the actual and estimated ages.
Estimation errors were strongly influenced by the actual ages of the participants, with errors increasing with age. The mean absolute error for young adults (aged 20–30 years) was years. For the middle-aged (35–50 years) and elderly (60–75 years) groups, these values were years and years, respectively. An F-test revealed that the error variance for the elderly group was significantly greater than that for the young group (, ). Similarly, the error variance for the elderly group exceeded that of the middle-aged group (, ).
3.4. Results of Kernel Regression Model Without Height and Weight
We also estimated the ages of walkers using kernel regression analysis with only the gait parameters, excluding self-reported height and weight. As mentioned in Section 1, our method is intended for monitoring the physical fitness of users; hence, it is reasonable that some information is provided by the users to estimate their walking age. However, to widen the potential applications of the age-estimation method, knowing the accuracy of the age estimation only by gait parameters is important. As listed in Table 5, after variable selection, six gait parameters remained as explanatory variables. The mean correlation coefficient between the estimated and actual ages was . The mean absolute error ± S.D. was years. The lowest estimated age was below zero, years old, and the highest estimated age was years old. Without the self-declared information, the estimation accuracy of the kernel regression analysis was comparable to that of the multiple-regression analysis with the self-declared information, as in Table 2.
Table 5.
Differences in explanatory variables by the estimation method.
4. Discussion
As shown in Section 3, the kernel regression analysis with selected variables exhibited an average correlation coefficient between the estimated and actual ages of 0.78, with an absolute mean error of 9.99 years. These values were better than those of the multiple-regression model. This suggests that nonlinear relationships between the age and gait parameters [41] were captured by the kernel regression model.
The selected variables differed between multiple-regression analysis and kernel regression analysis, as listed in Table 5. In the multiple regression analysis, the mediolateral velocity of the CoM was included in the explanatory variables, whereas in the kernel regression, anterior velocity of the CoM was included in the explanatory variables. As many earlier studies indicated [1,3,7,8,9,41,51], the anterior velocity or walking speed exhibits a negative correlation with age. In contrast, the mediolateral velocity appears to not be correlated with age [13]. Hence, the variables selected for multiple-regression analysis are partly not in agreement with the literature.
In the multiple-regression analysis, both height and weight are explanatory variables, but in the kernel regression, only weight is selected as an explanatory variable. In our dataset, the correlation coefficient between age and height was () and that between age and weight was (). Height exhibited a stronger linear relationship with age than that of weight. However, in the kernel regression analysis, weight remained in the explanatory variables instead of height. This suggests that weight allows us to estimate the age in combination with other explanatory variables in a nonlinear manner. Step width and stride length are explanatory variables in both the kernel regression and multiple-regression models. The stride length decreased and the step width increased with age [1,2,3,4,5,6,7,8,9,10,11,12,13,41,51]; hence, both the step width and stride length can be good predictors of age. The minimum foot clearance is used only in the kernel regression model. The age-dependence of the minimum foot clearance appears minimal in terms of the mean value; however, its variability depends on age [52]. Hence, the use of the minimum foot clearance as a general parameter to estimate the age of walkers is uncertain. In summary, the variables selected for the kernel regression model are mostly reasonable, whereas the validity of the weight and minimum foot clearance should be studied in the future.
Cadence was not included in the explanatory variables selected for the multiple-regression and kernel regression analyses. The relationship between cadence and age has not been agreed upon in earlier studies [3], with some studies claiming an increase with age [2,4] and others claiming no correlation between age and cadence [7]. Kim et al. [40] reported that the cadence is predicted by a nonlinear function of the age, and its model function differs between men and women. Hence, the contribution of cadence to the estimation of the age of walkers is still debated.
When the kernel regression analysis was used to estimate the age using only the seven gait parameters, excluding height and weight, the mean correlation coefficient between the estimated and actual ages was 0.67. However, when weight was added to the model, the mean correlation coefficient increased to 0.78, as listed in Table 2. This indicates that even a minimal amount of self-declared information, such as weight, helps improve the model accuracy. In practice, the use of such information is recommended.
As described in Section 3.3, the results indicate that age estimation errors tend to increase with age. Interestingly, similar age-related trends in estimation accuracy have been reported in studies employing different estimation methods [32]. We speculate that this is largely due to greater inter-individual variability in physical abilities among older adults. For example, Schrager et al. [51] reported increased fluctuations in walking velocity and step length with age. Additionally, Barrett et al. [52] found that the variability in minimum foot clearance also increases in older populations.
The age-estimation error in this study was 9.99 years on average. This value is greater than those of other studies using camera images [29] and motion data for a sustained time of measurement [32]. For the latter approach, the least average estimation error reached 5–7 years, utilizing outputs from multiple IMUs worn by walkers. Hence, a method to improve estimation accuracy is the introduction of the time-series variation of gait parameters into the model. However, in this study, each sample contained a set of gait parameters for a single gait cycle because of the specifications of the database that we used. The temporal variation of gait patterns are also known to pertain to fall risks (e.g., [52,53]), and we plan to expand our study to include continuous multiple gait cycles. Another promising approach is the use of age-class information. Li et al. [30] classified age into five groups and used an estimation model specified to each group. The same regression model was used for all ages in this study; thus, using different models depending on the age reported by the individual may be beneficial.
Some earlier studies classified individuals into broad age groups—such as children, young or middle-aged adults, and older adults [23,24,25,26,27]—suggesting that a two- or three-level classification may be sufficient for certain applications, such as adaptively planning the deployment of service resources in public facilities. For the purpose of estimating approximate age in large spaces, a mean absolute error of around 10 years may be considered acceptable. In the context of individual healthcare awareness, it could be more meaningful to observe how one’s walking age changes over time, such as through continuous physical training or lifestyle improvements. In such cases, precise age estimation may be less critical than tracking relative changes.
The limitations and future prospects of this study are as follows. In this study, age was estimated only for healthy women. Gender differences in gait have been reported in previous studies [4,41,54,55,56]; therefore, when estimating age from gait parameters, different models should be established for men and women. As long as the sexes are treated as distinct groups, the framework proposed in this study is expected to remain applicable.
Furthermore, relationships between the walking age considered in this study and physical strength are unclear. If the age of a person is estimated to be lower than their actual age, this does not directly mean that they are in a better fitness condition than others. Future work can investigate the correlation between the walking age of a person and their physical strength.
Age estimation based on walking characteristics in this study is generally limited to healthy individuals. Individuals with neuromuscular disorders or arthrosis exhibit gait patterns that differ significantly from those of healthy individuals [57,58,59,60]. Previous studies on walking age estimation have also excluded individuals with such conditions. Estimating the age of people with physical impairments is particularly challenging, as the variations in their gait are primarily driven by the specific nature of their disorders. Therefore, the approach proposed in this study is unlikely to generalize to pathological gait patterns without substantial modification, as such patterns are shaped more by the underlying condition than by chronological age.
Another challenge in applying the proposed method to practical, everyday use is accounting for footwear conditions. Footwear has been shown to influence gait patterns [61], and it remains uncertain whether a single model can adequately handle gait data collected under both barefoot and shod conditions.
The samples in the database were imbalanced across age groups, with a greater number of younger and older participants compared to those in middle age. As a result, the model may have been biased toward achieving higher accuracy in the younger and older age groups than in the middle-aged group. Furthermore, this study did not involve protocol pre-registration, as it was based on a secondary analysis of an existing dataset. This limits the transparency of the research process and may increase the risk of post hoc decisions, such as selective reporting or outcome switching.
Since the proposed method is trained on a large number of straight-line walking samples, it can be applied in daily life by extracting segments that involve straight-line walking. In real-world scenarios, age estimation would likely be most practical using an ensemble of available sensor data, including both camera-based and IMU-based information. Several earlier studies have proposed placing IMUs in shoe soles for practical implementation [62,63], making this a promising first option. Notably, image-based motion sensing has often demonstrated superior accuracy compared to IMU-based approaches [42]; therefore, a complementary use of both modalities may offer enhanced performance and robustness.
5. Conclusions
This study demonstrated that a person’s chronological age can be estimated using a set of representative gait parameters—such as step width, stride length, and anterior CoM velocity—along with self-reported height and weight. In contrast to prior studies that relied on temporally successive gait images or full time-series signals from IMUs, our approach focused on interpretable biomechanical features, allowing us to draw on a wide range of existing gait research for feature selection and interpretation.
Using kernel regression combined with a sensitivity-based variable selection method, we achieved a correlation coefficient of 0.78 and a mean absolute error of 9.99 years between the estimated and actual ages. This result may represent an upper bound on the achievable accuracy of age estimation using the proposed approach, especially considering that many previous studies have focused only on classifying individuals into broad age groups. These findings suggest that gait parameters contain sufficient information to enable practical age estimation and may offer a valuable means for long-term monitoring of functional aging.
The selected explanatory variables included step width, stride length, and anterior velocity, as they differ between different age groups [1,2,3,4,5,6,7,8,9,10,11,12,13,41]. Many of these gait parameters can be estimated using inertial measurement units (IMUs) worn on the body, making the proposed estimation model potentially useful for assessing an individual’s health status based on their gait in daily life. However, accurately capturing certain parameters, such as minimum foot clearance, may require multiple IMUs, which could limit the practicality and convenience of the approach. Moreover, the model was trained exclusively on healthy female participants, and its generalizability to other populations—including males, individuals with gait impairments, and diverse ethnic groups—remains to be explored.
Future work will aim to improve the model’s estimation accuracy and test its applicability to broader demographic groups. We also plan to investigate the relationship between the estimated walking age and other indicators of physical function or frailty, to assess the clinical or practical relevance of the proposed method.
Author Contributions
Conceptualization, T.K. and S.O.; methodology, T.K. and S.O.; software, T.K.; validation, T.K. and S.O.; formal analysis, T.K. and S.O.; investigation, T.K. and S.O.; resources, T.K. and Y.A.; writing—original draft preparation, T.K. and S.O.; writing—review and editing, T.K., S.O. and Y.A.; visualization, T.K.; supervision, S.O.; project administration, S.O.; funding acquisition, S.O. All authors have read and agreed to the published version of the manuscript.
Funding
This research was in part funded by The Okawa Foundation for Information and Telecommunications (2025-B-3).
Institutional Review Board Statement
Not applicable.
Informed Consent Statement
Not applicable.
Data Availability Statement
This study utilized a conditionally open database [44], which is not available for redistribution.
Acknowledgments
We thank Sayaka Yamada for her assistance in data analysis.
Conflicts of Interest
The authors declare no conflicts of interest.
References
- Ko, S.; Hausdorff, J.M.; Ferrucci, L. Age-associated differences in the gait pattern changes of older adults during fast-speed and fatigue conditions: Results from the Baltimore longitudinal study of ageing. Age Ageing 2010, 39, 668–694. [Google Scholar] [CrossRef] [PubMed]
- DeVita, P.; Hortobagyi, T. Age causes a redistribution of joint torques and powers during gait. J. Appl. Physiol. 2000, 88, 1804–1811. [Google Scholar] [CrossRef] [PubMed]
- Aboutorabi, A.; Arazpour, M.; Bahramizadeh, M.; Hutchins, S.W.; Fadayevatan, R. The effect of aging on gait parameters in able-bodied older subjects: A literature review. Aging Clin. Exp. Res. 2016, 28, 393–405. [Google Scholar] [CrossRef] [PubMed]
- Hollman, J.H.; McDade, E.M.; Petersen, R.C. Normative spatiotemporal gait parameters in older adults. Gait Posture 2011, 34, 111–118. [Google Scholar] [CrossRef]
- Beauchet, O.; Allali, G.; Annweiler, C.; Bridenbaugh, S.; Assal, F.; Kressig, R.W.; Herrmann, F.R. Gait variability among healthy adults: Low and high stride-to-stride variability are both a reflection of gait stability. Gerontology 2009, 55, 702–706. [Google Scholar] [CrossRef]
- Dean, J.C.; Alexander, N.B.; Kuo, A.D. The effect of lateral stabilization on walking in young and old ddults. IEEE Trans. Biomed. Eng. 2007, 54, 1919–1926. [Google Scholar] [CrossRef]
- Samson, M.; Crowe, A.; Vreede, P.; Dessens, J.; Duursma, S.; Verhaar, H. Differences in gait parameters at a preferred walking speed in healthy subjects due to age, height and body weight. Aging 2001, 13, 16–21. [Google Scholar] [CrossRef] [PubMed]
- Menz, H.B.; Lord, S.R.; Fitzpatrick, R.C. Age-related differences in walking stability. Age Ageing 2003, 32, 137–142. [Google Scholar] [CrossRef]
- Ko, S.U.; Ling, S.; Winters, J.; Ferrucci, L. Age-related mechanical work expenditure during normal walking: The Baltimore longitudinal study of aging. J. Biomech. 2009, 42, 1834–1839. [Google Scholar] [CrossRef]
- Nagano, H.; Begg, R.; Sparrow, W.; Taylor, S. A comparison of treadmill and overground walking effects on step cycle asymmetry in young and older individuals. J. Appl. Biomech. 2013, 29, 188–193. [Google Scholar] [CrossRef]
- Lockhart, T.; Woldstad, J.; Smith, J. Effects of age-related gait changes on the biomechanics of slips and falls. Ergonomics 2003, 46, 1136–1160. [Google Scholar] [CrossRef]
- Yamaguchi, T.; Masani, K. Effects of age on dynamic balance measures and their correlation during walking across the adult lifespan. Sci. Rep. 2022, 12, 14301. [Google Scholar] [CrossRef] [PubMed]
- Kuroda, T.; Okamoto, S.; Akiyama, Y. Anterior and mediolateral dynamic gait stabilities attributed to different gait parameters in different age groups. J. Biomech. Sci. Eng. 2023, 19, 23-00183. [Google Scholar] [CrossRef]
- Antonelli, M.; Caselli, E.; Gastaldi, L. Comparison of gait smoothness metrics in healthy elderly and young people. Appl. Sci. 2024, 14, 911. [Google Scholar] [CrossRef]
- Watanabe, H.; Okamoto, S.; Kuroda, T.; Akiyama, Y. Manipulability analysis of anterior and mediolateral dynamic gait stability of young and elderly individuals. J. Robot. Mechatron. 2024, 36, 1568–1576. [Google Scholar] [CrossRef]
- Davoudi, M.; Salami, F.; Putz, C.; Wolf, S.I. Establishing reference data for electromyographic activity in gait: Age and gender variations. Appl. Sci. 2025, 15, 3472. [Google Scholar] [CrossRef]
- Xu, D.; Zhou, H.; Quan, W.; Jiang, X.; Liang, M.; Li, S.; Ugbolue, U.C.; Baker, J.S.; Gusztav, F.; Ma, X.; et al. A new method proposed for realizing human gait pattern recognition: Inspirations for the application of sports and clinical gait analysis. Gait Posture 2024, 107, 293–305. [Google Scholar] [CrossRef]
- Kim, M.J.; Han, J.H.; Shin, W.C.; Hong, Y.S. Gait pattern identification using gait features. Electronics 2024, 13, 1956. [Google Scholar] [CrossRef]
- Slemenšek, J.; Fister, I.; Geršak, J.; Bratina, B.; van Midden, V.M.; Pirtošek, Z.; Šafarič, R. Human gait activity recognition machine learning methods. Sensors 2023, 23, 745. [Google Scholar] [CrossRef]
- Ejaz, N.; Khan, S.J.; Azim, F.; Asif, M.; Teuțan, E.; Pleșa, A.; Păcurar, R.; Stan, S.D. Automatic gait classification model empowered by machine learning for people with and without osteoporosis using smart walker. Appl. Sci. 2024, 14, 3874. [Google Scholar] [CrossRef]
- Mavrogiannis, C.; Baldini, F.; Wang, A.; Zhao, D.; Trautman, P.; Steinfeld, A.; Oh, J. Core challenges of social robot navigation: A survey. ACM Trans. Hum. Robot Interact. 2023, 12, 1–39. [Google Scholar] [CrossRef]
- Singamaneni, P.T.; Bachiller-Burgos, P.; Manso, L.J.; Garrell, A.; Sanfeliu, A.; Spalanzani, A.; Alami, R. A survey on socially aware robot navigation: Taxonomy and future challenges. Int. J. Robot. Res. 2024, 43, 1533–1572. [Google Scholar] [CrossRef]
- Begg, R.K.; Palaniswami, M.; Owen, B. Support vector machines for automated gait classification. IEEE Trans. Biomed. Eng. 2005, 52, 828–838. [Google Scholar] [CrossRef] [PubMed]
- Nabila, M.; Mohammed, A.; Yousra, B. Gait-based human age classification using a silhouette model. IET Biom. 2018, 7, 116–124. [Google Scholar] [CrossRef]
- Davis, J.W. Visual categorization of children and adult walking styles. In Proceedings of the Audio- and Video-Based Biometric Person Authentication: 4th International Conference, AVBPA 2003, Guildford, UK, 9–11 June 2003; Springer: Berlin/Heidelberg, Germany, 2001; pp. 295–300. [Google Scholar]
- Zhang, D.; Wang, Y.; Bhanu, B. Age classification base on gait using HMM. In Proceedings of the 20th International Conference on Pattern Recognition, Istanbul, Turkey, 23–26 August 2010; pp. 3834–3837. [Google Scholar] [CrossRef]
- Chuen, B.K.Y.; Tee, C.; Ong, T.S.; Ong, M.G.K. A preliminary study of gait-based age estimation techniques. In Proceedings of the 2015 Asia-Pacific Signal and Information Processing Association Annual Summit and Conference (APSIPA), Hong Kong, China, 16–19 December 2015; pp. 800–806. [Google Scholar]
- Urvashi; Kumar, D.; Malhotra, A. Age estimation from gait patterns using a Convolutional Neural Network and Support Vector Machine hybrid model. In Proceedings of the 2024 International Conference on Cybernation and Computation (CYBERCOM), Dehradun, India, 15–16 November 2024; pp. 531–534. [Google Scholar] [CrossRef]
- Makihara, Y.; Okumura, M.; Iwama, H.; Yagi, Y. Gait-based age estimation using a whole-generation gait database. In Proceedings of the 2011 International Joint Conference on Biometrics (IJCB), Washington, DC, USA, 11–13 October 2011; pp. 1–6. [Google Scholar]
- Li, X.; Makihara, Y.; Xu, C.; Yagi, Y.; Ren, M. Gait-based human age estimation using age group-dependent manifold learning and regression. Multimed. Tools Appl. 2018, 77, 28333–28354. [Google Scholar] [CrossRef]
- Sakata, A.; Takemura, N.; Yagi, Y. Gait-based age estimation using multi-stage convolutional neural network. IPSJ Trans. Comput. Vis. Appl. 2019, 11, 4. [Google Scholar] [CrossRef]
- Ahad, M.; Ngo, T.; Antar, A.; Ahmed, M.; Hossain, T.; Muramatsu, D.; Makihara, Y.; Inoue, S.; Yagi, Y. Wearable sensor-based gait analysis for age and gender estimation. Sensors 2020, 20, 2424. [Google Scholar] [CrossRef]
- Kuroda, T.; Okamoto, S.; Akiyama, Y. Walking-age estimator based on gait parameters. In Proceedings of the 2023 IEEE 12th Global Conference on Consumer Electronics (GCCE), Nara, Japan, 10–13 October 2023; pp. 345–347. [Google Scholar]
- Takano, W. Annotation generation from IMU-based human whole-body motions in daily life behavior. IEEE Trans. Hum. Mach. Syst. 2020, 50, 13–21. [Google Scholar] [CrossRef]
- Yang, D.; Huang, J.; Tu, X.; Ding, G.; Shen, T.; Xiao, X. A wearable activity recognition device using air-pressure and IMU sensors. IEEE Access 2019, 7, 6611–6621. [Google Scholar] [CrossRef]
- Kaichi, T.; Maruyama, T.; Tada, M.; Saito, H. Learning sensor interdependencies for IMU-to-segment assignment. IEEE Access 2021, 9, 116440–116452. [Google Scholar] [CrossRef]
- Ksibi, A.; Alluhaidan, A.S.D.; Salhi, A.; El-Rahman, S.A. Overview of Lifelogging: Current Challenges and Advances. IEEE Access 2021, 9, 62630–62641. [Google Scholar] [CrossRef]
- Huang, M.; Garcia, A. Dataset and system design for orthopedic walker fall detection and activity logging using motion classification. Appl. Sci. 2023, 13, 11379. [Google Scholar] [CrossRef]
- Oh, H.; Yoo, J. Real-time detection of at-risk movements using smartwatch IMU sensors. Appl. Sci. 2025, 15, 1842. [Google Scholar] [CrossRef]
- Kim, Y.K.; Joo, J.Y.; Jeong, S.H.; Jeon, J.H.; Jung, D.Y. Effects of walking speed and age on the directional stride regularity and gait variability in treadmill walking. J. Mech. Sci. Technol. 2016, 30, 2899–2906. [Google Scholar] [CrossRef]
- Schwesig, R.; Leuchte, S.; Fischer, D.; Ullmann, R.; Kluttig, A. Inertial sensor based reference gait data for healthy subjects. Gait Posture 2011, 33, 673–678. [Google Scholar] [CrossRef] [PubMed]
- Teufl, W.; Lorenz, M.; Miezal, M.; Taetz, B.; Fröhlich, M.; Bleser, G. Towards inertial sensor based mobile gait analysis: Event-detection and spatio-temporal parameters. Sensors 2019, 19, 38. [Google Scholar] [CrossRef]
- Tanabe, K.; Suzuki, T. Verification of the effectiveness of sensitivity analysis as a variable selection in support vector regression—analysis of factors affecting prefectural all-cause mortality rates. Proc. Inst. Stat. Math. 2020, 68, 175–192. [Google Scholar]
- Kobayashi, Y.; Hida, N.; Nakajima, K.; Fujimoto, M.; Mochimaru, M. AIST Gait Database 2019. 2019. Available online: https://unit.aist.go.jp/harc/ExPART/GDB2019.html (accessed on 1 February 2025).
- Kobayashi, Y.; Hobara, H.; Heldoorn, T.A.; Kouchi, M.; Mochimaru, M. Age-independent and age-dependent sex differences in gait pattern determined by principal component analysis. Gait Posture 2016, 46, 11–17. [Google Scholar] [CrossRef]
- Faul, F.; Erdfelder, E.; Lang, A.G.; Buchner, A. G*Power 3: A flexible statistical power analysis program for the social, behavioral, and biomedical sciences. Behav. Res. Methods 2007, 39, 175–191. [Google Scholar] [CrossRef]
- Al Bochi, A.; Delfi, G.; Dutta, T. A scoping review on minimum foot clearance: An exploration of level-ground clearance in individuals with abnormal gait. Int. J. Environ. Res. Public Health 2021, 18, 10289. [Google Scholar] [CrossRef]
- Santhiranayagam, B.K.; Lai, D.T.H.; Sparrow, W.A.; Begg, R.K. Minimum toe clearance events in divided attention treadmill walking in older and young adults: A cross-sectional study. J. Neuroeng. Rehabil. 2015, 12, 58. [Google Scholar] [CrossRef]
- Sato, K. Factors affecting minimum foot flearance in the elderly walking: A multiple regression analysis. Open J. Ther. Rehabil. 2015, 3, 109–115. [Google Scholar] [CrossRef]
- Carter, S.; Saghafi, A. An exploration of the effects of gait speed and joint movements on minimum toe clearance across the lifespan: A cross-sectional study. J. Appl. Biomech. 2025; ahead of print. [Google Scholar] [CrossRef] [PubMed]
- Schrager, M.A.; Kelly, V.E.; Price, R.; Ferrucci, L.; Shumway-Cook, A. The effects of age on medio-lateral stability during normal and narrow base walking. Gait Posture 2008, 28, 466–471. [Google Scholar] [CrossRef]
- Barrett, R.; Mills, P.; Begg, R. A systematic review of the effect of ageing and falls history on minimum foot clearance characteristics during level walking. Gait Posture 2010, 32, 429–435. [Google Scholar] [CrossRef]
- Inai, T.; Kobayashi, Y.; Huang, C.; Fujita, K.; Fujimoto, M.; Nihey, F.; Yamamoto, A.; Nakajima, K.; Nakahara, K.; Kutsuzawa, G.; et al. Identification of characteristics of foot position and angle during swing phase in fallers using principal component analysis. Front. Bioeng. Biotechnol. 2023, 11, 1117884. [Google Scholar] [CrossRef] [PubMed]
- Kobayashi, H.; Kakihana, W.; Kimura, T. Combined effects of age and gender on gait symmetry and regularity assessed by autocorrelation of trunk acceleration. J. Neuroeng. Rehabil. 2014, 11, 109. [Google Scholar] [CrossRef] [PubMed]
- Cho, S.H.; Park, J.; Yun Kwon, O. Gender differences in three dimensional gait analysis data from 98 healthy Korean adults. Clin. Biomech. 2004, 19, 145–152. [Google Scholar] [CrossRef] [PubMed]
- Hediyeh, H.; Sayed, T.; Zaki, M.; Mori, G. Pedestrian gait analysis using automated computer vision techniques. Transp. A Transp. Sci. 2014, 10, 214–232. [Google Scholar] [CrossRef]
- Saxe, R.C.; Kappagoda, S.; Mordecai, D.K.A. Classification of pathological and normal gait: A survey. arXiv 2020, arXiv:2012.14465. [Google Scholar] [CrossRef]
- Zhao, A.; Li, J.; Dong, J.; Qi, L.; Zhang, Q.; Li, N.; Wang, X.; Zhou, H. Multimodal gait recognition for neurodegenerative diseases. IEEE Trans. Cybern. 2022, 52, 9439–9453. [Google Scholar] [CrossRef] [PubMed]
- Kiss, R.M. Effect of severity of knee osteoarthritis on the variability of gait parameters. J. Electromyogr. Kinesiol. 2011, 21, 695–703. [Google Scholar] [CrossRef] [PubMed]
- Alkjaer, T.; Raffalt, P.C.; Dalsgaard, H.; Simonsen, E.B.; Petersen, N.C.; Bliddal, H.; Henriksen, M. Gait variability and motor control in people with knee osteoarthritis. Gait Posture 2015, 42, 479–484. [Google Scholar] [CrossRef] [PubMed]
- Singh, S.; Bohara, R.; Rahman, A.; Indoria, R. Effect of different types of footwear on gait pattern—A scoping review. Int. J. Mod. Dev. Eng. Sci. 2024, 2, 16–19. [Google Scholar] [CrossRef]
- Riglet, L.; Nicol, F.; Leonard, A.; Eby, N.; Claquesin, L.; Orliac, B.; Ornetti, P.; Laroche, D.; Gueugnon, M. The use of embedded IMU insoles to assess gait parameters: A validation and test-retest reliability study. Sensors 2023, 23, 8155. [Google Scholar] [CrossRef]
- Napier, C.; Willy, R.W.; Hannigan, B.C.; McCann, R.; Menon, C. The effect of footwear, running speed, and location on the validity of two commercially available inertial measurement units during running. Front. Sport. Act. Living 2021, 3, 643385. [Google Scholar] [CrossRef]
Disclaimer/Publisher’s Note: The statements, opinions and data contained in all publications are solely those of the individual author(s) and contributor(s) and not of MDPI and/or the editor(s). MDPI and/or the editor(s) disclaim responsibility for any injury to people or property resulting from any ideas, methods, instructions or products referred to in the content. |
© 2025 by the authors. Licensee MDPI, Basel, Switzerland. This article is an open access article distributed under the terms and conditions of the Creative Commons Attribution (CC BY) license (https://creativecommons.org/licenses/by/4.0/).