Article

Physicochemical and Antioxidant Properties of Selected Polish and Slovak Honeys

by
Stanisław Kowalski
1,
Zuzana Ciesarová
2,
Kristína Kukurová
2,
Blanka Tobolková
2,
Martin Polovka
2,
Łukasz Skoczylas
3,
Małgorzata Tabaszewska
3,4,
Karolina Mikulec
5,
Anna Mikulec
6 and
Krzysztof Buksa
1,*
1
Department of Carbohydrate Technology and Cereal Processing, Faculty of Food Technology, University of Agriculture in Krakow, 122 Balicka Street, 30-147 Kraków, Poland
2
National Agricultural and Food Centre, Food Research Institute, Priemyselna’ Street 4, 82475 Bratislava, Slovakia
3
Technology and Nutrition Hygiene, Faculty of Food Technology, University of Agriculture in Krakow, 122 Balicka Street, 30-147 Kraków, Poland
4
Department of Human Nutrition and Metabolomics, Pomeranian Medical University in Szczecin, Broniewskiego Street 24, 71-460 Szczecin, Poland
5
Graduate of the Warsaw School of Economics, Niepodległości Avenue 162, 02-554 Warszawa, Poland
6
Faculty of Engineering Sciences, University of Applied Science in Nowy Sacz, Staszica Street 1, 33-300 Nowy Sacz, Poland
*
Author to whom correspondence should be addressed.
Appl. Sci. 2025, 15(11), 5810; https://doi.org/10.3390/app15115810
Submission received: 11 April 2025 / Revised: 15 May 2025 / Accepted: 19 May 2025 / Published: 22 May 2025
(This article belongs to the Special Issue Functional Foods for Human Health—Product Development and Analysis)

Abstract

:

Featured Application

The obtained results may, to some extent, facilitate the classification of honeys according to their origin and antioxidant activity. They may also contribute to more precise conclusions about the health-promoting properties of the product.

Abstract

In this study, the physicochemical and antioxidant properties of 19 honey samples from Poland and Slovakia were assessed and models describing the relationship between antioxidant activity and the determined physicochemical features were developed. All tested honeys met the regulatory criteria of EU standards for the content of water, hydroxymethylfurfural, and diastase activity. Honey samples from Poland and Slovakia had similar glucose-to-fructose ratios, but differences were observed in diastase activity, electrical conductivity, and antioxidant potential. Polish forest honey samples showed the highest antioxidant activity, and Polish rapeseed honey showed higher antioxidant potential than the Slovak honey. Color analysis showed a strong correlation (R2 = 0.849) between the browning index and antioxidant capacity. Cluster analysis effectively distinguished honey types based on their chemical composition, although some sample overlap was attributed to environmental influences. Regression models identified key predictors of antioxidant potential, and polyphenol content evidenced by color parameters (a*, b*). This study provides valuable information on honey characteristics and demonstrates the feasibility of using statistical models to predict antioxidant properties.

1. Introduction

Honey is well known all over the world as a natural sweet substance produced from the nectar of flowers or secretions of plants and plant-sucking insects mainly by bee’s genus Apis mellifera and by wild bees (stingless bees, or Meliponinae) [1]. Honey composition is complex, containing primarily sugars such as fructose and glucose, along with proteins, enzymes, amino acids, mineral salts, vitamins, and a variety of bioactive compounds, including polyphenols and flavonoids. These constituents contribute to honey’s health-promoting properties, especially its antioxidant capacity [2]. It should be noted, that according to recent observations, antioxidant compounds, and in particular polyphenols, may have an ambivalent nature and act as both anti- and pro-oxidant factors in living organisms [3]. The physicochemical properties, chemical composition of honey depends on many factors regarding to floral origin of nectar [4]. Monosaccharides—fructose and glucose—constitutes main components of honey. In some cases, different types of honey exhibit diversified proportions of those two main carbohydrates, though other sugars are also present in lesser extend [5]. Honey is a very complex system and can be considered as valuable source of antioxidants [6]. Large set of antioxidants can interact and contribute to the biological value of honey. It contains caffeic, coumaric acid as well as their esters, phenolic acids and flavonoid aglycones, carotenoids and ascorbic acid [7]. Antioxidant activities of honey are significantly influenced by factors such as botanical and geographical origin, or environmental conditions. For example, dark-colored honeys, like buckwheat honey, revealed higher phenolic content and antioxidant properties compared to brighter types [2,8].
Poland and Slovakia, with their rich biodiversity and traditional beekeeping practices, produce a variety of honeys with distinct characteristics. Polish honeys have been identified as valuable sources of antioxidants, with studies showing significant variations in antioxidant activity and phenolic content among different types [9]. In honey samples obtained from Slovakia, analyses have demonstrated notable antioxidant and antimicrobial activities, underscoring the potential health benefits of these natural products [10].
Although concentration of major honey components like carbohydrates is more or less similar in many types of honey, some minor components can be useful for differentiation of same specific types of this product. Electrical conductivity is the most common parameter used to distinguish nectar honey and multifloral honey from honeydew honey [11]. Moreover, analysis of other minor ingredients like amino acids, carboxylic acids, polyphenols, and flavonoids can help in honey type determination [6,12,13]. However, identification of all kinds of honey on the basis of physicochemical features is still difficult and therefore, statistical approach like chemometric analysis is often applied for better interpretation of obtained data [7,14,15,16].
Cluster analysis is an important tool in exploratory data analysis, enabling the detection of structure in datasets without the need to apply previous assumptions about the membership of objects in specific groups. It is widely used in many fields of science, supporting decision-making and discovering hidden patterns in complex datasets. Its main goal is to group the studied objects into subsets, called clusters, so that elements belonging to one group show maximum similarity to each other, and at the same time differ significantly from elements belonging to other groups. The key principle used in this method is the rule of within-cluster similarity as well as between-cluster dissimilarity. This means that elements within one cluster should be characterized by a high degree of similarity, while the differences between individual clusters should be as clear as possible [17]. On the other hand, OLS (Ordinary Least Squares) regression is a valuable tool of data evaluation in food technology, that allows for modeling, analysis of relationships between variables and optimization of production processes [18]. Although chemometric tools were applied to differentiate honey groups [12,14,15], there are few reports regarding the relationship between content of antioxidants, antioxidant activity and physicochemical features of Polish and Slovak honeys [19,20], so our research goal was to expand knowledge in this area. From this point of view, the aim of this study was the characterization of same major honey types produced in Poland and in the Slovak Republic and the development of models describing the relationship between antioxidant activity expressed as the ability to scavenge free radicals ABTS•+ or DPPH•, total polyphenol content (TPC), and the determined physicochemical features.
Given the influence of regional flora and environmental factors on honey composition, it is essential to investigate and compare the physicochemical and antioxidant properties of honeys from different geographical areas. Such studies can enhance our understanding of the factors that contribute to the quality and health benefits of honey and support the promotion of local honey varieties.

2. Materials and Methods

2.1. Materials

2.1.1. Samples

The set of analyzed honeys contained acacia, lime, rapeseed, and forest honeys (honeydew honeys). Measurements were done on 19 samples of honeys received from individual producers from Poland and the Slovak Republic. Botanical origin of honey was guaranteed by the seller.

2.1.2. Chemicals

In electron paramagnetic resonance (EPR) and UV-VIS experiments, 2,2’-azino-bis(3-ethylbenthiazoline-6-sulfonic acid) salt (ABTS, Polysciences, Inc., Warrington, PA, USA), Folin-Ciocalteu‘s phenol reagent, gallic acid of analytical grade purity (Sigma Aldrich Ltd., Milwaukee, WI, USA); potassium persulfate (Merck GmbH, Darmstadt, Germany), and sodium carbonate (Lachema, Brno, Czech Republic), 1,1-diphenyl-2-picrylhydrazyl radical (DPPH, Sigma Aldrich Ltd., Milwaukee, WI, USA) were employed. In all the experiments, water of HPLC-grade purity freshly prepared in the laboratory by Rodem 6 (Rodem Water, Zemné, Slovakia) was used. Standards of Caffeic acid, Phloridzin, Quercetin, p-coumaric acid, Vanillanic acid fructose, and glucose were purchased from Sigma-Aldrich (Sigma Aldrich Ltd., Milwaukee, WI, USA).

2.2. Methods

2.2.1. Water Content

Water content was measured according to the harmonized method of International Honey Commission [21] using refractometer PAL-22S (Atago Co., Ltd., Saitama, Japan). The homogeneous sample was heated in a water bath until the crystals were completely dissolved, cooled to room temperature, and then placed on the refractometer prism. The measurement was performed at least twice for each sample.

2.2.2. Electrical Conductivity

Electrical conductivity was measured according to the harmonized method of International Honey Commission [21] using conductometer CPC-551 (Elmetron, Zabrze, Poland). Measurements were performed for 20% w/v honey solutions (calculated as dry honey substance). The electrical conductivity of honey was expressed in mS/cm. The measurement was performed at least twice for each sample.

2.2.3. Diastase Number

Diastase activity was estimated according to the harmonized method of International Honey Commission [21] and expressed as a diastase number (DN). Measurements were done spectrophotometrically (λ = 620 nm) using UVS-2800 spectrophotometer (Labomed, Inc., Los Angeles, CA, USA). The measurement was performed using Phadebas tablets (Phadebas AB, Kristianstad Sweden) containing insoluble blue dyed cross-linked starch as the substrate. Diastase activity, in Schade scale, is defined as the amount of starch (g) hydrolysed during 1 h at 40 °C per 100 g of honey. The measurement was performed at least twice for each sample.

2.2.4. Specific Rotation

Specific rotation of 10% (w/v) aqueous honey solution was measured using AP-300 automatic polarimeter (Atago Co., Ltd., Saitama, Japan). Honey solutions were deproteinized before measurement using Carrez I and II solutions and filtered. The measurement was performed at least twice for each sample.

2.2.5. Carbohydrate Profile

Determination of sugars was accomplished by high performance liquid chromatography using chromatograph PU-4003 (Pye Unicam, Cambridge, UK). Chromatographic separation was performed on amino column Kromasil 100-5NH2, 250 × 4.6 mm i.d. (AkzoNobel, Amsterdam, The Netherlands) using refractive index detector RID-10A (Shimadzu Corp., Kioto, Japan). As a mobile phase the mixture of acetonitrile/water 80/20 (v/v) was used at the flow rate 1.5 mL/min. Samples were prepared at concentration of 2 g honey per 50 mL of water. Samples were sonicated for 5 min, then filtered through the 45 μm syringe filter with a cellulose membrane (Agilent, Waldbronn, Germany) and 20 µL of the filtrate was injected into HPLC system. Calibration of the HPLC system was done using standards of glucose (LOD = 0.53 mg/mL; LOQ = 1.61 mg/mL) and fructose (LOD = 2.08 mg/mL; LOQ = 6.30 mg/mL).

2.2.6. HMF Analysis

Honey samples were prepared in concentration 0.1 g/mL in 80/20 methanol/water (v/v) solution. Methanol was HPLC-purity grade from Sigma-Aldrich (Steinheim, Germany) and water was also HPLC-purity grade. Obtained samples were sonicated for 2 min and before chromatographic analysis filtered through filter paper.
Hydroxymethylfurfural (HMF) from Sigma-Aldrich was determined by HPLC using chromatograph Agilent Technologies 1200 series (Palo Alto, CA, USA) with spectrophotometric detector operating at 280 nm. Gradient separation (solvent A: methanol; B: 0.01 M phosphoric acid; C: acetonitrile) was carried out as follows: 0–1.5 min 0% A, 100% B, 0% C; 1.5–3 min. 2% A, 95% B, 3% C; 3–11.5 min. 94% A, 0% B, 6% C; 11.5–20 min. 2% A, 95% B, 3% C. Phosphoric acid and acetonitrile HPLC-purity grade were both from Sigma-Aldrich. 20 µL of the sample was injected into HPLC system. Separation was done using column Zorbax SB RP-18, 250 × 4.6 mm (Agilent Technologies). Calibration of the HPLC system was done using standard of HMF (Sigma-Aldrich, St. Luis, MA, USA).

2.2.7. Color Measurements

Color measurements were carried out using UV-VIS-NIR spectrophotometer Shimadzu 3600 (Shimadzu, Tokyo, Japan) with accessory. Absorbance of honey were performed using the following setup: spectral range 300–800 nm, sampling interval 1 nm, slit width 0.1 nm, in the quartz cell (optical path 1 cm, 100-QS-Suprasil, Hellma, Müllheim, Germany) against distilled water as a blank. CIE L*a*b* colour space defined by CIE (Commission Internationale de l’Eclairage) classifies colour of any object in three dimensions; L*, indicating lightness from 0 (black) to 100 (white); coordinates a* and b* represent greenness (−a*), redness (+a*), blueness (−b*) and yellowness (+b*), respectively.
The L*, a* and b* calculations were performed directly from the measured absorbance spectra in spectral range 380–780 nm by means of Panorama 3.1.16 advanced ColourLite (LabCognition Analytical Software, Köln, Germany) using the D65 day light illuminant and 10° standard observer angle. Browning index (BI) of honey samples were calculated from them using the following formula [22]:
BI = 100 ∙ ((X − 0.31)/0.17)
where: BI is a browning index and X as defined according to Equation (2).
X = (a* + 1.75 ∙ L*)/(5.645 ∙ L* + a* − 3.012 ∙ b*)
where: L*—lightness from 0 (black) to 100 (white); a* and b* represent greenness (−a*), redness (+a*), blueness (−b*) and yellowness (+b*).

2.2.8. Electron Paramagnetic Resonance Measurements of Antioxidant Activities

The EPR experiments were performed in duplicates, using a portable X-band EPR spectrometer e-scan (Bruker Biospin, Karlsruhe, Germany) with accessory. As the reference, 80% methanol (v/v) was used.
Exactly 300 μL of sample (prepared in the same way as in case of HMF analysis) was mixed with 700 μL of ABTS•+ (2,2′-azino-bis(3-ethylbenzthiazoline-6-sulphonic acid) (initial concentration c0(ABTS) = 0.1 mmol/L). Mixture was purged with 2 mL of air and immediately transferred into the EPR flat cell. EPR measurements started exactly 3 min. after the ABTS•+ addition and a set of 10 EPR spectra was recorded in time domain during approx. 15 min.
The ABTS•+ radical-scavenging activities of honey samples were expressed as Trolox equivalent antioxidant capacity (TEACABTS•+, mmol/kg) [23].

2.2.9. Total Phenolic Compounds Content (TPC)

Total phenolic compounds content was determined applying the Folin–Ciocalteu modified method [24]. A total of 200 μL of honey samples, 15.8 mL of distilled water, and 1 mL of Folin–Ciocalteu reagent were mixed. After 10 min, 3 mL of 20% sodium carbonate was added, and after 60 min, the absorbance of final solution was measured at 765 nm. Standard solutions of gallic acid were used for calibration curve construction and results were expressed as gallic acid equivalents (GAE, mg/kg).

2.2.10. DPPH Free Radical Scavenging Ability

The antioxidant activity against DPPH (1,1-diphenyl-2-picrylhydrazyl radical) were done according to Turkmen et al. [25]. Honey samples were prepared at a concentration of 0.2 g/mL and filtered.
For determination of scavenging activity against DPPH, 0.75 mL of honey solution was mixed with 2.25 mL 0.1 mM DPPH (methanol solution). In blank sample, honey solution was replaced by distilled water. After incubation in thedark at room temperature (60 min), the absorbance was measured spectrophotometrically (Spectro UV-VIS Dual Beam UVS-2800, Labomed, Los Angeles, CA, USA) at a wavelength of 517 nm. The scavenging activity (SA) was expressed as Trolox equivalent antioxidant capacity (TEACDPPH•, mmol/kg).

2.2.11. Chromatographic Analysis of Polyphenol Profile

Separation and identification of polyphenols were carried out using the HPLC method using Dionex Ultimate 3000 HPLC with Cosmosil 5C18—MS—II 250 × 4.6 mm (Nacalai Tesque, Inc., Kyoto, Japan) column and DAD detector (Thermo Scientific, Germering, Germany) according to Klimczak et al. [26] with modification as described by Mikulec et al. [27]. Gradient elution (1 mL/min) was used (solvent A—2% aqueous solution of acetic acid, and solvent B—100% methanol) for separation of individual polyphenols. Gradient program was as follows: 0 min. 95% A, 10 min. 70% A, 25 min. 50% A, 35 min. 30% A, 40 min. to the end of analysis 95% A. Set of analytical lines as 254 nm, 280 nm, 320 nm, and 360 nm and 3D spectra were recorded (Supplementary Materials Figure S1). All standards and eluents were of HPLC grade. Measurements were done in two replicates.

2.2.12. Statistical Analysis

The significance of differences was demonstrated by variance analysis using the Statistica 13.3 package (TIBCO Software Inc., Palo Alto, CA, USA).

Cluster Analysis

The cluster analysis was conducted using the K-Means algorithm, implemented in Python 3.11.11 with the scikit-learn library.
To determine the optimal number of clusters, the Elbow Method was applied, testing K-Means clustering for K values from 1 to 10 and analysing inertia. The Elbow Plot indicated a significant drop at K = 3, suggesting that three clusters provide the best segmentation of honey types based on composition.

Ordinary Least Squares (OLS) Regression

Three Ordinary Least Squares (OLS) regression models were developed using Python version 3.11.11 and the statsmodels library.
The selection of independent variables was guided by Variance Inflation Factor (VIF) analysis, which was conducted to detect and mitigate multicollinearity. Variables with high VIF values were considered for removal to ensure that the model produced reliable and interpretable coefficient estimates. Moreover, K-Fold Cross-Validation was used to assess model stability, and the final regression model was trained on the entire dataset to obtain the most accurate coefficient estimates.
Descriptive analyses ware carried out using Statistica 12.0 (Statsoft, Tulsa, OK, USA).

3. Results and Discussion

3.1. Physicochemical and Antioxidant Features of Honeys

All analyzed 19 honey samples from Poland and Slovakia had moisture content below 20% and hydroxymethylfurfural (HMF) content below 40 mg/kg; likewise, a diastase number higher than eight (Supplementary Materials Table S1), which is consistent with the standard of European Union [28]. The lowest diastase activity (expressed as diastase number) was observed in the case of rapeseed honeys from Poland. The highest value of this parameter was found in acacia honey from Slovakia, which was twice as large, as in the case of acacia honey from Poland. For all tested honeys, the sum of fructose and glucose, and the electrical conductivity of analyzed samples, were in line with standard requirements. The lowest conductivity exhibited rapeseed honeys (0.155 and 0.163 mS/cm for Polish and Slovak honeys, respectively) followed by acacia (0.192 and 0.232 mS/cm), lime (0.409 and 0.330 mS/cm), and forest honeys (1.032 and 1.155 mS/cm). The highest electrical conductivity revealed Polish forest honey what is characteristic for such type of honey (honeydew honey) [29]. The particular types of honey produced in Poland and Slovakia showed similarity in terms of glucose to fructose ratio (Supplementary Materials Table S1). It proves similarities of honey types obtained among selected countries. This similarity was also visible in the values of specific rotation. The most negative value of this parameter was shown by acacia honeys, which is related to the higher fructose content, while in the case of forest honeys (honeydew), the values of specific rotation oscillated around zero or was positive.
Color of analyzed honeys was evaluated (Supplementary Materials Table S1), and results were expressed as L*, a*, b*. The browning index (BI, Equation (1)) was calculated from the above-mentioned parameters and used for better and easier characterization of differences between analyzed samples.
The lowest value of BI was evaluated for Slovak rapeseed honey (7.54). Polish rapeseed honey exhibited higher value (14.34) what was a consequence of higher b* value reflecting a larger share of yellow color in overall color perception. An explanation of this observation may be the fact that the flowering period of rapeseed in Poland falls short before the acacia (Robinia pseudoacacia) bloom. Therefore, it is impossible to exclude the possibility of a small contamination of rapeseed nectar by nectar from another plant. Acacia honeys both from Poland and Slovakia had a similar BI value.
One of the most important functional properties of honey is antioxidant activity. Honeys differ in terms of floral source, and that is why they also vary in this functional feature. Antioxidant properties of honeys were expressed as Trolox equivalent antioxidant capacity (TEAC) and were measured both against ABTS•+ and DPPH. Polish and Slovak honeys had similar TEAC measured against ABTS•+ within their own type with rapeseed honey as one exception. Polish rapeseed honey exhibited twice as much antioxidant activity as compared to the Slovak one. This can be explained by the slightly darker and more yellow color of this honey. It is noteworthy that the color of the honey is closely related with its antioxidant properties (Supplementary Materials Table S1) [30]. On the other hand, both rapeseed honey from Slovakia and Poland showed similar antioxidant properties measured against DPPH, although the TPC value was higher, in the case of honey samples from Poland (Supplementary Materials Table S1). This may indicate a certain specificity of particular antioxidant activity assays [31]. The highest TEAC measured both against ABTS•+ and DPPH as well as the highest TPC showed sample of Polish forest honey (honeydew honey) (Supplementary Materials Table S1) what is characteristic for this type of product [29].
In each of the analyzed honeys, the dominant polyphenols (Supplementary Materials Table S1) were vanillic acid and quercetin. The content of vanillic acid ranged from 6.07 mg/kg in Slovak forest honey to 9.72 mg/kg in Polish forest honeys. The level of quercetin ranged from 4.48 mg/kg in Polish acacia honeys to 9.43 mg/kg in Polish rapeseed honeys. The lowest content of phloridzin was observed in Polish lime honeys (1.39 mg/kg), and the highest in Slovak rapeseed honey (6.61 mg/kg). The concentration of caffeic acid ranged from 1.96 mg/kg in Polish acacia honeys to 3.40 mg/kg in Slovak lime honey. The lowest level of p-coumaric acid was observed in Slovak rapeseed honeys (2.69 mg/kg), and the highest in Polish lime honey (6.16 mg/kg) (Supplementary Materials Table S1).

3.2. Statistical Discrimination of Honeys

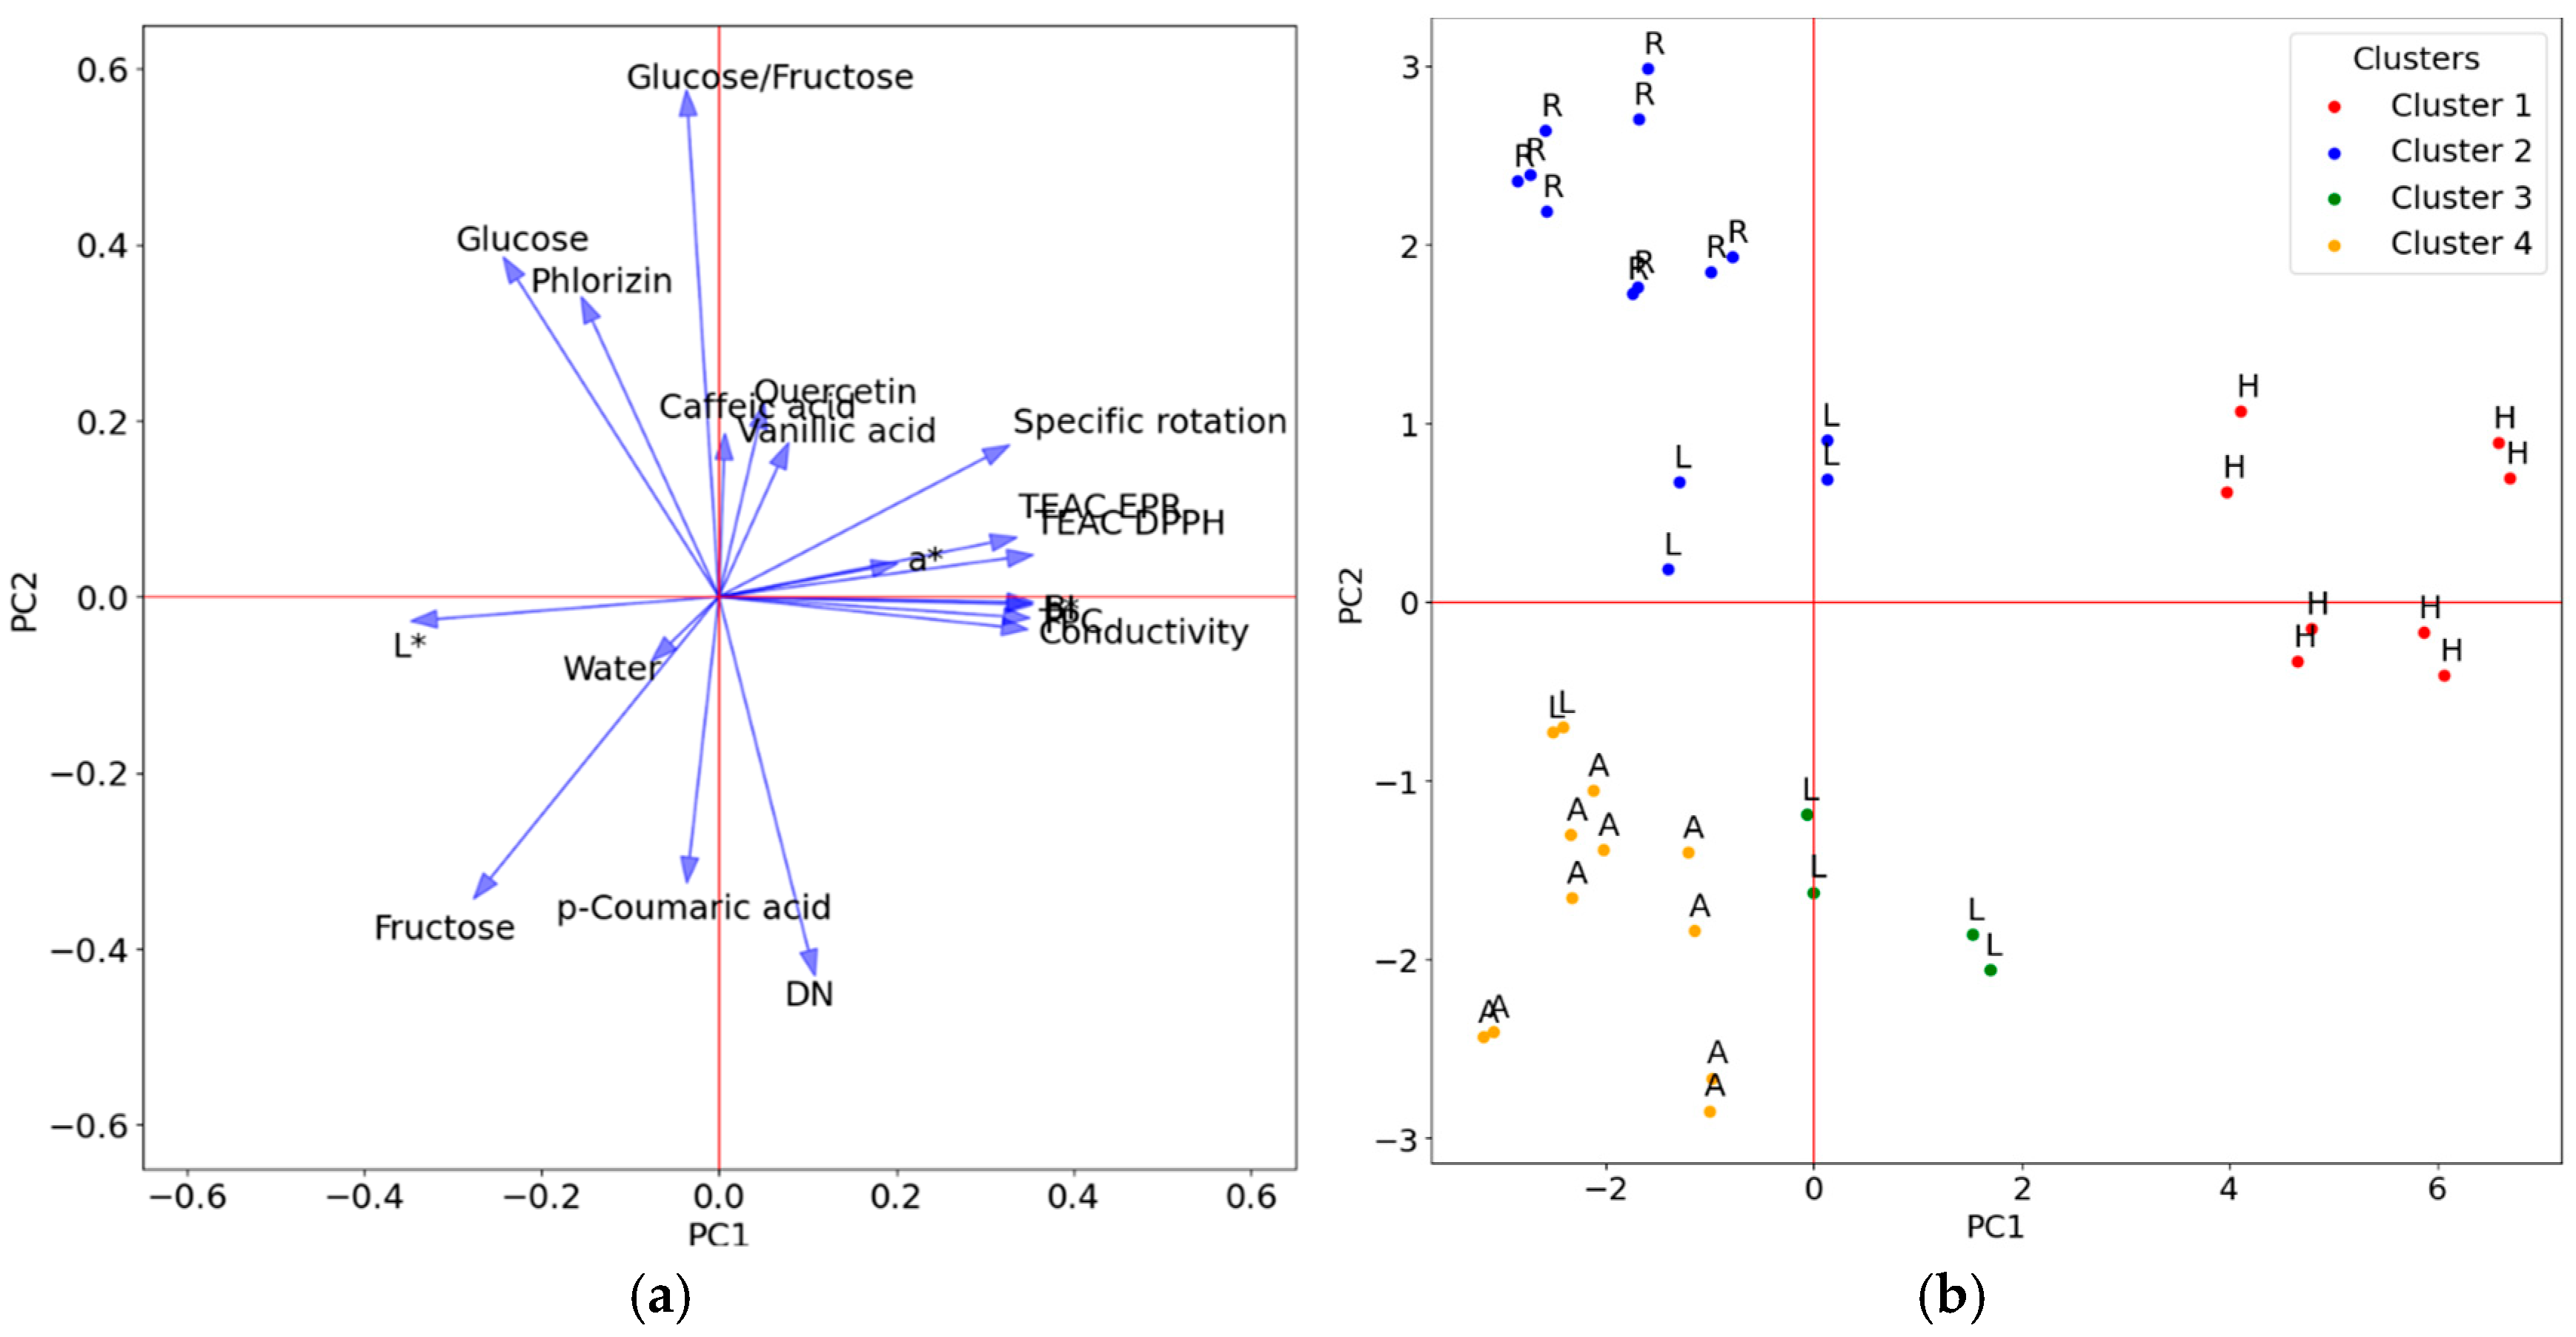
3.2.1. Cluster Analysis

Based on the Elbow Method, K-Means clustering was performed with K = 4 to segment the honey samples into distinct groups. To visualize the clustering results, Principal Component Analysis (PCA) was used to reduce dimensionality, allowing the clusters to be plotted in a 2D space (Figure 1b). In turn, the projection of variables onto the plane of main factors is presented in Figure 1a. The scatter plot displays the data points, colored according to their assigned cluster. Each point is annotated with its corresponding honey type (A—acacia, L—lime, R—rapeseed, H—honeydew (forest honey)) to enhance interpretability. The results suggest that the clusters successfully separate different honey types based on their chemical composition.
The distribution of honey types within each cluster was analyzed to assess the clustering effectiveness. The contingency table (Table 1) shows the number of samples for each honey type within the three clusters. The results indicate that certain honey types are grouped together, suggesting that the clustering aligns with their chemical composition. The influence of individual physicochemical parameters on the main components (PC1 and PC2) is presented in Figure 1a. It can be stated that the values of the first main factor are mainly influenced by parameters describing antioxidant activity, the color parameter (a*) and electrical conductivity, indicating the content of mineral compounds in honey. In turn, the second main factor was most strongly influenced by the content of glucose and fructose, as well as parameters that are not directly related to the honey variety, such as water content and diastase number. Among the determined polyphenols, the content of p-coumaric acid also had a large influence on PC2, which probably influenced the assignment of some of the lime honey samples to cluster number 3 (Figure 1b). The observed relationships confirm the fact that darker honeys (lower L* value) have a higher antioxidant potential [32].
To further evaluate cluster quality, the Silhouette Score was computed and resulted in a value of 0.2857. In this case, the score is not particularly high, which can be attributed to overlapping chemical components between some honey types. This suggests that while the clusters capture certain patterns, there is still some degree of similarity between different honey types, leading to less distinct separation. The chemical composition of nectar honeys can be influenced by environmental factors, including shifts in the production season, which causes the simultaneous occurrence of different nectar sources. Even honeys considered typical may be contaminated to some extent with nectar or pollen from other plants, which causes their similarity to other types of honey. Similarity between nectar honeys might be due to the fact that same plants are blooming in the same period or shortly one after another. For example, together with large-leaved lime (Tilia platyphyllos) such melliferous plants like snowberry (Symphoricarpos albus) and white clover (Trifolium repens) are blooming [12]. It is also necessary to consider the influence of abiotic factors which, by affecting plants and insects, may indirectly affect the composition of nectar [33]. In the case of lime honey, which is obtained from various species of lime trees, the flowering and nectar production period may occur from the second half of May to the first half of July [34]. The rapeseed flowering period usually falls in the middle of May but may shift to its second half [35]. In turn, Robinia pseudoacacia blooms from early May to June [36]. It is also worth noting the similarity of honeys, proven by variance analysis, within the content of individual chemical components. This is particularly visible in the polyphenol profile of the analyzed honeys (Supplementary Materials Table S1).

3.2.2. Assessment of OLS Regression Model Fit

Models describing the relationship between antioxidant activity expressed as the ability to scavenge free radicals ABTS•+ or DPPH, total polyphenol content (TPC), and selected physicochemical properties of honey samples from Poland and Slovakia were developed.
In the first model, the dependent variable used in the regression analysis was TEACABTS•+. The model (Supplementary Materials Table S2, Equation (S1)) was based on seven explanatory variables selected through variance inflation factor (VIF) analysis to detect and mitigate multicollinearity. Those selected variables (two color parameters a* and b* and the content of polyphenols: phloridzin, caffeic acid, quercetin, p-coumaric acid, and vanillic acid) represent various chemical components and factors influencing antioxidant activity.
At a significance level of 5%, the statistically significant predictors were a*, b*, and content of p-coumaric acid and vanillic acid (Supplementary Materials Table S2) in honey samples. According to the model, a one unit increase in the a* parameter is associated with a decrease in ABTS•+ radical scavenging capacity by approximately 0.18 mmol/kg, assuming all other variables are held constant. Conversely, a one-unit increase in b* is associated with an increase in scavenging ability by approximately 0.03 mmol/kg. Regarding the phenolic compounds, a one-unit increase in p-coumaric acid is expected to decrease ABTS•+ scavenging capacity by approximately 0.09 mmol/kg, while a one-unit increase in vanillic acid is associated with an increase of approximately 0.05 mmol/kg, keeping all other variables at a constant level.
The regression model demonstrates good explanatory power, with an adjusted R2 value of 0.858. This means that 85.8% of the variability in the dependent variable is explained by the model, after accounting for the number of predictors.
The above model was subsequently simplified. The revised version (Equation (3)) was constructed using four explanatory variables that influence antioxidant activity: the color parameters a* and b*, and content of p-coumaric acid and vanillic acid (Table 2).
In this case, the simplified regression model equation was as follows:
Y = −0.2466 − 0.1588 · a* + 0.0377 · b* − 0.0800 · p-coumaric acid + 0.0435 · vanillic acid
where: Y—ability to scavenge ABTS free cation radicals; a*—color change from greenness, redness; b*—color change from blueness to yellowness; p-coumaric acid—content of p-coumaric acid; vanillic acid—content of vanillic acid. Assuming a significance level of 5%, the statistically significant variables are a*, b*, and concentration of p-coumaric acid, and vanillic acid. According to the model, for every one-unit increase in a*, the antioxidant activity is expected to decrease by approximately 0.16 mmol/kg, assuming all other variables remain constant. Conversely, a one-unit increase in b* is associated with an increase in antioxidant activity of approximately 0.04 mmol/kg, again holding all other variables constant. An increase in p-coumaric acid content leads to a decrease in the ABTS•+ radical scavenging capacity by approximately 0.08 mmol/kg, while an increase in vanillic acid content results in an increase of approximately 0.04 mmol/kg, assuming all other variables are held constant.
The regression model demonstrates good explanatory power, with an adjusted R2 value of 0.858. This indicates that 85.8% of the variance in the dependent variable is explained by the independent variables, after adjusting for the number of predictors.
Another model was developed to assess the scavenging activity against DPPH free radicals (Supplementary Materials Table S3, Equation (S2)). The model was constructed using five explanatory variables found to influence antioxidant activity: color parameters a* and Browning Index (BI) as well as contents of phloridzin, caffeic acid, and vanillic acid. These variables were selected based on the results of the variance inflation factor (VIF) analysis, which identify and mitigate multicollinearity.
Assuming a significance level of 5%, the only statistically significant variable in this model is the Browning Index (BI). Specifically, a one-unit increase in BI is associated with an increase in antioxidant activity against DPPH radical of approximately 0.018 mmol/kg, holding all other variables constant. This regression model also shows a strong fit, with an adjusted R2 value of 0.927. This indicates that 92.7% of the variability in the dependent variable is explained by the independent variables, after accounting for the number of predictors.
Based on these findings, the model was simplified using BI as a single explanatory variable to evaluate its influence on antioxidant activity (Table 3, Equation (4)).
Y = 0.1590 + 0.0163 · BI
where: Y—ability to scavenge DPPH free radicals; BI—browning index change. A simplified regression model was developed, indicating that for every one-unit increase in the Browning Index (BI), antioxidant activity is expected to increase by approximately 0.016 mmol/kg, assuming all other variables remain constant. This model exhibits a strong fit, with an adjusted R2 value of 0.926, suggesting that 92.6% of the variance in the dependent variable is explained by the independent variables, even after accounting for model complexity.
The final model (Supplementary Materials Table S4, Equation (S3)) was developed to examine the relationship between total polyphenol content (TPC) and specific physicochemical properties of honeys. The model includes six explanatory variables that may influence TPC: the colour parameters a* and b*, and the contents of four polyphenols like phloridzin, caffeic acid, quercetin, and vanillic acid, selected based on a Variance Inflation Factor (VIF) analysis to mitigate multicollinearity.
At a 5% significance level, the statistically significant variables are the colour parameter b* and content of caffeic acid in honey samples. According to the model, a one-unit increase in b* is associated with an increase in TPC of approximately 8 mg GAE/kg, holding all other variables constant. An increase in caffeic acid content results in a TPC increase of approximately 15 mg GAE/kg assuming all other variables are held constant. The regression model demonstrates a very strong fit, with an adjusted R2 value of 0.925. This indicates that 92.5% of the variability in the dependent variable is explained by the independent variables, even after adjusting for the number of predictors.
This model was subsequently simplified. The final model (Table 4, Equation (5)) was constructed using two explanatory variables like colour parameter b* and content of caffeic in honey samples.
After simplification, the model in question took the following form:
Y = 166.9172 + 8.3961 · b* + 11.2498 · caffeic acid
where: Y—total polyphenols content (TPC); b*—color change from blueness to yellowness; caffeic acid—content of caffeic acid in honey samples. Assuming a significance level of 5%, the statistically significant variables are b*, and content of caffeic acids. For every one-unit increase in b*, the TPC value is expected to increase by approximately 8.4 mg GAE/kg, assuming all other variables remain constant. A one-unit increase in caffeic acid concentration is associated with an increase in TPC of approximately 11.2 mg GAE/kg. The regression model demonstrates a strong fit, with an adjusted R2 value of 0.918, indicating that 91.8% of the variation in the dependent variable is explained by the independent variables, even after adjusting for model complexity. Among all models discussed the one with the highest coefficient of determination (adjusted R2 = 0.926) is that describing the relationship between DPPH free radical scavenging activity and total polyphenol content (DPPH, Equation (4)). This model includes two colour parameters (a*, b*), and it is important to note that the color of honey is largely influenced by plant-derived components such as polyphenols, carotenoids, flavonoids, and mineral salts [6,23]. Indeed, all of the other models also included variables related to honey color, underscoring the significance of the relationship between color and antioxidant properties of honey. The results of regression analyses are consistent with previous studies that have shown a strong relationship between honey color and its antioxidant activity. Darker honeys, such as honeydew, are usually characterized by a higher content of polyphenols and a greater ability to neutralize free radicals [6,37]. Color, measured by the parameters a*, b*, and BI, can therefore act as a simple indicator of the health-promoting quality of honey [23].
Interestingly, some of the regression models revealed a negative correlation between the content of specific polyphenols and the antioxidant potentials of honey samples determined by spectrophotometric methods. Honey is a complex food matrix in which various constituents, including mineral salts and enzymes, can interact. In such cases, some components, e.g., polyphenols, may exhibit pro-oxidant activity [3]. It should also be noted that individual components of the food matrix exhibit varying affinities for different antioxidant assays [38]. Furthermore, the limitations of the analytical methods used to assess antioxidant potential must be considered. For example, the TPC determination method with the Folin–Ciocalteu reagent is not specific only for polyphenols, and many compounds, including mineral salts, enter into the reaction with this reagent [31]. Negative correlations between some antioxidant compounds in honey and the ability to scavenge free radicals ABTS•+ or DPPH were also observed by other authors [32,37].
The research results have practical applications in assessing the quality of honey. Color parameters, in particular BI and b*, can be used as quick indicators of antioxidant potential and polyphenol content, which can support the classification of honey varieties and support their promotion as health-promoting products. In addition, compounds such as caffeic and vanillic acid can be useful as chemical markers of honey quality. The results also confirm the need for a holistic approach to assessing the antioxidant properties of food—analysis of single compounds may not reflect the actual health-promoting potential due to complex interactions in the product matrix.

4. Conclusions

This study confirmed that commercially available Polish and Slovak honeys meet European quality standards. Diastase activity was highest in Slovak acacia honey and lowest in rapeseed honeys from both countries. Electrical conductivity varied depending on the type of honey, with the highest values in Polish forest honey, which is characteristic of honeydew honeys. Antioxidant activity correlated with the color of honey samples, and the highest values were observed in Polish forest honey. It is worth noting that Polish rapeseed honey showed higher antioxidant capacity (considered as TEACABTS, TEACDPPH, and TPC) as its Slovak counterpart and darker color probably due to its higher phenolic compound’s concentrations. Cluster analysis grouped honeys based on chemical composition, although some overlap suggests an influence of the environment on the chemical composition of nectar. Regression models identified key predictors of antioxidant potential, emphasizing the role of polyphenols and color parameters. The obtained results contribute to the authentication and assessment of honey quality, supporting its classification based on chemical markers.

Supplementary Materials

The following supporting information can be downloaded at: https://www.mdpi.com/article/10.3390/app15115810/s1, Table S1: Physicochemical and antioxidant properties of Polish and Slovak honeys; Table S2: Parameters of the complete ABTS free radical scavenging model as a function of selected variables; Table S3: Parameters of the complete DPPH free radical scavenging model as a function of selected variables; Table S4: Parameters of the complete TPC free radical scavenging model as a function of selected variables; Figure S1: Chromatograms of polyphenol standards.

Author Contributions

Conceptualization, S.K., K.K. and Z.C.; Methodology, S.K., K.M., Ł.S., M.T., B.T. and M.P.; Software, S.K., B.T., K.M. and A.M.; Validation, S.K., K.K., Z.C. and A.M.; Formal analysis, S.K., B.T. and Ł.S.; Investigation, S.K., K.K., Z.C., B.T. and M.T.; Resources, S.K. and A.M.; Data curation, S.K.; Writing—original draft preparation, S.K., K.M. and A.M.; Writing—review and editing, S.K. and A.M.; Visualization, K.M. and A.M.; Supervision, S.K. and K.B.; Project administration, S.K.; Funding acquisition, S.K. and K.B. All authors have read and agreed to the published version of the manuscript.

Funding

This research received no external funding.

Institutional Review Board Statement

Not applicable.

Informed Consent Statement

Not applicable.

Data Availability Statement

The original contributions presented in this study are included in the article. Further inquiries can be directed to the corresponding author.

Acknowledgments

This research was financed by the Ministry of Science and Higher Education of the Republic of Poland. This work was carried out within the framework of a bilateral scientific internship between the Agricultural University in Krakow, Poland, and the National Agricultural and Food Centre, Food Research Institute, Bratislava, the Slovak Republic.

Conflicts of Interest

The authors declare no conflicts of interest.

References

  1. Biluca, F.C.; Della Betta, F.; de Oliveira, G.P.; Pereira, L.M.; Gonzaga, L.V.; Costa, A.C.O.; Fett, R. 5-HMF and Carbohydrates Content in Stingless Bee Honey by CE before and after Thermal Treatment. Food Chem. 2014, 159, 244–249. [Google Scholar] [CrossRef] [PubMed]
  2. Majewska, E.; Drużyńska, B.; Derewiaka, D.; Ciecierska, M.; Pakosz, P. Comparison of Antioxidant Properties and Color of Selected Polish Honeys and Manuka Honey. Foods 2024, 13, 2666. [Google Scholar] [CrossRef] [PubMed]
  3. Andrés, C.M.C.; Pérez de la Lastra, J.M.; Juan, C.A.; Plou, F.J.; Pérez-Lebeña, E. Polyphenols as Antioxidant/Pro-Oxidant Compounds and Donors of Reducing Species: Relationship with Human Antioxidant Metabolism. Processes 2023, 11, 2771. [Google Scholar] [CrossRef]
  4. Cuevas-Glory, L.F.; Pino, J.A.; Santiago, L.S.; Sauri-Duch, E. A Review of Volatile Analytical Methods for Determining the Botanical Origin of Honey. Food Chem. 2007, 103, 1032–1043. [Google Scholar] [CrossRef]
  5. Zielińska, S.; Wesołowska, M.; Bilek, M.; Kaniuczak, J.; Dżugan, M. The Saccharide Profile of Polish Honeys Depending on Their Botanical Origin. J. Microbiol. Biotechnol. Food Sci. 2014, 3, 387–390. [Google Scholar]
  6. Da Silva, P.M.; Gauche, C.; Gonzaga, L.V.; Costa, A.C.O.; Fett, R. Honey: Chemical Composition, Stability and Authenticity. Food Chem. 2016, 196, 309–323. [Google Scholar] [CrossRef]
  7. Hermosin, I.; Chicon, R.M.; Dolores Cabezudo, M. Free Amino Acid Composition and Botanical Origin of Honey. Food Chem. 2003, 83, 263–268. [Google Scholar] [CrossRef]
  8. Khalil, M.I.; Moniruzzaman, M.; Boukraâ, L.; Benhanifia, M.; Islam, M.A.; Islam, M.N.; Sulaiman, S.A.; Gan, S.H. Physicochemical and Antioxidant Properties of Algerian Honey. Molecules 2012, 17, 11199–11215. [Google Scholar] [CrossRef]
  9. Miłek, M.; Bocian, A.; Kleczyńska, E.; Sowa, P.; Dżugan, M. The Comparison of Physicochemical Parameters, Antioxidant Activity and Proteins for the Raw Local Polish Honeys and Imported Honey Blends. Molecules 2021, 26, 2423. [Google Scholar] [CrossRef]
  10. Kačániová, M.; Borotová, P.; Galovičová, L.; Kunová, S.; Štefániková, J.; Kowalczewski, P.Ł.; Šedík, P. Antimicrobial and Antioxidant Activity of Different Honey Samples from Beekeepers and Commercial Producers. Antibiotics 2022, 11, 1163. [Google Scholar] [CrossRef]
  11. Popek, S. Identification of Honey Types. Nahrung 2003, 47, 39–40. [Google Scholar] [CrossRef] [PubMed]
  12. Kowalski, S.; Kopuncová, M.; Ciesarová, Z.; Kukurová, K. Free Amino Acids Profile of Polish and Slovak Honeys Based on LC–MS/MS Method without the Prior Derivatisation. J. Food Sci. Technol. 2017, 54, 3716–3723. [Google Scholar] [CrossRef]
  13. Bose, D.; Padmavati, M. Honey Authentication: A Review of the Issues and Challenges Associated with Honey Adulteration. Food Biosci. 2024, 61, 105004. [Google Scholar] [CrossRef]
  14. Devillers, J.; Morlot, M.; Pham-Delegue, M.H.; Dore, J.C. Classification of Monofloral Honeys Based on Their Quality Control Data. Food Chem. 2004, 86, 305–312. [Google Scholar] [CrossRef]
  15. Escuredo, O.; Dobre, I.; Fernández-González, M.; Seijo, M.C. Contribution of Botanical Origin and Sugar Composition of Honeys on the Crystallization Phenomenon. Food Chem. 2014, 149, 84–90. [Google Scholar] [CrossRef]
  16. Yaoa, L.; Jiang, Y.; Singanusong, R.; Datta, N.; Raymont, K. Phenolic Acids in Australian Melaleuca, Guioa, Lophostemon, Banksia and Helianthus Honeys and Their Potential for Floral Authentication. Food Res. Int. 2005, 38, 651–658. [Google Scholar] [CrossRef]
  17. Lund, B.; Ma, J. A Review of Cluster Analysis Techniques and Their Uses in Library and Information Science Research: K-Means and k-Medoids Clustering. Perform. Meas. Metr. 2021, 22, 161–173. [Google Scholar] [CrossRef]
  18. Zdaniuk, B. Ordinary Least-Squares (OLS) Model. In Encyclopedia of Quality of Life and Well-Being Research; Maggino, F., Ed.; Springer International Publishing: Cham, Switzerland, 2023; pp. 4867–4869. ISBN 978-3-031-17299-1. [Google Scholar]
  19. Tomczyk, M.; Tarapatskyy, M.; Dżugan, M. The Influence of Geographical Origin on Honey Composition Studied by Polish and Slovak Honeys. Czech J. Food Sci. 2019, 37, 232–238. [Google Scholar] [CrossRef]
  20. Czigle, S.; Filep, R.; Balažová, E.; Szentgyörgyi, H.; Balázs, V.L.; Kocsis, M.; Purger, D.; Papp, N.; Farkas, Á. Antioxidant Capacity Determination of Hungarian-, Slovak-, and Polish-Origin Goldenrod Honeys. Plants 2022, 11, 792. [Google Scholar] [CrossRef]
  21. Bogdanov, S.; Martin, P.; Lullmann, C. Harmonised Methods of the International Honey Commission; International Honey Commission; Swiss Bee Research Centre: Bern, Switzerland, 2002; Volume 5, pp. 1–62. [Google Scholar]
  22. Maskan, M. Kinetics of Colour Change of Kiwifruits during Hot Air and Microwave Drying. J. Food Eng. 2001, 48, 169–175. [Google Scholar] [CrossRef]
  23. Polovka, M.; Sťavíková, L.; Hohnová, B.; Karásek, P.; Roth, M. Offline Combination of Pressurized Fluid Extraction and Electron Paramagnetic Resonance Spectroscopy for Antioxidant Activity of Grape Skin Extracts Assessment. J. Chromatogr. A 2010, 1217, 7990–8000. [Google Scholar] [CrossRef]
  24. Chaovanalikit, A.; Wrolstad, R.E. Total Anthocyanins and Total Phenolics of Fresh and Processed Cherries and Their Antioxidant Properties. J. Food Sci. 2004, 69, FCT67–FCT72. [Google Scholar] [CrossRef]
  25. Turkmen, N.; Sari, F.; Poyrazoglu, E.S.; Velioglu, Y.S. Effects of Prolonged Heating on Antioxidant Activity and Colour of Honey. Food Chem. 2006, 95, 653–657. [Google Scholar] [CrossRef]
  26. Klimczak, I.; Małecka, M.; Szlachta, M.; Gliszczyńska-Świgło, A. Effect of Storage on the Content of Polyphenols, Vitamin C and the Antioxidant Activity of Orange Juices. J. Food Compos. Anal. 2007, 20, 313–322. [Google Scholar] [CrossRef]
  27. Mikulec, A.; Kowalski, S.; Sabat, R.; Skoczylas, Ł.; Tabaszewska, M.; Wywrocka-Gurgul, A. Hemp Flour as a Valuable Component for Enriching Physicochemical and Antioxidant Properties of Wheat Bread. LWT 2019, 102, 164–172. [Google Scholar] [CrossRef]
  28. EEC. Council Directive of 20 December relating to honey 2001/110/EC. Off. J. Eur. Communities 2001, 10, 47–52. [Google Scholar]
  29. Kowalski, S. Changes of Antioxidant Activity and Formation of 5-Hydroxymethylfurfural in Honey during Thermal and Microwave Processing. Food Chem. 2013, 141, 1378–1382. [Google Scholar] [CrossRef]
  30. Beretta, G.; Granata, P.; Ferrero, M.; Orioli, M.; Maffei Facino, R. Standardization of Antioxidant Properties of Honey by a Combination of Spectrophotometric/Fluorimetric Assays and Chemometrics. Anal. Chim. Acta 2005, 533, 185–191. [Google Scholar] [CrossRef]
  31. Huang, D.; Ou, B.; Prior, R.L. The Chemistry behind Antioxidant Capacity Assays. J. Agric. Food Chem. 2005, 53, 1841–1856. [Google Scholar] [CrossRef]
  32. Kędzierska-Matysek, M.; Stryjecka, M.; Teter, A.; Skałecki, P.; Domaradzki, P.; Florek, M. Relationships between the Content of Phenolic Compounds and the Antioxidant Activity of Polish Honey Varieties as a Tool for Botanical Discrimination. Molecules 2021, 26, 1810. [Google Scholar] [CrossRef]
  33. Plos, C.; Stelbrink, N.; Römermann, C.; Knight, T.M.; Hensen, I. Abiotic Conditions Affect Nectar Properties and Flower Visitation in Four Herbaceous Plant Species. Flora 2023, 303, 152279. [Google Scholar] [CrossRef]
  34. Dmitruk, M.; Denisow, B.; Chrzanowska, E.; Dąbrowska, A.; Bożek, M. Comparison of Nectar and Pollen Resources in Various Tilia Species. A Case Study from Southern Poland. Trees 2024, 38, 953–967. [Google Scholar] [CrossRef]
  35. d’Andrimont, R.; Taymans, M.; Lemoine, G.; Ceglar, A.; Yordanov, M.; van der Velde, M. Detecting Flowering Phenology in Oil Seed Rape Parcels with Sentinel-1 and -2 Time Series. Remote Sens. Environ. 2020, 239, 111660. [Google Scholar] [CrossRef]
  36. Martin, G.D. Addressing Geographical Bias: A Review of Robinia Pseudoacacia (Black Locust) in the Southern Hemisphere. S. Afr. J. Bot. 2019, 125, 481–492. [Google Scholar] [CrossRef]
  37. Jaśkiewicz, K.; Szczęsna, T.; Jachuła, J. How Phenolic Compounds Profile and Antioxidant Activity Depend on Botanical Origin of Honey—A Case of Polish Varietal Honeys. Molecules 2025, 30, 360. [Google Scholar] [CrossRef]
  38. Lang, Y.; Gao, N.; Zang, Z.; Meng, X.; Lin, Y.; Yang, S.; Yang, Y.; Jin, Z.; Li, B. Classification and Antioxidant Assays of Polyphenols: A Review. J. Futur. Foods 2024, 4, 193–204. [Google Scholar] [CrossRef]
Figure 1. PCA of honey samples. Projection of variables onto the plane of main factors (a); projection of cases onto the plane of main factors with cluster annotations (b). Honey type: A—acacia, L—lime, R—rapeseed, H—honeydew.
Applsci 15 05810 g001
Table 1. Distribution of honey types across clusters.
HoneyAcaciaLimeRapeseedHoneydew
Cluster
10008
204100
30400
410200
Table 2. Parameters of the simplified ABTS•+ free radical scavenging model as a function of selected variables.
VariableCoefficientStandard Errort-Statisticp-Value95% Confidence Interval
const−0.24660.1500−1.64100.1100−0.55200.0590
a*−0.15880.0570−2.80900.0080−0.2740−0.0440
b*0.03770.003012.84100.00000.03200.0440
p-coumaric acid−0.08000.0180−4.41400.0000−0.1170−0.0430
vanillic acid0.04350.01602.66600.01200.01000.0770
Table 3. Parameters of the simplified DPPH free radical scavenging model as a function of selected variables.
VariableCoefficientStandard Errort-Statisticp-Value95% Confidence Interval
const0.15900.02207.24000.00000.11400.2040
BI0.01630.001021.51800.00000.01500.0180
Table 4. Parameters of the simplified TPC model as a function of selected variables.
VariableCoefficientStandard Errort-Statisticp-Value95% Confidence Interval
const166.917216.300010.24000.0000133.8260200.0080
b*8.39610.415020.21900.00007.55309.2390
caffeic acid11.24985.34702.10400.04300.394022.1050
Disclaimer/Publisher’s Note: The statements, opinions and data contained in all publications are solely those of the individual author(s) and contributor(s) and not of MDPI and/or the editor(s). MDPI and/or the editor(s) disclaim responsibility for any injury to people or property resulting from any ideas, methods, instructions or products referred to in the content.

