Article

Study on the Combustion Behavior and Kinetic Characteristics of Semi-Coke from Oil Shale

Northeast Petroleum University Key Laboratory of Improving Oil and Gas Recovery, Ministry of Education, Daqing 163318, China
*
Author to whom correspondence should be addressed.
Appl. Sci. 2025, 15(11), 5797; https://doi.org/10.3390/app15115797
Submission received: 7 April 2025 / Revised: 7 May 2025 / Accepted: 20 May 2025 / Published: 22 May 2025
(This article belongs to the Section Applied Thermal Engineering)

Abstract

:
This study systematically investigates the combustion behavior and kinetic characteristics of oil shale semi-coke. Thermogravimetric analysis (TGA) experiments, combined with both model-free and model-based methods, were used to explore the thermal characteristics, kinetic parameters, and reaction mechanisms of the combustion process. The results show that the combustion process of oil shale semi-coke can be divided into three stages: a low-temperature stage (50–310 °C), a mid-temperature stage (310–670 °C), and a high-temperature stage (670–950 °C). The mid-temperature stage is the core of the combustion process, accounting for approximately 28–37% of the total mass loss, with the released energy concentrated and exhibiting significant thermal chemical activity. Kinetic parameters calculated using the model-free methods (OFW and KAS) and the model-based Coats–Redfern method reveal that the activation energy gradually increases with the conversion rate, indicating a multi-step reaction characteristic of the combustion process. The F2-R3-F2 model, with its segmented mechanism (boundary layer + second-order reaction), better fits the physicochemical changes during semi-coke combustion, and the analysis of mineral phase transformations is more reasonable. Therefore, the F2-R3-F2 model is identified as the optimal model in this study and provides a scientific basis for the optimization of oil shale semi-coke combustion processes. Furthermore, scanning electron microscopy (SEM) and X-ray diffraction (XRD) analyses were conducted on oil shale semi-coke samples before and after combustion to study the changes in the combustion residues. SEM images show that after combustion, the surface of the semi-coke sample exhibits a large number of irregular holes, with increased pore size and a honeycomb-like structure, indicating that the carbonaceous components were oxidized and decomposed during combustion, forming a porous structure. XRD analysis shows that the characteristic peaks of quartz (Q) are enhanced after combustion, while those of calcite (C) and pyrite (P) are weakened, suggesting that the mineral components underwent decomposition and transformation during combustion, particularly the decomposition of calcite into CO2 at high temperatures. Infrared spectroscopy (IR) analysis reveals that after combustion, the amount of hydrocarbons in the semi-coke decreases, while aromatic compounds and incompletely decomposed organic materials are retained, further confirming the changes in organic matter during combustion.

1. Introduction

With the depletion of conventional fossil energy resources, the development and utilization of unconventional energy sources have gradually become a global research focus in the energy sector. Oil shale, as an unconventional energy resource with abundant reserves and widespread distribution, has attracted considerable attention due to its ability to generate shale oil, semi-coke, and combustible gases during pyrolysis [1]. Among these products, semi-coke is the primary solid residue after oil shale combustion, containing a substantial amount of residual carbon and inorganic mineral components. Given its relatively high calorific value, combustion utilization has become a crucial step in achieving the comprehensive development of oil shale resources. However, the combustion behavior and kinetic characteristics of oil shale semi-coke are significantly influenced by its complex physicochemical composition and structural properties, which differ markedly from conventional coal combustion, necessitating further in-depth investigation [2].
The combustion characteristics of oil shale semi-coke determine its actual performance in energy utilization, including combustion efficiency, energy release rate, and pollutant emission characteristics. The combustion process of semi-coke not only involves the oxidation and decomposition of carbonaceous materials but also includes the thermal decomposition and interactions of inorganic mineral components, leading to complex multi-phase and multi-step reaction kinetics [3,4]. Furthermore, due to variations in geological conditions and composition, oil shale from different regions exhibits significant differences in the combustion behavior of its semi-coke, highlighting the importance of region-specific kinetic studies. Currently, the research on the combustion behavior of oil shale semi-coke primarily employs thermogravimetric analysis (TGA) techniques, which monitor mass changes with temperature to reveal combustion characteristics and reaction patterns. Additionally, model-free methods (such as the OFW method and KAS method) [5,6] and model-based methods (such as the Coats–Redfern method based on reaction mechanism functions) have been utilized to fit and calculate kinetic parameters, providing a theoretical foundation for combustion process simulation and optimization.
Despite the existing studies on the combustion characteristics of oil shale semi-coke, several issues remain unresolved. Significant discrepancies exist in the fitting performance of different kinetic models on experimental data, making it necessary to further explore suitable models for accurately describing the combustion process of oil shale semi-coke [7]. The combustion process of oil shale semi-coke generally includes stages such as volatile release and oxidation, residual carbon oxidation, and mineral decomposition, yet the reaction mechanisms and kinetic behaviors of each stage have not been systematically analyzed [8]. Moreover, due to regional variations in the physicochemical properties of oil shale semi-coke, studies on the regional characteristics of its combustion behavior and kinetic patterns are of great significance. To address these issues, this study focuses on the semi-coke of a typical oil shale from a specific region. Through thermogravimetric analysis (TGA) experiments, the combustion characteristics of the semi-coke are investigated, and kinetic parameters are determined and compared using both model-free and model-based methods [9,10].
Recent studies have investigated the combustion behavior of oil shale semi-coke using both thermogravimetric analysis (TGA) and pilot-scale combustion systems. For instance, Wang et al. (2011) explored the oxidation characteristics of semi-coke derived from oil shale under various atmospheres, revealing its multi-stage combustion behavior [11]. Huang et al. (2020) used TGA to determine the kinetic parameters of semi-coke combustion and highlighted the complexity of its reaction mechanisms [12]. In parallel, practical combustion studies have shown that semi-coke can serve as a supplementary fuel in industrial boilers, although challenges remain in ignition and burnout efficiency [13]. Despite these advances, few studies have integrated comprehensive kinetic modeling with detailed structural analysis (e.g., SEM, XRD, FTIR) to better understand the physicochemical changes during combustion. Our study aims to address this gap by combining both model-free and model-fitting kinetic approaches with in-depth post-combustion characterization to provide a more complete understanding of oil shale semi-coke combustion behavior.

2. Experimental Section

2.1. Experimental Samples

The oil shale samples used in this study were collected from Block X. Prior to the experiments, the samples were dried, ground, sieved, and prepared as granular particles with a size range of 0.5–1 mm. Their characteristics were characterized through elemental analysis and proximate analysis, as summarized in Table 1. The contents of carbon (C), hydrogen (H), nitrogen (N), and sulfur (S) were determined using an Elementar Vario EL cube elemental analyzer following the methodology outlined in (Analytical methods for carbon, hydrogen, oxygen, and nitrogen in rock organic matter) [14]. The moisture, ash, volatile matter, and fixed carbon contents of the oil shale were measured according to (Geological exploration specifications for oil shale, stone coal, and peat) [15] using a 5E-MAG6600 proximate analyzer(manufactured by Beijing Hengtai Shanghe Instruments Co., Ltd., Beijing, China). The specific procedures were as follows: A gravimetric method was employed and 1 g of the dried sample was placed in a sealed container and heated in an oven at 105 °C until a stable mass was achieved. The moisture content was calculated as the percentage of mass loss. The high-temperature combustion method was used and the sample was placed in a ceramic crucible, heated to 850 °C under a programmed temperature ramp, and maintained at this temperature for 1 h. After cooling, the residual ash mass was measured, and the ash content was calculated as the percentage of mass loss. The sample was loaded into a covered crucible and heated in a tube furnace at a rate of 3 °C/min to 900 °C, where it was held for 7 min. The volatile matter content was determined by collecting and weighing the released gases. The fixed carbon content was calculated as 100% − (Moisture + Ash + Volatile Matter)%.

2.2. Preparation of Semi-Coke

In this study, oil shale semi-coke samples were prepared through combustion using an aluminum retort reactor. The experimental setup consisted of a reactor, a temperature control system, a condensation system, and a gas collection system, as illustrated in Figure 1.
The preparation process was as follows: The raw oil shale was crushed to a particle size of 0.5–1.0 mm and dried at 105 °C for 24 h to remove moisture. Combustion experiments were conducted in an aluminum retort reactor under an air-protected atmosphere. The combustion temperature was set to 500 °C, with a heating rate of 10 °C/min. After maintaining the target temperature for 30 min, the system was cooled to room temperature, and the solid product (semi-coke) was collected. The elemental composition of oil shale semi-coke is presented in Table 2.

2.3. Characterization of Combustion Residues

The combustion residues of oil shale semi-coke were characterized using scanning electron microscopy (SEM) (manufactured by Thermo Fisher Scientific Inc., Waltham, MA, USA) and X-ray diffraction (XRD) (manufactured by Rigaku Corporation, Tokyo, Japan). SEM was used to analyze the surface morphology and microstructure, while XRD was employed to identify changes in the mineral composition after combustion. These analyses provide crucial data for understanding the material transformation mechanisms and residue characteristics during the combustion process [16].

2.4. Thermogravimetric Analysis (TGA)

To investigate the combustion characteristics of oil shale semi-coke, thermogravimetric analysis (TGA) experiments were conducted using a NETZSCH TG 209 F3 Tarsus thermogravimetric analyzer (manufactured by NETZSCH Group, Selb, Germany) [17]. A semi-coke sample of 20 ± 0.1 mg was used in each test. The mass change of the sample was recorded in real time under an air atmosphere at five different heating rates: 5 °C/min, 10 °C/min, 15 °C/min, 20 °C/min, and 25 °C/min. The temperature range was set from room temperature to 950 °C, with a gas flow rate of 50 mL/min (oxygen concentration: 21%).

2.5. Kinetic Model Analysis

In this study, the combustion kinetics parameters were calculated using both model-free methods (OFW and KAS methods) and model-based methods (Coats–Redfern method based on reaction mechanism functions). The specific procedures were as follows:
(1) Model-free methods.
Under non-isothermal conditions, the reaction rate equation is expressed as:
d α d t = A exp ( E a R T ) f ( α )
The reaction conversion rate α can be expressed as:
α = m 0 m t m 0 m
where α is the conversion rate, A is the pre-exponential factor (with units of min−1), T is the reaction temperature (K), R is the gas constant (8.314 J/(mol·K)),
f(α) is the mechanism function, m0 is the initial mass of the sample (mg), mt is the sample mass at a given time (mg), and m is the sample mass after the reaction is complete (mg).
The relationship equation between the reaction rate and activation energy in the OFW method is given as [18]:
ln β = ln A E a R G ( α ) 5.331 1.052 E a R T
The KAS (Kissinger–Akahira–Sunose) method is expressed as [19]:
ln β T 2 = ln A R G ( α ) E a E a R T
where β is the heating rate (°C/min), A is the pre-exponential factor (with units of min−1), R is the gas constant (8.314 J/(mol·K)), Ea is the activation energy at a given conversion rate (kJ/mol), G(α) is the integral reaction mechanism function, and T is the reaction temperature at the given conversion rate.
(2) Model-based method.
The model-based method determines combustion kinetic parameters by assuming a specific reaction mechanism function f(α) and combining it with thermogravimetric analysis (TGA) data. In this study, the Coats–Redfern method was first applied, where linear fitting of the relevant equations was performed to calculate the activation energy Eα and pre-exponential factor A based on the slope and intercept. To further optimize the fitting accuracy, different reaction mechanism functions—such as the second-order reaction model, diffusion model, and nucleation and growth control model—were assumed. By comparing the fitting performance, the most suitable reaction mechanism model was identified [20]. Finally, the combustion kinetics of oil shale semi-coke were analyzed using different kinetic mechanism functions. Typical kinetic mechanism functions are shown in Table 3.
The Coats–Redfern method equation can be simplified as:
ln g ( α ) T 2 = ln A R E a β ( 1 2 R T E ) E a R T
g ( α ) = ln 1 α   ( n = 1 )
g ( α ) = 1 α 1 n 1 n 1   ( n 1 )

3. Results and Discussion

3.1. Combustion Characteristics of Oil Shale Semi-Coke

3.1.1. Thermogravimetric Analysis (TGA) Results

The thermogravimetric analysis (TGA) experiment was conducted to obtain the TG and DTG curves of oil shale semi-coke at different heating rates (5 °C/min, 10 °C/min, 15 °C/min, 20 °C/min, and 25 °C/min). The results are shown in Figure 2.
As shown in Figure 2, the combustion process of the sample can be divided into three stages. The first stage is the low-temperature stage (50–310 °C). According to the TG curve, the mass loss during this stage is relatively small (about 10%). A minor loss peak appears on the DTG curve, with a peak temperature around 80–110 °C. At higher heating rates, the peak temperature shifts to a higher value. This stage mainly involves the volatilization of volatile components. The second stage is the medium-temperature stage (310–670 °C), which is the main stage of mass loss, accounting for about 28–37% of the total. A significant loss peak is observed on the DTG curve. During this stage, the carbonaceous components in oil shale semi-coke (mainly fixed carbon and a small amount of residual volatiles) undergo oxidation reactions. The peak temperature also shifts to higher values with the increasing heating rate. The third stage is the high-temperature stage (670–950 °C), mainly caused by the decomposition of carbonate minerals and oxidation of residuals, with a mass loss of about 43–62%. A more prominent mass loss peak appears on the DTG curve, with a peak temperature at around 770–820 °C. However, the reaction rate in this stage is relatively low and is significantly affected by the mineral composition [21].
The combustion process of oil shale semi-coke was found to consist of three distinct stages, with the main mass loss occurring in the medium-temperature zone (310–670 °C). This observation is consistent with the findings of Li et al. [22], who reported a similar multi-stage combustion pattern in thermogravimetric analysis of semi-coke samples. However, the onset temperature of the main combustion stage in this study (~310 °C) is slightly lower than that reported by Zanoni et al. [23], which may be attributed to differences in sample composition and particle size.

3.1.2. Extraction of Combustion Characteristic Parameters

To further analyze the combustion behavior of oil shale semi-coke, key combustion characteristic parameters were extracted from the thermogravimetric analysis (TGA) and derivative thermogravimetric analysis (DTG) curves. These parameters include ignition temperature (Ti), peak temperature (Tp), burnout temperature (Tf), and mass loss ratio. They reflect the thermal and chemical characteristics of the combustion process, including its initiation, main reaction phase, and completion. In this study, the extrapolation method was used to analyze the TG-DTG curves and determine the combustion characteristic parameters (Ti, Tp, and Tf) of the oil shale semi-coke. Taking the heating rate of 25 °C/min as an example, the calculation is shown in Figure 3.
Thermogravimetric analysis (TGA) reveals the staged characteristics of the combustion process of oil shale semi-coke, providing experimental data to support subsequent kinetic modeling. The ignition temperature and peak temperature reflect the thermal stability and reaction rate characteristics of semi-coke combustion. Higher ignition and peak temperatures indicate better combustion stability. The combustion characteristic parameters of oil shale semi-coke at different heating rates are shown in Table 4.
As shown in Table 4, with the increase in heating rate, the ignition temperature (Ti), peak temperature (Tp), and final combustion temperature (Tf) of the sample all show a gradual upward trend. This indicates that the thermal stability of the sample improves with higher heating rates, and the reaction rate characteristics of the combustion process also change. A higher heating rate leads to more intense combustion reactions at elevated temperatures, demonstrating better thermal stability and faster reaction rates. Using a higher heating rate can help improve the combustion efficiency of oil shale semi-coke and enhance its energy conversion efficiency.

3.2. Kinetic Analysis

3.2.1. Model-Free Kinetic Analysis

Based on the core concept of the isoconversional method, there is no need to assume a specific reaction mechanism function. Instead, experimental data from multiple heating rates (β) are used to determine the relationship between β and temperature (T), and kinetic parameters such as activation energy (Eα) and the pre-exponential factor (A) are calculated through linear fitting. The model-free fitting results of the non-isothermal combustion kinetics are shown in Figure 4. Both the OFW and KAS methods yield R2 values above 0.996, indicating that these methods are suitable for describing the combustion kinetics of oil shale semi-coke. The kinetic parameters calculated using the OFW and KAS methods are listed in Table 5.
The activation energy and pre-exponential factor calculated by the OFW and KAS methods are similar, indicating that the model-free method can effectively describe the overall characteristics of the oil shale semi-coke combustion process. Analysis using the isoconversional methods (OFW and KAS) reveals the kinetic behavior of the combustion process. The activation energy increases significantly with the conversion rate, suggesting a clearly staged reaction process. At low conversion rates, the reactions proceed easily, making them suitable for efficient energy release. At higher conversion rates, the reactions are hindered by greater energy barriers, requiring the optimization of combustion conditions (e.g., oxygen concentration or combustion temperature) to improve efficiency.
The gradual increase in activation energy (Eα) with the increasing conversion rate (α) indicates that, during combustion, the dominant reactions shift from the decomposition of easily volatilized components to the oxidation of more resistant fixed carbon and mineral decomposition. According to the OFW method, in the low conversion range (α = 0.1–0.3), the activation energy is relatively low (Eα, avg = 167.31 kJ/mol), and the reaction is mainly driven by the release of volatiles, with minimal chemical resistance. In the high conversion range (α = 0.7–0.9), the activation energy increases (Eα, avg = 201.44 kJ/mol), and the reaction is dominated by fixed carbon oxidation and mineral decomposition, which are associated with higher energy barriers. This indicates that the combustion reaction proceeds faster and more easily at low conversion rates (α = 0.1–0.3), while at high conversion rates (α = 0.7–0.9), the reaction slows down due to the high energy required for carbon and mineral decomposition [24].
The average activation energy calculated by the OFW and KAS methods (180.80–180.81 kJ/mol) falls within the range reported by previous studies on semi-coke and low-grade coals [25,26]. Compared with the results of Bai et al. [27], who reported a lower value (~150 kJ/mol) for retorted oil shale, the slightly higher activation energy in this study suggests a greater thermal stability of the semi-coke used, likely due to its residual carbon content and mineral matrix.

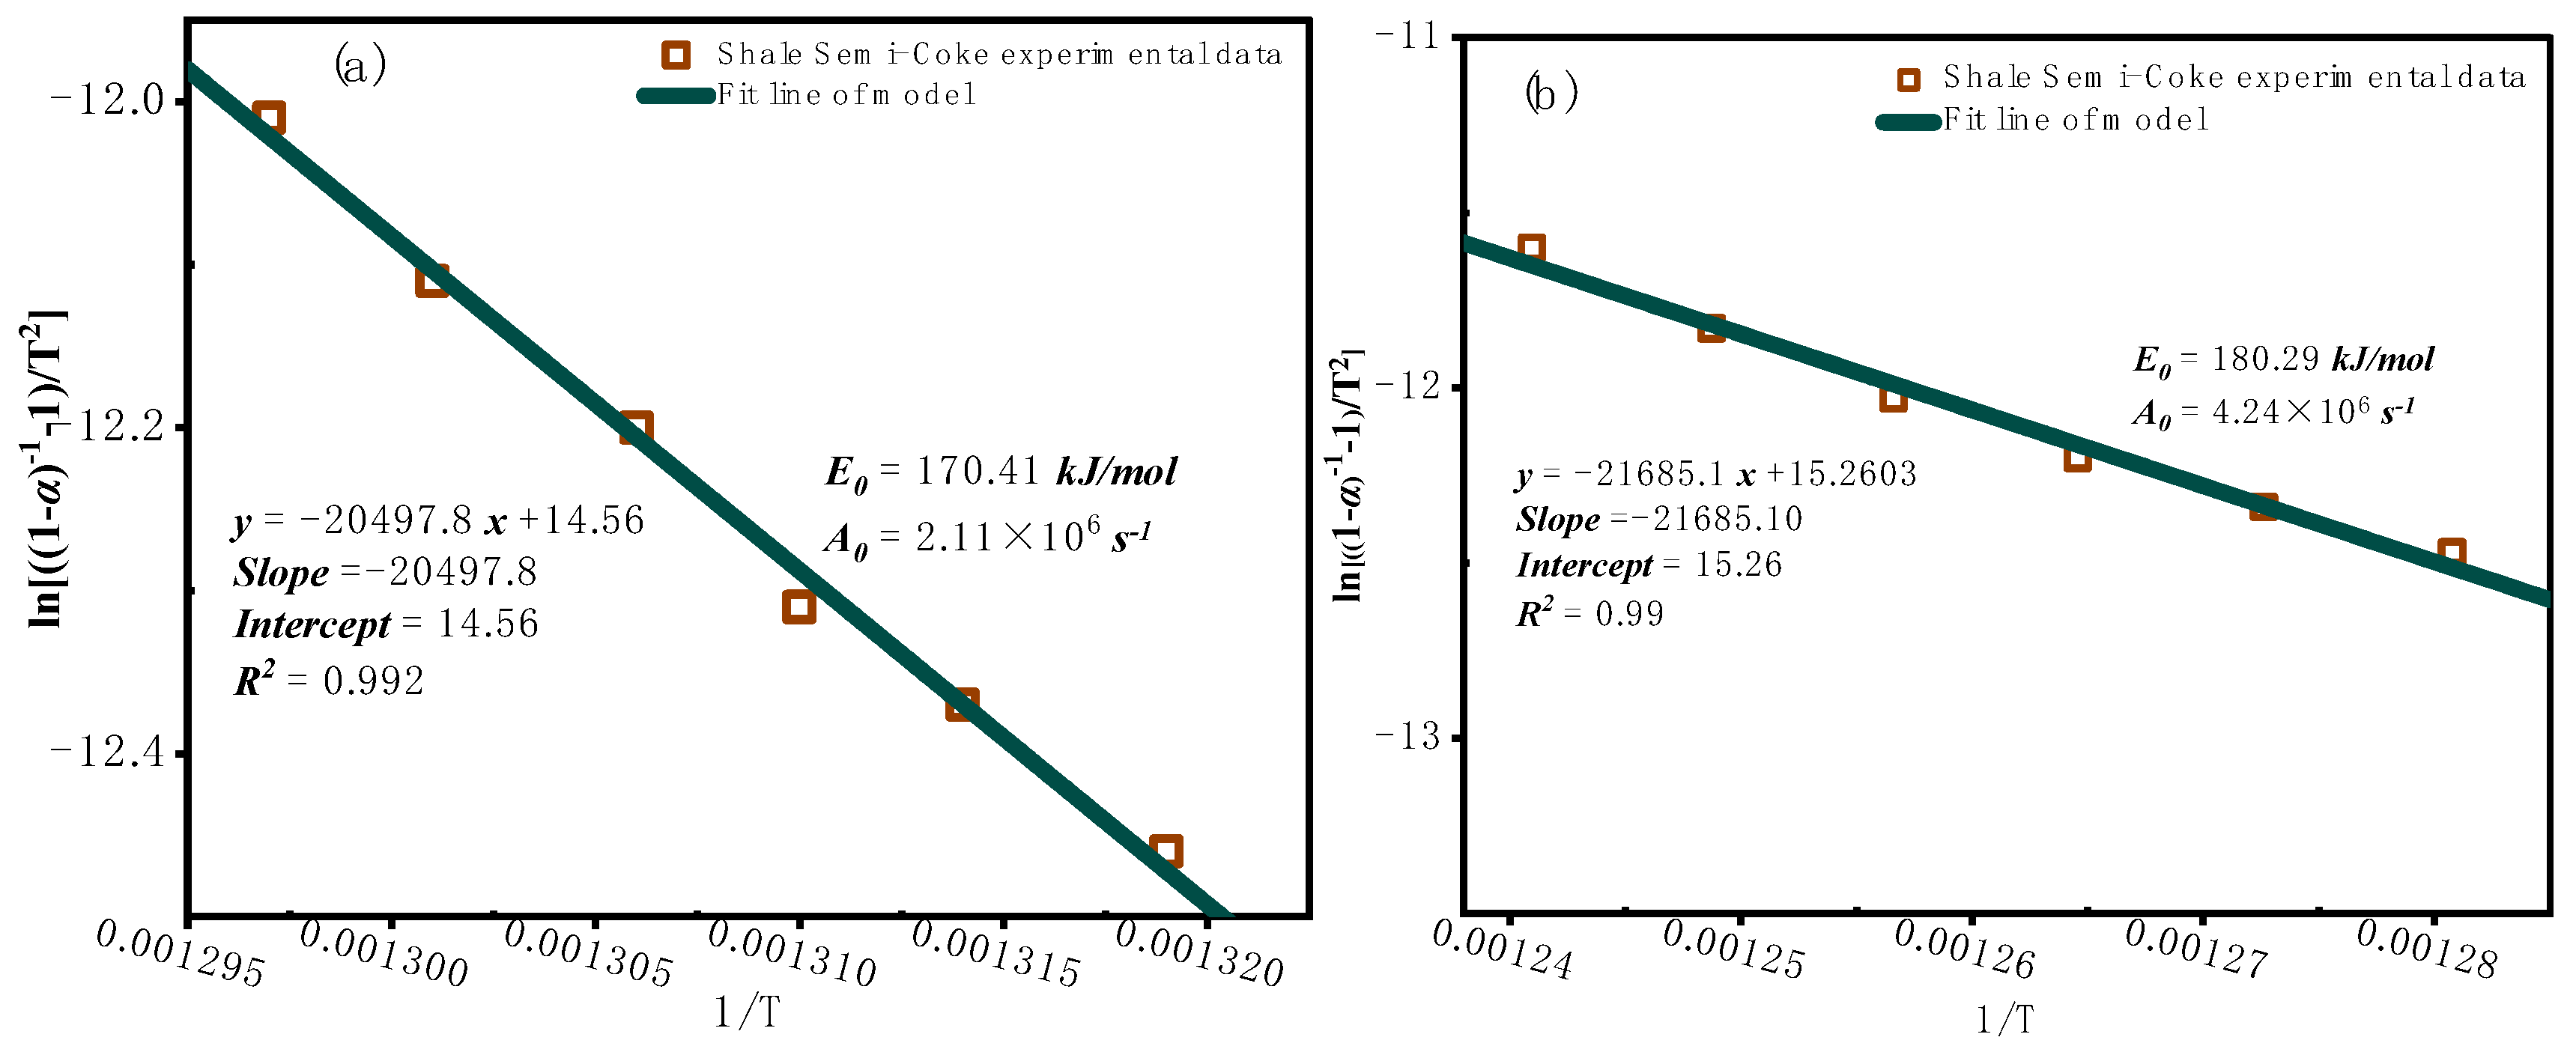
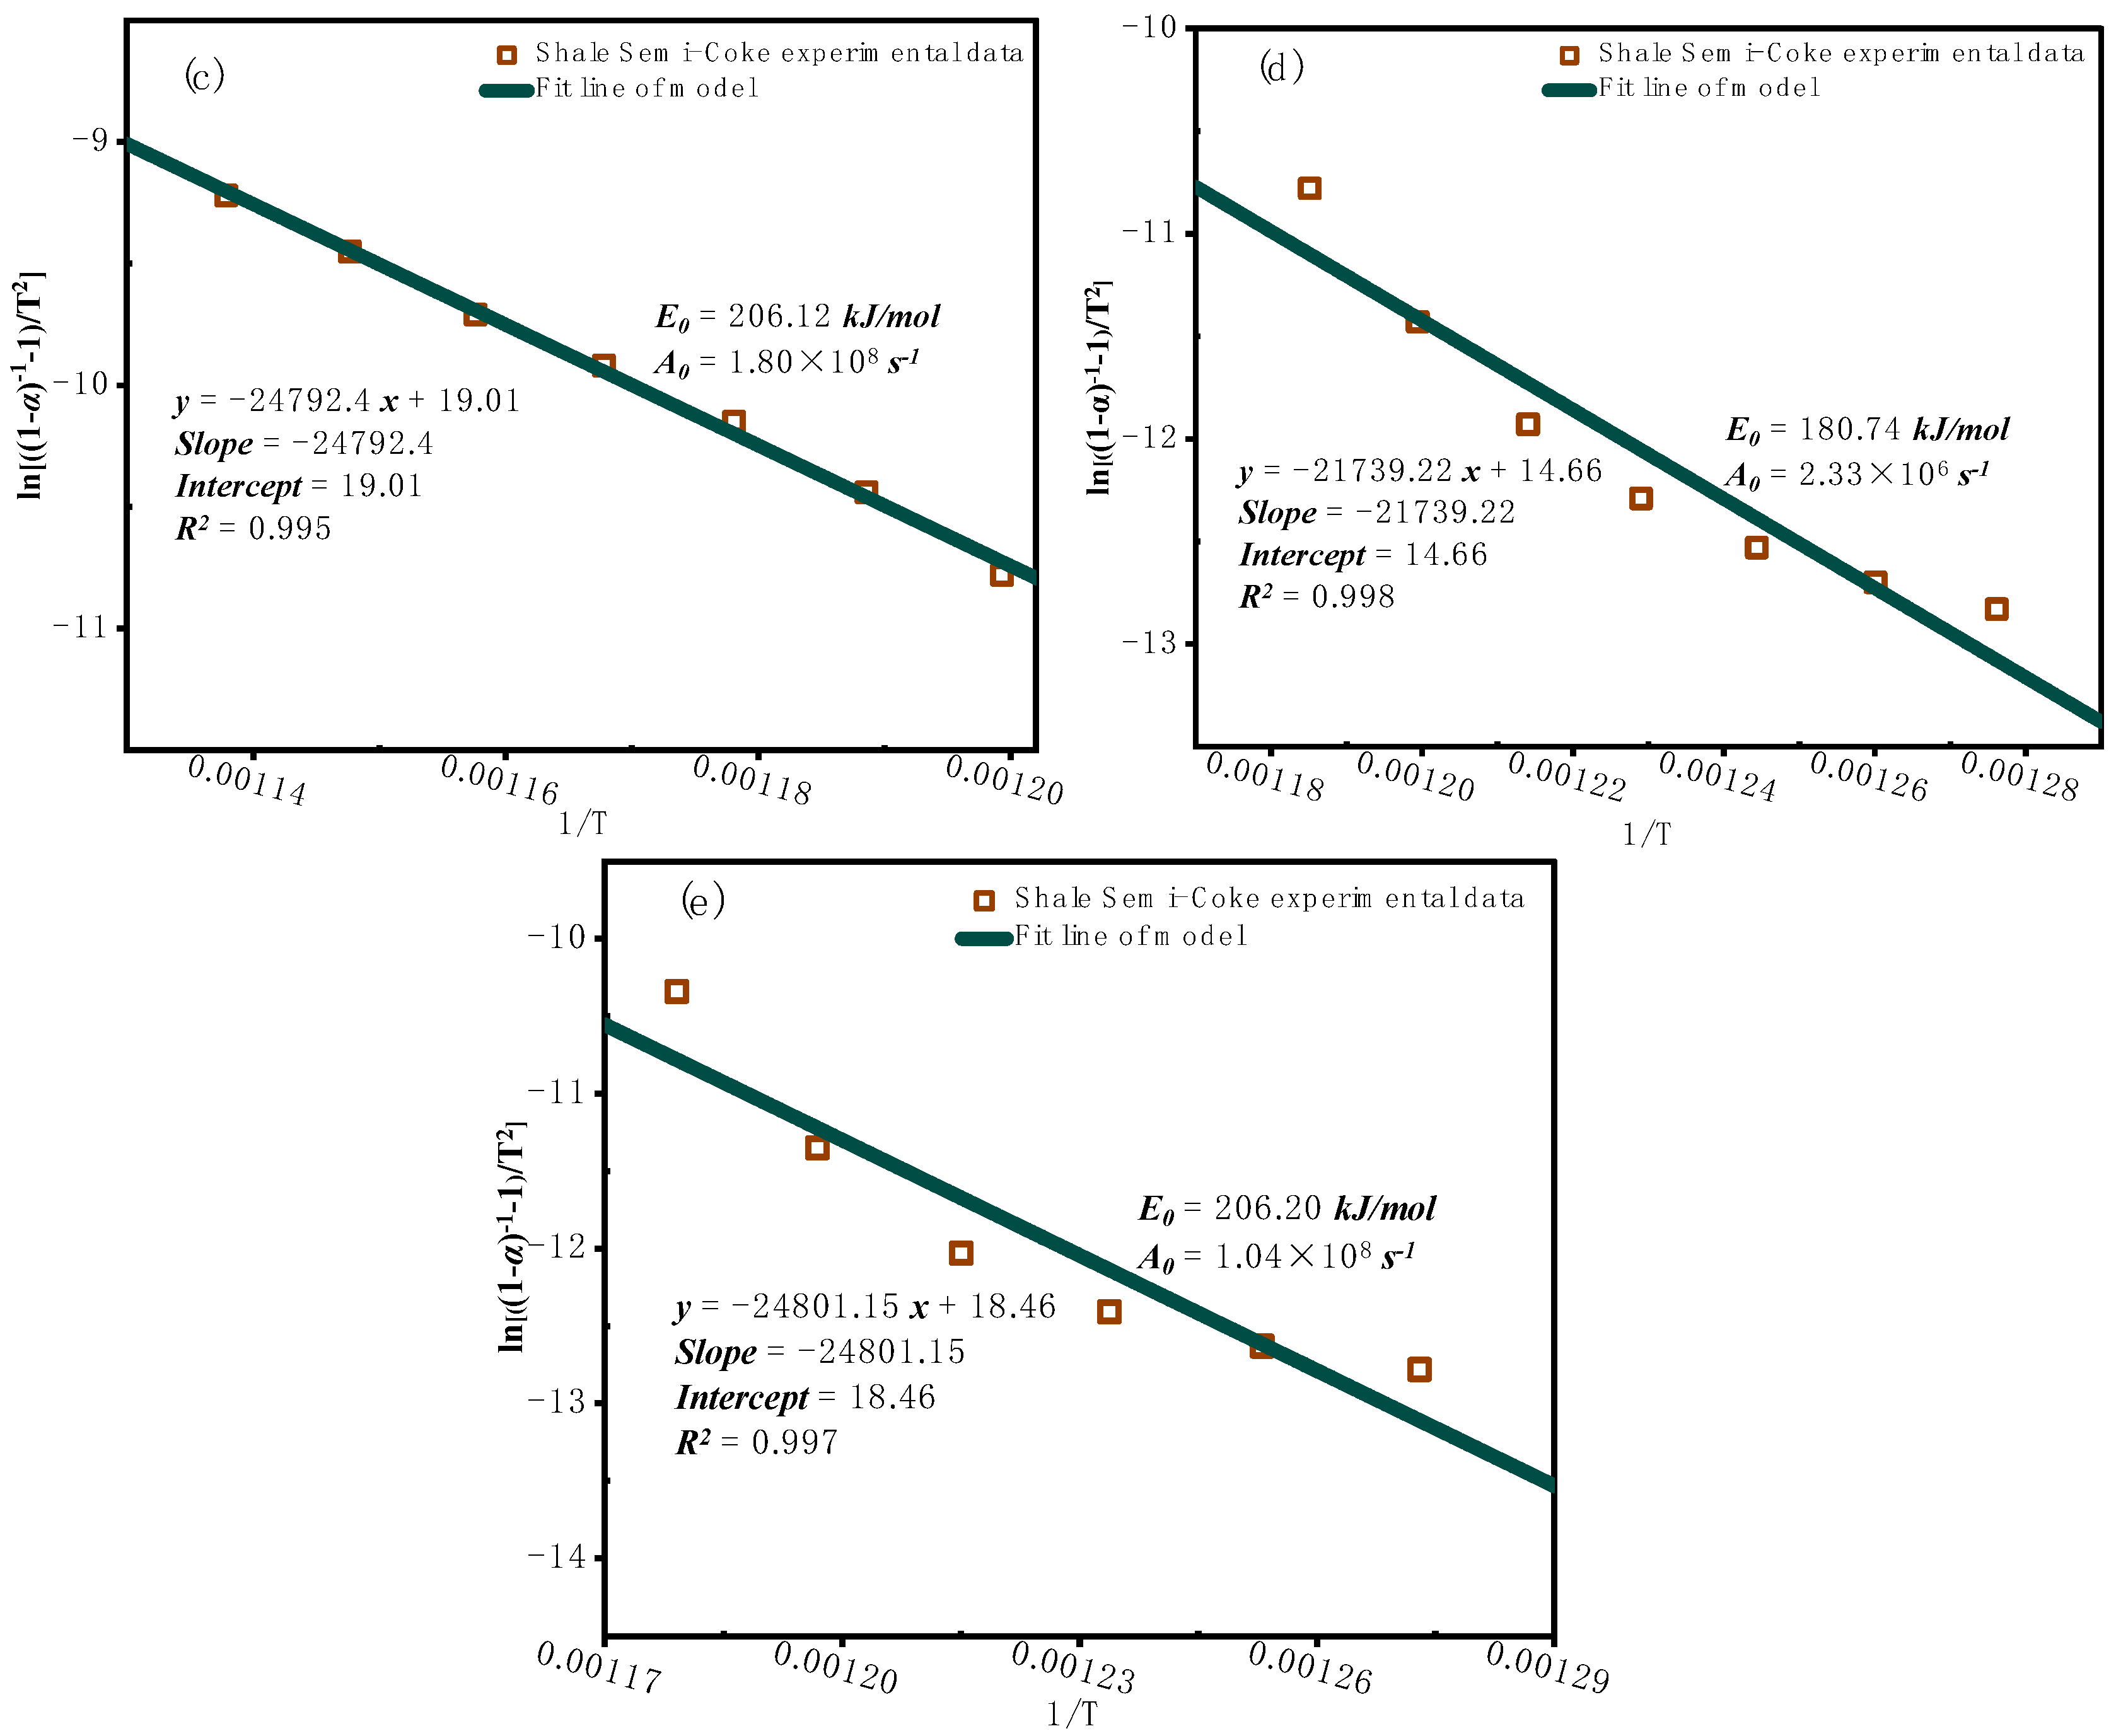
3.2.2. Model-Based Kinetic Function Analysis

Using TGA data at different heating rates, the fixed conversion temperature (T) points were extracted. Based on the Coats–Redfern equation, the function g(α) was computed, and its linear relationship with 1/T was plotted. Figure 5 presents the linear fitting results obtained using the Coats–Redfern integral method for oil shale semi-coke combustion at different heating rates.
As shown in Figure 5, the activation energy (Eα) calculated using the Coats–Redfern integral method is 188.75 kJ·mol−1, and the pre-exponential factor is 5.86 × 10⁷. The activation energies obtained by the OFW and KAS methods fall within the range of 180.80–180.81 kJ/mol, which is close to the result from the Coats–Redfern method, indicating that the Coats–Redfern method has a certain degree of applicability. However, because the Coats–Redfern method used in this study is based on the high-temperature range, it fits the combustion process of oil shale semi-coke in the high-temperature stage relatively well, but fits the low-temperature stage poorly. As a result, the overall fit of the combustion process is not ideal and still has certain errors and limitations. It does not adequately describe the full combustion behavior of oil shale semi-coke.
Furthermore, the kinetic fitting results show that a higher reaction order of n = 2 provides a better fit than n = 1. Therefore, second-order reaction models, diffusion models, and nucleation and growth control models are assumed to fit the experimental data, optimize the calculations, and determine the activation energy (Eα) and pre-exponential factor (A).
When the fitting was divided into three stages based on assumed models, the F2-F2-F2 model (second-order reaction across all stages) shows a gradual increase in activation energy from 180 kJ/mol in the first stage to 263 kJ/mol in the third stage. The lowest activation energy in the first stage suggests rapid combustion of volatiles, while the highest in the third stage indicates the dominance of fixed carbon oxidation or mineral decomposition, requiring more energy. The pre-exponential factor increases from 109 to 1011, reflecting the kinetic trend of significantly accelerated reaction rates with the increasing temperature.
However, fitting all stages with a second-order model overlooks mass transfer limitations such as ash layer coverage. Therefore, the F2-D4-F2 model (a mixed diffusion + second-order reaction model) and the F2-R3-F2 model (interface reaction + second-order reaction model) were introduced for further analysis. In the F2-D4-F2 model, a sharp 50 kJ/mol drop in activation energy in the second stage is mainly due to enhanced diffusion control, as reduced oxygen transfer resistance lowers the apparent activation energy.
The key feature of the F2-R3-F2 model is the use of the R3 model in the second stage, which reflects interface-controlled shrinking reactions. This results in a lower activation energy during this stage, as intermediate products (e.g., opened coke pores) promote the reaction. The third stage becomes the dominant one, contributing up to 58.3%, with a high activation energy of 203 kJ/mol, corresponding to dense carbon layer oxidation—consistent with fundamental combustion kinetics.
When fitting the reaction in two stages, the A2-F2 model (nucleation and growth + second-order reaction) stands out. Its second stage contributes 64.9%, with an activation energy of 221 kJ/mol, which is associated with nucleation and growth mechanisms, reflecting phase transitions and sintering behaviors of ash-forming minerals.
In summary, although the F2-F2-F2 model shows a high degree of fit and general applicability, with activation energy increasing alongside conversion—matching the typical multi-stage characteristics of oil shale semi-coke combustion (volatiles → fixed carbon → minerals)—its simple mechanism tends to overestimate reaction rates in diffusion-limited stages. The combustion of oil shale semi-coke exhibits clear multi-stage kinetic behavior, so model selection must balance mechanistic rationality and data fitting accuracy.
Among the tested models, the F2-R3-F2 model, with its segmented mechanism (interface reaction + second-order reaction), better reflects the physicochemical changes during semi-coke combustion. It also has a more reasonable distribution of contribution rates. Moreover, pore structure evolution and mineral phase transitions observed via in situ characterization (SEM, XRD) support the mechanism, making the F2-R3-F2 model the most suitable. The detailed kinetic parameters of each model are listed in Table 6.

3.3. Characterization of Combustion Residues Analysis

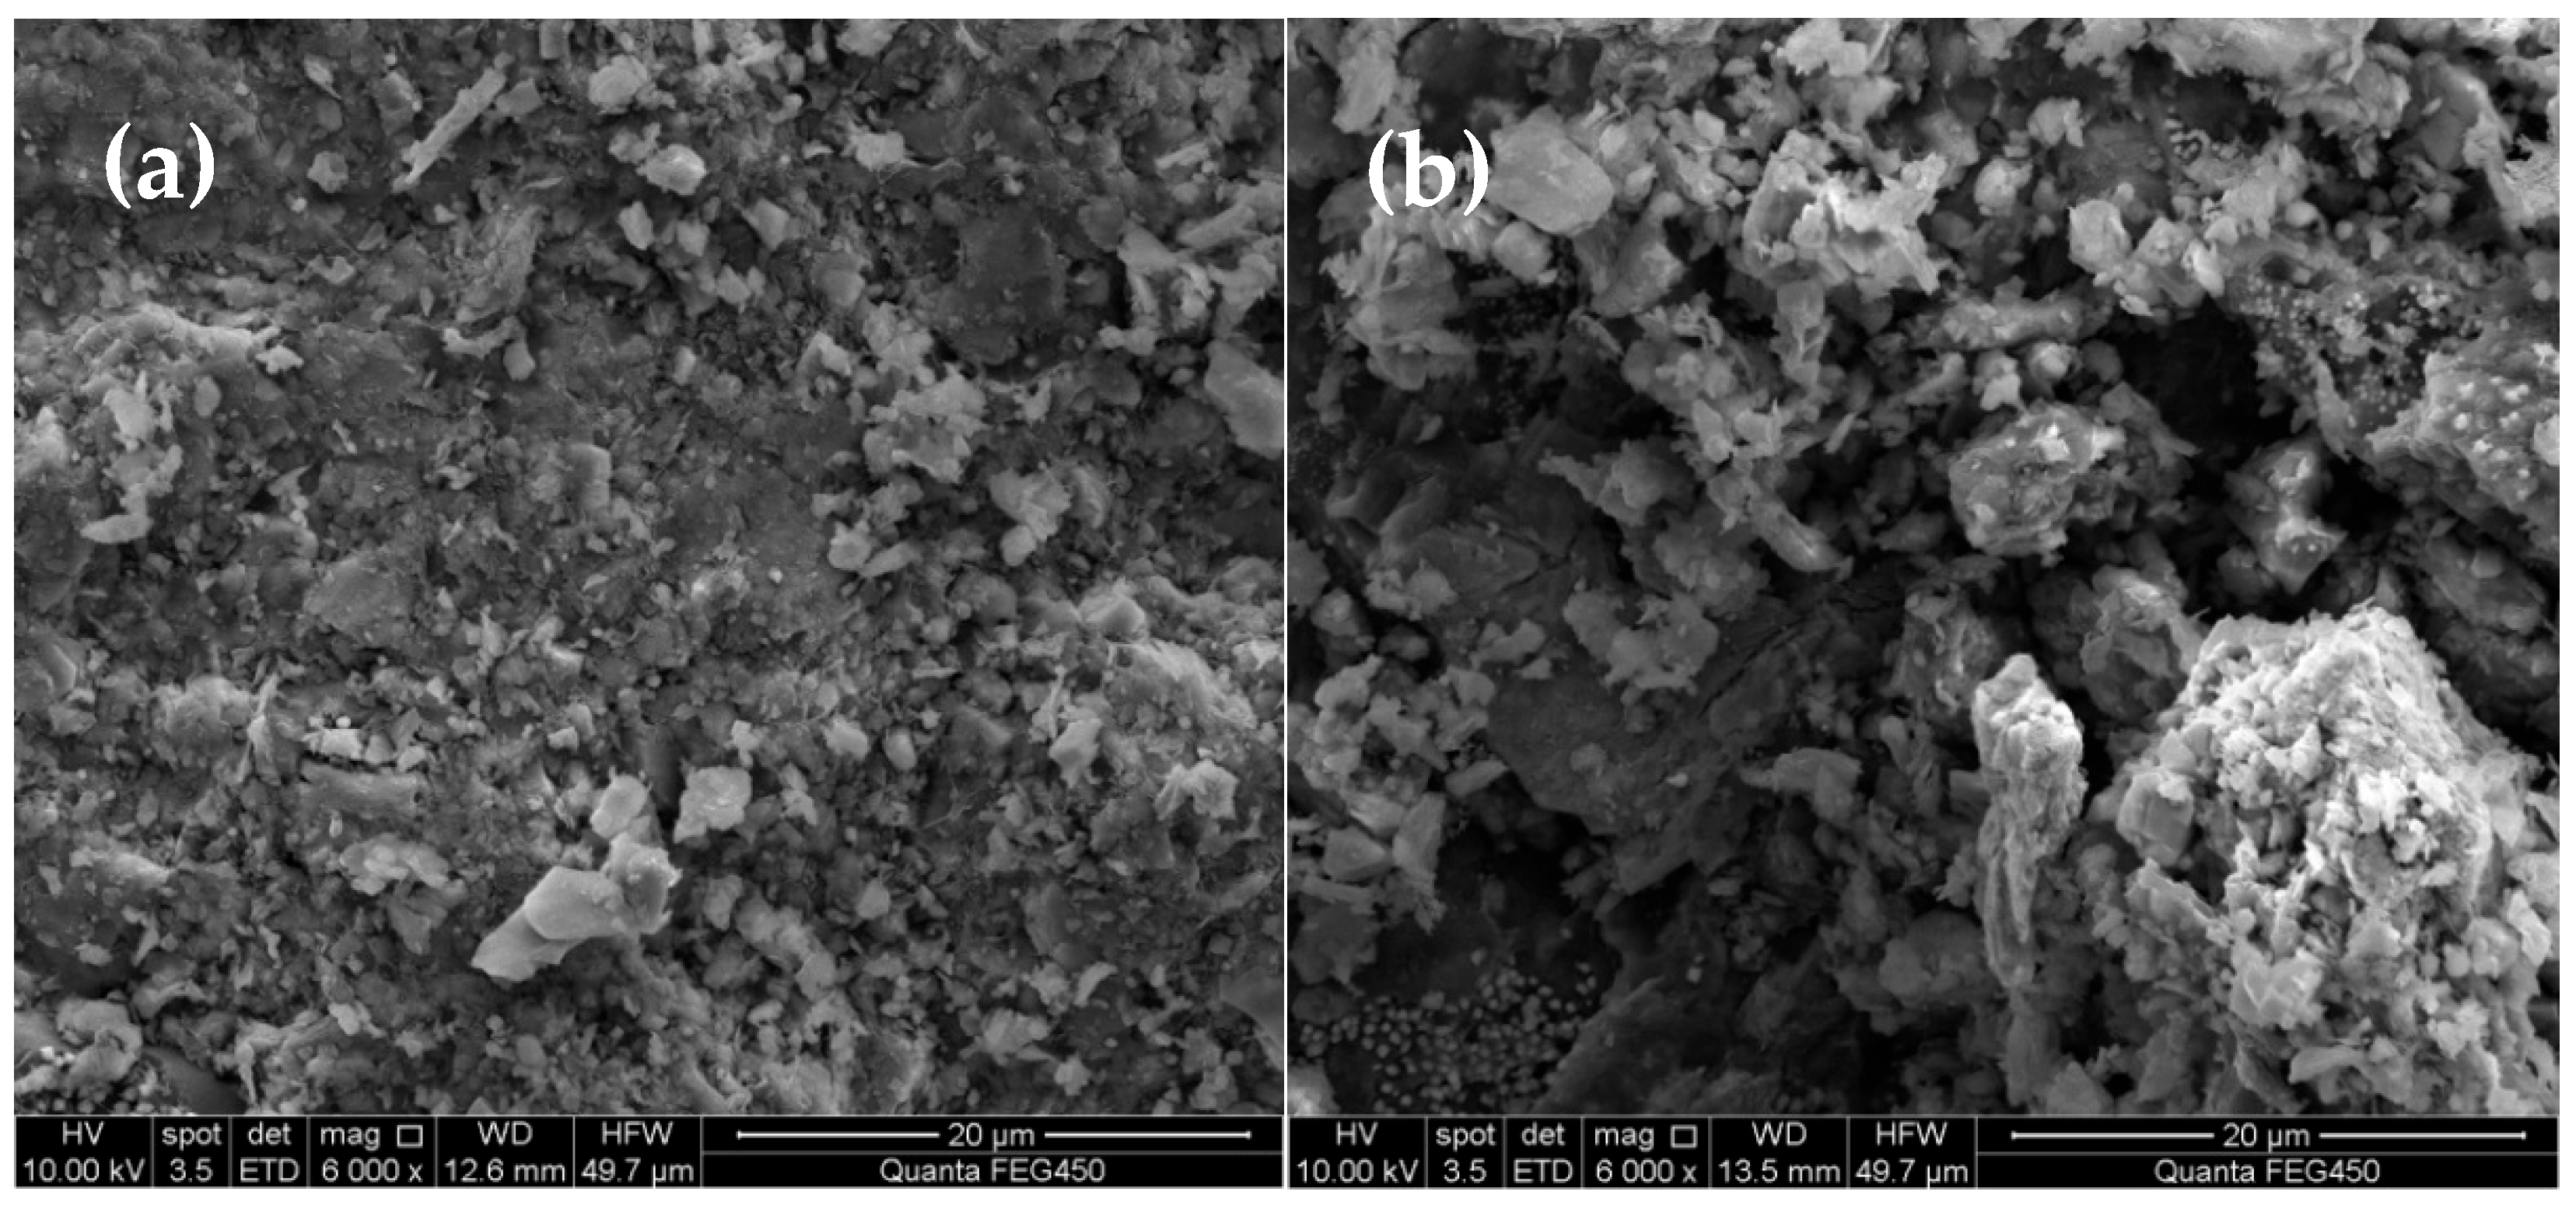
3.3.1. SEM Characterization

High-temperature combustion not only leads to the decomposition of organic matter but also causes the decomposition, concentration, and recrystallization of mineral components, revealing the profound impact of combustion on the solid-phase composition of oil shale.
Figure 6 presents the SEM images of oil shale semi-coke samples before and after combustion, illustrating the morphological changes induced by the combustion process.
As shown in Figure 6a, the surface of the sample before combustion is relatively smooth, with a few small and evenly distributed pores. The pores in the semi-coke are mainly formed by the release of volatiles during the combustion process. At this stage, the material has a high carbon content and low exposure of mineral components.
In Figure 6b, after combustion, the surface of the residual sample exhibits numerous irregular pores with larger and uneven pore sizes. Some areas display a honeycomb-like structure. This is due to the oxidative decomposition of carbonaceous components during combustion, leading to significant material loss and the formation of a porous structure. Additionally, the exposure and partial melting of mineral particles at high temperatures further alter the surface morphology.

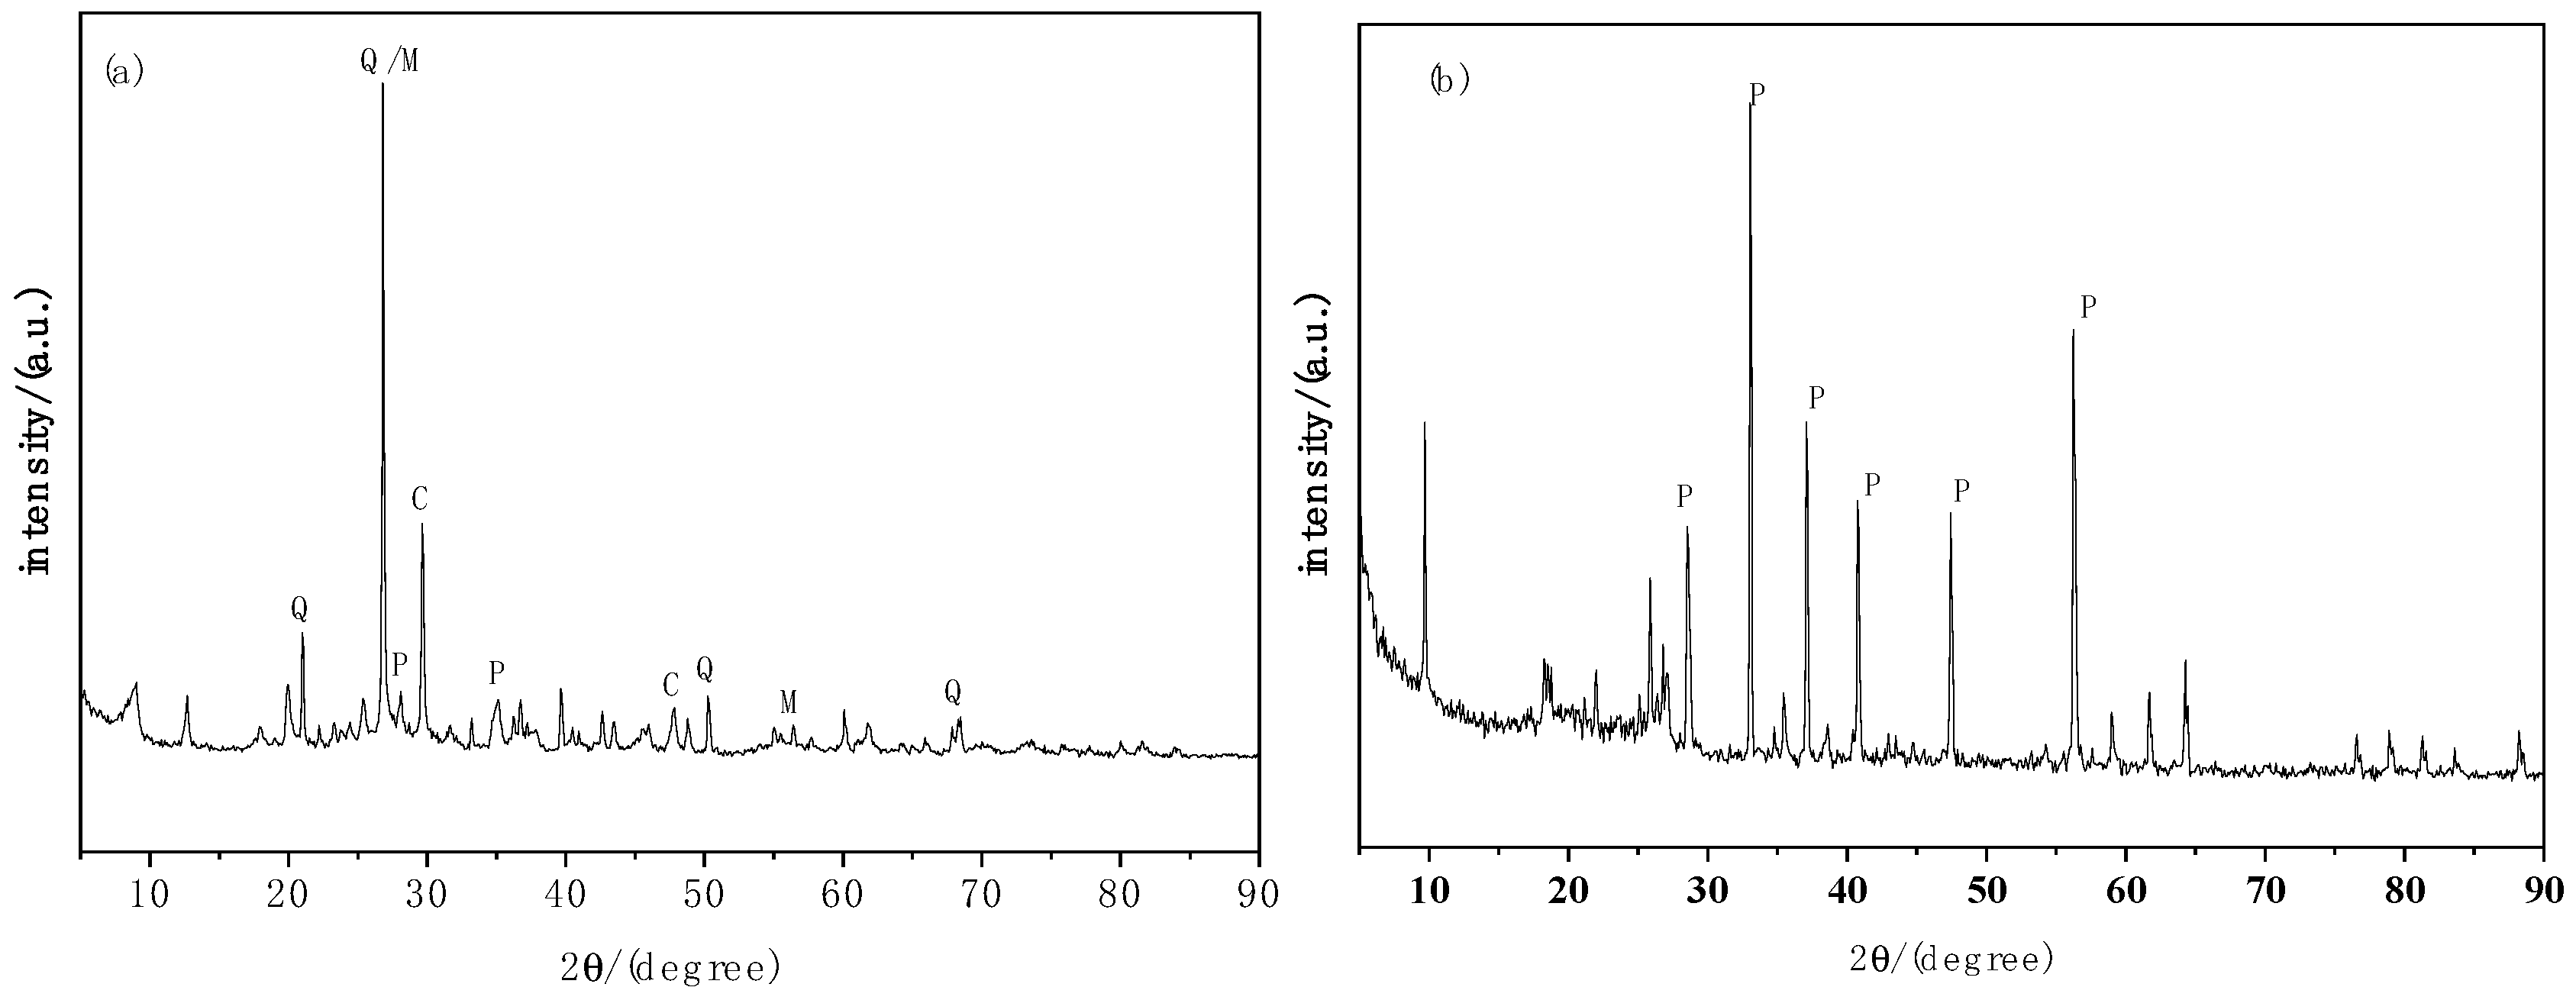
3.3.2. XRD Characterization

To reveal the changes in mineral composition and crystalline structure during the combustion process of oil shale, X-ray diffraction (XRD) analysis was performed on both raw oil shale and pyrolyzed semi-coke samples. The results are shown in Figure 7.
As shown in Figure 7, the XRD pattern of the oil shale sample (Figure 7a) indicates distinct characteristic peaks for quartz (Q) and dolomite (M), suggesting that these minerals are present in significant amounts. The strong peak intensity of calcite (C) indicates that it is a major carbonate mineral in the oil shale sample. The presence of characteristic peaks for pyrite (P) confirms that the sample contains a certain amount of sulfides. Multiple sharp diffraction peaks in the spectrum indicate that the minerals in the oil shale have good crystallinity. Organic matter does not show obvious features in the XRD pattern, as it is primarily amorphous.
The XRD pattern of the semi-coke sample (Figure 7b) shows that the quartz (Q) peaks remain present and their intensity significantly increases, indicating the relative enrichment of quartz during combustion. The intensity of the calcite (C) peaks decreases sharply, suggesting that the calcite decomposed at high temperatures, producing CO2 and leading to a reduction in content. The pyrite (P) peaks weaken, indicating that some sulfides may have decomposed or transformed. New characteristic peaks for potassium feldspar (K) appear in the semi-coke sample, likely due to mineral recrystallization during high-temperature reactions.

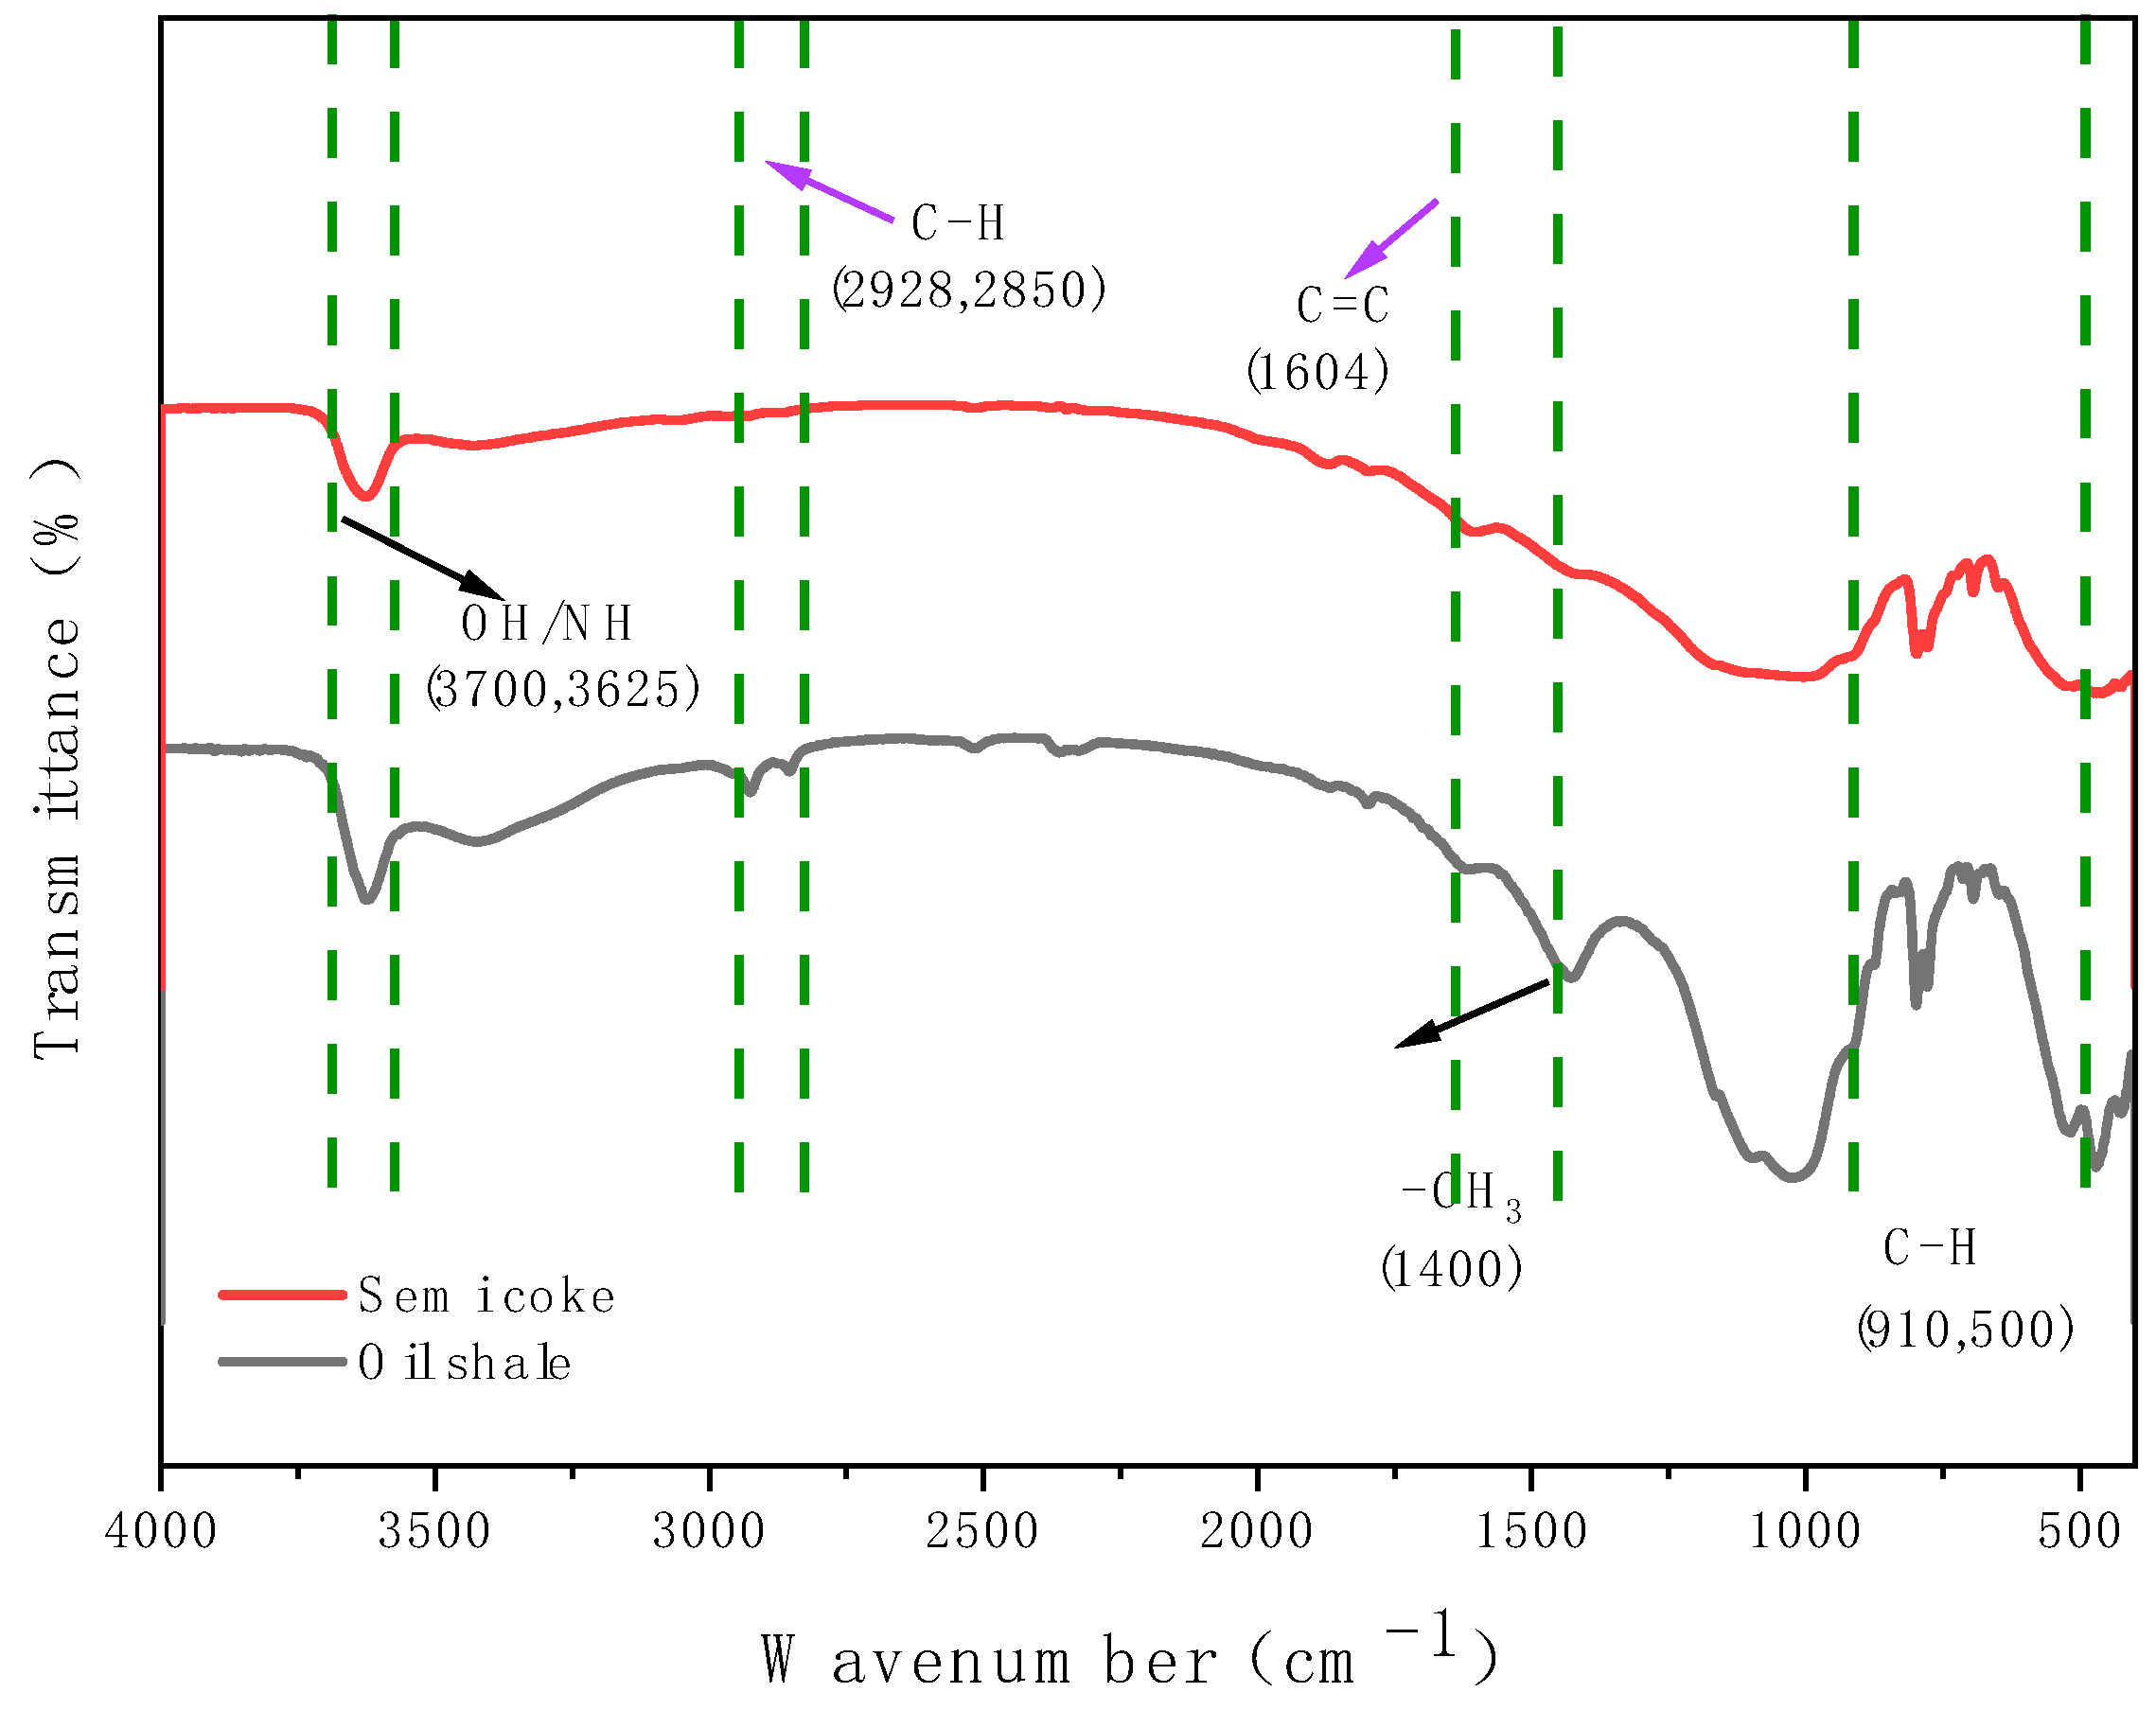
3.3.3. Infrared Spectroscopy (IR) Characterization

Figure 8 presents the infrared spectroscopy analysis of oil shale and combustion semi-coke. As shown in Figure 8, the wavenumber range of 3700–3625 cm−1 (OH/NH) corresponds to the stretching vibration peaks of hydrogen bonds (OH or NH), indicating the presence of moisture and amino or hydroxyl functional groups in the sample. The intensity of the stretching vibration peak in semi-coke is lower than that in oil shale, suggesting that some moisture and amino groups are removed during combustion. The absorption peaks at 2928 cm−1 and 2850 cm−1 (C-H) represent the typical stretching vibrations of C-H bonds, indicating the presence of hydrocarbons such as methane and alkanes. These peaks generally reflect the existence of hydrocarbon groups in organic matter. The absorption peak intensity in semi-coke is lower than that in oil shale, suggesting a reduction in alkanes due to hydrocarbon cracking or volatilization during combustion.
The 1604 cm−1 (C=C) peak represents the characteristic absorption of C=C double bonds, reflecting the presence of aromatic compounds or incompletely cracked organic matter in oil shale. This peak is still observed in semi-coke, indicating that aromatic compounds and unbroken organic structures remain in the semi-coke.
The 1400 cm−1 (C-H) absorption peak suggests the presence of certain alkyl substances in semi-coke, possibly low-molecular-weight organic compounds or incompletely cracked structures.
The absorption peaks at 910 cm−1 and 500 cm−1 (C-H) are related to C-H vibrations, typically indicating the presence of benzene rings or aliphatic hydrocarbons in organic matter. A comparison between oil shale and semi-coke highlights the differences in organic composition and chemical bond transformations. Oil shale contains more moisture and hydrocarbons, whereas semi-coke exhibits reduced moisture content and decreased volatile components. Hydrocarbons are significantly reduced, while aromatic compounds and other stable structures remain intact.
While this study provides a detailed understanding of the combustion behavior and kinetics of oil shale semi-coke, its practical relevance is of particular importance. In regions where oil shale is an abundant resource, such as in the Middle East, China, and the United States, oil shale semi-coke can be considered a potential alternative fuel for industrial applications, including power generation and cement production. By optimizing combustion processes and improving energy efficiency, oil shale semi-coke could help reduce the reliance on traditional fossil fuels and contribute to more sustainable energy solutions [28]. Future studies will need to explore the feasibility of using oil shale semi-coke in real-world combustion systems to assess its performance in industrial-scale applications.

4. Conclusions

This study systematically investigated the combustion characteristics and kinetics of oil shale semi-coke using thermogravimetric analysis combined with model-free and model-fitting approaches. The key findings are as follows:
(1) The combustion process of oil shale semi-coke occurs in three distinct stages, with the main combustion phase (310–670 °C) responsible for the majority of mass loss and energy release.
(2) The average activation energies obtained from model-free methods (OFW and KAS) are essentially similar and show high correlation (R2 > 0.996), confirming their reliability in describing the combustion kinetics.
(3) The F2–R3–F2 model is identified as the most appropriate mechanism through model-fitting analysis, effectively reflecting the multi-stage nature of the reaction and associated mineral transformations.
(4) SEM, XRD, and FTIR analyses confirm significant morphological and compositional changes before and after combustion, supporting the proposed reaction mechanisms.
These results provide a theoretical foundation for the clean and efficient utilization of oil shale semi-coke as an alternative fuel. Future work should focus on validating these findings under practical combustion conditions to better assess industrial applicability.

Author Contributions

Methodology, L.Z., T.W. and P.X.; Validation, S.L.; Investigation, M.W.; Data curation, J.Y.; Writing—original draft, F.Z. All authors have read and agreed to the published version of the manuscript.

Funding

This work was funded by the Heilongjiang Provincial Natural Science Foundation of Joint Guidance Project (Grant No. LH2022E022).

Data Availability Statement

The original contributions presented in this study are included in the article. Further inquiries can be directed to the corresponding author.

Conflicts of Interest

The authors declare no conflict of interest.

References

  1. Sun, B.Z.; Wang, Q.; Shen, P.Y.; Qin, H.; Li, S.H. Kinetic analysis of co-combustion of oil shale semi-coke with bituminous coal. Oil Shale 2012, 29, 63–75. [Google Scholar] [CrossRef]
  2. Wang, Q.; Wang, H.; Sun, B.; Bai, J.; Guan, X. Interactions between oil shale and its semi-coke during co-combustion. Fuel 2009, 88, 1520–1529. [Google Scholar] [CrossRef]
  3. Qin, H.; Yue, Y.; Zhang, L.; Liu, Y.; Chi, M.; Liu, H.; Wang, Q.; Liu, B. Study on co-combustion kinetics of oil shale sludge and semicoke. Energy Fuels 2016, 30, 2373–2384. [Google Scholar] [CrossRef]
  4. Wang, Q.; Sun, B.; Wu, X.; Bai, J.; Sun, J. Influence of retorting temperature on combustion characteristics and kinetic parameters of oil shale semicoke. Oil Shale 2006, 23, 328–339. [Google Scholar]
  5. Qin, H.; Wang, W.; Liu, H.; Zhang, L.; Wang, Q.; Shi, C.; Yao, K. Thermal behavior research for co-combustion of furfural residue and oil shale semi-coke. Appl. Therm. Eng. 2017, 120, 19–25. [Google Scholar] [CrossRef]
  6. Wang, P.; Wang, C.A.; Wang, C.; Du, Y.; Che, D. Experimental investigation on co-combustion characteristics of semi-coke and coal: Insight into synergy and blending method. Process Saf. Environ. Prot. 2023, 175, 290–302. [Google Scholar] [CrossRef]
  7. Pan, N.; Li, D.; Lü, W.; Dai, F. Kinetic study on the pyrolysis behavior of Jimsar oil shale. Oil Shale 2019, 36, 462–482. [Google Scholar] [CrossRef]
  8. Chi, M.; Xu, X.; Cui, D.; Zhang, H.; Wang, Q. A TG-FTIR investigation and kinetic analysis of oil shale kerogen pyrolysis using the distributed activation energy model. Oil Shale 2016, 33, 228–247. [Google Scholar] [CrossRef]
  9. Han, X.; Jiang, X.; Cui, Z. Thermal analysis studies on combustion mechanism of oil shale. J. Therm. Anal. Calorim. 2006, 84, 631–636. [Google Scholar] [CrossRef]
  10. Han, X.; Kulaots, I.; Jiang, X.; Suuberg, E.M. Review of oil shale semicoke and its combustion utilization. Fuel 2014, 126, 143–161. [Google Scholar] [CrossRef]
  11. Wang, Q.; Xu, H.; Liu, H.; Jia, C.; Bai, J. Thermogravimetric Analysis of the Combustion Characteristics of Oil Shale Semi-Coke/Biomass Blends. Oil Shale 2011, 28, 284–295. [Google Scholar]
  12. Huang, Y.; Zhang, M.; Miao, M.; Deng, B.; Cai, J.; Wu, Y.; Yang, H. Combustion kinetics study of oil shale semi-coke. CIESC J. 2019, 70, 3033. [Google Scholar]
  13. He, J.Y.; Zou, C.; Zhao, J.X.; Liang, D.; Xi, J.L.; Ma, C. Comparison of semi-coke with traditional pulverized coal injection and iron ore sintering fuels based on chemical structure and combustion behavior. J. Iron Steel Res. Int. 2022, 29, 725–740. [Google Scholar] [CrossRef]
  14. GB/T 19143-2017; National Technical Committee 355 on Petroleum and Natural Gas of Standardization Administration of China (SAC/TC 355). Analytical Methods for Carbon, Hydrogen, Oxygen, and Nitrogen in Rock Organic Matter. China Standards Press: Beijing, China, 2017.
  15. DZ/T 0346-2020; National Technical Committee 93 on Natural Resources and Territorial Spatial Planning of Standardization Administration of China (SAC/TC 93). Specifications for Mineral Geological Exploration of Oil Shale, Stone-Like Coal, and Peat. Geology Press: Beijing, China, 2020.
  16. Guo, Z.; Xu, X.; Zhu, D.; Pan, J.; Yang, C.; Li, S. Clean Preparation of Formed Coke from Semi-coke by the Carbonated Consolidation Process. ACS Omega 2023, 8, 27398–27409. [Google Scholar] [CrossRef] [PubMed]
  17. Bai, F.; Sun, Y.; Liu, Y. Thermogravimetric analysis of Huadian oil shale combustion at different oxygen concentrations. Energy Fuels 2016, 30, 4450–4456. [Google Scholar] [CrossRef]
  18. Ozawa, T. A new method of analyzing thermogravimetric data. Bull. Chem. Soc. Jpn. 1965, 38, 1881–1886. [Google Scholar] [CrossRef]
  19. Kissinger, H.E. Reaction kinetics in differential thermal analysis. Anal. Chem. 1957, 29, 1702–1706. [Google Scholar] [CrossRef]
  20. Coats, A.W.; Redfern, J.P. Kinetic parameters from thermogravimetric data. Nature 1964, 201, 68–69. [Google Scholar] [CrossRef]
  21. Torrente, M.C.; Galan, M.A. Kinetics of the thermal decomposition of oil shale from Puertollano (Spain). Fuel 2001, 80, 327–334. [Google Scholar] [CrossRef]
  22. Li, S.; Yue, C. Study of pyrolysis kinetics of oil shale. Fuel 2003, 82, 337–342. [Google Scholar] [CrossRef]
  23. Zanoni, M.A.B.; Massard, H.; Martins, M.F. Formulating and optimizing a combustion pathways for oil shale and its semi-coke. Combust. Flame 2012, 159, 3224–3234. [Google Scholar] [CrossRef]
  24. Yang, Y.; Lu, X.; Wang, Q. Investigation on the co-combustion of low calorific oil shale and its semi-coke by using thermogravimetric analysis. Energy Convers. Manag. 2017, 136, 99–107. [Google Scholar] [CrossRef]
  25. Yao, Z.; Ma, X.; Wang, Z.; Chen, L. Characteristics of co-combustion and kinetic study on hydrochar with oil shale: A thermogravimetric analysis. Appl. Therm. Eng. 2017, 110, 1420–1427. [Google Scholar] [CrossRef]
  26. Kok, M.V.; Bal, B.; Varfolomeev, M.A.; Nurgaliev, D.K. Thermal characteristics and model-free kinetics of oil shale samples. J. Therm. Anal. Calorim. 2023, 148, 8933–8943. [Google Scholar] [CrossRef]
  27. Bai, F.; Sun, Y.; Liu, Y.; Li, Q.; Guo, M. Thermal and kinetic characteristics of pyrolysis and combustion of three oil shales. Energy Convers. Manag. 2015, 97, 374–381. [Google Scholar] [CrossRef]
  28. Liu, H.P.; Liang, W.X.; Qin, H.; Wang, Q. Thermal behavior of co-combustion of oil shale semi-coke with torrefied cornstalk. Appl. Therm. Eng. 2016, 109, 413–422. [Google Scholar] [CrossRef]
Figure 1. Aluminum retort combustion experimental apparatus.
Applsci 15 05797 g001
Figure 2. TG and DTG curves of oil shale semi-coke.
Applsci 15 05797 g002
Figure 3. Schematic diagram for calculating combustion characteristic parameters of oil shale semi-coke.
Applsci 15 05797 g003
Figure 4. Model-free kinetic fitting curves for non-isothermal combustion.
Applsci 15 05797 g004
Figure 5. The Coats–Redfern linear regression analysis plot. (a) Heating rate of 5 °C/min; (b) heating rate of 10 °C/min; (c) heating rate of 15 °C/min; (d) heating rate of 20 °C/min; (e) heating rate of 25 °C/min.
Applsci 15 05797 g005aApplsci 15 05797 g005b
Figure 6. SEM images of oil shale semi-coke samples before and after combustion. (a) Oil shale before combustion; (b) oil shale semi-coke after combustion.
Applsci 15 05797 g006
Figure 7. XRD patterns of oil shale and semi-coke samples. Note: C—calcite, M—dolomite, P—pyrite, Q—quartz. (a) XRD pattern of oil shale sample; (b) XRD pattern of semi-coke sample.
Applsci 15 05797 g007
Figure 8. Infrared analysis of oil shale and combustion semi-coke.
Applsci 15 05797 g008
Table 1. Elemental composition and proximate analytics of oil shale samples.
Elemental Analysis (wt%)Proximate Analytics (wt%)
C13.44Moisture content3.8
H0.46Volatile matter28.4
N0.38Ash content64.2
S0.58Fixed carbon3.6
Table 2. Elemental composition and heating value analysis of shale semi-coke.
Elemental Composition and Content
Elemental Analysis (wt%)C2.23
H0.16
N0.14
S0.08
Heating Value Analysis (MJ/kg)Dry distillation temperature at 500 °C
HHV8.0
Table 3. Typical kinetic mechanism function.
FunctionMechanismDifferential Form f(α)Integral Form G(α)
Reaction Order Models
First-orderF1(1 − α)−ln(1 − α)
Second-orderChemical reaction
(F2)
(1 − α)2(1 − α)−1 − 1
Diffusion Models
Jander equation2D, n = 0.54(1 − α)1/2[1 − (1 − α)1/2]1/2[1 − (1 − α)1/2]1/2
Jander equation3D, n = 0.56(1 − α)2/3[1 − (1 − α)1/3]1/2[1 − (1 − α)1/3]1/2
G-B equation3D, D4
(column symmetry)
3/2[(1 − α)−1/3 − 1] − 11 − 2/3α − (1 − α)2/3
Geometrical Contraction Models
Contracting areaR2, n = 2(1 − α)1/22[1 − (1 − α)1/2]
Contracting volumeR3, n = 3(1 − α)2/33[1 − (1 − α)1/3]
Nucleation Models
Avrami−ErofeevRandom nucleation and nuclei growth
A2, 2D, n = 2
1/2(1 − α)[−ln(1 − α)]−1[−ln(1 − α)]2
Avrami−ErofeevRandom nucleation and nuclei growth
A3, 3D, n = 3
1/3(1 − α)[−ln(1 − α)]−2[−ln(1 − α)]3
Mample powern = 1/44α3/4α1/4
Mample powern = 1/3 3α2/3α1/3
Mample powern = 1/2 2α1/2α1/2
Mample powern = 21/2α−1α2
Table 4. Combustion characteristics parameters of semi-coke under different heating rates.
Heating Rate/°C/minTi/°CTp/°CTf/°CΔm/%
5427.94490.83546.534.29
10453.42510.80564.525.18
15461.19533.64584.395.54
20465.38543.61589.625.82
25475.56549.78599.806.22
Table 5. Kinetic parameters calculated by the OFW method and KAS method at different conversion levels.
αEα, kJ/molA (1/s)Eα,avg, kJ/molAavgRavg2
OFW0.1145.586.27 × 106180.801.04 × 1090.998
0.2194.418.95 × 109
0.3161.963.72 × 107
0.4132.612.07 × 105
0.5183.262.57 × 107
0.6205.111.57 × 108
0.7201.737.67 × 107
0.8200.396.01 × 107
0.9202.207.93 × 107
KAS0.1145.265.1 × 106180.811.07 × 1090.997
0.2194.319.27 × 109
0.3161.823.35 × 107
0.4132.531.41 × 105
0.5183.022.23 × 107
0.6204.931.46 × 108
0.7201.546.93 × 107
0.8200.195.36 × 107
0.9201.997.06 × 107
Table 6. Calculated kinetic parameters for each mode.
F2-F2-F2F2-F2
stage IStage IIStage IIstage IStage II
Eα/KJ·mol−1180.130249.799263.730170.646277.451
A/S−13.93 × 1094.58 × 10101.35 × 10118.04 × 1084.73 × 1011
Contribution0.3950.2780.3550.4310.596
Eα,avg/KJ·mol−1231.22224.05
R20.980.97
f(α)(1 − α)2(1 − α)2(1 − α)2(1 − α)2(1 − α)2
F2-D4-F2F2-D4
stage IStage IIStage IIstage IStage II
Eα/KJ·mol−194.34050.227265.53661.98221.187
A/S−13.08 × 1032.195.83 × 10106.122.26 × 10−2
Contribution0.4310.1570.4430.5420.410
Eα,avg/KJ·mol−1136.7041.58
R20.940.82
f(α)(1 − α)23/2[(1 − α)−1/3 − 1]−1(1 − α)2(1 − α)23/2[(1 − α)−1/3 − 1] − 1
F2-R3-F2A2-F2
stage IStage IIStage IIIstage IStage II
Eα/KJ·mol−1131.344102.546203.089114.196221.454
A/S−12.21 × 1069.08 × 1032.95 × 1071.17 × 1057.11 × 108
Contribution0.2480.1870.5830.3860.649
Eα,avg/KJ·mol−1145.66167.83
R20.970.95
f(α)(1 − α)2(1 − α)2/3(1 − α)21/2(1 − α)[−ln(1 − α)]−1(1 − α)2
Disclaimer/Publisher’s Note: The statements, opinions and data contained in all publications are solely those of the individual author(s) and contributor(s) and not of MDPI and/or the editor(s). MDPI and/or the editor(s) disclaim responsibility for any injury to people or property resulting from any ideas, methods, instructions or products referred to in the content.

