Abstract
Marine transportation of liquefied carbon dioxide (LCO2) is crucial for Carbon Capture, Transportation, Utilization, and Storage (CCTUS) technology, aiding in CO2 emission reduction and greenhouse effect control. This study investigates the thermodynamic and fluid dynamic characteristics of LCO2 in Type C storage tanks using numerical simulations, focusing on heat transfer, flow phenomena, and boil-off gas (BOG) generation under varying storage pressures. Results show that heated liquid rises along the tank wall, forming vortices, while gas-phase vortices are driven by central upward airflow. Over time, liquid velocity near the wall increases, enhancing flow field mixing. Gas-phase temperatures rise significantly, while liquid-phase temperature gradients remain minimal. Higher storage pressures reduce fluid velocity, vortex range, and thermal response speed. BOG generation is higher at low pressures and decreases as pressure rises, slowing beyond 1.5 MPa. Under sloshing conditions, interfacial fluctuations enhance heat and mass transfer, reducing thermal stratification. Resonance periods amplify interfacial disturbances, improving thermal mixing and minimizing temperature gradients (ΔT ≈ 0.1 K). Higher filling rates suppress surface rupture, while lower rates exhibit gas-dominated instabilities and larger thermal gradients (ΔT ≈ 0.3 K).
1. Introduction
Carbon dioxide (CO2) is a primary anthropogenic greenhouse gas contributing to the global climate. The International Energy Agency (IEA) indicates that limiting global warming to 1.5 °C above pre-industrial levels necessitates achieving net-zero global CO2 emissions by approximately 2050 [1]. This aligns with the goals outlined in the Paris Agreement [2]. Carbon Capture, Transportation, Utilization, and Storage (CCTUS) technologies are therefore widely recognized as essential tools for achieving deep decarbonization. Among these technologies, maritime transport of liquefied CO2 (LCO2) presents a particularly promising solution when pipeline infrastructure is unavailable or impractical, especially for intercontinental shipping and offshore storage applications.
Cryogenic transport of LCO2 typically involves one of three types of tanks: fully pressurized, semi-refrigerated, or fully refrigerated. Semi-refrigerated C-type tanks are considered a well-balanced option due to their compatibility with the thermodynamic characteristics of CO2 and their operational feasibility in marine environments [3]. However, during transport, external heat ingress and ship-induced motion may cause liquid sloshing and phase change, leading to the formation of boil-off gas (BOG). The generation of BOG not only increases tank pressure but also poses operational safety risks and raises the energy demand for re-liquefaction systems [4]. While BOG-related phenomena have been extensively studied in the context of liquefied natural gas (LNG) and liquid hydrogen, reliable CO2-specific models remain scarce.
Several numerical and experimental studies have explored self-pressurization, heat transfer, and evaporation dynamics in cryogenic tanks. For example, Huerta [5] and Qu [6] investigated LNG evaporation behavior in large-scale storage tanks, emphasizing the roles of gas–liquid interface dynamics and thermal stratification. Zuo et al. [7,8] developed visualization and transient simulation systems for low-temperature fluids such as liquid oxygen, offering insights into pressurization over time. Wang et al. [9] proposed a one-dimensional model incorporating vapor temperature gradients to enhance tank pressurization predictions. However, these models were largely designed for LNG or oxygen systems with distinct thermophysical properties, limiting their direct applicability to LCO2, particularly under dynamic marine transport conditions.
Recent studies on CO2 transportation have primarily focused on system-level aspects rather than internal tank behavior. Sani et al. [10] developed a thermal model for insulated CO2 truck tanks. Bartosz Dziejarski et al. [11] evaluate technological readiness (TRL) and emphasize the influence of CO₂ source and separation methods, while Hope McLaughlin et al. [12] examine CCUS’s socio-technical role in industrial decarbonization, including policy gaps. Ma et al. [13,14] and Xing et al. [15] addressed ship design and hydrodynamics for offshore CO2 shuttle vessels. These works provide useful engineering context but lack detailed analysis of internal heat and mass transfer mechanisms. Roussanaly et al. [16] and Vermeulen [17] performed economic assessments across different pressure conditions, but their models were based on steady-state assumptions and omitted transient thermophysical dynamics. Lee et al. [18] and Drescher et al. [19] provided valuable experimental data on energy consumption and depressurization safety, yet did not quantify the time-resolved evolution of internal flow and thermal fields. As a result, most existing BOG models rely heavily on analogies with LNG, often overlooking CO2’s narrower liquid-phase window, stronger thermal sensitivity, and unique solidification risks near the triple point. Moreover, simplified interface treatments and steady-state assumptions reduce model accuracy, particularly under realistic marine operating conditions.
To address these gaps, this study develops a 2D transient numerical model that dynamically resolves natural convection, heat leakage, and interface evolution. The model enables accurate simulation of BOG formation under varying fill levels. Through this approach, we aim to provide theoretical support for optimizing tank design and improving BOG mitigation strategies in LCO2 maritime transport.
The remainder of this paper is organized as follows: Section 2 introduces the physical model, governing equations, boundary conditions, the numerical methods, and validation approach. Section 3 presents and analyzes the simulation results. Finally, Section 4 summarizes the key findings and offers recommendations for future research.
2. Materials and Methods
2.1. Physical Model
A certain type of 3500 m3 carbon dioxide storage tank was selected, as shown in Figure 1. The tank consists of two end heads and a cylinder. The length of the tank is 29.14 m, and the spherical head diameter is 11.4 m.

Figure 1.
The model of the CO2 cargo tank and the diagram of the tank.
2.2. Governing Equations
The governing equations are solved using the finite volume method within ANSYS Fluent 2024 R2. The volume of fluid (VOF) model is coupled with the energy equation and the Lee model to simulate interfacial evaporation-condensation. The pressure-based solver is employed with the PISO algorithm for transient simulations.
The volume of fluid (VOF) model is applicable to the case where the sum of the volume fractions of all components is one in each computational cell. By defining the volume fraction of each phase, the movement of each phase can be tracked, and the interface between each phase can be determined; the VOF method is widely used to model two or more immiscible phases. It is also the preferred method in the literature for tracking the vapor–liquid interface.
Continuity equation:
where is the fluid density, is the volume fraction of the phase that satisfies , and the subscript and are the vapor and liquid, respectively. is the velocity vector. is the source term of mass transfer between vapor and liquid phases.
Momentum equation:
is calculated by the continuum surface force (CSF) model:
where the surface tension coefficient is represented by the letter , and the surface curvature is represented by the letters and , respectively. is the volume force because of sloshing.
Energy equation:
and are the internal energy and temperature, respectively.
is the thermal conductivity; is the energy source term.
2.3. Phase Change Model
The Lee model is employed to account for evaporation-condensation. Evaporation occurs when the temperature of the liquid exceeds the boiling/saturation temperature at a given pressure. Condensation is the reverse process of evaporation, where the vapor converts back into liquid by virtue of heat removal. Thus, condensation takes place when the vapor temperature drops below the saturation temperature. The mass transfer from liquid to vapor and vapor to liquid during evaporation and condensation, respectively, is described by the following Lee model:
where is the saturation temperature corresponding to pressure, and is the adjustable mass transfer factor.
The mass transfer coefficient in the Lee phase-change model (unit: s−1) governs the rate of phase transition across the vapor–liquid interface. Reported values of in the literature vary widely, typically ranging from 0.01 to 10, depending on the specific application and flow conditions [20,21]. Saleem et al. [22] investigated this parameter in the context of full-scale LNG storage tank simulations and found that varying had negligible influence on the computed evaporation rate. Based on these findings and consistent with established practice in related studies, a value of = 0.1 is adopted in the present work. This choice effectively maintains the interface temperature near saturation while ensuring numerical stability.
The source term of the energy equation is identified as follows, based on the latent heat that is either released or absorbed at the phase transition:
2.4. Boundary Conditions
In this study, CO2 is selected as the working fluid. Its temperature-dependent thermophysical properties, such as density, specific heat capacity, viscosity, thermal conductivity, and latent heat of vaporization, are obtained from the NIST database and imported into ANSYS Fluent through a user-defined material file. A summary of key values used is provided in Table 1. These parameters are critical for accurately capturing phase-change behavior under varying temperature and pressure conditions.

Table 1.
The thermophysical properties of CO2.
The selected operating pressure range (0.6–4.0 MPa) encompasses typical industrial values (1.0–2.0 MPa) for LCO2 shipping as recommended by demonstrated in CCS projects such as Northern Lights. By including both lower and higher pressures beyond this typical window, the simulations account for possible off-design and safety-critical conditions. The corresponding temperature range covers the CO2 saturation points under each pressure and enables full analysis of phase-change behavior. These choices ensure that the numerical results are applicable to both design and operational assessments.
In the static simulations, all tank walls are modeled as stationary, no-slip, adiabatic boundaries. A constant heat flux of 14 W/m2 is applied to the bottom wall to simulate thermal ingress from the external environment, driving vaporization of the liquid CO2.
For sloshing simulations, the tank motion is modeled using dynamic mesh techniques. Specifically, a sinusoidal angular displacement is imposed at the tank walls using a user-defined function (UDF) in the following form:
where is the maximum angular amplitude, and is the oscillation period. This single-frequency approach is widely used as a first-order approximation to study fluid–structure interactions in marine environments. While real sea conditions exhibit complex, multi-frequency wave motions, the use of a controlled sinusoidal input facilitates clearer attribution of observed effects to sloshing and simplifies parametric sensitivity analysis. Future studies will incorporate irregular wave spectra to improve realism.
The initial temperature of the liquid CO2 is set to 253.7 K, and the initial pressure corresponds to saturation conditions (e.g., 2.0 MPa). The vapor phase occupies approximately 20% of the tank volume, representing a realistic boil-off gas (BOG) scenario.
The gravity direction is defined in the vertical direction (negative y-axis), with an acceleration of 9.81 m/s2. The vapor–liquid interface is initially flat and determined by volume fraction initialization in Fluent. No inlet or outlet boundaries are used, as the tank is considered completely enclosed.
2.5. Numerical Implementation
The ICEM method is used to implement geometry models and generate a computational mesh. A two-dimensional mesh is adopted for solving the governing equations, and the simulations are performed using the ANSYS Fluent double precision solver. Other solvers supporting the VOF method may also be applicable. A second-order upwind scheme is employed for the discretization of the convective terms.
To capture the turbulent mixing induced by vapor–liquid phase change, natural convection, and wall shear effects, the Shear Stress Transport (SST) k–ω turbulence model is selected. This model combines the near-wall accuracy of the standard k–ω formulation with the robustness of the k–ε model in the free-stream region, making it particularly suitable for buoyancy-driven and phase-change-dominated flows. Its ability to resolve flow separation, interface deformation, and recirculation zones ensures a more accurate prediction of mixing behavior and heat/mass transport inside the tank. The second-order upwind scheme is also used to discretize the turbulent kinetic energy and the specific dissipation rate equations.
The pressure–velocity coupling is handled using the Pressure Implicit with Splitting of Operators (PISO) algorithm. The volume fraction equation is solved using the compressive scheme to preserve sharp interfaces. A time step of 0.001 s is used in combination with an implicit first-order time discretization scheme for transient simulation. Convergence is monitored via residuals, and all governing equations are considered to have converged when residuals fall below 10−6.
2.6. Grid Verification
To assess the impact of grid density on simulation results, this study employed four grids of varying densities. The corresponding numbers of grid cells are 32,244, 37,220, 46,447, and 53,132. Among the three grids, the rates of BOG production and temperature distribution differences were compared. Considering factors such as simulation accuracy and computational time, it is appropriate to select the grid with 37,220 cells for numerical computation.
To evaluate the impact of mesh resolution on the simulation accuracy, four different structured meshes were generated using ANSYS ICEM 2024 R2, with total cell counts of 32,244, 37,220, 46,447, and 53,132, respectively. Special attention was given to mesh refinement near the vapor–liquid interface and wall boundaries to better resolve thermal gradients and interface dynamics. The mesh quality was ensured by maintaining an orthogonal quality above 0.99.
A mesh independence study was performed by monitoring the boil-off gas (BOG) mass generated under identical boundary conditions. The results, presented in Table 2, indicate that the BOG mass converges when the number of cells exceeds approximately 37,000. The difference in predicted BOG mass between the finest grid and the 37,220-cell grid is less than 1.5%, indicating sufficient numerical accuracy. Hence, the mesh with 37,220 cells was adopted for subsequent simulations to balance computational cost and accuracy.

Table 2.
Grid independence study results.
These results demonstrate that the simulated BOG mass is insensitive to further mesh refinement beyond 37,220 cells, confirming mesh convergence.
Model validation was performed by replicating the experimental setup of Grotle and Æsøy [23], who investigated water sloshing in a cylindrical tank of 0.89 m length and 0.35 m diameter. Two validation cases were considered: Case #1 with f = 0.40 Hz (T = 2.5 s) and Case #2 with f = 0.59 Hz (T = 1.7 s), both using an angular amplitude of 3°. Simulation results showed excellent agreement with experimental interface shapes.
A detailed comparison of the phase distribution between simulations and experiments is shown in Figure 2. The numerical results exhibit excellent agreement with experimental snapshots, particularly in capturing the interface shape evolution under sloshing conditions. For all tested cases, the simulated interface morphology aligns closely with the experimental observations, demonstrating the model’s capability to resolve complex free-surface dynamics.

Figure 2.
Comparison of interface shape between experimental results [20] and simulation results.
Further validation is performed by comparing the predicted pressure and temperature variations against experimental data, as illustrated in Figure 3. The numerical results accurately reproduce the temporal trends of both parameters, with deviations remaining below 5.0%. The consistent overlap confirms the model’s robustness in predicting thermodynamic and hydrodynamic coupling effects.
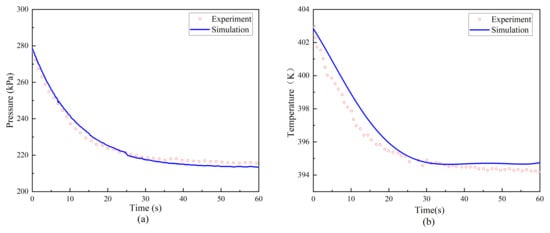
Figure 3.
Comparison of simulation results with experimental data: pressure (a) and temperature (b).
3. Results and Discussion
3.1. Analysis of Thermodynamic Flow Characteristics
Figure 4 illustrates the velocity vector diagrams at four distinct time points under a pressure of 0.6 MPa. It can be observed that the heated fluid near the wall ascends due to natural convection caused by density reduction, while the colder fluid at the center descends under the driving force, forming a distinct vortex region. The flow pattern of the gas-phase vortex is notably different, primarily characterized by an upward airflow from the center, which is likely attributed to the greater driving force induced by liquid-phase evaporation compared to that generated by thermal effects. Furthermore, as time progresses, the velocity of the fluid near the wall gradually increases, promoting a more uniform motion throughout the fluid domain.

Figure 4.
The velocity vector diagrams at 0.6 MPa.
In terms of spatial distribution, the region near the wall exhibits an upward flow, whereas the central region demonstrates a descending trend. The highest fluid velocity is observed near the gas–liquid interface. Over time, both the fluid velocity and its maximum value progressively increase, leading to a more homogenized flow pattern.
Figure 5 illustrates the temperature distribution at different time points under a pressure of 0.6 MPa. In the vapor phase, a notable and continuous temperature rise is observed. Numerical results indicate that the vapor temperature increases from 220.03 K at 0 s to 223.45 K at 300 s, yielding a total increment of approximately ΔT = 3.42 K. This temperature rise originates near the heated wall and gradually propagates toward the vapor core, forming clear thermal stratification.

Figure 5.
The temperature corresponding to 0.6 MPa.
In contrast, the temperature in the liquid phase remains nearly constant, with a total increase of less than 0.03 K throughout the same duration. This negligible change is due to the higher thermal conductivity and specific heat of the liquid phase, as well as the latent heat absorption during phase change, which inhibits sensible heating.
In summary, due to the absence of an absolute insulation structure, heat leakage is inevitable. The fluid near the wall absorbs heat, leading to density variations and the formation of natural convection, which drives the entire fluid domain into relative motion. As illustrated in Figure 4, a distinct vortex is observed in the liquid phase, where the flow phenomenon is more pronounced due to the thermophysical property differences between the liquid and gas phases. However, as shown in Figure 5, the temperature rise in the liquid phase is not significant, primarily because the absorbed heat is initially converted into latent heat, and the higher specific heat capacity of the liquid phase further mitigates temperature changes. In contrast, the gas phase exhibits a more noticeable temperature gradient, reaching up to 3.5 K, owing to its lower specific heat capacity and thermal conductivity.
3.2. Flow Characteristics Under Different Storage Pressures
3.2.1. Flow Analysis
This section comprehensively analyzes the heat transfer and flow characteristics within the storage tank under varying storage pressures. Figure 6 presents the velocity vector diagrams at 0.6 MPa, 0.7 MPa, 1 MPa, 2 MPa, and 4 MPa. The results reveal that as the pressure increases, the maximum fluid flow velocity gradually decreases, the extent of natural convection-induced vortices diminishes, and the rate of fluid velocity increment over time slows down. From the velocity contour maps, it is evident that fluid motion initially generates velocity in the outer regions, which subsequently drives the acceleration of the inner fluid.
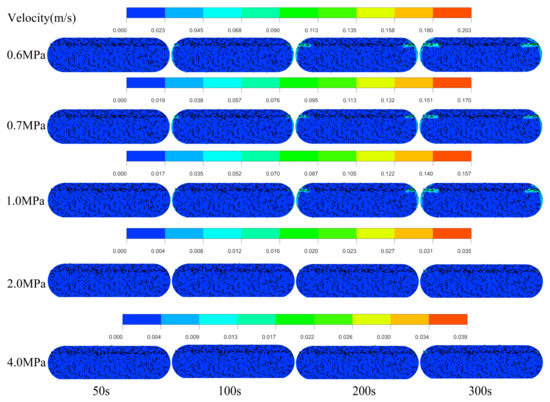
Figure 6.
The velocity vector diagrams at 0.6 MPa, 0.7 MPa, 1 MPa, 2 MPa, and 4 MPa.
To provide a quantitative basis for the observed flow behavior, the peak fluid flow velocity within the storage tank at a representative time point was extracted for each pressure condition. As shown in Table 3, the peak velocity demonstrates a clear decreasing trend with increasing storage pressure. Specifically, the peak velocity is 0.203 m/s at 0.6 MPa, decreasing to 0.170 m/s at 0.7 MPa, 0.157 m/s at 1.0 MPa, 0.035 m/s at 2.0 MPa, and further to 0.039 m/s at 4.0 MPa. This quantitative data indicates a substantial suppression of the maximum fluid speed as the storage pressure increases.

Table 3.
Peak fluid velocity at different pressures.
Although the kinematic viscosity of both the saturated liquid and vapor CO2 decreases with increasing pressure (as shown in Figure 7), this trend does not lead to increased fluid velocity. This is because natural convection in the tank is primarily governed by thermal gradients and buoyancy forces rather than viscosity alone. At higher pressures, the thermal driving force weakens due to reduced temperature gradients and decreased thermal expansion coefficients, which leads to less vigorous convection, even though the fluid becomes more mobile in terms of viscosity. Thus, the reduction in fluid motion is more directly attributable to diminished thermal driving forces rather than changes in viscosity alone.
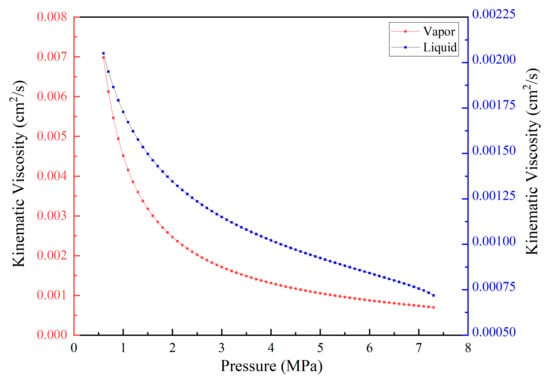
Figure 7.
The curve of CO2 kinematic viscosity variation with pressure.
3.2.2. Heat Transfer Analysis
Figure 8 illustrates the temperature distribution at 0.6 MPa, 0.7 MPa, 1 MPa, 2 MPa, and 4 MPa. Figure 9 shows the temperature variation curves of the vapor and liquid phases over time under different pressures, along with temperature cloud plots at 50 s, 100 s, 200 s, and 300 s. The curves clearly illustrate the distinct thermal responses of the two phases under varying pressures. Quantitatively, the peak temperature difference (ΔT) in the vapor phase after 300 s is significant at lower pressures (e.g., 3.42 K at 0.6 MPa) but diminishes considerably at higher pressures (e.g., 0.27 K at 4.0 MPa, as shown in Table 4). In contrast, the liquid phase exhibits minimal temperature changes, with peak ΔT values remaining close to zero across all pressures (ranging from 0.03 K to 0.04 K). These quantitative metrics confirm that the efficiency of heat transfer, which primarily occurs in the gas phase, is significantly dependent on the storage pressure.
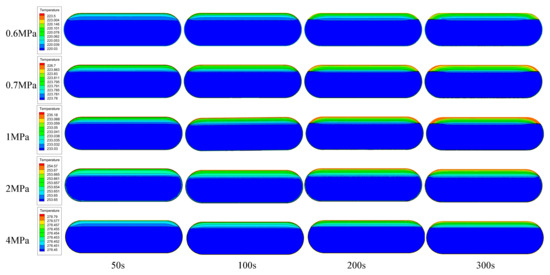
Figure 8.
The temperature cloud diagrams at 0.6 MPa, 0.7 MPa, 1 MPa,2 MPa, and 4 MPa.
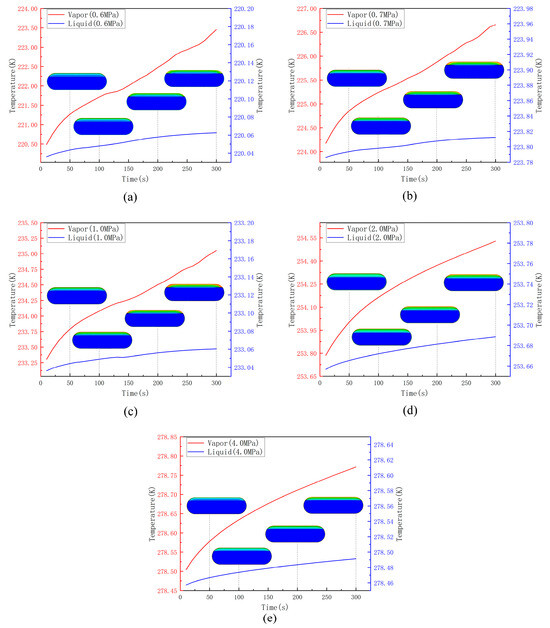
Figure 9.
Temperature curves over time under different pressures. (a) 0.6 MPa, (b) 0.7 MPa, (c) 1 MPa, (d) 2 MPa, (e) 4 MPa.

Table 4.
Peak temperature difference (ΔT) after 300 s.
Comparative analysis reveals that the temperature diffusion range under 4 MPa is significantly smaller than that under 0.6 MPa. This phenomenon can be attributed to the increase in the specific heat capacity of the fluid with rising pressure, enabling it to absorb more heat and resulting in weaker temperature transfer. Additionally, as shown in Figure 10, which depicts the variation of CO2 Prandtl number and thermal diffusivity with pressure, the gas phase exhibits a larger thermal diffusion coefficient and a smaller Prandtl number compared to the liquid phase, leading to a faster thermal response speed. However, as the pressure increases, the thermal diffusion coefficient of the gas phase decreases, and the Prandtl number increases, causing the thermal response speed to slow down relative to low-pressure conditions. Consequently, higher pressures result in a smaller temperature rise range and a more limited temperature distribution.

Figure 10.
The curves of CO2 Prandtl number (a) and thermal diffusivity (b) variation with pressure.
In summary, the analysis of flow and heat transfer characteristics under varying storage pressures reveals distinct behaviors in the liquid and gas phases of carbon dioxide. The liquid phase consistently exhibits higher flow velocities compared to the gas phase, yet its thermal response speed is significantly slower. In contrast, the gas phase demonstrates a more pronounced thermal stratification, with faster temperature propagation. As the storage pressure increases, the flow and heat transfer performance of liquid carbon dioxide gradually declines, manifested by reduced flow velocities and a smaller range of vortex formation. Similarly, in the gas phase, the heat transfer rate diminishes, resulting in a smaller temperature gradient. These trends are attributed to the combined effects of increasing specific heat capacity, decreasing thermal diffusivity, and rising Prandtl number with pressure, as illustrated in Figure 10.
3.2.3. Analysis of BOG Generation
Figure 11 illustrates the variation in the amount of boil-off gas (BOG) generated under different storage pressures. It is evident that under low-pressure conditions, the amount of BOG generated is relatively high, whereas under high-pressure conditions, the amount is significantly reduced. As the storage pressure increases, the amount of BOG generated gradually decreases, and the rate of BOG generation slows down noticeably beyond 1.5 MPa. This trend is closely related to the thermophysical properties of liquid carbon dioxide at different states. With increasing storage pressure, the boiling point of the fluid rises, requiring more heat for evaporation, which consequently reduces the amount of BOG generated. Additionally, as the pressure increases, both the flow and heat transfer performance of the fluid decline, resulting in poorer heat transfer efficiency and a corresponding reduction in BOG generation.

Figure 11.
The difference in BOG generated under different storage pressures.
In practical terms, low-pressure storage conditions are easier to achieve; however, they impose higher demands on BOG risk management due to the increased generation of BOG. Conversely, high-pressure storage conditions generate less BOG but require more stringent equipment specifications to withstand the elevated pressures.
3.3. Analysis of Evaporation Characteristics at Different Filling Ratios
This section analyzes the differences in temperature and velocity fields at different filling ratios, studying the fluid dynamics, thermodynamics, and BOG generation characteristics of the fluid inside the tank at filling rates of 50%, 60%, 70%, 80%, and 90%.
Figure 12 presents the temporal evolution of the velocity distribution within the tank at a filling rate of 50%. Consistent with prior observations, a velocity gradient initially develops near the wall surface. The heated fluid undergoes a reduction in density, inducing natural convection that drives the fluid upward toward the free surface and subsequently inward toward the central region of the tank. This flow behavior results in the formation of vortices at both ends of the tank. Under the influence of these vortices, multiple vortex pairs are generated within the tank. The maximum velocity is observed at the interface where the liquid phase ascends and the gas phase descends, with the peak fluid velocity reaching 0.03 m/s.

Figure 12.
The velocity distribution of a 50% filling rate.
Figure 13 illustrates the variation of temperature distribution within the tank at a 50% filling rate. Over the studied time range, the temperature rise is predominantly observed in the gas phase. This phenomenon can be attributed to two factors: First, the gas phase exhibits a significantly lower specific heat capacity compared to the liquid phase, resulting in a more rapid temperature increase under identical heat input and consequently a steeper temperature gradient. Second, at this moderate filling level, the gas phase occupies a larger volume within the tank, enabling more extensive thermal diffusion throughout the vapor region when contrasted with higher filling rates.

Figure 13.
The temperature distribution of a 50% filling rate.
Figure 14 demonstrates the variations in velocity distribution under different filling rates. It is evident that the overall velocity within the fluid domain exhibits a decreasing trend as the filling rate increases. Specifically, at a 50% filling rate, the region where the velocity gradient forms at the liquid surface is more extensive compared to cases with higher filling rates. This behavior can be attributed to the greater degree of freedom of movement for both the gas and liquid phases at lower filling rates, facilitating their motion under the influence of wall-induced vortices. Conversely, at higher filling rates, the available space for the gas phase is reduced, limiting its freedom of movement, while the increased mass of the liquid phase results in slower fluid motion.
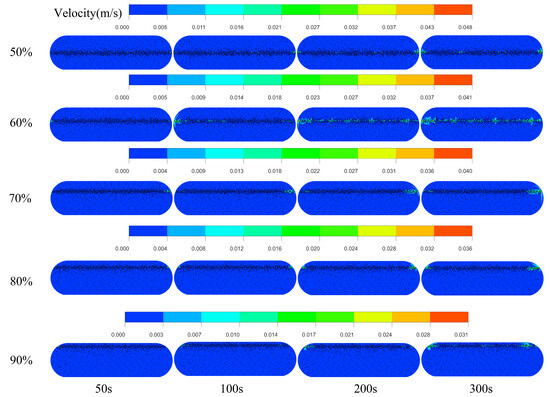
Figure 14.
The differences in velocity distribution under various filling rates.
Figure 15 and Figure 16 present the temperature characteristics under different filling rates, with Figure 15 showing the spatial distribution and Figure 16 displaying the temporal evolution of gas and liquid phase temperatures. In the gas phase, lower filling rates (e.g., 50%) result in broader temperature distributions and higher peak temperatures, while higher filling rates (e.g., 90%) lead to more localized distributions. The liquid phase maintains near-uniform temperature distributions across all conditions, except at 70% filling rate, where temperatures are slightly lower. These observations are primarily attributed to (1) increased gas-phase interfacial area at lower filling rates, which enhances environmental heat influx into the system, and (2) reduced gas–liquid interfacial heat transfer at lower filling rates, causing greater heat retention and consequently higher gas-phase temperatures.
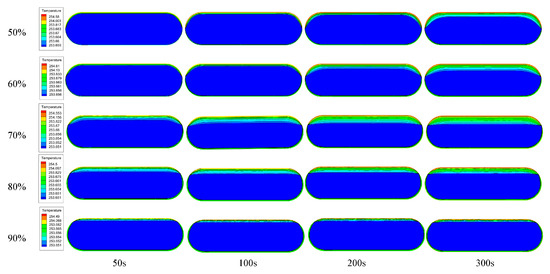
Figure 15.
The differences in temperature distribution under various filling rates.
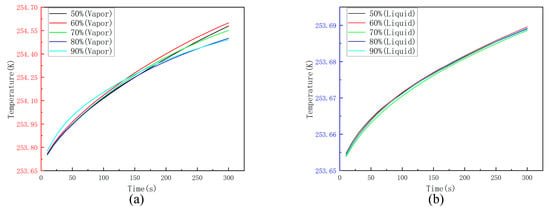
Figure 16.
The temperature evolution curves of the vapor (a) and liquid (b) phases.
Figure 17 illustrates the temporal evolution of the boil-off gas (BOG) generated under different filling rates. While these curves provide a visual comparison, a quantitative analysis of the average BOG generation rate offers further insight. The average BOG generation rate over the 300-s simulation was calculated for each filling ratio and is presented in Table 5. As the filling ratio increases, the average BOG generation rate shows a clear upward trend, increasing from approximately 0.0000865 kg/s at 50% filling to 0.0003001 kg/s at 95% filling. This quantitative analysis confirms the accelerated BOG production at elevated filling rates observed in Figure 17. This trend can be attributed to several factors: first, at higher filling rates, the contact area between the liquid phase and the tank wall increases, facilitating greater heat absorption from the surroundings. Second, the enhanced heat transfer at the gas–liquid interface under high filling rates further contributes to the accelerated evaporation of the liquid phase. These combined effects result in a higher BOG generation rate at elevated filling rates.

Figure 17.
The difference in BOG generated under different filling rates.

Table 5.
Average BOG generation rate at different filling ratios.
3.4. Analysis of Flow and Heat Transfer Characteristics Under Sloshing Conditions
3.4.1. Sloshing Analysis
In this section, the sloshing characteristics are analyzed under a sloshing period of 6 s and an amplitude of 3°. Figure 18 compares the fluid temperature contours under sloshing and static conditions. It is evident that a pronounced thermal stratification exists in the vapor region, while the temperature distribution in the liquid region remains nearly uniform. Notably, under sloshing conditions, the degree of thermal stratification in the vapor region is significantly reduced compared to static conditions. Additionally, under sloshing conditions, the maximum temperature near the bulkhead is relatively lower, and the overall fluid temperature does not exhibit a significant increase.

Figure 18.
Temperature in static and sloshing conditions.
The primary reason for these observations is that the sloshing motion induces fluctuations at the vapor–liquid interface, which significantly enhance heat and mass transfer between the vapor and liquid phases. This enhanced interfacial dynamics under sloshing conditions promotes more efficient thermal mixing, thereby reducing thermal stratification and moderating temperature extremes within the vapor region.
3.4.2. Effect of Different Sloshing Period
To comprehensively investigate the influence of sloshing excitation on the hydrodynamic characteristics and boil-off gas (BOG) generation in the CO2 storage tank, additional sloshing conditions are examined. This section focuses on the study of different sloshing periods. As is well-known, the impact of sloshing reaches its maximum at resonance, where the sloshing intensity is most pronounced. The resonance period typically occurs near the natural period of the system.
For the Type C CO2 tank studied in this work, the first-mode natural period is 8.6 s under an 80% filling ratio. Consequently, in addition to the default sloshing period of 6 s analyzed in Section 3.4.1, the hydrodynamic characteristics and BOG generation behavior are also investigated at sloshing periods of 8 s, 10 s, and 15 s.
Figure 19 and Figure 20, respectively, present the phase distribution diagrams and free surface elevation profiles under sloshing periods of 6 s, 8 s, 8.6 s, 10 s, and 15 s. At a sloshing period of 6 s, the free surface exhibits higher oscillation amplitudes but remains relatively stable, with the liquid surface maintaining an almost consistent level. In contrast, at 15 s, the free surface displays more pronounced fluctuations, indicating the formation of multiple wave patterns within each oscillation cycle. This behavior suggests that lower-frequency sloshing (15 s) induces more complex and dynamic interfacial motion compared to higher-frequency sloshing (6 s).
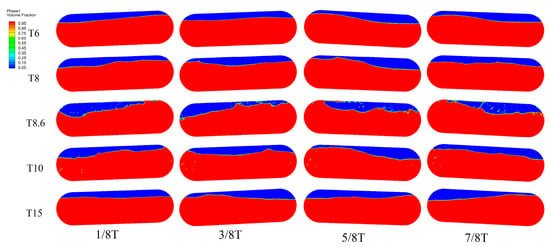
Figure 19.
Phase contours at 80% filling rate under different sloshing periods.

Figure 20.
Free liquid level height distribution curve at 80% filling rate.
For sloshing periods close to the natural period, distinct differences are observed. At 10 s, the free surface exhibits higher oscillation amplitudes, while at the natural period of 8.6 s, the liquid surface height variations are the most intense. Specifically, at 8.6 s, the free surface undergoes continuous transformation into a highly fragmented state, accompanied by the formation of intense jets along both sides of the tank wall. This phenomenon is attributed to the resonance effect, which amplifies the sloshing energy and leads to pronounced interfacial disturbances, including wave breaking and jet formation.
Figure 21 illustrates the temperature distribution under sloshing periods of 6 s, 8 s, 8.6 s, 10 s, and 15 s. At periods far from the natural period (6 s and 15 s), significant temperature gradients are observed. Specifically, in the gas phase region, a temperature difference of approximately 0.3 K is noted, while a smaller but noticeable temperature gradient also exists in the liquid phase region. Notably, at 6 s, the temperature gradient in the gas phase is more pronounced, whereas at 15 s, the temperature gradient in the liquid phase becomes more dominant.

Figure 21.
Temperature distribution at 80% filling rate under different sloshing periods.
To quantify these observations, we calculated the temperature difference (ΔT) between the maximum and minimum temperatures within each phase at 120 s for each sloshing period. The results are summarized in Table 6.

Table 6.
Temperature difference (ΔT) at 120 s for different sloshing periods.
As shown in Table 6, the temperature difference in the gas phase is significantly larger than in the liquid phase across all periods. The gas phase ΔT is largest at 6 s (0.216 K) and 15 s (0.151 K), indicating more pronounced thermal stratification away from the natural period. Near the natural period (8 s, 8.6 s, 10 s), the gas phase ΔT is reduced to approximately 0.1 K or less, suggesting a more uniform temperature distribution. The liquid phase ΔT remains small across all periods.
In contrast, at periods close to the natural period (8 s, 8.6 s, and 10 s), the temperature gradient is significantly reduced, with a difference of only about 0.1 K. This indicates that heat exchange is more intense near the natural period due to enhanced fluid motion and interfacial mixing. Specifically, at 8.6 s, the thermal stratification at the gas–liquid interface is more pronounced, and the temperature near the tank wall is relatively higher. However, near the natural period, the temperature near the wall is lower, suggesting that sloshing near the natural period promotes more efficient heat exchange.
3.4.3. Sloshing Characteristics at Different Filling Rates
In this section, the sloshing dynamics of liquid in a tank under different filling rates are systematically analyzed, with natural periods identified as 16 s for 30% and 11.89 s for 50% filling rates.
At a 30% filling rate (Figure 22a), when the sloshing periods (6 s, 10 s) are significantly shorter than the natural period (16 s), the free surface remains stable and continuous, with only a few wave peaks observed. As the period approaches the natural period (15 s, 16 s), resonance effects intensify, leading to severe surface fragmentation accompanied by wall-adherent jets and splashing (Figure 22a, T15–T16). Notably, at T = 15 s (close to the natural period of 16 s), significant surface breakup already occurs, indicating higher sensitivity to resonance at lower filling rates. In contrast, at a 50% filling rate (Figure 22b), when the period (15 s) exceeds the natural period (11.89 s), inertial forces drive wall-adherent jets while maintaining surface continuity (Figure 22b, T15), contrasting sharply with the intense splashing observed at the natural period (11.89 s). This behavior aligns with observations at an 80% filling rate, suggesting that higher filling rates suppress surface rupture by enhancing liquid inertia.
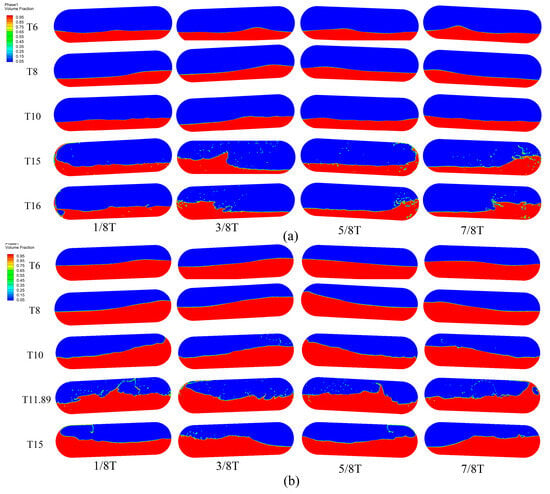
Figure 22.
Phase contours at 30% (a) and 50% (b) filling rate under different sloshing periods.
Near the natural period (Figure 22a, T15–T16; Figure 22b, T10–T11.89), both filling rates exhibit interfacial instabilities, but with distinct manifestations. At 30% filling, gas–liquid interactions dominate energy dissipation, leading to surface breakup and splashing (Figure 22a). At 50% filling, liquid inertia prevails, resulting in more persistent jets during resonance, while reduced gas cushioning exacerbates energy accumulation, ultimately causing more violent splashing (Figure 22b, T11.89). Additionally, in non-resonant regimes (e.g., T = 15 s at 50% filling), higher liquid mass delays surface rupture, allowing jets to propagate stably along the walls.
Figure 23 illustrates distinct temperature evolution patterns at 30% (Figure 23a, natural period: 16 s) and 50% (Figure 23b, natural period: 11.89 s) filling rates. To quantify these observations, the temperature difference (ΔT) between the maximum and minimum temperatures within the gas phase at a representative time point was calculated for different filling rates and sloshing periods (Table 7). At periods far from resonance (e.g., 6 s), the high sloshing frequency and large wave amplitudes result in a significantly increased gas–liquid interfacial area and enhanced convective heat transfer between the phases. This intensified heat exchange can influence the vapor temperature distribution by potentially limiting the rise of the maximum vapor while possibly increasing the minimum vapor temperature or maintaining it near the initial value, leading to a smaller temperature gradient. As shown in Table 7, the vapor temperature difference (ΔT) is 0.310 K at 6 s (30% fill) and 0.329 K at 6 s (50% fill), suggesting that while interfacial heat transfer is strong, other factors also contribute to the overall temperature stratification.

Figure 23.
The temperature distribution at a 30% (a) and 50% (b) filling rate.

Table 7.
Temperature difference (ΔT) for different filling rates and sloshing periods (K).
Conversely, as the period lengthens away from resonance (e.g., 10 s), the reduced wave amplitude and potentially smaller number of wave peaks lead to a decreased gas–liquid interfacial area and less efficient heat transfer. This allows the maximum vapor temperature to rise more significantly due to weaker cooling from the liquid phase, resulting in larger temperature gradients (Vapor ΔT reaches 0.430 K at 10 s period for 30% fill).
As the period approaches the natural frequency (15 s, 16 s for 30%; 10 s, 11.89 s for 50%), resonance-induced liquid surging and jet formation enhance gas–liquid mixing, effectively homogenizing the temperature distribution and significantly reducing the vapor temperature gradient.
For the 50% filling rate, similar trends are observed, with inertial forces at super-resonance periods (e.g., 15 s) also playing a role in temperature distribution. The slightly lower overall temperatures in the 50% case are attributed to improved convective mixing from greater liquid inertia.
As shown in Table 7, the temperature difference within the liquid phase (Liquid ΔT) remains minimal (typically less than 0.015 K) across all tested sloshing periods and filling rates. This indicates that the liquid phase maintains a relatively uniform temperature distribution, with minimal thermal stratification, even under dynamic sloshing conditions.
The interplay between filling rate and sloshing period governs thermal stratification. Lower filling rates (30%) can exhibit larger gas-phase temperature gradients at off-resonance conditions due to pronounced interfacial interactions, while higher fills (50%, 80%) prioritize inertial-driven mixing, reducing stratification, especially near resonance.
In summary, the sloshing-induced thermal behavior is strongly dependent on both the filling rate, which influences the liquid inertia and interfacial area, and the sloshing period, which determines the intensity of interfacial motion and mixing efficiency.
Figure 24 illustrates the liquid height level curves at different periods. At 30% filling (Figure 24a), the liquid level curves for 6 s, 8 s, and 10 s exhibit smooth and continuous profiles, with amplitudes slightly increasing as the oscillation period lengthens. At 15 s and 16 s (near the natural period of 16 s), the free surface undergoes significant fragmentation, characterized by elevated peaks corresponding to topping phenomena and wall-adherent jets. These resonance-driven instabilities result in larger amplitude fluctuations compared to non-resonant periods. Notably, the amplitude at 15 s approaches the maximum observed value, reflecting intensified fluid motion near the natural period.

Figure 24.
Free liquid level height curves at 30% (a) and 50% (b) filling rate.
For 50% filling (Figure 24b), the liquid level curves at 6 s, 8 s, and 15 s maintain smooth profiles with moderate amplitude variations. However, near the natural period (10 s and 11.89 s), the free surface exhibits pronounced distortions. The highest amplitude occurs at 10 s, while 15 s (exceeding the natural period of 11.89 s) shows slightly reduced amplitude due to the redistribution of liquid mass caused by persistent wall-adherent jets. This jetting phenomenon effectively lowers the localized free-surface height at 15 s, despite the period being farther from resonance.
The liquid level is governed by the interplay between oscillation period, natural frequency, and filling rate. Resonance conditions amplify amplitude fluctuations through interfacial instabilities, while non-resonant periods exhibit smoother profiles with gradual amplitude variations.
4. Conclusions
This article numerically simulates static evaporation and sloshing dynamics in LCO2 storage tanks, providing a comprehensive analysis of thermodynamic and hydrodynamic behaviors under varying pressures and sloshing conditions. Key findings, with implications for engineering design and operation, include the following:
- (1)
- Static evaporation initiates vortex formation near tank walls, driven by buoyancy and phase-change effects, resulting in gas-phase temperature rises up to 2.5 K due to the unique physical properties of CO2. Sloshing effectively reduces thermal stratification in the vapor phase by enhancing interfacial heat and mass transfer, particularly near bulkheads, thus lowering peak temperatures;
- (2)
- Increased storage pressure significantly suppresses natural convection, leading to a narrower range of vortex formation and a deceleration of fluid. Operation near resonance sloshing periods (e.g., 8.6 s at 80% filling) amplifies interfacial disturbances, minimizing vapor temperature gradients (ΔT ≈ 0.1 K) through intense mixing, while off-resonance periods result in considerably larger gradients (ΔT ≈ 0.3 K);
- (3)
- Boil-off gas (BOG) generation exhibits a clear inverse relationship with storage pressure, plateauing above 1.5 MPa. Conversely, low filling rates (30%) can exacerbate gas-phase thermal gradients due to enhanced interfacial instabilities, potentially leading to increased BOG. Quantitatively, average BOG generation rates varied significantly with the filling ratio;
- (4)
- Liquid-phase flow inertia dominates under sloshing conditions, effectively suppressing surface rupture at high filling rates. In contrast, low filling rates prioritize gas–liquid interfacial interactions, intensifying splashing and thermal stratification in the gas phase.
The insights gained from this study offer valuable guidance for optimizing LCO2 storage tank design and operational strategies. By carefully selecting operating pressures and avoiding resonance sloshing frequencies, BOG losses can be minimized, and thermal management enhanced. Higher filling rates, while potentially increasing BOG in static conditions, can offer advantages during sloshing by promoting mixing and reducing thermal stratification.
However, the current study has limitations, including simplifications in the sloshing model. Future research should focus on exploring more complex sloshing scenarios, investigating a wider range of tank geometries and sizes, and importantly, conducting experimental studies to validate numerical predictions. Furthermore, exploring the economic implications of different design and operational choices based on these findings would be beneficial.
This research contributes to a deeper understanding of the complex interplay between thermodynamic and hydrodynamic phenomena in LCO2 storage tanks, providing a foundation for improved design and operational practices aimed at enhancing efficiency and safety.
Author Contributions
Conceptualization, M.S. and Z.Z.; methodology, M.S.; software, M.S. and J.G.; validation, M.S. and J.G.; formal analysis, M.S. and Z.Z.; writing—original draft preparation, M.S.; writing—review and editing, Z.Z. All authors have read and agreed to the published version of the manuscript.
Funding
This research received no external funding.
Institutional Review Board Statement
Not applicable.
Informed Consent Statement
Not applicable.
Data Availability Statement
The raw data supporting the conclusions of this article will be made available by the authors on request.
Acknowledgments
The authors sincerely thank the editors and anonymous reviewers for their constructive comments, which significantly improved the quality of this paper. Use DeepSeek V3 and Chat GPT 3.5 for language polishing during the article writing process.
Conflicts of Interest
The authors declare no conflicts of interest.
Nomenclature
| Symbol | Quantity | Unit |
| cₚ | Specific heat | J/(kg·K) |
| E | Specific energy | J/kg |
| Surface tension source term | N/(m3·s) | |
| Body force source term (sloshing) | N/(m3·s) | |
| g | Gravitational acceleration | m/s2 |
| Latent heat (liquid-vapor) | J/kg | |
| T | Temperature | K |
| p | Pressure | Pa |
| Mass source term | kg/(m3·s) | |
| Energy source term | J/(m3·s) | |
| t | Time | s |
| u | Velocity vector | m/s |
| U | Internal energy | J |
| Greek | ||
| α | Volume fraction | - |
| Mass transfer coefficient | s⁻1 | |
| μ | Dynamic viscosity | kg/(m·s) |
| λ | Thermal conductivity | W/(m·K) |
| ρ | Density | kg/m3 |
| σ | Surface tension coefficient | N/m |
| θ | Sloshing amplitude | ° |
| Subscripts | ||
| v | Vapor phase | - |
| l | Liquid phase | - |
| sat | Saturation condition | - |
References
- Huang, M.-T.; Zhai, P.-M. Achieving Paris Agreement temperature goals requires carbon neutrality by middle century with far-reaching transitions in the whole society. Adv. Clim. Change Res. 2021, 12, 281–286. [Google Scholar] [CrossRef]
- Rogelj, J.; den Elzen, M.; Höhne, N.; Fransen, T.; Fekete, H.; Winkler, H.; Schaeffer, R.; Sha, F.; Riahi, K.; Meinshausen, M. Paris agreement climate proposals need a boost to keep warming well below 2 °C. Nature 2016, 534, 631–639. [Google Scholar] [CrossRef] [PubMed]
- Lu, H.; Ma, X.; Huang, K.; Fu, L.; Azimi, M. Carbon dioxide transport via pipelines: A systematic review. J. Clean. Prod. 2020, 266, 121994. [Google Scholar] [CrossRef]
- Hasan, M.M.F.; Zheng, A.M.; Karimi, I.A. Minimizing boil-off losses in liquefied natural gas transportation. Ind. Eng. Chem. Res. 2009, 48, 9571–9580. [Google Scholar] [CrossRef]
- Huerta, F.; Vesovic, V. A realistic vapour phase heat transfer model for the weathering of LNG stored in large tanks. Energy 2019, 174, 280–291. [Google Scholar] [CrossRef]
- Qu, Y.; Noba, I.; Xu, X.; Privat, R.; Jaubert, J.-N. A thermal and thermodynamic code for the computation of Boil-Off Gas–Industrial applications of LNG carrier. Cryogenics 2018, 99, 105–113. [Google Scholar] [CrossRef]
- Zuo, Z.; Jiang, W.; Pan, P.; Qin, X.; Huang, Y. Quasi-equilibrium evaporation characteristics of oxygen in the liquid–vapor interfacial region. Int. Commun. Heat Mass Transf. 2021, 129, 105697. [Google Scholar] [CrossRef]
- Zuo, Z.; Jiang, W.; Qin, X.; Huang, Y. A numerical model for liquid–vapor transition in self-pressurized cryogenic containers. Appl. Therm. Eng. 2021, 193, 117005. [Google Scholar] [CrossRef]
- Wang, G.; Li, J.; Zhao, Y.; Hong, G. Analysis of a new self-pressurization model for cryogenic fluid tank. IOP Conf. Ser. Mater. Sci. Eng. 2019, 502, 012064. [Google Scholar] [CrossRef]
- Sani, A.G.; Najafi, H.; Azimi, S.S. Dynamic thermal modeling of the refrigerated liquified CO2 tanker in carbon capture, utilization, and storage chain: A truck transport case study. Appl. Energy 2022, 326, 119990. [Google Scholar] [CrossRef]
- Dziejarski, B.; Krzyżyńska, R.; Andersson, K. Current status of carbon capture, utilization, and storage technologies in the global economy: A survey of technical assessment. Fuel 2023, 342, 127776. [Google Scholar] [CrossRef]
- McLaughlin, H.; Littlefield, A.A.; Menefee, M.; Kinzer, A.; Hull, T.; Sovacool, B.K.; Bazilian, M.D.; Kim, J.; Griffiths, S. Carbon capture utilization and storage in review: Sociotechnical implications for a carbon reliant world. Renew. Sustain. Energy Rev. 2023, 177, 113215. [Google Scholar] [CrossRef]
- Ma, Y.; Xing, Y.; Ong, M.C.; Hemmingsen, T.H. Baseline design of a subsea shuttle tanker system for liquid carbon dioxide transportation. Ocean Eng. 2021, 240, 109891. [Google Scholar] [CrossRef]
- Ma, Y.; Xing, Y.; Hemmingsen, T.H. An evaluation of key challenges of CO2 transportation with a novel Subsea Shuttle Tanker. IOP Conf. Ser. Mater. Sci. Eng. 2021, 1201, 012078. [Google Scholar] [CrossRef]
- Xing, Y.; Janocha, M.J.; Yin, G.; Ong, M.C. CFD Investigation on Hydrodynamic Resistance of a Novel Subsea Shuttle Tanker. J. Mar. Sci. Eng. 2021, 9, 1411. [Google Scholar] [CrossRef]
- Roussanaly, S.; Deng, H.; Skaugen, G.; Gundersen, T. At what pressure shall CO2 be transported by ship? An in-depth cost comparison of 7 and 15 barg shipping. Energies 2021, 14, 5635. [Google Scholar] [CrossRef]
- Vermeulen, T.N. CO2 Liquid Logistics Shipping Concept (LLSC): Overall Supply Chain Optimization; Global Carbon Capture and Storage Institute Limited: Canberra, Australia, 2011; Available online: https://globalccsinstitute.com/archive/hub/publications/44046/co2-liquid-logistics-shipping-concept-overall-supply-chain-optimization-simplified-chinese.pdf (accessed on 14 April 2025).
- Lee, U.; Lim, Y.; Lee, S.; Jung, J.; Han, C. CO2 Storage Terminal for Ship Transportation. Ind. Eng. Chem. Res. 2011, 51, 389–397. [Google Scholar] [CrossRef]
- Drescher, M.; Fahmi, A.; Jamois, D.; Proust, C.; Marques-Riquelme, E.; Belgaroui, J.; Teberikler, L.; Laruelle, A. Blowdown of CO2 vessels at low and medium pressure conditions: Experiments and simulations. Process. Saf. Environ. Prot. 2023, 179, 907–927. [Google Scholar] [CrossRef]
- Ferrín, J.L.; Pérez-Pérez, L.J. Numerical simulation of natural convection and boil-off in a small size pressurized LNG storage tank. Comput. Chem. Eng. 2020, 138, 106840. [Google Scholar] [CrossRef]
- Wu, S.; Ju, Y.; Lin, J.; Fu, Y. Numerical simulation and experiment verification of the static boil-off rate and temperature field for a new independent type B liquefied natural gas ship mock up tank. Appl. Therm. Eng. 2020, 173, 115265. [Google Scholar] [CrossRef]
- Saleem, A.; Farooq, S.; Karimi, I.A.; Banerjee, R. A CFD simulation study of boiling mechanism and BOG generation in a full-scale LNG storage tank. Comput. Chem. Eng. 2018, 115, 112–120. [Google Scholar] [CrossRef]
- Grotle, E.L.; Æsøy, V. Dynamic modelling of the thermal response enhanced by sloshing in marine LNG fuel tanks. Appl. Therm. Eng. 2018, 135, 512–520. [Google Scholar] [CrossRef]
Disclaimer/Publisher’s Note: The statements, opinions and data contained in all publications are solely those of the individual author(s) and contributor(s) and not of MDPI and/or the editor(s). MDPI and/or the editor(s) disclaim responsibility for any injury to people or property resulting from any ideas, methods, instructions or products referred to in the content. |
© 2025 by the authors. Licensee MDPI, Basel, Switzerland. This article is an open access article distributed under the terms and conditions of the Creative Commons Attribution (CC BY) license (https://creativecommons.org/licenses/by/4.0/).