Article

Structural Design of Segmented Linings for High-Pressure CAES in Underground Workings: Method and Case Study

1
Institute of Rock Mechanics, Ningbo University, 818#, Fenghualu, Jiangbeiqu, Ningbo 315211, China
2
Ningbo Key Laboratory of Energy Geostructure, Ningbo University, Ningbo 315211, China
3
State Key Laboratory of Disaster Reduction in Civil Engineering, Shanghai 200092, China
*
Authors to whom correspondence should be addressed.
These authors contributed equally to this work and should be considered co-first authors.
Appl. Sci. 2025, 15(10), 5782; https://doi.org/10.3390/app15105782
Submission received: 4 April 2025 / Revised: 12 May 2025 / Accepted: 16 May 2025 / Published: 21 May 2025

Abstract

:
This study aims to ensure that the maximum crack width of underground working linings for compressed air energy storage (CAES) meets the allowable limit under high internal pressure conditions. Drawing on crack width calculation methods from hydraulic tunnels, this study proposes a design method for segmented linings with preset seams. The method accounts for the shear mechanical behavior of the sliding layer, with parameters determined through laboratory testing. A typical case study validates the reliability of the crack width calculation method that accounts for lining damage and plasticity. The study determined, from an engineering case, that six seams are optimal when the lateral pressure coefficient λ is below 1, while four seams are more suitable when λ > 1. Additionally, reinforcement ratios and retractable joints of the segmented lining were designed for the case. When the surrounding rock quality is lower than that of hard rock mass and gas pressure exceeds 12 MPa, monolithic cast-reinforced concrete linings often fail to meet the allowable crack width limits. However, segmented linings offer greater flexibility, as they can still meet the requirements even with fair-quality rock mass. These findings provide critical theoretical foundations for the design of CAES workings under high internal pressure.

1. Introduction

Underground workings for compressed air energy storage (CAES) with rock linings typically employ one of three sealing systems: steel-lined sealing layers [1], flexible sealing layers using polymer materials [2,3], and polyurethane polymer mortar [4]. Compared to steel linings, flexible sealing layers offer greater deformability, faster and simpler construction, and lower costs, making them a promising alternative [5]. However, under high internal gas pressure, linings may crack, potentially leading to the failure of the flexible sealing layer due to crack intrusion [6,7,8,9]. As a result, flexible-sealed CAES workings impose strict limits on the maximum allowable crack width in the lining. According to the Chinese Design Specification for Hydraulic Concrete Structures [10], to prevent reinforcement corrosion, the maximum permissible crack width for reinforced concrete structures permanently located underground is 0.3 mm. This requirement is difficult to meet under conditions of high internal pressure and lower-quality rock mass. When the rock mass has a low elastic modulus, significant deformation can lead to wide cracks in the lining [11]. Consequently, monolithic cast-reinforced concrete linings are generally applicable only when the surrounding rock is of higher quality or the storage pressure is relatively low. Designing high-pressure CAES workings in rock masses of lower quality presents significant challenges.
In addition, CAES workings are required to withstand high internal pressure, which demands both high gas tightness and structural stability [12,13,14]. Zhuo et al. [15] and Wan et al. [16] developed a thermo-mechanical coupled numerical model for CAES workings, showing that tensile stresses during operation can induce cracking in the lining and surrounding rock, thereby compromising overall stability. To accommodate the surrounding rock deformation and reduce cracking in the lining, several strategies have been proposed. One approach is to use flexible concrete materials with a low elastic modulus and high tensile strength for the lining [17]. Since the load-bearing ratio of monolithic linings increases with the elastic modulus [18], selecting a lower-modulus material allows the lining to act mainly as a load-transfer structure. This reduces the risk of cracking [19,20]. Another approach is to adopt a segmented lining structure that allows the radial displacement to be released through preset seams, thus preventing wide cracks.
The earliest segmented lining consists of eight reinforced concrete segments and backfill concrete between the segment tails and the surrounding rock [21,22,23]. Segmented linings can move with rock deformation, and the internal gas pressure is transferred through the sealing system to the surrounding rock. Field tests have shown an air leakage rate of only 0.2% per day [24], indicating that segmented linings can meet sealing requirements and are suitable for CAES working construction. Wu et al. [25] proposed an analytical model to determine the support stiffness of circumferentially yielding linings, which was successfully applied in the Saint-Martin-la-Porte tunnel. Their simulations demonstrated that yielding linings, formed by embedding yield elements in shotcrete to create pre-designed seams, effectively transfer pressure to the rock mass through deformable seams and reduce structural loads. Xu et al. [26] proposed a segmented lining structure for CAES workings based on elastic deformation analysis, though it did not account for plastic deformation. Zhang et al. [27] introduced a composite segmented lining. This design considered shear deformation between the initial support and the lining. However, the shear properties of the sliding layer were not validated through experiments. In addition, the effects of the lateral pressure coefficient, the number of seams, and their positions were not considered. Qiu et al. [28] proposed a segmented lining design method for underground hydrogen storage workings, showing that flexible seam fillers help reduce stress and damage levels compared to monolithic linings. Zhang et al. [29] conducted prototype experiments to reveal the failure mechanisms of shield segments with preset seams under internal water pressure, identifying patterns in seam openings and damage evolution. These studies suggest that research on segmented linings for CAES workings is still in its early stages. A unified design methodology for linings in flexible-sealed CAES workings has yet to be established.
This study aims to effectively control the maximum crack width in the lining and prevent the failure of the sealing layer due to crack intrusion, thereby ensuring the gas tightness and stability of the workings. A segmented lining structure with preset seams is adopted to release radial displacement and reduce tensile stress in the lining. A design method for the segmented lining is proposed, incorporating the shear behavior of the sliding layer as determined through laboratory testing, along with a numerical model that accounts for damage in the lining. Using an engineering case, this study details the design of the number of seams, the reinforcement ratio, and the retractable joint structure and discusses the applicability of this method across various rock mass qualities. The findings provide a new approach for reducing crack widths in rock-lined concrete workings and enhancing the performance of CAES systems.

2. Materials and Methods

2.1. Governing Equations for Segmented Linings

Monolithic reinforced concrete linings are prone to cracking under high internal pressure, which may compromise their load-bearing capacity. By introducing preset seams, the radial displacement of the lining can be released, allowing the internal gas pressure to be effectively transferred to the surrounding rock, thereby fully utilizing the rock mass’s bearing capacity. A typical segmented lining structure with preset seams is shown in Figure 1. This structure consists of four main components: a segmented reinforced concrete lining, preset seams, retractable joints, a sliding layer, and sealing elements at the seams. Sealing materials are applied to the inner wall of the working area, and sealing strips are installed at the seams to prevent high-pressure gas leakage. Steel bedding is locally embedded between the flexible sealing materials and the lining to prevent the sealing materials from being pushed into the seams under pressure. The sliding layer ensures that preset seams open under internal pressure and helps redistribute circumferential stresses in the lining. The working mechanism of the segmented lining is as follows:
(1) Before gas injection, the preset seams remain closed, as shown in Figure 1a.
(2) As the working is pressurized, internal pressure increases, causing slippage between the primary and secondary linings. This leads to a gradual opening of the preset seams, allowing for the radial displacement of the lining to be released and redistributing circumferential stress. The internal pressure is thereby effectively transferred to the surrounding rock. Without the sliding layer, significant shear stress would develop between the primary and secondary linings to counterbalance the internal pressure, preventing seam opening and inhibiting radial displacement release.
(3) When the internal pressure reaches its maximum, the opening displacement of the preset seams reaches its peak value, Dmax, and the radial displacement of the lining is fully released, as shown in Figure 1b.
In establishing the governing equations, several simplifications were made for computational efficiency and model tractability:
(1) The surrounding rock was modeled as an elastoplastic material and assumed to be of uniform quality and isotropic. Spatial variability and mechanical anisotropy caused by bedding planes, joints, or faults were not considered.
(2) The retractable joints between segmented linings were represented by linearly elastic elements. This simplification does not account for potential nonlinear deformation, interface slip, or damage-induced degradation that may occur under service conditions.
Shear deformation occurs between the initial support and the lining before any sliding takes place at their interface. This mechanical behavior is captured in the model presented in Figure 2. The maximum shear deformation, represented by δm, is influenced by the friction coefficient and the shear stiffness of the interface, Kn. The model highlights how the interaction between the two structural components contributes to the overall system response.
To analyze the stress state of the lining, a small segment is isolated, as shown in Figure 2b. The analysis is carried out in both the radial and circumferential directions. A polar coordinate system is introduced to facilitate the formulation of the corresponding equilibrium equations:
σ r r + 1 r τ r θ θ + σ r σ θ r = 0
1 r σ θ θ + τ r θ r + 2 τ r θ r = 0
The radial (σr), circumferential (σθ), and shear (τ) stresses characterize the internal force distribution in the lining. The strain–deformation relations of the segment are then derived using basic geometric assumptions:
ε r = u r r
ε θ = u r r + 1 r u θ θ
γ r θ = 1 r u r θ + u θ r u θ r
Strains εr and εθ are linked to displacements ur and uθ in the radial and circumferential directions, respectively. The lining behaves elastically before yielding, and the stress–strain relationships are governed by standard constitutive laws.
ε r = 1 μ 2 E σ r 1 μ μ σ θ
ε θ = 1 μ 2 E σ θ 1 μ μ σ r
γ r θ = 2 ( 1 + μ ) E τ r θ
A stress boundary is applied at r = R0, the liner’s inner surface, with radial stress equal to the internal air pressure pa.
σ r r = R 0 = p a
Given the high internal pressure, both tension and compression damage in concrete are considered. The elastic response is governed by the modulus of elasticity and Poisson’s ratio. In the plastic range, the uniaxial compressive stress–strain relationship is defined as follows.
σ = 1 d c E c ε
d c = 1 ρ c n n 1 + x c n x c 1 1 ρ c α c x c 1 2 + x c     x c > 1
ρ c = f c , r E c ε c , r
n = E c ε c , r E c ε c , r f c , r
x = ε ε c , r
In the compressive stress–strain curve of concrete, the descending branch is characterized by the parameter αc. The representative uniaxial compressive strength, denoted by fc,r, is typically taken as fc,r = fc. The corresponding peak strain is εc,r, which marks the strain at peak compressive strength. The evolution of compressive damage is described using the parameter dc.
The uniaxial tensile stress–strain behavior of concrete, accounting for compressive damage, is defined by the following equations.
σ = 1 d t E c ε
d t = 1 ρ t 1.2 0.2 x t 5 x t 1 1 ρ t α t x t 1 1.7 + x t     x t > 1
ρ t = f t , r E c ε t , r
x = ε ε t , r
The descending branch of the tensile stress–strain curve in concrete is governed by the parameter αt. The representative tensile strength ft,r is typically assumed equal to ft. The strain at peak tensile strength is denoted as εt,r. The evolution of damage under uniaxial tension is described using the parameter dt.
The mechanical properties of concrete used in this study are listed in Table 1.

2.2. Mechanical Behavior of Sliding Layers

The interface between the initial support and the lining is simulated using the Coulomb friction model. As shown in Figure 2c, the surfaces in contact can sustain a certain level of shear resistance, known as cohesion, before sliding occurs. This shear resistance depends on the normal contact pressure. In the basic formulation, the critical shear stress is defined as a function of this pressure. Once the threshold is exceeded, sliding initiates. The maximum frictional stress at the interface is proportional to the applied normal load. Accordingly, the relationship between shear stress and shear displacement at the interface is given by
τ r θ r = R 0 + d = K n Δ u θ Δ u θ δ m f σ r r = R 0 + d Δ u θ > δ m
It should be noted that Kn and δm are not material constants but are affected by the level of normal stress.
Direct shear tests were conducted using a custom-designed shear box, where the lining concrete sample was placed in the upper box and the initial support sample in the lower one. A normal load was applied vertically to the upper box, while a horizontal displacement was imposed on the lower box at a constant rate of 0.2 mm/min. This setup is illustrated in Figure 3. Before testing, concrete blocks were cast for both the lining and the initial support. The initial support samples measured 20 cm × 10 cm × 5 cm, and the lining samples were 10 cm × 10 cm × 5 cm. After seven days of curing, a 2 mm thick sliding layer was applied to the lining sample by either brushing or spraying. The entire assembly was then cured for an additional 21 days. To evaluate shear performance, a range of sliding layer materials was examined. These included plain asphalt, modified asphalt cement, geotextile-reinforced asphalt, and waterborne polyurethane. The shear mechanical behavior of each material was tested using the above-described procedure.
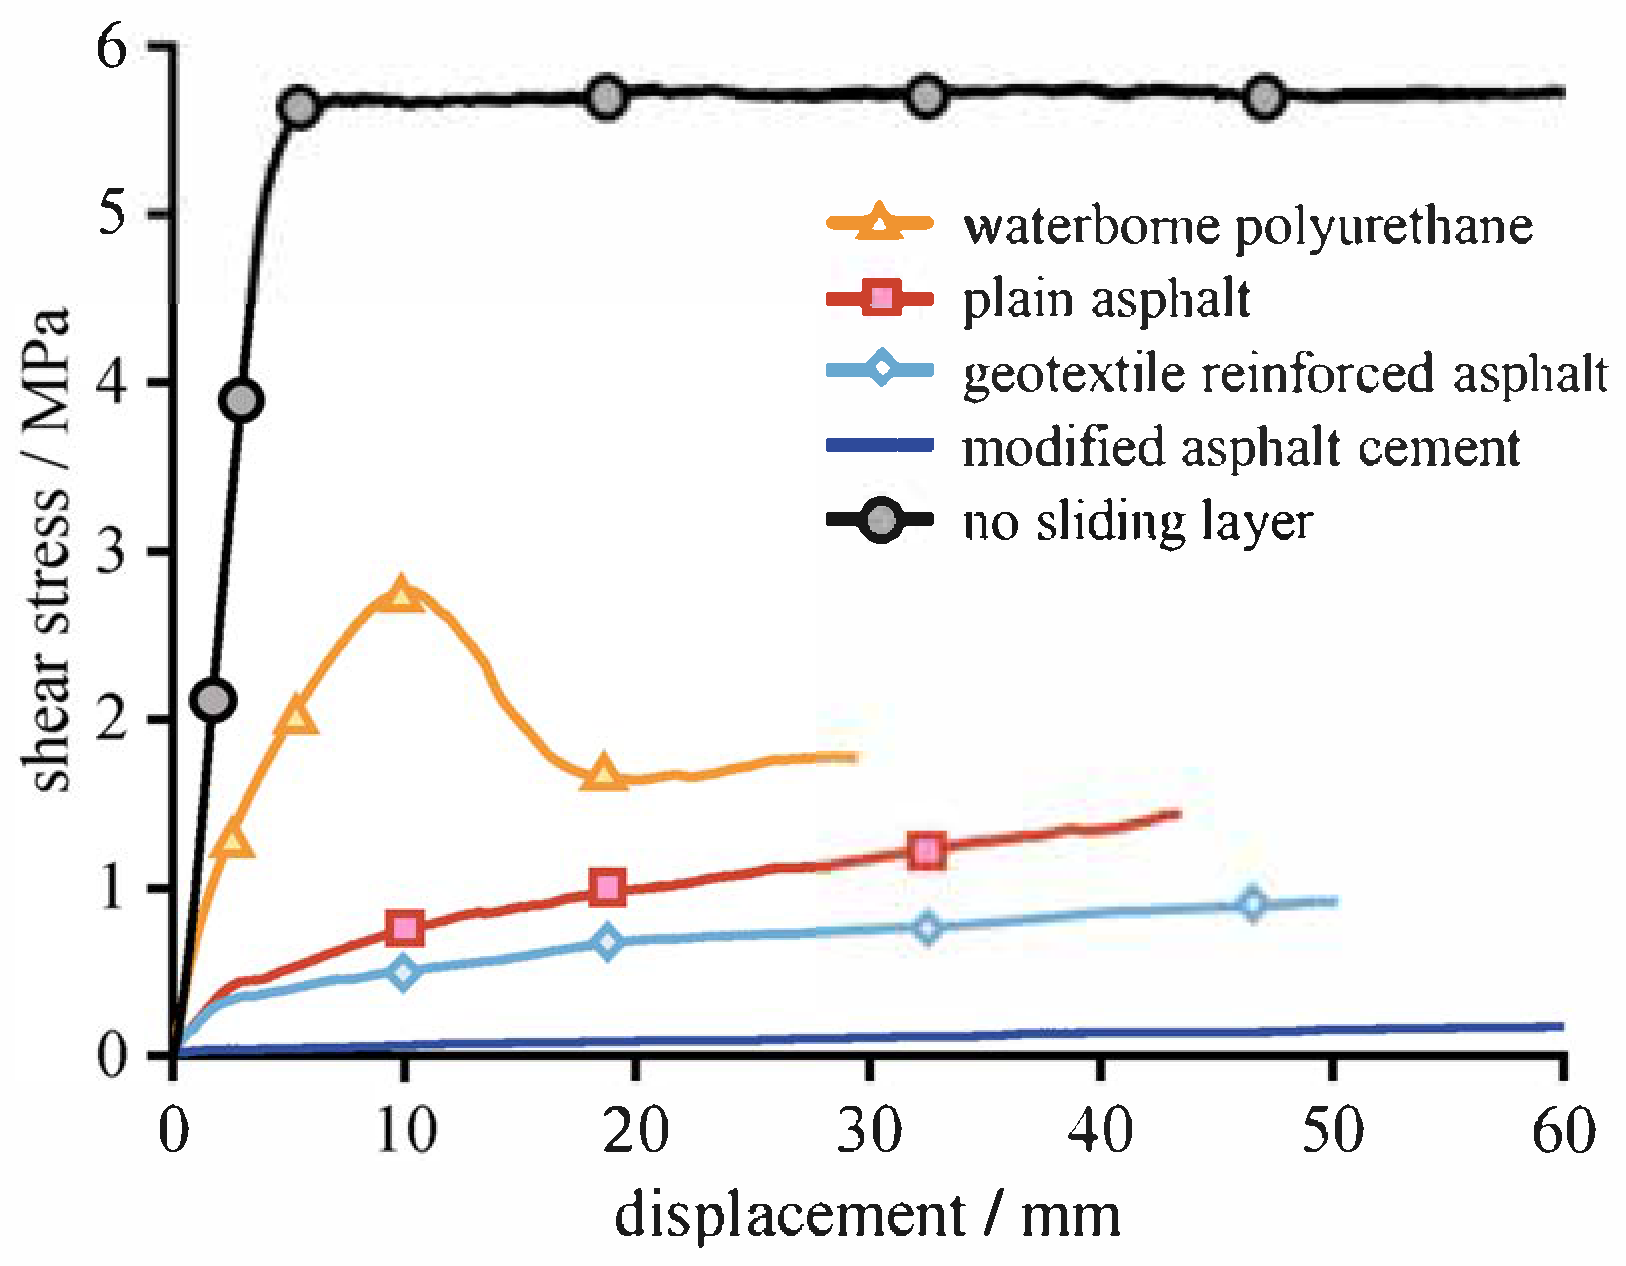
Shear stiffness values for each sliding layer material were obtained from the measured displacement–shear stress curves, as summarized in Table 2. These tests were conducted under a constant normal stress of 10 MPa. Figure 4 presents the shear response curves of various materials used in the sliding layer. Among all materials, the highest shear stiffness—943.2 MPa/m—was observed at the concrete–concrete interface between the lining and initial support. In contrast, sliding layers significantly reduced this value. Plain asphalt yielded a shear stiffness of 33.1 MPa/m, geotextile-reinforced asphalt 18.2 MPa/m, and modified asphalt cement only 2.6 MPa/m. Waterborne polyurethane showed a relatively higher stiffness of 98.5 MPa/m. The reductions in shear stiffness, compared to direct concrete contact, were substantial: 96.49% for plain asphalt, 98.07% for geotextile-reinforced asphalt, 99.72% for modified asphalt cement, and 89.56% for waterborne polyurethane. These results demonstrate the effectiveness of the sliding layer in mitigating shear transmission across the interface. Notably, the friction coefficient was not determined in these tests. Due to the adhesive and deformable nature of the asphalt-based materials, no distinct slip occurred at the interface, and the shear deformation was primarily governed by the material’s behavior rather than frictional sliding. In this study, plain asphalt was adopted as the material for the sliding layer, with its shear stiffness listed in Table 3, and the friction coefficient between concrete and asphalt was set to 0.35 based on the findings by Damasceno et al. [30].

2.3. Calculation for the Maximum Crack Width of Segmented Linings

Preset seams allow for the partial release of radial displacement in the lining. This helps reduce the maximum crack width. However, the crack width must still meet the required control limits. Currently, there is no established design code specifically for CAES workings. However, the Code for Design of Hydraulic Tunnel [31] provides a useful reference. This is due to the structural similarities between hydraulic tunnels and CAES workings: both are embedded underground and subjected to combined internal and external pressures. According to this code, the maximum crack width of reinforced concrete linings can be calculated using the following formula [31]:
w max = 2 ( σ s E s ψ 0.7 × 10 14 ) l f
ψ = 1 α 2 f tk ρ s σ s
l f = ( 60 + α 1 d ρ s ) ν
where wmax represents the maximum crack width of the lining (mm); σs is the tensile stress in the reinforcement (N/mm2); Es is the elastic modulus of the reinforcement (N/mm2); ψ is the coefficient of the uneven strain distribution of the longitudinal tensile reinforcement between cracks; lf is the average crack spacing (mm); ftk is the standard axial tensile strength of concrete (N/mm2); ρs is the reinforcement ratio of the tensile reinforcement; α1 and α2 are calculation coefficients, with α1 = 0.16 and α2 = 0.60; ν is a coefficient related to the surface shape of the tensile reinforcement, with a value of 0.7 for deformed bars; and d is the diameter of the tensile reinforcement (mm).
The tensile stress in the reinforcement can be calculated through numerical simulations. Xiang et al. [18] showed that the surrounding rock at six times the radius of the CAES working is largely unaffected by the internal storage pressure. Therefore, a CAES working with an internal diameter of 10 m, an initial support thickness of 18 cm, a secondary lining thickness of 50 cm, and a flexible sealing layer thickness of 10 mm was adopted for the model. The model’s geometry is 200 m × 200 m (W × H), which meets the requirement of being more than six times the working radius. The portion from the top of the model to the ground is simplified as a surface load ρrgh, where ρr is the density of the surrounding rock, g is the gravitational acceleration, and h is the thickness of the overlying rock mass. The model’s bottom is fully fixed, and the left and right sides are load boundaries, with λ as the lateral pressure coefficient (see Figure 5). The numerical simulation should consider the excavation process of the underground working, including the following steps:
(1) The initial geostress balance.
(2) The excavation of the surrounding rock and the installation of the initial support.
(3) The application of the secondary lining and sealing layer and the calculation under external pressure conditions.
(4) The application of internal pressure and the execution of the calculation.

2.4. Implementation

The design method for segmented linings was proposed to address the inability of monolithic linings to meet crack control requirements. It involves the following key design processes:
(1) Site investigation and testing to obtain the mechanical properties of the surrounding rock, assessing its suitability for the construction of CAES workings.
(2) The preliminary design of the working depth, diameter, and internal pressure based on the properties of the surrounding rock.
(3) The calculation of the maximum crack width for the monolithic lining, followed by an assessment to determine if it meets the crack control requirements. If the requirements are met, the monolithic lining design proceeds. If not, the working depth, diameter, and internal pressure should be optimized.
(4) After several optimization iterations, if the internal pressure is less than 8 MPa and the working diameter is less than 6 m but the crack control requirements are still not satisfied, a segmented lining should be adopted. The rationale for this is that both small internal pressure and a small diameter result in low economic benefits.
(5) The design of the number of preset seams, determining the optimal number of seams.
(6) Based on the optimal number of preset seams, we design the reinforcement ratio of the lining and retractable joints structure, ensuring that the maximum crack width of linings is smaller than the allowable values, thus completing the design of the segmented lining.
The design process for the segmented lining is illustrated in Figure 6.

3. Validation

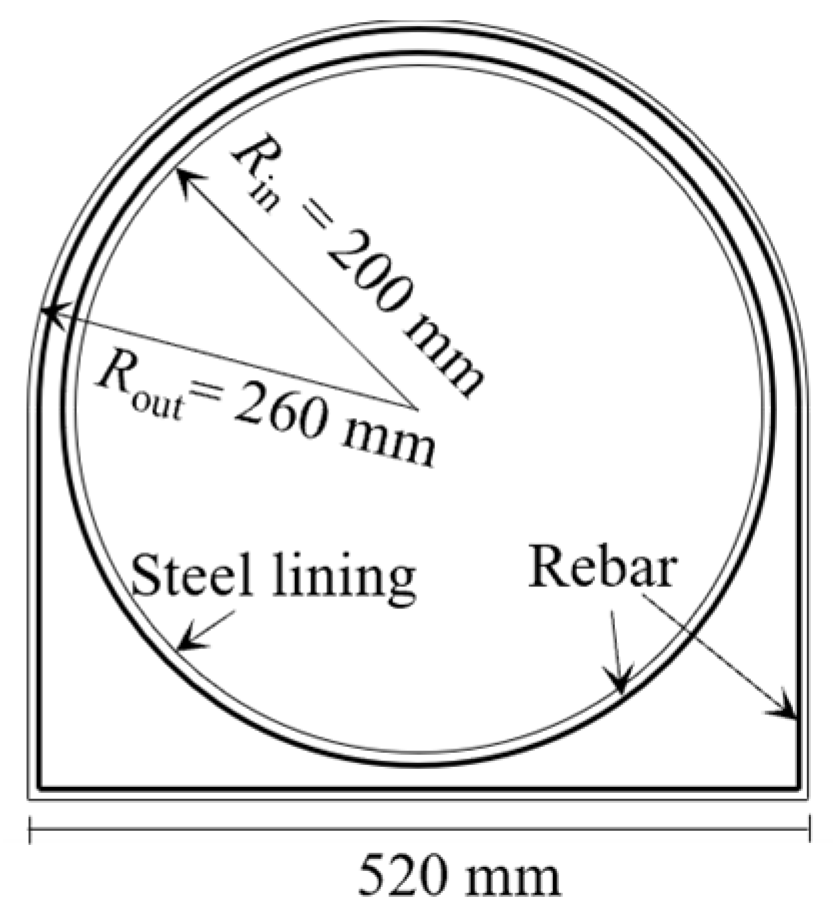
The calculation method for the maximum crack width of linings was validated by comparing it with a physical model test of a reinforced concrete pressure pipeline. The model of the pressure pipeline is shown in Figure 7 [32], with a clear internal diameter of 400 mm. The innermost layer consists of a steel lining with a thickness of 1 mm, while the lining is reinforced on both the inner and outer sides with 6 mm diameter steel bars, achieving a reinforcement ratio of 1.286%. The lining is made of standard C30 concrete specimens. The internal water pressure is 1.3 MPa, and the normal displacement at the bottom of the model is constrained, with the rest of the boundaries being free.
The concrete tensile damage factor (DAMAGET) distribution obtained from the simulation is shown in Figure 8a. The values of DAMAGET range from 0 to 1, with higher values indicating more severe damage. The red regions, where the damage factor reaches 0.97, represent fully damaged areas, corresponding to the crack distribution zone. This closely matches the crack distribution area observed in the experiment. Additionally, the maximum tensile stress in the reinforcement obtained from the simulation is 156.0 MPa, which is in good agreement with the experimental result of 144.8 MPa. The calculated maximum crack width in the concrete is 0.092 mm, which is only 6% different from the experimental result of 0.087 mm [32]. This confirms the accuracy of both the numerical simulation method and the calculation approach for the maximum crack width of the lining.
A key limitation of the laboratory setup is the simplification of boundary conditions, where the confining effects of the surrounding rock mass and the initial support were not considered when evaluating the mechanical behavior of the concrete lining. While the simplified test setup can, to some extent, reproduce the working condition of the lining, it inevitably introduces several deficiencies. First, the concrete lining in the test was subjected to uniaxial tensile loading, whereas in real conditions, the lining may experience tensile stress in one direction and compressive stress in another, which typically leads to lower effective strength than uniaxial tension alone. Therefore, the experimental results may overestimate the actual load-bearing capacity of the lining. Second, the laboratory model cannot represent the shear stress transfer at the interface between the lining and the surrounding rock; only smooth contact conditions can be simulated. These limitations imply that the laboratory tests provide an idealized assessment of crack development, which may differ from actual in situ behavior due to the absence of confinement. Future experiments should incorporate more realistic boundary constraints and interface behavior to better simulate the in situ mechanical behavior of underground workings for CAES.

4. Case Study

4.1. Case Background

This study focuses on the design method of the segmented lining structure based on a CAES project in Inner Mongolia. The proposed underground gas storage facility is designed as a tunnel structure with a circular cross-section, a clear internal diameter of 10 m, and a working depth of 146 m. According to the geological survey report, the surrounding rock is classified as a medium-quality rock mass, with a deformation modulus of E = 6 GPa, a cohesion value of c = 1.5 MPa, and an internal friction angle of φ = 45°. The rock mass has a Poisson’s ratio of ν = 0.28 and a density of γ = 26.2 kN/m3. Additionally, the hydraulic fracturing stress measurements show the presence of tectonic stress in the area, with a vertical stress of 3.9 MPa, a horizontal principal stress of 3.5 MPa, and a lateral pressure coefficient λ of 0.9.

4.2. Mechanical Response of the Surrounding Rock

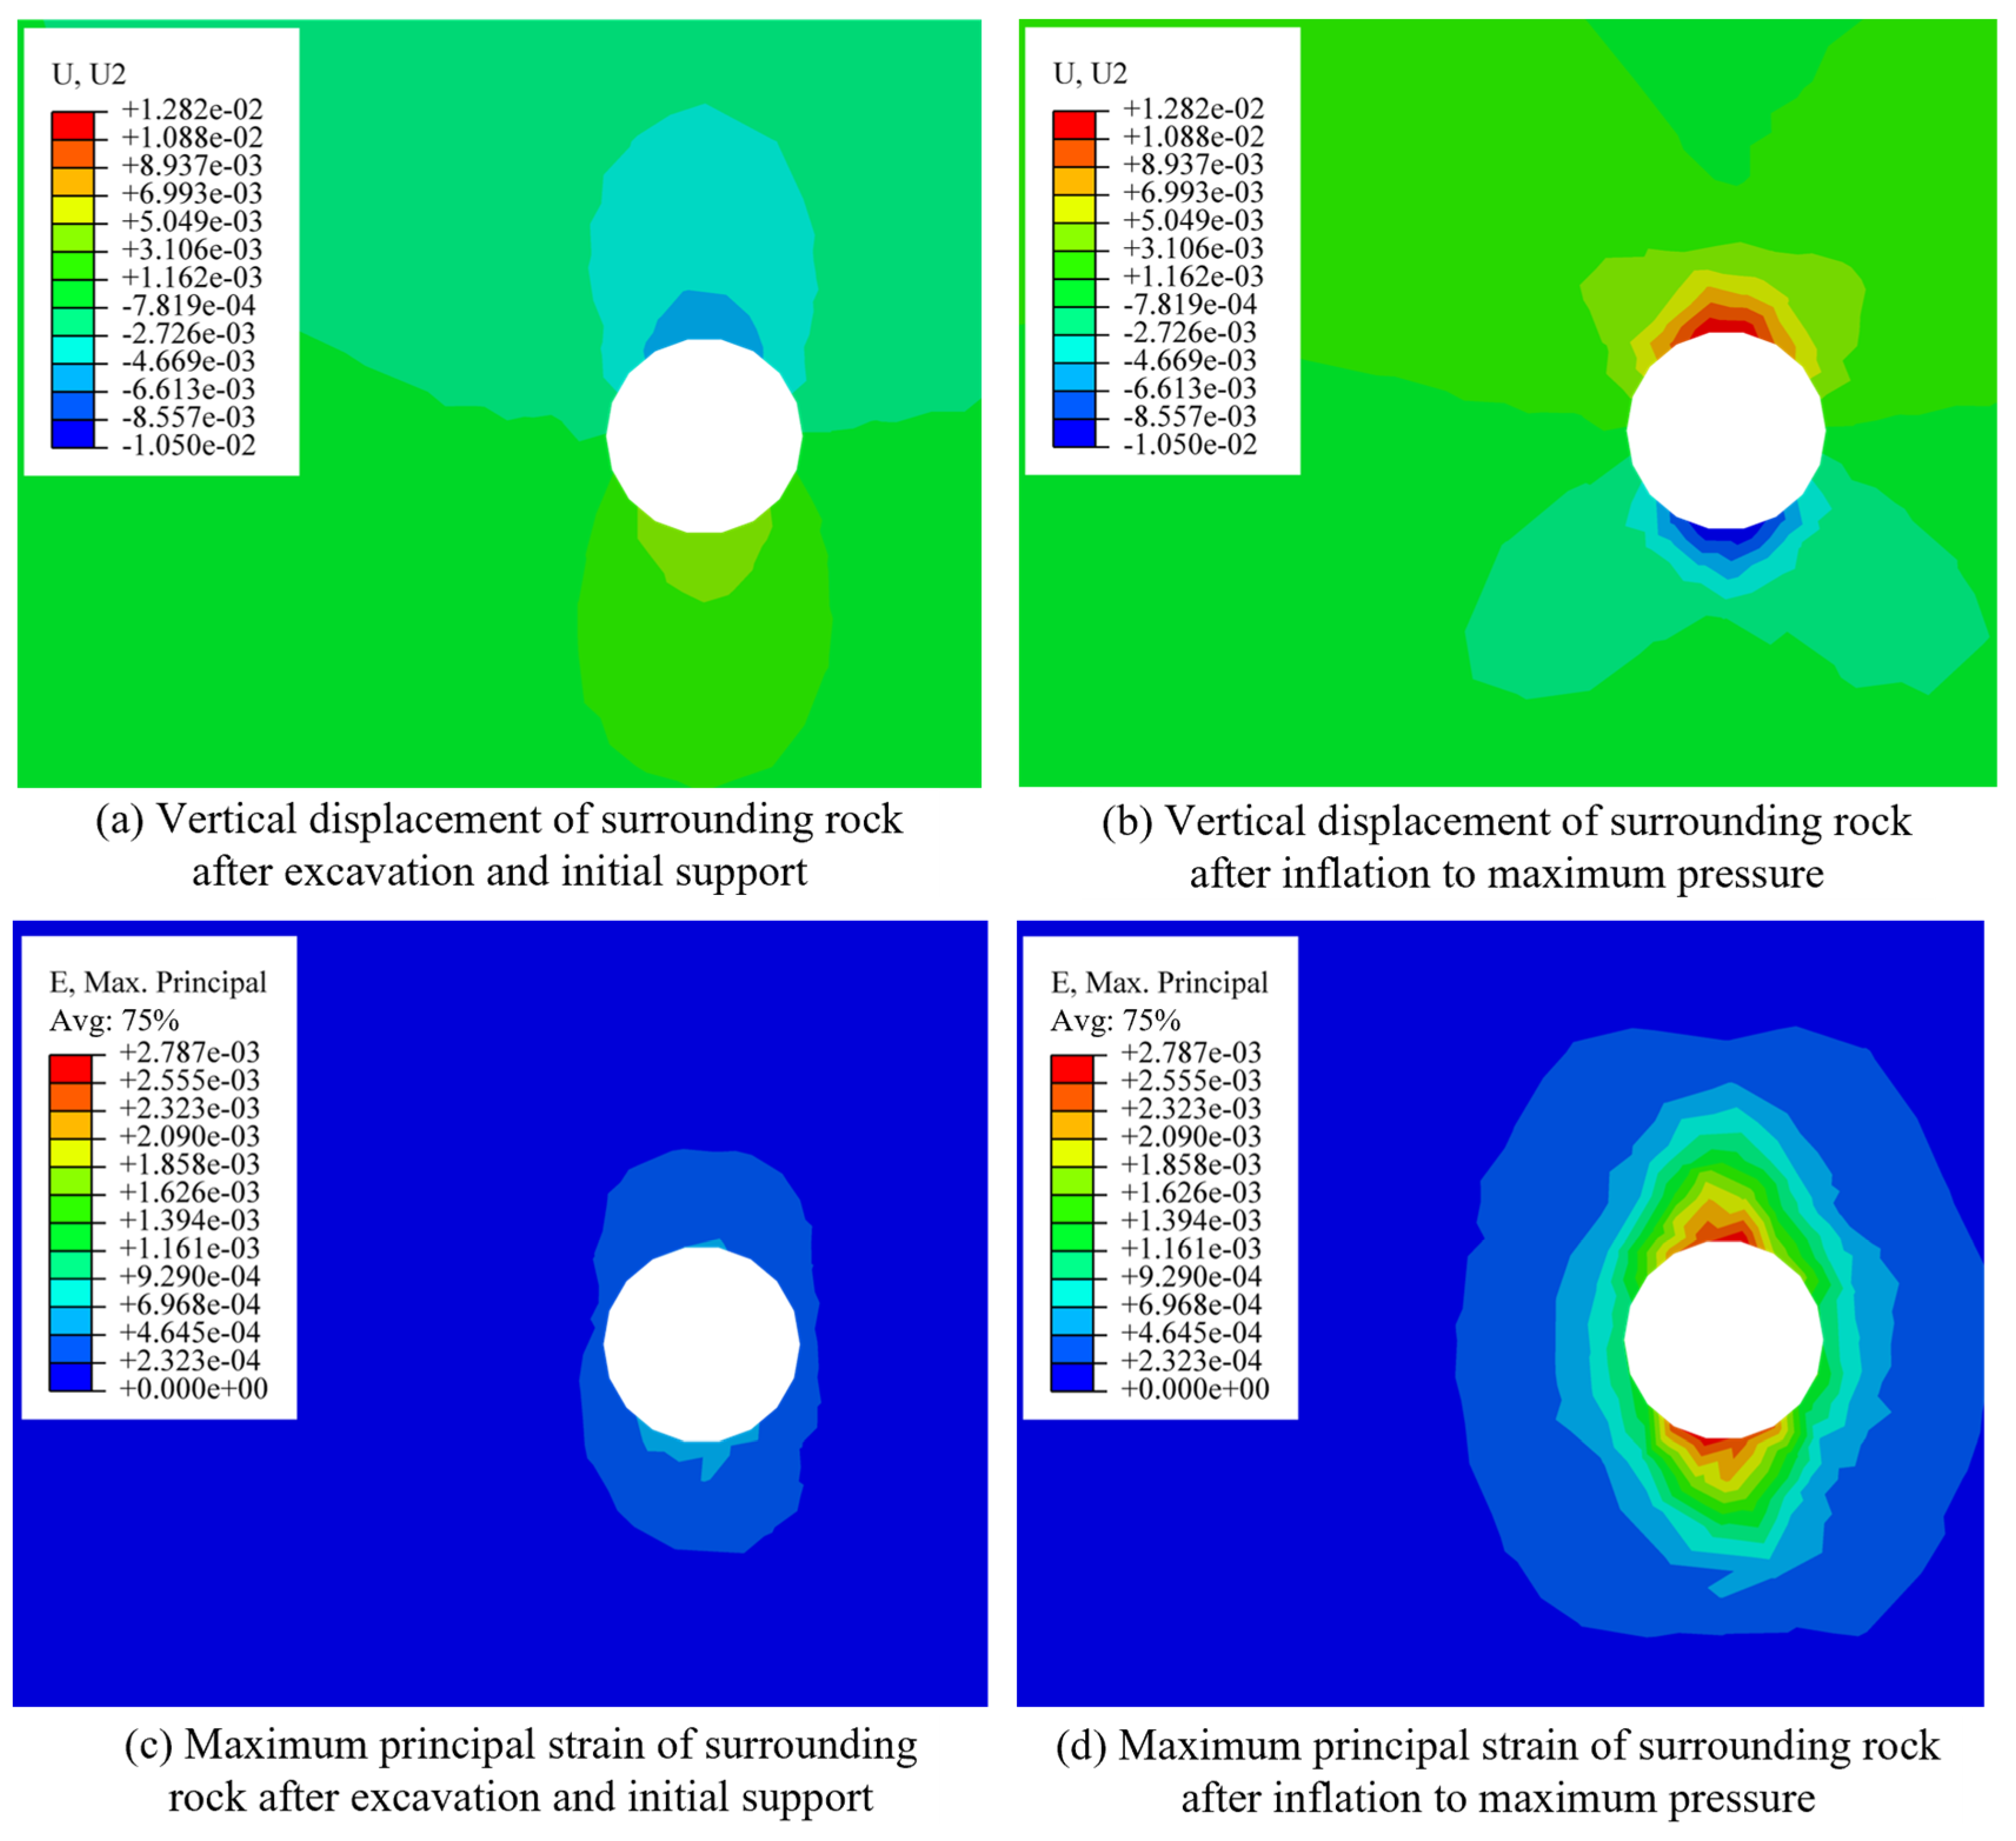
Figure 9 shows the vertical displacement and maximum principal strain of the surrounding rock after excavation and during operation under a lateral pressure coefficient of 0.39. It can be observed that after excavation and the application of the initial lining, the maximum displacement at the crown of the tunnel reaches 4.8 mm, with a maximum principal strain of 5.40 × 10⁻⁴. After inflation to the maximum pressure, the surrounding rock exhibits a maximum vertical displacement of 12.8 mm, expanding outward, and the maximum principal strain increases to 2.79 × 10⁻³. The plastic zone extends further, and the stress state of the surrounding rock transitions from compression-dominated to a combined tension–compression state. Air pressurization induces significant radial displacement in the surrounding rock. Therefore, preset seams are required in the lining. These seams help release the radial deformation of the lining and allow the surrounding rock to provide effective resistance.

4.3. Design of the Number of Preset Seams

The lateral pressure coefficient reflects the state of the in situ stress and is defined as the ratio of the maximum horizontal stress to the vertical principal stress. The variation in the lateral pressure coefficient affects the stability of the surrounding rock. To identify the optimal number of preset seams, the stability of the lining will be evaluated under various lateral pressure coefficients and seam configurations.

4.3.1. Lateral Pressure Coefficient Less than One

To investigate the optimal number of preset seams when the lateral pressure coefficient is less than 1, this section establishes a two-dimensional numerical model for the lateral pressure coefficient of λ = 0.39 with two, three, four, six, and eight preset seams. The best preset seam configuration is determined by analyzing the degree of lining damage, reinforcement stress, and seam opening displacement. As shown in the total damage (SDEG) of the lining in Figure 10, multiple preset seams can effectively reduce the damage factor at the far end of the joints. As the number of preset seams increases, the region with higher lining damage between the seams noticeably decreases. However, increasing the number of preset seams leads to a decline in the overall integrity of the lining. When the number of preset seams reaches six, the total damage is minimized.
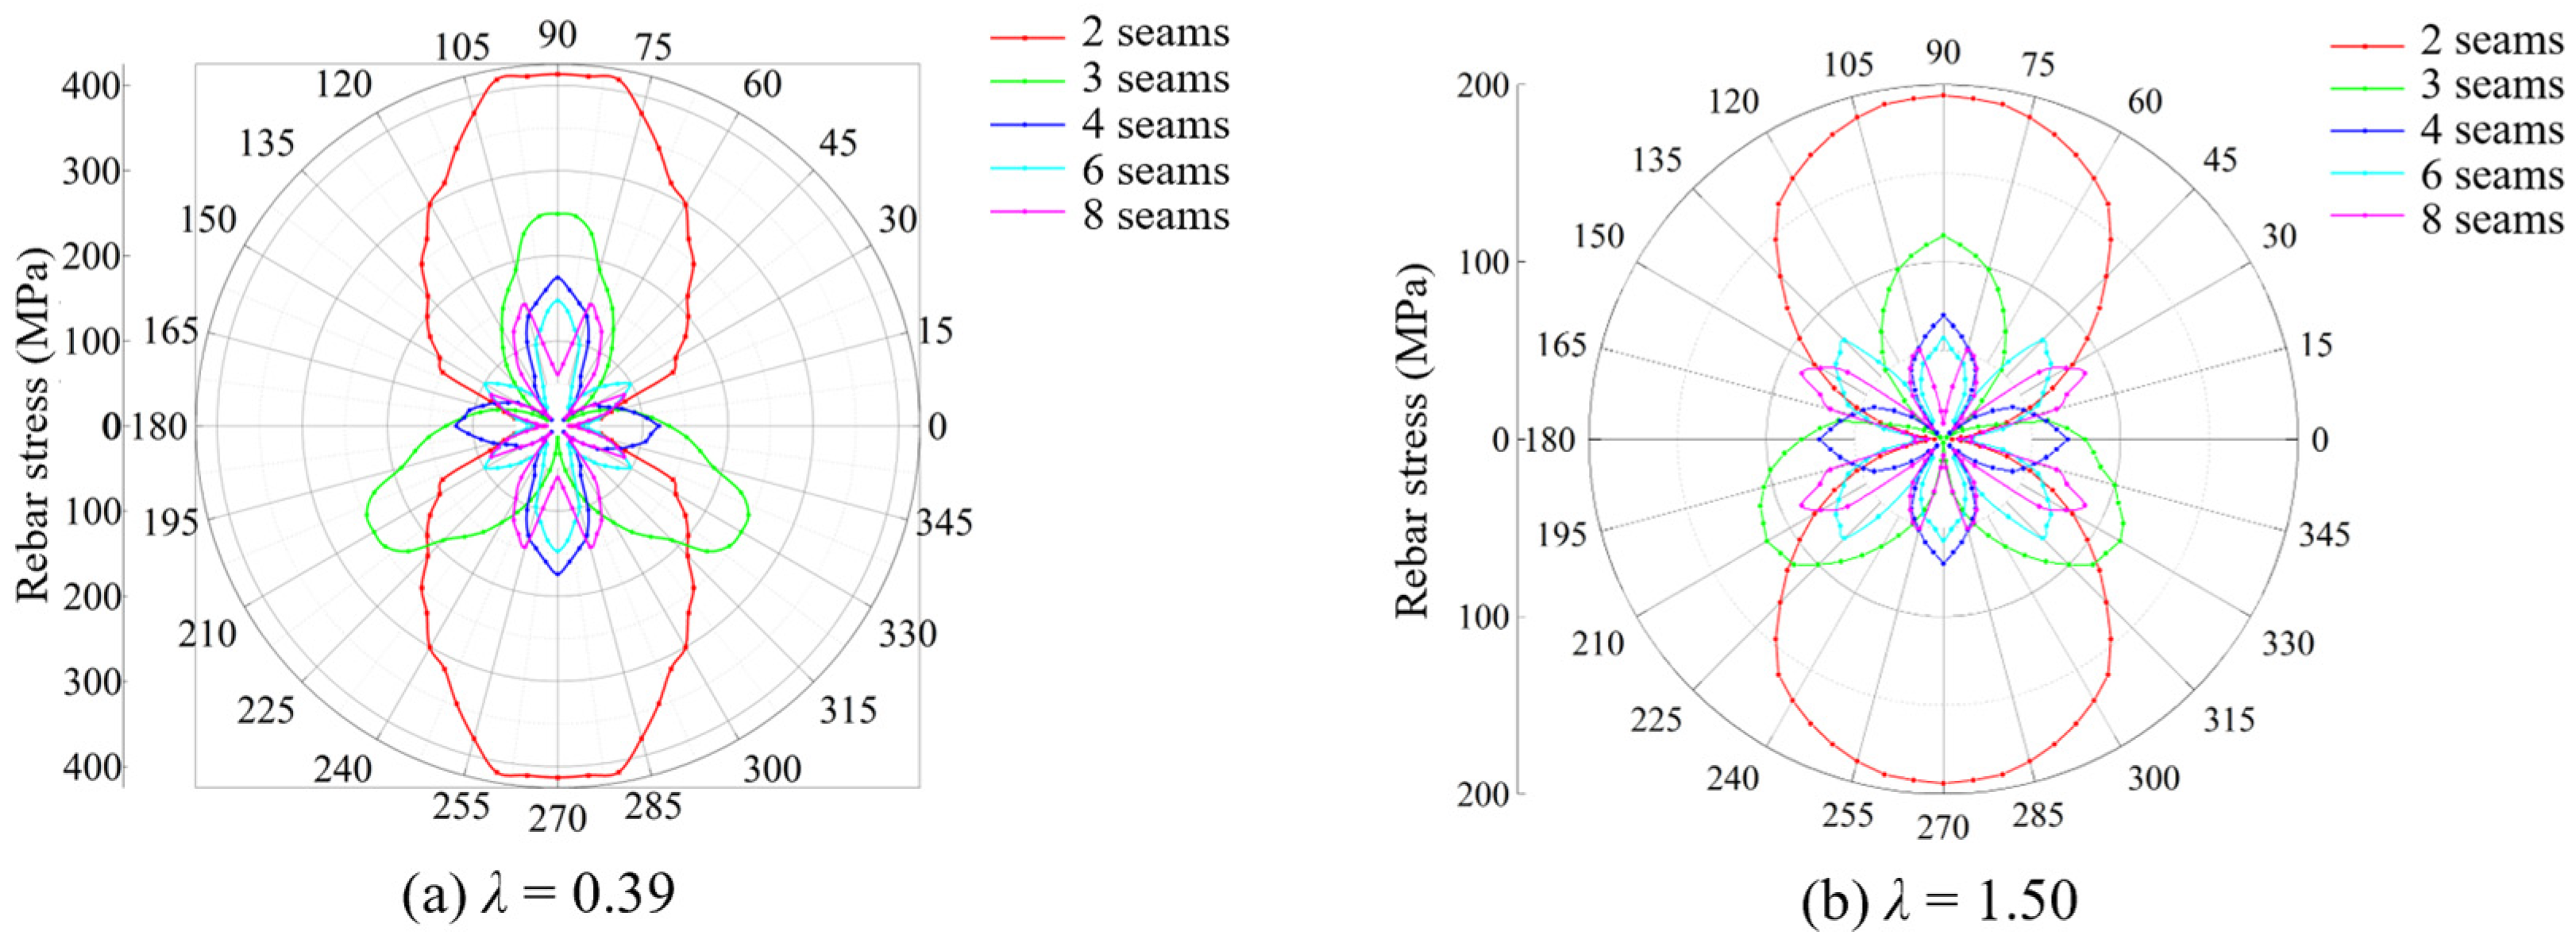
As shown in Figure 11, it can be seen that when two preset seams are used for λ = 0.39, the maximum tensile stress in the reinforcement at the seam is 13 MPa, while at the far end, the maximum tensile stress reaches 413 MPa, leading to reinforcement yielding and crack widths exceeding 0.3 mm. With three preset seams, although the maximum tensile stress reduces to 249 MPa, the maximum crack width still reaches 0.32 mm. With four, six, and eight preset seams, the maximum tensile stress in the reinforcement further decreases and is maintained below 200 MPa, with corresponding maximum crack widths of 0.17 mm, 0.12 mm, and 0.12 mm, respectively.
The seam opening displacement of the lining is a key parameter in the design of segmented lining structures. Excessive seam openings may reduce the sealing performance of the underground working. In contrast, insufficient seam openings may limit the self-supporting capacity of the surrounding rock. This can reduce the gas storage capacity of the working. Additionally, the opening displacement of a single seam should not be too large, as it could increase the complexity of sealing the seam. Therefore, it is essential to study the seam opening displacement under high internal pressure conditions.
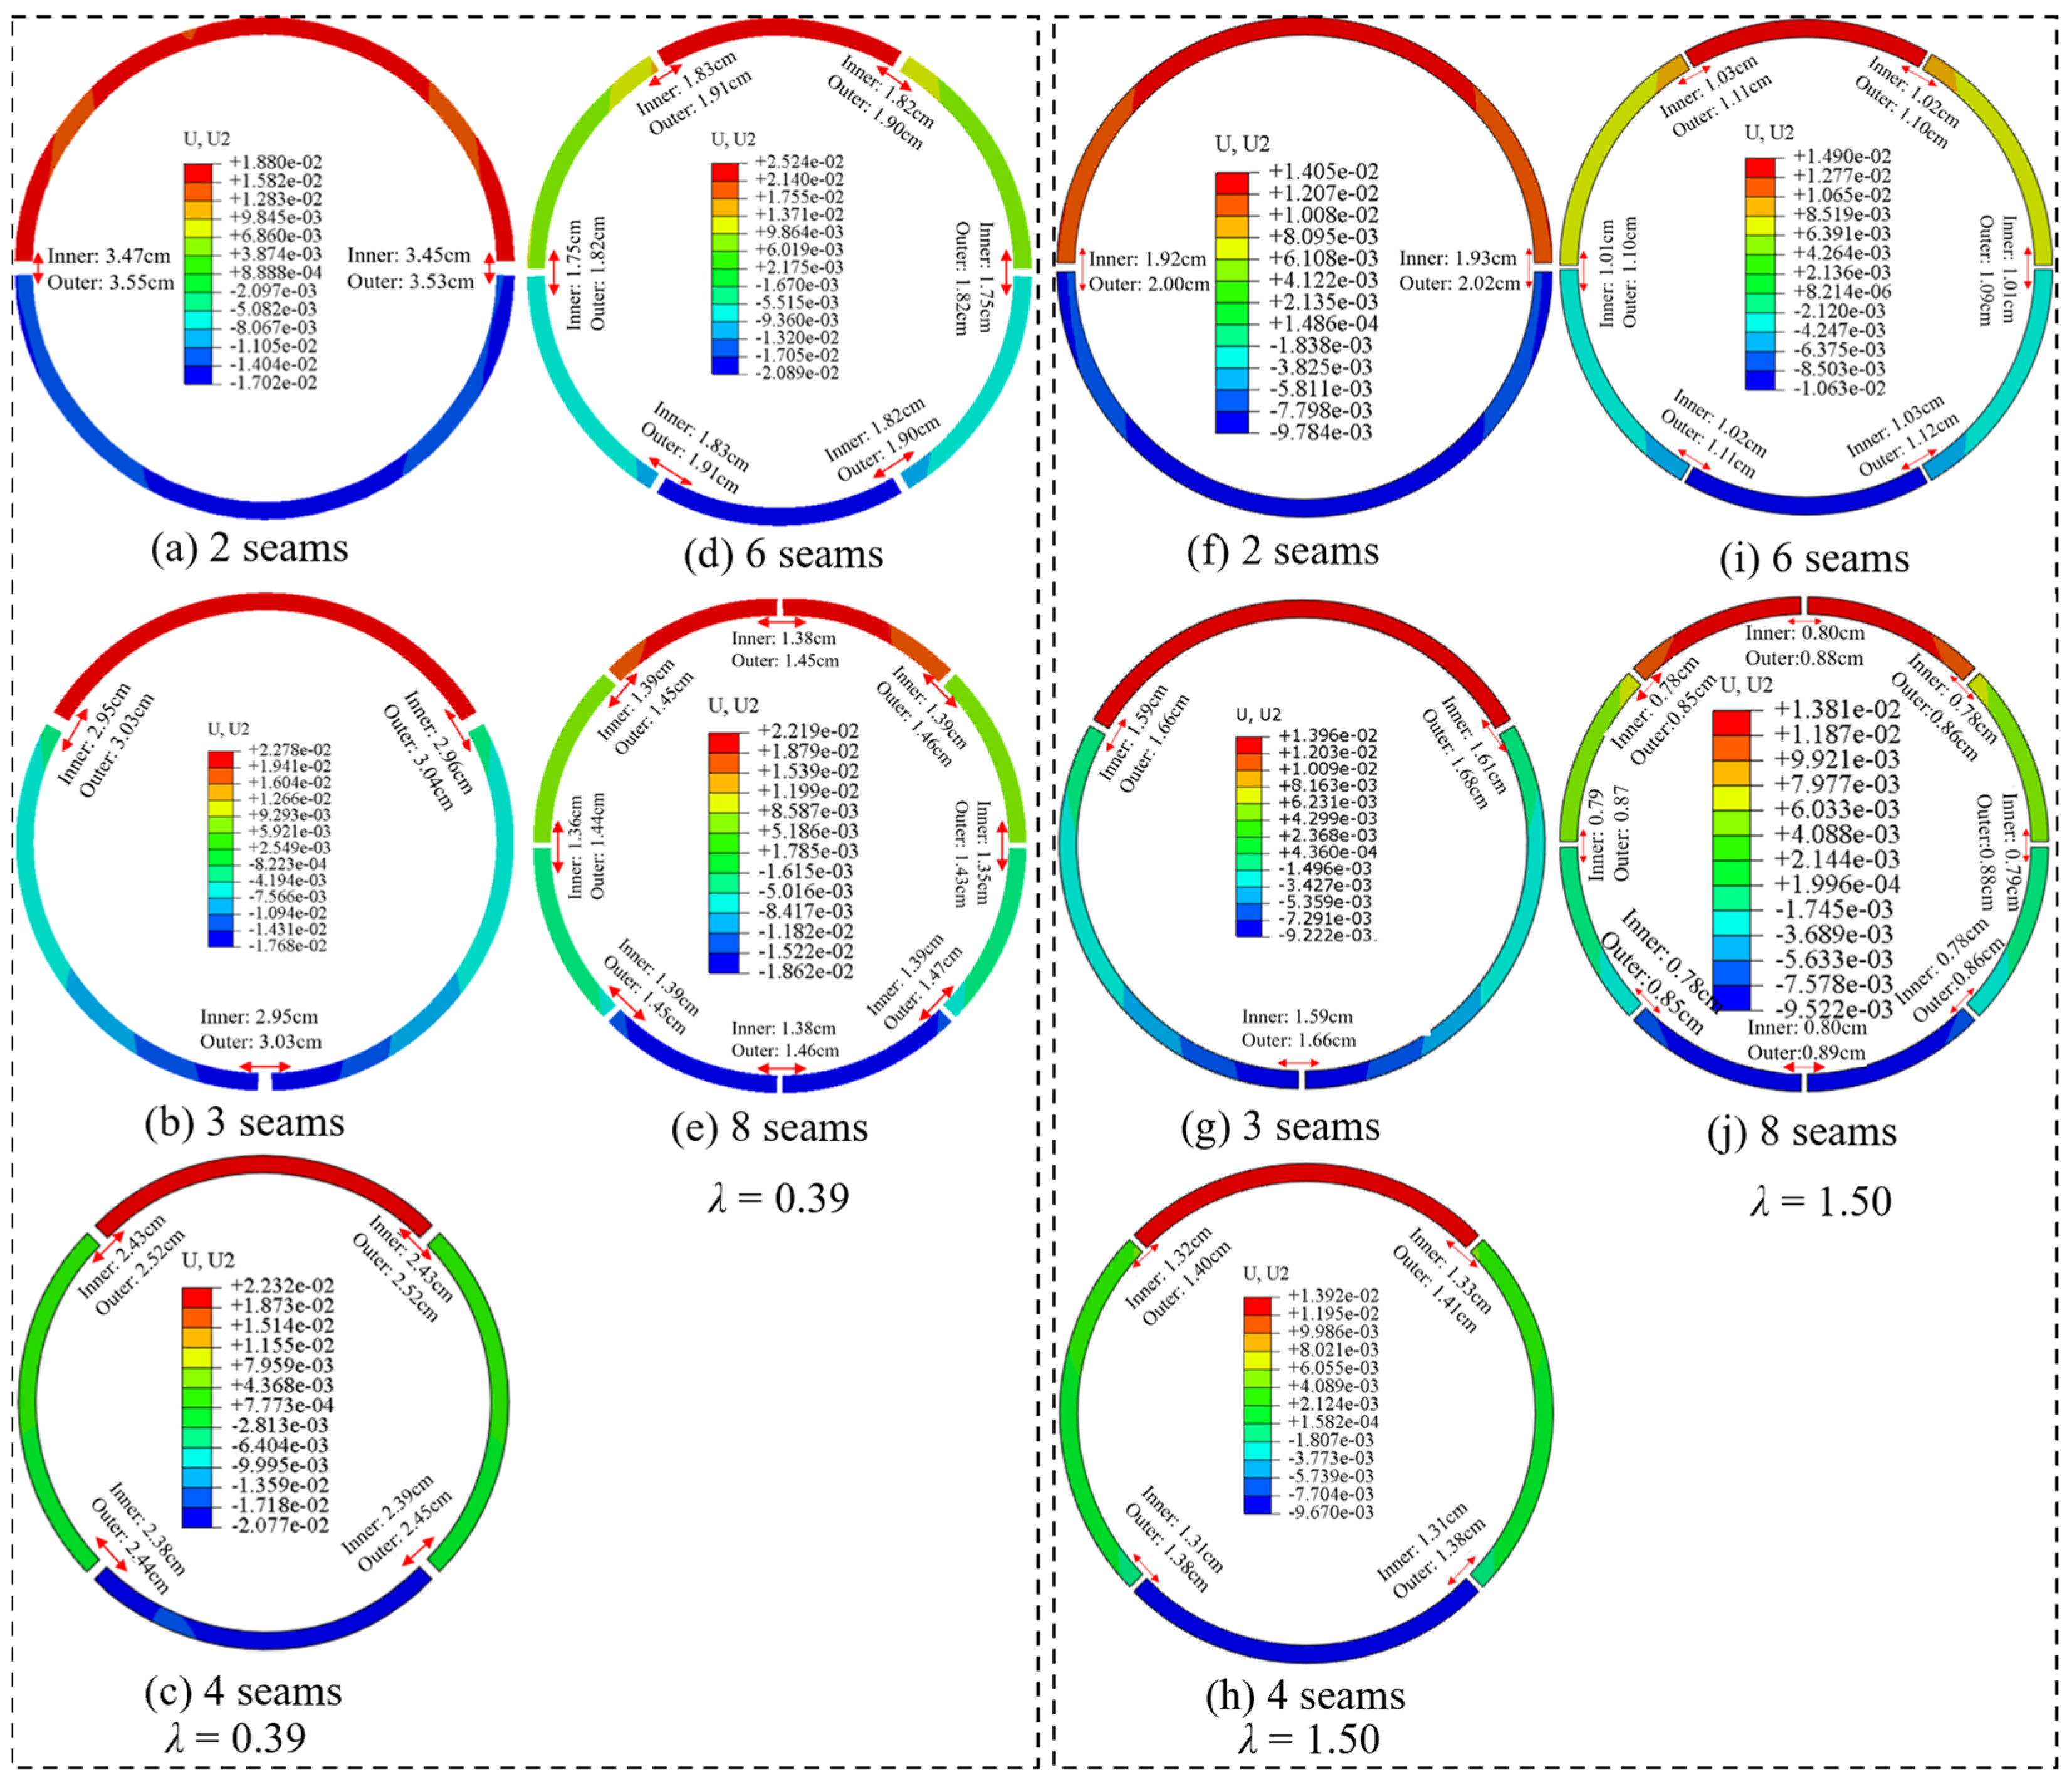
Figure 12 shows the calculated seam opening displacements of the lining for different numbers of preset seams. It can be observed that with two preset seams, the seam opening displacement at the inner side of a single lining reaches 3.47 cm. As the number of preset seams increases, the seam opening displacement at the inner side of a single lining decreases to below 2.00 cm. Furthermore, as the number of preset seams increases, the total seam opening displacement of the lining increases.
Increasing the number of preset seams effectively alleviates the excessive tensile stress in the reinforcement at the far end of the seams and reduces the lining damage factor. Additionally, the total seam opening displacement of the lining increases, which better facilitates the release of radial displacement and maximizes the self-supporting capacity of the surrounding rock. When six or eight preset seams are used, the SDEG of the lining is only around 30%, and the maximum crack width under high internal pressure is just 0.12 mm. This demonstrates that using six or eight preset seams meets the design requirements for the segmented lining structure. Considering both construction costs and technical difficulty, the optimal solution is to use six seams.

4.3.2. Lateral Pressure Coefficient Greater than One

Figure 10 and Figure 12 compare the SDEG and seam opening displacements of the lining for different preset seam configurations when λ = 1.50. These configurations include zero, two, three, four, six, and eight preset seams. For the monolithic cast concrete lining, diffuse cracking is still observed. In contrast, the damage factor within a 15° range at the seams of the segmented lining approaches zero. The SDEG at the far end of the lining is further reduced compared to the case when λ < 1, and crack formation also improves. When λ > 1, the horizontal compressive stress on the lining increases, and cracks tend to concentrate near the crown. Additionally, both the single seam opening displacement and total seam opening displacement decrease significantly compared to the case where λ < 1.
The reinforcement stress and the maximum crack widths of the lining for each configuration are shown in Figure 11 and Figure 13. It can be observed that the reinforcement stress for all preset seam configurations is below 200 MPa, and the corresponding maximum crack width of the lining is less than the design code limit of 0.3 mm. The maximum tensile stress significantly decreases compared to the case when λ > 1. For configurations with four, six, and eight preset seams, the maximum tensile stress in the reinforcement does not differ greatly. However, when six or eight preset seams are used, the reduction in the overall quality of the lining results in a slight increase in the maximum tensile stress in the reinforcement. Therefore, considering the SDEG of the lining and the maximum tensile stress of the reinforcement for different preset seam configurations, four, six, and eight preset seams meet the design requirements when λ > 1. Additionally, it can be observed that increasing the lateral pressure coefficient positively affects the lining’s performance, and under higher lateral pressure coefficients, reducing the number of preset seams can still satisfy the design requirements.

4.4. Design of Retractable Joints

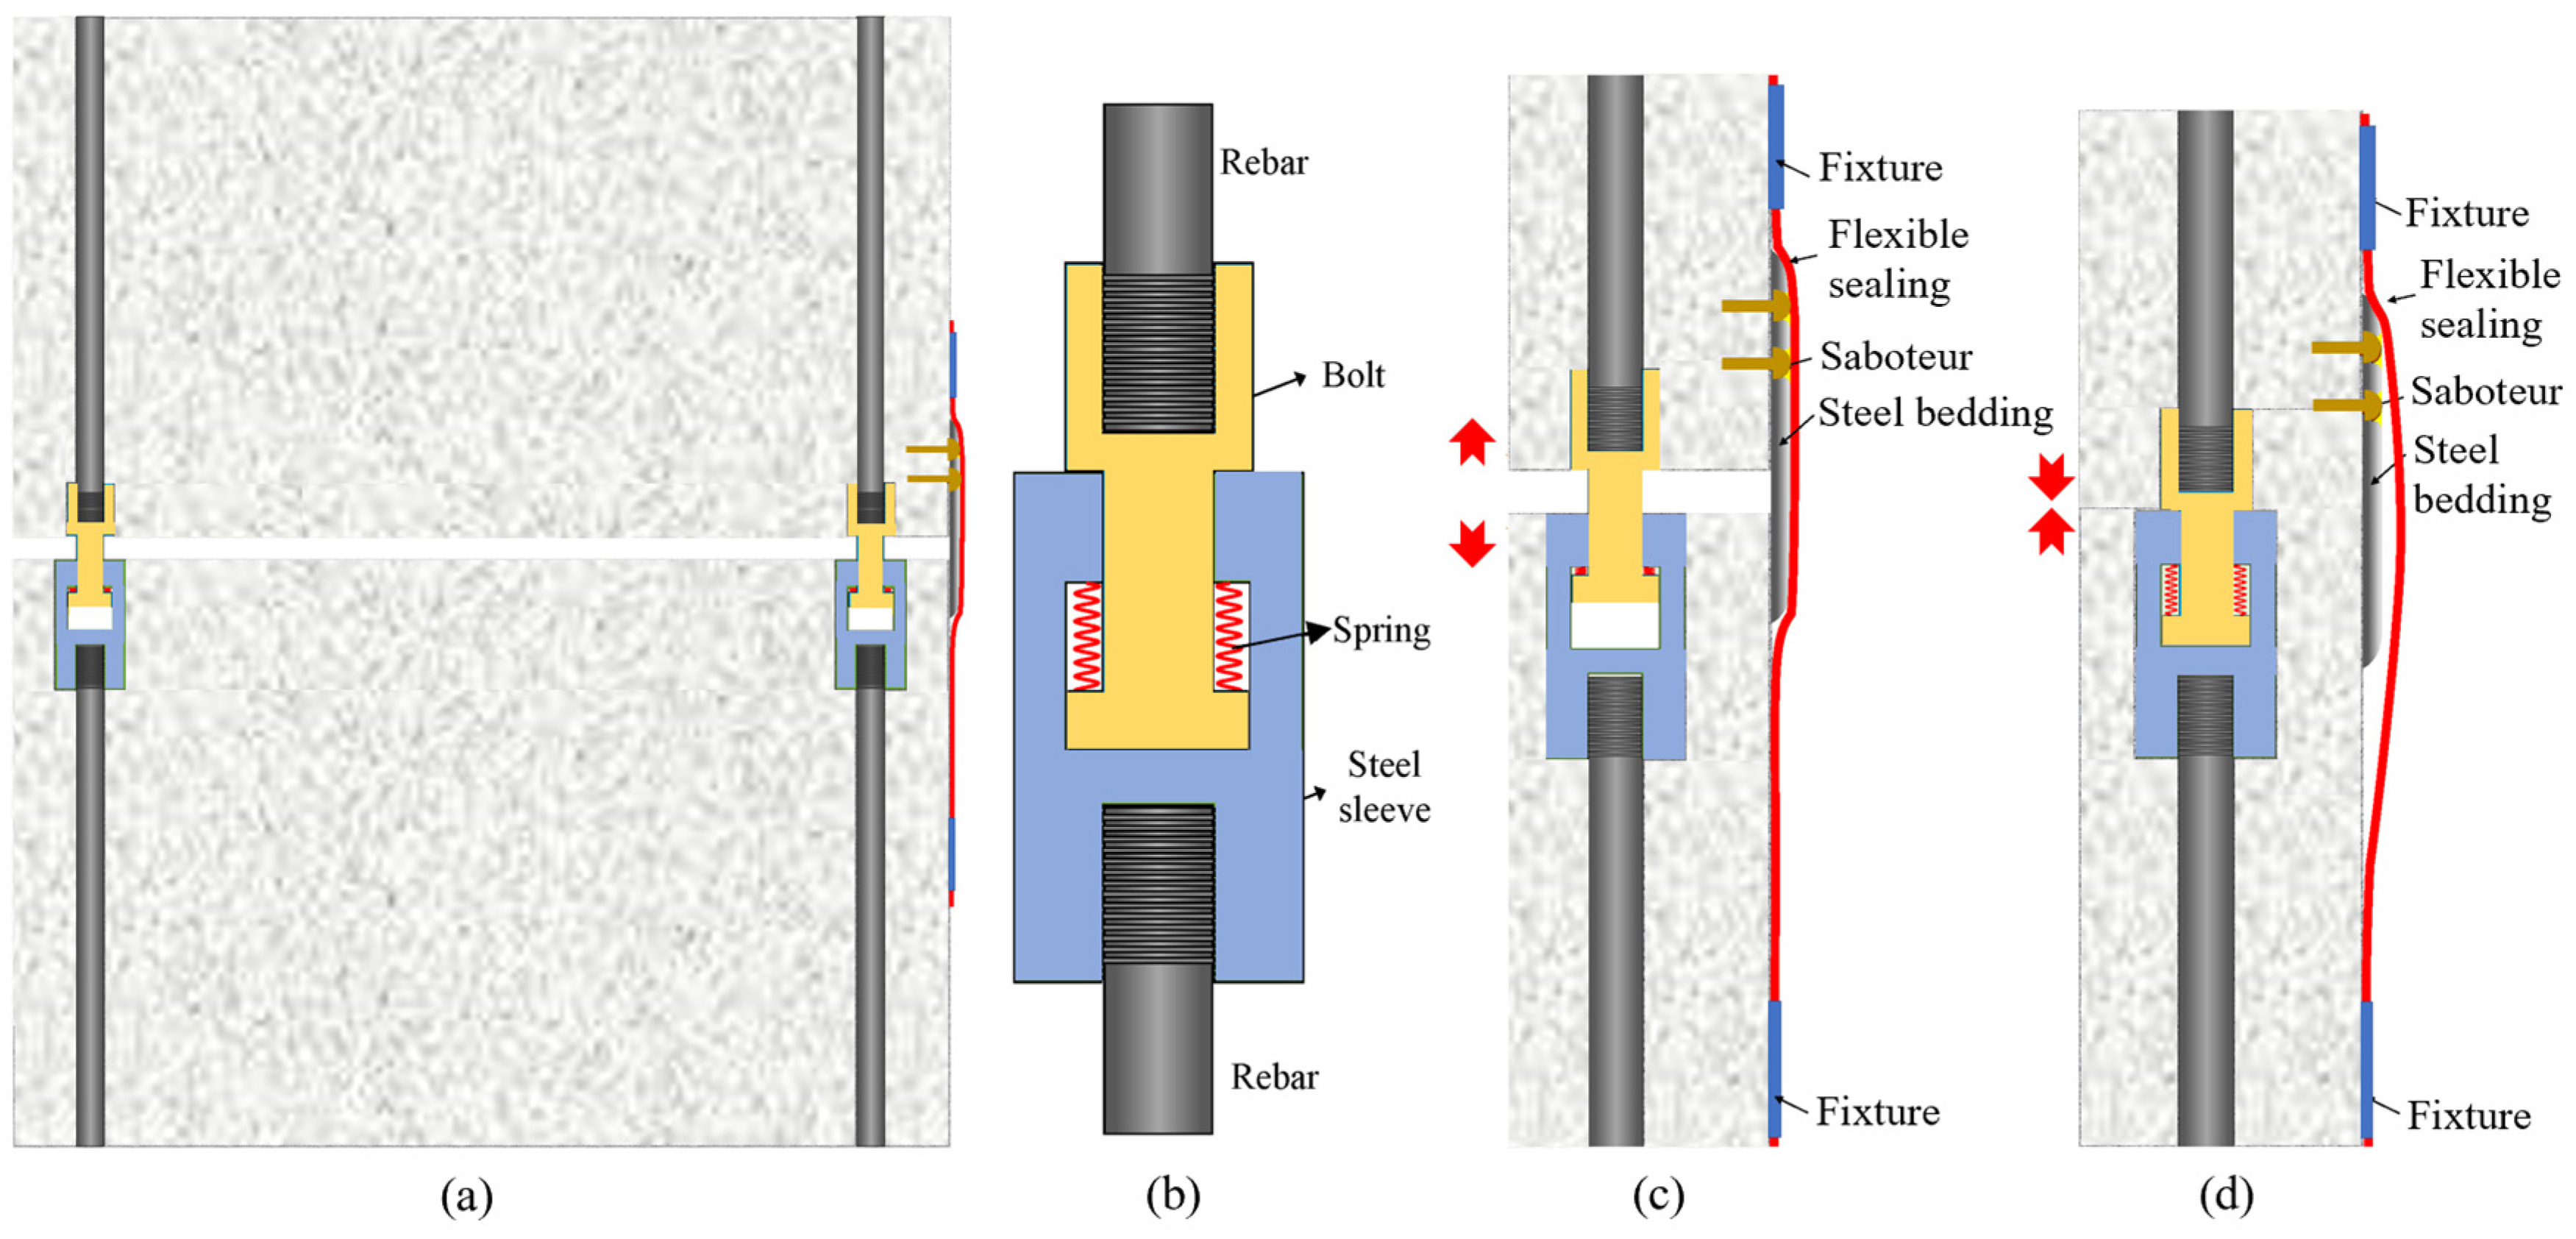
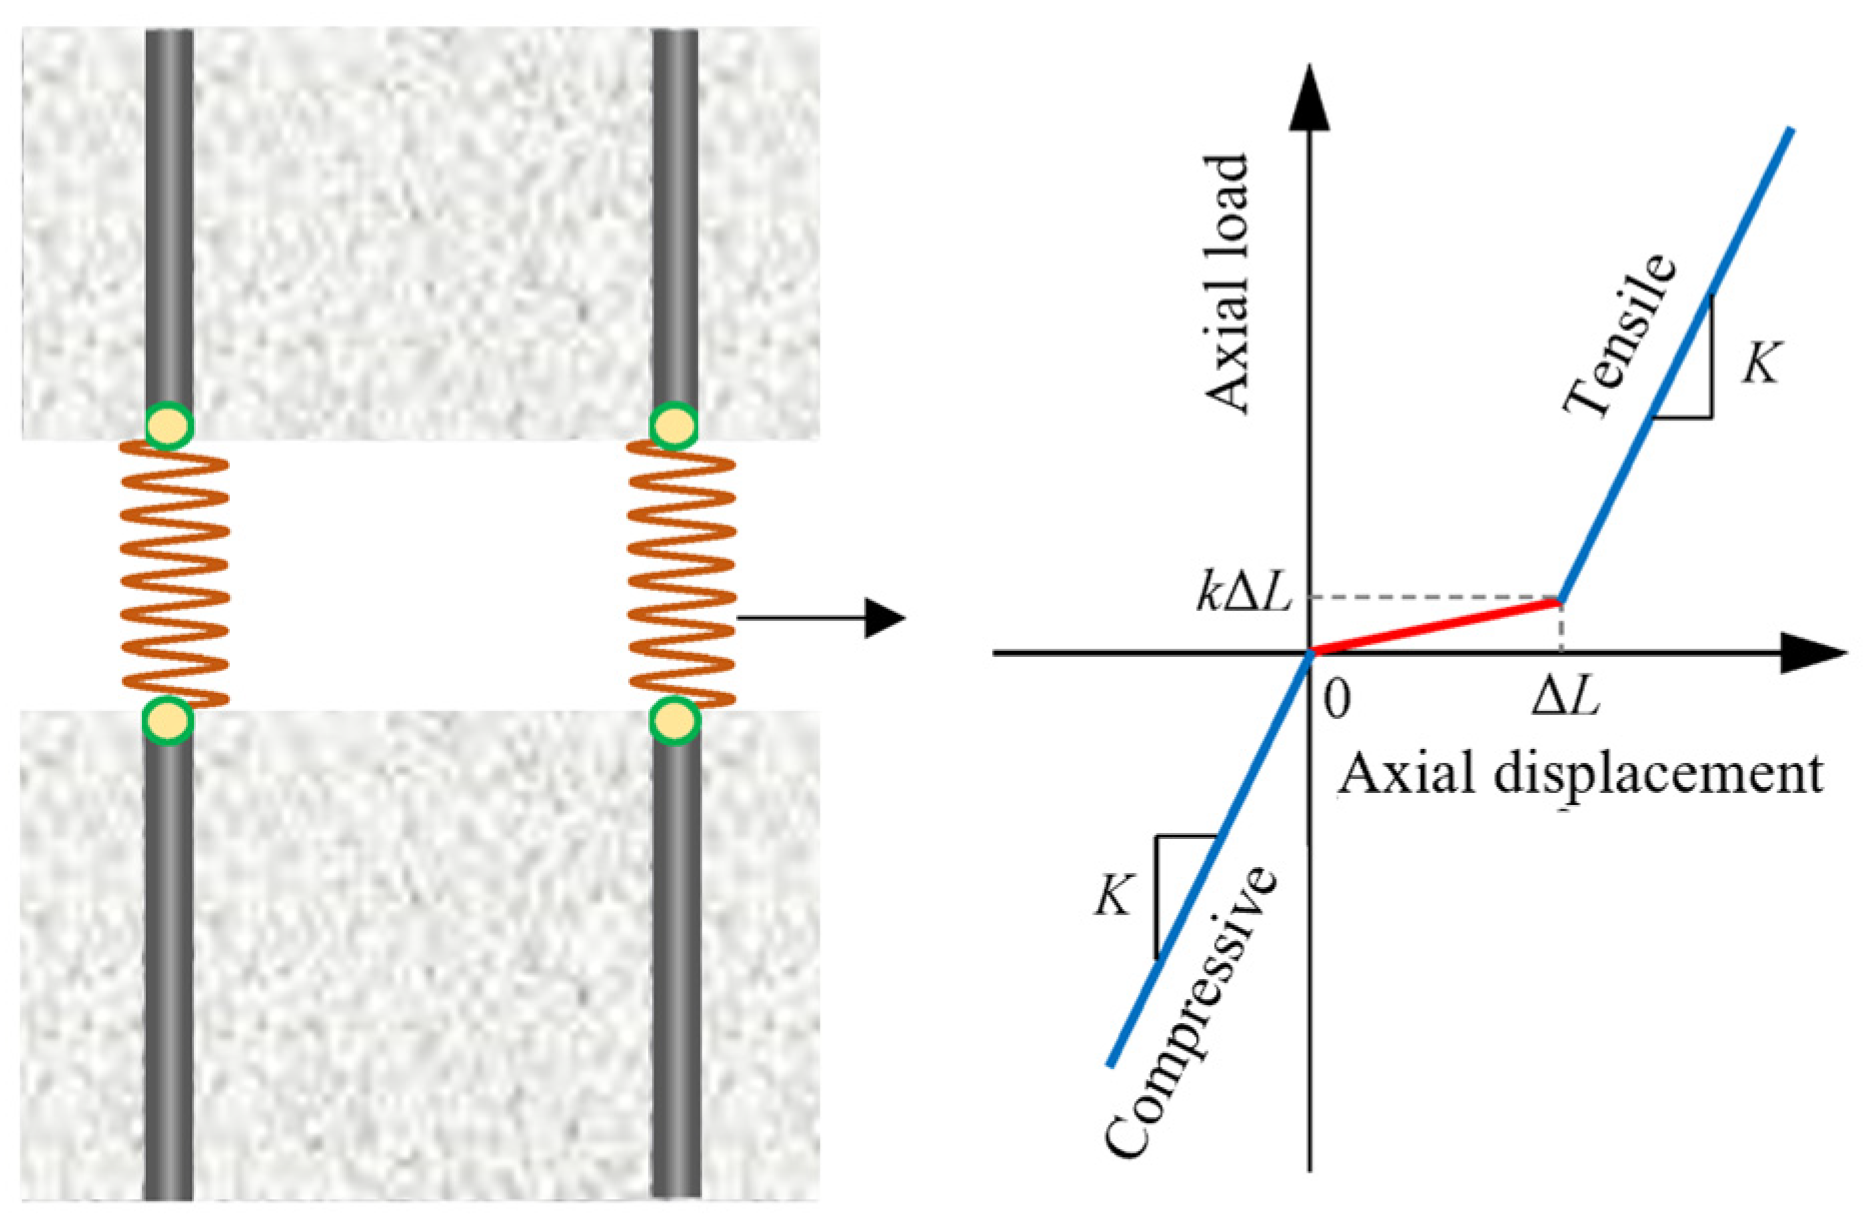
To reduce reinforcement stress and control joint opening, a segmented lining system with retractable joints was developed, as illustrated in Figure 14. The lining is composed of reinforced concrete segments connected by specially designed mechanical joints. These joints include bolts, steel sleeves, washers, and internal springs, which together allow for controlled elongation under pressure. The core of the retractable joint is a two-headed bolt with a narrowed central section. One end connects to rebar via internal threads; the other fits into a steel sleeve joined by a spring. As the bolt elongates under internal pressure, the spring compresses and absorbs deformation. A mechanical stopper limits the movement, ensuring that the maximum elongation does not exceed ΔL, as shown in Figure 15.
These joints are prefabricated and assembled by threading them into the steel reinforcement before concrete casting. One segment embeds the bolt; the adjacent one houses the sleeve, with a gap between segments. When the internal pressure increases, the seams open, activating the joint system to release strain. This prevents excessive tensile stress in the reinforcement and limits concrete cracking. Although increasing the number of joints reduces stress and joint opening, it also weakens structural continuity. The top segment is especially prone to damage. The retractable joint system addresses this trade-off by balancing flexibility and structural stability.
The rebar joints are represented using nonlinear spring elements. The axial load–displacement relationship follows a three-stage curve. During tension, the joint first behaves like a soft spring with stiffness ks. This continues until the deformation reaches a threshold value ΔL corresponding to the full compression of the internal spring. Beyond this point, both the sleeve and rebar begin to deform. In this stage, the stiffness increases and matches the axial stiffness of the steel bar, denoted as K. In compression, if the rebar remains elastic, the joint responds linearly with stiffness equal to K. Notably, the spring stiffness ks is much smaller than the steel bar’s axial stiffness K, making the system highly deformable in the initial stage.

4.5. Design of Reinforcement Ratio

Although the survey data indicate that the lateral pressure coefficient for this case is 0.9, the spatial variability of the rock mass means that it cannot be guaranteed that all strata in the area will have a lateral pressure coefficient of 0.9. From an engineering design perspective, a more conservative lateral pressure coefficient of λ = 0.39 should be used. After setting six preset seams with a maximum seam opening displacement of 1 cm, the design with a reinforcement ratio of 2.0% results in a maximum crack width that meets the crack control requirements. The design results are shown in Table 4
Table 4 compares the maximum reinforcement stress with and without retractable joints. With six preset seams, the maximum tensile stress in the inner reinforcement without retractable joints is 145.3 MPa, while the outer reinforcement has a maximum stress of 60.8 MPa. In the case of retractable joints, the maximum tensile stress in the inner reinforcement is 240.6 MPa, and in the outer reinforcement, it is 212.3 MPa. The use of retractable joints results in a slight increase in reinforcement stress compared to the structure without joints. However, the overall difference in stress levels remains small. This is because the joints at the seams help control circumferential displacement. Moreover, the reinforcement joints promote a more balanced stress distribution between the inner and outer layers. This suggests a reduction in bending moments and improved structural stability of the lining.

5. Discussion

This section examines the applicability of the segmented lining design method under varying elastic moduli of the surrounding rock and internal pressure. Table 5 lists a set of representative mechanical parameters for each rock mass grade. Taking a typical working with a burial depth of 200 m and an internal diameter of 10 m as an example, a reinforcement ratio of 3.0% is chosen. This ratio is selected because higher reinforcement ratios are difficult to construct and lack practical significance.

5.1. Maximum Crack Width of the Lining

Figure 16a illustrates the elastic modulus and gas pressure ranges where the crack control requirements are satisfied. The vertical and diagonal shaded areas represent the applicable regions for monolithic and segmented linings, respectively. Under strict crack control with a maximum crack width limit of 0.3 mm, the required elastic modulus of the surrounding rock increases sharply as the internal pressure gradually increases. This indicates a nonlinear relationship between internal pressure and rock mass elasticity when using the maximum crack width as the limiting factor. Higher internal pressure leads to increasingly stringent rock mass requirements. Notably, when the maximum storage pressure exceeds 12 MPa, very few surrounding rock conditions are suitable to meet the crack control requirements for the monolithic lining.
However, when two preset seams are used, the required elastic modulus of the surrounding rock is reduced to 4.5 GPa to ensure that the lining meets the crack control criteria. This provides essential support for constructing CAES workings with pressures exceeding 12 MPa in the surrounding rock of fair to extremely hard quality. Therefore, it is recommended that when designing a monolithic lining structure with crack control, the maximum storage pressure should not exceed 12 MPa. For segmented lining structures with two preset seams, the maximum pressure in fair-quality rock mass should not exceed 15 MPa. Higher pressures can be designed for better-quality rock, with a maximum pressure of 17 MPa in extremely hard-quality rock mass. The use of preset seams in the lining significantly broadens the range of suitable rock conditions for meeting the crack control requirements under high internal air pressure.
In this study, the crack width limit of 0.3 mm was adopted based on the Design Specification for Hydraulic Concrete Structures [10]. This limit is primarily used to prevent water seepage through structural cracks. However, in CAES workings, water seepage is not a concern. The primary objective is to ensure the integrity of the sealing layer and avoid failure due to crack-induced deformation. As a result, the 0.3 mm limit is considered conservative for CAES applications. The allowable crack width in such cases can be relaxed to some extent. However, the appropriate upper limit remains under investigation. Determining this limit is one of the key targets of our ongoing research.

5.2. Maximum Seam Opening Displacement of the Lining

The maximum allowable seam opening displacement is a critical factor in the design of lining structures. An excessively large limit may cause sealing difficulties, while a very small limit can lead to significant increases in economic costs. Figure 16b shows the range of the elastic modulus and gas pressures for which the maximum seam opening displacement satisfies the limits of Dmax ≤ 1 cm, Dmax ≤ 2 cm, and Dmax ≤ 3 cm. It is clear that, when the maximum seam opening displacement is used as the control standard, there is a nonlinear relationship between the internal pressure and the surrounding rock modulus. Higher internal pressure results in much stricter rock conditions. Under constant seam opening displacement limits, the required elastic modulus of the surrounding rock increases sharply as the internal pressure gradually rises. For medium-quality rock mass, to control the maximum seam opening displacement to no more than 2 cm, the maximum internal pressure should not exceed 12 MPa. For poor- to extremely poor-quality rock mass, pressures below 8 MPa would also cause the maximum seam opening displacement to exceed 3 cm. In the rock mass of poor quality or worse, the maximum internal pressure should not exceed 6 MPa. For extremely hard rock mass, to meet the requirement of a maximum seam opening displacement of 2 cm, the internal pressure can reach up to 21 MPa.
Smaller limits for seam displacement result in more stringent rock conditions for high-pressure workings. Even with larger seam opening displacement limits, high-pressure workings cannot be constructed in rock masses of fair to extremely poor quality. The maximum allowable seam displacement should be reasonably chosen based on the specific engineering conditions, as larger allowable displacements present sealing challenges.

5.3. Generalizability of the Proposed Method

This method is developed for circular underground workings with flexible sealing layers. However, it can be extended to other cases:
(1) The proposed method is also applicable to non-circular geometries, such as horseshoe or elliptical tunnels. These shapes often perform better under high internal pressure. By adjusting the ratio between the major and minor axes of the cross-section, the stress distribution can be better aligned with the in situ stress field. This allows the structure to more effectively utilize the surrounding rock’s confinement. As a result, applying this method to such geometries would be conservative and structurally safe.
(2) In practice, storage involves cyclic loading. The surrounding rock may accumulate residual deformation. This may enlarge seam openings and cause retractable joint failure. Future work should study joint behavior under repeated loading and damaged conditions.
(3) The design fits well with prefabricated rubber sealing layers. These materials offer high tensile strength and good deformation capacity. As long as they resist leakage and aging, they are suitable for use in underground workings with segmented linings for CAES.

6. Conclusions

This study addresses the inability of monolithic reinforced concrete linings to meet the crack control requirements under high internal pressure by improving the lining structure. A new lining structure design was proposed, and its application in engineering was explored through laboratory tests and numerical simulations. The main findings are summarized as follows:
(1) Based on the calculation formula for the maximum crack width of hydraulic tunnel linings, a design method for segmented linings with retractable seams was proposed. This method takes into account the shear mechanical properties of the sliding layer, which were determined through laboratory tests, as well as the plasticity of the lining damage. The reliability of the method was verified by comparing it with results from a typical pressure pipeline model test.
(2) The increase in the number of preset seams helps to expand the improvement effect. As the number of preset seams increases, the range of improvement in the lining’s performance also expands. The opening displacement of individual seams decreases, while the total seam opening displacement increases, allowing the lining to release more radial displacement. This effectively reduces the reinforcement stress and damage factor at the far end of the seams. However, the increase in the number of preset seams also leads to higher construction difficulty and costs, so the minimum number of seams should be used to meet the performance requirements.
(3) Within the lateral pressure coefficient range for the specific engineering case studied, an increase in the lateral pressure coefficient has a positive impact on the lining’s safety. As the lateral pressure coefficient increases, the maximum tensile stress in the reinforcement and the areas with higher damage in the lining gradually concentrate near the crown. By appropriately reducing the number of preset seams, both the design requirements for the segmented lining and the construction difficulty and cost can be minimized. For the case studied, when the lateral pressure coefficient is less than one, the maximum tensile stress in the reinforcement and the lining damage factor decrease as the number of preset seams increases. Considering construction costs and technical difficulty, the optimal configuration is six preset seams. When the lateral pressure coefficient exceeds one, four preset seams are the most suitable solution.
(4) The design of retractable joints and reinforcement ratios was carried out for a typical case. The results showed that the reinforcement stress in segmented linings with retractable joints was slightly higher than in those without them. However, the use of rebar joints led to a more uniform stress distribution in both the inner and outer reinforcement bars. This indicates reduced bending moments and improved structural integrity of the lining.
(5) For a typical case with a working internal diameter of 10 m and a reinforcement ratio of 3%, the applicability of the segmented lining design method was determined. When the storage pressure exceeds 12 MPa, nearly no suitable surrounding rock meets the crack control requirements for monolithic linings. However, by using the segmented lining, the lining can meet crack control requirements as long as the surrounding rock’s elastic modulus exceeds 4.5 GPa. The maximum crack width and maximum seam opening displacement have the most significant impact on the lining’s load-bearing capacity. This research provides important support for the construction of CAES workings with internal pressures exceeding 12 MPa in the surrounding rock of fair to extremely hard quality, thereby expanding the potential scope for CAES working construction.

Author Contributions

S.W.: writing—original draft, software, methodology, investigation, and validation. M.G.: methodology and writing—review and editing. C.X.: supervision, funding acquisition, and conceptualization. All authors have read and agreed to the published version of the manuscript.

Funding

The authors acknowledge the support from the National Key Research and Development Program “Intergovernmental International Science and Technology Innovation Cooperation” of China (No. 2024YFE0105800), the National Natural Science Foundation of China (Nos. U23B20145 and 52278402), and the POWERCHINA Key Research Project (No. DJ-HXGG-2023-09).

Institutional Review Board Statement

Not applicable.

Informed Consent Statement

Not applicable.

Data Availability Statement

The original contributions presented in this study are included in the article. Further inquiries can be directed to the corresponding authors.

Conflicts of Interest

The authors declare that they have no known competing financial interests or personal relationships that could have appeared to influence the work reported in this study.

References

  1. Zhou, A.; Li, P.; Fan, L.; Yi, Z.; Tang, X.; Fei, W. Influence of drainage system on the stability of underground CAES gas storage under different lateral pressure coefficients. Tunn. Undergr. Space Technol. 2025, 159, 106444. [Google Scholar] [CrossRef]
  2. Prado, L.Á.D.; Menéndez, J.; Bernardo-Sánchez, A.; Galdo, M.; Loredo, J.; Fernández-Oro, J.M. Thermodynamic analysis of compressed air energy storage (CAES) reservoirs in abandoned mines using different sealing layers. Appl. Sci. 2021, 11, 2573. [Google Scholar] [CrossRef]
  3. Liang, W.; Yang, D.; Bian, H. Mechanical properties of rubber sealing material in lined rock cavern for compressed air energy storage considering thermo-mechanical coupling effect. Constr. Build. Mater. 2025, 458, 139494. [Google Scholar] [CrossRef]
  4. Yang, X.; Jiang, Z.; Shi, Z.; Mao, Q.; Liao, J.; Tian, X. Mechanical performance of polyurethane polymer mortar—A novel sealing material for CAES man-made caverns. J. Energy Storage 2025, 106, 114845. [Google Scholar] [CrossRef]
  5. Qin, S.; Xia, C.; Zhou, S. Air tightness of compressed air storage energy caverns with polymer sealing layer subjected to various air pressures. J. Rock Mech. Geotech. Eng. 2023, 15, 2105–2116. [Google Scholar] [CrossRef]
  6. Damasceno, D.R.; Spross, J.; Johansson, F. Rock mass response for lined rock caverns subjected to high internal gas pressure. J. Rock Mech. Geotech. Eng. 2023, 15, 119–129. [Google Scholar] [CrossRef]
  7. Liu, X.; Yang, J.; Yang, C.; Zhang, Z.; Chen, W. Numerical simulation on cavern support of compressed air energy storage (CAES) considering thermo-mechanical coupling effect. Energy 2023, 282, 128916. [Google Scholar] [CrossRef]
  8. Shatskyi, I.P.; Makoviichuk, M.V.; Shcherbii, A.B. Equilibrium of cracked shell with flexible coating. In Shell Structures: Theory and Applications; CRC Press: Boca Raton, FL, USA, 2017; Volume 4, pp. 165–168. [Google Scholar]
  9. Shatskyi, I.P.; Makoviichuk, M.V.; Shcherbii, A.B. Influence of flexible coating on the limit equilibrium of a spherical shell with meridional crack. Mater. Sci. 2020, 55, 484–491. [Google Scholar] [CrossRef]
  10. PCNECL. Design Specification for Hydraulic Concrete Structures; China Water and Power Press: Beijing, China, 2009. [Google Scholar]
  11. Li, P.; Kang, H.; Zhu, Q.; Wu, Y.; Zhang, J.; Fan, L.; Wang, Z. Numerical and experimental investigations of concrete lined compressed air energy storage system. J. Clean. Prod. 2023, 390, 136153. [Google Scholar] [CrossRef]
  12. Yu, Z.; Shen, S.; Li, M.; Zhang, M.; Tian, L.; Hua, G. An improved rock damage model from a cyclic temperature–triaxial loading experiment for compressed air energy storage caverns. Eng. Geol. 2025, 344, 107857. [Google Scholar] [CrossRef]
  13. Aghababaei, F.; Sedaee, B. Underground compressed air energy storage (CAES) in naturally fractured depleted oil reservoir: Influence of fracture. Geoenergy Sci. Eng. 2025, 244, 213496. [Google Scholar] [CrossRef]
  14. Hu, B.; Yu, L.; Mi, X.; Xu, F.; Li, S.; Li, W.; Wei, C.; Zhang, T. Comparative analysis of thermodynamic and mechanical responses between underground hydrogen storage and compressed air energy storage in lined rock caverns. Int. J. Min. Sci. Technol. 2024, 34, 531–543. [Google Scholar] [CrossRef]
  15. Zhou, S.W.; Xia, C.C.; Zhao, H.B.; Mei, S.H.; Zhou, Y. Numerical simulation for the coupled thermo-mechanical performance of a lined rock cavern for underground compressed air energy storage. J. Geophys. Eng. 2017, 14, 1382–1398. [Google Scholar] [CrossRef]
  16. Wan, F.; Jiang, Z.; Tian, X.; Konietzky, H.; Xiao, Z. A thermo-hydro-mechanical damage model for lined rock cavern for compressed air energy storage. J. Energy Storage 2024, 78, 110186. [Google Scholar] [CrossRef]
  17. Monte, F.L.; Harmon, J.; Andrade, J.; Ferrara, L. Fiber-Reinforced Concrete for an Innovative Energy Storage Plant: From the Experimental Investigation to the Structural Design. In RILEM-fib International Symposium on Fibre Reinforced Concrete; Springer Nature: Cham, Switzerland, 2024; pp. 252–259. [Google Scholar]
  18. Xiang, Y.; Zhang, G.; Wang, X.; Zhang, G.; Xiong, F.; Tang, Z.; Hua, D. Load-sharing characteristics of lined rock caverns of compressed air energy storage system: A theoretical analysis. Appl. Energy 2025, 388, 125626. [Google Scholar] [CrossRef]
  19. Ma, Y.; Rao, Q.; Huang, D.; Liu, Z.; Yi, W.; Li, P. Gas-mechanical coupled crack initiation analysis for local air-leakage of compressed air energy storage (CAES) cavern with consideration of seepage effect. Theor. Appl. Fract. Mech. 2023, 125, 103827. [Google Scholar] [CrossRef]
  20. Li, Y.; Xue, P.; Liu, Y.; Wang, J.; Yin, W. Modeling underground performance of compressed air energy storage in a practical flat aquifer: Insights on the permeability effects. Energy 2025, 332, 135592. [Google Scholar] [CrossRef]
  21. Hori, M.; Goda, Y.; Onishi, H. Mechanical behaviour of surrounding rock mass and new lining structure of air-tight pressure cavern. In Proceedings of the 10th ISRM Congress, Sandton, South Africa, 8–12 September 2003; p. ISRM-10CONGRESS-2003-088. [Google Scholar]
  22. Ishihata, T. Underground compressed air storage facility for CAES-G/T power plant utilizing an airtight lining. News J. Int. Soc. Rock Mech. 1997, 5, 17–21. [Google Scholar]
  23. Nishimoto, Y.; Tobase, T.; Hori, M.; Sawada, T. In-situ chamber tests for underground compressed-air storage facilities. In Proceedings of the ISRM International Symposium—EUROCK 96, Turin, Italy, 2–5 September 1996; p. ISRM-EUROCK-1996-124. [Google Scholar]
  24. Gasanzade, F.; Bauer, S. Approximating coupled power plant and geostorage simulations for compressed air energy storage in porous media. Appl. Energy 2025, 380, 125070. [Google Scholar] [CrossRef]
  25. Wu, K.; Song, J.; Zheng, X.; Zhao, N.; Shao, Z.; Chu, Z. The deformation coordination-dominated design of yielding supports applied in large deformation tunnels. Acta Geotech. 2024, 19, 2499–2513. [Google Scholar] [CrossRef]
  26. Xu, C.; Zhang, G.; Xia, C.; Du, S. Mechanical behavior of a new segmented lining for underground rock caverns with high internal pressure. Comput. Geotech. 2024, 167, 106100. [Google Scholar] [CrossRef]
  27. Zhang, G.C.; Xu, C.; Xia, C.C. Mechanical properties of composite segmented lining for high-pressure gas storage cavern considering shear deformation. Comput. Geotech. 2024, 45, 3533–3544. [Google Scholar]
  28. Qiu, K.; Li, S.; Wang, Z.; Wan, Z.; Zhao, S. Research on influence patterns of fault activation on lining structures in lined rock caverns for underground hydrogen energy storage. Int. J. Hydrogen Energy 2024, 58, 605–620. [Google Scholar] [CrossRef]
  29. Zhang, D.M.; Zhou, W.D.; Bu, X.H.; Jiang, Y.; Jia, K.; Yang, G.H. Failure mechanism and stiffness degradation of double lining with inner R/FRC lining subjected to internal water pressure. Tunn. Undergr. Space Technol. 2022, 130, 104737. [Google Scholar] [CrossRef]
  30. Damasceno, D.R.; Spross, J.; Johansson, F. Effect of rock joints on lined rock caverns subjected to high internal gas pressure. J. Rock Mech. Geotech. Eng. 2023, 15, 1625–1635. [Google Scholar] [CrossRef]
  31. PCCECL. Code for Design of Hydraulic Tunnel; China Water and Power Press: Beijing, China, 2020. [Google Scholar]
  32. Yang, T.W. Research on Calculation Model of Crack Width of Steel Lined Reinforced Concrete Penstocks; Hubei University of Technology: Wuhan, China, 2020. [Google Scholar]
  33. JTG/T D70—2010; Design Guidelines for Highway Tunnels. China Communications Press: Beijing, China, 2010. (In Chinese)
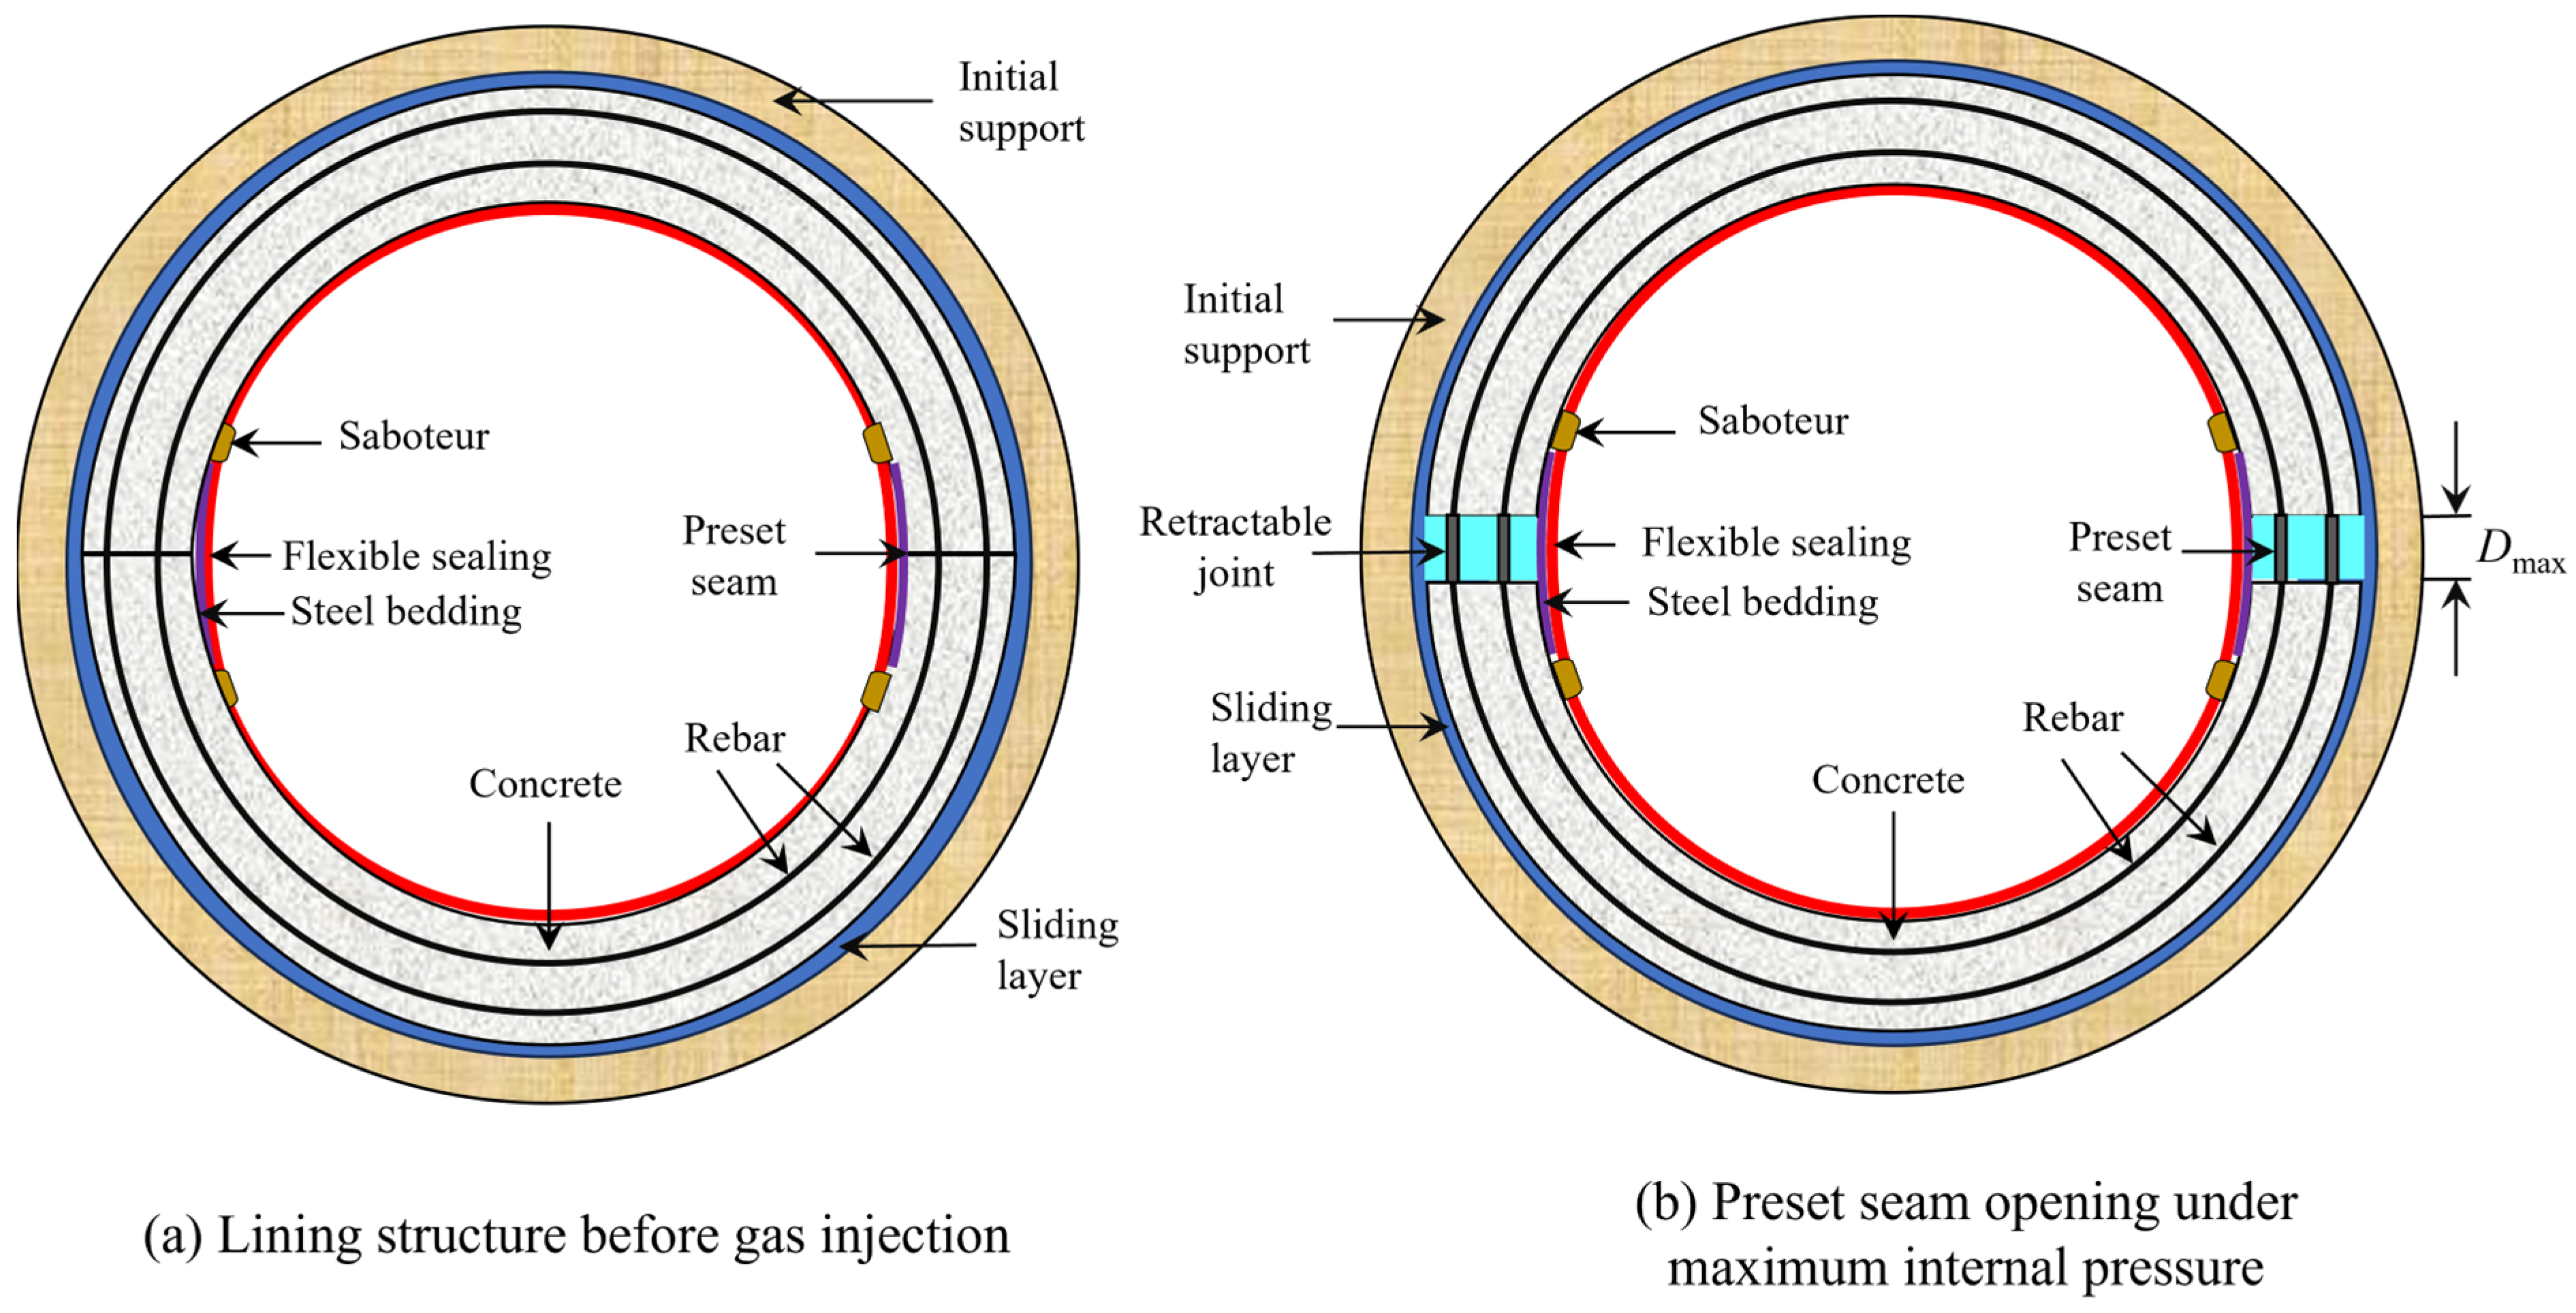
Figure 1. Structural components and working mechanism of the segmented lining.
Applsci 15 05782 g001
Figure 2. Modeling shear interaction in segmented lining systems: (a) force analysis of segmented lining, (b) extracted unit segment, and (c) mechanical behavior of sliding layers.
Applsci 15 05782 g002
Figure 3. Configuration of the shear test for sliding layers.
Applsci 15 05782 g003
Figure 4. Shear curve of each material under a normal load of 10 MPa.
Applsci 15 05782 g004
Figure 5. Numerical simulation process of the CAES working.
Applsci 15 05782 g005
Figure 6. Flowchart of the design process for the segmented lining.
Applsci 15 05782 g006
Figure 7. Reinforced concrete pressure pipeline [30].
Applsci 15 05782 g007
Figure 8. Crack pattern of the pipeline [30].
Applsci 15 05782 g008
Figure 9. Vertical displacement and maximum principal strain of the surrounding rock after excavation and during operation.
Applsci 15 05782 g009
Figure 10. Total damage (SDEG) of the lining for different numbers of preset seams ((af), λ = 0.39; (gl), λ = 1.50).
Applsci 15 05782 g010
Figure 11. Rebar stress for different numbers of preset seams.
Applsci 15 05782 g011
Figure 12. Comparison of seam openings for varying preset seams ((ae), λ = 0.39; (fj) λ = 1.50).
Applsci 15 05782 g012
Figure 13. Maximum crack width of the lining with varying preset seams.
Applsci 15 05782 g013
Figure 14. Configuration of the segmented lining: (a) the preset seam; (b) retractable joints; (c) the state of the joint when the working is inflated; (d) the state of the joint when the working is deflated.
Applsci 15 05782 g014
Figure 15. Load–displacement relationship of the joints.
Applsci 15 05782 g015
Figure 16. Relationship between internal pressure and the rock mass grade: (a) different lining types and (b) different preset seam opening displacements.
Applsci 15 05782 g016
Table 1. Parameters of concrete.
αcαtfc,r/MPaft,r/MPaεc,r/10−3εt,r/10−5
1.941.2519.11.711.799.5
Table 2. Interfacial shear stiffness of different material types.
Material TypesPlain AsphaltGeotextile-Reinforced AsphaltModified Asphalt CementWaterborne PolyurethaneNo Sliding Layer
Shear stiffness Kn (MPa·m−1)33.118.22.698.5943.2
Table 3. Interfacial shear stiffness of plain asphalt under different normal stresses.
Normal Stresses (MPa)8101215
Shear stiffness Kn (MPa·m−1)20.133.1118.2147.3
Table 4. Lining reinforcement ratio design results.
Retractable JointMaximum Stress in Inner Reinforcement (MPa)Maximum Stress in Outer Reinforcement (MPa)Maximum Crack Width of Linings (mm)Maximum Seam Opening Displacement (cm)Reinforcement RatioReinforcement Design
Without joints145.360.80.121.912.0%Inner:
Φ25@100 mm
Outer:
Φ25@100 mm
With joints240.6212.30.271.002.0%Inner:
Φ25@100 mm
Outer:
Φ25@100 mm
Table 5. Mechanical parameters of surrounding rocks with different quality grades [33].
Rock QualityElastic Modulus (GPa)Cohesion (MPa)Friction Angle (°)Density (kg/m3)Poisson’s Ratio
Extremely hard34.02.26128000.19
Very hard25.01.85527000.23
Hard15.01.34725000.25
Medium quality9.00.94124000.28
Fair5.00.63723000.30
Poor3.00.43322000.32
Very poor2.00.32821000.34
Extremely poor1.30.22220000.35
Disclaimer/Publisher’s Note: The statements, opinions and data contained in all publications are solely those of the individual author(s) and contributor(s) and not of MDPI and/or the editor(s). MDPI and/or the editor(s) disclaim responsibility for any injury to people or property resulting from any ideas, methods, instructions or products referred to in the content.