
Development of an In-Line Vision-Based Measurement System for Shape and Size Calculation of Cross-Cutting Boards—Straightening Process Case

Abstract
1. Introduction
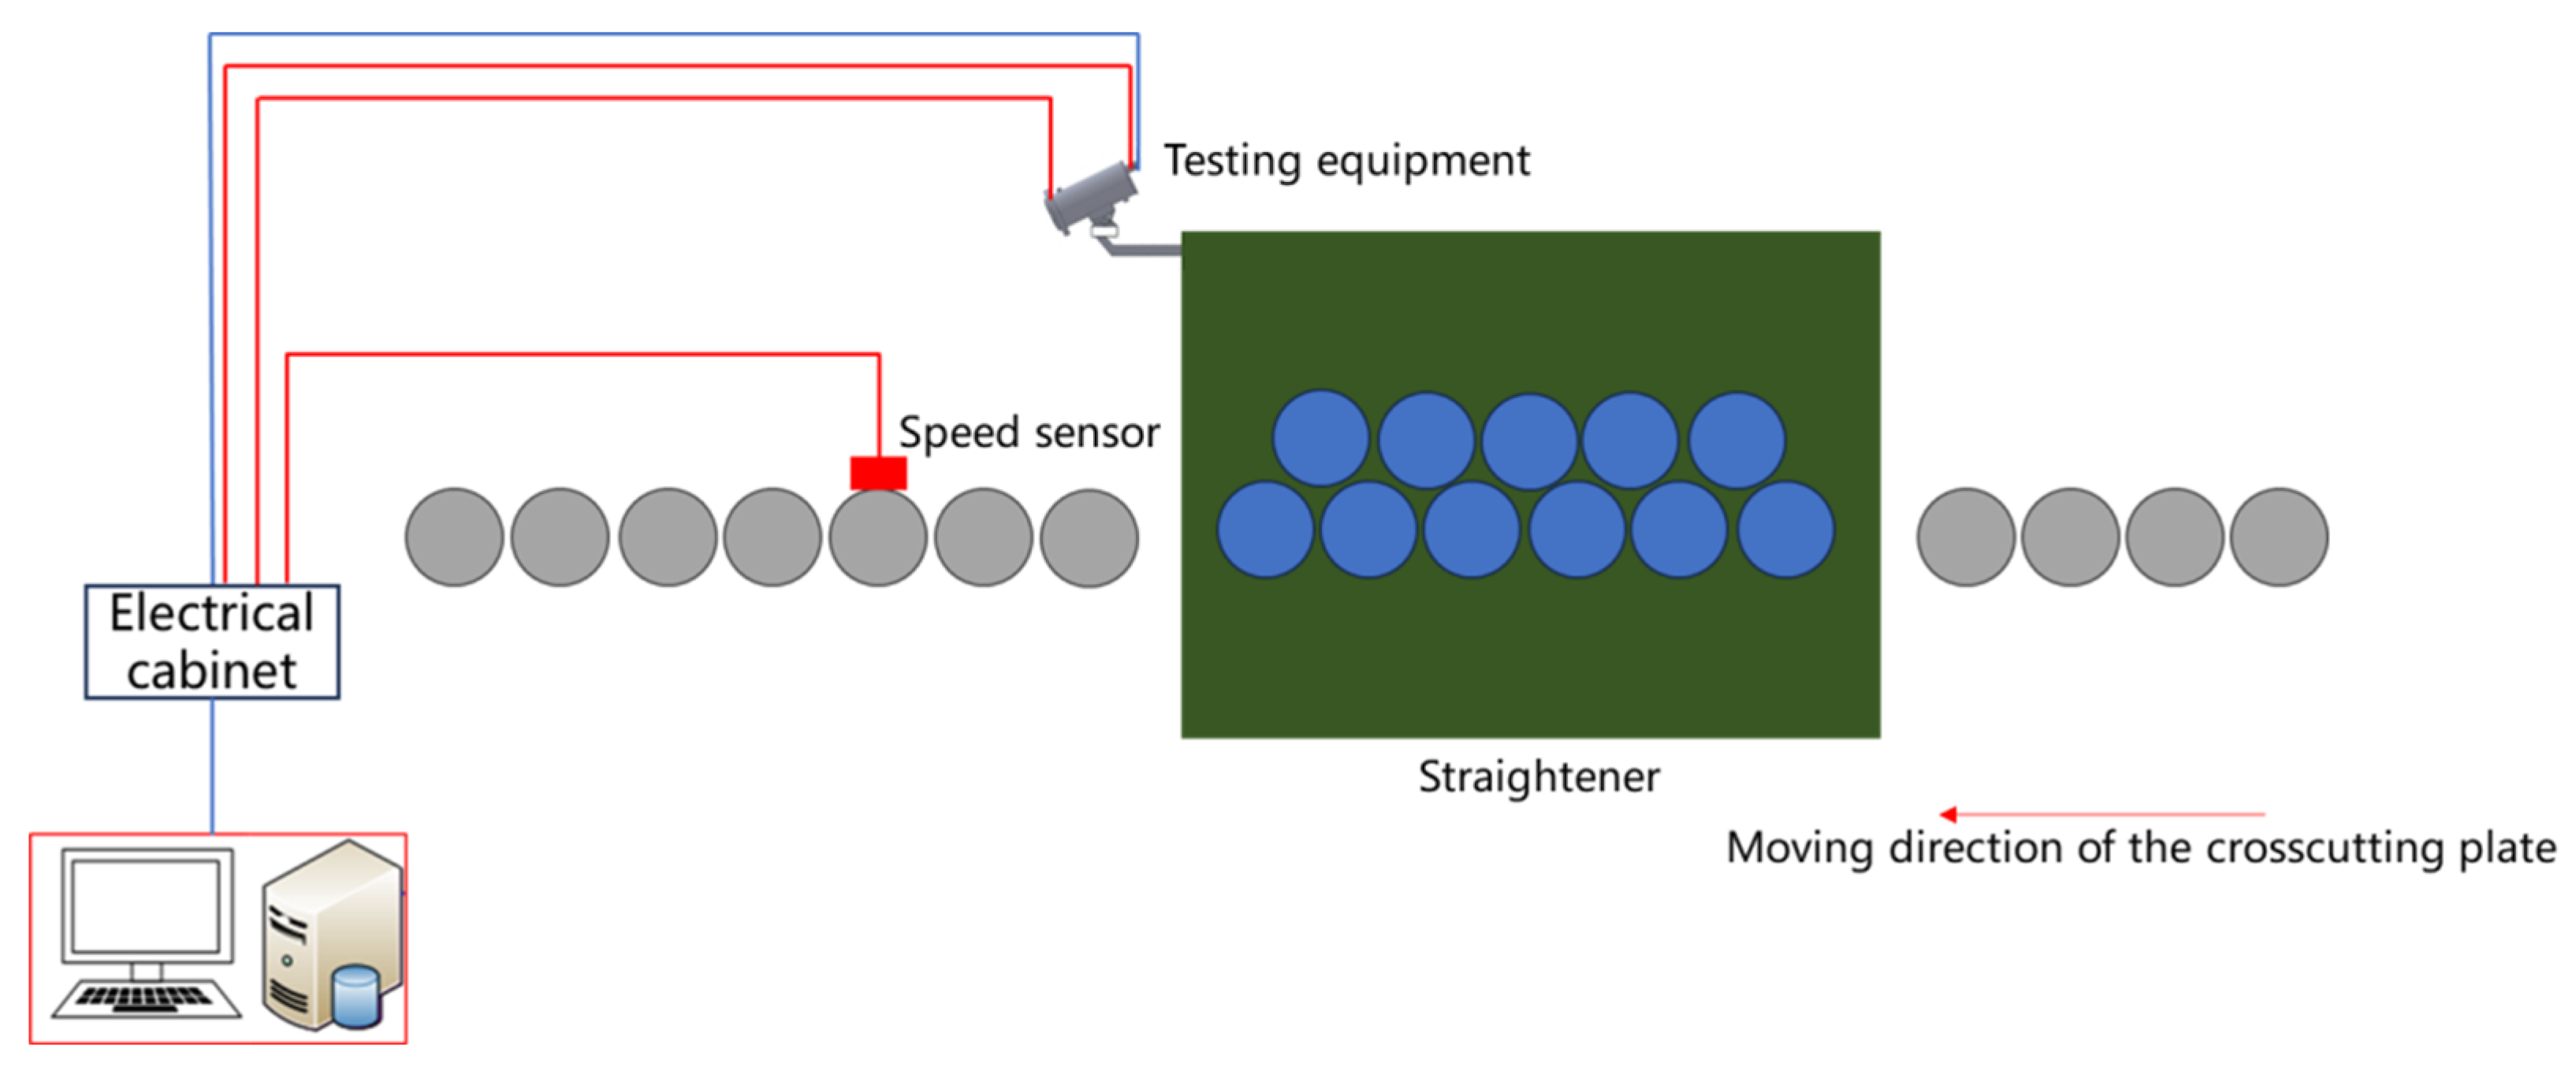
2. Online Measurement System Overall Architecture
2.1. Optical Equipment
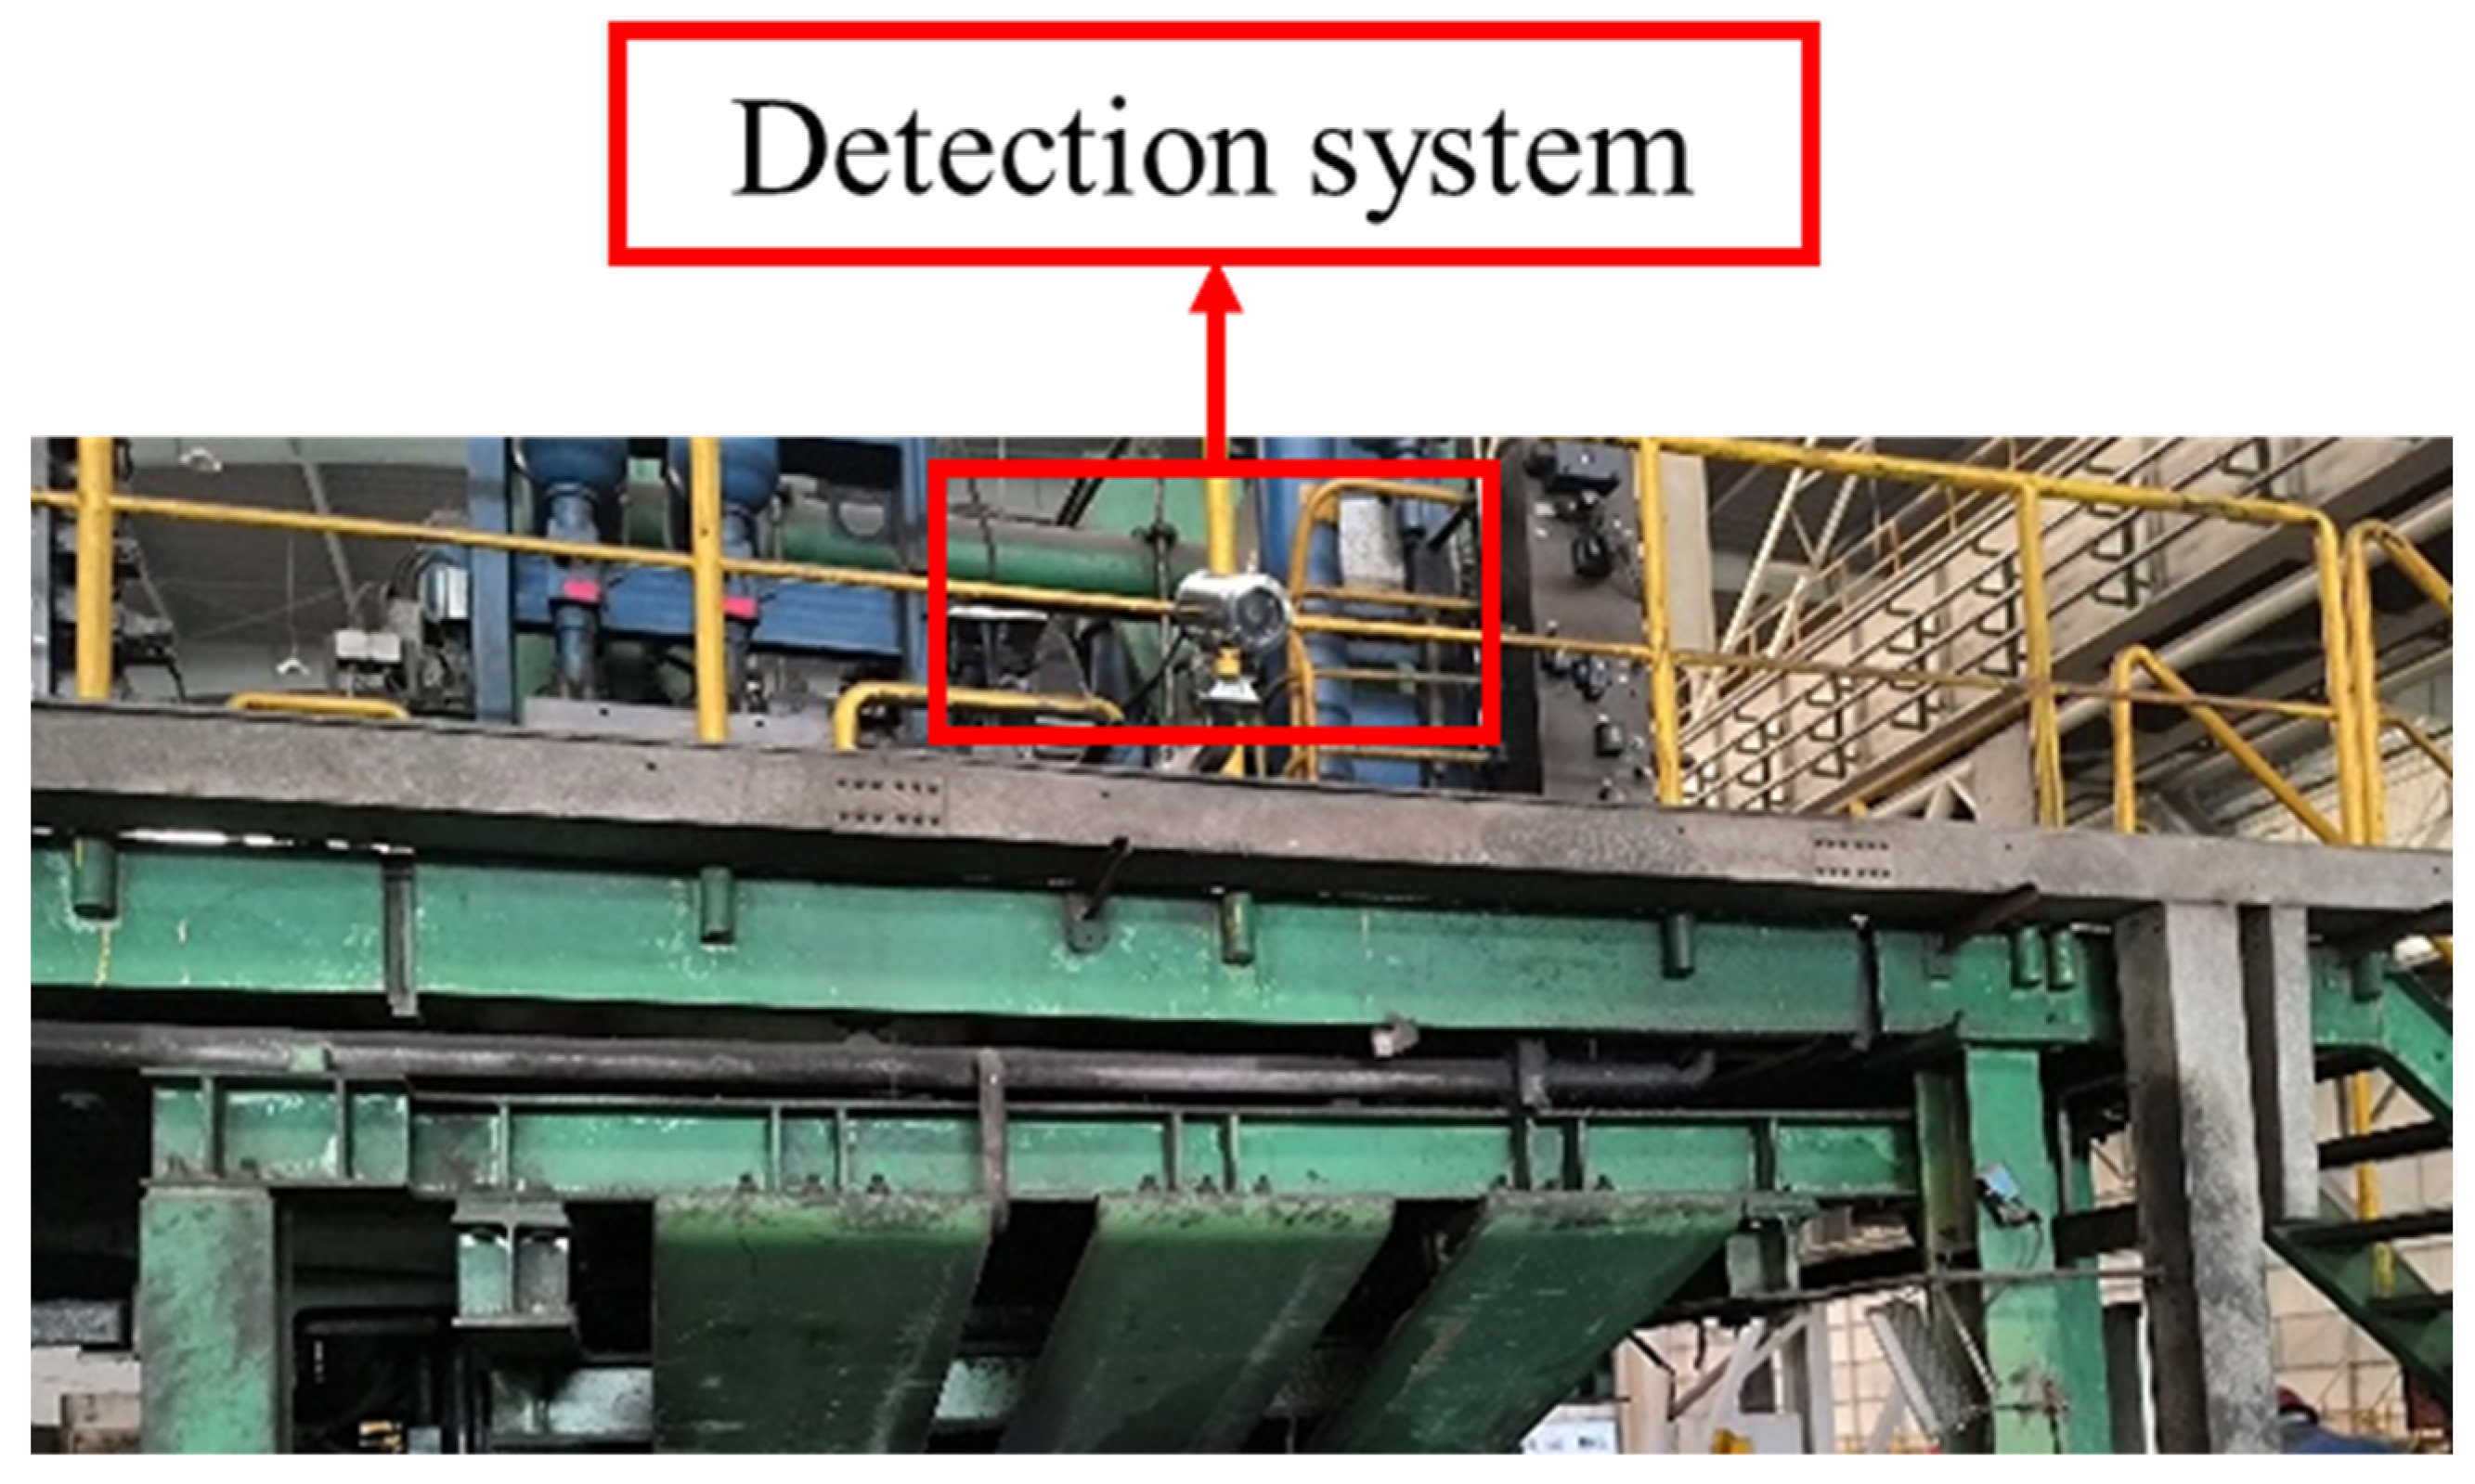
2.2. Detecting System Fixed Device
3. Measurement System Measures the Core Algorithm
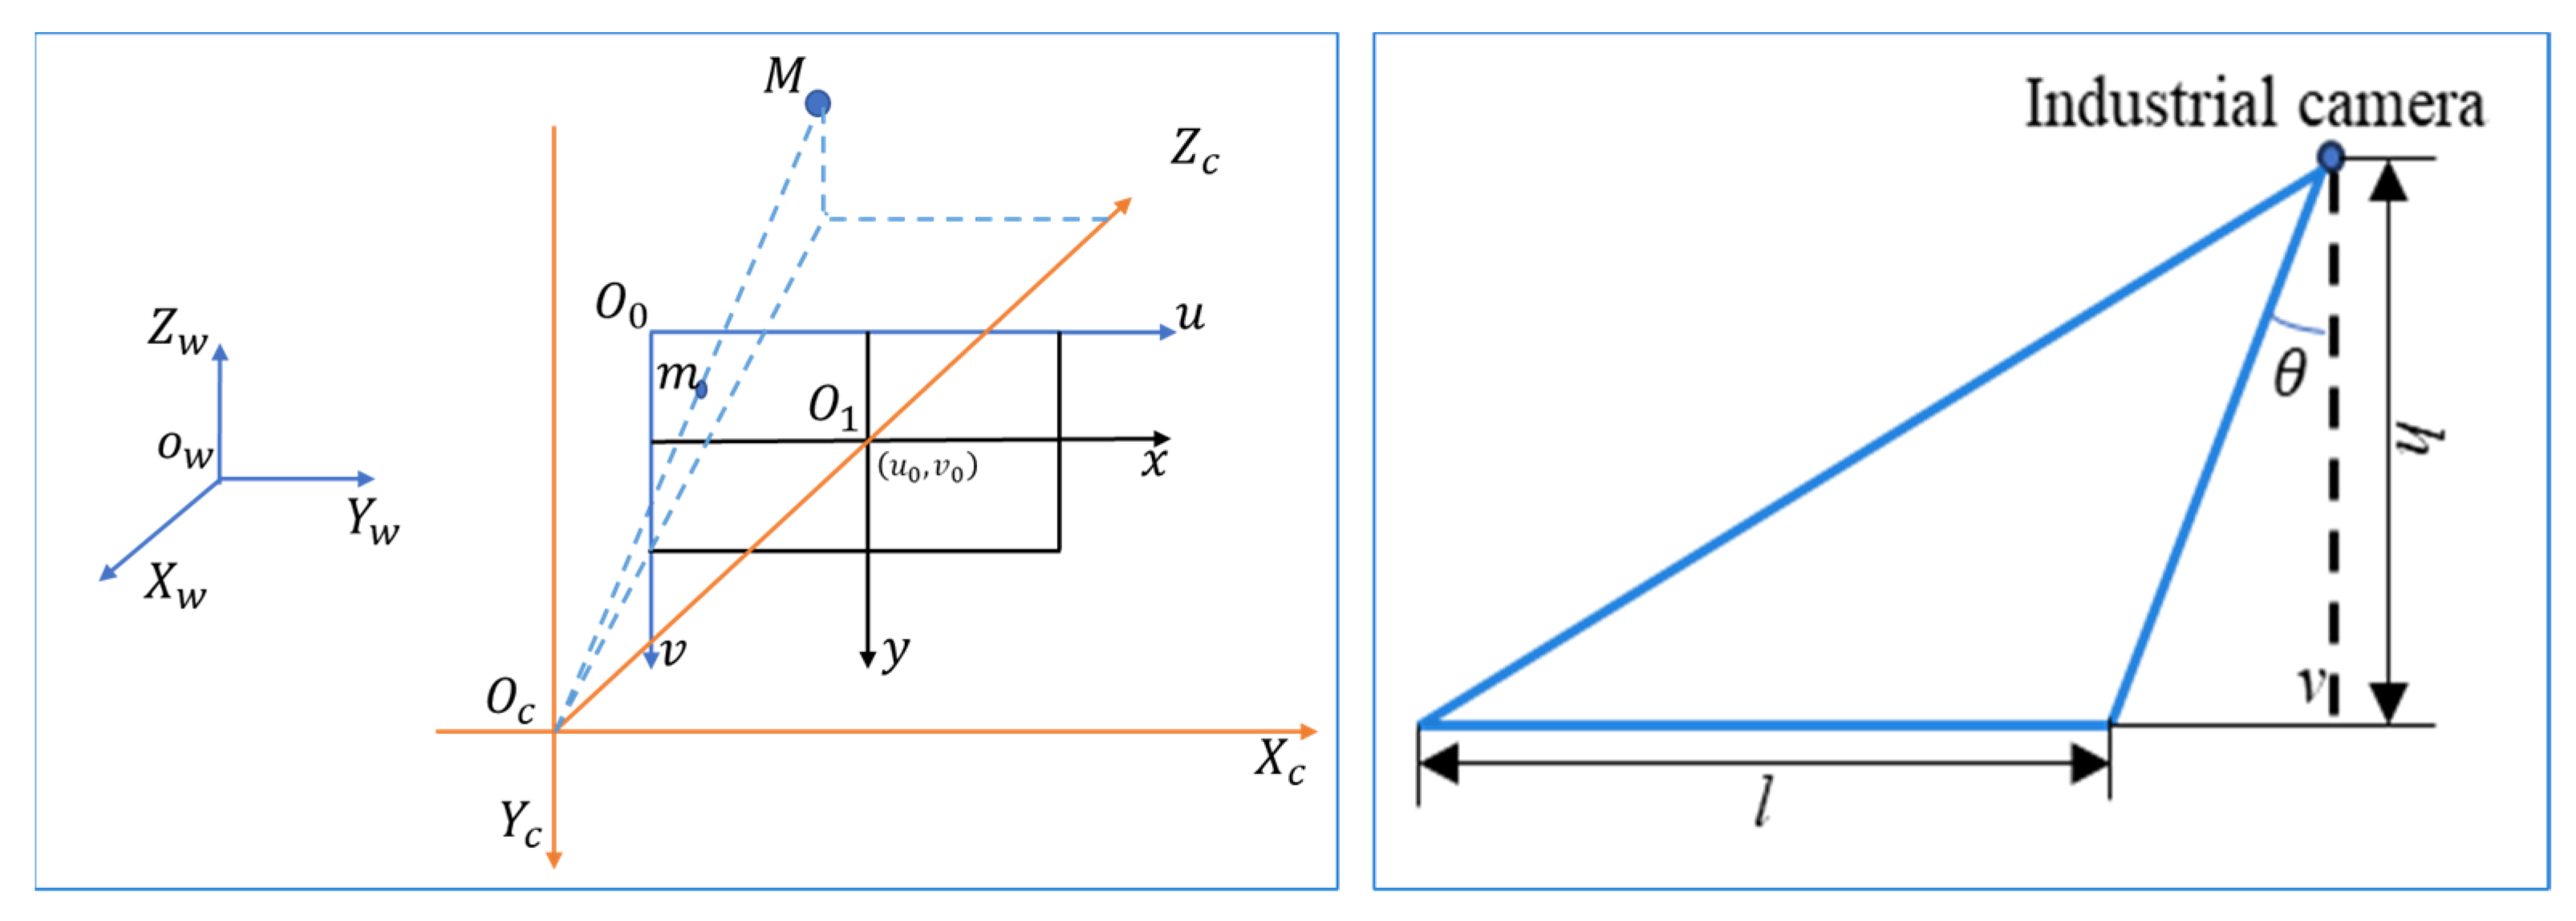
3.1. Measurement Principle
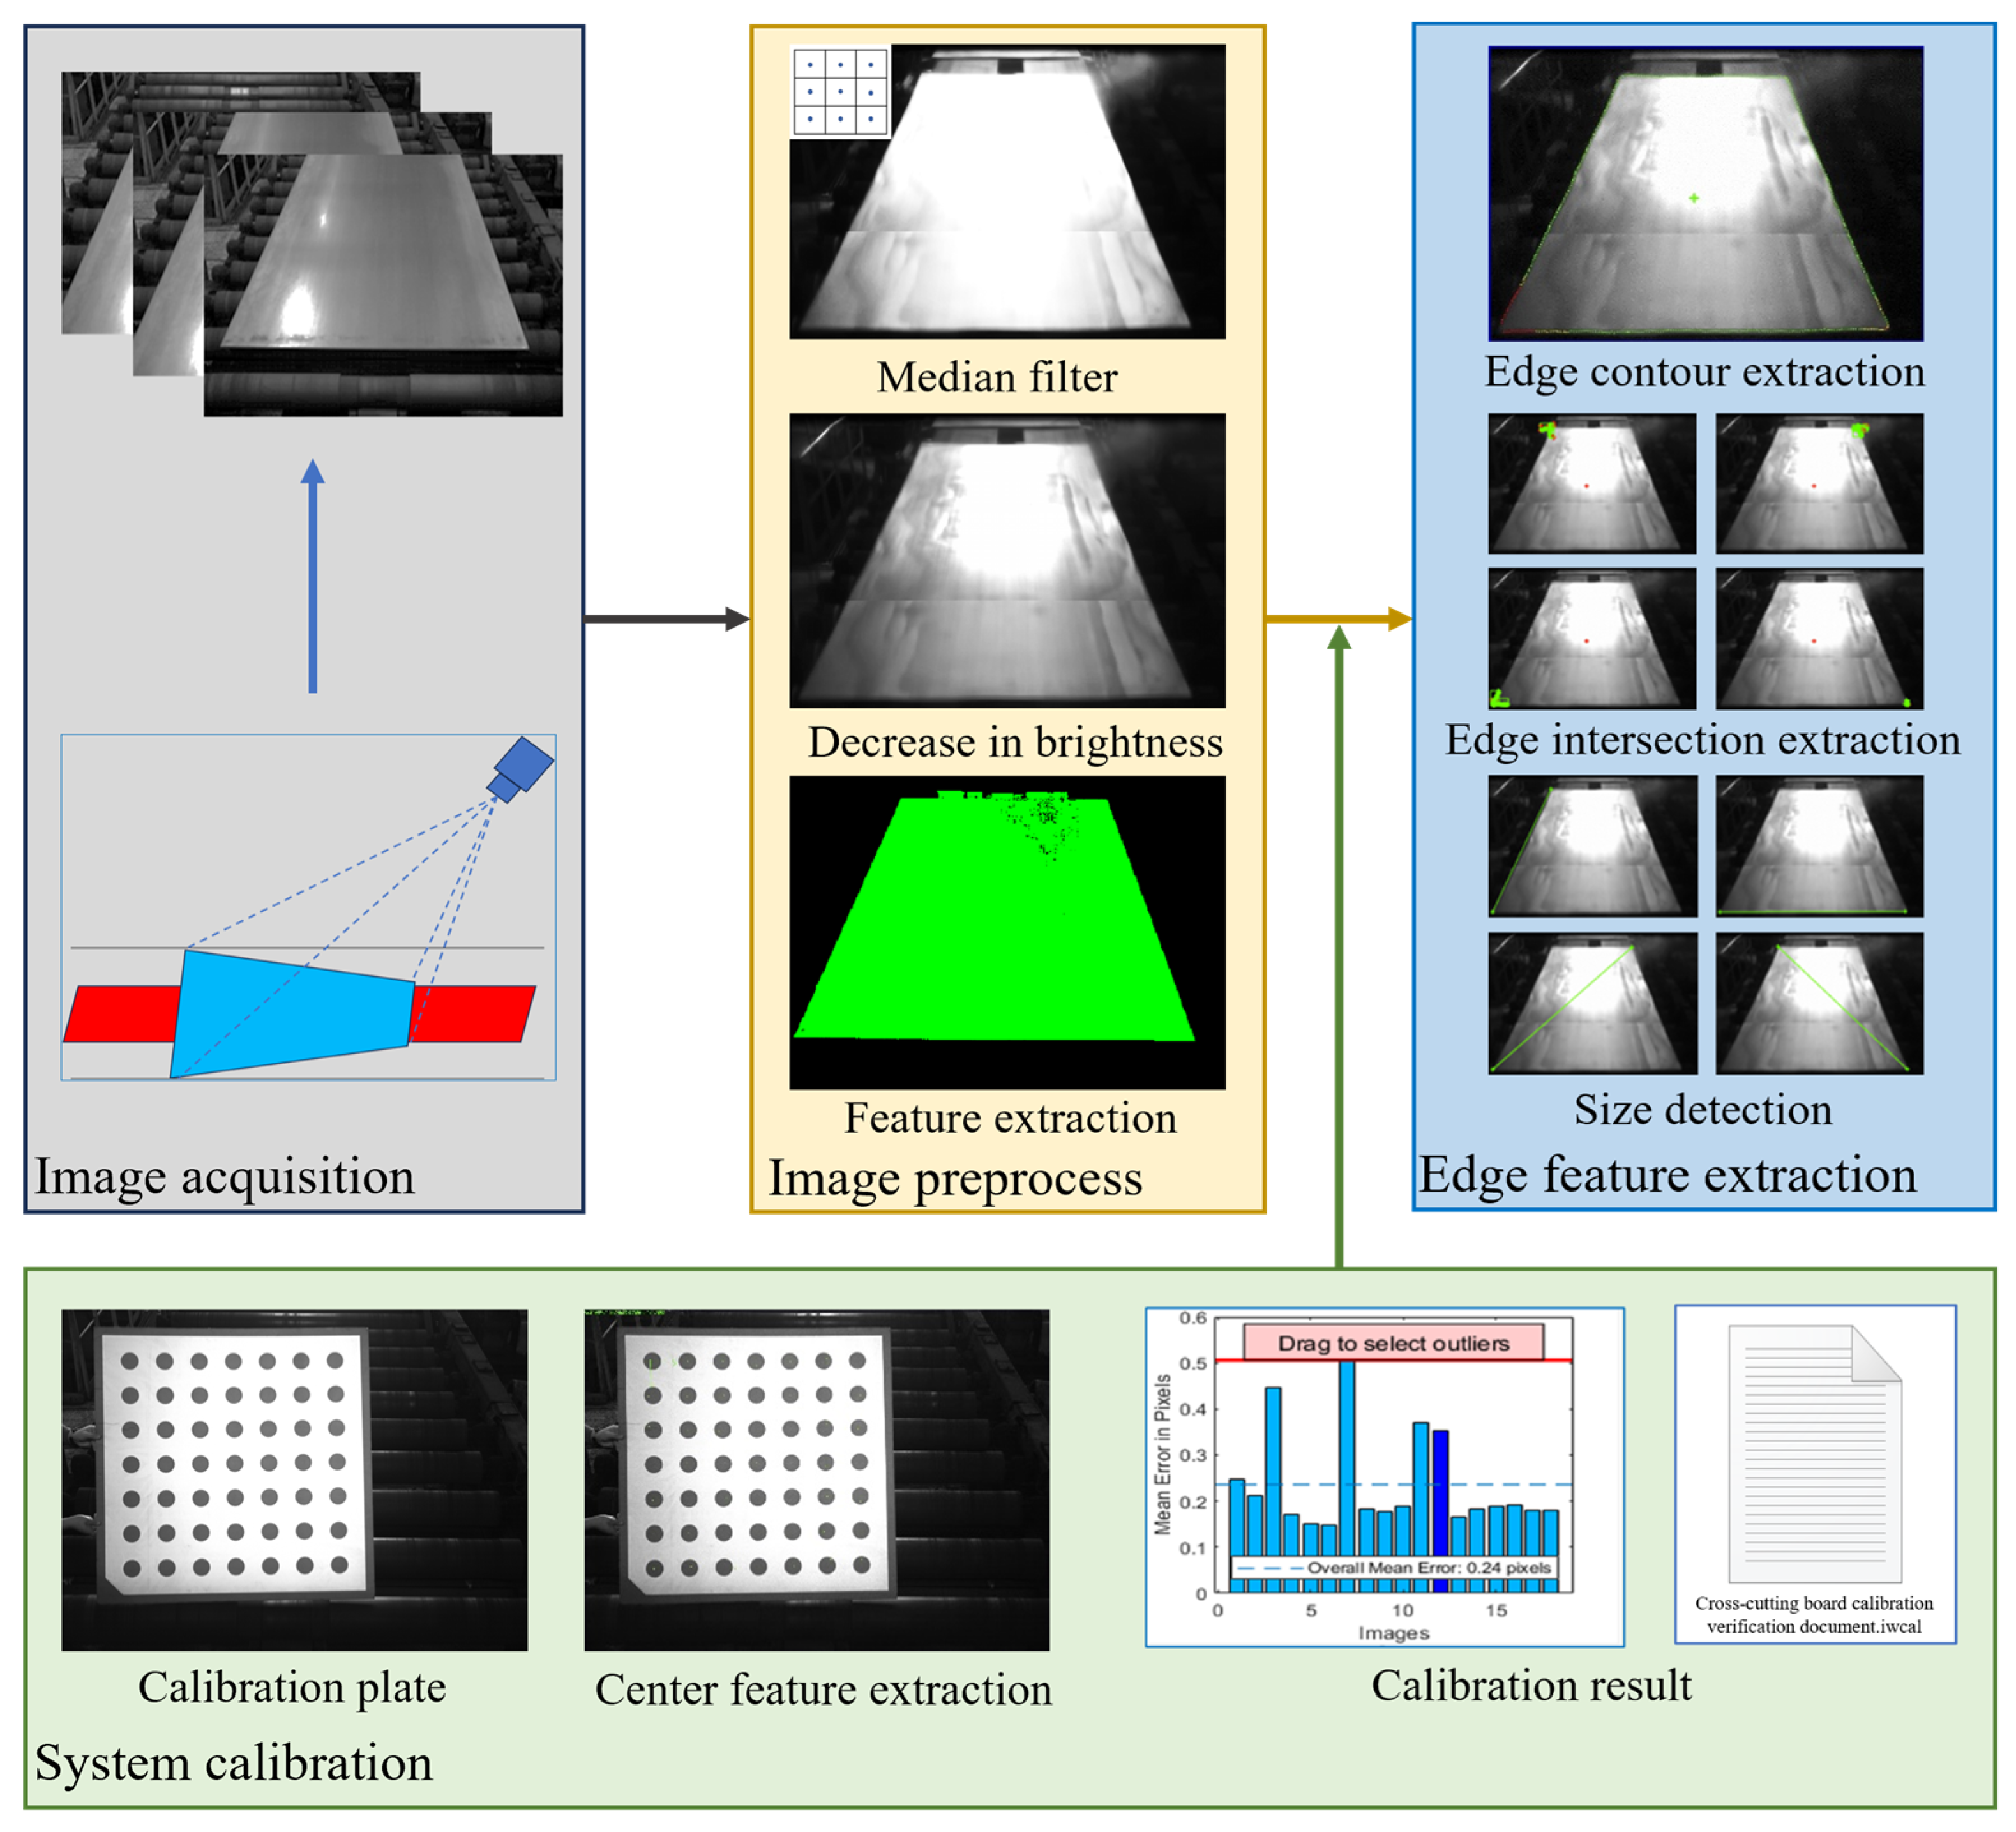
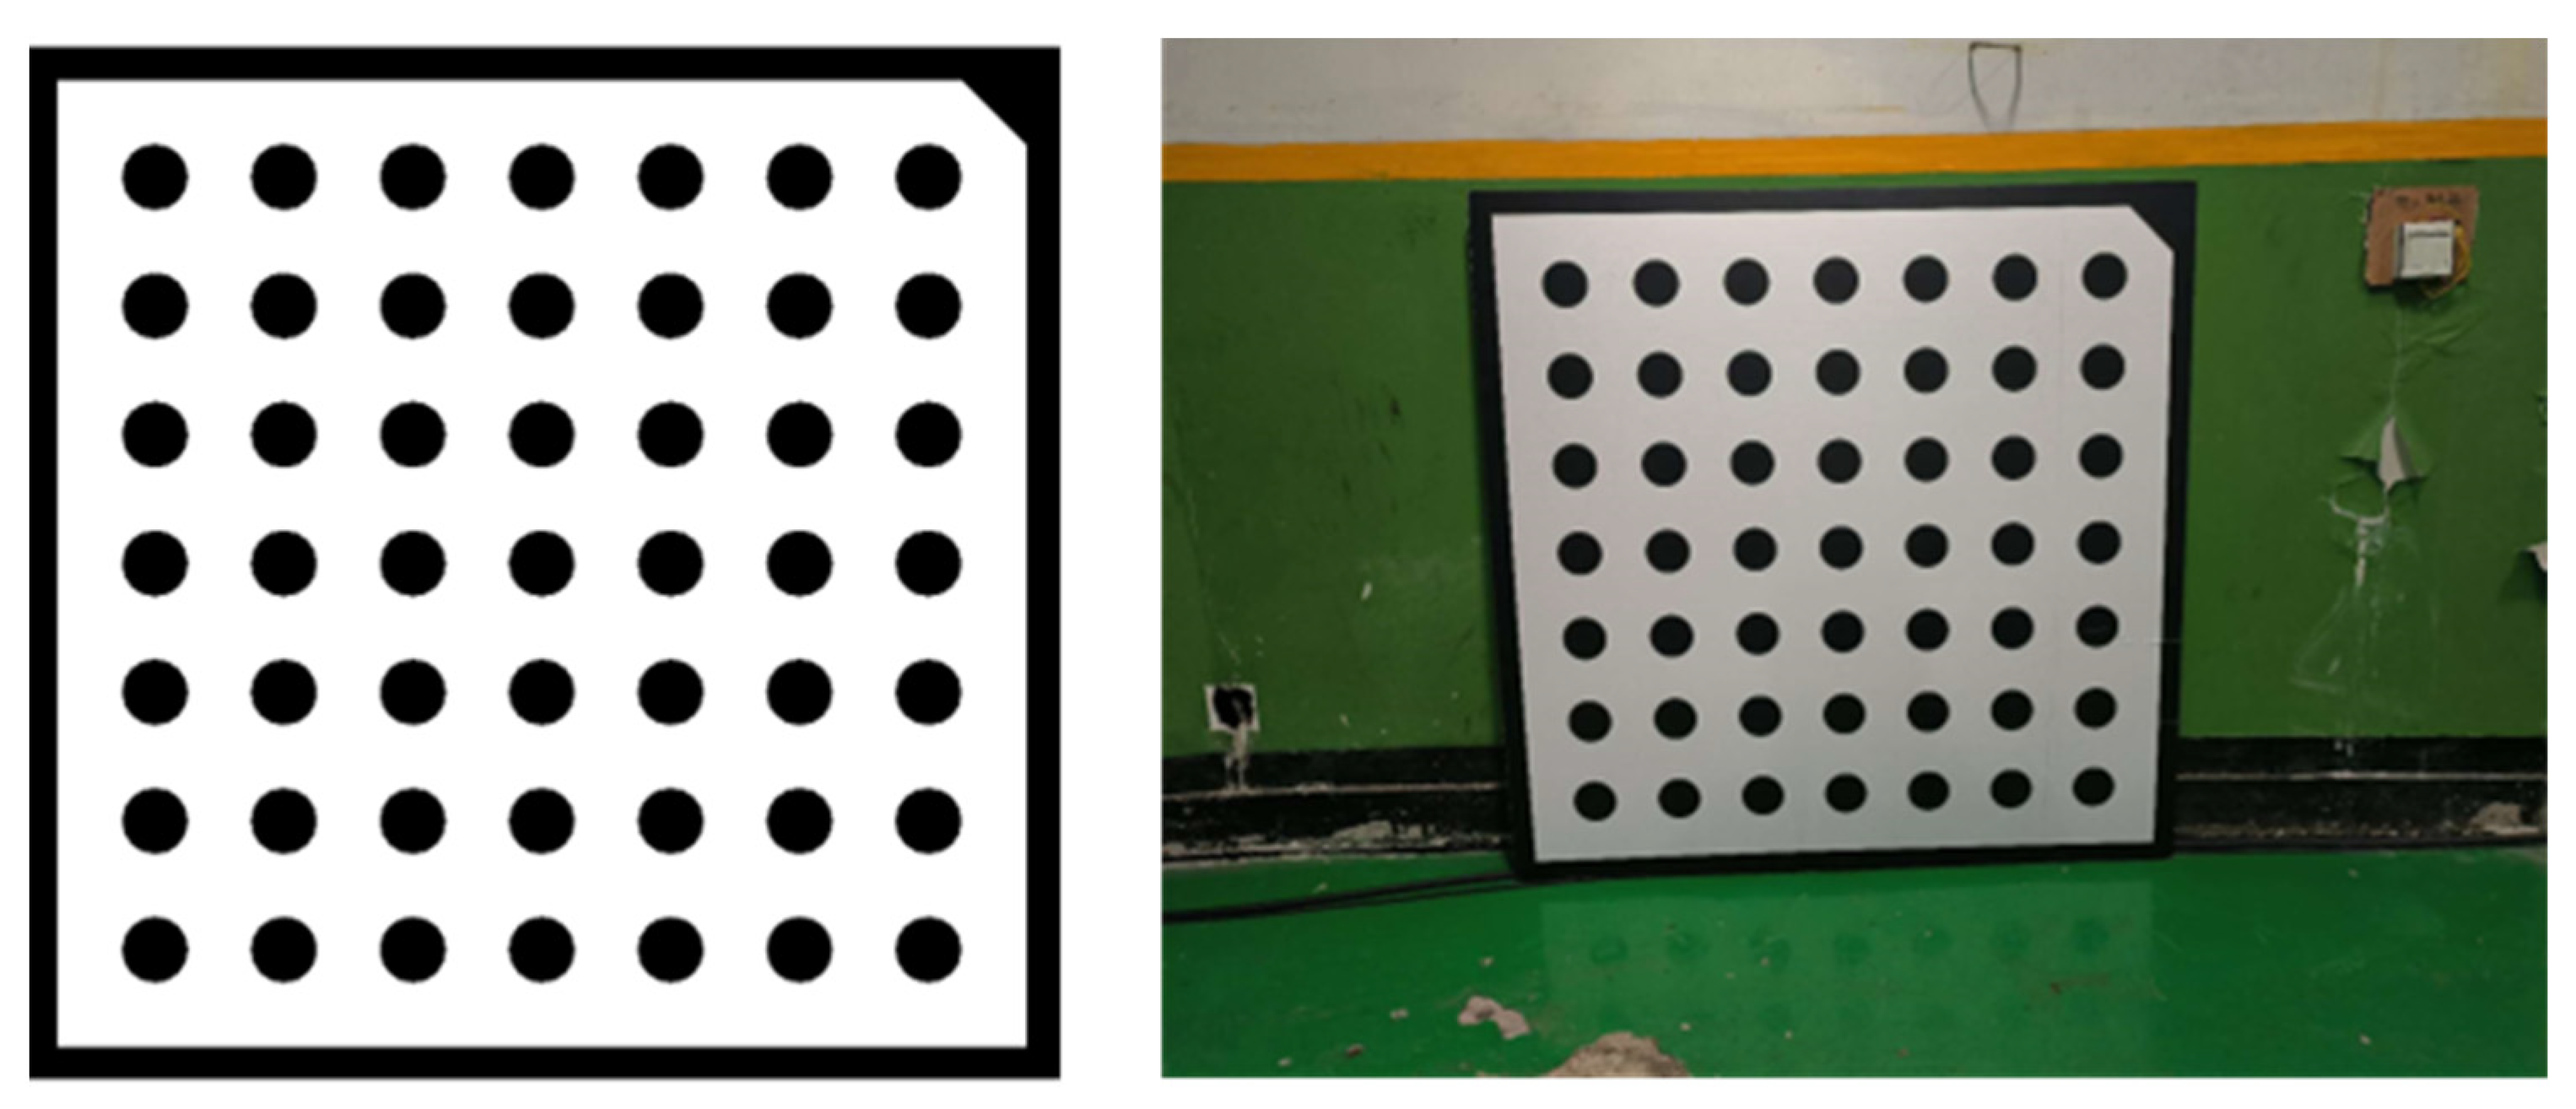
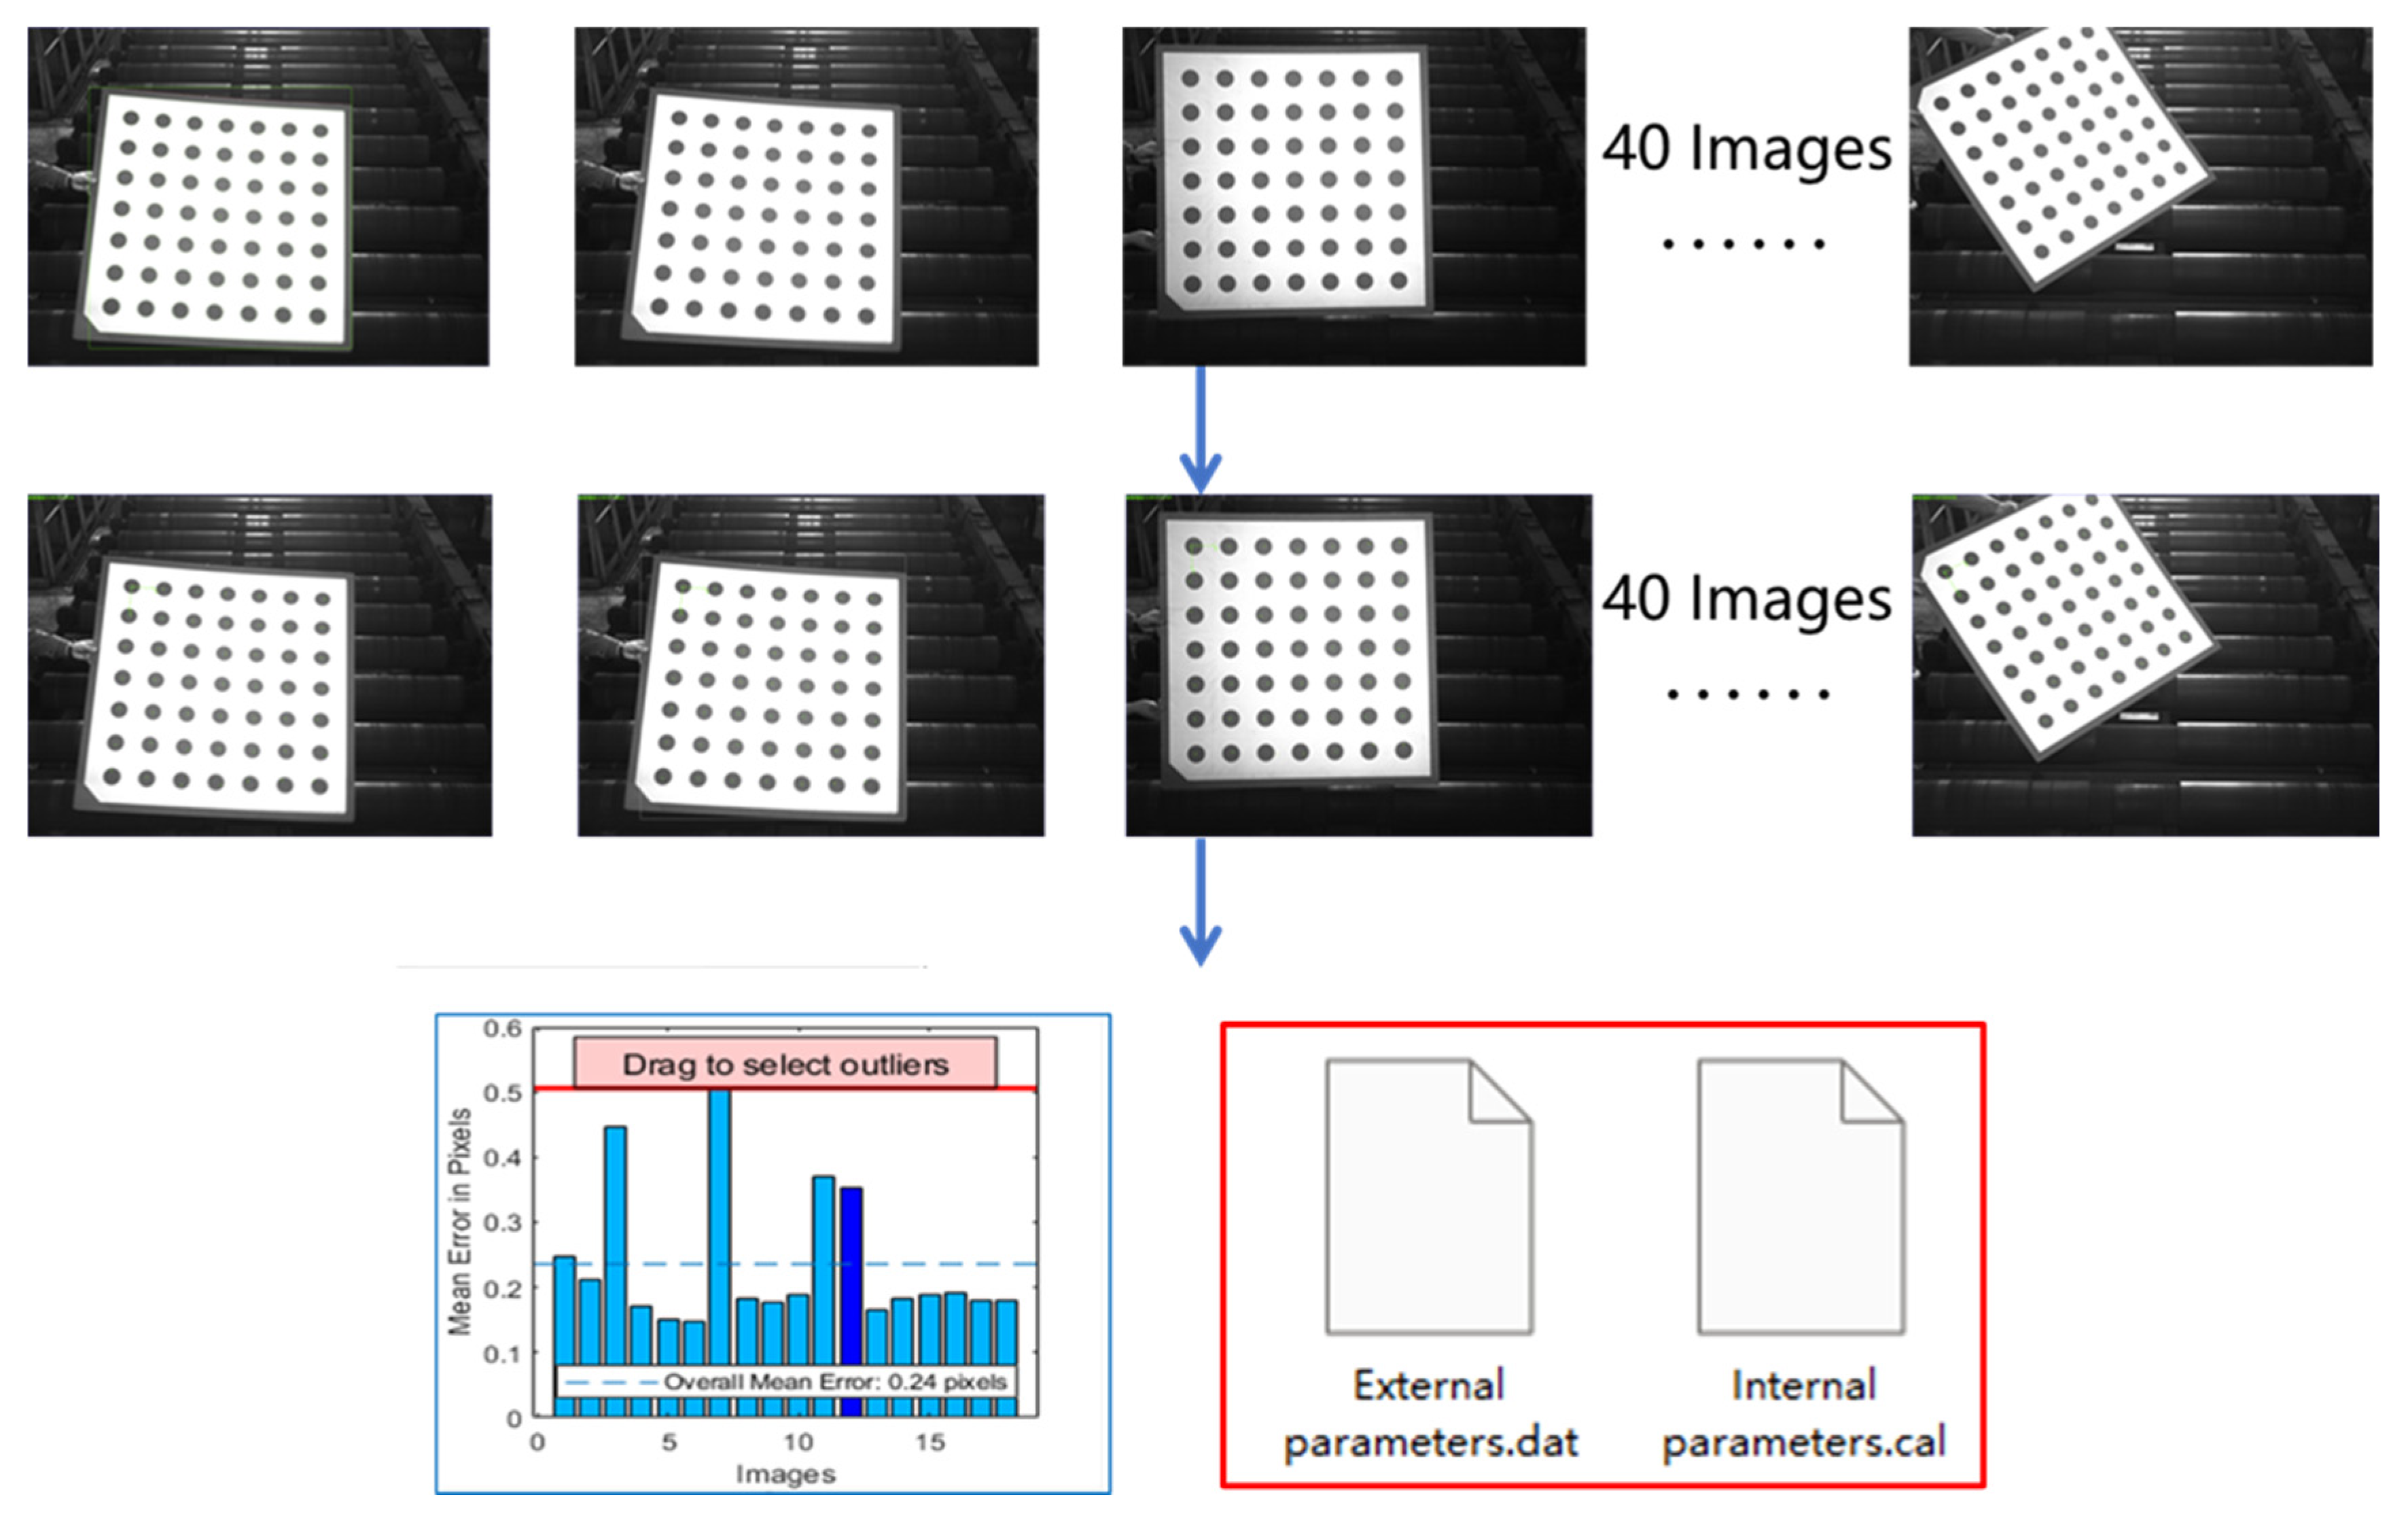
3.2. System Calibration Detection
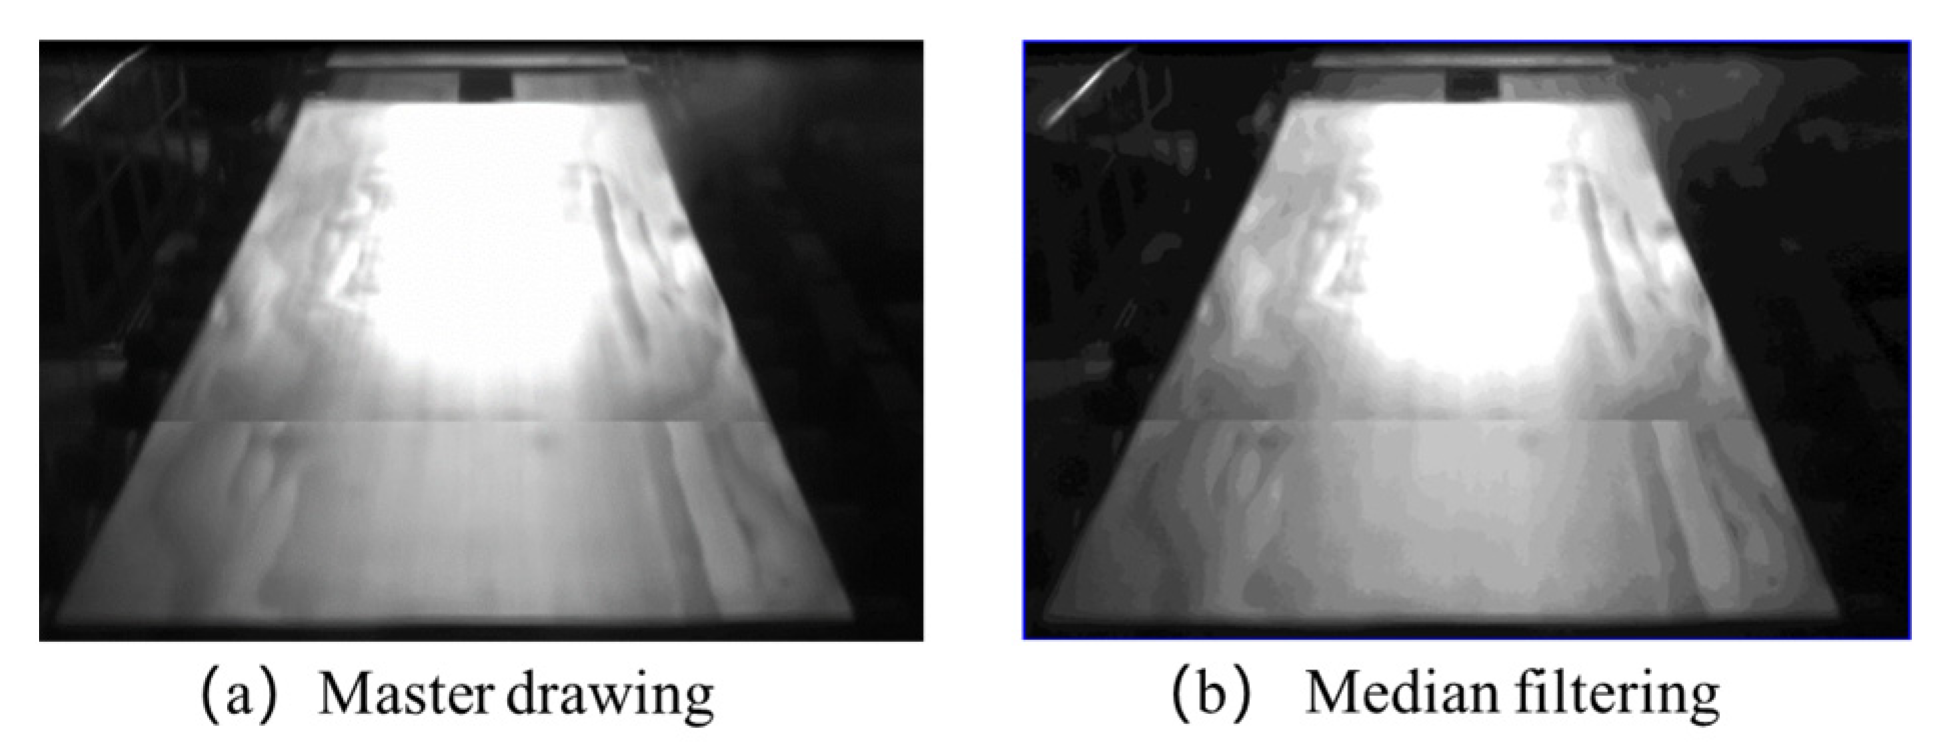
3.3. Image Preprocessing
- (1)
- Median Filtering
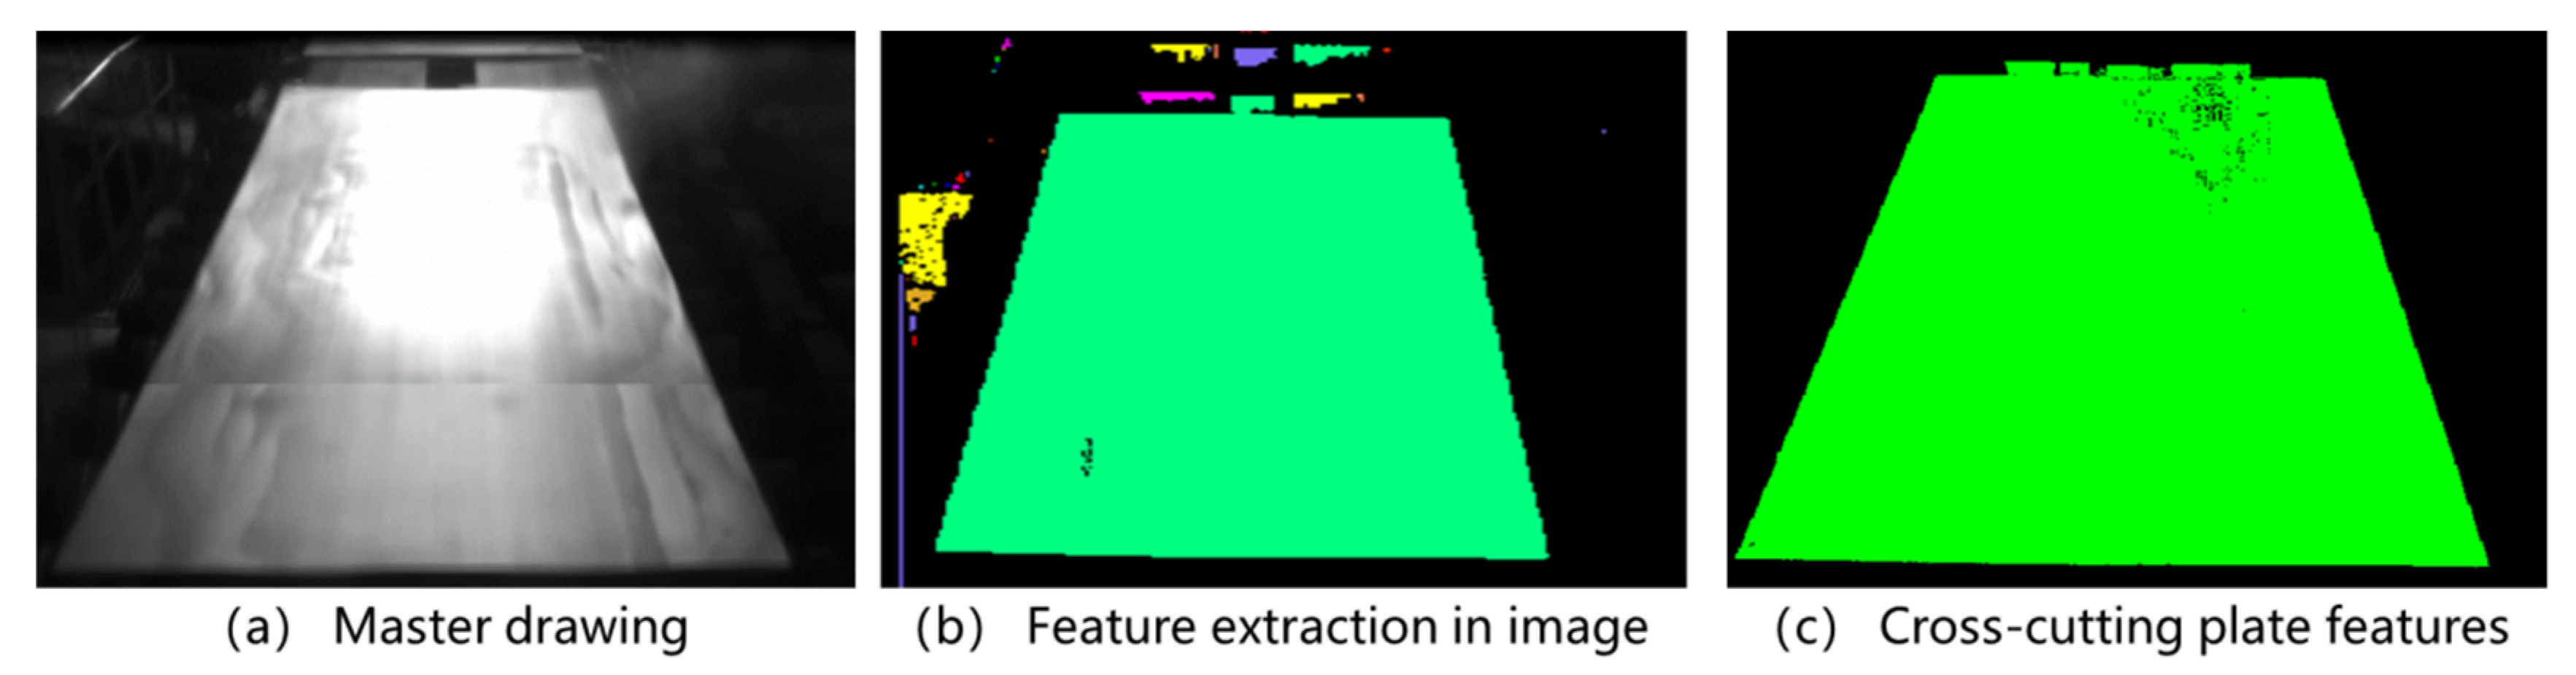
- (2)
- Cross-cutting board feature extraction
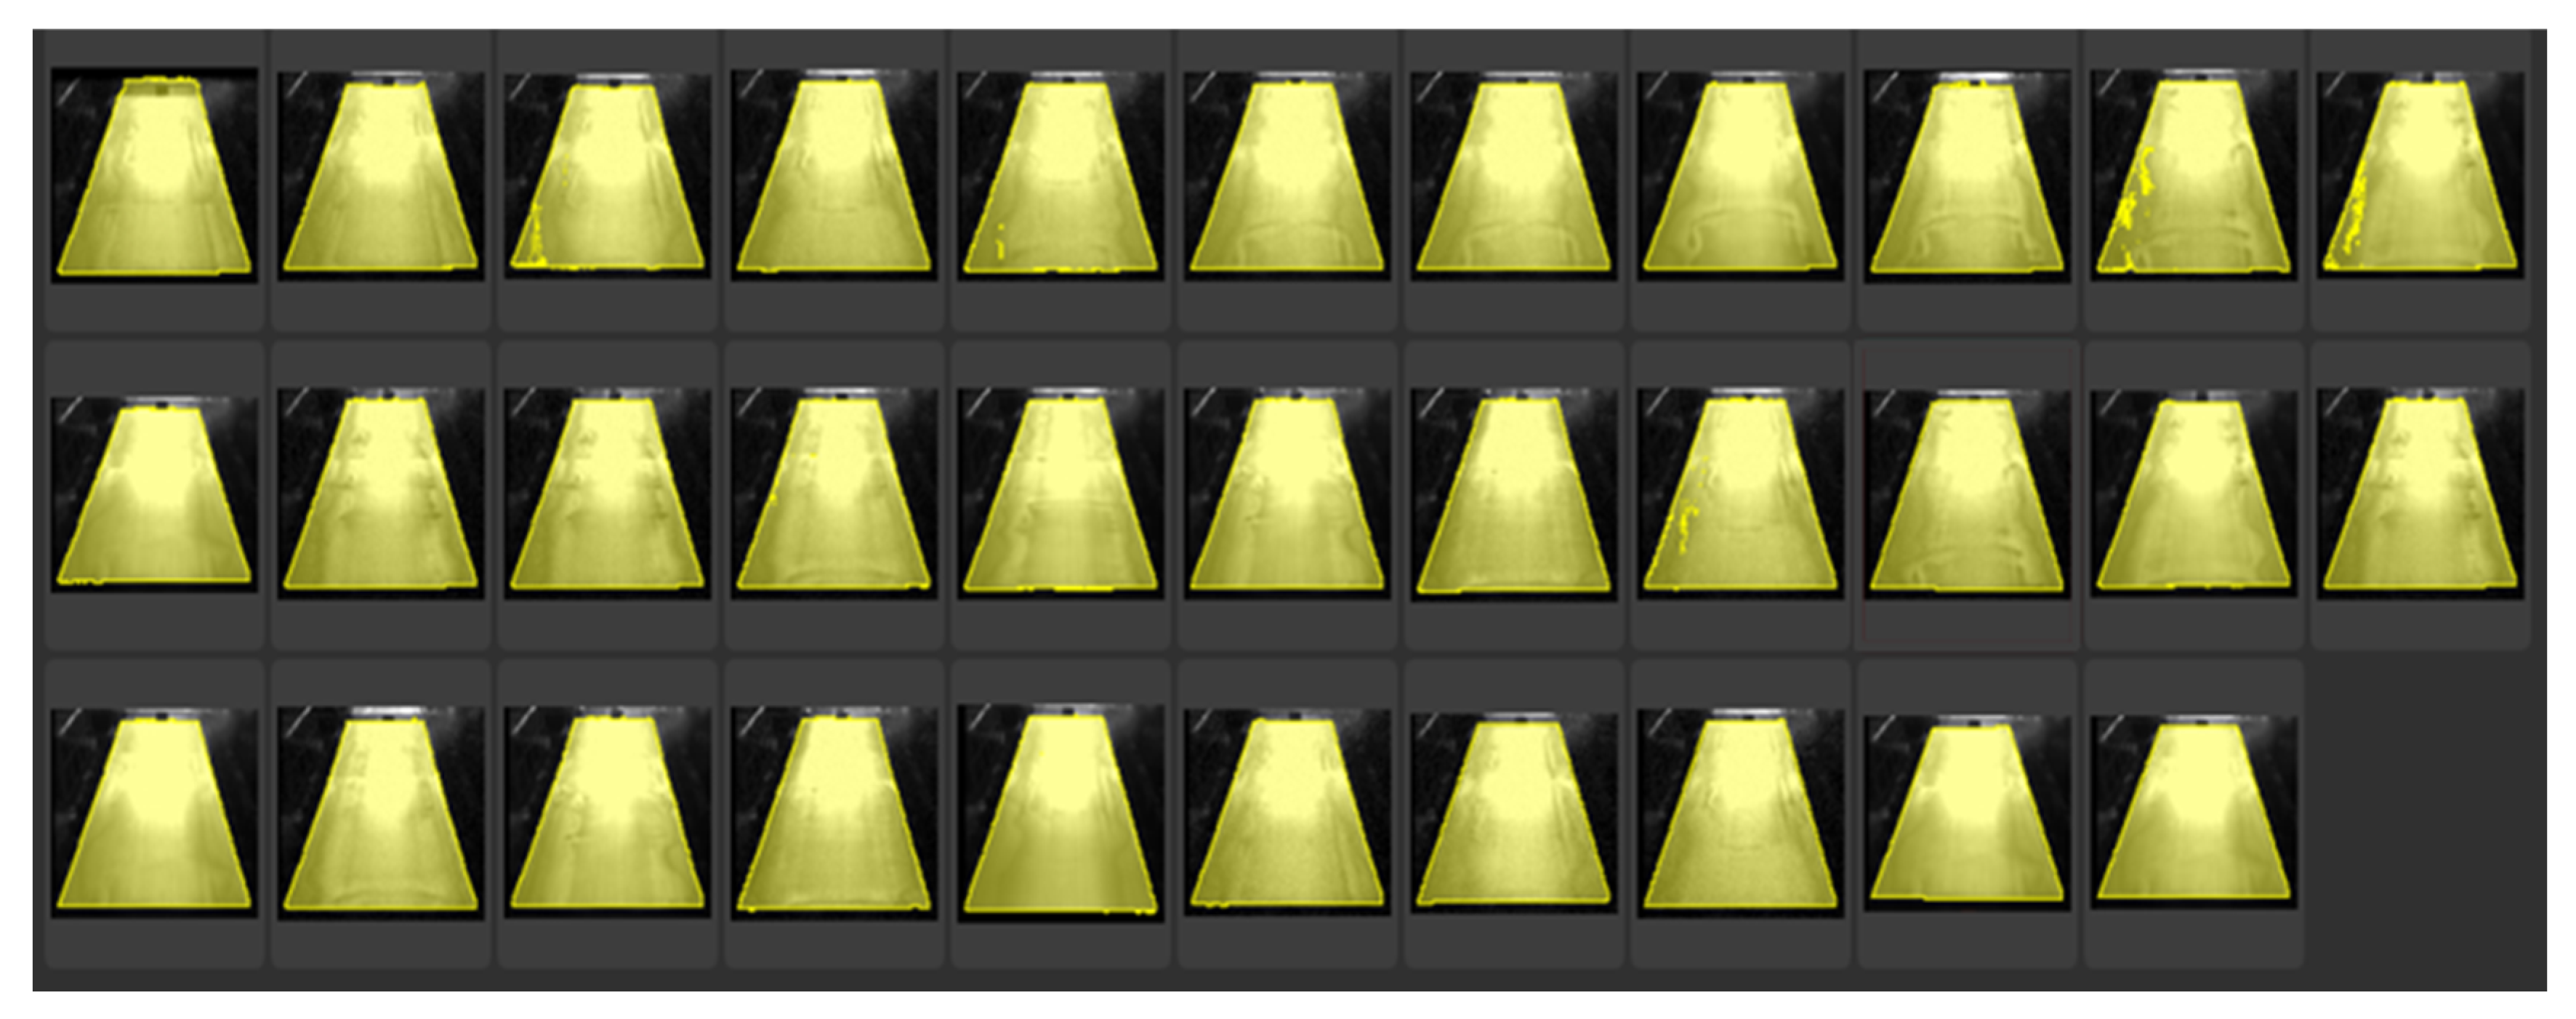
- (3)
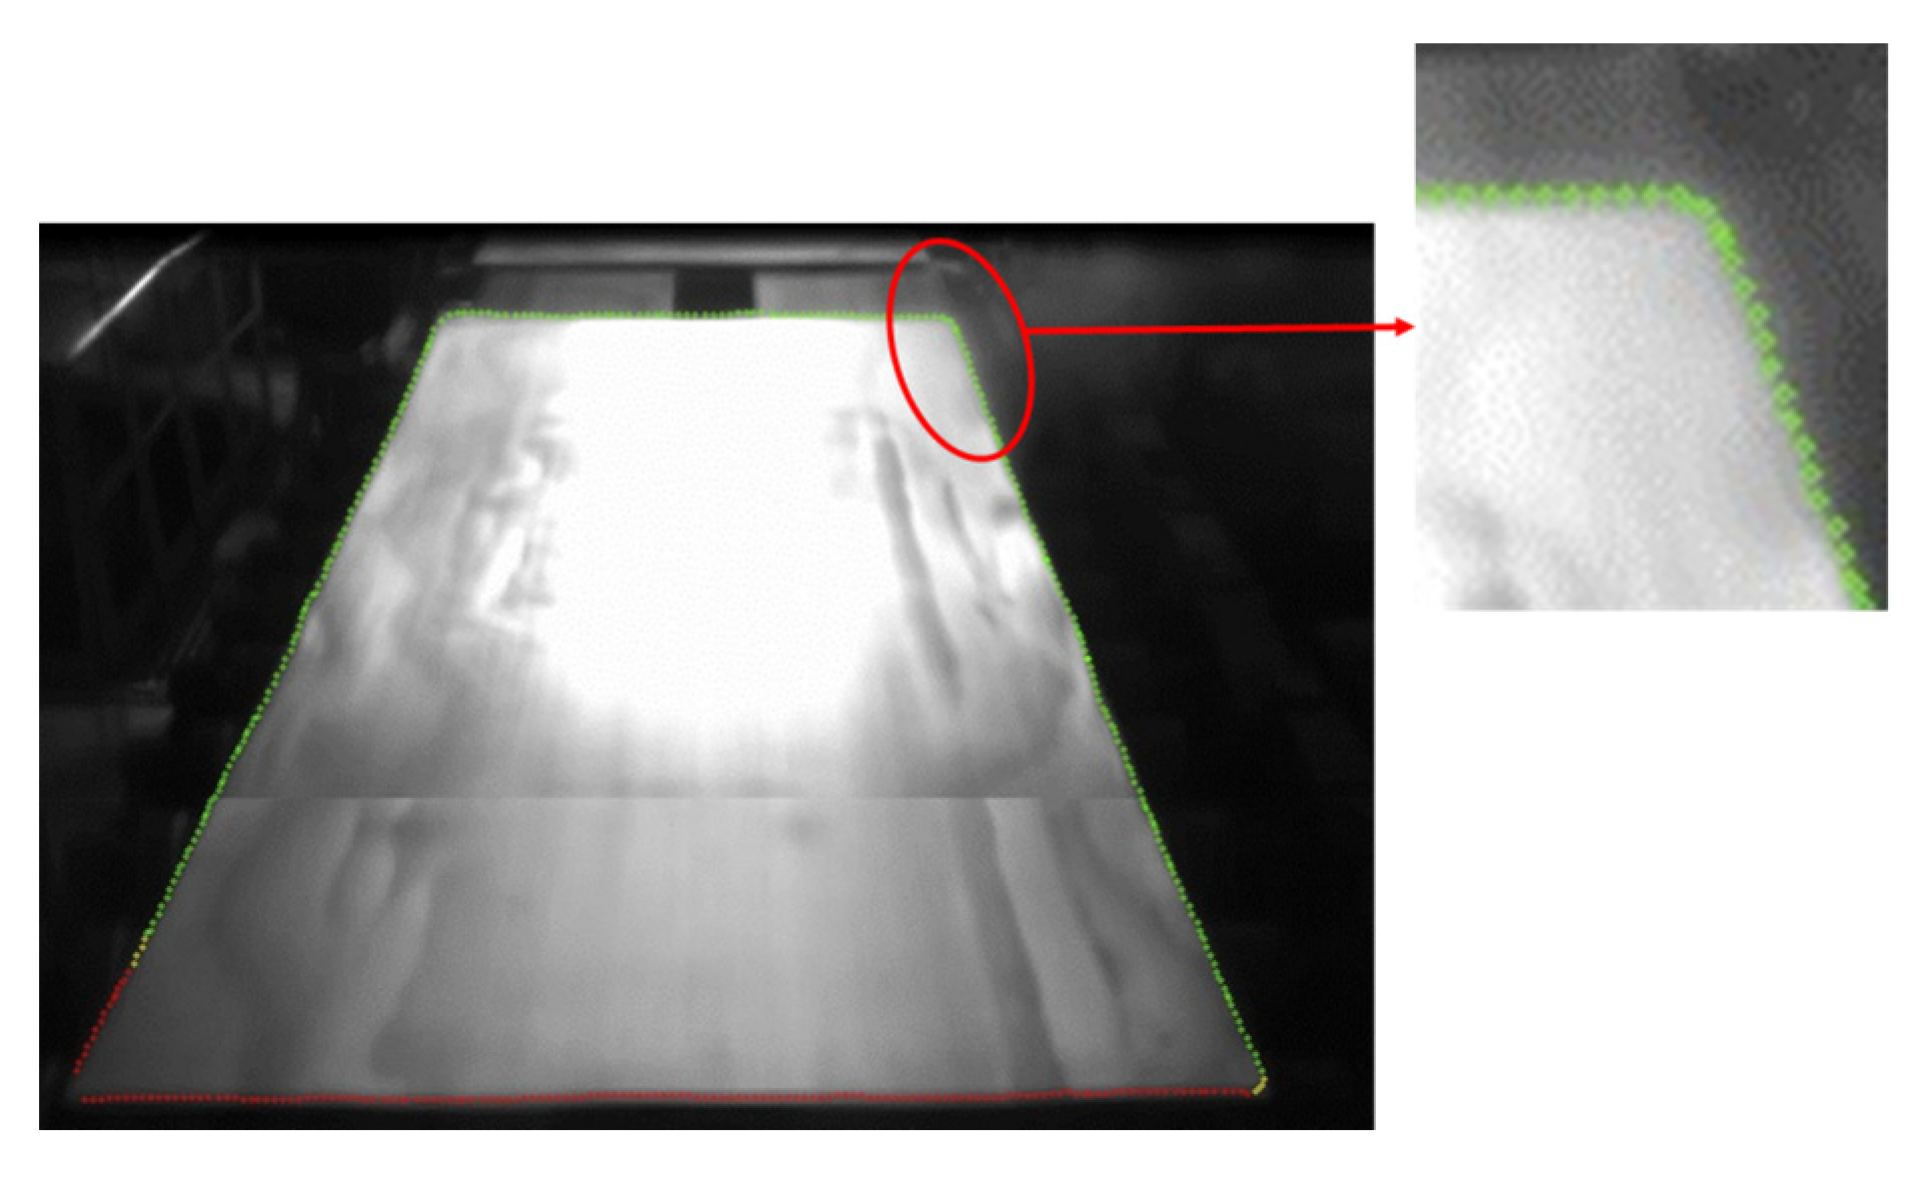
- Extraction of contour of cross-cutting board edge
4. Measurement of the Length, Width, and Diagonal of a Cross-Cutting Board
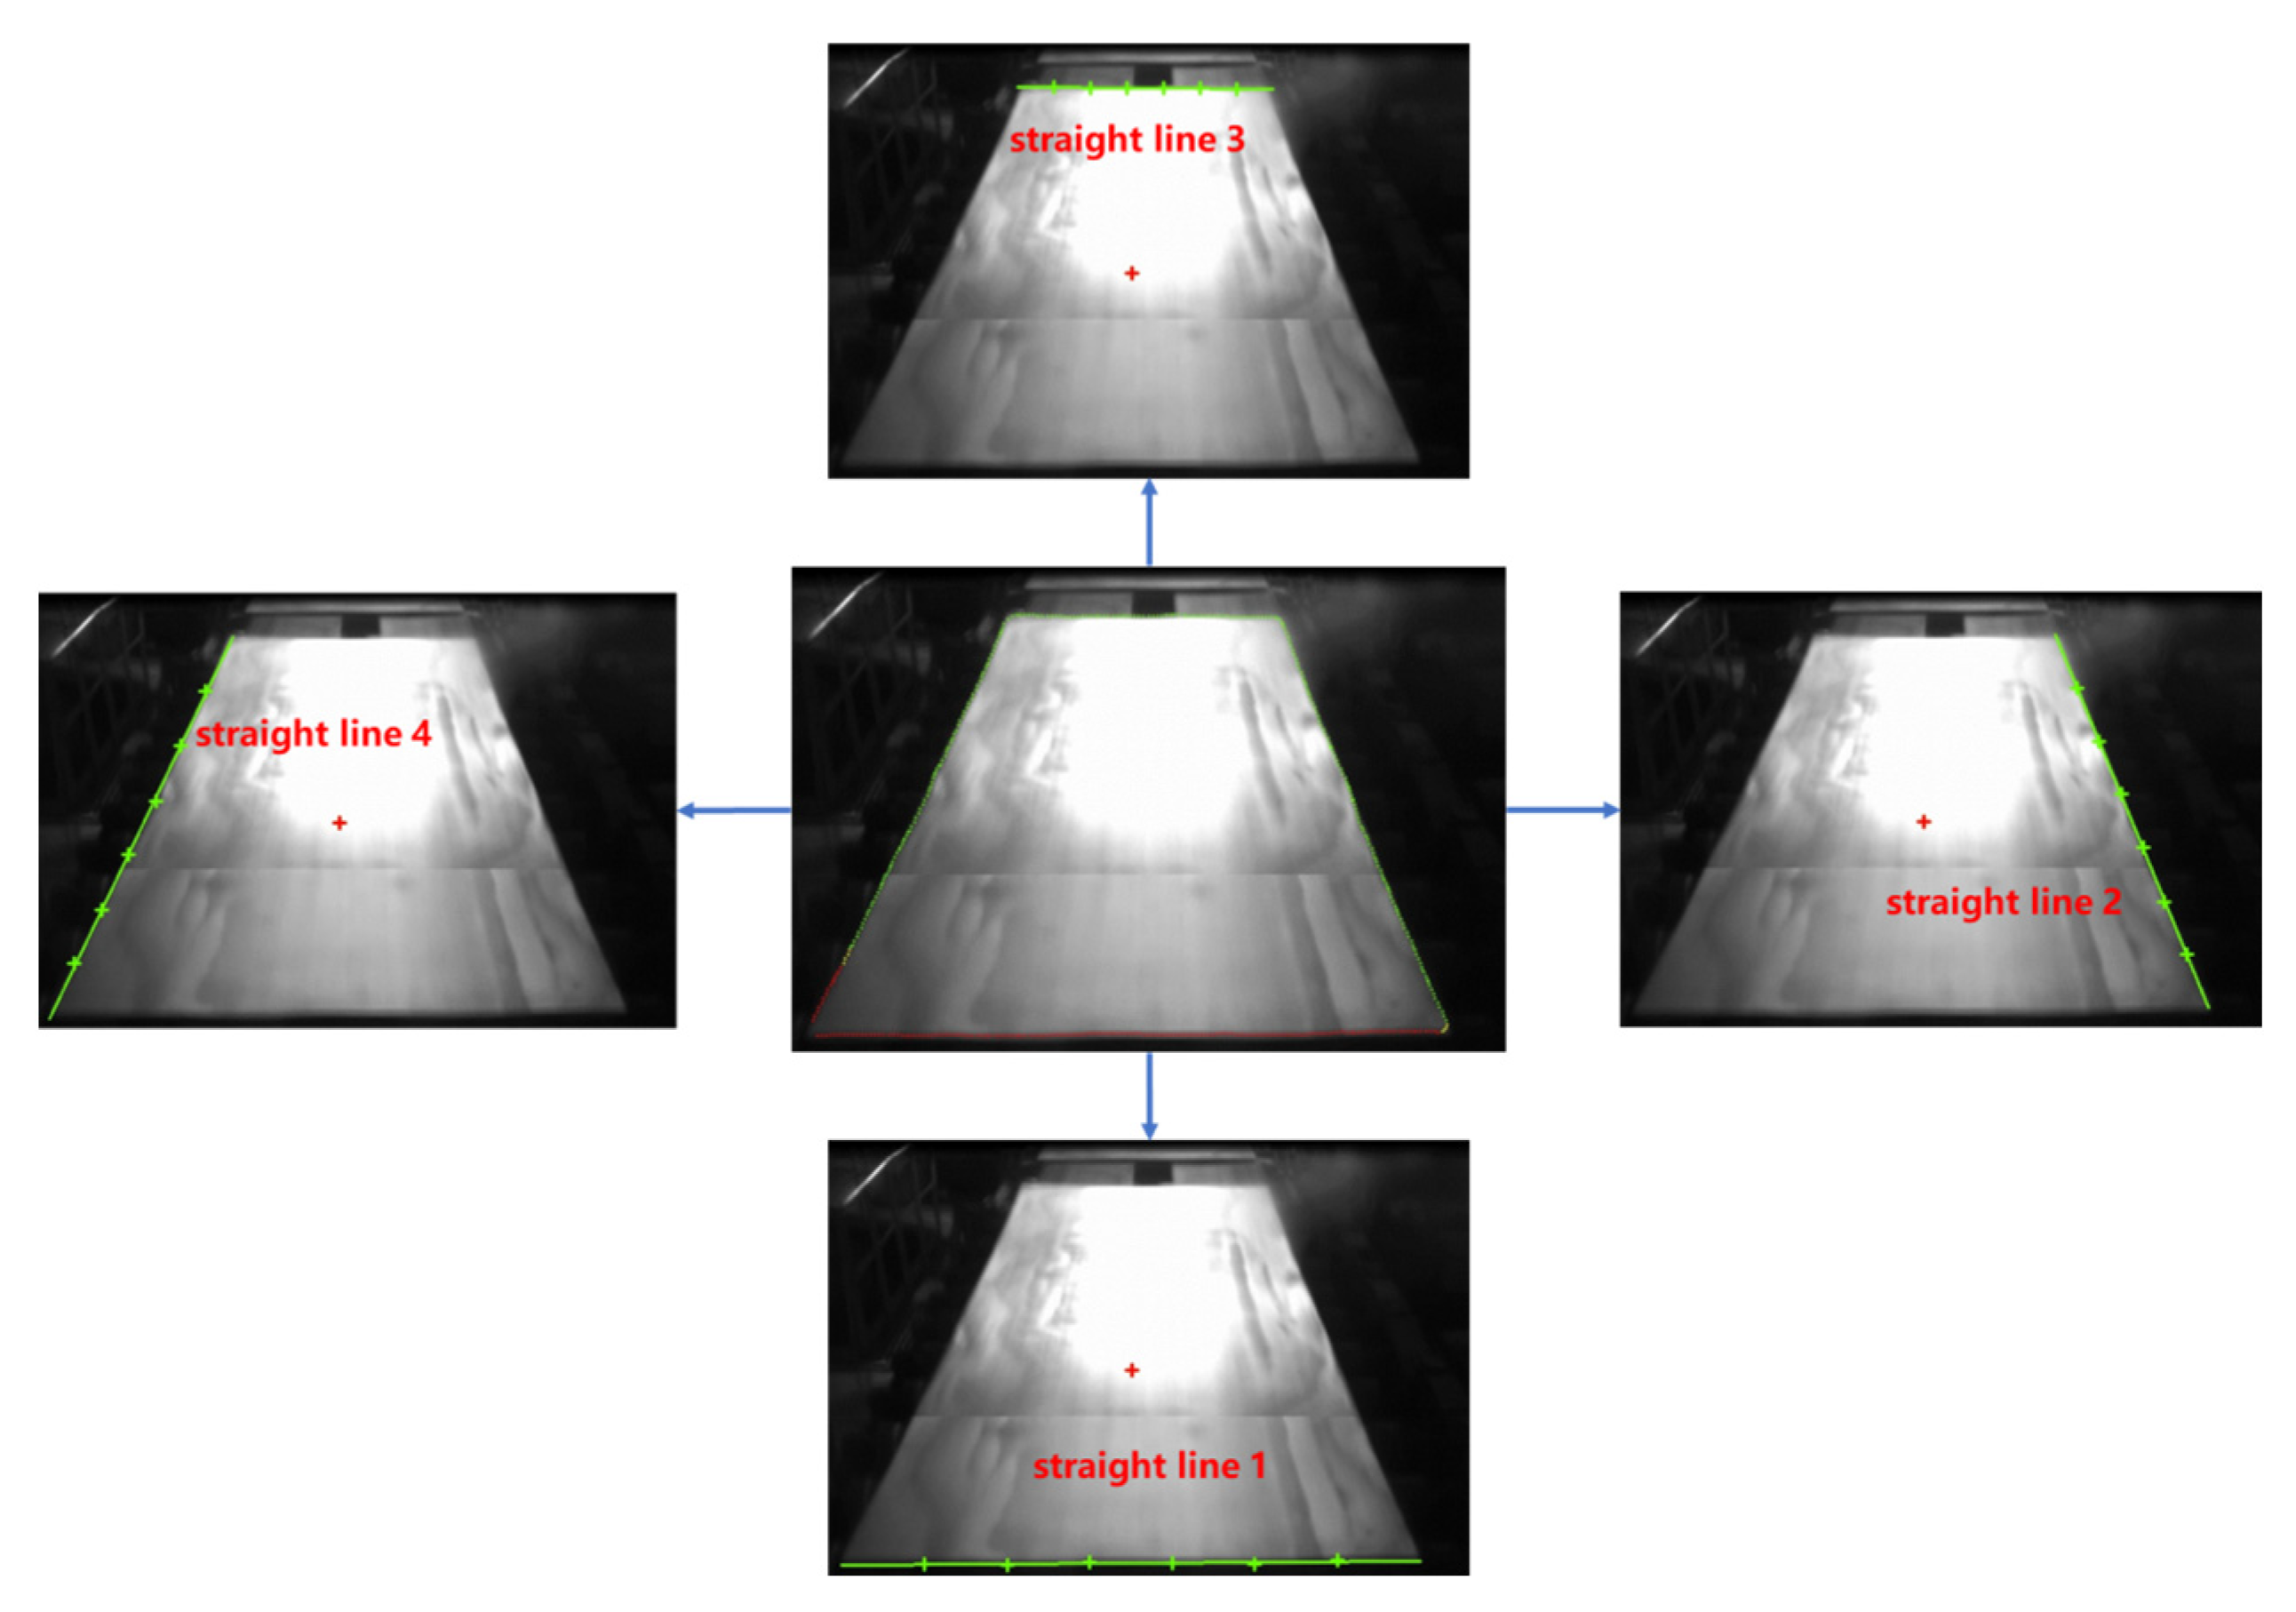
4.1. Fitting Straight Lines to Edge Contours
4.2. Measurement of Cross-Cutting Board Dimensions
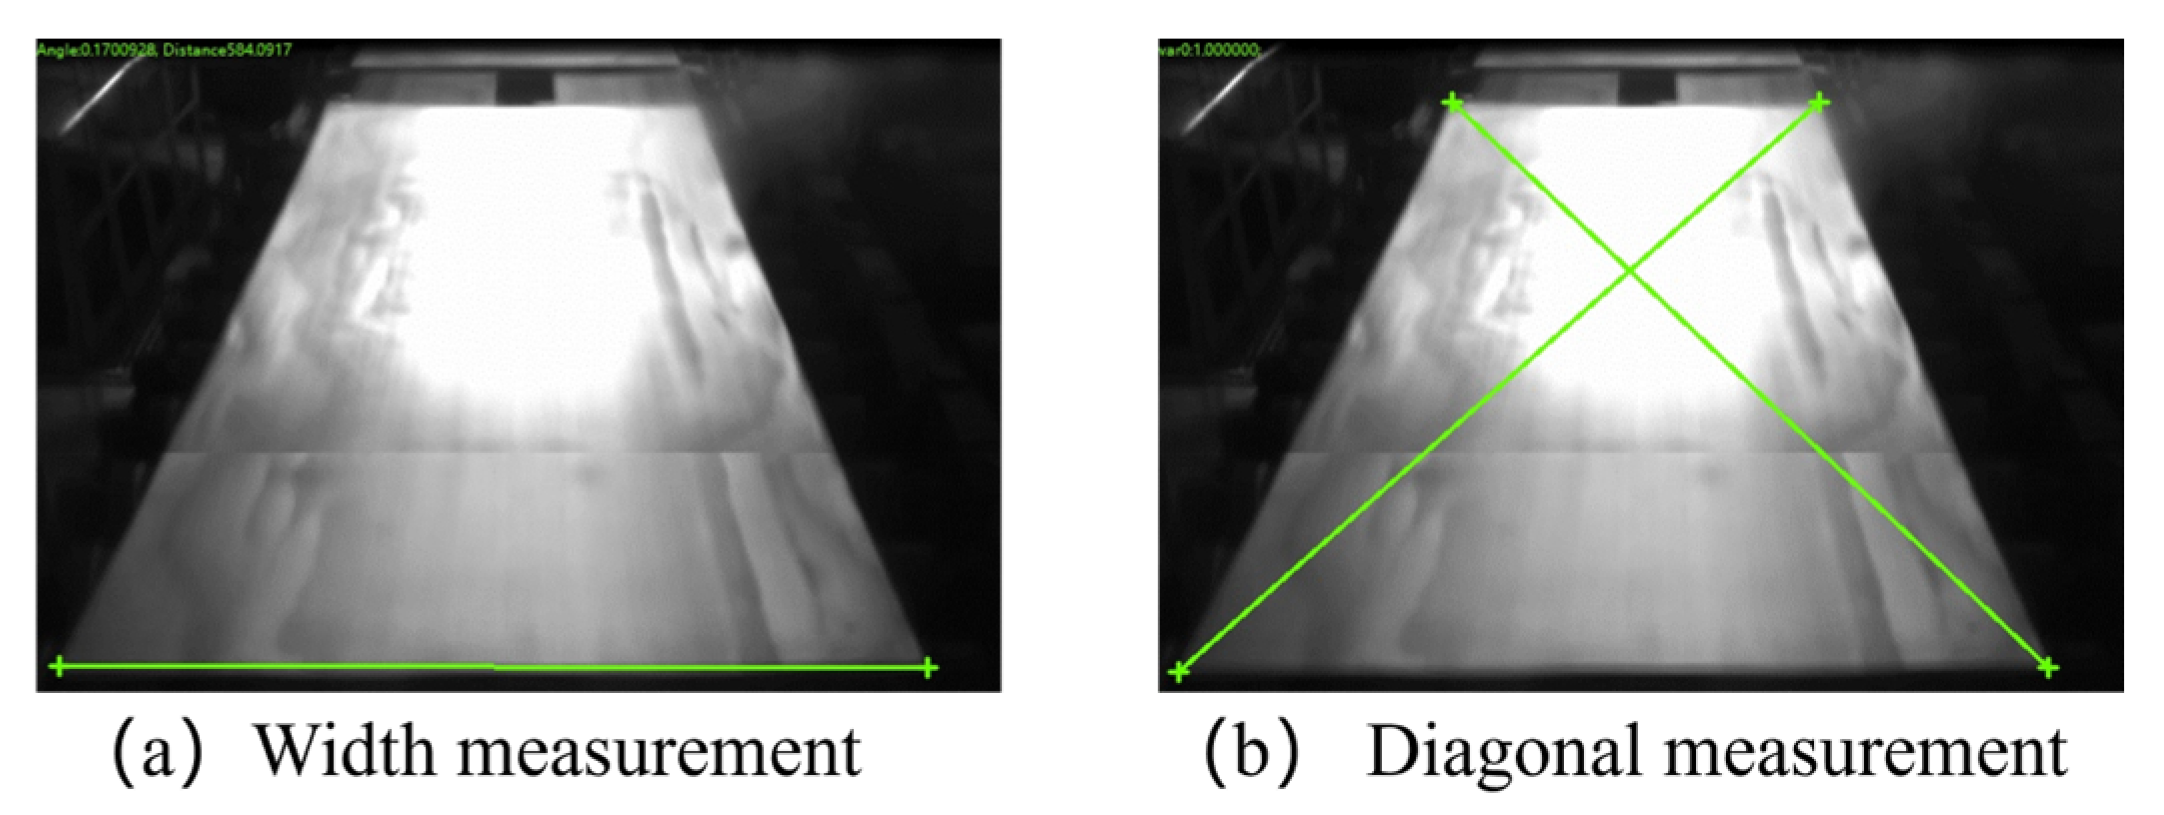
- (1)
- Measurement of width and diagonal
- (2)
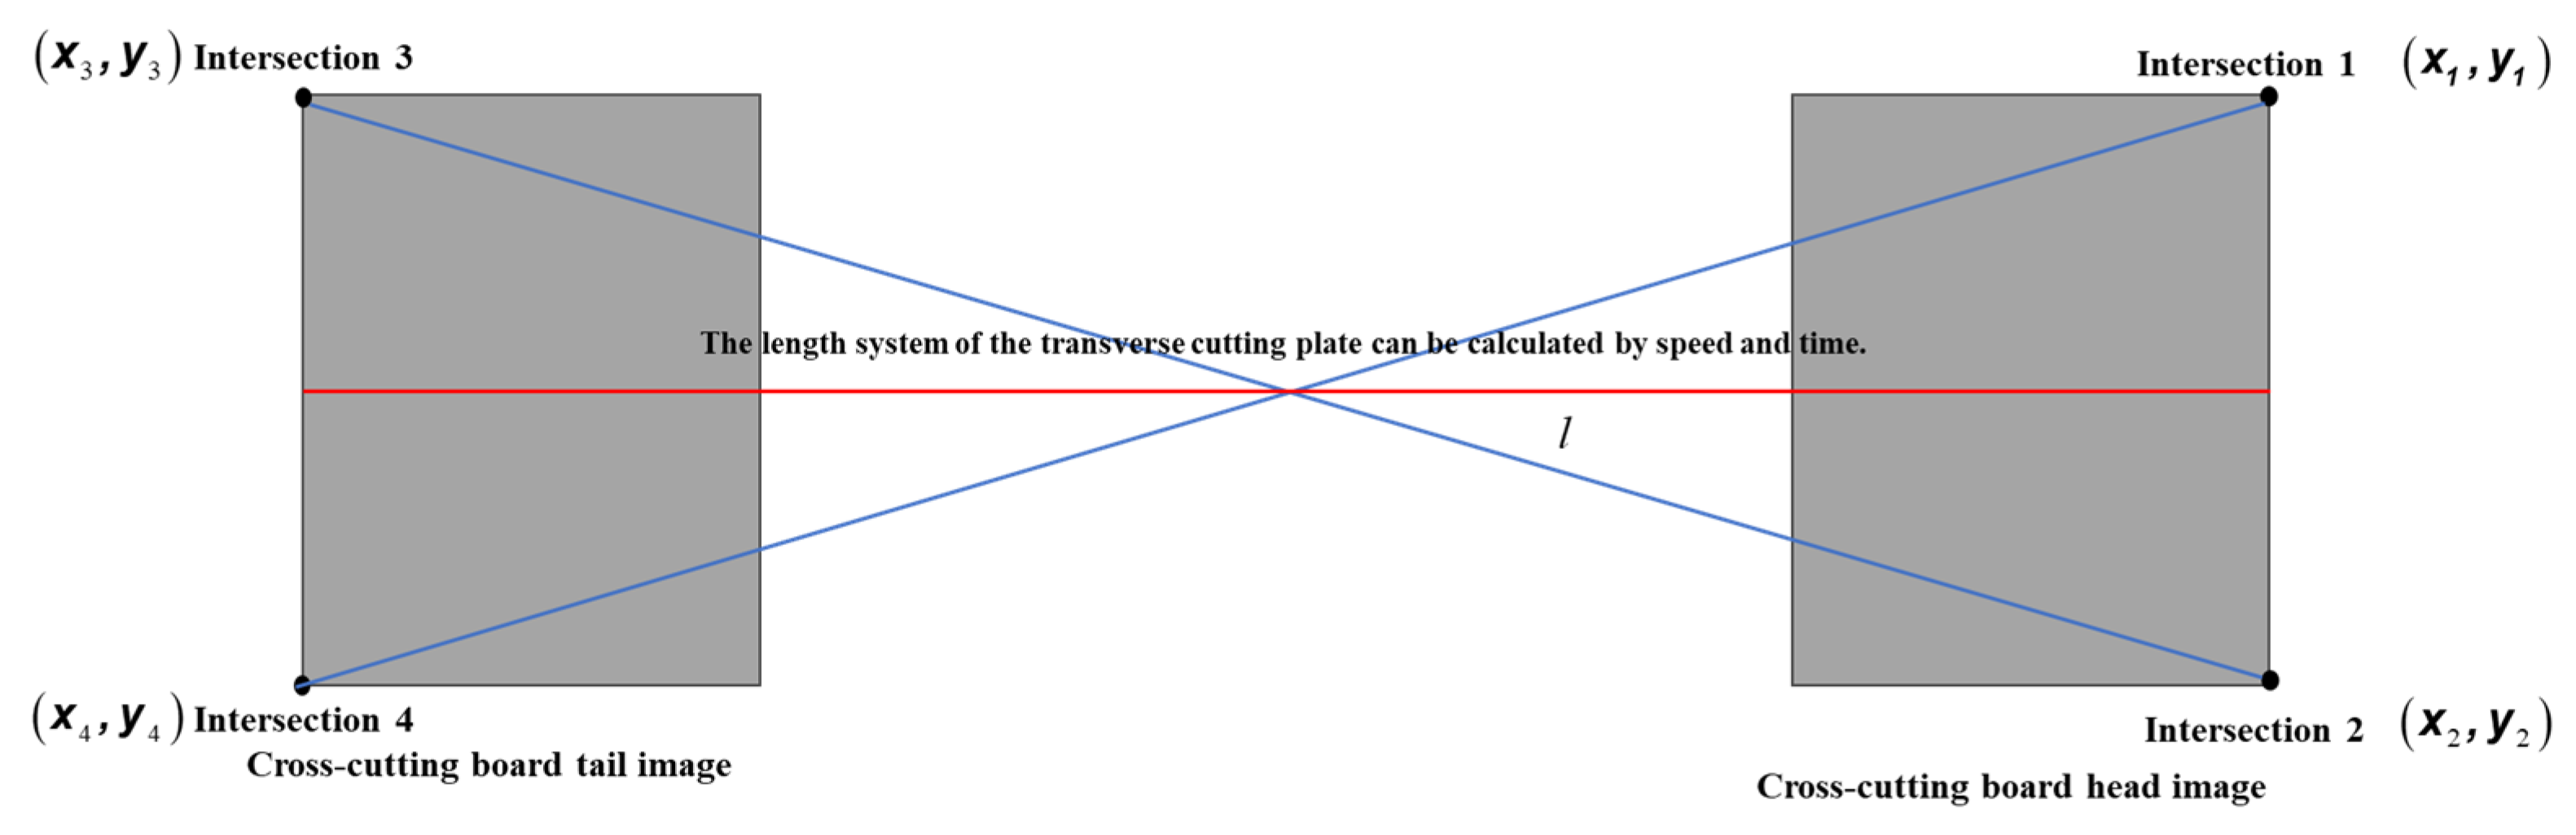
- Measurement of length (l)
- (3)
- Analysis of the measurement accuracy of the length, width, and diagonal difference of the cross-cutting board
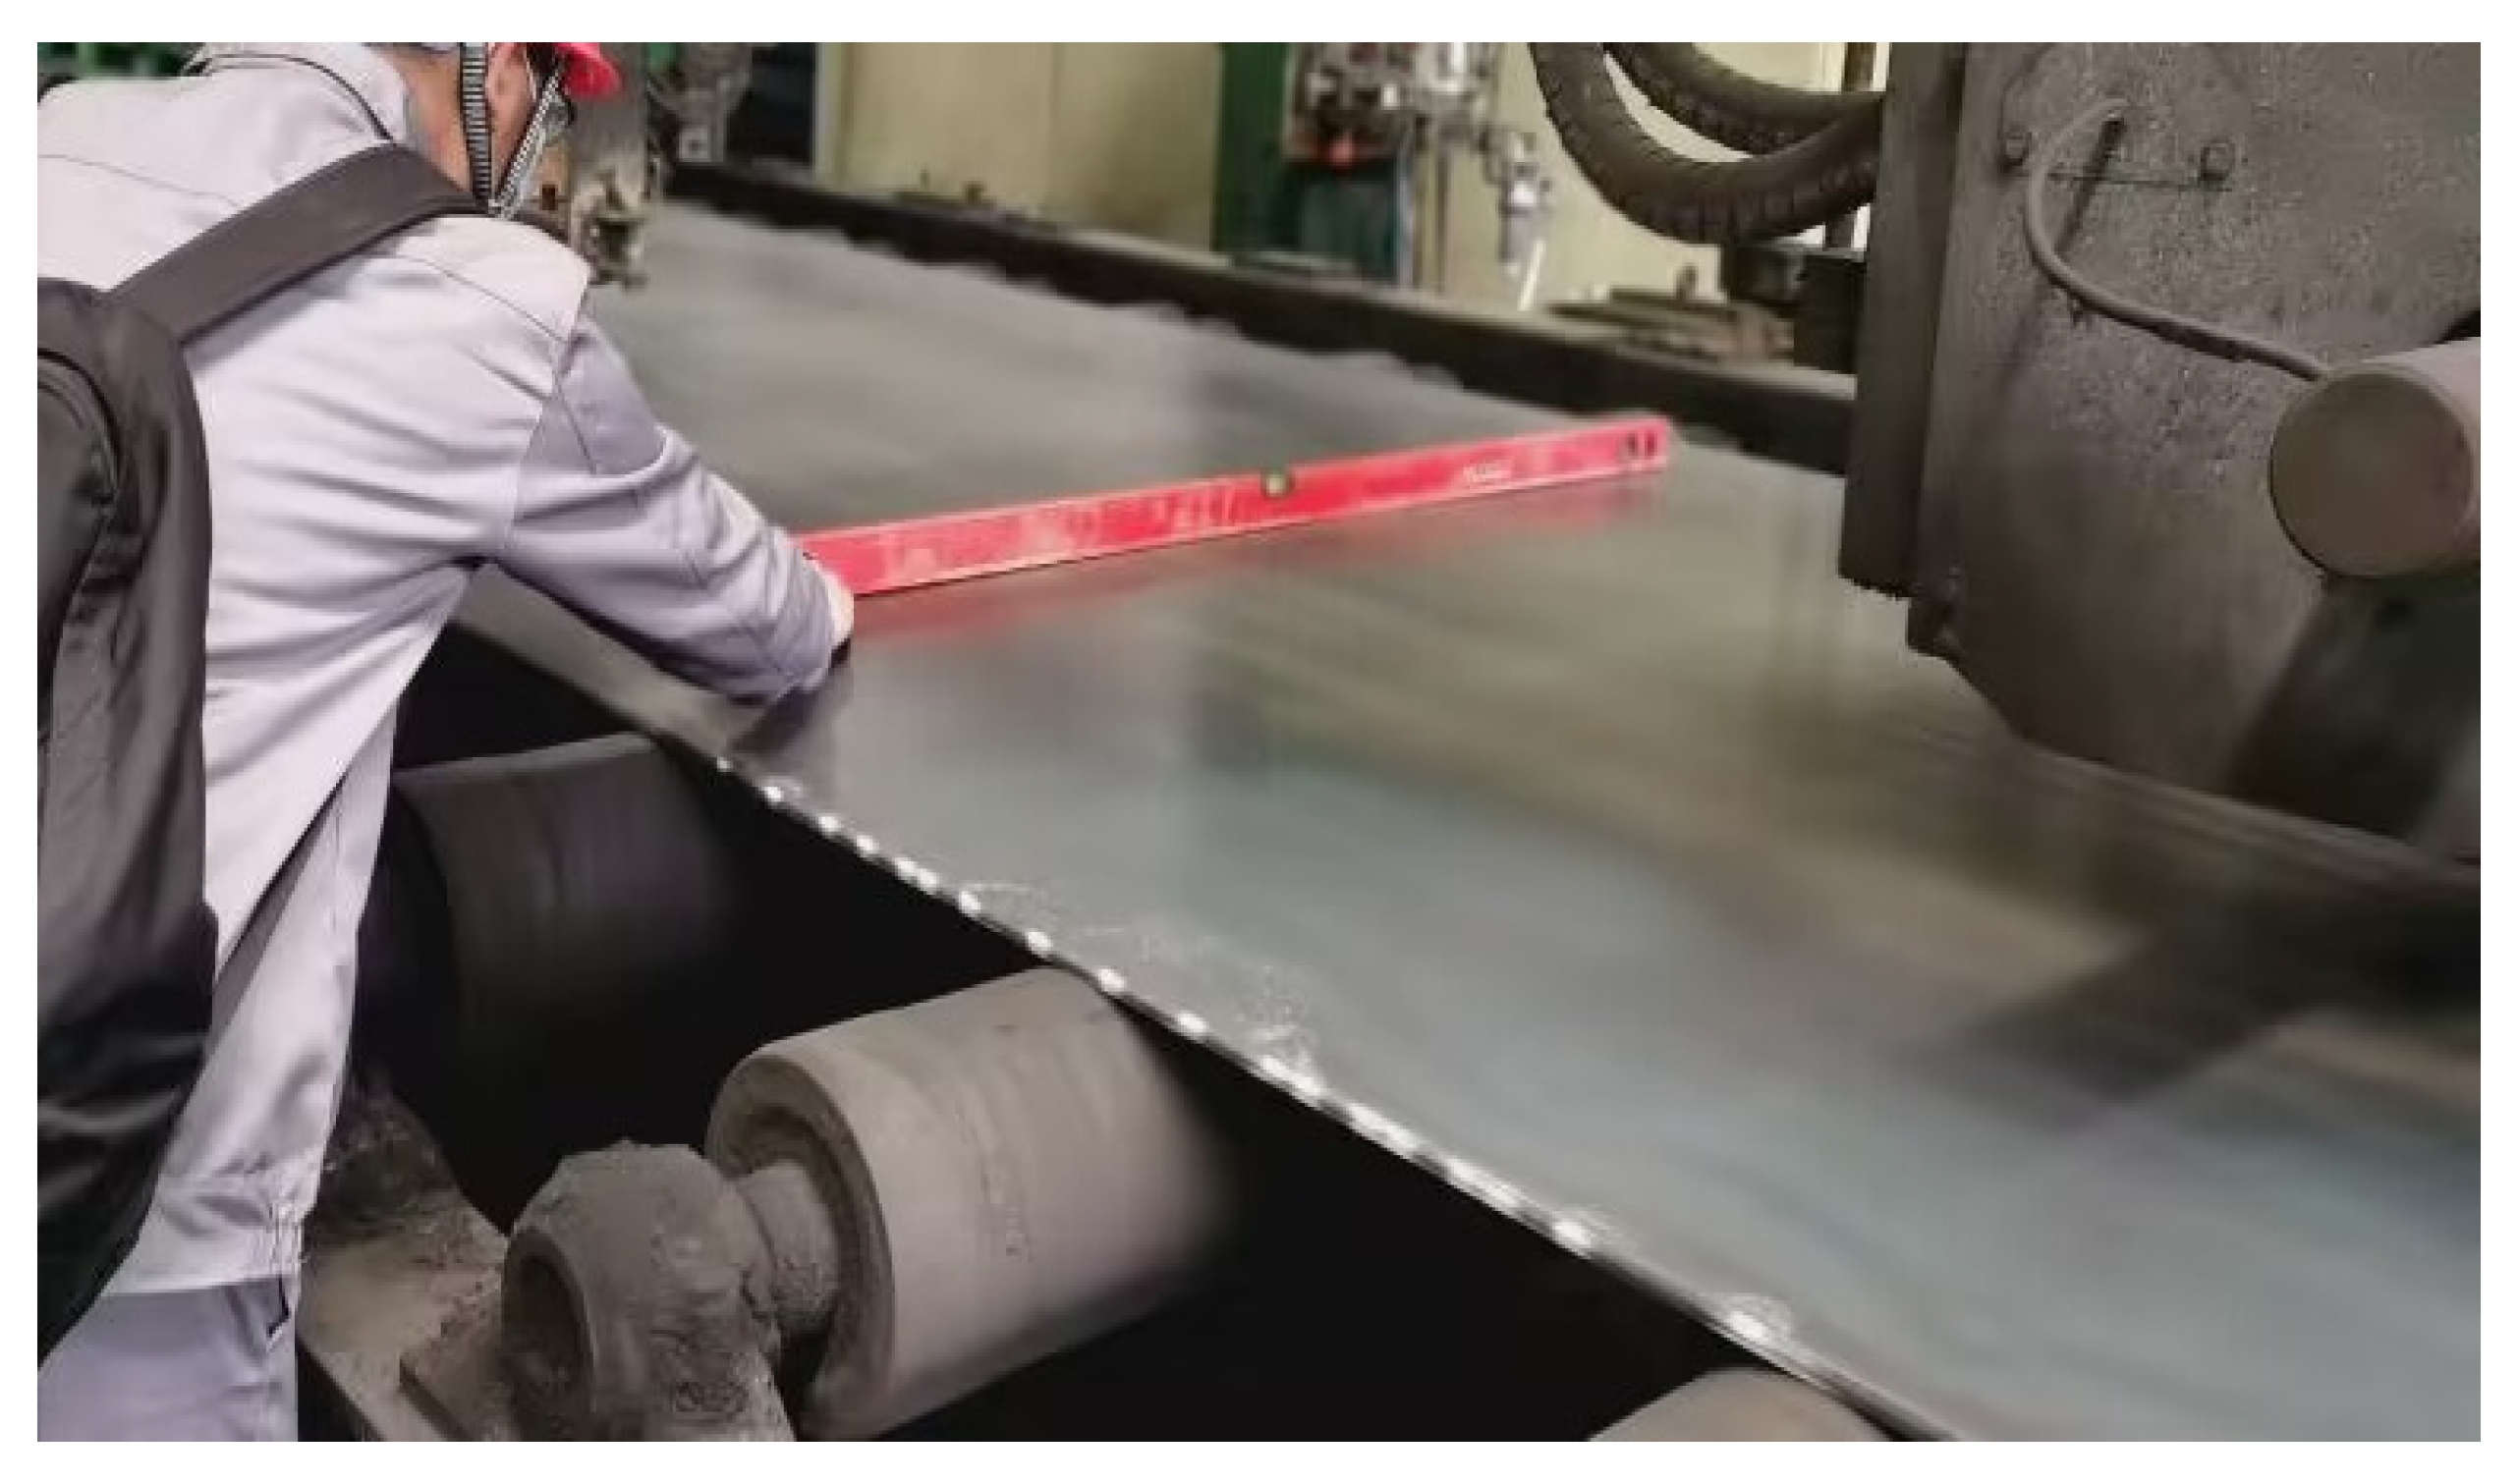
5. Analysis of Industrial Field Application Results
- (1)
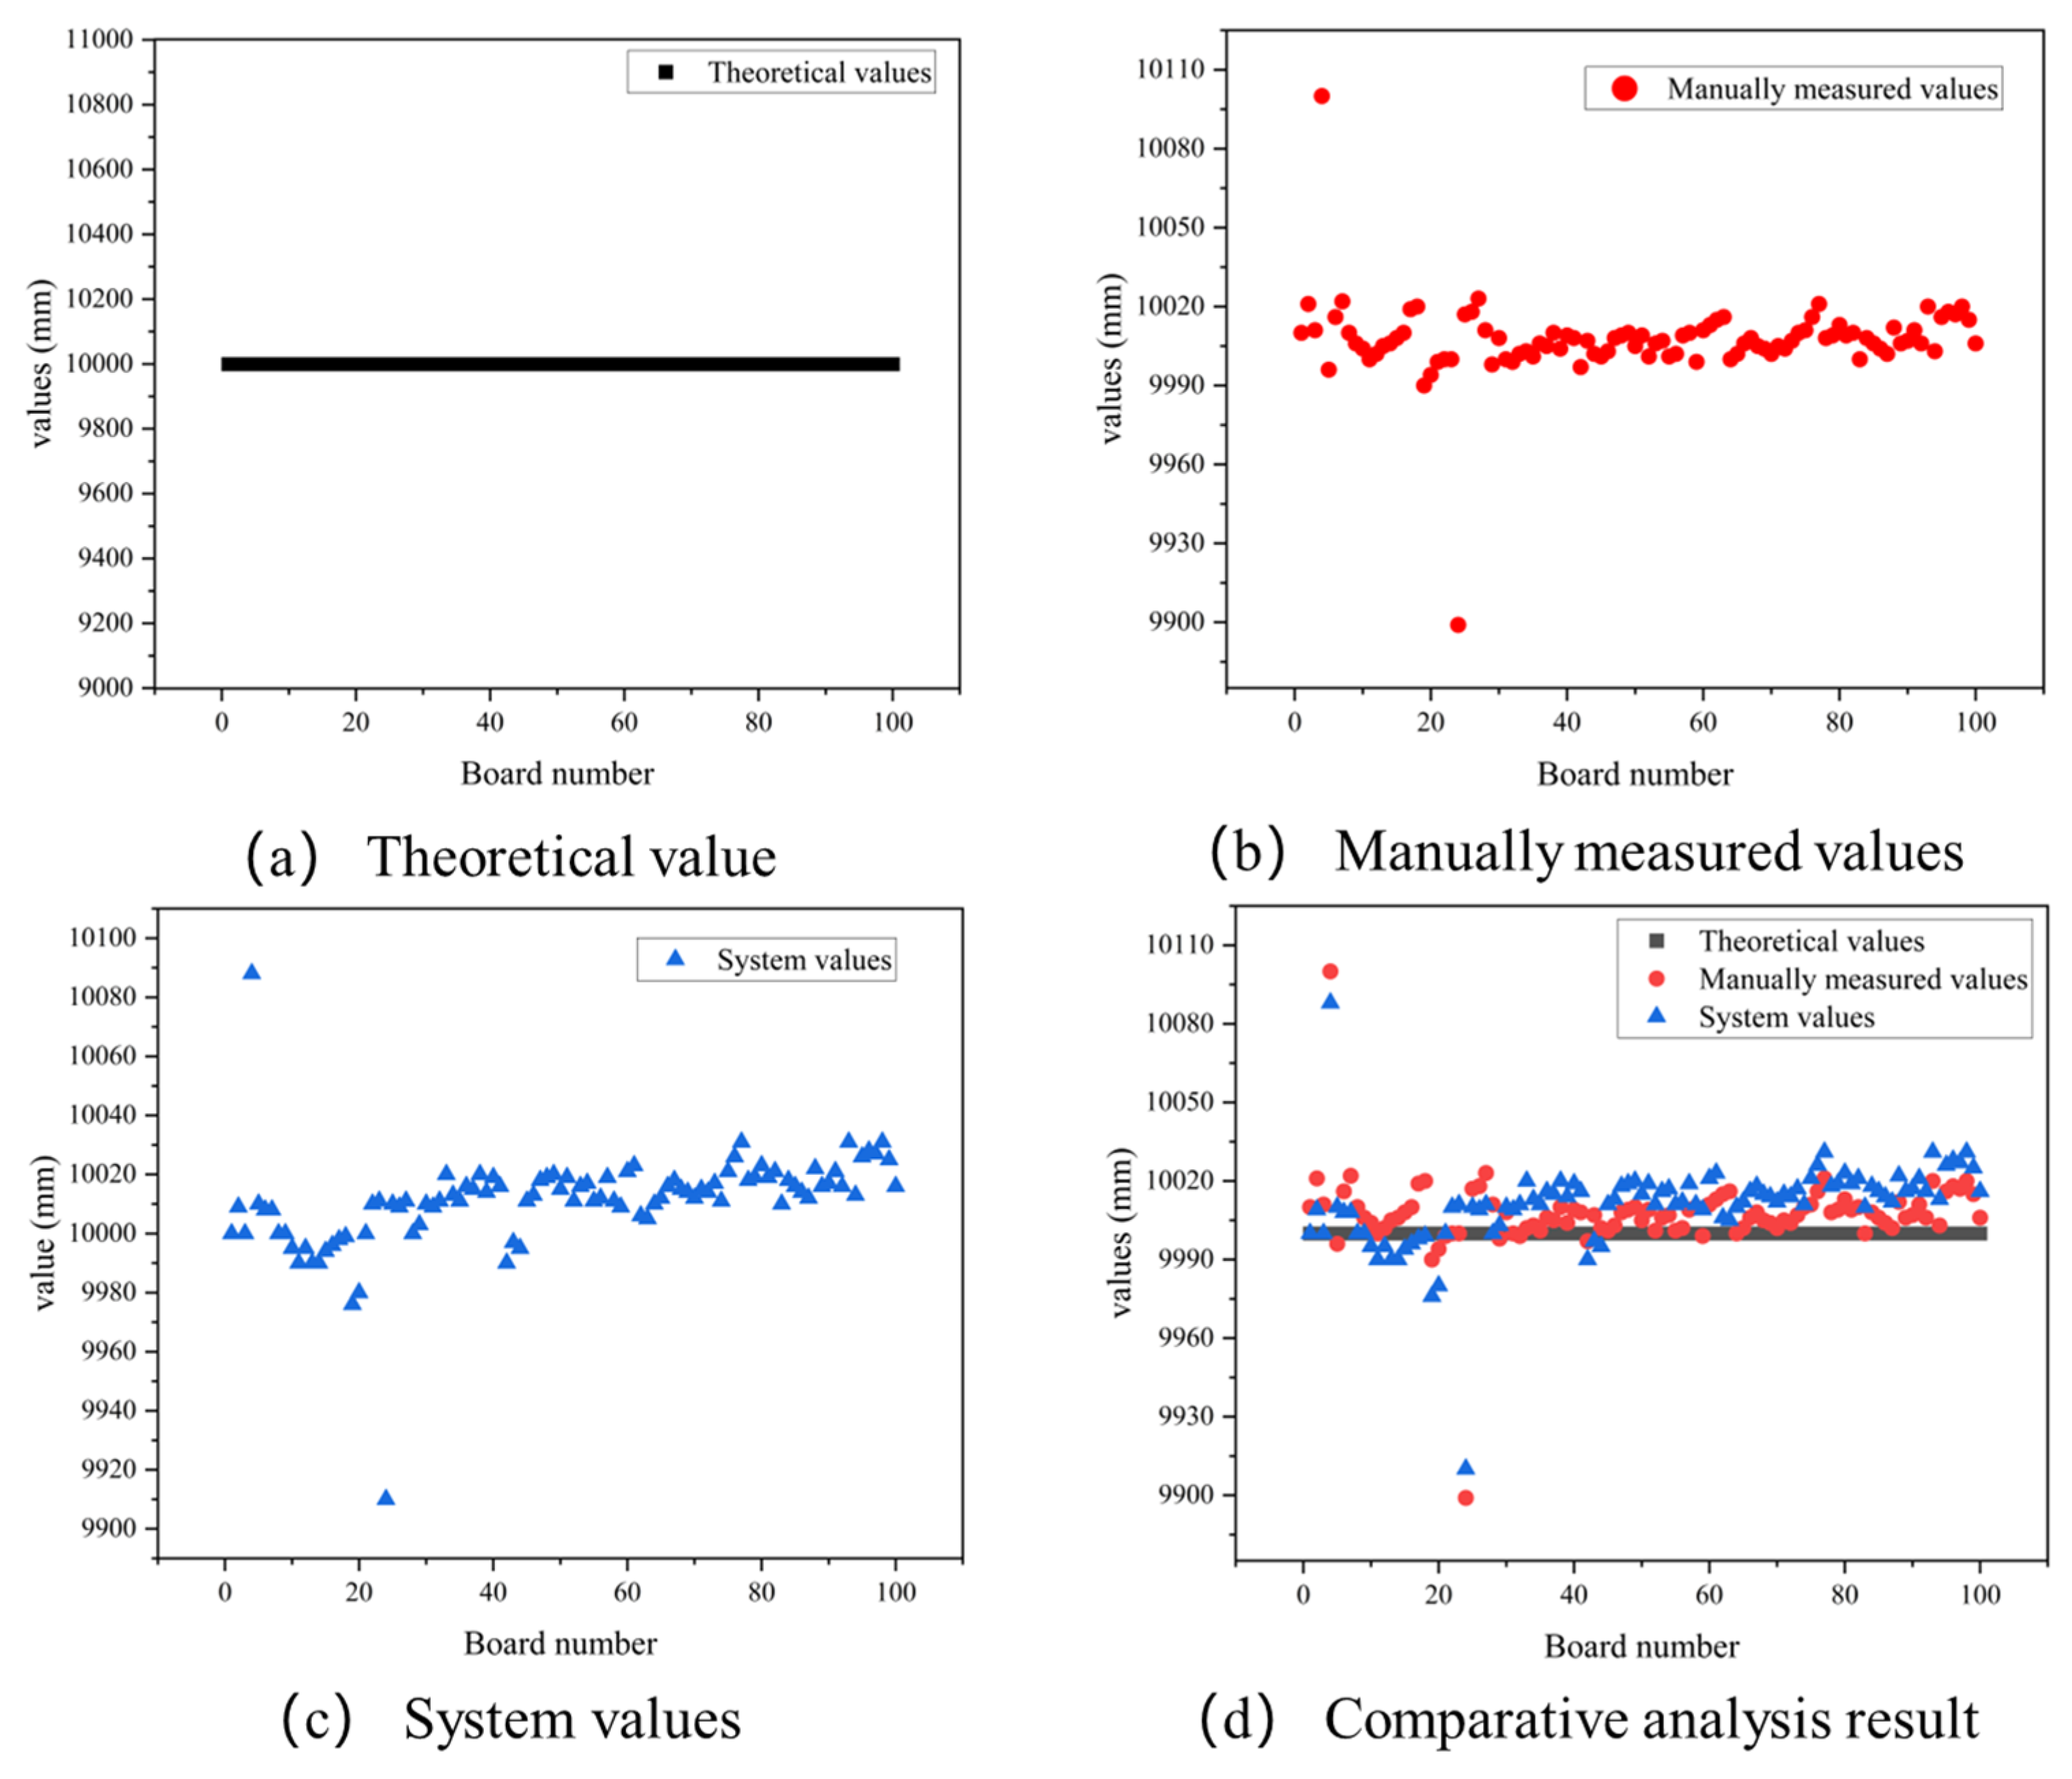
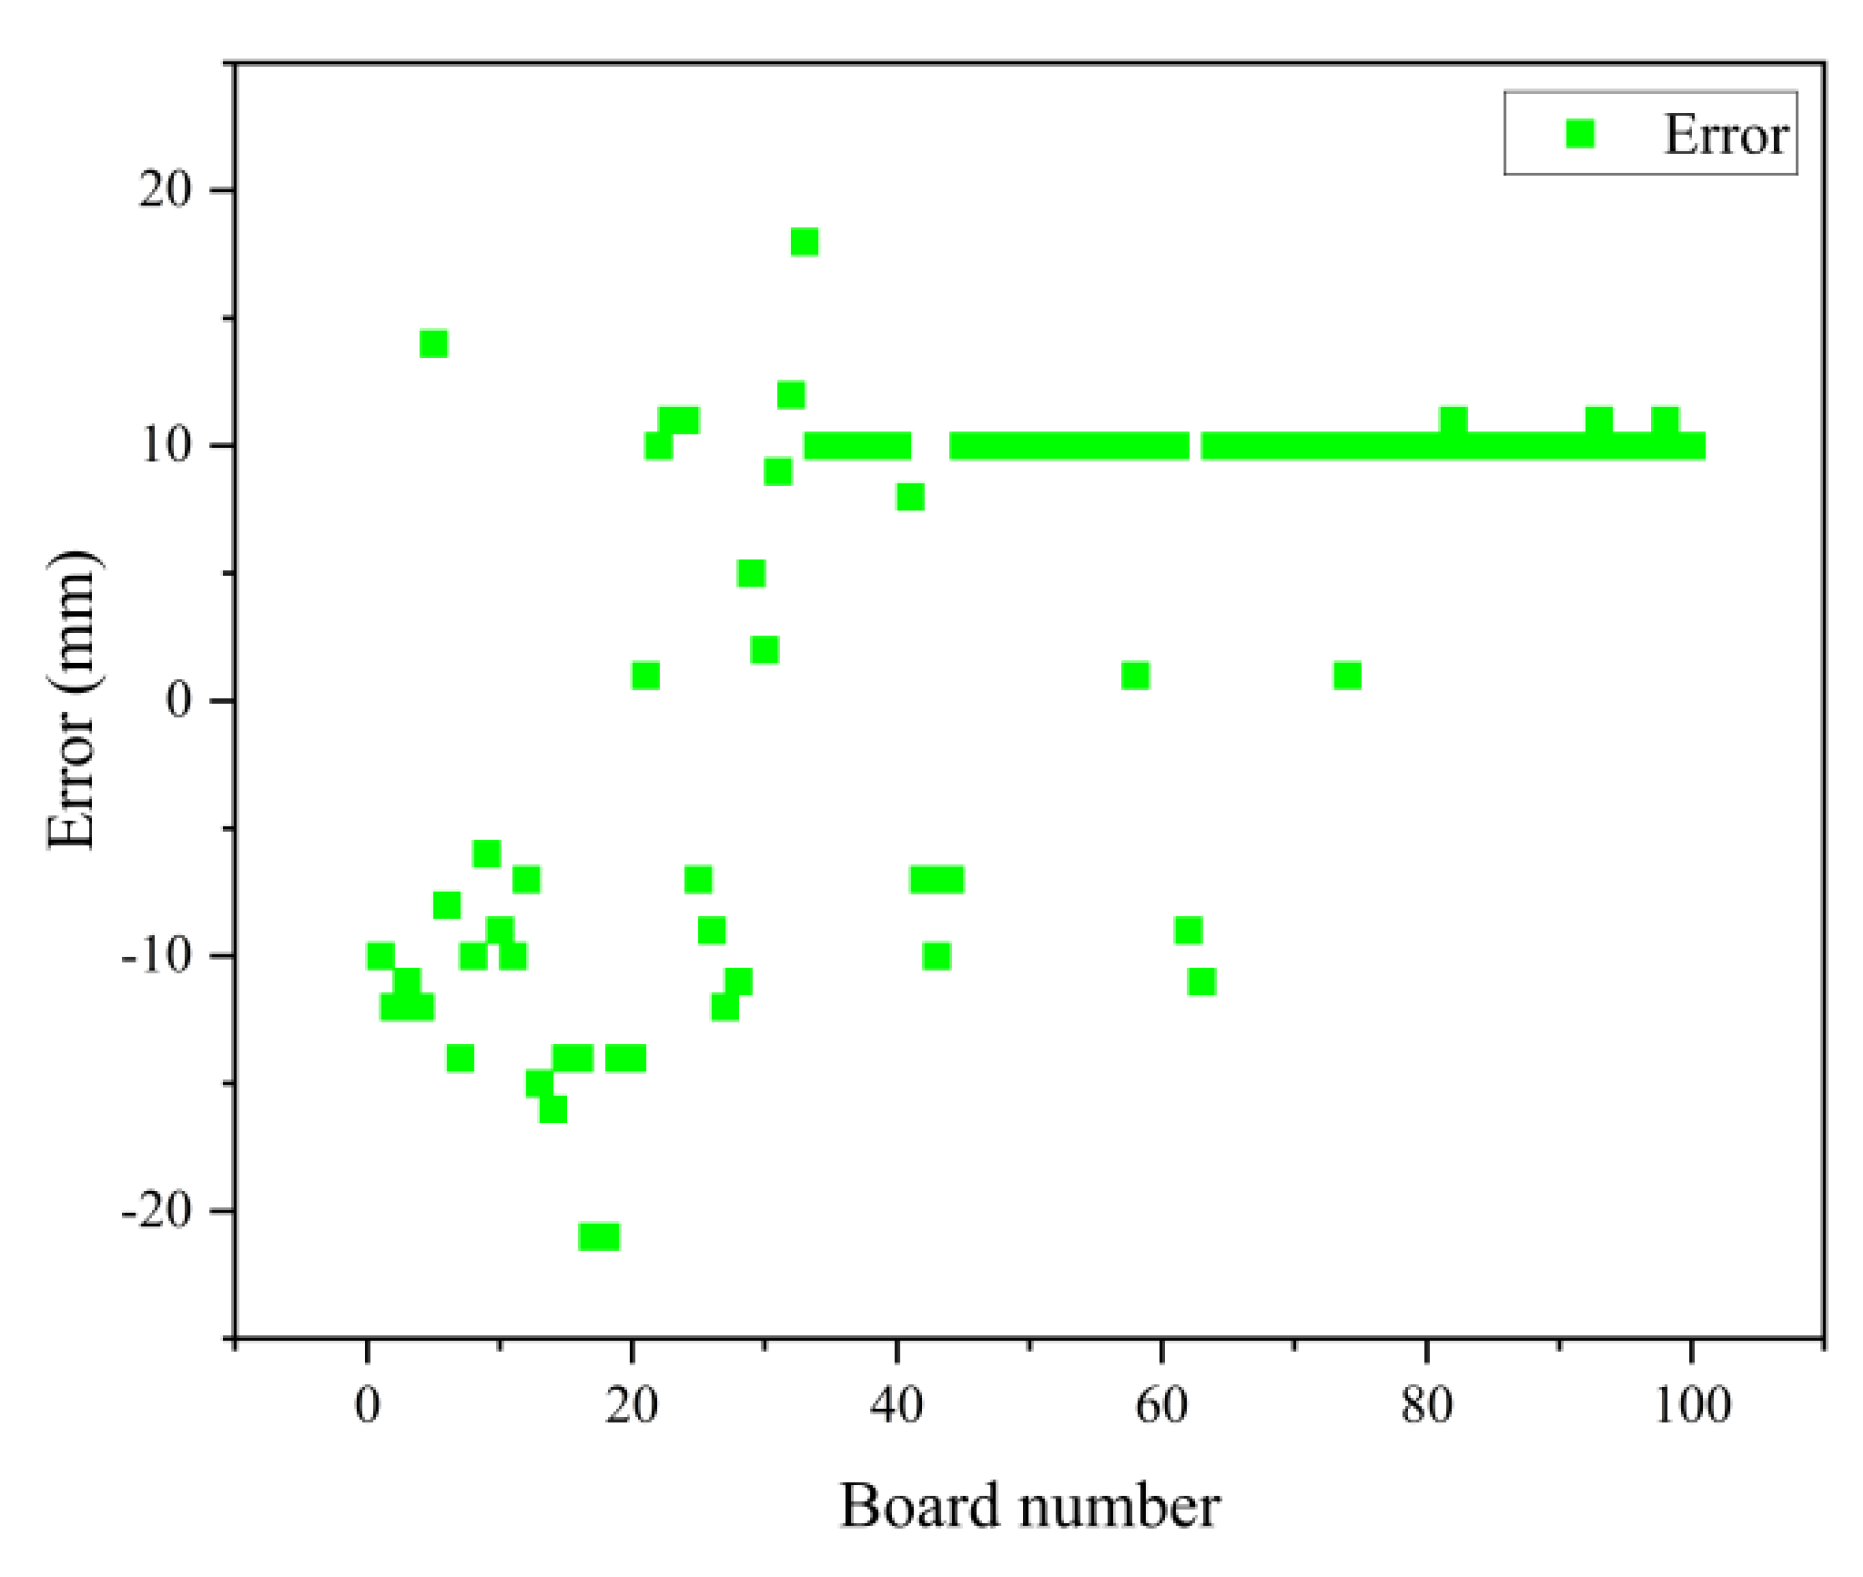
- Results of the cross-cutting board length inspection
- (2)
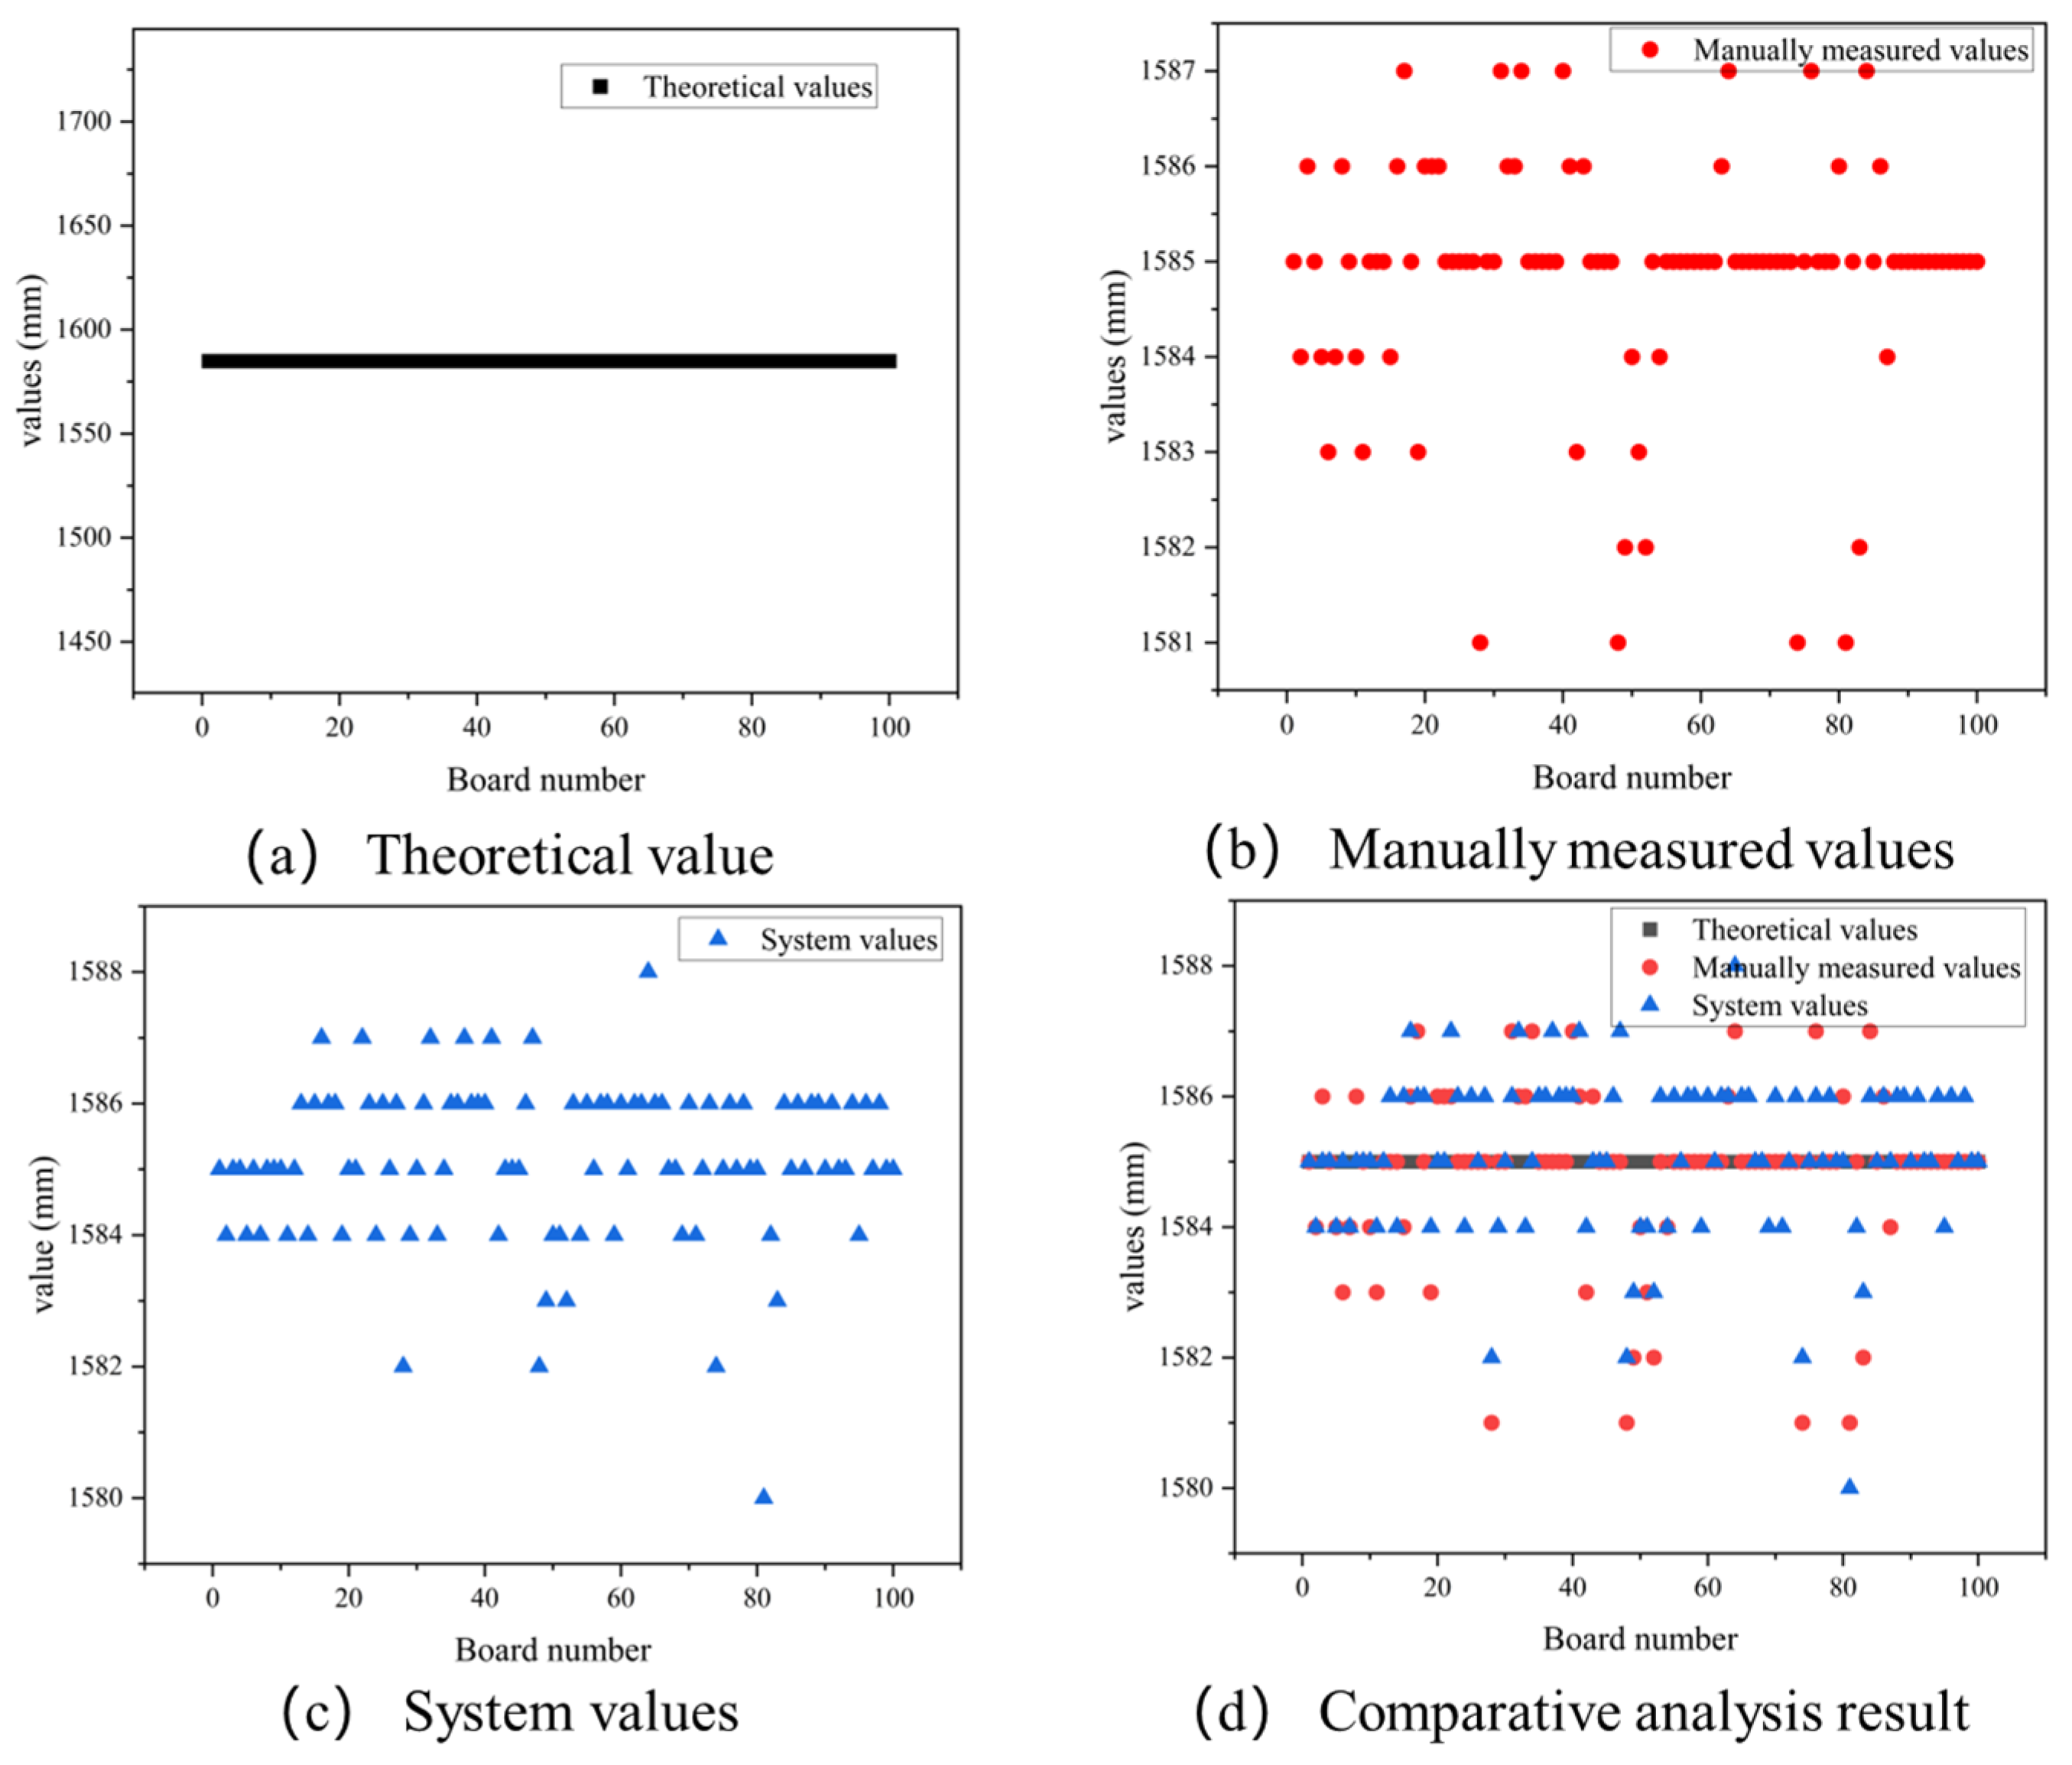
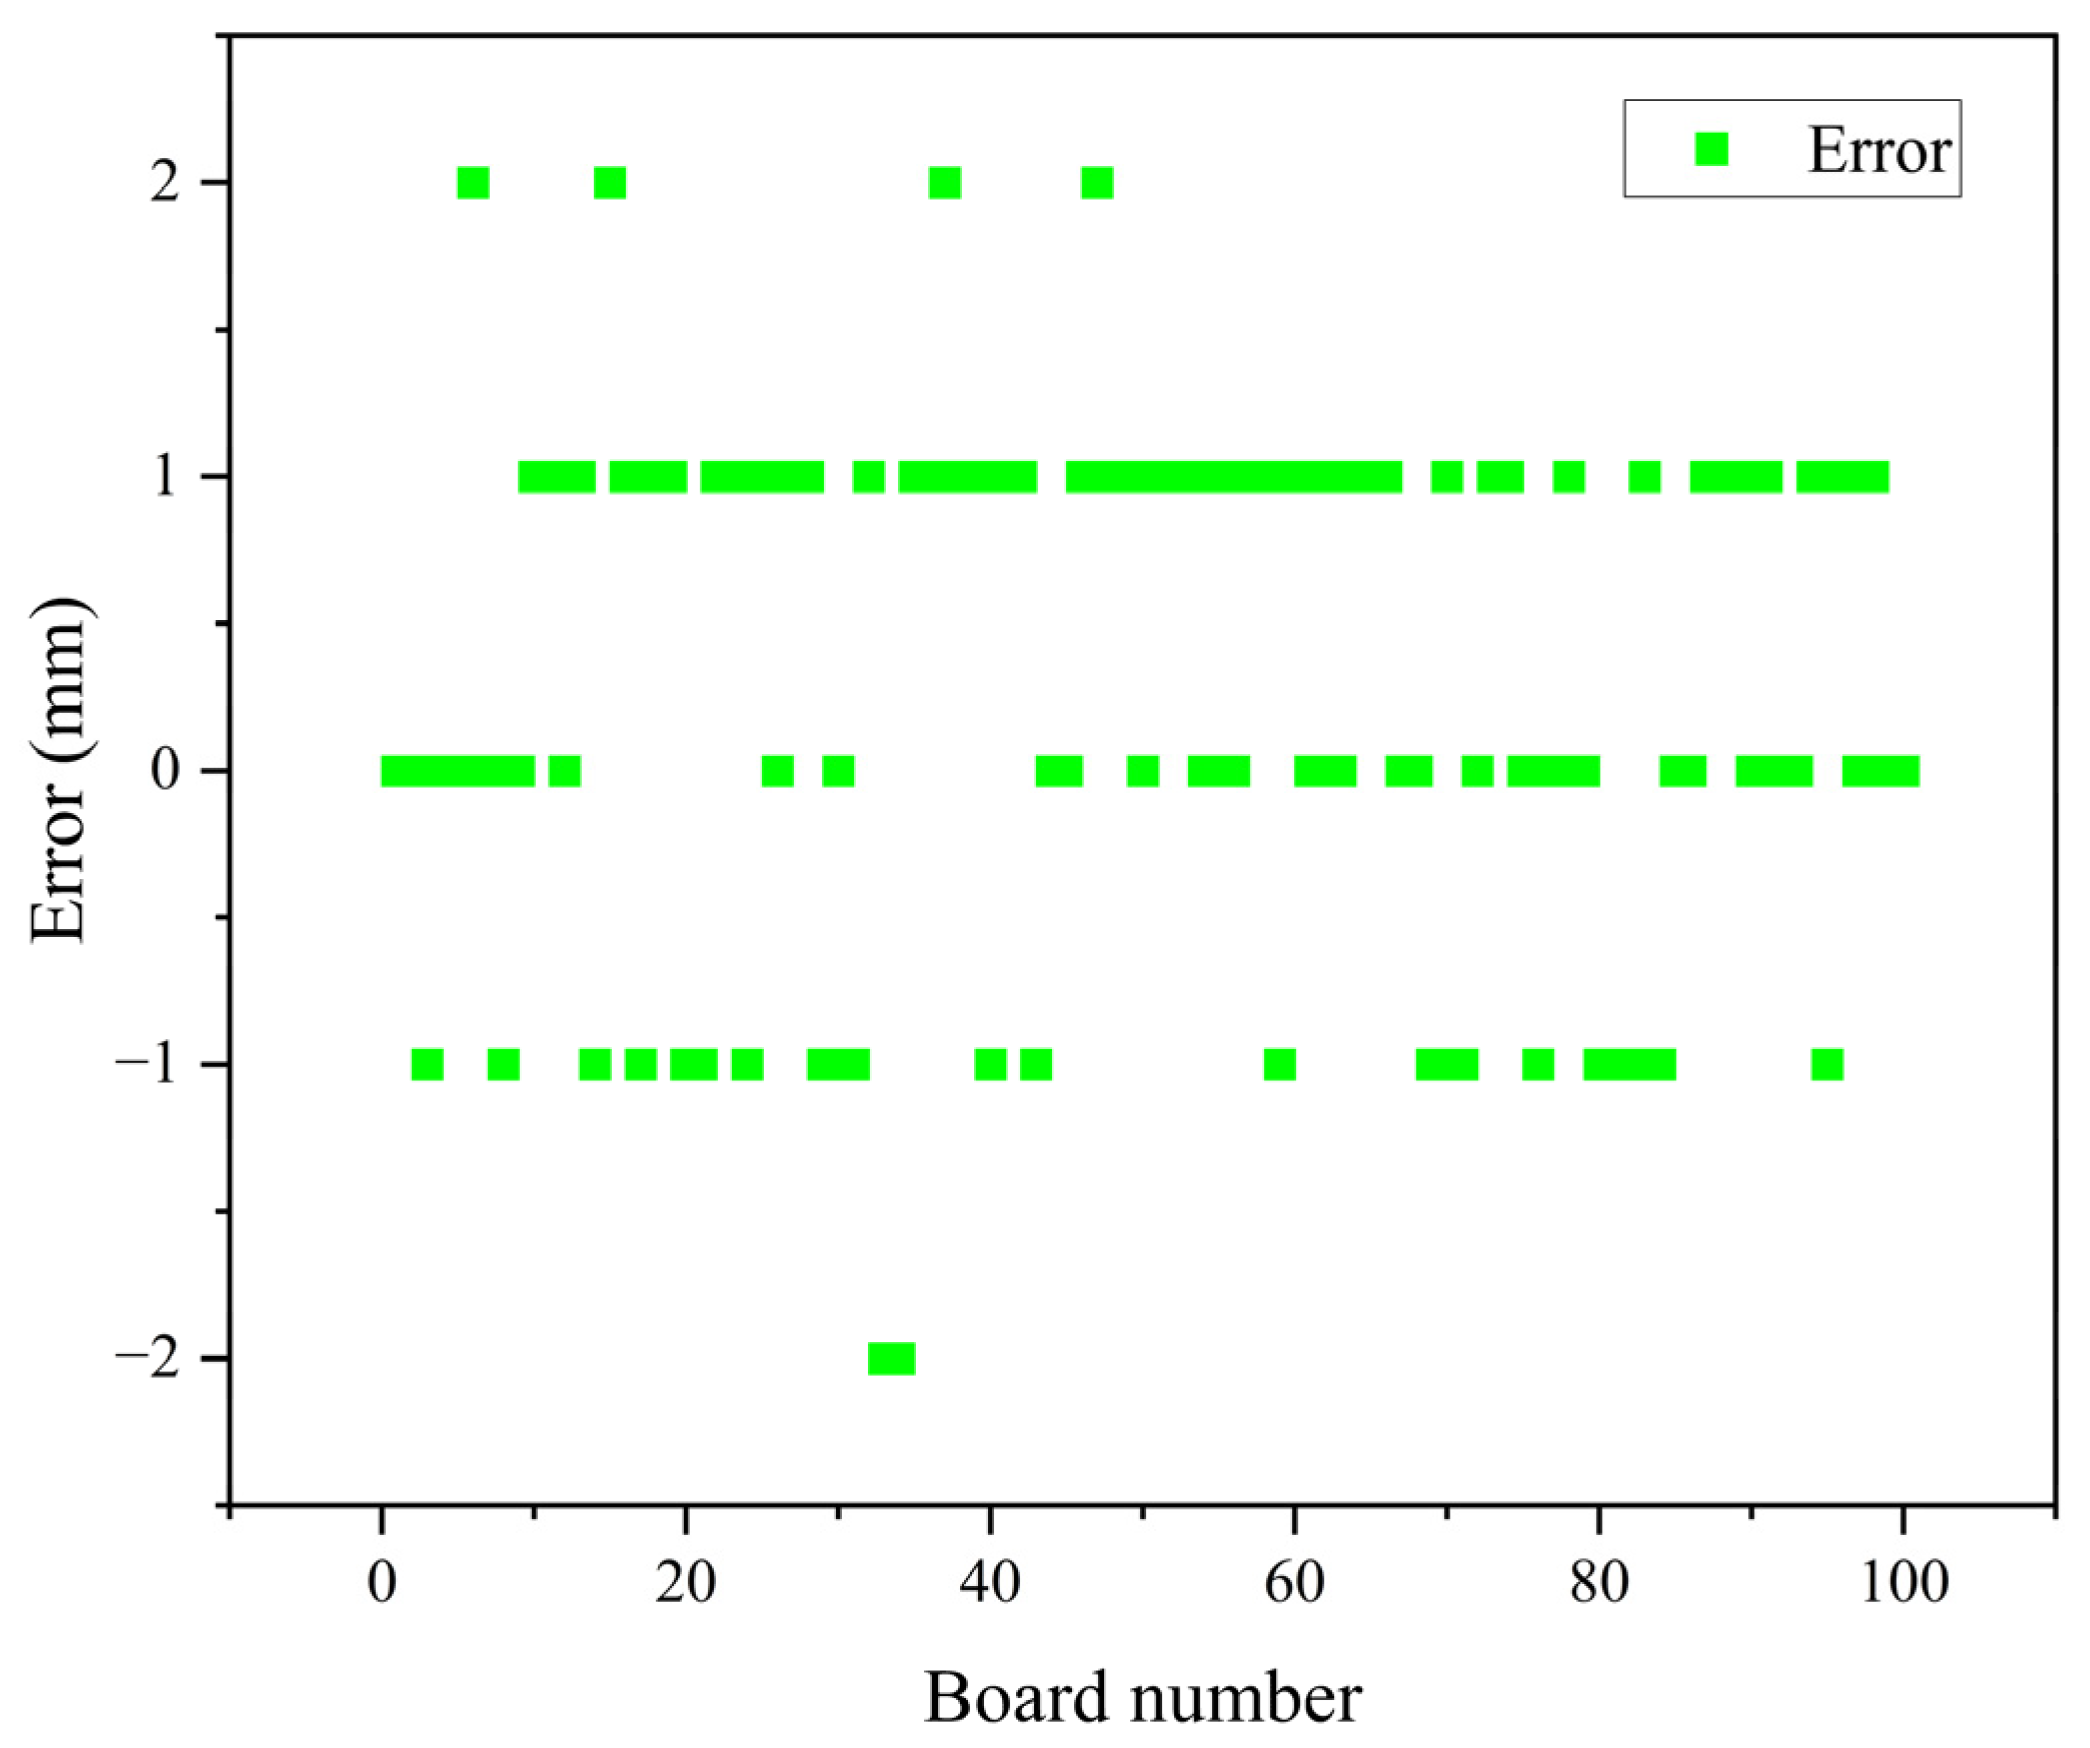
- Width detection result of the cross-cutting board
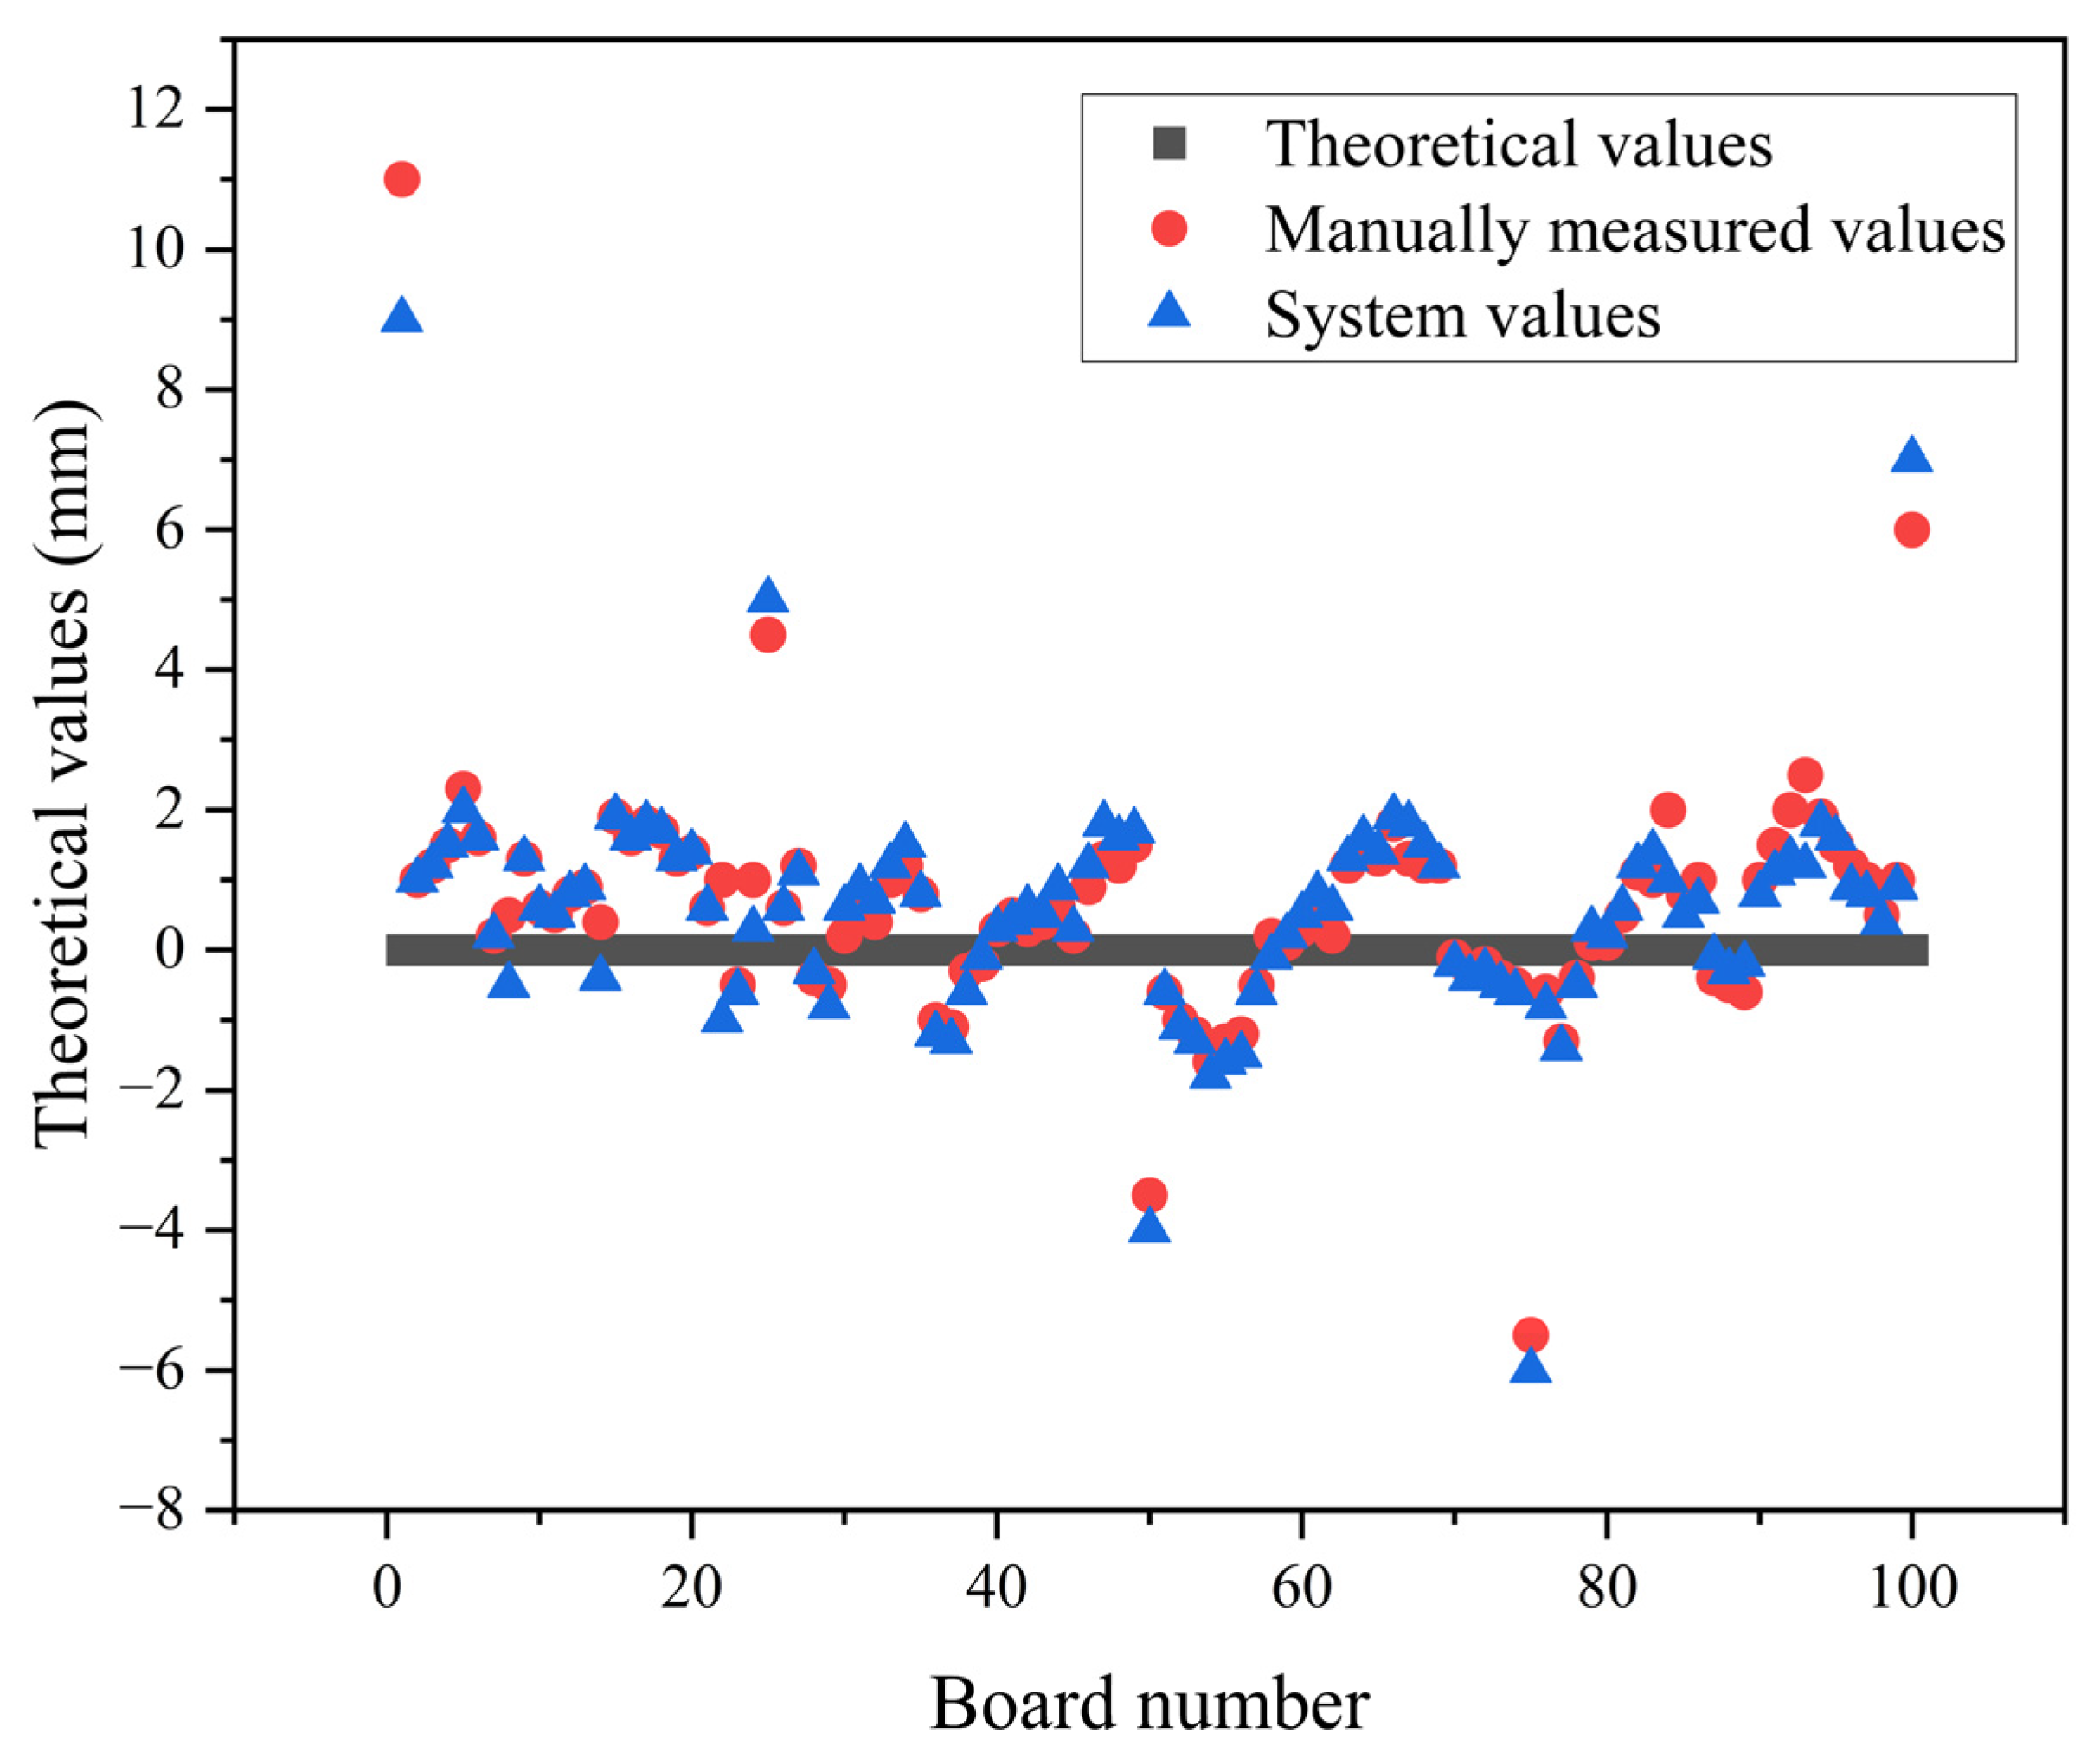
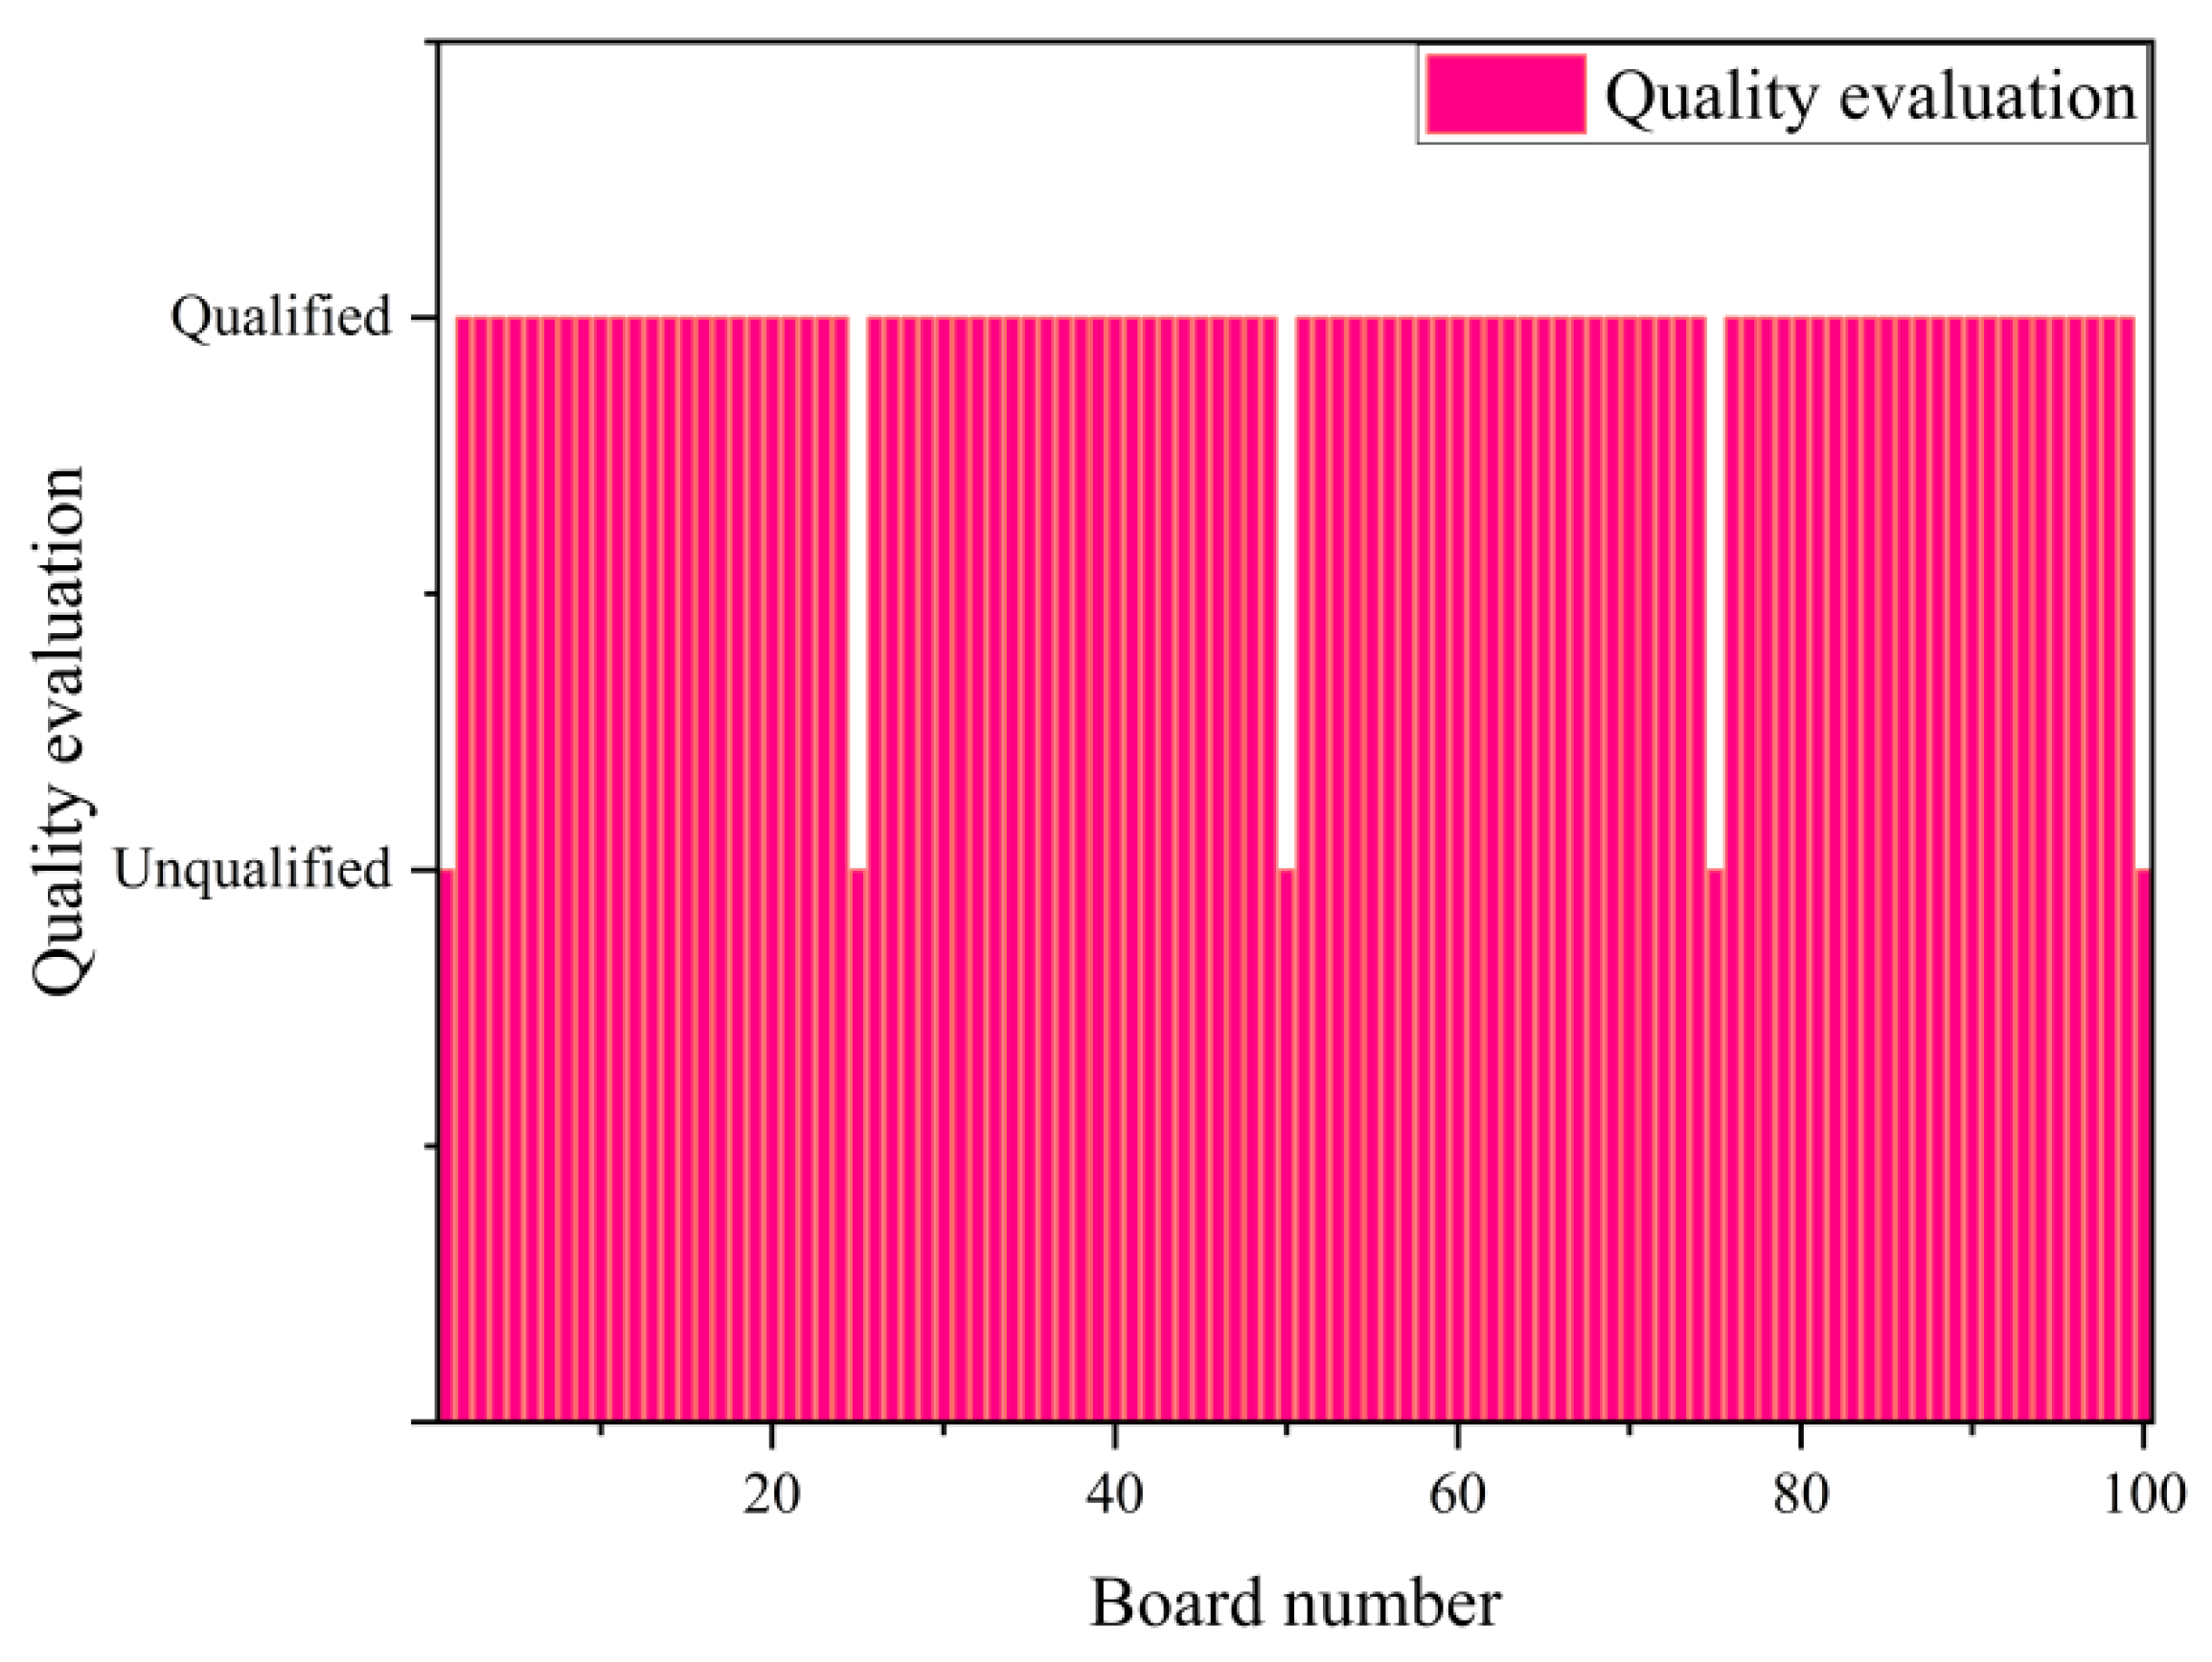
- (3)
- Diagonal detection result of the cross-cutting boards
6. Conclusions
- (1)
- In order to address the industrial environment, industrial cameras need to capture images of cross-cutting boards at a certain angle. A visual inspection coordinate transformation model suitable for the industrial field has been established, which can effectively reduce detection errors caused by camera tilt.
- (2)
- Aiming at the influence of environmental factors such as dust and iron scrap in the industrial site, this paper developed a series filter based on morphological processing to effectively remove the noise in the field environment by comparing the existing filtering techniques such as median filtering, mean filtering, and Gaussian filtering.
- (3)
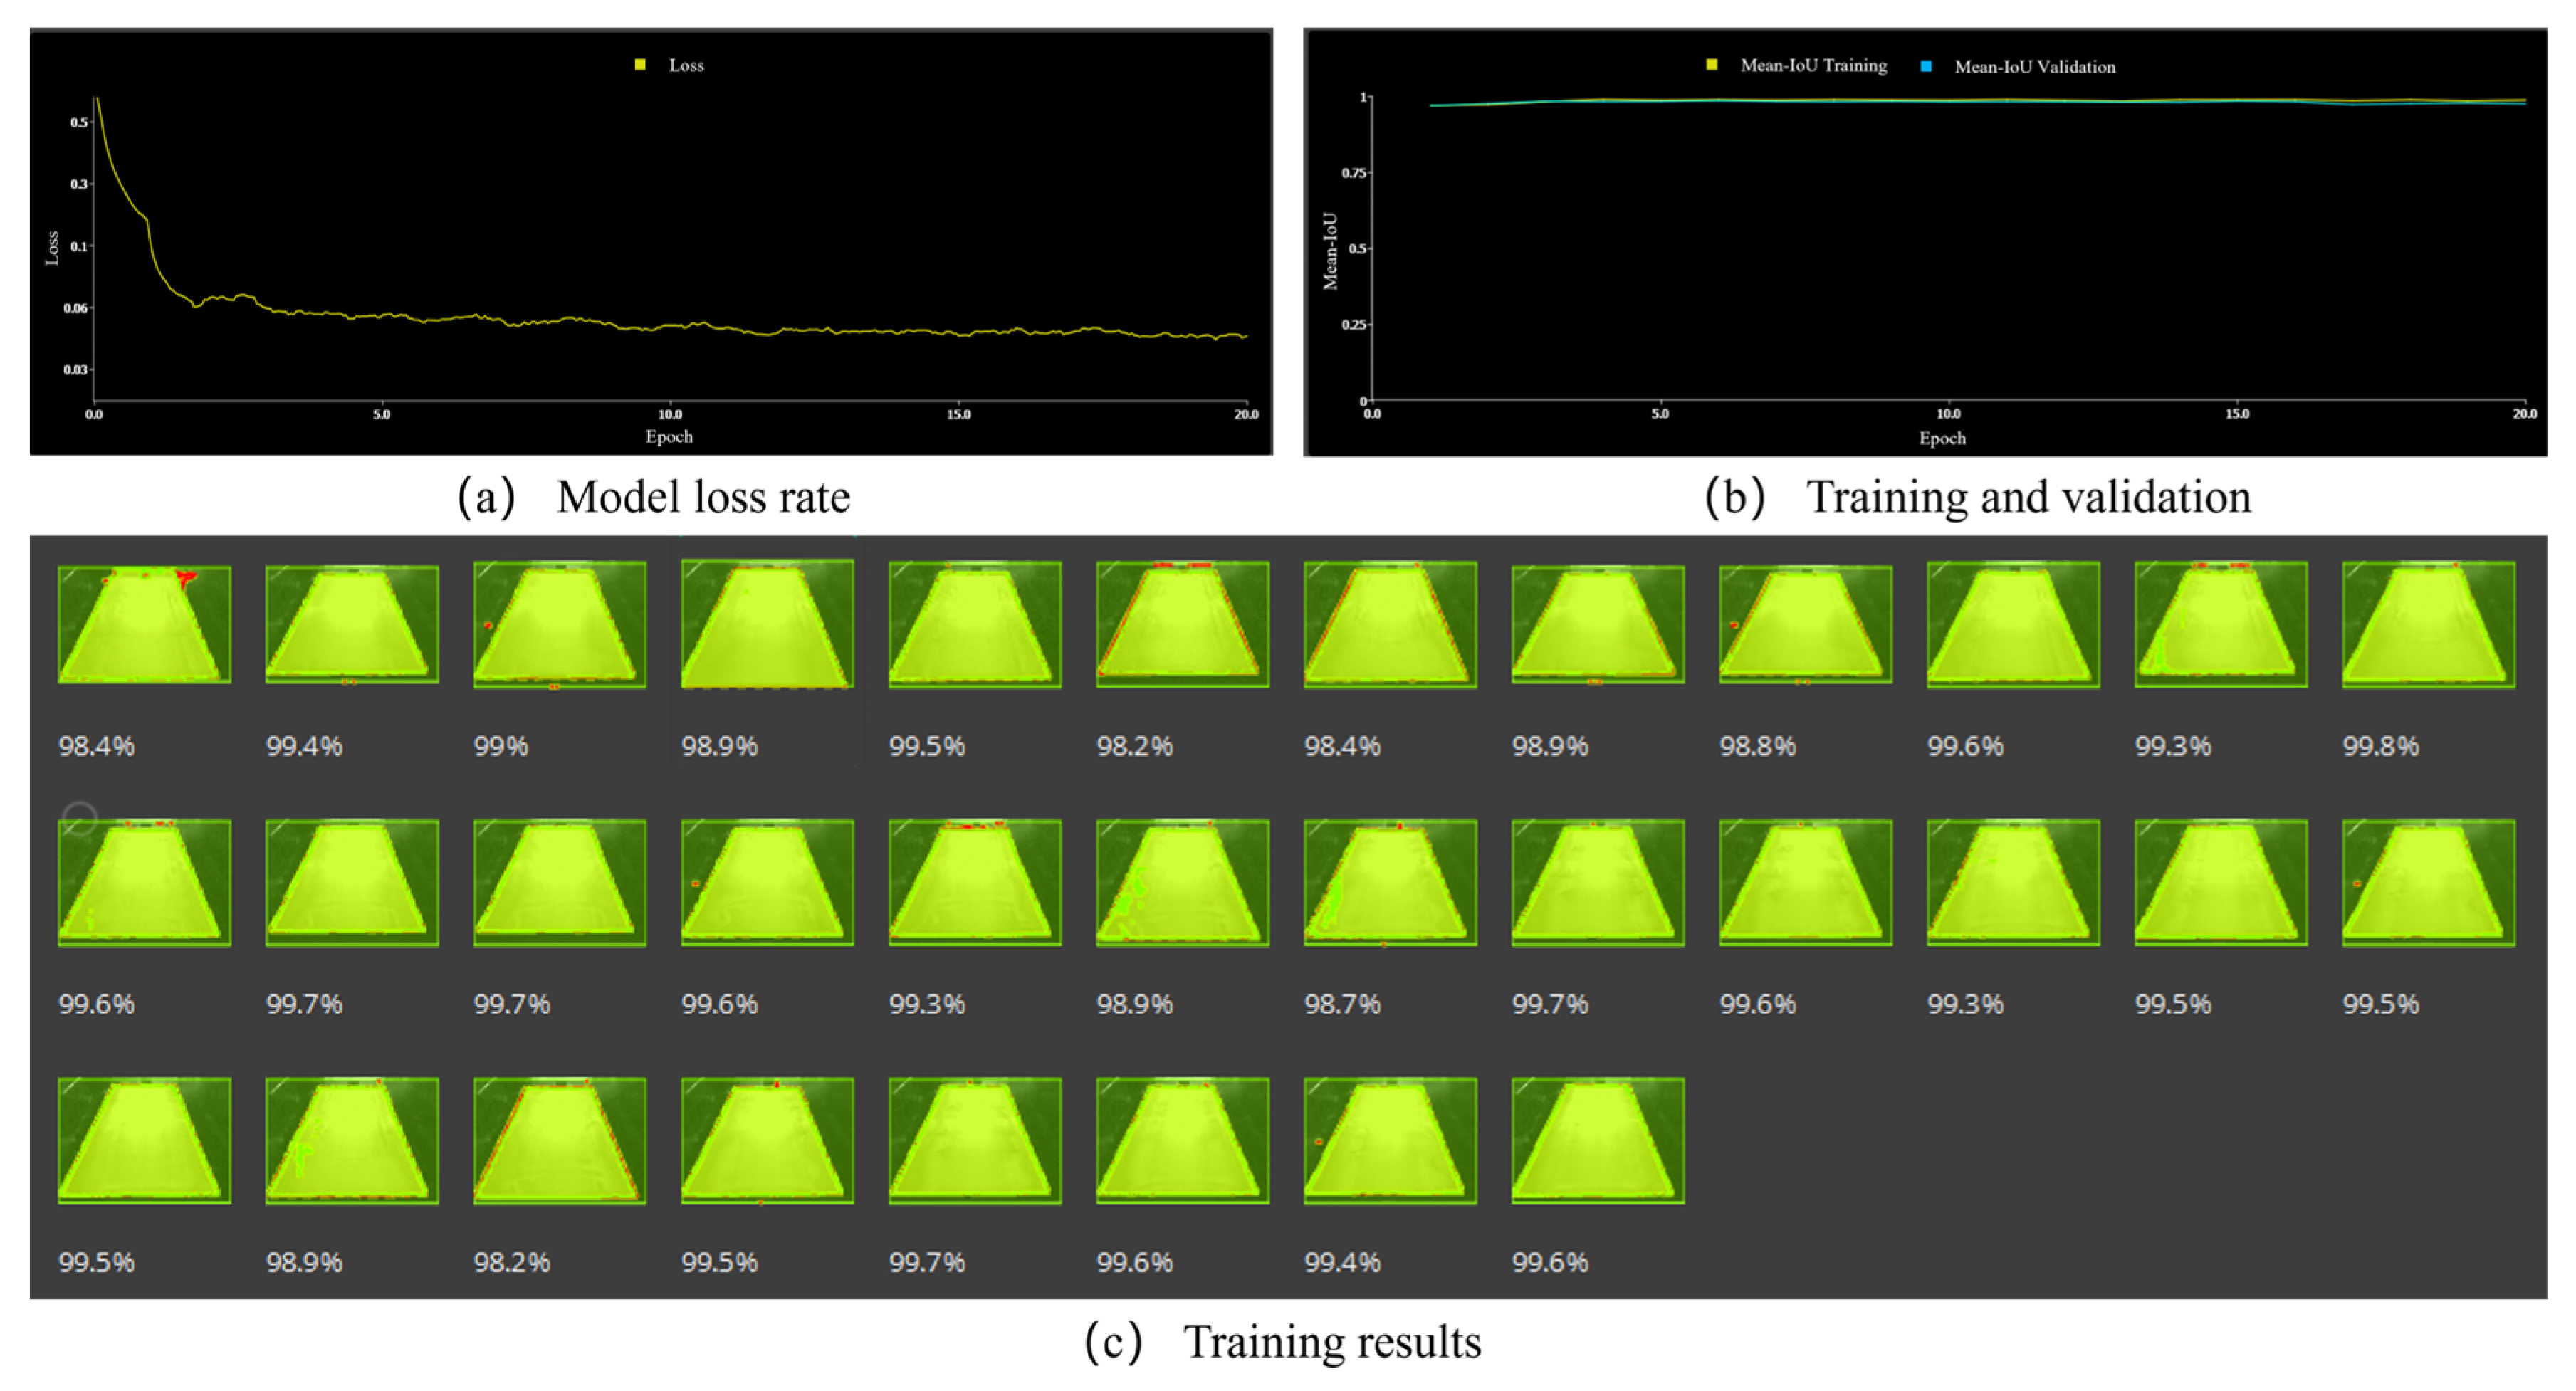
- According to the dynamic characteristics of the production process of cross-cutting boards, this article adopts the method of deep learning to achieve the accurate extraction of the edge contour of cross-cutting boards.
- (4)
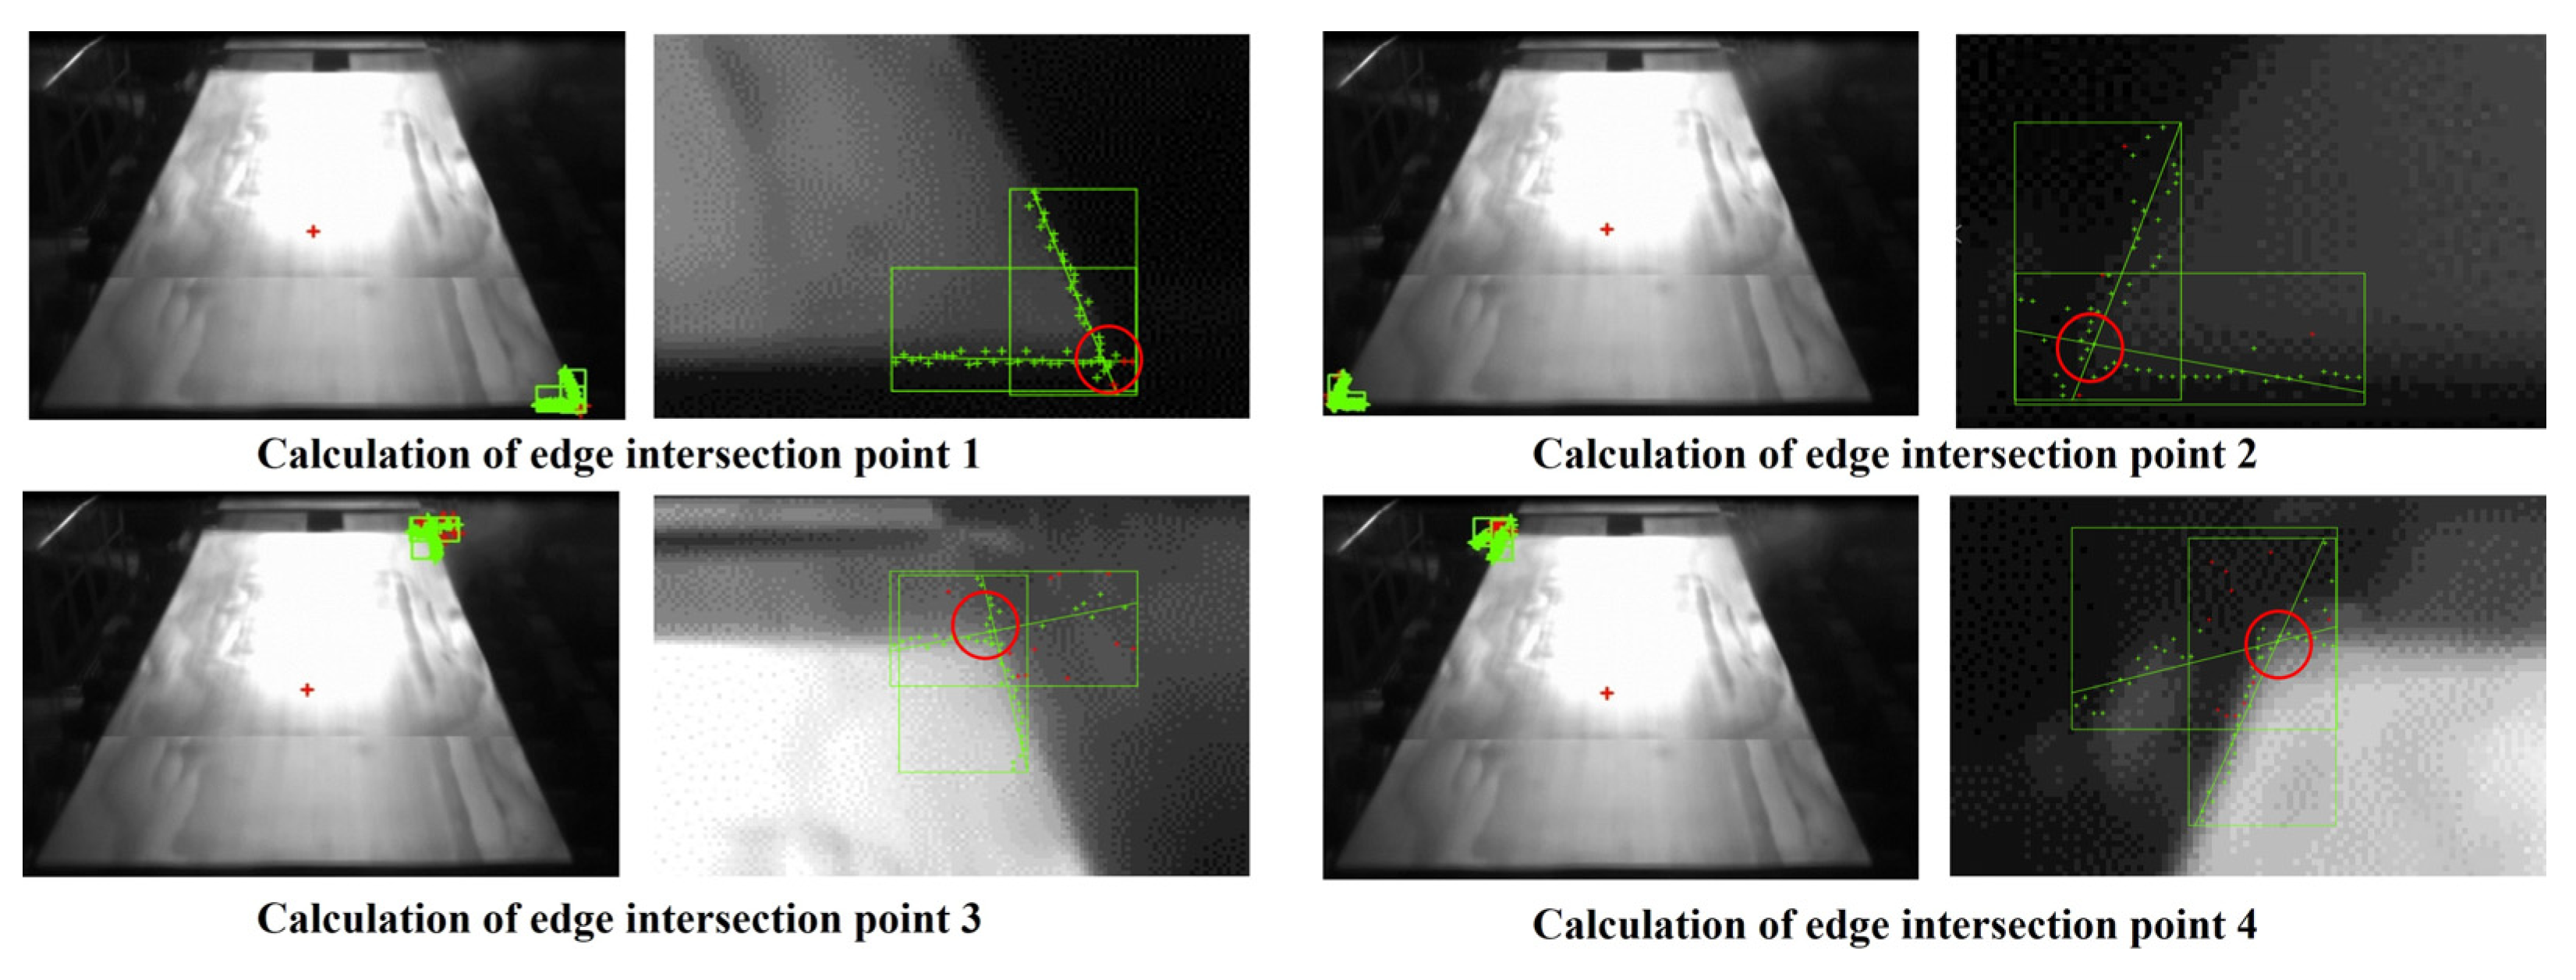
- The article proposes a novel edge intersection extraction algorithm based on the line fitting and least squares methods. It fits the extracted edge contours with straight lines, obtains the optimal and through the least squares method, and then calculates the edge intersections using a pairwise line intersection model.
- (5)
- The article proposes to calculate the dimensions of the cross-cutting board based on the coordinates of its four intersection points. The length detection error is ≤±25 mm, and the width detection error is ≤±2 mm. The diagonal detection results are good, which meets the requirements for on-site production.
- (6)
- The measurement system also has certain limitations. It can only measure cross-cutting boards with a length of less than 10,000 mm. If the length exceeds 10,000 mm, the field of view of the measurement system will not be able to fully cover the cross-cutting boards. In the future, if this problem is to be solved, it is necessary to improve the algorithm of the measurement system and add a fast image stitching algorithm to achieve the measurement of longer cross-cutting boards.
Author Contributions
Funding
Institutional Review Board Statement
Informed Consent Statement
Data Availability Statement
Conflicts of Interest
References
- He, H.N.; Shao, J.; Wang, X.C.; Yang, Q.; Liu, Y.; Xu, D.; Sun, Y.Z. Research and application of approximate rectangular section control technology in hot strip mills. J. Iron Steel Res. Int. 2021, 28, 279–290. [Google Scholar] [CrossRef]
- Zhang, Q.; Zhou, S.; Zhang, X.; Zhang, B. Modeling and finite element verification of the wavy leveling process mechanism for thin strip steel straightening machine. J. Mech. Eng. 2015, 51, 49–57. [Google Scholar] [CrossRef]
- Kim, B.J. Image enhanced machine vision system for smart factory. Int. J. Internet Broadcast. Commun. 2021, 13, 7–13. [Google Scholar]
- Khosravian, A.; Amirkhani, A.; Kashiani, H.; Masih-Tehrani, M. Generalizing state-of-the-art object detectors for autonomous vehicles in unseen environments. Expert Syst. Appl. 2021, 183, 115417. [Google Scholar] [CrossRef]
- Montague, R.; Watton, J.; Brown, K. A machine vision measurement of slab camber in hot strip rolling. J. Mater. Process. Technol. 2005, 168, 172–180. [Google Scholar] [CrossRef]
- Wang, R.; Yang, Q.; He, A.; Shao, J.; Bian, H. Strip shape control capability of hot wide strip rolling mills. J. Univ. Sci. Technol. Beijing Miner. Met. Mater. 2008, 15, 91–95. [Google Scholar] [CrossRef]
- Feng, X.; Luo, L.; Gao, X. SDDA: A method of surface defect data augmentation of hot-rolled strip steel. J. Electron. Imaging 2022, 31, 033002. [Google Scholar] [CrossRef]
- Wang, Y.; Luo, Q.; Xie, H.; Li, Q.; Sun, G. Digital image correlation (DIC) based damage detection for CFRP laminates by using machine learning based image semantic segmentation. Int. J. Mech. Sci. 2022, 230, 107529. [Google Scholar] [CrossRef]
- Yan, S.; Wang, X.; Yang, Q.; Xu, D.; He, H.; Liu, Y. Online deviation measurement system of the strip in the finishing process based on machine vision. Measurement 2022, 202, 111735. [Google Scholar] [CrossRef]
- Stavropoulos, P.; Pastras, G.; Souflas, T.; Tzimanis, K.; Bikas, H. A Computationally Efficient Multi-Scale Thermal Modelling Approach for PBF-LB/M Based on the Enthalpy Method. Metals 2022, 12, 1853. [Google Scholar] [CrossRef]
- Zhang, C.P.; Wang, Q. Survey on imaging model and calibration of light field camera. Chin. J. Lasers 2016, 43, 0609004. [Google Scholar] [CrossRef]
- Zhang, Z. A flexible new technique for camera calibration. IEEE Trans. Pattern Anal. Mach. Intell. 2000, 22, 1330–1334. [Google Scholar] [CrossRef]
- Hu, Z.; Jiang, H.; Zhang, T. Research on MATLAB-Based Image Preprocessing. In Proceedings of the First International Conference on Information Sciences, Machinery, Materials and Energy, Chongqing, China, 11–13 April 2015. [Google Scholar]
- Liu, M. Optical pattern recognition image preprocessing based on hybrid cluster intelligent algorithm. Opt. Quantum Electron. 2024, 56, 648. [Google Scholar] [CrossRef]
- Zahradnik, P.; Simak, B.; Vlcek, M. Filter Design for Image Preprocessing in Image Communication. In Proceedings of the 2009 Eighth International Conference on Networks, Gosier, Guadeloupe, France, 1–6 March 2009. [Google Scholar]
- Singh, D.P.; Khare, A. Automatic Image Segmentation using Threshold Based Parameter and Genetic Algorithm. Int. J. Res. Rev. Comput. Sci. 2012, 3, 1672–1677. [Google Scholar]
- Paul, A.; Bhoumik, S. Classification of hyperspectral imagery using spectrally partitioned HyperUnet. Neural Comput. Appl. 2022, 34, 2073–2082. [Google Scholar] [CrossRef]
- Lei, S. Measurement System of Screw Profile Dimension Based on Machine Vision. Instrum. Technol. Sens. 2023, 7, 71–74+84. (In Chinese) [Google Scholar]
- Koohmishi, M.; Palassi, M. Evaluation of morphological properties of railway ballast particles by image processing method. Transp. Geotech. 2017, 12, 15–25. [Google Scholar] [CrossRef]
- Tang, H.; Chao, Y.; Liu, W.; Ma, C.X. Research review on measurement methods of large-sized parts based on machine vision. Electron. Meas. Technol. 2021, 44, 8. (In Chinese) [Google Scholar]
- You, N.; Han, L.; Zhu, D.; Song, W. Research on image denoising in edge detection based on wavelet transform. Appl. Sci. 2023, 13, 1837. [Google Scholar] [CrossRef]
- Sekehravani, E.A.; Babulak, E.; Masoodi, M. Implementing canny edge detection algorithm for noisy image. Bull. Electr. Eng. Inform. 2021, 9, 1404–1410. [Google Scholar] [CrossRef]
- Wang, B.; Fan, S.S. An improved canny edge detection algorithm. In Proceedings of the 2009 Second International Workshop on Computer Science and Engineering, Washington, DC, USA, 28–30 October 2009; p. 718. [Google Scholar]
- Guo, L.; Nan, J. Canny edge detection algorithm based on wavelet transform and RAMF. In Proceedings of the 2010 International Conference on Computational Problem-Solving, Lijiang, China, 3–5 December 2010. [Google Scholar]
- Farebroyher, R.W. Supplementary notes on the minimax and orthogonal least squares line fitting procedures. Commun. Stat.-Theory Methods 2023, 52, 3350–3353. [Google Scholar] [CrossRef]
- Greco, L.; Pacillo, S.; Maresca, P. An impartial trimming algorithm for robust circle fitting. Comput. Stat. Date Anal. 2023, 181, 107686. [Google Scholar] [CrossRef]
- Luo, J.; Li, K.; Xie, C.; Yan, Z.; Li, F.; Jia, X.; Wang, Y. A novel anti-loosening bolt looseness diagnosis of bolt connections using a vision-based technique. Sci. Rep. 2024, 14, 11441. [Google Scholar] [CrossRef] [PubMed]
- Peng, Y.; Guo, S.; Liu, C.; Barella, S.; Liang, S.; Gruttadauria, A.; Mapelli, C. Dynamic recrystallization behavior of low-carbon steel during hot rolling process: Modeling and simulation. J. Mater. Res. Technol. 2022, 20, 1266–1290. [Google Scholar] [CrossRef]
- Stavropoulos, P.; Sabatakakis, K.; Papacharalampopoulos, A.; Mourtzis, D. Infrared (IR) quality assessment of robotized resistance spot welding based on machine learning. Int. J. Adv. Manuf. Technol. 2022, 119, 1785–1806. [Google Scholar] [CrossRef]
- Bourlesas, N.; Tzimanis, K.; Sabatakakis, K.; Bikas, H.; Stavropoulos, P. Over-deposition assessment of Direct Energy Deposition (DED) using melt pool geometric features and Machine Learning. Procedia CIRP 2024, 124, 797–802. [Google Scholar] [CrossRef]

| Line Name | Slope k | Intercept b |
|---|---|---|
| Line one | 0 | 5030 |
| Line two | ||
| Line three | 0 | 5010 |
| Line four |
| Parameter | Theoretical Values/mm | Manually Measured Values/mm | System Values/mm | Measurement Error/mm |
|---|---|---|---|---|
| Length | 10,000 | 10,008 | 10,040 | 32 |
| Width | 1585 | 1585 | 1586 | 1 |
| Diagonal difference | 0 | 1 | 0 | 1 |
| Board Number | Theoretical Values/mm | Manually Measured Values/mm | System Values/mm | Error |
|---|---|---|---|---|
| 1 | 10,000 | 10,010 | 10,000 | −10 |
| 2 | 10,000 | 10,021 | 10,009 | −12 |
| 3 | 10,000 | 10,011 | 10,000 | −11 |
| 4 | 10,000 | 10,100 | 10,088 | −12 |
| 5 | 10,000 | 9996 | 10,010 | 14 |
| 6 | 10,000 | 10,016 | 10,008 | −8 |
| 7 | 10,000 | 10,022 | 10,008 | −14 |
| …… | …… | …… | …… | …… |
| 99 | 10,000 | 10,015 | 10,025 | 10 |
| 100 | 10,000 | 10,006 | 10,016 | 10 |
| Board Number | Theoretical Values/mm | Manually Measured Values/mm | System Values/mm | Error |
|---|---|---|---|---|
| 1 | 1585 | 1585 | 1585 | 0 |
| 2 | 1585 | 1584 | 1584 | 0 |
| 3 | 1585 | 1586 | 1585 | −1 |
| 4 | 1585 | 1585 | 1585 | 0 |
| 5 | 1585 | 1584 | 1584 | 0 |
| 6 | 1585 | 1583 | 1585 | 2 |
| 7 | 1585 | 1584 | 1584 | 0 |
| …… | …… | …… | …… | …… |
| 99 | 1585 | 1585 | 1585 | 0 |
| 100 | 1585 | 1585 | 1585 | 0 |
| Board Number | Manually Measured Values/mm | System Values/mm | Quality Evaluation |
|---|---|---|---|
| 1 | 11 | 9 | Unqualified |
| 2 | 1 | 1 | Qualified |
| 3 | 1.2 | 1.2 | Qualified |
| 4 | 1.5 | 1.5 | Qualified |
| 5 | 2.3 | 2 | Qualified |
| 6 | 1.5 | 1.6 | Qualified |
| 7 | 0 | 0.2 | Qualified |
| …… | …… | …… | |
| 99 | 1 | 0.9 | Qualified |
| 100 | 6 | 7 | Unqualified |
Disclaimer/Publisher’s Note: The statements, opinions and data contained in all publications are solely those of the individual author(s) and contributor(s) and not of MDPI and/or the editor(s). MDPI and/or the editor(s) disclaim responsibility for any injury to people or property resulting from any ideas, methods, instructions or products referred to in the content. |
© 2025 by the authors. Licensee MDPI, Basel, Switzerland. This article is an open access article distributed under the terms and conditions of the Creative Commons Attribution (CC BY) license (https://creativecommons.org/licenses/by/4.0/).
Share and Cite
Ge, S.; Zhang, W.; Han, L.; Peng, Y.; Sun, J. Development of an In-Line Vision-Based Measurement System for Shape and Size Calculation of Cross-Cutting Boards—Straightening Process Case. Appl. Sci. 2025, 15, 5752. https://doi.org/10.3390/app15105752
Ge S, Zhang W, Han L, Peng Y, Sun J. Development of an In-Line Vision-Based Measurement System for Shape and Size Calculation of Cross-Cutting Boards—Straightening Process Case. Applied Sciences. 2025; 15(10):5752. https://doi.org/10.3390/app15105752
Chicago/Turabian StyleGe, Shitao, Wei Zhang, Licheng Han, Yan Peng, and Jianliang Sun. 2025. "Development of an In-Line Vision-Based Measurement System for Shape and Size Calculation of Cross-Cutting Boards—Straightening Process Case" Applied Sciences 15, no. 10: 5752. https://doi.org/10.3390/app15105752
APA StyleGe, S., Zhang, W., Han, L., Peng, Y., & Sun, J. (2025). Development of an In-Line Vision-Based Measurement System for Shape and Size Calculation of Cross-Cutting Boards—Straightening Process Case. Applied Sciences, 15(10), 5752. https://doi.org/10.3390/app15105752