Article

Assessing High-Value Bioproducts from Seaweed Biomass: A Comparative Study of Wild, Cultivated and Residual Pulp Sources

by
Henrique S. Ferreira
1,
Teresa Mouga
2,3,
Sílvia Lourenço
2,3,
Margarida H. Matias
1,
Marta V. Freitas
2,4 and
Clélia Neves Afonso
2,*
1
School of Tourism and Maritime Technology, Polytechnic University of Leiria, Rua do Conhecimento, 4, 2520-614 Peniche, Portugal
2
MARE—Marine and Environmental Sciences Centre/ARNET—Aquatic Research Network, ESTM, Polytechnic University of Leiria, Cetemares Building, Av. Porto de Pesca, 2520-641 Peniche, Portugal
3
S2AQUA—Collaborative Laboratory, Association for a Sustainable and Smart Aquaculture, Avenida Parque Natural da Ria Formosa s/n, 8700-194 Olhão, Portugal
4
MARE—Marine and Environmental Sciences Centre/ARNET—Aquatic Research Network, Department of Life Sciences, University of Coimbra, Calçada Martim de Freitas, 3000-456 Coimbra, Portugal
*
Author to whom correspondence should be addressed.
Appl. Sci. 2025, 15(10), 5745; https://doi.org/10.3390/app15105745
Submission received: 11 April 2025 / Revised: 13 May 2025 / Accepted: 17 May 2025 / Published: 21 May 2025
(This article belongs to the Section Food Science and Technology)

Abstract

:

Featured Application

The biochemical and bioactive profiles of wild and cultivated kelps, including industrial residual pulp, highlight their potential for use in Blue Biotechnology. These biomasses can serve as sustainable sources of high-value compounds such as polyunsaturated fatty acids, proteins, and polyphenols.

Abstract

This study aimed to evaluate the biochemical composition and bioactivities of biomass derived from wild (Laminaria ochroleuca and Saccorhiza polyschides) and cultivated (Macrocystis pyrifera) kelps, as well as industrially extracted residual pulp from M. pyrifera, to assess the potential production of high value bioproducts. All samples had a low lipid content, with M. pyrifera having the lowest (1.3% dw) and S. polyschides showing the highest value (3.3%). Fatty acids such as palmitic acid (C16:0), oleic acid (C18:1n-9 cis), alpha-linolenic acid (ALA, C18:3n-3), and eicosapentaenoic acid (EPA, C20:5n-3) were present, with the residual pulp having a distinctive n-6/n-3 ratio of less than one. The protein content was around 9% dry weight (dw) in all samples. The residual pulp and S. polyschides had the highest polyphenol content, with 4.86 and 4.94 mg GAE·g−1 extract, respectively. Hydroethanolic extracts (30–70%) confirmed Fe3+ reducing activity (FRAP) in all samples. These findings offer valuable insights on the biochemical composition and bioactivity of the kelp species under study and the residual kelp biomass (pulp), underlining their significant potential for applications in the field of Blue Biotechnology.

1. Introduction

The use of seaweed is ancient, dating back at least to the Neolithic period, over 8000 years ago [1]. Traditionally, seaweeds have been harvested by Asian populations for food and medicinal (or healing) purposes [2]. Only recently have Western European countries become widely interested in the use of seaweed, owing to advances in science and technology that allow the extraction and isolation of valuable natural compounds [3].
Most seaweeds are benthic organisms, attached to a substrate, and are exposed to a variety of abiotic and biotic factors. As a form of protection, these organisms adapt their metabolism by producing a wide range of metabolites. These include proteins, polysaccharides, fatty acids, sterols, pigments, phenolic compounds and many other secondary metabolites, in varying proportions, which can be extracted and used in food matrices, as well as in cosmetics, pharmaceuticals, and other biotechnological applications [4]. The biochemical profile of seaweed depends on many factors such as taxon, geographical location, harvesting season, environmental factors, cultivation conditions, life cycle stage and processing method [5,6]. Among the diverse seaweed species, brown seaweeds (Phaeophyceae) are particularly important for their high-value polysaccharides, such as alginic acid [7]. Alginic acid can provide rigidity and flexibility, allowing seaweed to withstand ocean currents and resist desiccation at low tide. Alginates are widely used as thickening, gelling and stabilizing agents, with applications in various industries: food (salad dressings, ice cream, beer and dairy drinks), cosmetics (shampoo, lipsticks, creams), pharmaceuticals, and even paper and paint production [8,9].
Brown algae are also well known for their content of fucoxanthin, the dominant accessory photosynthetic pigment xanthophyll responsible for their yellowish-brown colour. In addition to fucoxanthin, other carotenoids such as violaxanthin and β-carotene [10,11] can also be found, along with chlorophyll a and chlorophylls c1 and c2. Fucoxanthin has antioxidant, anti-inflammatory, anti-obesity, neuroprotective and anti-cancer properties [9,11], in addition to its potential to replace synthetic colourings in various industries such as food and cosmetics [12].
The brown seaweed Saccorhiza polyschides (Figure 1A), known as furbelows, is distinguished by a flattened stipe, with helical and wavy margins in adult individuals, growing from a large bulbous and rough attachment organ and eventually widening into several blades [13]. Unlike true kelps, S. polyschides is a semi-annual species, which has earned it the common name “false kelp” [14]. According to Salland et al. [15], the sporophyte phase can last between 12 and 18 months. It is characterized by rapid growth in spring and summer, with the cycle ending in autumn [16]. S. polyschides has a wide distribution along the northeastern Atlantic coast and can be found in the shallow intertidal and subtidal zones, up to 19 m deep on rocky bottoms, from Norway to Ghana [17]. It is traditionally known to be edible, has biofertilizer potential [18] and may also have antioxidant and neuroprotective properties [19,20,21].
Laminaria ochroleuca, known as kombu, is an edible seaweed, and related species are widely consumed in Asian countries. It grows to a length of up to 3 m and has a flat blade divided into linear segments, which emerge abruptly from a rigid, smooth, cylindrical stipe, while small rhizoids attach to the substrate (Figure 1B) [17]. A distinctive feature of the species is its yellowish colour. It is a perennial seaweed, being found in temperate waters along the south and north Atlantic coasts (from the south of the UK to Morocco) as well as in the Azores and some areas of the Mediterranean ocean at depths of up to 18 m [22,23,24]. It is used in culinary dishes to add flavour, and is rich in minerals, particularly magnesium, calcium and iodine. The presence of laminarins gives it anti-rheumatic and anti-inflammatory properties [19].
Macrocystis pyrifera (Figure 1C), known as giant kelp, is a perennial and fast-growing species that can grow to over 40 m in length. This is a unique kelp because of its long, cylindrical, flexible and dichotomously branched stipes. The blades are rough with toothed margins, and with aerocysts at the base [25]. It has a wide geographical distribution, occurring in the southern hemisphere, in temperate zones of the Atlantic Ocean, and in the eastern Pacific Ocean [4]. This macroalgae, successfully cultivated in marine aquaculture systems, is characterised not only by its high productivity but also by its abundance of alginate and phenolic compounds with antioxidant activity [4,26]. The controlled cultivation of M. pyrifera enables producers to meet the industrial demand for homogeneous, high-quality biomass, promoting its potential use in high value chains such as nutraceuticals, natural cosmetics and biomedical materials. Besides, being rich in minerals such as iodine and potassium [4], M. pyrifera has been used in cosmetic formulations for skin rejuvenation [27], for feed enrichment [28] or as an agricultural biostimulant [29]. Its alginate is used in the food industry as an emulsifier, stabilizer and gelling agent in yoghurt and ice creams [4]. Besides, other applications as a biomaterial are being developed due to the rheological properties of this phycocolloid [30].
Marine macroalgae have attracted increasing interest by the blue economy due to their high productivity, sustainability and abundance of bioactive compounds with multiple biotechnological applications. The aim of this study was to evaluate the biochemical composition and antioxidant activity of L. ochroleuca (wild), S. polyschides (wild) and M. pyrifera (cultivated). Furthermore, the extraction of bio compounds from M. pyrifera produces a dark, dry and hard residue with unknown composition and properties (Figure 1D), which was also analysed with a view to future biotechnological applications of these biomasses.

2. Materials and Methods

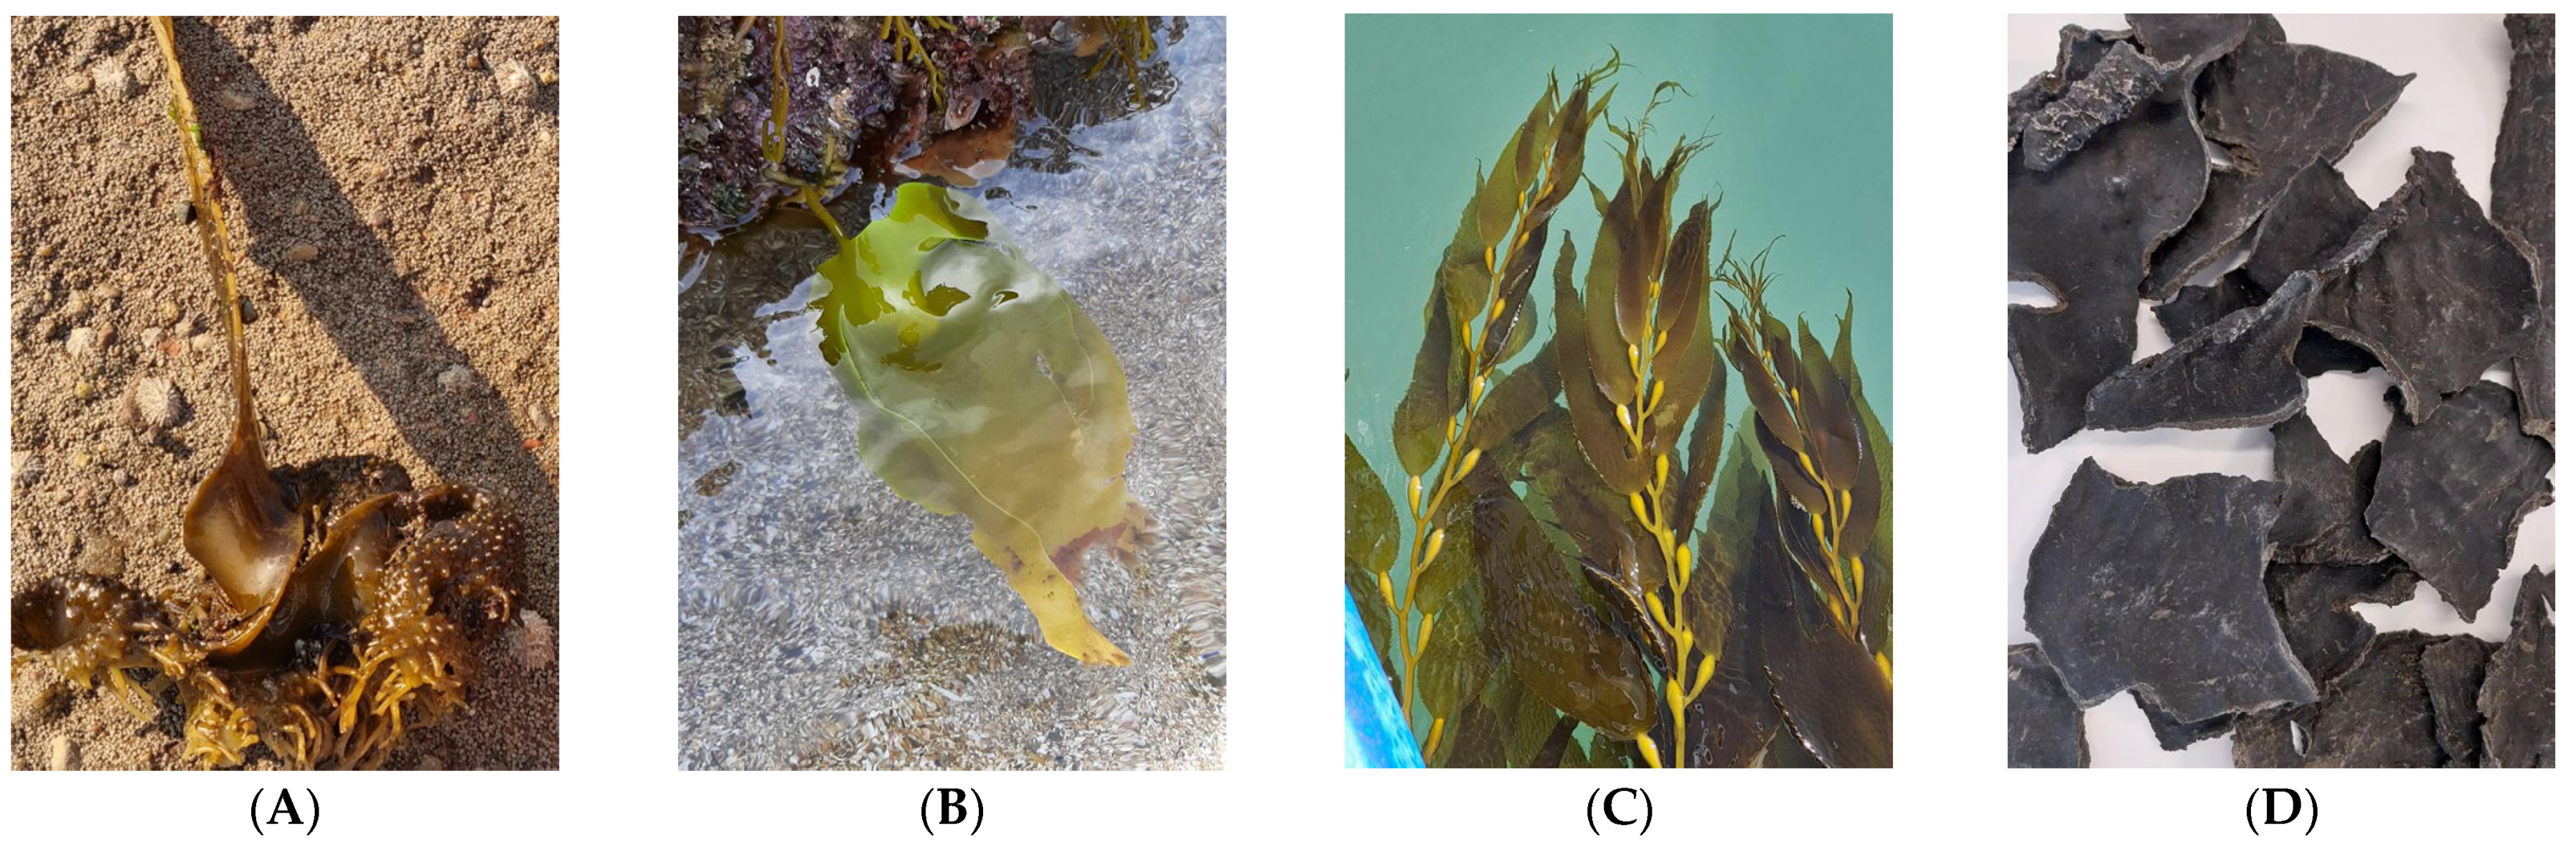
2.1. Sample Collection and Preparation

Healthy blades of two species of brown algae were harvested in 2023 in central Portugal from several sites in the Peniche region. Saccorhiza polyschides was harvested at the end of September, at low tide, on the coast. Laminaria ochroleuca was collected in August, between 10 and 17 m deep.
Macrocystis pyrifera was collected in June from offshore cultivation in Lüderitz, Namibia, and provided by the NGO Kelp Forest Foundation (Zeist, The Netherlands). In accordance with the information provided by the NGO, M. pyrifera biomass was dried at 40 °C in a ventilated oven. To obtain the insoluble crude fraction residue, the dried biomass was subjected to aqueous extraction at 40 °C. This residue was dried at 40 °C in a ventilated oven (FD115, Binder, Tuttlingen, Germany) for 48 h, then stored for later analysis and evaluation. The solid extract residue was termed ‘residual pulp’. To simplify handling and analysis, the residual pulp was ground in a food processor (Vorwerk, Thermomixer 31-1, Wuppertal, Germany). The harvesting season and the biomass collection coordinates for each species are shown in Table 1.
Fresh samples of S. polyschides and L. ochroleuca were washed with seawater to remove impurities and epibionts and then rinsed with distilled water. Part of the sample was stored at −20 °C. The remaining sample was dried at 40 °C for 48 h in a ventilated oven (Memmert, IF110, Wuppertal, Germany). The dried samples were then ground to 200 µm, using a food processor (Breville, VBL120X Personal Active Pro, Cheadle, UK) and a grinder (SilverCrest, SKMS 180 A1, Neckarsulm, Germany). Finally, the samples were stored at −20 °C until further use.
Photographs were taken using an optical microscope (Zeiss, Axio Lab. A1, Oberkochen, Germany) equipped with a 5 MP digital colour microphotography camera (Zeiss, AxioCam 105, Oberkochen, Germany) to determine differences in the cellular structure of the M. pyrifera sample and the ‘residual pulp’.

2.2. Biochemical Profiling Methodology

2.2.1. Ash Content and Moisture Percentage

The AOAC method was used to determine the moisture and ash content of the samples [31]. Briefly, the fresh biomass was oven-dried (Memmert, UF110, Büchenbach, Germany) at 105 °C for 48 h, and then allowed to cool to a constant weight. Moisture content was expressed as a percentage of fresh weight (fw). Ash content was determined after burning 1 g of four replicate samples in a muffle furnace (Nabertherm, B170, Lilienthal, Germany) with a heating ramp of 4 h and a plateau of 5 h at 525 °C and then allowing it to cool down. The ash content (as a percentage of dry weight) was then calculated.

2.2.2. Protein Content

Protein content was determined by the Kjeldahl method. Dried 0.5 g triplicates of each sample were placed in a digestion tube containing a catalyst tablet (VWR Chemicals, Radnor, PA, USA) and 25 mL of 97% sulphuric acid (Honeywell/Fluka, 30743, Charlotte, NC, USA), with a blank control using 1 mL of distilled water. The mixture was digested (J.P. Select bloc digest 6, Abrera, Spain) with sequential heat treatments: one at 220 °C for 30 min and the other at 400 °C for 90 min. After cooling the tubes, 8 mL of distilled water and 100 mL of sodium hydroxide were added to the distillation apparatus (Velp Scientifica, UDK 139, Usmate Velate, Italy). The distillate was collected in 30 mL of 4% boric acid and titrated with 0.1 M hydrochloric acid. The protein content was calculated as follows:
%   Protein   ( %   dry   weight )   =   [ V s V b × n × c f × 0.014 ] W   ×   100 %
where Vs is the volume of titrant used for the sample (mL), Vb is the volume of titrant used for the blank (mL), n is the concentration of HCl used in the titration (0.1 M), W is the initial sample mass (g), and cf is the conversion factor for seaweeds (5, according to Angell et al. [32]).

2.2.3. Total Lipids

Quantification of total lipids in the samples was performed according to Bligh and Dyer [33] with the adaptations by Coen et al. [34]. Briefly, dried samples (≈13 mg) were homogenized with 150 μL of a chloroform:methanol:water (1:1:1) mixture and centrifuged at 8000× g at 4 °C for 10 min to allow phase separation. The lower organic phase was recovered in a weighed evaporation flask through an anhydrous sodium sulphate column. Then, 100 mL of the sample was mixed with 500 mL of 97% sulphuric acid and heated at 200 °C for 15 min (Memmert, UF110, Büchenbach, Germany). After cooling, 1.5 mL of ultrapure water was carefully added to the mixture. Finally, 200 µL aliquots (in triplicate) were transferred to a 96 flat-bottom microplate (Greiner Bio-one, 655101, Frickenhausen, Germany) and the absorbance of the samples was read at 375 nm (Synergy H1 Hybrid Reader, BioTek® Instruments, Winooski, VT, USA). The absorbance of the samples was compared with the absorbance of a calibration curve using tripalmitin at 3.2 mg·mL−1 as a standard (Sigma–Aldrich, T5888, Darmstadt, Alemanha). Lipid content results were expressed as a percentage of dry weight (% dw).

2.2.4. Fatty Acid Profile Determination

The fatty acid (FA) profile of the samples was analysed by gas chromatography (GC). FA methyl esters (FAME) were obtained by direct acid transmethylation according to Fernández et al. [35]. Dried samples (≈50 mg) were mixed with 2 mL of methanol containing 2% sulphuric acid and heated at 80 °C (Memmert, OB14, Schwabach, Germany) for 2 h. Afterwards, 1 mL of ultrapure water and 2 mL of n-hexane (Fisher Scientific/0355/15, Waltham, MA, USA) were added to the mixture, stirred, and centrifuged at 1500× g for 5 min to separate the phases.
Finally, the upper hexane phase was recovered and analysed on a GC (Finnigan Ultra Trace Thermo Scientific, Waltham, MA, USA) equipped with a Thermo TR-FAME capillary column (60 m × 0.25 mm ID, 0.25 μm film thickness), an autosampler (AS 3000, Thermo Electron Corporation, Waltham, MA, USA) and a flame ionization detector (FID). Helium (1.5 mL/min) was used as the carrier gas. XCaliburTM software (Xcalibur 4.2., Thermo Scientific, Waltham, MA, USA) was used to determine the integration and peak areas. The FA content was expressed as a percentage of the total peak area (% Total FA).

2.2.5. Pigment Analysis

Photosynthetic pigments were extracted according to the methods defined by Osório et al. [36] and both fresh and dried samples were analysed. Dry powdered samples were used outright, and fresh samples were crushed in a mortar and pestle for 10 min. Fucoxanthin was extracted from both powdered and fresh samples, using a 4:1 (v/v) solution of dimethyl sulfoxide (DMSO) and ultrapure water. Chlorophyll a and chlorophylls c1 and c2 were extracted in combination from both powder and fresh samples using 90% acetone as a solvent.
For the quantification, 0.5 g of the seaweed was weighed and a 1:20 sample/solvent ratio was used. Both fresh and dried samples were transferred to a beaker with the solvent and stirred for 30 min on a digital multi-position magnetic stirrer (OVAN, MM90E, Barcelona, Spain). The sample was centrifuged at 8000× g for 20 min at 4 °C and then filtered through 1.2 µm glass fibre filters (VWR, 516-0869, Stockholm, Sweden). Finally, the absorbance was read in a UV–VIS spectrophotometer between 200 nm and 900 nm (Thermo Scientific, Evolution 201, Waltham, MA, USA). The following equations were used to calculate the concentrations of fucoxanthin, chlorophyll a and chlorophylls c, and the results were expressed as μg·g−1 [36,37,38]:
Fucoxanthin (μg/g) = 7.69 × (A480 − A750) − 5.5 × [(A631 − A750) + (A582 − A750) − 0.297 × (A665 − A750)] − 0.377 × (A665 − A750)
Chlorophyll a (μg/g) = 0.3319 × (A630 − A750) − 1.7495 × (A647 − A750) + 11.9442 × (A664 − A750) − 1.4306 × (A691 − A750) (±0.0020)
Chlorophylls c (μg/g) = 23.5902 × (A630 − A750) − 7.8516 × (A647 − A750) − 1.5214 × (A664 − A750) − 1.7443 × (A691 − A750) (±0.0075)

2.2.6. Quantification of Elements

Dry samples were used to quantify elements’ content by X-ray fluorescence spectrometry (XRF). To ensure complete removal of moisture, the samples were placed in beakers suitable for XRF analysis and subjected to additional drying in a ventilated oven (Binder, FD23, Germany) at 60 °C for 48 h. Quantification was performed by XRF (Bruker S1 Titan, Kennewick, WA, USA), with readings taken in triplicate. Results were expressed as mg·g−1 (dw).

2.2.7. Alginate Extraction and Analysis

Alginate was extracted by adapting the method described by Trica et al. [39]. Briefly, 2 g of dried seaweed underwent a mild depigmentation in 20 mL of 70% ethanol (v/v) at room temperature for 24 h. The residual EtOH was removed by vacuum filtration (Prat Dumas, A125108, 10–12 µm, Couze-et-Saint-Front, France) and 100 mL of 0.2 M hydrochloric acid was added at room temperature and allowed to stand for 24 h. The samples were then treated with 2% calcium carbonate for the alkaline treatment and the alginate was extracted at different temperatures (25 °C, 60 °C and 80 °C) for 5 h in a water bath (Memmert, OB14, Schwabach, Germany). The alginate was precipitated by adding 2 volumes of EtOH (96%) at 4 °C, overnight. The precipitate was oven dried at 60 °C (Memmert, IF110, Büchenbach, Germany) for 48 h, and then ground in a mortar and a grinder. The alginates were analysed by Fourier transform infrared spectroscopy (FTIR) (Perkin Elmer, Spectrum II, Buckinghamshire, PA, USA), with 64 scans, a resolution of 8 cm−1 and a spectral range of 4000–400 cm−1. Commercial alginate (Farmaquimica Sur, Málaga, Spain) was used as a standard to validate the results of the extracted alginates.

2.3. Antioxidant Activity

2.3.1. Hydroethanolic Extraction

Hydroethanolic extraction was performed according to a dry biomass:solvent ratio of 1:10 (g·mL−1). The powdered dried extracts (50 g) were mixed in ethanol:water (70:30) at a concentration of 100 mg·mL−1. The extracts were sonicated for 15 min and kept under constant stirring for 8 h at 40 °C, protected from light. The extract was then centrifuged at 8000× g for 10 min at room temperature and the supernatant was freeze-dried and stored in a desiccator at room temperature until use.

2.3.2. Total Phenolic Content Assay (TPC)

The TPC assay was performed by adapting the Folin–Ciocalteu method of Singleton and Rossi [40] to microscale. Briefly, 30 μL of the hydroethanolic extracts were added to 770 μL of ultrapure water and 50 μL of Folin–Ciocalteu reagent (Sigma–Aldrich, F9252, Darmstadt, IN, USA), and the mixture was allowed to stand for 5 min at room temperature in the dark. Then, 150 μL of sodium carbonate (20% w/v) (ChemLab, CL00.1431.1000, Zedelgem, Belgium) was added and incubated for 1 h at room temperature in the dark. Then, 200 μL of each sample was transferred to flat-bottomed microplates and left to incubate for 30 min at room temperature in the dark. Absorbance was read at 755 nm (Synergy H1 Hybrid Reader, BioTek® Instruments, Winooski, VT, USA). The results were expressed as gallic acid equivalents (mg GAE·g−1 crude extract).

2.3.3. Ferric Reducing Antioxidant Power (FRAP) Assay

The antioxidant activity of the hydroethanolic extracts was determined by a microscale adapted FRAP assay [41]. The FRAP reagent was prepared using 300 mM acetate buffer (pH 3.6), 10 mM 2,4,6-tri(2-pyridyl)-1,3,5-triazine (TPTZ) solution and 20 mM ferric chloride in a 10:1:1 ratio. Then, 30 μL of the sample and 900 μL of FRAP reagent were added. The tubes were incubated for 15 min at 37 °C, followed by 5 min in the dark at room temperature. Then, 200 μL of each sample was added to the microplate and the absorbance was read at 593 nm in a microplate reader (Synergy H1 Hybrid Reader, BioTek® Instruments, Winooski, VT, USA). The results were expressed as ferrous sulphate equivalents in mmol·100 mg−1 of sample.

2.4. Statistical Analysis

Results are presented as mean values ± standard deviations (SDs). Whenever homogeneity and normality tests were validated, the results were analysed using Student’s t-tests, one-way analysis of variance (ANOVA) or two-way ANOVA, followed by a post hoc Tukey’s Honest Significant Difference (HSD) test. Otherwise, the non-parametric Kruskal–Wallis test was used for the comparisons described. Statistically significant differences were considered when the p-value was <0.05. The statistical analysis was performed using the software SPSS Statistics 29 software (IBM Corporation, New York, NY, USA).

3. Results

3.1. Biochemical Profiling

3.1.1. Proximate Composition

The fresh seaweed had a high moisture content, with the highest value of 79.74 ± 0.50% fw recorded for Saccorhiza polyschides, while Laminaria ochroleuca had a significantly lower value (73.35 ± 1.36% fw) (Table 2). The ash content of the dried samples was higher for Macrocystis pyrifera and for the residual pulp, with 48.94 ± 0.70% and 28.56 ± 0.25% total dry weight (dw), respectively. The dried samples of S. polyschides and L. ochroleuca showed an ash content of 20.01 ± 0.05% dw and 22.03 ± 0.60% dw, respectively. As to the protein content, the four samples analysed had a similar result, with a small variation between 8.9 and 9.2%. Saccorhiza polyschides had the highest lipid content (3.41 ± 0.46% dw), followed by L. ochroleuca and the residual pulp (2.79 ± 0.25% and 2.37 ± 0.21% dw, respectively), while M. pyrifera had the lowest lipid content (1.28 ± 0.19% dw). L. ochroleuca had the highest carbohydrate content (56.03%), closely followed by S. polyschides (55.42%), whereas residual pulp had a lower value (46.41 ± 0.28%), and M. pyrifera the lowest carbohydrate content (29.17 ± 0.71%).

3.1.2. Fatty Acid Profile

The fatty acid (FA) profile of the samples is shown in Table 3. Palmitic acid (C16:0) was the most abundant fatty acid in all samples, reaching levels up to 40.25 ± 1.37% of S. polyschides. Thus, total saturated fatty acids (SFA) were most abundant in S. polyschides (51.57 ± 1.57%), followed by L. ochroleuca (43.45 ± 0.59%).
The most abundant monounsaturated fatty acid (MUFA) was oleic acid (C18:1 n-9), ranging from 8.64% (residual pulp) to 17.74 ± 2.09% (L. ochroleuca). Among the polyunsaturated fatty acids, α-linolenic acid (ALA) was predominant in the residual pulp (8.54 ± 0.06%) and was the lowest in S. polyschides (2.54 ± 0.06%). Arachidonic acid (ARA) was the highest in M. pyrifera followed by the residual pulp: 14.55 ± 0.50% and 10.70 ± 0.52%, respectively. Eicosapentaenoic acid (EPA, C20:5) was found in the residual pulp at 11.14%. Total polyunsaturated fatty acid (PUFA) ranged from 25.08 ± 1.24% in the S. polyschides sample to 38.01 ± 1.05% in the residual pulp. The amount of n-3 fatty acids (n3) varied among the samples, with the highest value in the residual pulp (19.86 ± 0.55%) and the lowest in S. polyschides (5.05 ± 0.22%). The amount of n-6 fatty acids also varied, reaching the highest value in M. pyrifera (21.18 ± 0.74%) and the lowest in L. ochroleuca (16.22 ± 0.03%). As for docosahexaenoic acid (DHA, C22:6n-3), its concentration varied between 0.02 ± 0.01% (S. polyschides) and 0.14 ± 0.02% (M. pyrifera), and it was not detected in L. ochroleuca. Total PUFA ranged from 25.08 ± 1.24% in S. polyschides to 38.01 ± 1.05% in the residual pulp. The amount of omega-3 fatty acids (n3) varied among the samples, with the highest value in the residual pulp (19.86 ± 0.55%) and the lowest in S. polyschides (5.05 ± 0.22%). The amount of omega-6 fatty acids also varied significantly, reaching the highest value in M. pyrifera (21.18 ± 0.74%) and the lowest in L. ochroleuca (16.22% ± 0.29%). The values of the n6/n3 ratio were greater than one in all the samples, except for the residual pulp, which had a ratio of 0.87 ± 0.01.

3.1.3. Pigment Contents

Chlorophyll a was the most abundant pigment present in the fresh biomasses, with S. polyschides yielding 4218.74 ± 93.53 μg·g−1 fw and L. ochroleuca yielding 2599.38 ± 701.51 μg·g−1 fw. Regarding the results for chlorophylls c, fresh S. polyschides showed a concentration of 965.62 ± 127.39 μg·g−1 fw and L. ochroleuca 681.34 ± 159.54 μg·g−1 fw. Regarding fucoxanthin, the fresh S. polyschides yielded a result of 695.48 ± 22.51 μg·g−1 fw, followed by the fresh L. ochroleuca sample, which yielded a result of 439.93 ± 30.32 μg·g−1 fw (Table 4).
The dried biomass of the four samples was also analysed, with much lower concentrations than the fresh biomass. The highest fucoxanthin concentration was obtained in the residual pulp, which had an average value of 157.528 ± 2.717 μg·g−1 dw, while M. pyrifera had the lowest fucoxanthin concentration (56.71 ± 1.38 μg·g−1 dw). The concentration of chlorophyll a was dominant in L. ochroleuca (26.59 ± 1.93 μg·g−1 dw) and the remaining samples had values ranging from 16.63 ± 2.33 μg·g−1 dw (in the residual pulp) to 22.18 ± 2.469 μg·g−1 dw (S. polyschides). The concentration of chlorophylls c was highest in L. ochroleuca (2.95 ± 0.09 μg·g−1 dw), followed by S. polyschides (2.66 ± 0.03 μg·g−1 dw), M. pyrifera (0.69 ± 0.07 μg·g−1 dw) and the residual pulp (0.15 ± 0.08 μg·g−1 dw).

3.1.4. Elemental Composition

The phosphorus, chlorine and potassium contents varied significantly among the samples, with M. pyrifera and the residual pulp standing out with the highest values. The phosphorus content was 5.29 ± 0.03 mg·g−1 in M. pyrifera and 4.05 ± 0.26 mg·g−1 in the residual pulp. Chlorine showed values of 77.97 ± 0.65 mg·g−1 in M. pyrifera and 22.67 ± 1.95 mg·g−1 in S. polyschides, also with statistically significant differences (H2(3) = 9.974, p < 0.019). As for potassium, the highest concentration was found in M. pyrifera (67.72 ± 0.62 mg·g−1) and the lowest in S. polyschides (6.03 ± 0.44 mg·g−1). Calcium showed the lowest concentration in M. pyrifera with 3.61 ± 0.05 mg·g−1 and the highest in S. polyschides with 11.7 ± 0.74 mg·g−1. As far as the microelements are concerned, again there were large variations among samples, with iron showing the highest value in M. pyrifera with 646.33 ± 143.79 μg·g−1, zinc registering the highest concentration in S. polyschides with 33.33 ± 2.52 μg·g−1, while copper and arsenic showed the highest values in M. pyrifera with 8.00 ± 1.00 μg·g−1 and with 55.67 ± 4.16 μg·g−1, respectively. It should also be noted that arsenic was detected at high concentrations in all samples (Table 5).

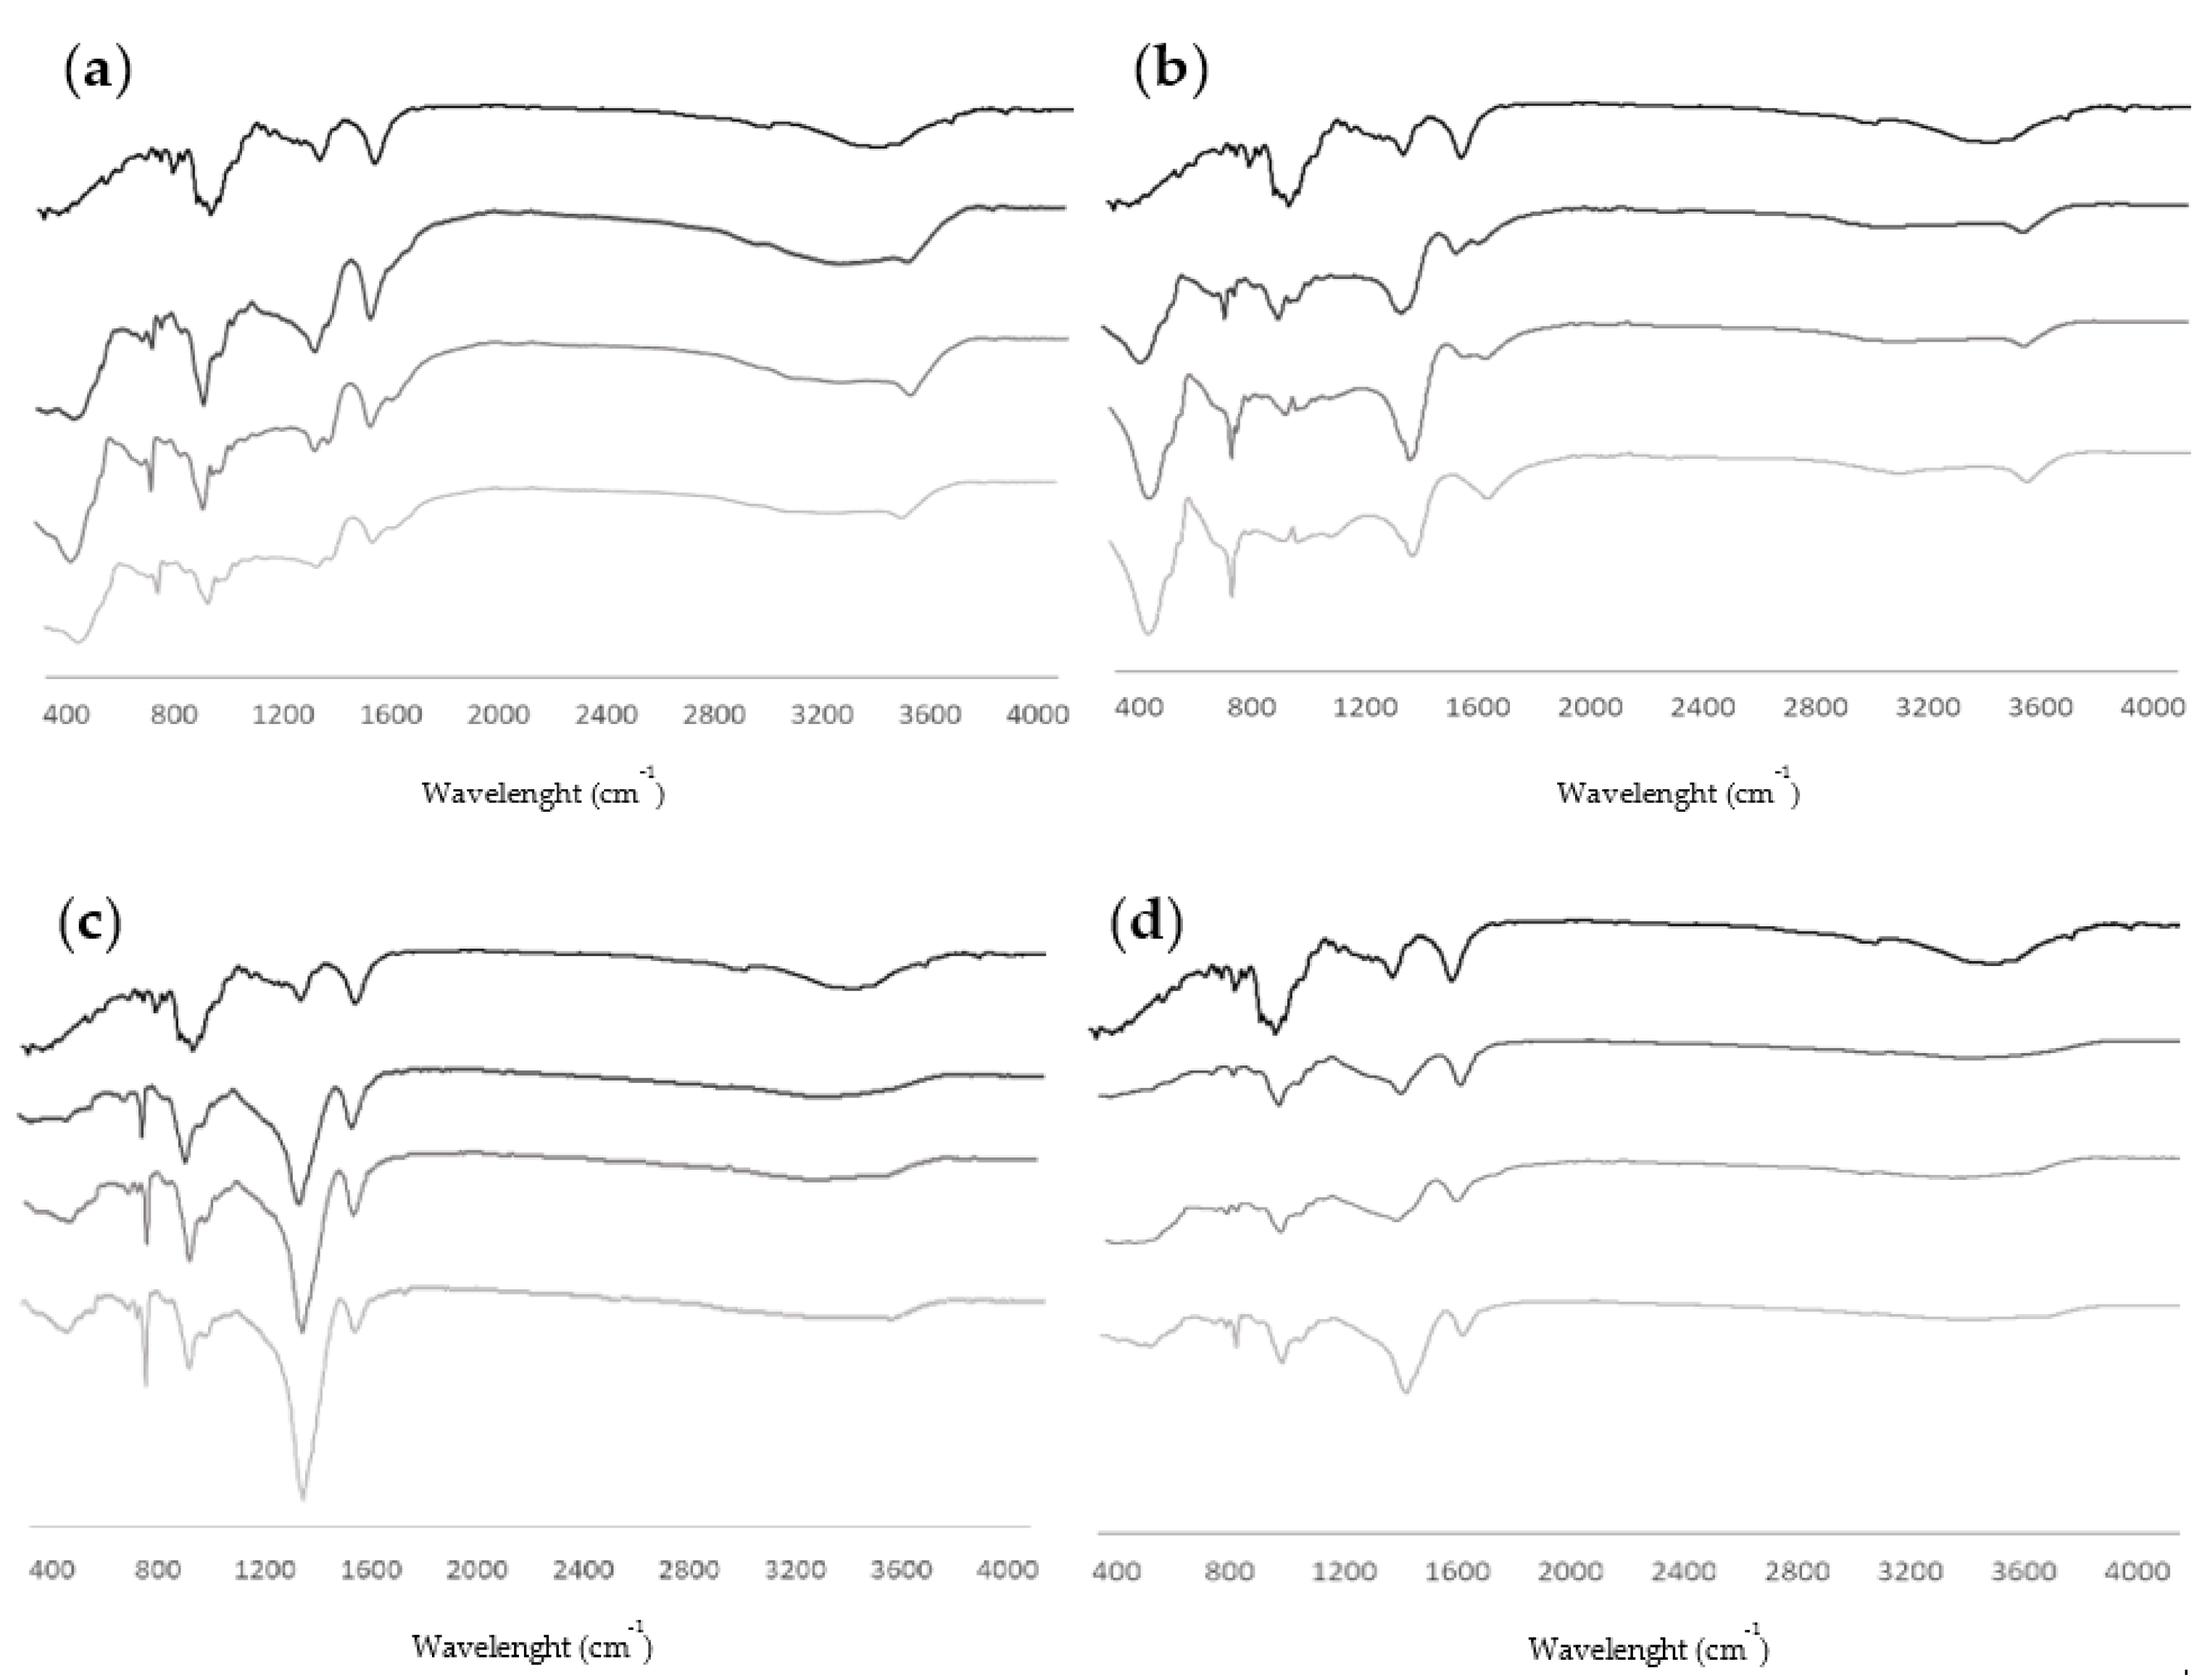
3.1.5. Alginate Content

The sodium alginate yield of the samples is presented in Table 6 and shows significant differences among the samples. The highest value was found in the residual pulp extracted at 60 °C (51.04 ± 0.75% dw) and S. polyschides extracted at 80 °C, while the lowest value was found in L. ochroleuca extracted at 25 °C (7.33 ± 0.29% dw).
Microscopic examination indicated that the cell wall architecture of M. pyrifera (Figure 2A) remained relatively intact and well-organized, in contrast to the residual pulp biomass (Figure 2B), which exhibited significant structural disruption.
Figure 3 shows the FTIR spectra obtained from the analysis of alginates extracted from different samples. The presence of water in alginate samples is related to their hygroscopicity, which means that they tend to absorb moisture from their surroundings. The broad bands at 1600–1610 cm−1 have been suggested to be the asymmetric stretching of the carboxylate (O–C–O). The peak between 1400 and 1454 cm−1 is attributed to the C–OH deformation vibration [42]. The sharp peak between 1020 and 1040 cm−1 can be attributed to the elongation of the C–O groups [43]. At 1200 cm−1, there are slight peaks that may be related to the vibration of the sulphate group (SO3) present in sulphated polysaccharides [9]. Between 848 and 880 cm−1, the peak corresponds to the deformation vibration of the bond between carbon 1 and hydrogen (C1–H) of the mannuronic acid residues, while at 940 cm−1, the peak is associated with the C–O stretching of the guluronic acid residues [42]. Our results also show that there are some differences in the peaks between the extracted alginates and the commercial alginate, namely some noise below 800 cm−1, which could be related to other compounds in the samples [9].

3.2. Antioxidant Capacity

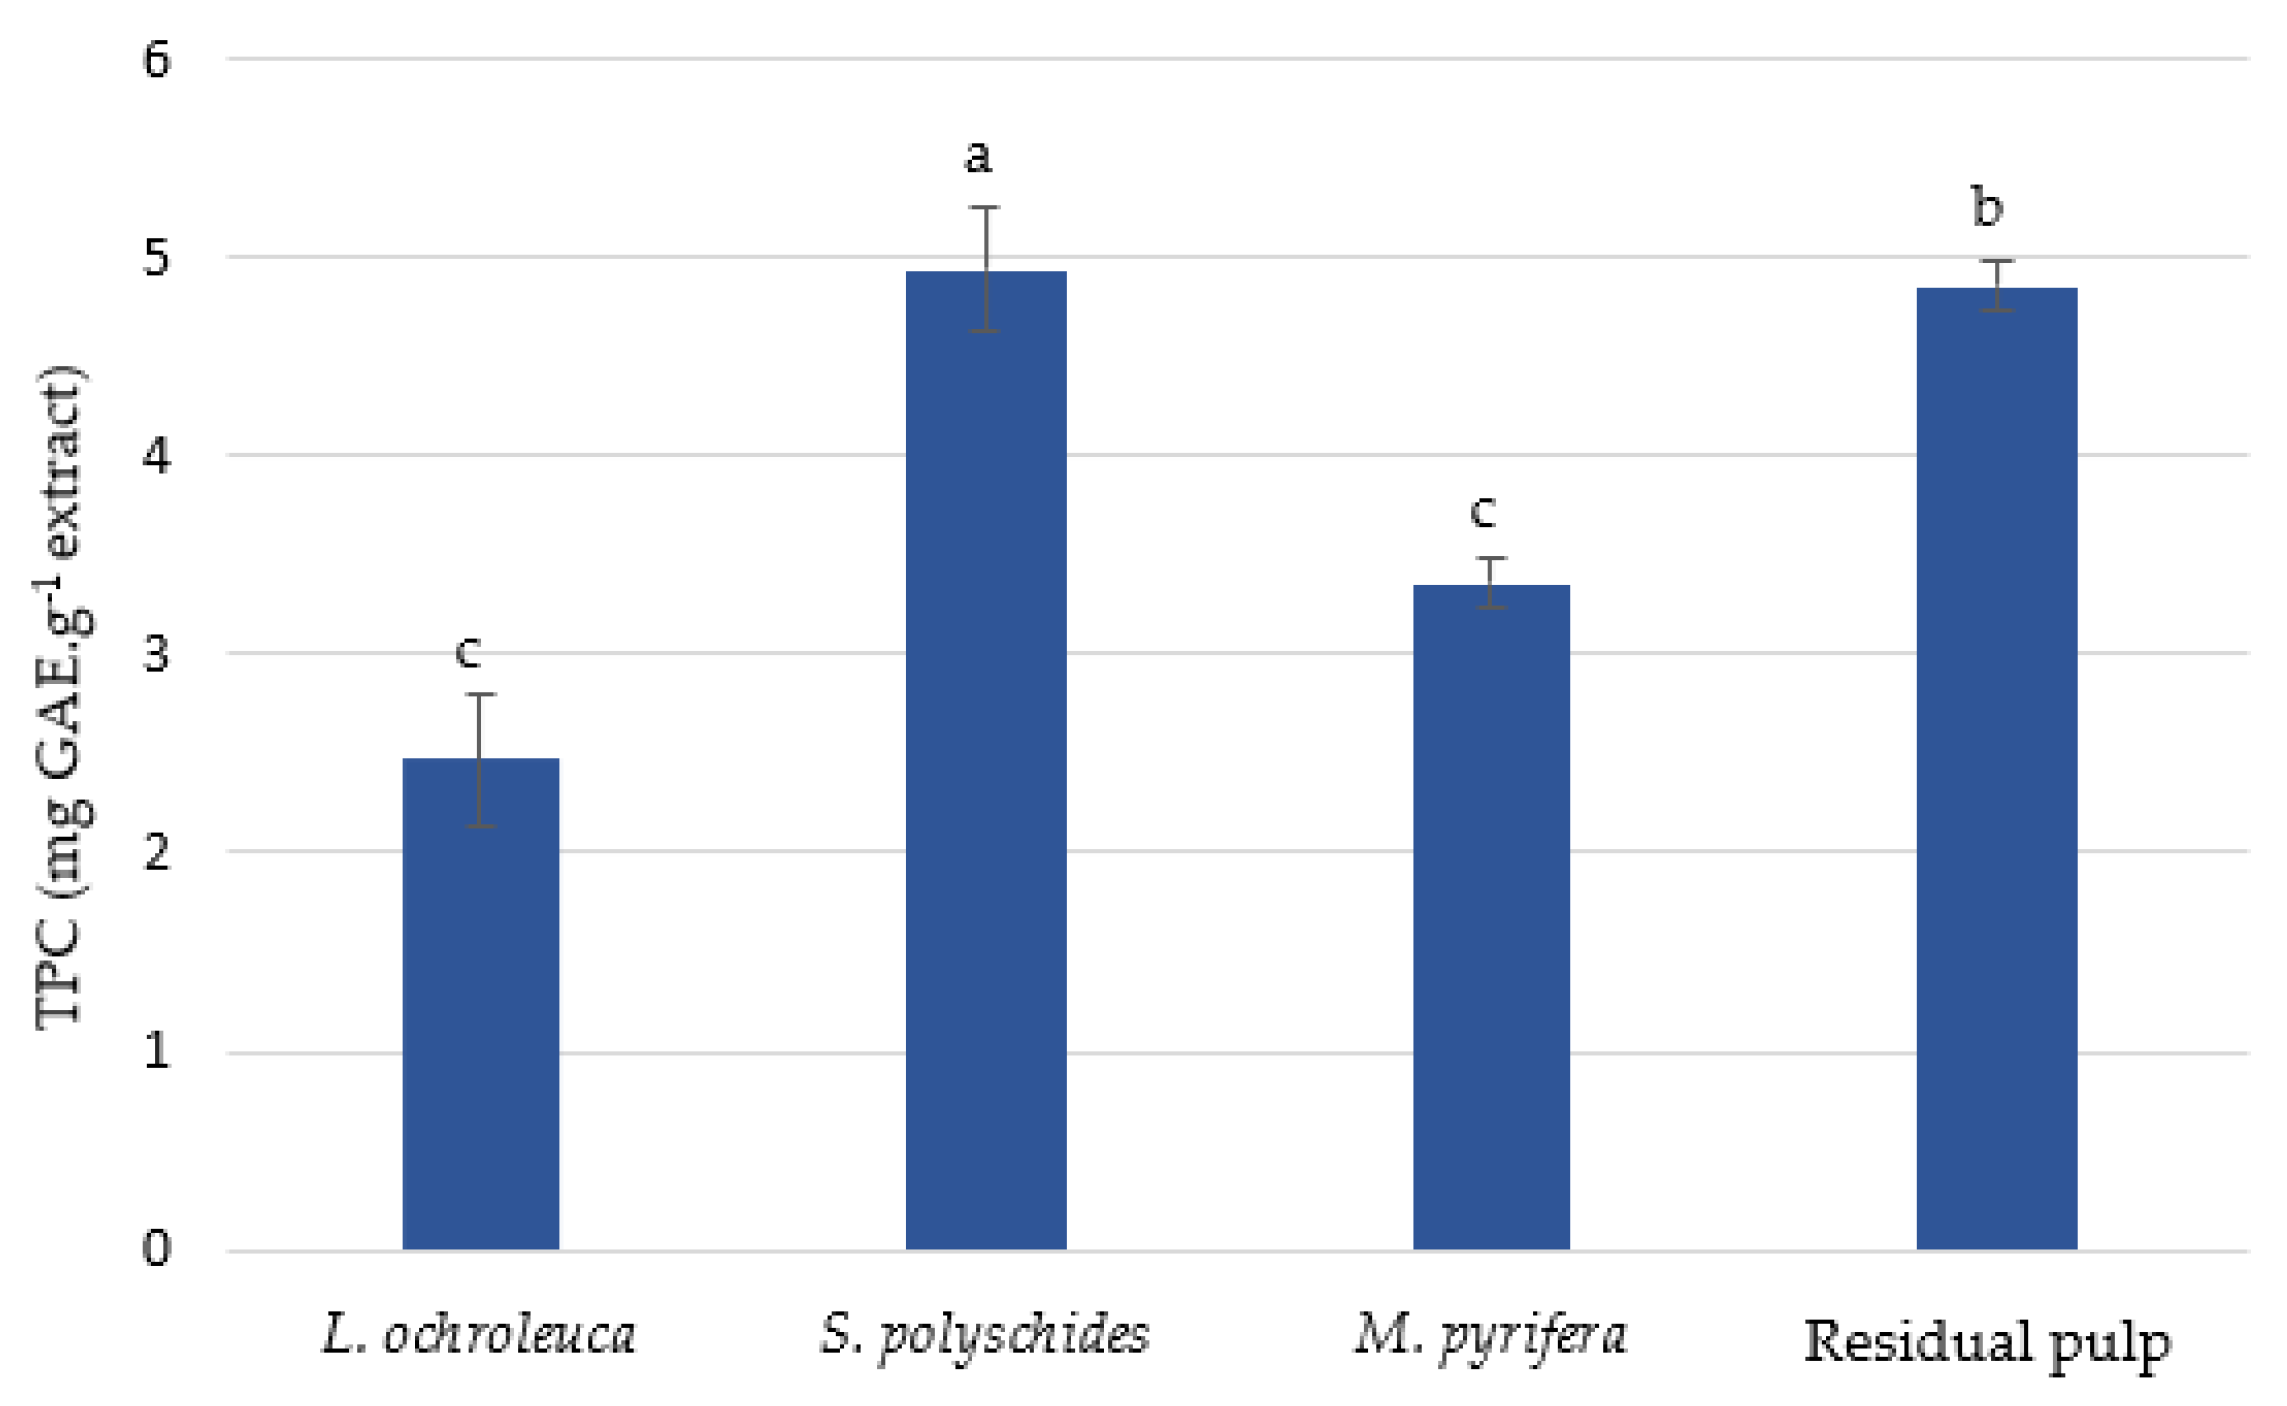
3.2.1. Total Phenolic Content (TPC)

The TPC determined for the three seaweeds and pulp ranged from 2.47 ± 0.33 mg GAE·g−1 (L. ochroleuca) to 4.94 ± 0.31 mg GAE·g−1 (S. polyschides), with significant differences among samples (Figure 4). The seaweed M. pyrifera and its residual pulp had an intermediate TPC content with 3.36 ± 0.13 mg GAE·g−1 and 4.86 ± 0.12 mg GAE·g−1, respectively.

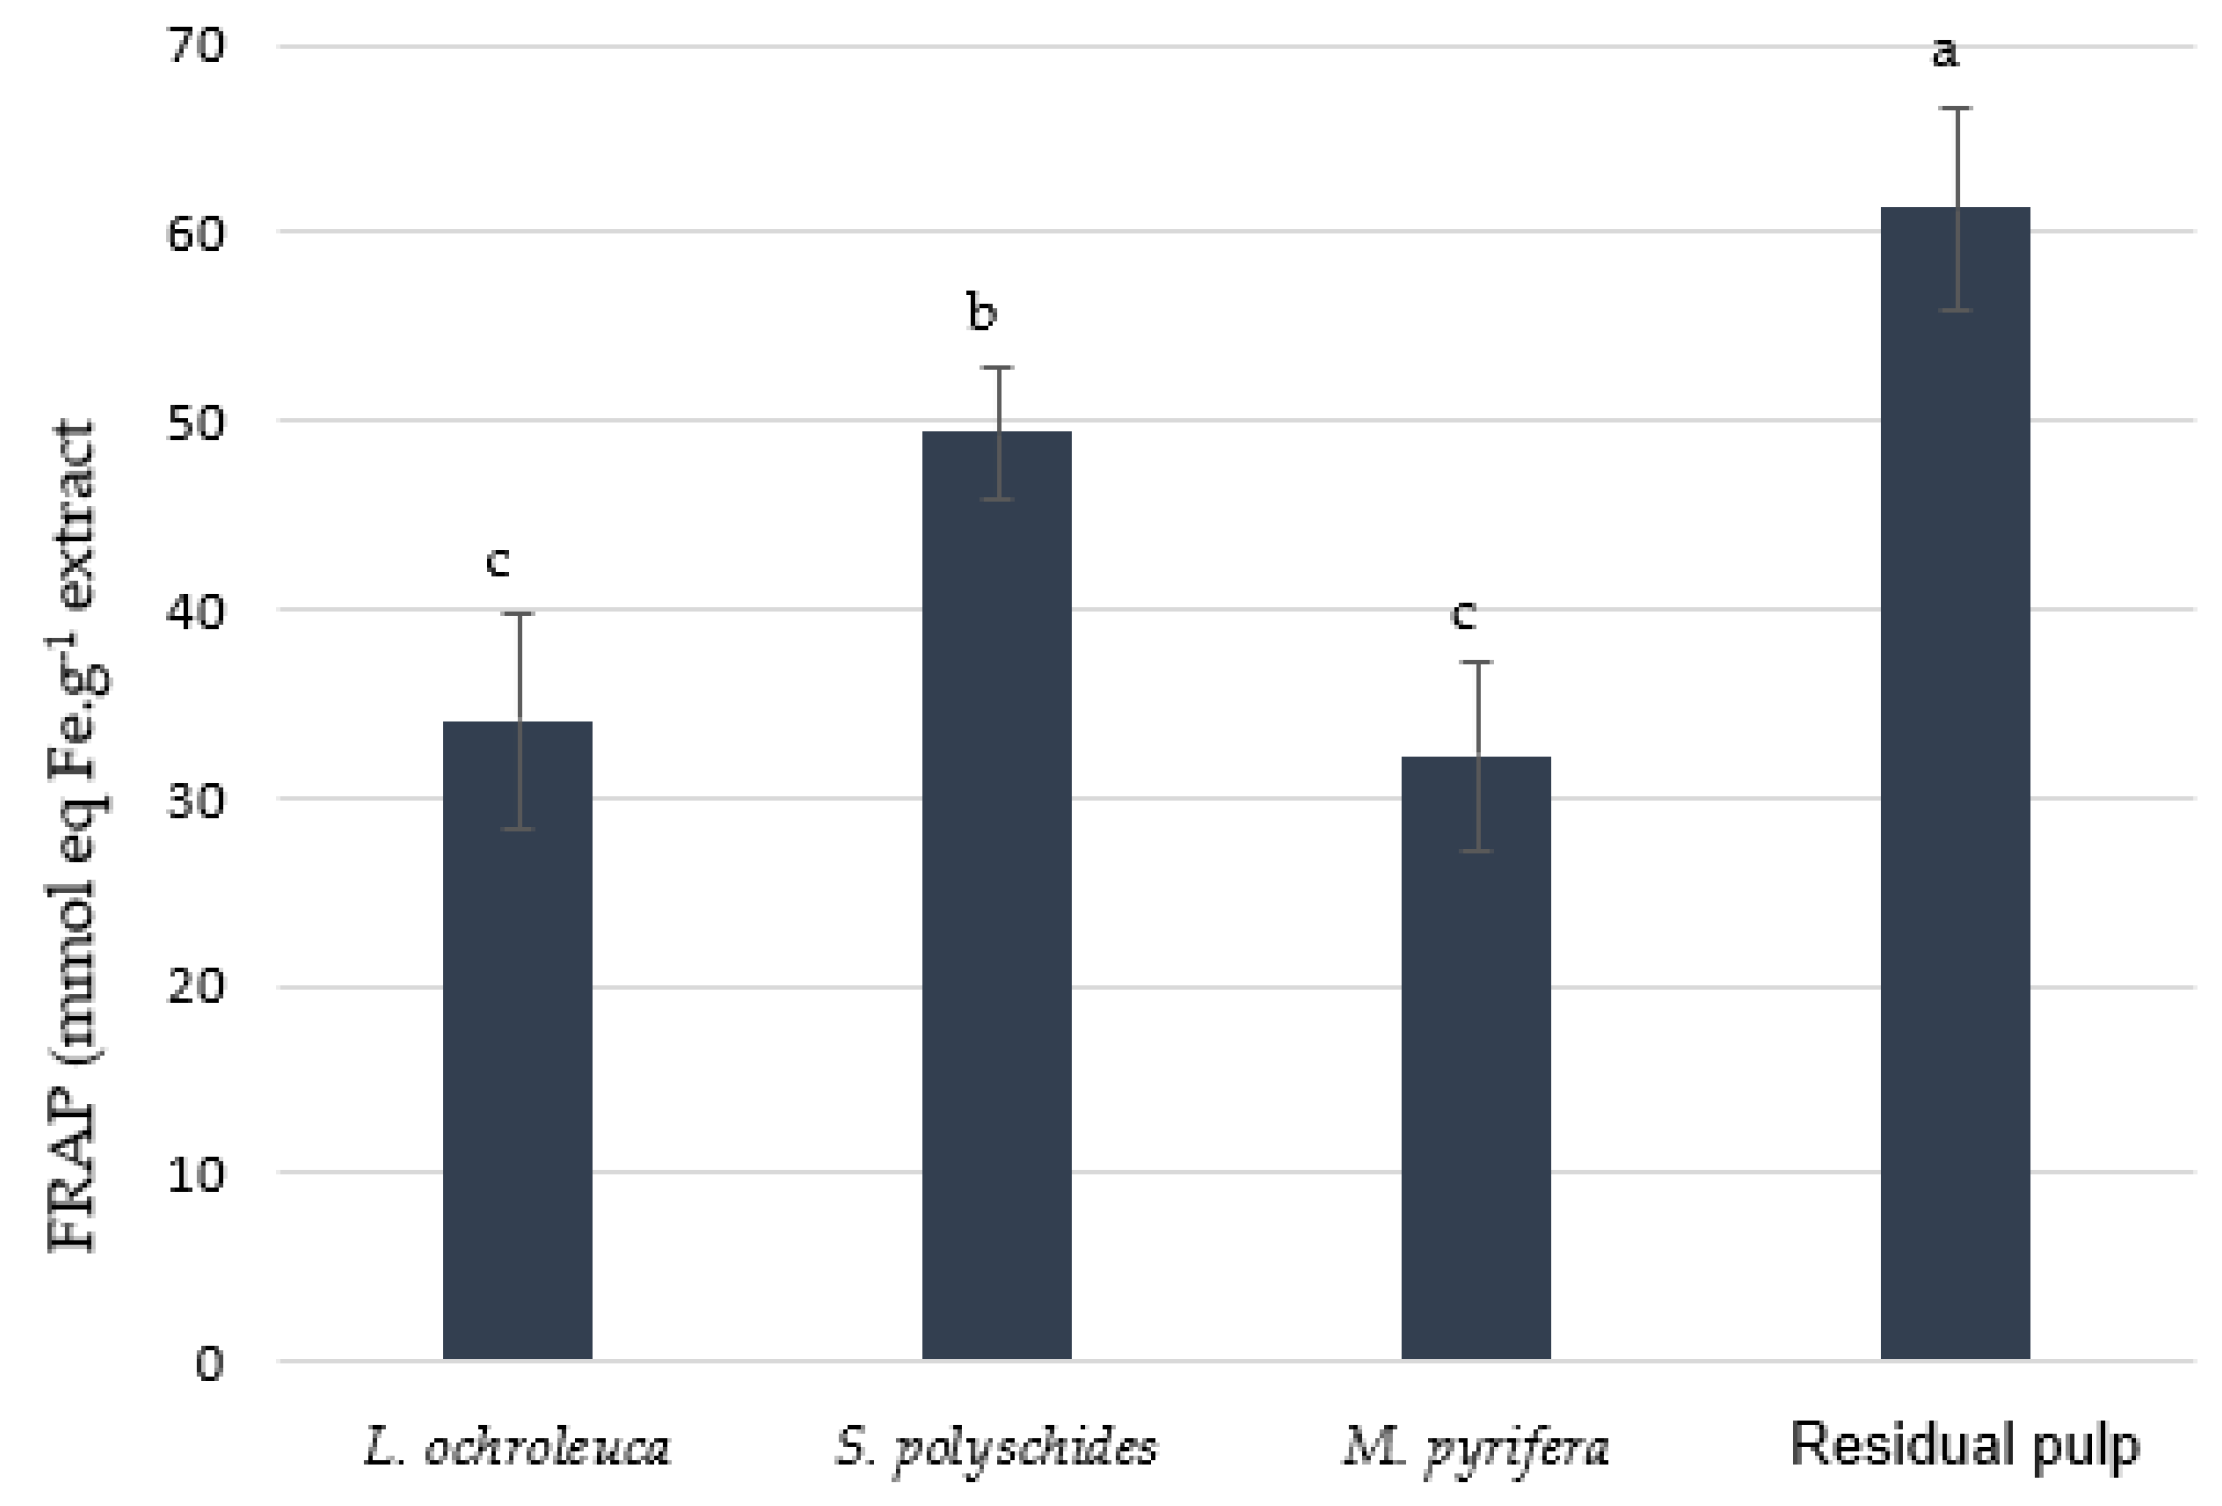
3.2.2. Ferric Reducing Antioxidant Power (FRAP)

The residual pulp had the highest reduction potential of 61.27 ± 3.41 mmol eq Fe·g−1 extract, significantly higher than all the other samples, followed by S. polyschides with a reduction potential of 49.30 ± 5.03 mmol eq Fe·g−1 extract. A lower value was recorded for M. pyrifera, which had a potential of 34.09 ± 5.79 mmol eq Fe·g−1 extract, while L. ochroleuca showed the lowest content, 32.21 ± 5.38 mmol eq Fe·g−1 extract (Figure 5).

4. Discussion

Marine seaweeds have a rich and diverse biochemical profile, containing primary and secondary metabolites such as pigments, phenolic compounds, polysaccharides, fatty acids and proteins. These compounds can be used in the development of various innovative products in many industries, particularly in the food industry. Abiotic factors such as changing nutrient levels, UV radiation, temperature, and salinity can cause environmental stress, leading to metabolic changes and variations in metabolites’ production. Therefore, the biochemical profile of seaweed changes in response to these stressors [44].
Given that the aim of this study was to evaluate the biochemical composition and antioxidant activity of L. ochroleuca (wild), S. polyschides (wild), M. pyrifera (cultivated) and the residual pulp of cultivated M. pyrifera, the results show differences among the species, which is in line with previously published data demonstrating the highly diverse biochemical composition of brown seaweeds. The fresh biomass of Laminaria ochroleuca and Saccorhiza polyschides had a high moisture content, as is usual for seaweeds, in line with or slightly higher than the values found by other authors (85–94%) [44,45,46]. The ash content represents the inorganic content of the sample [35]. For S. polyschides, large discrepancies were found between our study and previously published studies (20–44.6% dw) [44,45,46], indicating large environmental variations in nutrient availability between sampling sites. The remarkably high ash content found in M. pyrifera (48.94% dw) cultivated in Lüderitz, Namibia is even higher than that found by Lamare and Wing [36], indicating a high concentration of mineral salts and inorganic elements in the dry biomass. This may be related to the high availability of inorganic elements in the marine environment due to the Benguela Current and the seawater hydrodynamics that mobilise minerals by suspending them in seawater, making them available for absorption by the seaweed [47,48]. Finally, the reduction in the inorganic matter content of the pulp may be due to the previous aqueous extraction process. The work of Cebrián-Lloret et al. [49] showed the same downward trend during phycocolloid extraction, suggesting that inorganic matter may be lost to the liquid fraction during extraction.
The protein content of brown macroalgae usually varies between 5% and 20% of dry weight (dw), depending on species, season, and environmental conditions [29,50,51]. Specifically, S. polyschides has been reported to contain between 7% and 18% dw protein [52], L. ochroleuca exhibits values ranging from 7.5% to 18% [44], while M. pyrifera is known to have a protein content between 5% and 15% of its dry weight [53,54]. Our results are in line with these authors, demonstrating that seaweed biomass may be an interesting alternative protein source, suitable as a functional or supplementary food. This is particularly relevant given the growing global demand for sustainable protein sources to reduce reliance on animal-derived products.
Although brown algae tend to have a lower average protein content than red or green algae, their nutritional and functional potential remains substantial [51]. Beyond quantity, protein quality, including the essential amino acid profile, digestibility, and presence of bioactive peptides, plays a critical role in evaluating their effective value [50,55]. Several studies have demonstrated that proteins and hydrolysates derived from macroalgae exhibit antioxidant, antihypertensive, anti-inflammatory, and antimicrobial properties, highlighting their multifunctional applications in health-promoting food systems [55,56,57]. However, the bioaccessibility and bioavailability of algal proteins can be limited by structural barriers such as cell wall polysaccharides and the presence of anti-nutritional factors. Therefore, advances in extraction technologies such as enzymatic hydrolysis or fermentation are essential to enhance protein recovery and functionality [58].
Moreover, from an environmental and economic perspective, macroalgal cultivation and processing generally exhibit a significantly lower ecological footprint compared to conventional protein sources such as meat or soy. Their fast growth, low land and freshwater requirements, and potential for carbon sequestration make seaweeds particularly attractive for future food systems [59]. As such, brown seaweeds may contribute to more resilient, circular, and sustainable agri-food production systems.
As demonstrated by our study, brown macroalgae possess a high carbohydrate content, as has been reported by many authors [4,44,54,60,61,62,63,64]. A significant portion of these carbohydrates are classified as dietary fibres, primarily composed of complex, non-digestible polysaccharides such as alginate, laminarin, fucoidan, and cellulose [63]. From a nutritional perspective, these compounds are crucial for human digestive health, supporting gut microbiota, regulating bowel function, and contributing to satiety and weight management [51]. From a biotechnological perspective, they hold considerable potential across the food, pharmaceutical, and biomedical sectors. Furthermore, these polysaccharides function as prebiotics, promoting the growth of beneficial intestinal bacteria and contributing to the prevention of metabolic disorders such as obesity, type 2 diabetes, and cardiovascular disease [65]. In addition, the viscosity and gel-forming properties of alginates make them valuable as food additives, serving as thickeners, stabilizers, and emulsifiers in functional foods and nutraceutical formulations [66]. In a broader biotechnological context, brown algal carbohydrates are being explored for a wide range of industrial applications. Alginate, for example, is extensively used in wound dressings, drug delivery systems, and tissue engineering scaffolds due to its biocompatibility and capacity to form hydrogels [67]. Fucoidans, sulphated polysaccharides with demonstrated anticoagulant, antiviral, and immunomodulatory activities, are being investigated as pharmaceutical agents and for use in targeted cancer therapies [68,69]. These applications reinforce the role of brown macroalgae as a sustainable and multifunctional biomass that aligns with the principles of a circular economy and green biotechnology. Nevertheless, challenges remain, particularly regarding efficient extraction and purification processes and variability in carbohydrate composition due to environmental factors. Overcoming these limitations through process optimization and standardization of biomass quality will be essential for the scalable exploitation of brown algal carbohydrates.
The low lipid content indicates that seaweed and residual pulp biomass are compatible with a healthy diet [70]. Compared to the results of Pacheco et al. [44] and Sánchez-Machado et al. [71], the results for L. ochroleuca show higher values. However, L. ochroleuca harvested in spring had a lipid content of 2.2% dw [45], and S. polyschides harvested in summer had values varying between 1.1% and 2.5% dw [44,61,62], which are closer to our results. Moreover, S. polyschides harvested in the late summer/early autumn [46] had a lipid content of 3.3% dw, which is also remarkably similar to our results. Conversely, M. pyrifera showed a lipid content (1.28%) close to that reported by Biparva et al. (1.57%) [54]. These results show that the lipid content of seaweeds not only depends on the season in which the seaweed was harvested, but also varies according to geographical location, climate and environmental conditions such as light intensity, day length, temperature, salinity and nutrient availability. All of these factors influence the metabolic activities of seaweeds and consequently the production of metabolites. The increase in lipid concentration in the residual pulp biomass is likely a consequence of the prior aqueous extraction process, which may have partially compromised the integrity of the residual pulp cell membranes. In fact, the membrane stability can be affected by processing conditions, such as temperature, pH variations and exposure to organic or polar solvents [72,73]. When cell membranes are destabilized, subsequent steps in the analysis, particularly those involving mechanical or solvent-based disruption, can lead to enhanced cell lysis and the release of intracellular components, including lipids. Therefore, the elevated lipid content detected in the residual pulp may not reflect a true increase in lipid abundance, but rather a higher extractability due to membrane permeabilization and breakdown during the initial extraction step, making lipids more readily available for quantification compared to the untreated sample.
Palmitic acid and the oleic acid were the most abundant fatty acids in the three seaweeds, a finding confirmed by several authors [44,74,75,76]. Besides, the amount of the polyunsaturated fatty acids linolenic acid (ALA), arachidonic acid (ARA), eicosapentaenoic acid (EPA), and docosahexaenoic acid (DHA) was always higher in the residual pulp and M. pyrifera than in the other two species. Méndez et al. [77] found rather similar results but measured different values depending on the structure of the M. pyrifera biomass evaluated. The presence of EPA in both the residue and M. pyrifera and DHA in the residual pulp (albeit at low levels) suggests that this seaweed and the byproducts of its transformation can be used as functional ingredients in aquafeed. Both matrices contain nutrients essential for the growth and survival of marine larvae [78,79]. Alpha-linolenic acid (ALA) and docosahexaenoic acid (DHA) were not detected in the studies by Belattmania et al. and Pereira et al. [74,76], while Méndez et al. [77] found no DHA in their seaweed samples. The n6/n3 ratio is often used to assess the quality of fats in a healthy diet. The ideal ratio for a balanced diet should be close to one, as this value reflects the recommended balance of essential fatty acids [80]. The ratios of omega-6 and omega-3 fatty acids obtained in this study for L. ochroleuca and S. polyschides (1.75 and 3.92, respectively) are higher than those reported by Sánchez-Machado et al. [71], while similar or higher ratios have been reported for S. polyschides in samples collected off the coast of Morocco, in Peniche (Portugal) and in the Gulf of Cádiz (Spain), with ratios of 6.62, 3.31 and 10.9, respectively [45,74,76]. Interestingly, the best ratio was obtained by the residual pulp biomass with a ratio of 0.87, which can be explained, again, by the disruption of the cell membrane, allowing some fatty acids to be extracted more easily. Lower temperatures favour an increase in the PUFA content of Macrocystis pyrifera, compared to those found in warmer waters (L. ochroleuca and S. polyschides) [74,81]. This increase in PUFA contributes to the greater fluidity of cell membranes in low temperature environments [64].
As previously mentioned, brown seaweeds are used in the food industry for their alginate content [82]. The extraction efficiency and properties of alginates are influenced by various parameters, such as temperature, extraction time, pH, sample size and the alkaline extraction used [83]. Statistical analysis revealed that both the extraction temperature and the seaweed sample had highly significant effects on the extraction yield of alginate (p < 0.001), along with a significant interaction effect. This indicates that the impact of temperature on yield is dependent on the biomass source used. Post hoc Tukey HSD tests showed that all tested temperatures (25 °C, 60 °C, and 80 °C) differed significantly in terms of extraction yield, with mean values increasing as the temperature increased. This trend suggests that higher temperatures enhance alginate solubilization from the cell wall, possibly due to increased molecular mobility and disruption of intermolecular interactions. Regarding the biomass type, all sample groups differed significantly from each other. Our extractions yielded 7.33 to 51.04% dw of alginates, with L. ochroleuca registering the lowest yield at 25 °C extraction and the residual pulp the highest. Lower results were obtained by Belattmania et al. [74], while a similar yield was obtained for S. polyschides and L. ochroleuca by Kaidi et al. [84]. As for M. pyrifera, the best values were obtained at 80 °C, which were higher than those obtained by Hernández-Carmona et al. [43]. These differences may be attributed to the extent of cell wall degradation and intrinsic alginate content. The significant interaction between temperature and biomass type further highlights that extraction efficiency is not governed by a single factor, providing a clear indication of the variation between species and the need to optimize the extraction protocols for each of them.
Specifically, regarding the M. pyrifera residual biomass, our results show that the highest extraction yield was obtained with an extraction temperature of 60 °C. In all the extractions, and regardless of the extraction temperature, the residual biomass always showed higher alginate extraction yield values. Figure 2A shows that the cell wall of the algal biomass of M. pyrifera had a well-organized cell structure compared to the structure of the residual pulp, which was disrupted due to the aqueous extraction, an aspect that is clearly visible in Figure 2B. It is likely that this cellular disintegration, resulting from the processing, fostered the release of alginate and improved the overall efficiency of the extraction.
As far as the FTIR analysis is concerned, the most prominent absorption peaks found correspond to the functional groups typically associated with sodium alginate. Between the wavelengths of 3000 and 3500 cm−1, water is typically found [9,85]. Characteristic peaks were detected around 1600 cm−1 and 1400 cm−1, which are indicative of asymmetric and symmetric stretching vibrations of the carboxylate (–COO) groups, respectively, key functional groups in the alginate backbone [9]. These confirm the presence of uronic acids, such as guluronic (G) and mannuronic (M) acid residues, which constitute the main structural components of alginate. In the region between 3000 and 3500 cm−1, a broad absorption band was observed, which is commonly attributed to the O–H stretching vibrations of hydroxyl groups and adsorbed water molecules [86]. This is typical in polysaccharide-rich samples and reflects both the intrinsic hydrophilicity of alginate and the moisture retained within the matrix or bound to its structure. The intensity of this band may also be influenced by residual humidity or hydrogen bonding within the polymer network. Overall, the FTIR spectral profile supports the presence of alginate and related polysaccharides in the sample and can also be used as a rapid tool for confirming functional group integrity following extraction processes. Moreover, minor peaks detected in other regions (e.g., 1020–1100 cm−1) may correspond to C–O stretching in alcohols and polysaccharides, further substantiating the carbohydrate-rich nature of the material [87].
The natural environment provides a wide range of elements that are essential for the survival and functioning of living organisms. In addition, the environment also contains heavy metals, which can play a dual role, either supporting biological functions or causing toxicity [88]. Heavy metals are present in the environment from natural or anthropogenic sources, including industrial effluents, organic waste, waste burning, and transport and power generation. As seaweed can absorb these hazardous compounds in large quantities, their consumption can lead to the intake of these contaminants [89]. As mentioned above, the levels of arsenic found in most of our samples were rather high compared to the levels mentioned in Commission Regulation (EU) No. 465/2023 [90], which recommends a maximum level of inorganic arsenic between 10 and 300 μg·kg−1 of wet weight. These values are within the range reported by Yu and coworkers [91] for Phaeophyceae, usually the group with the highest arsenic concentration among seaweeds. However, the most common types of arsenic found in seaweed are arsenic sugars, which are believed to be like arseno-betaine in that they are harmless to the human body [92]. On the other hand, other authors point out that arsenic can be converted by mammals into toxic dimethylacetamide, a carcinogenic compound [93]. To assess the food safety of these algae, it is therefore necessary to obtain new data on the levels of organic and inorganic arsenic in the seaweeds and kelp pulp biomass.
Regarding macro- and microelements, the values recorded in the present study are generally in line with those reported by Circuncisão et al. [6] for brown algae, although, as mentioned above, large variations were recorded depending on the location, season and other environmental parameters. Seaweeds are usually rich in macroelements, making them valuable dietary sources of essential nutrients. These nutrients are needed to produce metabolites and cellular metabolism. However, the recommended daily intake of seaweed is between 5 and 10 g dw per day [94]. Hence, the macro- and microelements are found at lower levels than the dietary reference values [95], as only small amounts of seaweed can be consumed daily.
Like all photosynthetic organisms, brown algae contain chlorophyll a. These organisms also have other accessory pigments. In addition to chlorophylls c1 and c2, they are rich in fucoxanthin and other carotenoids. Together, these pigmented metabolites give these algae their yellowish-brown or dark brown colour. These natural pigments, regardless of their source, can be used in the food, cosmetic and pharmaceutical industries [12] as they have antioxidant, anti-inflammatory, antidiabetic, antiobesity, neuroprotective, anticancer and photoprotective properties [75]. The quantification of these pigments hence helps to determine the biotechnological potential of these samples. The analysis of pigment profiles in both fresh and dried macroalgal biomass revealed species-specific differences and notable changes induced by biomass drying. Fresh samples of L. ochroleuca and S. polyschides gave the best results for both fucoxanthin and chlorophylls a and c [96]. Freeze-thawing of fresh samples reduces molecular movement and promotes the formation of ice crystals, which can lead to membrane rupture due to hydrogen bridge dissociation [73]. In the fresh samples, S. polyschides consistently exhibited the highest concentrations of photosynthetic pigments, with chlorophyll a reaching 4218.74 ± 93.53 μg·g−1 fw, significantly higher than the value in L. ochroleuca (2599.38 ± 701.51 μg·g−1 fw). This dominance of chlorophyll a in S. polyschides aligns with previous studies showing high photosynthetic capacity in kelp and pseudo-kelp species, particularly under optimal environmental conditions [97]. Similarly, chlorophyll c—an accessory group of pigments involved in light harvesting—was more abundant in S. polyschides (965.62 ± 127.39 μg·g−1 fw) compared to L. ochroleuca (681.34 ± 159.54 μg·g−1 fw). Chlorophyll c facilitates efficient light absorption in the blue region of the spectrum, especially under low light or subtidal conditions, and its levels may reflect adaptive strategies to environmental light gradients. Variations in chlorophyll c concentrations could be due to several factors, including the specific methods used for extraction and quantification, and should be confirmed, in the future, by HPLC. Indeed, according to Marcheafave et al. [98], the extraction of photosynthetic pigments is influenced by a combination of abiotic and biotic factors [36,99], the type of solvent used, the state of the sample (fresh or dry) and the stage of the algae’s life cycle.
Regarding fucoxanthin, fresh S. polyschides again demonstrated higher levels (695.48 ± 22.51 μg·g−1 fw) than fresh L. ochroleuca (439.93 ± 30.32 μg·g−1 fw). This supports its potential as a valuable source of bioactive compounds for nutraceutical and pharmaceutical applications [51]. Besides, the maceration process also resulted in the release of more pigments.
As to the results obtained for photosynthetic pigments in the dried samples, the lower values recorded may be related to the drying process, which can degrade chlorophylls [77]. This comparison highlights the pigment degradation or transformation post-harvest, which is consistent with the known thermal and oxidative sensitivity of these compounds. Across all pigments, concentrations in the dried samples were markedly lower. For instance, the highest fucoxanthin content was found in the residual pulp (157.53 ± 2.72 μg·g−1 dw), which is noteworthy given that this material is typically regarded as a byproduct. Its unexpectedly high fucoxanthin content may result from residual pigment retention in fibrous fractions or partial concentration during drying. M. pyrifera exhibited the lowest fucoxanthin content (56.71 ± 1.38 μg·g−1 dw), likely due to species-specific differences in pigment biosynthesis. Meanwhile, chlorophyll a remained the highest in the dry biomass of L. ochroleuca (26.59 ± 1.93 μg·g−1 dw), and intermediate values were recorded in S. polyschides (22.18 ± 2.47 μg·g−1 dw) and the residual pulp (16.63 ± 2.33 μg·g−1 dw). This suggests that while chlorophyll a is susceptible to degradation, some fraction is retained even in waste material, offering opportunities for valorisation. The pattern for chlorophyll c was similar, with L. ochroleuca and S. polyschides again showing the highest values (2.95 ± 0.09 and 2.66 ± 0.03 μg·g−1 dw, respectively). Notably, the residual pulp retained very low levels (0.15 ± 0.08 μg·g−1 dw), indicating greater susceptibility of chlorophyll c to degradation or leaching during processing.
Fernandes et al. [100] studied the photosynthetic pigments of S. polyschides and L. ochroleuca, among other algae. Despite recording differences between parts of the thalli and the harvesting site, these authors recorded a range of fucoxanthin and chlorophyll a values like ours. However, our chlorophyll c concentrations were always lower than those in the aforementioned study.
These findings highlight the biotechnological potential of S. polyschides and L. ochroleuca as primary sources of chlorophylls and fucoxanthin. In parallel, the substantial pigment content found in the residual pulp underscores the feasibility of circular economy strategies for valorising algal byproducts through integrated biorefinery approaches [101]. Overall, the results advocate for a broader utilization of both primary and residual biomass fractions in pigment extraction and functional food development.
To assess the antioxidant capacity of macroalgal extracts, Total Phenolic Content (TPC) and Ferric Reducing Antioxidant Power (FRAP) are two commonly employed methods that provide complementary insights. The TPC assay quantifies the total concentration of phenolic compounds in a sample and offer a direct indication of the extract’s potential health benefits. Studies have reported a wide range of TPC values in brown algae, depending on species, season, and extraction method [102,103]. The FRAP assay evaluates the ability of antioxidants in the sample to reduce Fe3+ to Fe2+ under acidic conditions, thus measuring the electron-donating capacity of the extract [41]. This method is particularly useful for screening the antioxidant potential of complex matrices like seaweed extracts. Given the growing demand for natural antioxidants in the food, cosmetic, and pharmaceutical industries, the evaluation of macroalgal extracts using TPC and FRAP remains a vital step in bioactive compound screening. Furthermore, integrating these assays within biorefinery models enhances the sustainable exploitation of algal biomass, allowing for the valorisation of both primary and secondary metabolites.
The Total Phenolic Content (TPC) among the three seaweed species and the residual pulp showed statistically significant differences, ranging from 2.47 ± 0.33 mg GAE·g−1 in L. ochroleuca to 4.94 ± 0.31 mg GAE·g−1 in S. polyschides (Figure 4). These results highlight the species-specific variability in phenolic compound accumulation, which is known to be influenced by genetic, environmental, and seasonal factors, such as light availability, temperature, and nutrient levels [104,105]. S. polyschides displayed the highest TPC, suggesting a stronger antioxidant potential and increased relevance for bioactive applications, particularly in the food, pharmaceutical, and cosmeceutical industries. Regarding S. polyschides, previously published results obtained with methanolic extracts [20] showed a higher phenolic content (66.89 ± 0.002 mg GAE·g−1 extract) than ours. On the other hand, the aqueous extracts of L. ochroleuca and S. polyschides from the study by Pacheco et al. [44] had lower values than those obtained in the present study.
The relatively low TPC in L. ochroleuca may reflect its lower biosynthetic capacity for phenolic production or reduced accumulation due to physiological or ecological differences. L. ochroleuca showed a higher total polyphenol content than that obtained in the present study [75], as well as the TPC obtained by Beratto-Ramos et al. [106] for M. pyrifera, which was also harvested in winter. M. pyrifera and its residual pulp exhibited intermediate TPC values, with the pulp (4.86 ± 0.12 mg GAE·g−1) containing slightly more phenolics than the raw seaweed biomass (3.36 ± 0.13 mg GAE·g−1). This may be attributed to processing effects, where cell disruption and thermal exposure enhance the release of bound polyphenols from the algal matrix. It should also be stressed that the study from Beratto-Ramos et al. [106] used algae species harvested in distinct locations at different times of the year, and a residue from a previous extraction. In the subsequent hydroethanolic extraction of the residue, the temperature, polar organic solvent (ethanol) and water caused further damage to the cell membrane, and the antioxidant compounds were more easily extracted. All these factors, together with the sequential extraction, are likely to have influenced the antioxidant activity of the extracts. The residual pulp extract, therefore, showed interesting results, indicating that the primary extraction process of the biomass did not affect the whole biomass, leaving behind many of the bioactive compounds, which may be further explored.
Brown algae are generally rich in phenolic compounds, which have antioxidant properties [107]. The results obtained from the FRAP assay showed a higher antioxidant capacity of the residual pulp than the other samples, and much higher than that of the M. pyrifera biomass. Notably, M. pyrifera and L. ochroleuca showed markedly lower values, suggesting species-specific differences in antioxidant profiles (Figure 5). The elevated antioxidant potential of the residual pulp may be attributed to the accumulation or retention of bioactive compounds, such as phenolic acids (namely phloroglucinol) or reducing sugars, following upstream processing [25,108]. These results support previous findings indicating that algal processing residues remain rich in valuable phytochemicals, thus reinforcing their potential for reuse within circular biorefinery models [101,105]. Notably, this valorisation aligns with sustainable development goals by converting algal waste streams into functional ingredients for nutraceuticals or cosmetics [51].
The higher reducing power observed in S. polyschides is consistent with earlier studies reporting significant levels of polyphenols and antioxidant activity in brown algae species [109,110]. This is also in agreement with the TPC content of the species as analysed earlier.
In contrast, the lower FRAP values of L. ochroleuca and M. pyrifera may reflect differences in biochemical composition, including lower concentrations of polyphenolic compounds, as previously described, or a higher proportion of non-reducing antioxidants such as carotenoids or vitamins, which are not effectively measured by the FRAP assay [111]. This reinforces the importance of using multiple assays to comprehensively evaluate antioxidant potential, as each method has different sensitivities to various antioxidant mechanisms. In summary, the high FRAP value of the residual pulp underscores its potential as a valuable byproduct rich in antioxidant compounds, which could be further explored for functional food, cosmetic, or other applications. This finding contributes to the growing body of literature advocating for the integration of waste streams into high value bioproduct development within macroalgal processing chains.
The antioxidant profiles revealed by both the TPC and FRAP assays suggest a potential positive correlation between the total phenolic content and the ferric reducing capacity of the macroalgal samples and their byproducts. Notably, S. polyschides exhibited the highest TPC among the seaweeds, closely followed by the residual pulp, which also demonstrated the highest FRAP value. This parallel trend supports the widely reported observation that phenolic compounds, particularly phlorotannin’s in brown macroalgae, play a significant role in antioxidant activity due to their electron-donating capacity and metal-chelating properties [110,111]. Furthermore, L. ochroleuca, which showed the lowest TPC, also exhibited the lowest FRAP value, reinforcing this possible correlation. Several studies have demonstrated strong correlations between TPC and FRAP values in various macroalgal species, indicating that polyphenols are key contributors to reducing power.
Overall, our findings indicate that residual pulp from seaweed processing retains substantial content of proteins, lipids, carbohydrates, pigments and phenolics, representing a promising raw material for valorisation in biorefinery and circular economy strategies, particularly in the context of sustainable extraction of antioxidant-rich compounds from industrial byproducts [112,113].

5. Conclusions

The results of the biomolecular and functional screening showed that the target seaweed species and their byproducts have high potential for various uses. This approach is in line with the concept of the circular economy, promoting the integral use of natural resources and helping to reduce environmental impact. The analysis revealed that the residual pulp and S. polyschides render a high yield of alginates, which are essential for applications as thickeners and stabilisers in food, including ice creams, yoghurts, and cosmetic products. In addition, the levels of polyunsaturated fatty acids, including eicosapentaenoic acid (EPA, C20:5) and alpha-linolenic acid (ALA, C18:3), suggest applications in food supplements and balanced aquaculture feeds. The lipid profile of the residual pulp also shows a favourable n6/n3 ratio, ideal for formulations that promote human cardiovascular and metabolic health.
In terms of minerals, S. polyschides, M. pyrifera and the residual pulp have good levels of phosphorus, and both M. pyrifera and residual pulp have high levels of potassium, suggesting their use in agricultural fertilisers and biostimulants. Future studies could evaluate the efficacy of these compounds in agricultural systems and explore the impact of their inclusion in diets for invertebrates and fish in aquaculture systems.
Antioxidant analysis of the hydroethanolic extracts revealed high levels of polyphenols and a significant capacity to reduce iron ions, reinforcing the extracts’ potential as a source of antioxidant compounds for the cosmetic and pharmaceutical industries. These compounds could be used in anti-ageing products, photo protectants and formulations designed to mitigate oxidative stress.

Author Contributions

Conceptualization, T.M., S.L. and C.N.A.; methodology, T.M., C.N.A., S.L., M.V.F.; validation, T.M., C.N.A. and S.L.; formal analysis, H.S.F., T.M., C.N.A. and S.L. investigation, H.S.F., M.H.M. and M.V.F.; writing—original draft preparation, C.N.A., H.S.F. and T.M.; writing—review and editing, T.M., C.N.A. and S.L.; visualization, H.S.F.; supervision, T.M., C.N.A. and S.L.; project administration, T.M., C.N.A. and S.L.; funding acquisition, T.M., C.N.A. and S.L. All authors have read and agreed to the published version of the manuscript.

Funding

This work had the support of national funds through Fundação para a Ciência e Tecnologia (FCT), within the scope of the projects UID/04292/MARE-Centro de Ciências do Mar e do Ambiente and LA/P/0069/2020 (ARNET Associate Laboratory) (https://doi.org/10.54499/LA/P/0069/2020), and also the doctoral grant awarded to Marta V. Freitas, UI/BD/150957/2021 (https://doi.org/10.54499/UI/BD/150957/2021). Sílvia Lourenço is supported by the strategic project LA/P/0069/2020 (https://doi.org/10.54499/LA/P/0069/2020) granted to the Associate Laboratory ARNET by FCT.

Institutional Review Board Statement

Not applicable.

Informed Consent Statement

Not applicable.

Data Availability Statement

The raw data supporting the conclusions of this article will be made available by the authors on request.

Acknowledgments

The authors would like to thank João Franco and his team on the SeaForester Project for harvesting Laminaria ochroleuca. The authors are truly thankful to the Kelp Forest Foundation for providing the Macrocystis pyrifera biomass and residues. The authors would like also to thank Raúl Bernardino and Marta Neves for their valuable assistance and insightful suggestions concerning, respectively, the elemental and fatty acid profile analyses, carried out in this study.

Conflicts of Interest

The authors declare no conflicts of interest.

References

  1. Becket, A.; Macgregor, G.; Duffy, P.; Finlay, N.; Miller, J.; Sheridan, A. Forest Grazing and Seaweed Foddering: Early Neolithic Occupation at Maybole, South Ayrshire. Proc. Soc. Antiqu. Scotl. 2009, 139, 105–122. [Google Scholar] [CrossRef]
  2. Yang, L.E.; Lu, Q.Q.; Brodie, J. A review of the bladed Bangiales (Rhodophyta) in China: History, culture and taxonomy. Eur. J. Phycol. 2017, 52, 251–263. [Google Scholar] [CrossRef]
  3. Pereira, L. Macroalgae. Encyclopedia 2021, 1, 177–188. [Google Scholar] [CrossRef]
  4. Pereira, L. Edible Seaweeds of the World; CRC Press: Boca Raton, FL, USA, 2016; pp. 354–355. [Google Scholar] [CrossRef]
  5. Bocanegra, A.; Bastida, S.; Benedí, J.; Ródenas, S.; Sánchez-Muniz, F.J. Characteristics and Nutritional and Cardiovascular Health Properties of Seaweeds. J. Med. Food 2009, 12, 236–258. [Google Scholar] [CrossRef]
  6. Circuncisão, A.R.; Catarino, M.D.; Cardoso, S.M.; Silva, A.M.S. Minerals from Macroalgae Origin: Health Benefits and Risks for Consumers. Mar. Drugs 2018, 16, 400. [Google Scholar] [CrossRef] [PubMed]
  7. Lee, R.E. Phycology, 5th ed.; Cambridge University Press: New York, NY, USA, 2018. [Google Scholar]
  8. Cardoso, S.; Carvalho, L.; Silva, P.; Rodrigues, M.; Pereira, O.; Pereira, L. Bioproducts from Seaweeds: A Review with Special Focus on the Iberian Peninsula. Curr. Org. Chem. 2014, 18, 896–917. [Google Scholar] [CrossRef]
  9. Pereira, L.; Ribeiro-Claro, P. Analysis by vibrational spectroscopy of seaweeds with potential in food, pharmaceutical and cosmetic industries. In Marine Algae: Biodiversity, Taxonomy, Environmental Assessment, and Biotechnology; Pereira, L., Neto, J., Eds.; CRC Press: Boca Raton, FL, USA, 2015; pp. 228–239. [Google Scholar]
  10. Pal, A.; Kamthania, M.C.; Kumar, A. Bioactive Compounds and Properties of Seaweeds—A Review. Open Access Libr. J. 2014, 1, e752. [Google Scholar] [CrossRef]
  11. Din, N.A.S.; Mohd Alayudin, A.S.; Sofian-Seng, N.-S.; Rahman, H.A.; Mohd Razali, N.S.; Lim, S.J.; Mustapha, W.A. Brown Algae as Functional Food Source of Fucoxanthin: A Review. Foods 2022, 11, 2235. [Google Scholar] [CrossRef]
  12. Lourenço-Lopes, C.; Garcia-Oliveira, P.; Carpena, M.; Fraga-Corral, M.; Jimenez-Lopez, C.; Pereira, A.G.; Prieto, M.A.; Simal-Gandara, J. Scientific Approaches on Extraction, Purification and Stability for the Commercialization of Fucoxanthin Recovered from Brown Algae. Foods 2020, 9, 1113. [Google Scholar] [CrossRef]
  13. Norton, T.A. Growth Form and Environment in Saccorhiza polyschides. J. Mar. Biol. Assoc. 1969, 49, 1025–1045. [Google Scholar] [CrossRef]
  14. Smale, D.A.; Burrows, M.T.; Moore, P.; O’Connor, N.; Hawkins, S.J. Threats and Knowledge Gaps for Ecosystem Services Provided by Kelp Forests: A Northeast Atlantic Perspective. Ecol. Evol. 2013, 3, 4016–4038. [Google Scholar] [CrossRef]
  15. Salland, N.; Jensen, A.; Smale, D.A. The Structure and Diversity of Macroinvertebrate Assemblages Associated with the Understudied Pseudo-Kelp Saccorhiza polyschides in the Western English Channel (UK). Mar. Environ. Res. 2024, 198. [Google Scholar] [CrossRef] [PubMed]
  16. Biskup, S.; Bertocci, I.; Arenas, F.; Tuya, F. Functional Responses of Juvenile Kelps, Laminaria ochroleuca and Saccorhiza polyschides, to Increasing Temperatures. Aquat. Bot. 2014, 113, 117–122. [Google Scholar] [CrossRef]
  17. Guiry, M.D.; Guiry, G.M. AlgaeBase; World-Wide Electronic Publication, National University of Ireland: Galway, Ireland, 2013; Available online: http://www.algaebase.org (accessed on 31 January 2025).
  18. Soares, C.; Švarc-Gajić, J.; Oliva-Teles, M.T.; Pinto, E.; Nastić, N.; Savić, S.; Almeida, A.; Delerue-Matos, C. Mineral Composition of Subcritical Water Extracts of Saccorhiza polyschides, a Brown Seaweed Used as Fertilizer in the North of Portugal. J. Mar. Sci. Eng. 2020, 8, 244. [Google Scholar] [CrossRef]
  19. Freitas, M.V.; Pereira, L.; Afonso, C.; Mouga, T. Sabores Do Mar; Politécnico Leiria: Leiria, Portugal, 2022. [Google Scholar]
  20. Pinteus, S.; Silva, J.; Alves, C.; Horta, A.; Fino, N.; Rodrigues, A.I.; Mendes, S.; Pedrosa, R. Cytoprotective Effect of Seaweeds with High Antioxidant Activity from the Peniche Coast (Portugal). Food Chem. 2017, 218, 591–599. [Google Scholar] [CrossRef] [PubMed]
  21. Silva, J.; Alves, C.; Pinteus, S.; Mendes, S.; Pedrosa, R. Neuroprotective Effects of Seaweeds against 6-Hydroxidopamine-Induced Cell Death on an in Vitro Human Neuroblastoma Model. BMC Complement. Altern. Med. 2018, 18, 58. [Google Scholar] [CrossRef]
  22. Assis, J.; Tavares, J.T.; Serrão, E.A.; Alberto, F.; Ferreira, C.; Tavares, D.; Paulos, L.; Tempera, F. Florestas Marinhas. As Espécies de Algas Castanhas Gigantes de Portugal, 1st ed.; Gobius Comunicação e Ciência: Oeiras, Portugal, 2011; Volume 1. [Google Scholar]
  23. Pereira, T.R.; Azevedo, I.C.; Oliveira, P.; Silva, D.M.; Sousa-Pinto, I. Life History Traits of Laminaria ochroleuca in Portugal: The Range-Center of Its Geographical Distribution. Aquat. Bot. 2019, 152, 1–9. [Google Scholar] [CrossRef]
  24. WoRMS, Editorial Board World Register of Marine Species. Available online: https://www.marinespecies.org/ (accessed on 19 February 2025).
  25. Pérez-Alva, A.; Ramírez-Rodrigues, M.A.; Baigts-Allende, D.K.; Martínez-Jiménez, L.A.; Ramírez-Rodrigues, M.M. Macrocystis pyrifera: A Potential Source of Bioactive Compounds. Curr. Nutr. Food Sci. 2024, 20, 505–512. [Google Scholar] [CrossRef]
  26. Purcell-Meyerink, D.; Packer, M.A.; Wheeler, T.T.; Hayes, M. Aquaculture Production of the Brown Seaweeds Laminaria digitata and Macrocystis pyrifera: Applications in Food and Pharmaceuticals. Molecules 2021, 26, 1306. [Google Scholar] [CrossRef]
  27. Gold, M.; Bae, Y.S.C.; Goldberg, D.J.; Jamal, S.; Lewis, A.B.; Marchbein, S.; Ros, A.; Santhanam, U.; DiNatale, L.; Emmetsberger, J. Macrocystis pyrifera Ferment-Containing Creams for Optimizing Facial Skin Rejuvenation. J. Cosmet. Dermatol. 2023, 22, 3313–3319. [Google Scholar] [CrossRef]
  28. Gojon-Baez, H.H.; Siqueiros-Beltrones, D.A.; Hernandez-Contreras, H. In Situ Ruminal Digestibility and Degradability of Macrocystis pyrifera and Sargassum spp. in Bovine Livestock. Cienc. Mar. 1998, 24, 463–481. [Google Scholar] [CrossRef]
  29. Mansilla, A.; Ávila, M. Using Macrocystis pyrifera (L.) C. Agardh from Southern Chile as a Source of Applied Biological Compounds. Rev. Bras. Farm. 2011, 21, 262–267. [Google Scholar] [CrossRef]
  30. Qin, Y. Alginate Fibres: An Overview of the Production Processes and Applications in Wound Management. Polym. Int. 2008, 57, 171–180. [Google Scholar] [CrossRef]
  31. Latimer, G.W., Jr. (Ed.) AOAC Official Methods of Analysis of AOAC International, 20th ed.; Association of Official Analytical Chemists: Gaithersburg, MA, USA, 2016; ISBN 0935584870. [Google Scholar]
  32. Angell, A.R.; Mata, L.; de Nys, R.; Paul, N.A. The Protein Content of Seaweeds: A Universal Nitrogen-to-Protein Conversion Factor of Five. J. Appl. Phycol. 2016, 28, 511–524. [Google Scholar] [CrossRef]
  33. Bligh, E.G.; Dyer, W.J. A rapid method of total lipid extraction and purification. Can. J. Biochem. Physiol. 1959, 37, 911–917. [Google Scholar] [CrossRef]
  34. De Coen, W.M.; Janssen, C.R. The Use of Biomarkers in Daphnia Magna Toxicity Testing. IV. Cellular Energy Allocation: A New Methodology to Assess the Energy Budget of Toxicant-Stressed Daphnia Populations; Kluwer Academic Publishers: Dordrecht, The Netherlands, 1997; Volume 6. [Google Scholar]
  35. Fernández, A.; Grienke, U.; Soler-Vila, A.; Guihéneuf, F.; Stengel, D.B.; Tasdemir, D. Seasonal and Geographical Variations in the Biochemical Composition of the Blue Mussel (Mytilus edulis L.) from Ireland. Food Chem. 2015, 177, 43–52. [Google Scholar] [CrossRef]
  36. Osório, C.; Machado, S.; Peixoto, J.; Bessada, S.; Pimentel, F.B.; Alves, R.C.; Oliveira, M.B.P.P. Pigments Content (Chlorophylls, Fucoxanthin and Phycobiliproteins) of Different Commercial Dried Algae. Separations 2020, 7, 33. [Google Scholar] [CrossRef]
  37. Connan, S. Spectrophotometric Assays of Major Compounds Extracted from Algae. Methods Mol. Biol. 2015, 1308, 75–101. [Google Scholar] [CrossRef] [PubMed]
  38. Ritchie, R.J. Universal chlorophyll equations for estimating chlorophylls a, b, c, and d and total chlorophylls in natural assemblages of photosynthetic organisms using acetone, methanol, or ethanol solvents. Photosynthetica 2008, 46, 115–126. [Google Scholar] [CrossRef]
  39. Trica, B.; Delattre, C.; Gros, F.; Ursu, A.V.; Dobre, T.; Djelveh, G.; Michaud, P.; Oancea, F. Extraction and Characterization of Alginate from an Edible Brown Seaweed (Cystoseira barbata) Harvested in the Romanian Black Sea. Mar. Drugs 2019, 17, 405. [Google Scholar] [CrossRef]
  40. Singleton, V.L.; Rossi, J.A. Colorimetry of total phenolics with phosphomolybdic-phosphotungstic acid reagents. Am. J. Enol. Vitic. 1965, 16, 144–158. [Google Scholar] [CrossRef]
  41. Benzie, I.F.F.; Strain, J.J. The Ferric Reducing Ability of Plasma (FRAP) as a Measure of “Antioxidant Power”: The FRAP Assay. Anal. Biochem. 1996, 239, 70–76. [Google Scholar] [CrossRef] [PubMed]
  42. Beratto-Ramos, A.; Agurto-Muñoz, C.; Pablo Vargas-Montalba, J.; Castillo, R. del P. Fourier-Transform Infrared Imaging and Multivariate Analysis for Direct Identification of Principal Polysaccharides in Brown Seaweeds. Carbohydr. Polym. 2020, 230, 115561. [Google Scholar] [CrossRef] [PubMed]
  43. Hernández-Carmona, G.; McHugh, D.J.; López-Gutiérrez, F. Pilot Plant Scale Extraction of Alginates from Macrocystis pyrifera. 2. Studies on Extraction Conditions and Methods of Separating the Alkaline-Insoluble Residue. J. Appl. Phycol. 1999, 11, 493–502. [Google Scholar] [CrossRef]
  44. Pacheco, D.; Miranda, G.; Rocha, C.P.; Pato, R.L.; Cotas, J.; Gonçalves, A.M.M.; Dias Santos, S.M.; Bahcevandziev, K.; Pereira, L. Portuguese Kelps: Feedstock Assessment for the Food Industry. Appl. Sci. 2021, 11, 10681. [Google Scholar] [CrossRef]
  45. Garcia, J.S.; Palacios, V.; Roldán, A. Nutritional Potential of Four Seaweed Species Collected in the Barbate Estuary (Gulf of Cadiz, Spain). J. Nutr. Food Sci. 2016, 6, 3. [Google Scholar] [CrossRef]
  46. Milinovic, J.; Fernando, A.L.; Campos, B.; Leite, B.; Mata, P.; Diniz, M.; Sardinha, J.; Noronha, J.P. Nutritional Benefits of Edible Macroalgae from the Central Portuguese Coast: Inclusion of Low-Calorie ‘Sea Vegetables’ in Human Diet. Int. J. Environ. Sci. Nat. Res. 2021, 28, 556250. [Google Scholar] [CrossRef]
  47. Fennel, W. Theory of the Benguela Upwelling System. J. Phys. Oceanogr. 1999, 29, 177–190. [Google Scholar] [CrossRef]
  48. Rixen, T.; Lahajnar, N.; Lamont, T.; Koppelmann, R.; Martin, B.; van Beusekom, J.E.E.; Siddiqui, C.; Pillay, K.; Meiritz, L. Oxygen and Nutrient Trapping in the Southern Benguela Upwelling System. Front. Mar. Sci. 2021, 8, 730591. [Google Scholar] [CrossRef]
  49. Cebrián-Lloret, V.; Metz, M.; Martínez-Abad, A.; Knutsen, S.H.; Ballance, S.; López-Rubio, A.; Martínez-Sanz, M. Valorization of Alginate-Extracted Seaweed Biomass for the Development of Cellulose-Based Packaging Films. Algal Res. 2022, 61, 102576. [Google Scholar] [CrossRef]
  50. Fleurence, J. Seaweed proteins: Biochemical, nutritional and functional properties. Trends Food Sci. Technol. 1999, 10, 25–28. [Google Scholar] [CrossRef]
  51. Holdt, S.L.; Kraan, S. Bioactive compounds in seaweed: Functional food applications and legislation. J. Appl. Phycol. 2011, 23, 543–597. [Google Scholar] [CrossRef]
  52. Vieira, E.F.; Soares, C.; Machado, S.; Correia, M.; Ramalhosa, M.J.; Oliva-teles, M.T.; Paula Carvalho, A.; Domingues, V.F.; Antunes, F.; Oliveira, T.A.C.; et al. Seaweeds from the Portuguese Coast as a Source of Proteinaceous Material: Total and Free Amino Acid Composition Profile. Food Chem. 2018, 269, 264–275. [Google Scholar] [CrossRef]
  53. Bolton, J.J.; Rothman, M.D. The Potential for Kelp (Order Laminariales) Aquaculture in South Africa: A Biological Review. Bot. Mar. 2024, 67, 525–541. [Google Scholar] [CrossRef]
  54. Biparva, P.; Mirzapour-Kouhdasht, A.; Valizadeh, S.; Garcia-Vaquero, M. Advanced Processing of Giant Kelp (Macrocystis Pyrifera) for Protein Extraction and Generation of Hydrolysates with Anti-Hypertensive and Antioxidant Activities In Vitro and the Thermal/Ionic Stability of These Compounds. Antioxidants 2023, 12, 775. [Google Scholar] [CrossRef]
  55. Harnedy, P.A.; FitzGerald, R.J. Bioactive proteins, peptides, and amino acids from macroalgae. J. Phycol. 2011, 47, 218–232. [Google Scholar] [CrossRef] [PubMed]
  56. O’Brien, R.; Hayes, M.; Sheldrake, G.; Tiwari, B.; Walsh, P. Macroalgal Proteins: A Review. Foods 2022, 11, 571. [Google Scholar] [CrossRef] [PubMed]
  57. Rocha, D.H.A.; Pinto, D.C.G.A.; Silva, A.M.S. Macroalgae Specialized Metabolites: Evidence for Their Anti-Inflammatory Health Benefits. Mar. Drugs 2022, 20, 789. [Google Scholar] [CrossRef]
  58. Bleakley, S.; Hayes, M. Algal Proteins: Extraction, Application, and Challenges Concerning Production. Foods 2017, 6, 33. [Google Scholar] [CrossRef]
  59. Khan, N.; Sudhakar, K.; Mamat, R. Macroalgae farming for sustainable future: Navigating opportunities and driving innovation. Heliyon 2024, 10, e28208. [Google Scholar] [CrossRef]
  60. Garcia-Oliveira, P.; Carreira-Casais, A.; Caleja, C.; Pereira, E.; Calhelha, R.C.; Sokovic, M.; Simal-Gandara, J.; Ferreira, I.C.F.R.; Prieto, M.A.; Barros, L. Macroalgae as an Alternative Source of Nutrients and Compounds with Bioactive Potential. Proceedings 2021, 70, 46. [Google Scholar] [CrossRef]
  61. Rodrigues, D.; Freitas, A.C.; Pereira, L.; Rocha-Santos, T.A.P.; Vasconcelos, M.W.; Roriz, M.; Rodríguez-Alcalá, L.M.; Gomes, A.M.P.; Duarte, A.C. Chemical Composition of Red, Brown and Green Macroalgae from Buarcos Bay in Central West Coast of Portugal. Food Chem. 2015, 183, 197–207. [Google Scholar] [CrossRef] [PubMed]
  62. Soares, C.; Sousa, S.; Machado, S.; Vieira, E.; Carvalho, A.P.; Ramalhosa, M.J.; Morais, S.; Correia, M.; Oliva-Teles, T.; Domingues, V.F.; et al. Bioactive Lipids of Seaweeds from the Portuguese North Coast: Health Benefits versus Potential Contamination. Foods 2021, 10, 1366. [Google Scholar] [CrossRef] [PubMed]
  63. Kraan, S. Algal Polysaccharides, Novel Applications and Outlook. In Carbohydrates—Comprehensive Studies on Glycobiology and Glycotechnology; InTech: London, UK, 2012. [Google Scholar] [CrossRef]
  64. Paiva, L.; Lima, E.; Neto, A.I.; Baptista, J. Seasonal Variability of the Biochemical Composition and Antioxidant Properties of Fucus spiralis at Two Azorean Islands. Mar. Drugs 2018, 16, 248. [Google Scholar] [CrossRef] [PubMed]
  65. De Jesus Raposo, M.F.; De Morais, A.M.M.B.; De Morais, R.M.S.C. Emergent Sources of Prebiotics: Seaweeds and Microalgae. Mar. Drugs 2016, 14, 27. [Google Scholar] [CrossRef]
  66. Carrasqueira, J.; Bernardino, S.; Bernardino, R.; Afonso, C. Marine-Derived Polysaccharides and Their Potential Health Benefits in Nutraceutical Applications. Mar. Drugs 2025, 23, 60. [Google Scholar] [CrossRef]
  67. Lee, K.Y.; Mooney, D.J. Alginate: Properties and biomedical applications. Prog. Polym. Sci. 2012, 37, 106–126. [Google Scholar] [CrossRef]
  68. Fitton, J.H. Therapies from Fucoidan; Multifunctional Marine Polymers. Mar. Drugs 2011, 9, 1731–1760. [Google Scholar] [CrossRef]
  69. Thinh, P.D.; Menshova, R.V.; Ermakova, S.P.; Anastyuk, S.D.; Ly, B.M.; Zvyagintseva, T.N. Structural Characteristics and Anticancer Activity of Fucoidan from the Brown Alga Sargassum mcclurei. Mar. Drugs 2013, 11, 1456–1476. [Google Scholar] [CrossRef]
  70. Lordan, S.; Ross, R.P.; Stanton, C. Marine bioactives as functional food ingredients: Potential to reduce the incidence of chronic diseases. Mar. Drugs 2011, 9, 1056–1100. [Google Scholar] [CrossRef]
  71. Sánchez-Machado, D.I.; López-Cervantes, J.; López-Hernández, J.; Paseiro-Losada, P. Fatty Acids, Total Lipid, Protein and Ash Contents of Processed Edible Seaweeds. Food Chem. 2004, 85, 439–444. [Google Scholar] [CrossRef]
  72. Cebrián-Lloret, V.; Martínez-Abad, A.; López-Rubio, A.; Martínez-Sanz, M. Sustainable Bio-Based Materials from Minimally Processed Red Seaweeds: Effect of Composition and Cell Wall Structure. J. Polym. Environ. 2023, 31, 886–899. [Google Scholar] [CrossRef]
  73. Mouga, T. Integridade membranar: A resposta da membrana plasmática ao stress térmico e aos solventes orgânicos em células de beterraba. Captar Ciência e Ambiente Para Todos 2024, 13, 1–13. [Google Scholar]
  74. Belattmania, Z.; Engelen, A.H.; Pereira, H.; Serrão, E.A.; Custódio, L.; Varela; Zrid; Reani; Sabour, B. Fatty Acid Composition and Nutraceutical Perspectives of Brown Seaweeds from the Atlantic Coast of Morocco. Int. Food Res. J. 2018, 25, 1520–1527. [Google Scholar]
  75. Otero, P.; López-Martínez, M.I.; García-Risco, M.R. Application of Pressurized Liquid Extraction (PLE) to Obtain Bioactive Fatty Acids and Phenols from Laminaria ochroleuca Collected in Galicia (NW Spain). J. Pharm. Biomed. Anal. 2019, 164, 86–92. [Google Scholar] [CrossRef] [PubMed]
  76. Pereira, T.; Horta, A.; Barroso, S.; Mendes, S.; Gil, M.M. Study of the Seasonal Variations of the Fatty Acid Profiles of Selected Macroalgae. Molecules 2021, 26, 5807. [Google Scholar] [CrossRef] [PubMed]
  77. Méndez, F.; Rivero, A.; Bahamonde, F.; Gallardo, P.; Frangopulos, M.; Zolezzi, J.; Inestrosa, N.C.; Mansilla, A. Fatty Acid Composition of Different Morphological Structures in the Sub-Antarctic Kelps Macrocystis pyrifera (L.) C. Agardh and Lessonia Flavicans Bory of the Magellan Ecoregion: Nutritional and Biomedical Potentials. J. Appl. Phycol. 2023, 36, 831–844. [Google Scholar] [CrossRef]
  78. Carboni, S.; Hughes, A.D.; Atack, T.; Tocher, D.R.; Migaud, H. Fatty Acid Profiles during Gametogenesis in Sea Urchin (Paracentrotus lividus): Effects of Dietary Inputs on Gonad, Egg and Embryo Profiles. Comp. Biochem. Physiol. Part A Mol. Integr. Physiol. 2013, 164, 376–382. [Google Scholar] [CrossRef]
  79. Gomes, A.S.; Lourenço, S.; Santos, P.M.; Neves, M.; Adão, P.; Tecelão, C.; Pombo, A. High Dietary Protein, n − 3/n − 6 Ratio and β-Carotene Enhances Paracentrotus lividus (Lamarck, 1816) Larval Development. Aquac. Res. 2022, 53, 5398–5412. [Google Scholar] [CrossRef]
  80. Gómez Candela, C.; Bermejo López, L.M.; Loria Kohen, V. Importancia Del Equilibrio Del Índice Omega-6/Omega-3 En El Mantenimiento de Un Buen Estado de Salud. Recomendaciones Nutricionales. Nutr. Hosp. 2011, 26, 323–329. [Google Scholar] [CrossRef]
  81. Schmid, M.; Guihéneuf, F.; Stengel, D.B. Fatty Acid Contents and Profiles of 16 Macroalgae Collected from the Irish Coast at Two Seasons. J. Appl. Phycol. 2014, 26, 451–463. [Google Scholar] [CrossRef]
  82. McHugh, D.J. Production, Properties and Uses of Alginates. In Production and Utilization of Products from Commercial Seaweeds; McHugh, D.J., Ed.; FAO: Rome, Italy, 1987. [Google Scholar]
  83. Mohammed, A.; Bissoon, R.; Bajnath, E.; Mohammed, K.; Lee, T.; Bissram, M.; John, N.; Jalsa, N.K.; Lee, K.Y.; Ward, K. Multistage Extraction and Purification of Waste Sargassum natans to Produce Sodium Alginate: An Optimization Approach. Carbohydr. Polym. 2018, 198, 109–118. [Google Scholar] [CrossRef] [PubMed]
  84. Kaidi, S.; Bentiss, F.; Jama, C.; Khaya, K.; Belattmania, Z.; Reani, A.; Sabour, B. Isolation and Structural Characterization of Alginates from the Kelp Species Laminaria ochroleuca and Saccorhiza polyschides from the Atlantic Coast of Morocco. Colloids Interfaces 2022, 6, 51. [Google Scholar] [CrossRef]
  85. Azizi, N.; Najafpour, G.; Younesi, H. Acid Pretreatment and Enzymatic Saccharification of Brown Seaweed for Polyhydroxybutyrate (PHB) Production Using Cupriavidus necator. Int. J. Biol. Macromol. 2017, 101, 1029–1040. [Google Scholar] [CrossRef]
  86. El-Houssiny, A.S.; Ward, A.A.; Mostafa, D.M.; Abd-El-Messieh, S.L.; Abdel-Nour, K.N.; Darwish, M.M.; Khalil, W.A. Drug–polymer interaction between glucosamine sulfate and alginate nanoparticles: FTIR, DSC and dielectric spectroscopy studies. Adv. Nat. Sci. Nanosci. Nanotechnol. 2016, 7, 02501. [Google Scholar] [CrossRef]
  87. Miguel, S.P.; D’Angelo, C.; Ribeiro, M.P.; Simões, R.; Coutinho, P. Chemical Composition of Macroalgae Polysaccharides from Galician and Portugal Coasts: Seasonal Variations and Biological Properties. Mar. Drugs 2023, 21, 589. [Google Scholar] [CrossRef] [PubMed]
  88. Reid, G.K.; Chopin, T.; Robinson, S.M.C.; Azevedo, P.; Quinton, M.; Belyea, E. Weight Ratios of the Kelps, Alaria esculenta and Saccharina latissima, Required to Sequester Dissolved Inorganic Nutrients and Supply Oxygen for Atlantic Salmon, Salmo salar, in Integrated Multi-Trophic Aquaculture Systems. Aquaculture 2013, 408–409, 34–46. [Google Scholar] [CrossRef]
  89. Cavaco, M.; Duarte, A.; Freitas, M.V.; Afonso, C.; Bernardino, S.; Pereira, L.; Martins, M.; Mouga, T. Seasonal Nutritional Profile of Gelidium corneum (Rhodophyta, Gelidiaceae) from the Center of Portugal. Foods 2021, 10, 2394. [Google Scholar] [CrossRef]
  90. European Commission. Regulation (EU) No 465/2023 of the European Parliament and of the Council. In Official Journal of the European Union; European Commission: Bruxelles, Belgium, 2023. [Google Scholar]
  91. Yu, Y.; Morales-Rodriguez, A.; Zhou, G.; Barrón, D.; Sahuquillo, À.; López-Sánchez, J.F. Survey of Arsenic Content in Edible Seaweeds and Their Health Risk Assessment. Food Chem. Toxicol. 2024, 187, 114603. [Google Scholar] [CrossRef]
  92. Wei, C.; Li, W.; Zhang, C.; Van Hulle, M.; Cornelis, R.; Zhang, X. Safety Evaluation of Organoarsenical Species in Edible Porphyra from the China Sea. J. Agric. Food Chem. 2003, 51, 5176–5182. [Google Scholar] [CrossRef]
  93. Chen, J.; Cao, W.; Wei, P.; Li, T.; Weng, W. Speciation Transformation of Arsenic in Abalone Viscera Hydrolysate Fraction: In Vitro Digestion and in Vivo Metabolism. Food Res. Int. 2019, 123, 340–345. [Google Scholar] [CrossRef]
  94. Cherry, P.; O’Hara, C.; Magee, P.J.; McSorley, E.M.; Allsopp, P.J. Risks and benefits of consuming edible seaweeds. Nutr. Rev. 2019, 77, 307–329. [Google Scholar] [CrossRef] [PubMed]
  95. European Commission. Regulation (EU) No 1169/2011 of the European Parliament and of the Council. In Official Journal of the European Union; European Commission: Bruxelles, Belgium, 2011. [Google Scholar]
  96. Beattie, S.W.; Morançais, M.; Déléris, P.; Fleurence, J.; Dumay, J. Extraction of Phycocyanin and Phycoerythrin Pigments. In Protocols for Macroalgae Research; Charrier, B., Wichard, T., Reddy, C.R.K., Eds.; CRC Press: Boca Raton, FL, USA, 2018; pp. 249–265. [Google Scholar]
  97. Gomez, I.; Huovinen, P. Morpho-functional patterns and zonation of South Chilean seaweeds: The importance of photosynthetic and bio-optical traits. Mar. Ecol. Prog. Ser. 2011, 422, 77–91. [Google Scholar] [CrossRef]
  98. Marcheafave, G.G.; Tormena, C.D.; Pauli, E.D.; Rakocevic, M.; Bruns, R.E.; Scarminio, I.S. Experimental Mixture Design Solvent Effects on Pigment Extraction and Antioxidant Activity from Coffea arabica L. Leaves. Microchem. J. 2019, 146, 713–721. [Google Scholar] [CrossRef]
  99. Shannon, E.; Abu-Ghannam, N. Optimisation of Fucoxanthin Extraction from Irish Seaweeds by Response Surface Methodology. J. Appl. Phycol. 2017, 29, 1027–1036. [Google Scholar] [CrossRef]
  100. Fernandes, F.; Barbosa, M.; Oliveira, A.P.; Azevedo, I.C.; Sousa-Pinto, I.; Valentão, P.; Andrade, P.B. The Pigments of Kelps (Ochrophyta) as Part of the Flexible Response to Highly Variable Marine Environments. J. Appl. Phycol. 2016, 28, 3689–3696. [Google Scholar] [CrossRef]
  101. Zabochnicka, M.; Krzywonos, M.; Romanowska-Duda, Z.; Szufa, S.; Darkalt, A.; Mubashar, M. Algal Biomass Utilization toward Circular Economy. Life 2022, 12, 1480. [Google Scholar] [CrossRef] [PubMed]
  102. Jensen, S.; Helgadóttir, J.K.; Jónsdóttir, R. Bioactivity Screening of Extracts from Icelandic Seaweeds for Potential Application in Cosmeceuticals. Phycology 2024, 4, 576–588. [Google Scholar] [CrossRef]
  103. Hermund, D.B.; Torsteinsen, H.; Vega, J.; Figueroa, F.L.; Jacobsen, C. Screening for New Cosmeceuticals from Brown Algae Fucus vesiculosus with Antioxidant and Photo-Protecting Properties. Marine Drugs 2022, 20, 687. [Google Scholar] [CrossRef]
  104. van Hees, D.H.; Olsen, Y.S.; Wernberg, T.; Van Alstyne, K.L.; Kendrick, G.A. Phenolic concentrations of brown seaweeds and relationships to nearshore environmental gradients in Western Australia. Mar. Biol. 2017, 164, 74. [Google Scholar] [CrossRef]
  105. Lopes, C.; Obando, J.M.C.; Santos, T.C.D.; Cavalcanti, D.N.; Teixeira, V.L. Abiotic Factors Modulating Metabolite Composition in Brown Algae (Phaeophyceae): Ecological Impacts and Opportunities for Bioprospecting of Bioactive Compounds. Mar. Drugs 2024, 22, 544. [Google Scholar] [CrossRef]
  106. Beratto-Ramos, A.; Castillo-Felices, R.d.P.; Troncoso-Leon, N.A.; Agurto-Muñoz, A.; Agurto-Muñoz, C. Selection criteria for high-value biomass: Seasonal and morphological variation of polyphenolic content and antioxidant capacity in two brown macroalgae. J. Appl. Phycol. 2019, 31, 653–664. [Google Scholar] [CrossRef]
  107. Gupta, S.; Abu-Ghannam, N. Recent developments in the application of seaweeds or seaweed extracts as a means for enhancing the safety and quality attributes of foods. Innov. Food Sci. Emerg. Technol. 2011, 12, 600–609. [Google Scholar] [CrossRef]
  108. Ravanal, M.C.; Pezoa-Conte, R.; von Schoultz, S.; Hemming, J.; Salazar, O.; Anugwom, I.; Jogunola, O.; Mäki-Arvela, P.; Willför, S.; Mikkola, J.-P.; et al. Comparison of different types of pretreatment and enzymatic saccharification of Macrocystis pyrifera for the production of biofuel. Algal Res. 2016, 13, 141–147. [Google Scholar] [CrossRef]
  109. Silva, A.; Rodrigues, C.; Garcia-Oliveira, P.; Lourenço-Lopes, C.; Silva, S.A.; Garcia-Perez, P.; Carvalho, A.P.; Domingues, V.F.; Barroso, M.F.; Delerue-Matos, C.; et al. Screening of Bioactive Properties in Brown Algae from the Northwest Iberian Peninsula. Foods 2021, 10, 1915. [Google Scholar] [CrossRef] [PubMed]
  110. Dang, T.T.; Bowyer, M.C.; Van Altena, I.A.; Scarlett, C.J. Comparison of chemical profile and antioxidant properties of the brown algae. Int. J. Food Sci. Technol. 2017, 53, 174–181. [Google Scholar] [CrossRef]
  111. Yuan, Y.V.; Walsh, N.A. Antioxidant and antiproliferative activities of extracts from a variety of edible seaweeds. Food Chem. Toxicol. 2006, 44, 1144–1150. [Google Scholar] [CrossRef]
  112. Torres, M.D.; Kraan, S.; Domínguez, H. Seaweed biorefinery. Rev. Environ. Sci. Biotechnol. 2019, 18, 335–388. [Google Scholar] [CrossRef]
  113. Johnston, K.G.; Abomohra, A.; French, C.E.; Zaky, A.S. Recent Advances in Seaweed Biorefineries and Assessment of Their Potential for Carbon Capture and Storage. Sustainability 2023, 15, 13193. [Google Scholar] [CrossRef]
Figure 1. Samples of kelp used in this study. (A) Saccorhiza polyschides (distinctive stipe and bulbous base); (B) Laminaria ochroleuca (juvenile); (C) Macrocystis pyrifera by the Kelp Forest Foundation and (D) M. pyrifera residual pulp.
Applsci 15 05745 g001
Figure 2. Optical microscope view of (A) Macrocystis pyrifera and (B) residual pulp (total magnification 400×).
Applsci 15 05745 g002
Figure 3. FTIR spectra of sodium alginate from the three seaweed species and residual pulp, extracted at different temperatures (25 °C, 60 °C and 80 °C), (a) Laminaria ochroleuca, (b) Saccorhiza polyschides, (c) Macrocystis pyrifera, (d) residual pulp. In each of the spectra, the four traces, correspond from top to down, to the following: commercial alginate standard, extraction at 80 °C, extraction at 60 °C and extraction at 25 °C.
Applsci 15 05745 g003
Figure 4. Total phenolic content (TPC), expressed as mg GAE·g−1, in hydroethanolic kelp extracts. Data are presented as mean ± standard deviation (n = 3). Different letters above the bars indicate statistically significant differences between the extracts (p < 0.05).
Applsci 15 05745 g004
Figure 5. Ferric reducing antioxidant power (FRAP), expressed as mmol Fe2+ equivalents·g−1 of extract, in hydroethanolic kelp extracts. Data are presented as mean ± standard deviation (n = 3). Different letters above the bars indicate statistically significant differences between the extracts (p < 0.05).
Applsci 15 05745 g005
Table 1. List of species studied, harvesting season and coordinates of the harvest site.
SpeciesOrderHarvest SeasonHarvest LocationCoordinates
Macrocystis pyrifera (L.) C. Agardh 1820LaminarialesWinterLüderitz, Namibia26°38′15.8” S 15°06′17.5” E
Laminaria ochroleuca Bachelot de la Pylaie 1824LaminarialesSummerPeniche Coast, Peniche, Portugal39°21′31.00″ N 9°21′59.05″ W
Saccorhiza polyschides (Lightfoot) Batters 1902TilopteridalesSummerCasais do Baleal, Peniche, Portugal39°22′29.61” N 9°19′36.00” W
Table 2. Proximate composition of the three seaweeds and kelp pulp, expressed as percentage of fresh weight (fw) for moisture, and dry weight (dw) for other parameters. Values are presented as mean ± standard deviation (n = 4). Different superscript lowercase letters (a, b, c, d) indicate statistically significant differences between different samples for a p-value < 0.05.
L. ochroleucaS. polyschidesM. pyriferaResidual Pulp
Moisture (% fw)73.35 ± 1.36 b79.74 ± 0.50 a--
Ash (% dw)22.03 ± 0.60 c20.01 ± 0.05 d48.94 ± 0.70 a28.56 ± 0.25 b
Proteins (% dw)8.93 ± 0.168.97 ± 0.279.20 ± 0.049.08 ± 0.02
Lipids (% dw)2.79 ± 0.25 a, b3.41 ± 0.46 a1.28 ± 0.19 c2.37 ± 0.21 b
Carbohydrates 1 (% dw)56.03 ± 1.33 a55.42 ± 0.30 a29.17 ± 0.71 c46.41 ± 0.28 b
1 Following AOAC, carbohydrates were determined by subtraction as: Total carbohydrates (%) = 100% − (% water + % protein + % ash + % lipid).
Table 3. Percentage of total fatty acids in the three seaweeds and residual pulp. Values are presented as mean ± standard deviation (n = 3). SFA—saturated fatty acids, MUFA—monounsaturated fatty acids, PUFA—polyunsaturated fatty acids, ALA—linolenic acid, ARA—arachidonic acid, EPA—eicosapentaenoic acid, DHA—docosahexaenoic acid. Different superscript lowercase letters (a, b, c, d) indicate statistically significant differences between samples for a p-value < 0.05.
L. ochroleucaS. polyschidesM. pyriferaResidual Pulp
SFA (% Total FA)
C14:06.53 ± 0.56 c5.31 ± 0.50 c13.29 ± 0.66 a9.71 ± 0.82 b
C15:00.73 ± 0.05 a0.49 ± 0.02 b0.42 ± 0.02 b0.43 ± 0.03 b
C16:033.9 ± 0.40 b40.25 ± 1.37 a21.50 ± 0.34 c18.54 ± 0.47 d
C17:00.16 ± 0.01 b0.26 ± 0.00 a0.19 ± 0.04 a, b0.19 ± 0.04 a, b
C18:01.43 ± 0.04 b3.07 ± 0.12 a1.70 ± 0.78 b1.46 ± 0.53 b
C20:00.32 ± 0.01 b1.97 ± 0.22 a0.27 ± 0.03 b0.32 ± 0.03 b
∑ Total SFA43.45 ± 0.5951.57 ± 1.5737.66 ± 1.5230.91 ± 0.79
MUFA (% Total FA)
C16:1 n-73.58 ± 0.03 a1.49 ± 0.06 d1.82 ± 0.06 b1.65 ± 0.06 c
C18:1 n-917.74 ± 2.09 a14.81 ± 0.33 b12.11 ± 0.55 b8.64 ± 0.11 c
C20:1 n-96.23 ± 0.06 c3.13 ± 0.04 d9.07 ± 0.15 b15.56 ± 0.10 a
∑ Total MUFA30.79 ± 0.9723.35 ± 0.3528.14 ± 0.9431.07 ± 0.30
PUFA (% Total FA)
C18:2 n-6 cis6.27 ± 0.12 b9.41 ± 0.24 a5.59 ± 0.06 c5.53 ± 0.05 c
C18:3 n-3 (ALA)3.38 ± 0.10 c2.54 ± 0.06 d5.68 ± 0.04 b8.54 ± 0.06 a
C20:4 n-6 (ARA)8.64 ± 0.17 c9.24 ± 0.72 c14.55 ± 0.50 a10.70 ± 0.52 b
C20:5 n-3 (EPA)5.90 ± 0.18 c2.49 ± 0.15 d6.80 ± 0.16 b11.14 ± 0.50 a
C22:6 n-3 (DHA)n.d.0.02 ± 0.01 a0.14 ± 0.02 a0.11 ± 0.02 a
∑ Other PUFA0.27 ± 0.030.22 ± 0.010.59 ± 0.070.92 ± 0.08
∑ Total PUFA25.77 ± 0.6025.08 ± 1.2434.20 ± 0.6838.01 ± 1.05
n-3/n-61.75 ± 0.023.92 ± 0.031.66 ± 0.020.87 ± 0.01
Table 4. Concentrations of fucoxanthin, chlorophyll a and chlorophyll c in fresh and dried samples of the three seaweed species under study and the residual kelp pulp. Data are presented as mean ± standard deviation (n = 3). Different superscript lowercase letters (a, b, c, d) indicate statistically significant differences between different samples for p-value < 0.05.
L. ochroleucaS. polyschidesM. pyriferaResidual Pulp
Fresh Samples (μg·g−1 fw)
Fucoxanthin 439.93 ± 30.32 b695.48 ± 22.51 a--
Chlorophyll a2599.38 ± 701.51 b4218.74 ± 93.53 a--
Chlorophyll c681.34 ± 159.54 b965.62 ± 127.39 a--
Dried Samples (μg·g−1 dw)
Fucoxanthin142.12 ± 3.31 b111.34 ± 4.99 c56.71 ± 1.38 d157.52 ± 2.71 a
Chlorophyll a26.59 ± 1.93 a22.18 ± 2.47 a, b19.27 ± 3.17 b16.63 ± 2.33 b
Chlorophyll c2.95 ± 0.09 a2.66 ± 0.32 a0.69 ± 0.07 b0.15 ± 0.08 c
Table 5. The relative percentages of macroelements (mg·g−1) and microelements (µg·g−1) in the three seaweed species and residual pulp. The results are reported as mean ± standard deviation (n = 3). Different superscript lowercase letters (a, b, c) indicate statistically significant differences between different samples for a p-value < 0.05.
L. ochroleucaS. polyschidesM. pyriferaResidual Pulp
Macroelements (mg·g −1)
Phosphorus (P)1.18 ± 0.05 b, c0.83 ± 0.02 c5.29 ± 0.03 a4.05 ± 0.26 a, b
Sulphur (S)8.40 ± 0.18 a7.50 ± 0.15 a, b0.59 ± 0.08 c2.55 ± 0,13 b, c
Chlorine (Cl)24.84 ± 0.86 b22.67 ± 1.95 b77.97 ± 0.65 a39.84 ± 0.62 a, b
Potassium (K)22.34 ± 0.35 b, c6.03 ± 0.44 c67.72 ± 0.62 a56.07 ± 0.70 a, b
Calcium (Ca)7.80 ± 0.32 a, b11.72 ± 0.74 a3.61 ± 0.05 c7.18 ± 0.11 b, c
Microelements (μg·g−1)
Iron (Fe)72.67 ± 15.1 c137.67 ± 10.50 b, c646.33 ± 143.79 a229.00 ± 6.56 a, b
Zinc (Zn)15.67 ± 1.15 c33.33 ± 2.52 a24.67 ± 0.58 a, b22.00 ± 1.00 b, c
Copper (Cu)5.00 ± 0,00 b3.67 ± 0.58 b, c8.00 ± 1.00 a3.67 ± 0.58 c
Arsenic (As)40.00 ± 1.73 a, b12.67 ± 1.53 c55.67 ± 4.16 a26.00 ± 1.00 b, c
Table 6. Alginate extraction yields as % of dry matter (dw) from the three seaweeds and the residual kelp pulp after alkaline extraction at different temperatures. Values are presented in % of dry matter, as mean ± standard deviation (n = 3). Different superscript lowercase letters (a, b, c, d) indicate statistically significant differences between samples for a p-value < 0.05.
L. ochroleucaS. polyschidesM. pyriferaResidual Pulp
25 °C7.33 ± 0.29 d22.67 ± 0.74 b13.34 ± 0.66 c41.37 ± 0.50 a
60 °C13.61 ± 0.71 d33.32 ± 0.73 b28.32 ± 1.05 c51.04 ± 0.75 a
80 °C29.91 ± 0.75 c46.71 ± 1.02 a31.63 ± 0.93 c38.85 ± 0.43 b
Disclaimer/Publisher’s Note: The statements, opinions and data contained in all publications are solely those of the individual author(s) and contributor(s) and not of MDPI and/or the editor(s). MDPI and/or the editor(s) disclaim responsibility for any injury to people or property resulting from any ideas, methods, instructions or products referred to in the content.

