
Integrated Approach to Aerodynamic Optimization of Darrieus Wind Turbine Based on the Taguchi Method and Computational Fluid Dynamics (CFD)

 , ,
, ,
Abstract
1. Introduction
2. Methodology
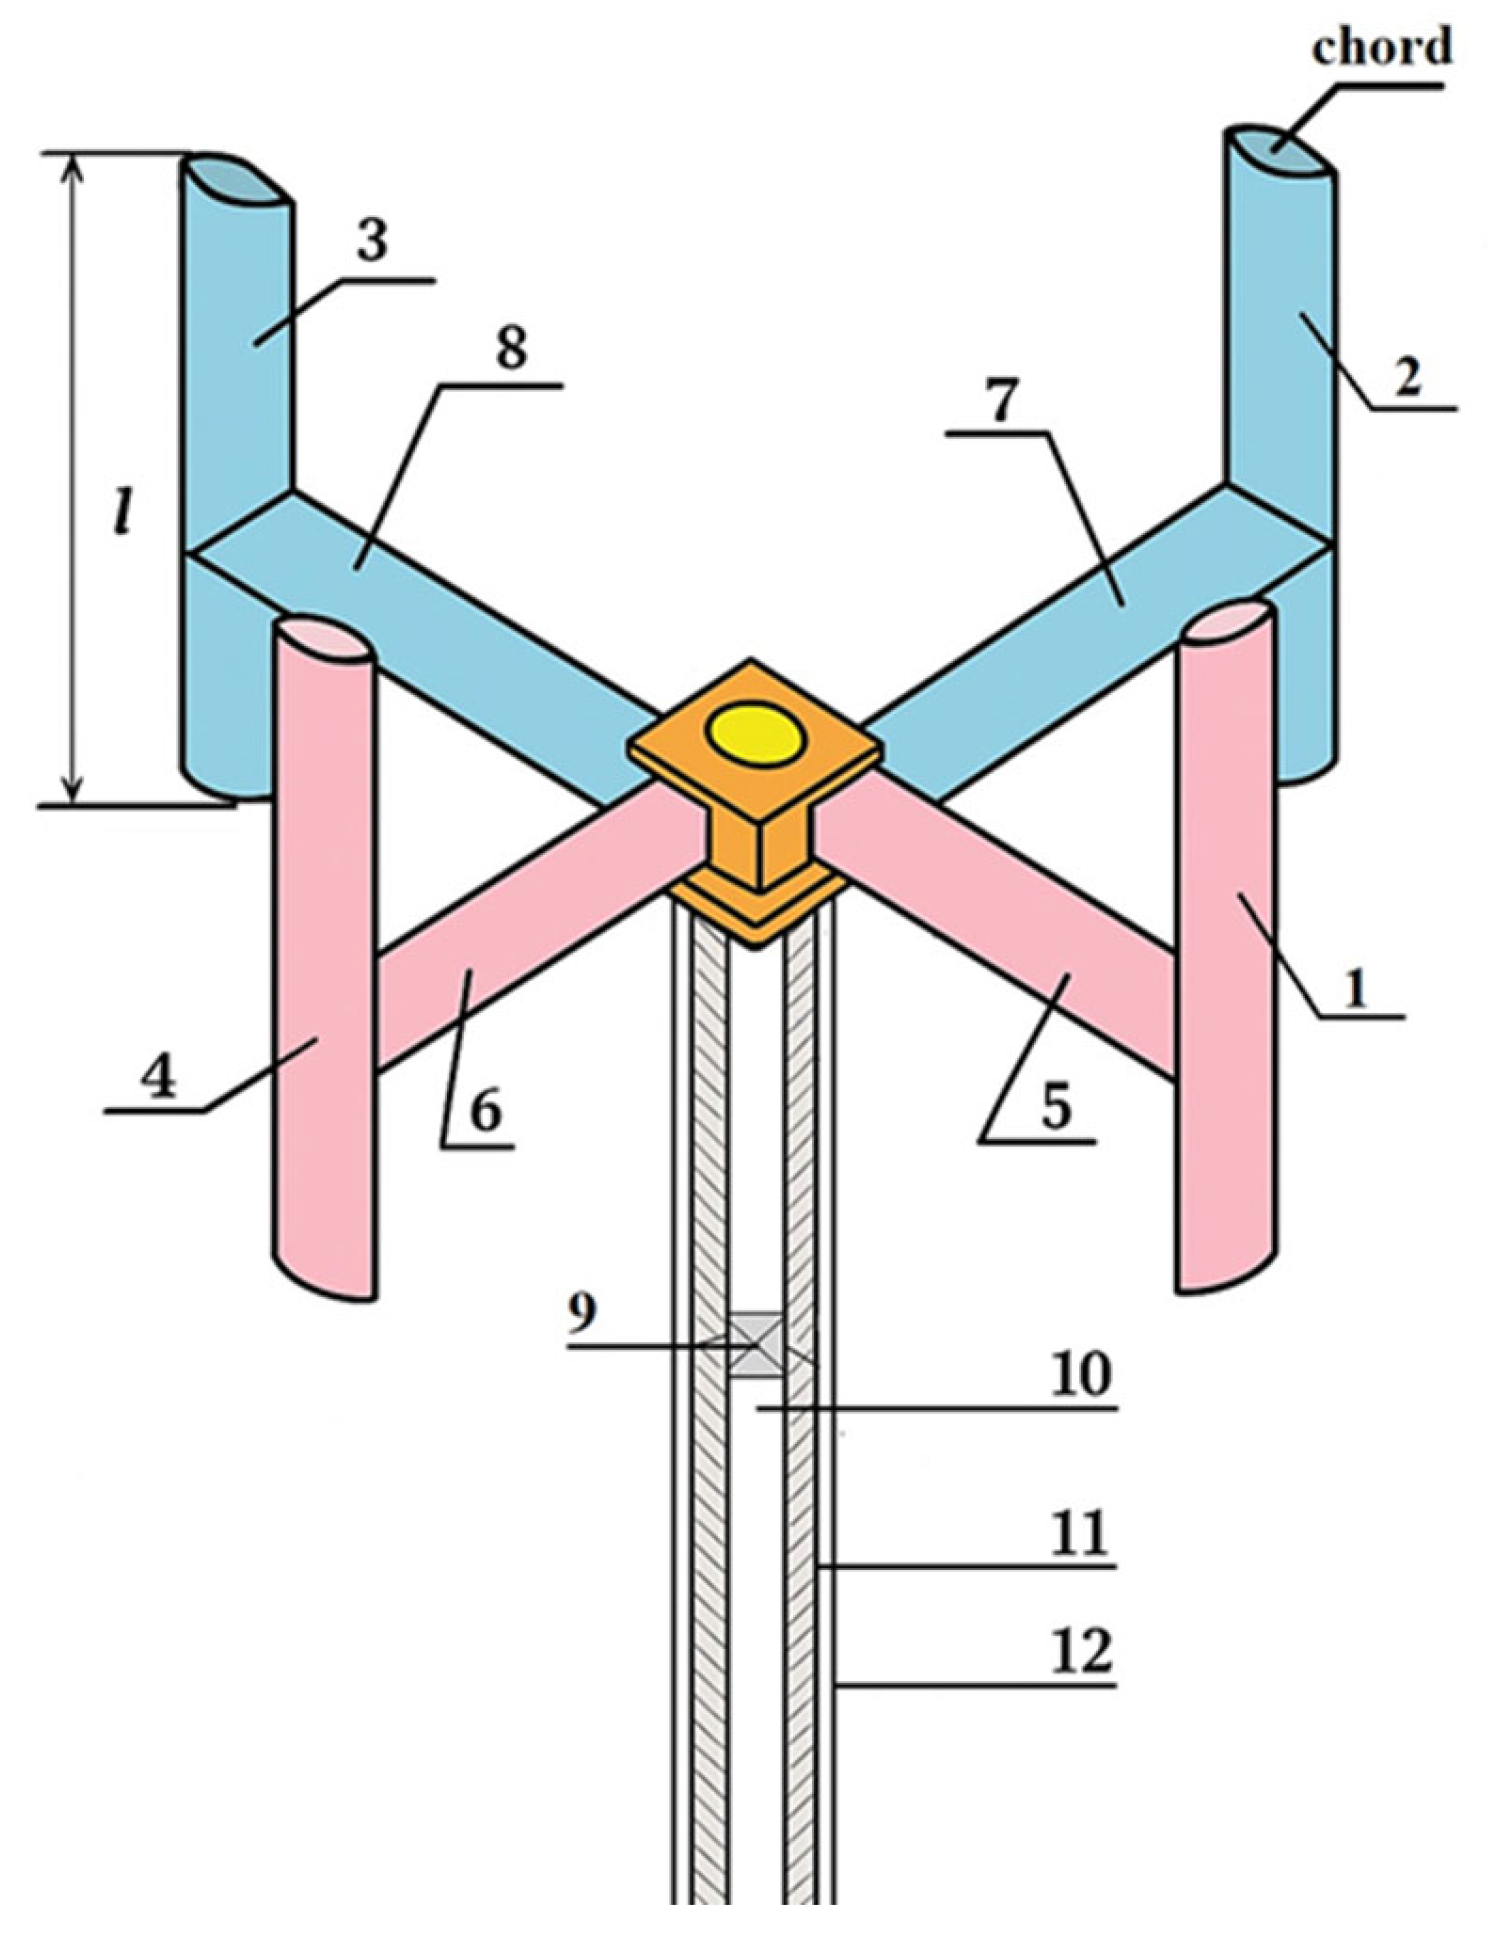
2.1. Model Geometry
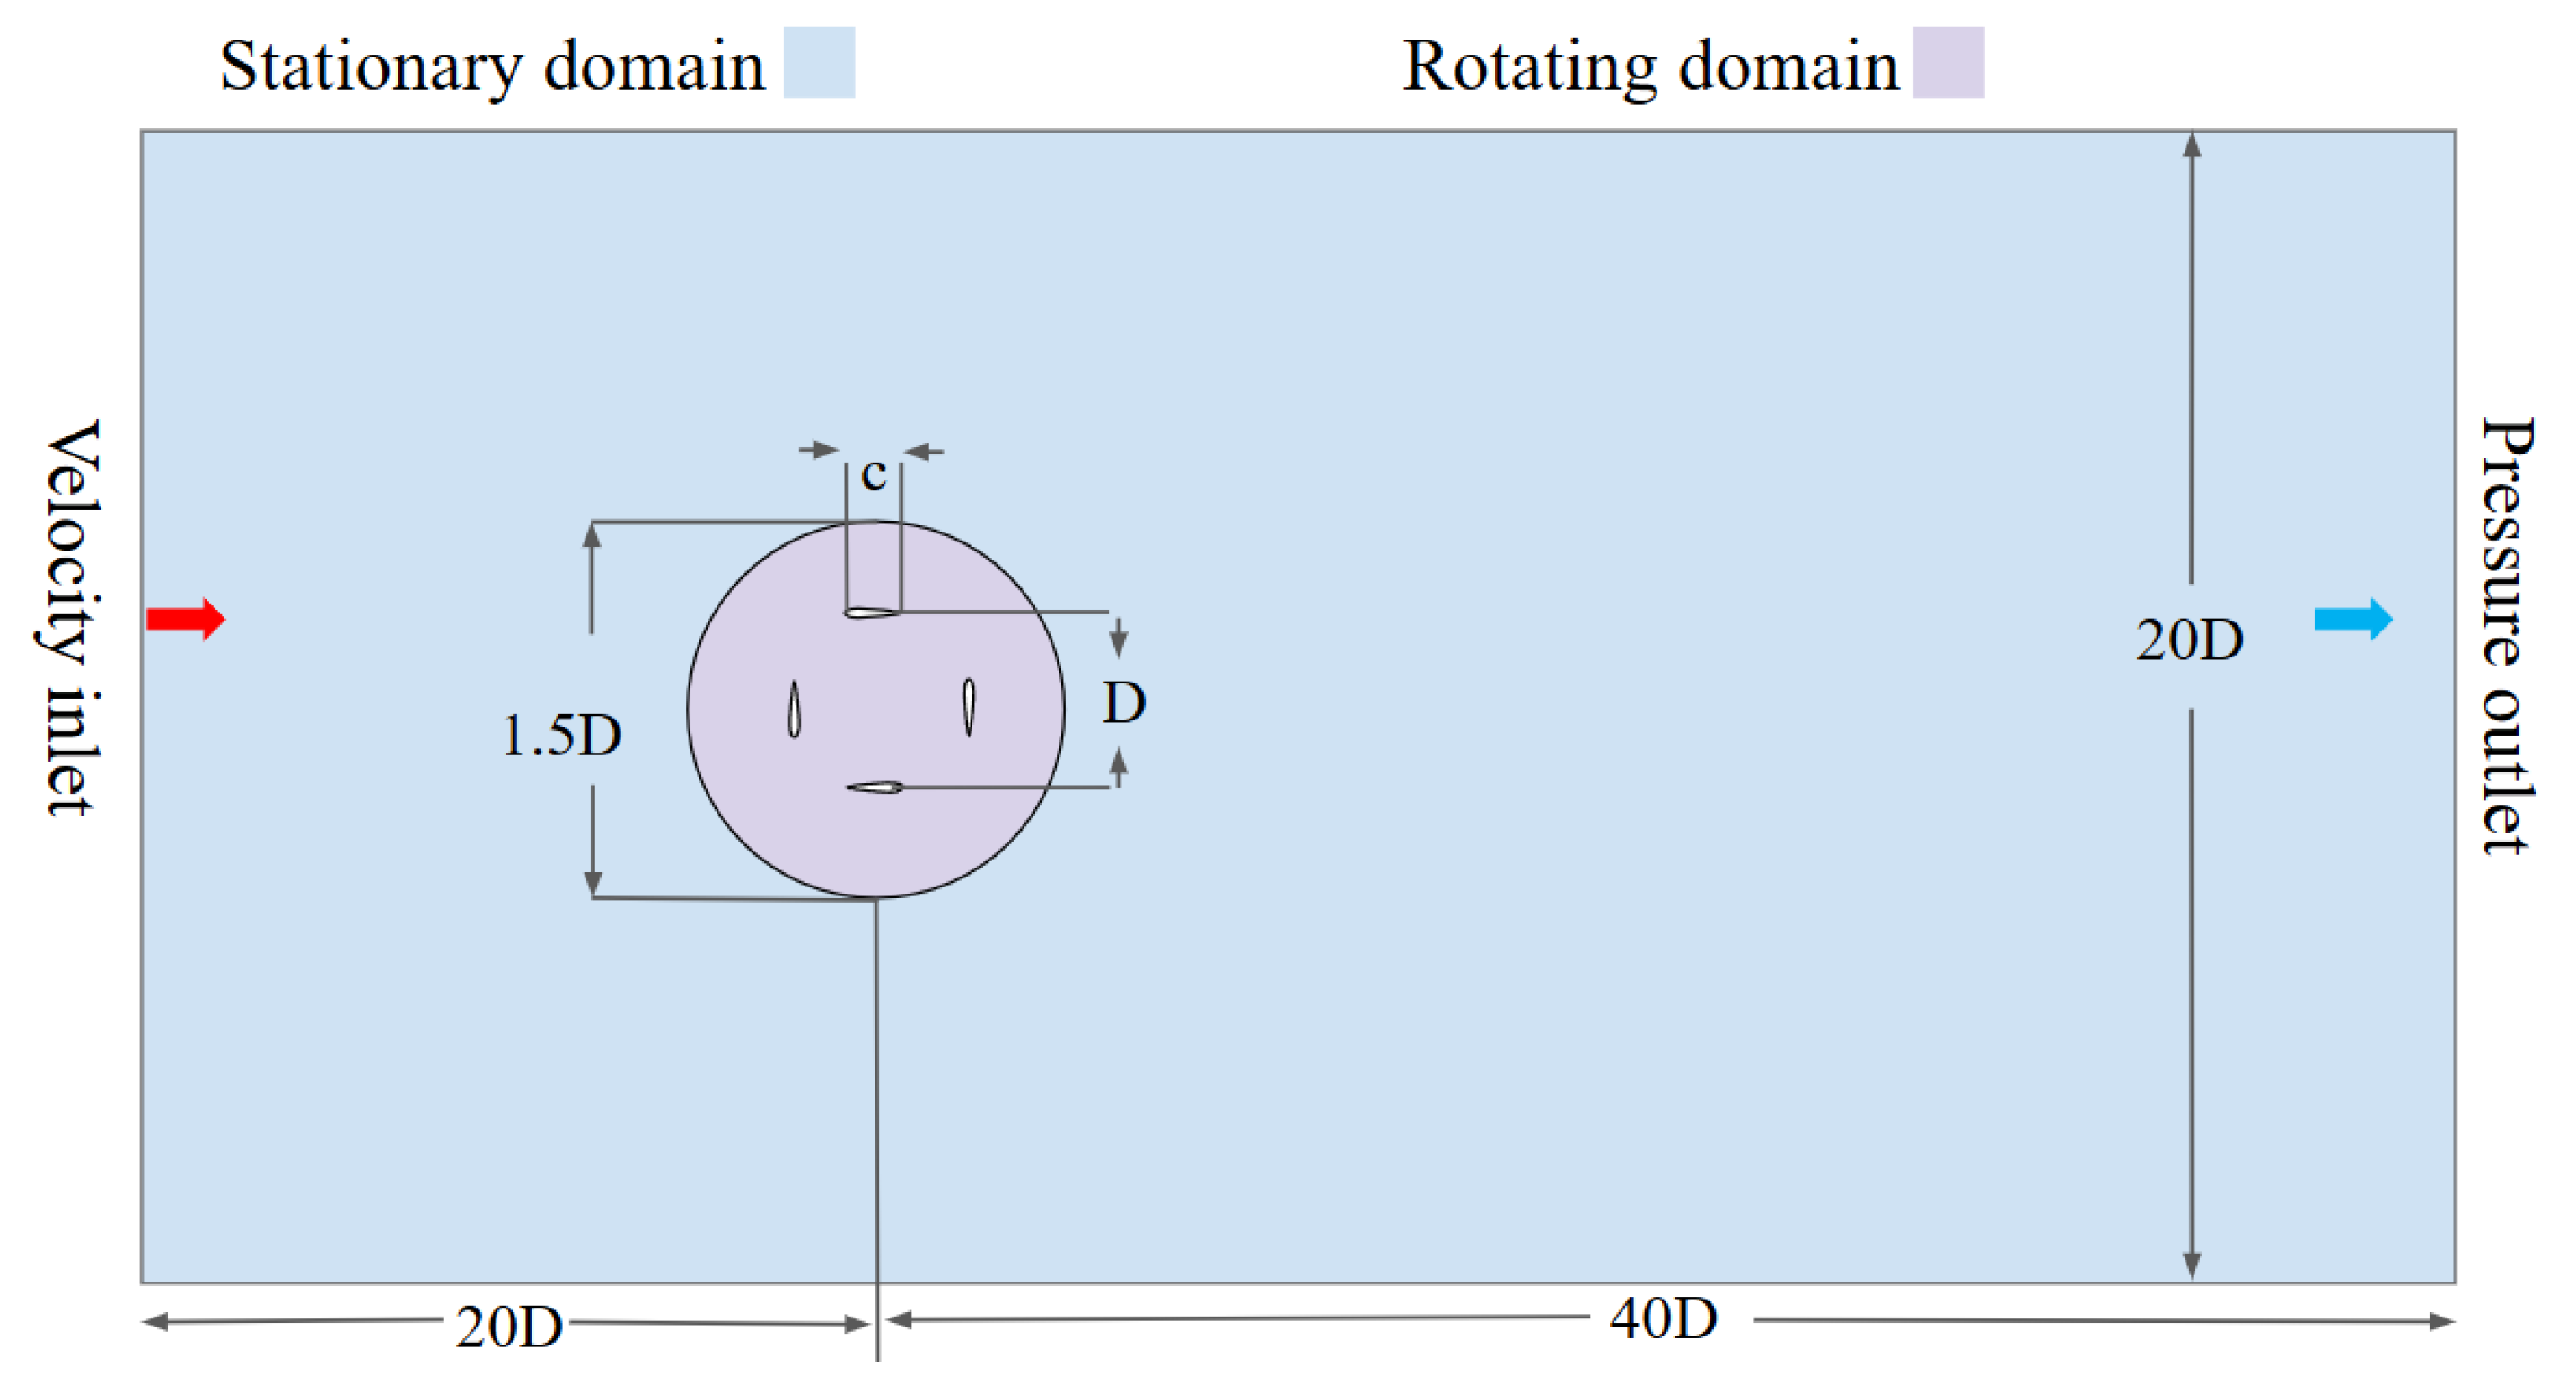
2.2. Initial and Boundary Conditions of the Model
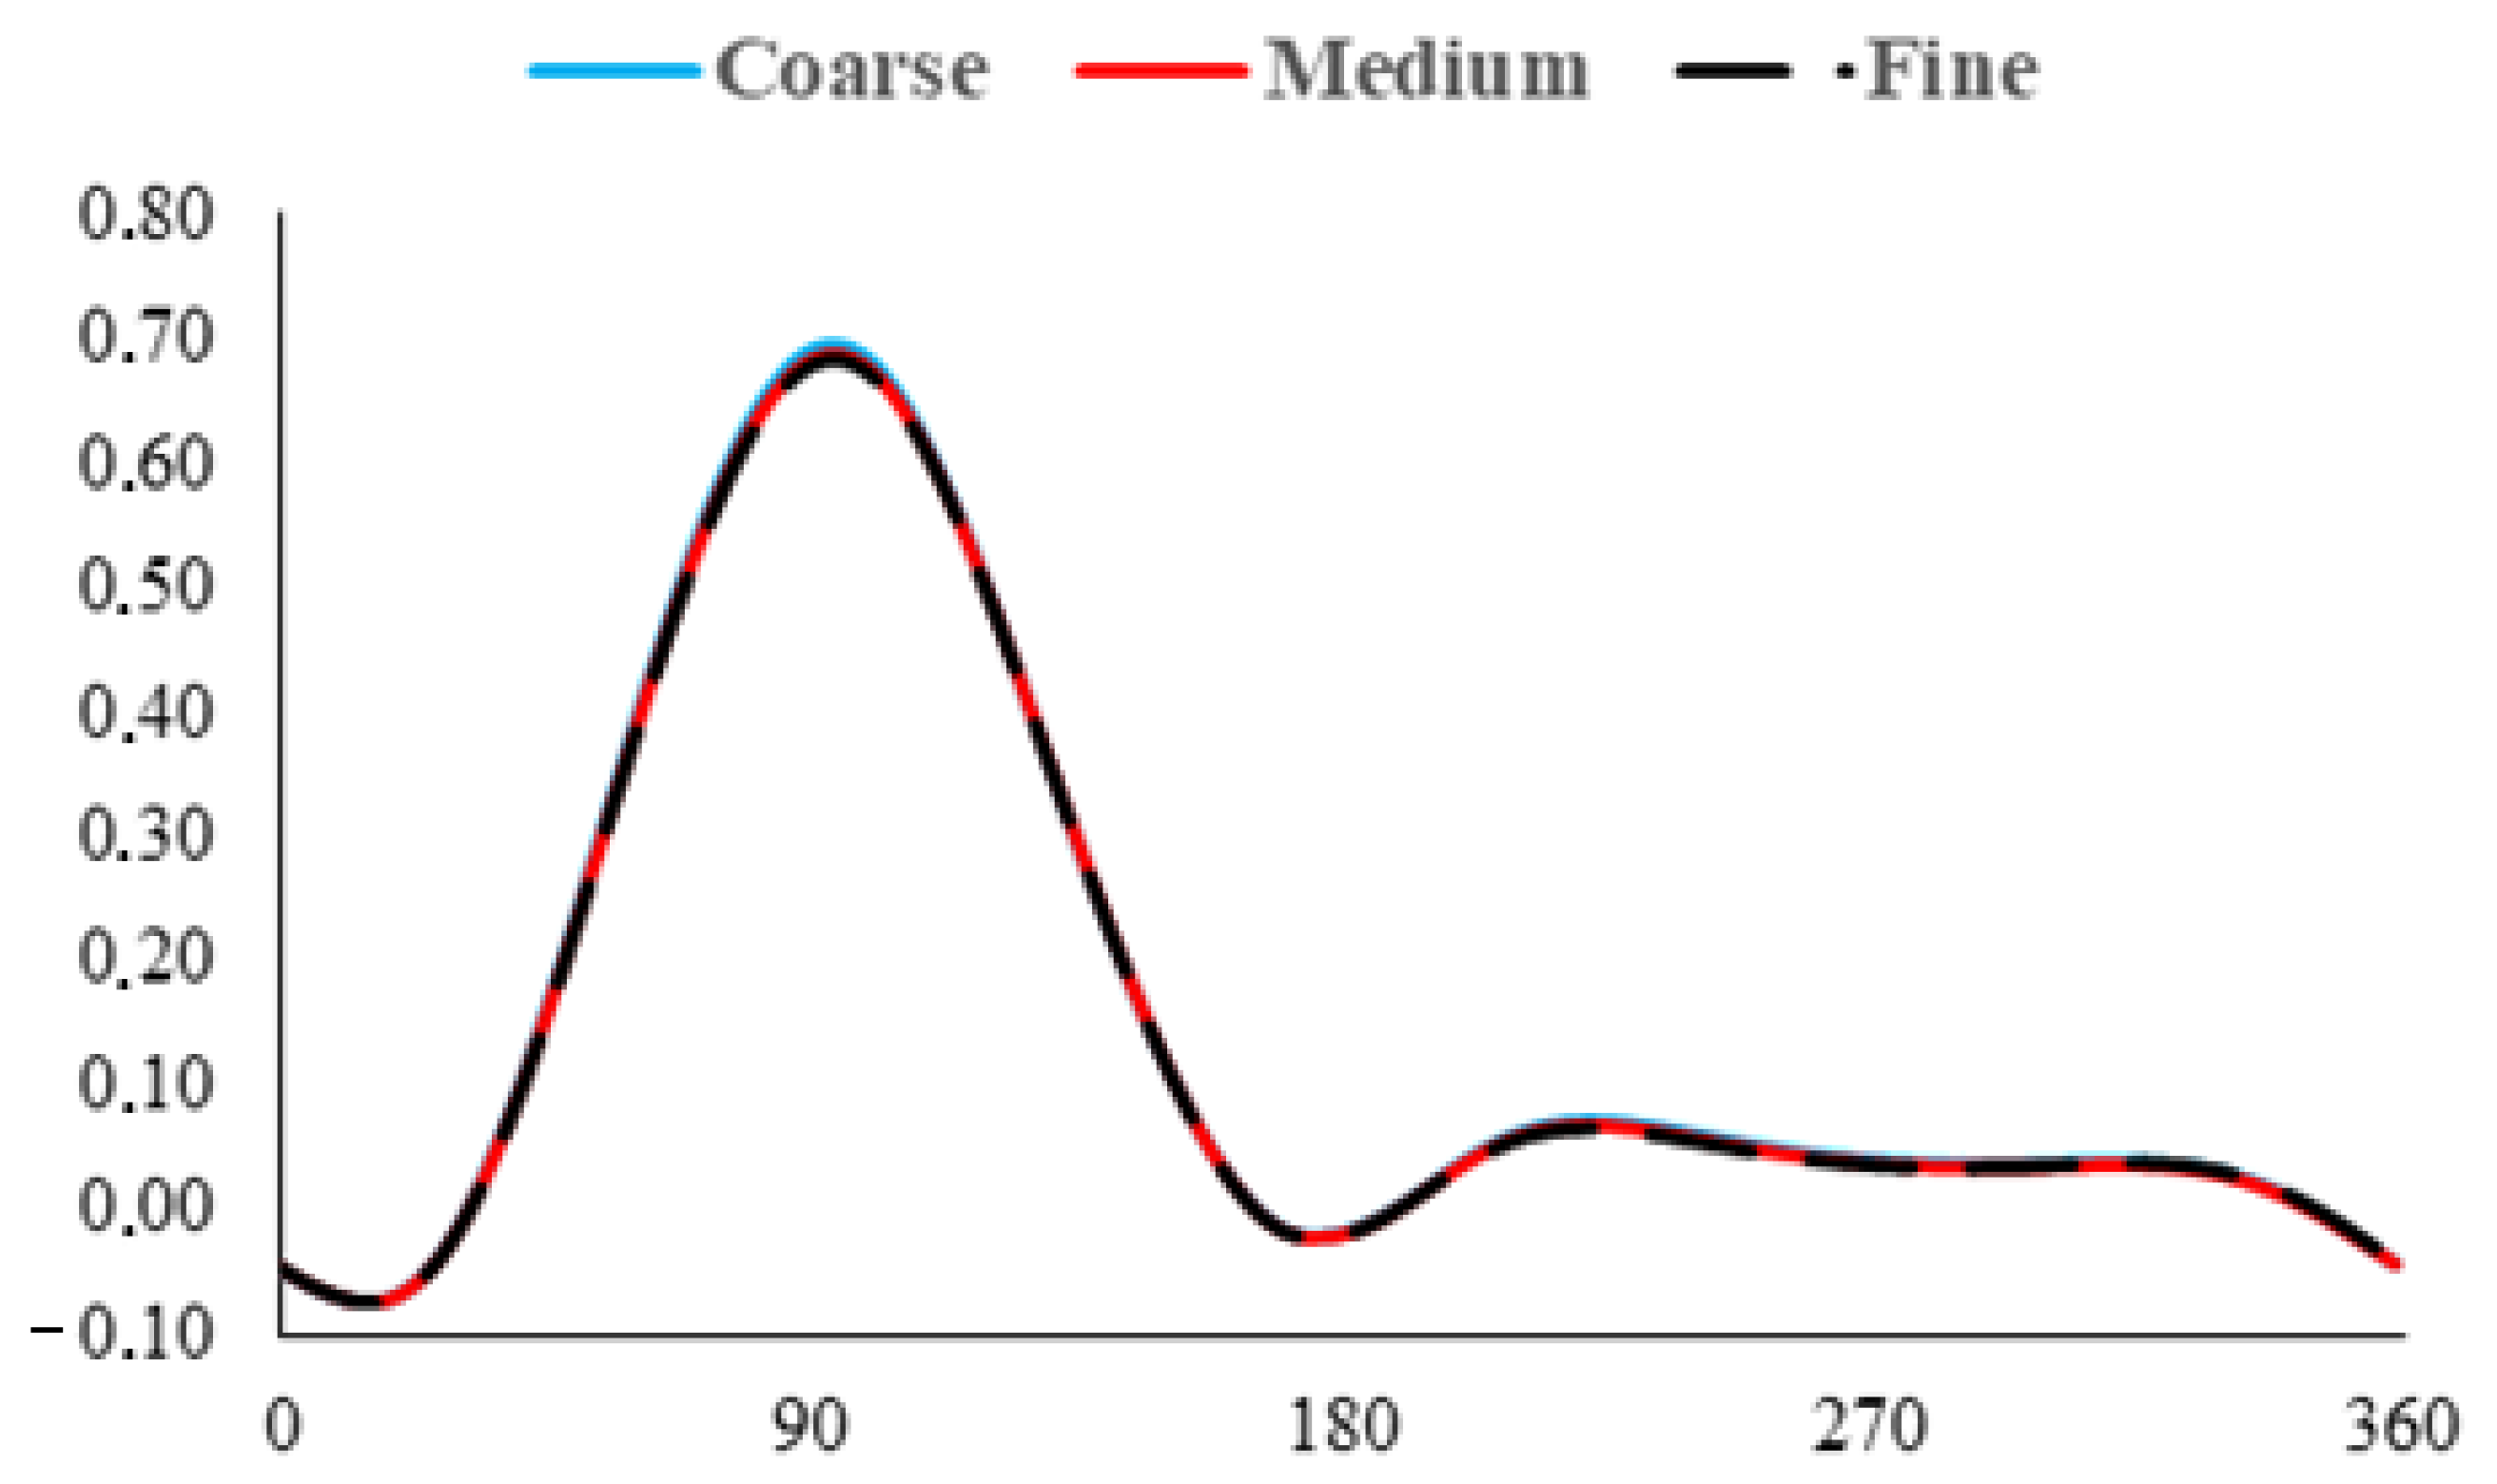
2.3. Grid Independence Study
2.4. Taguchi Method
3. Results and Discussions
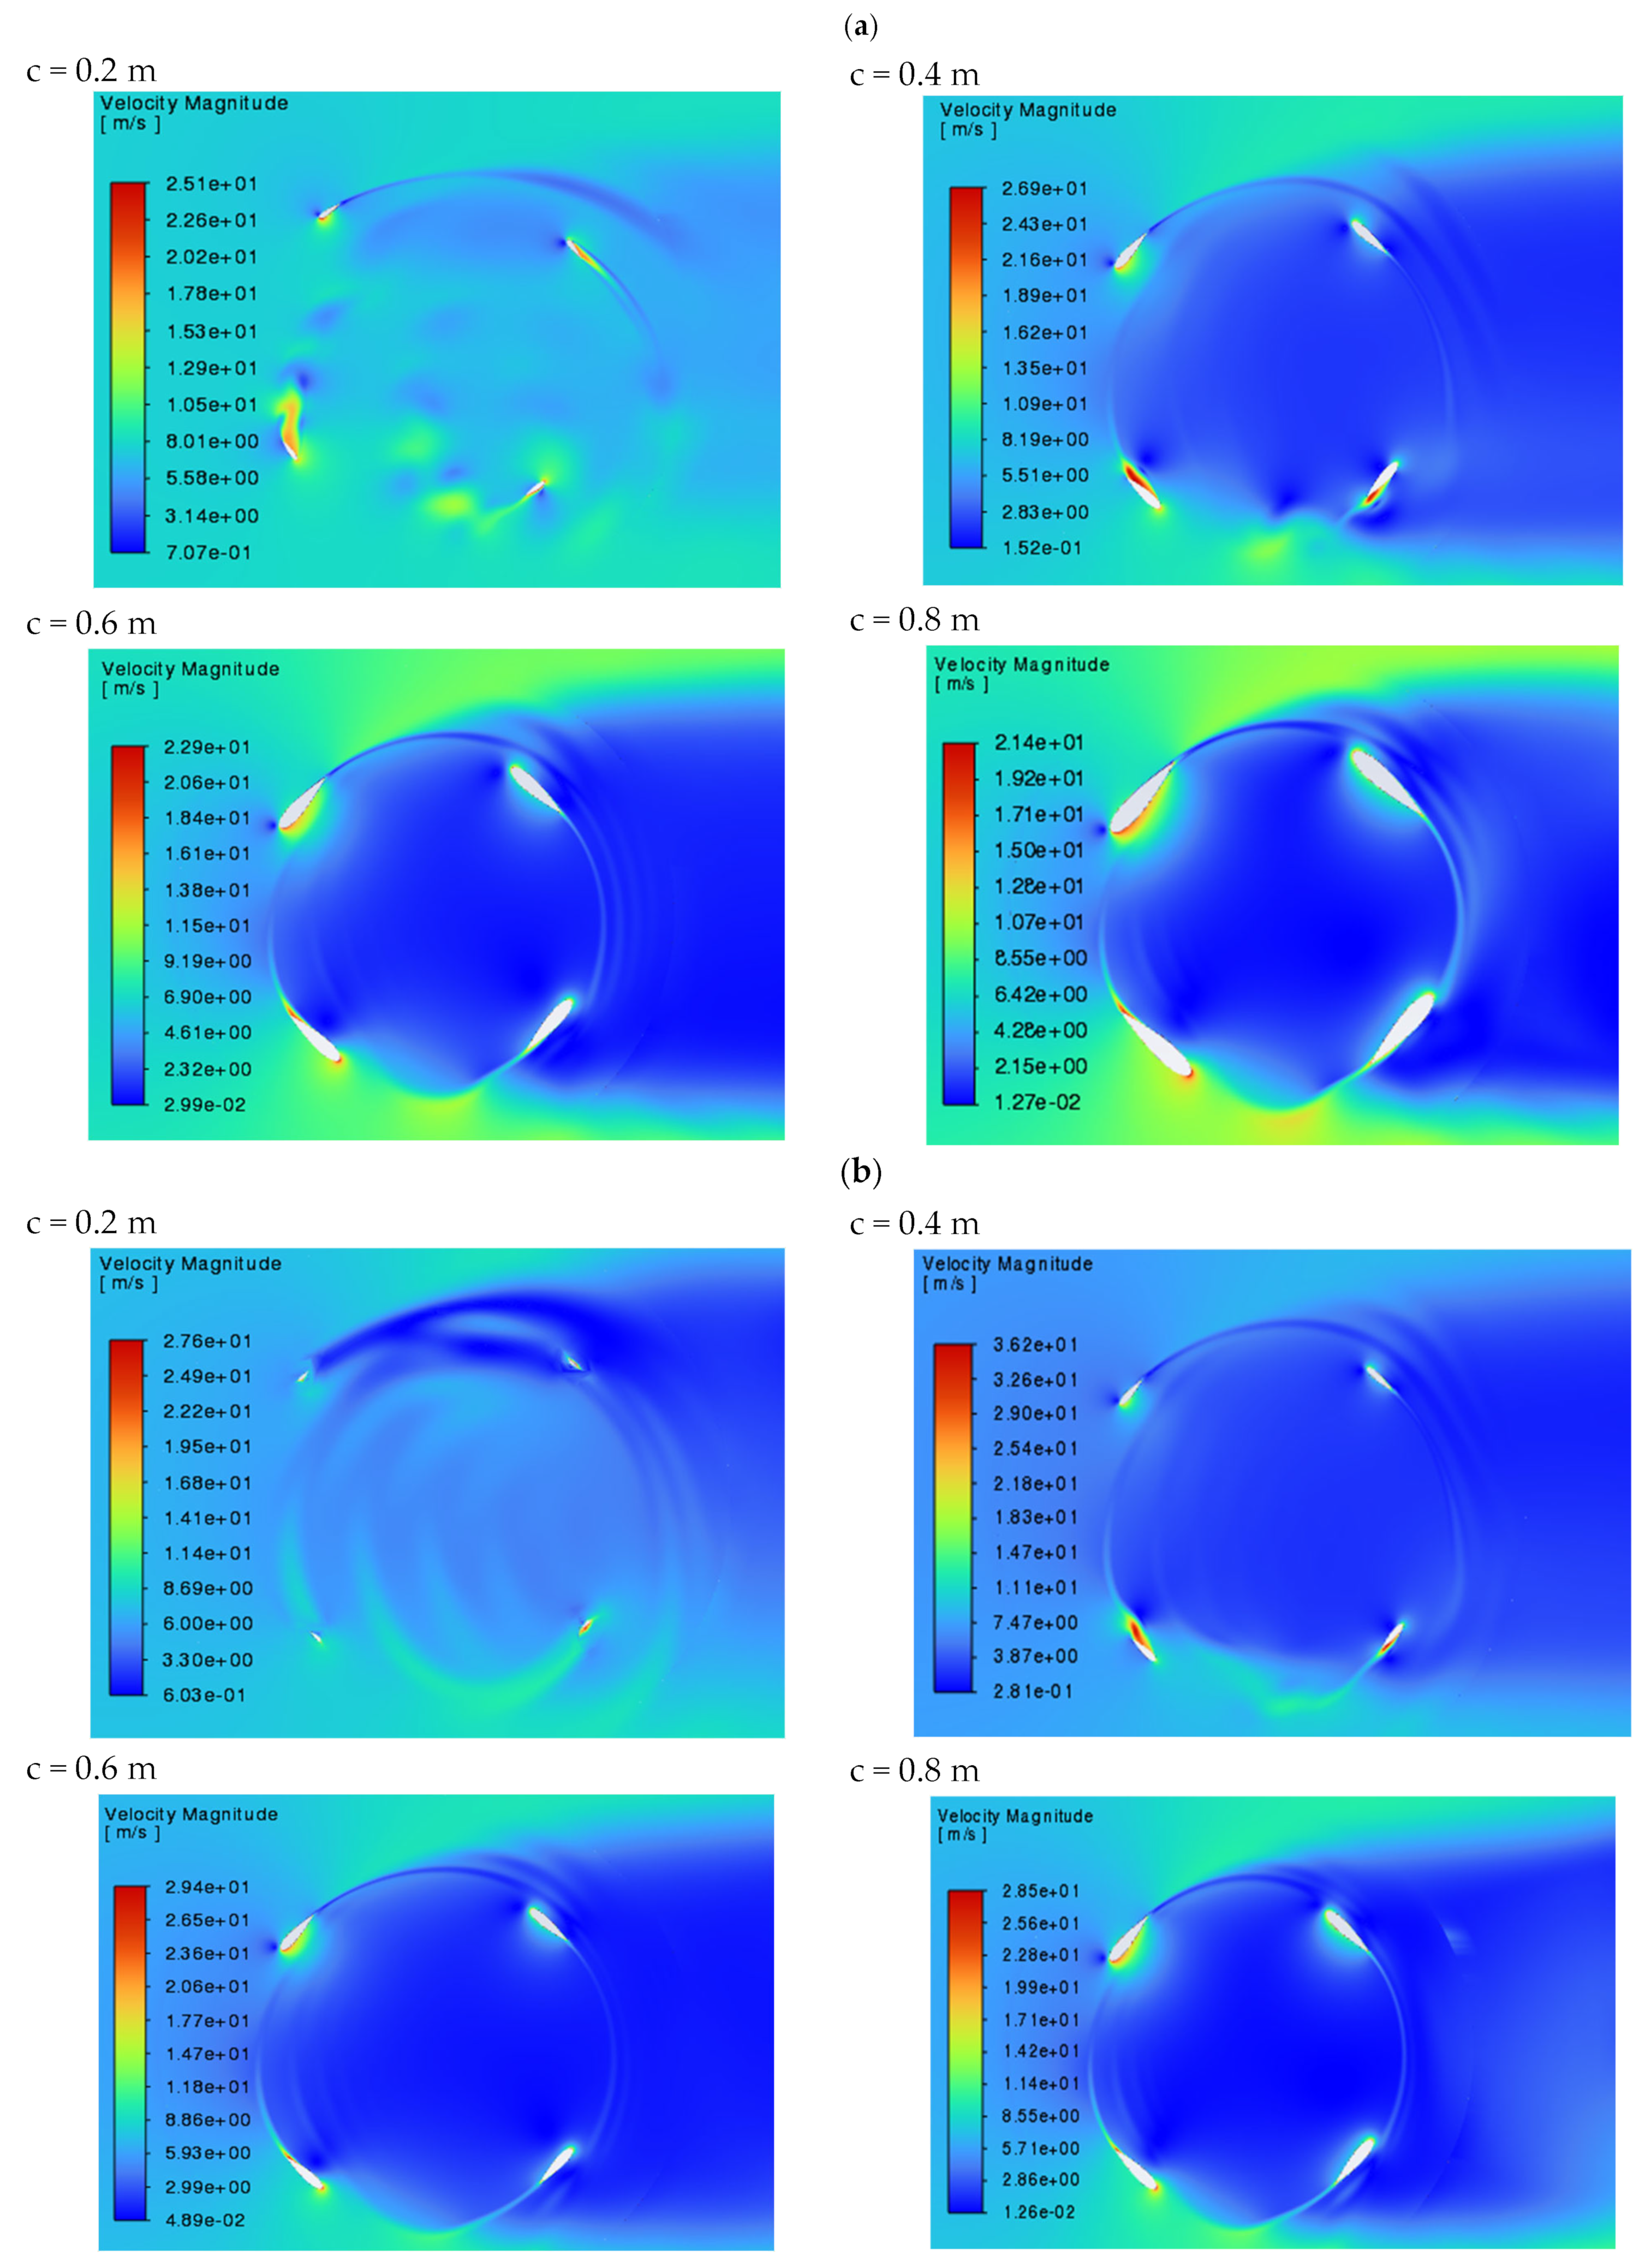
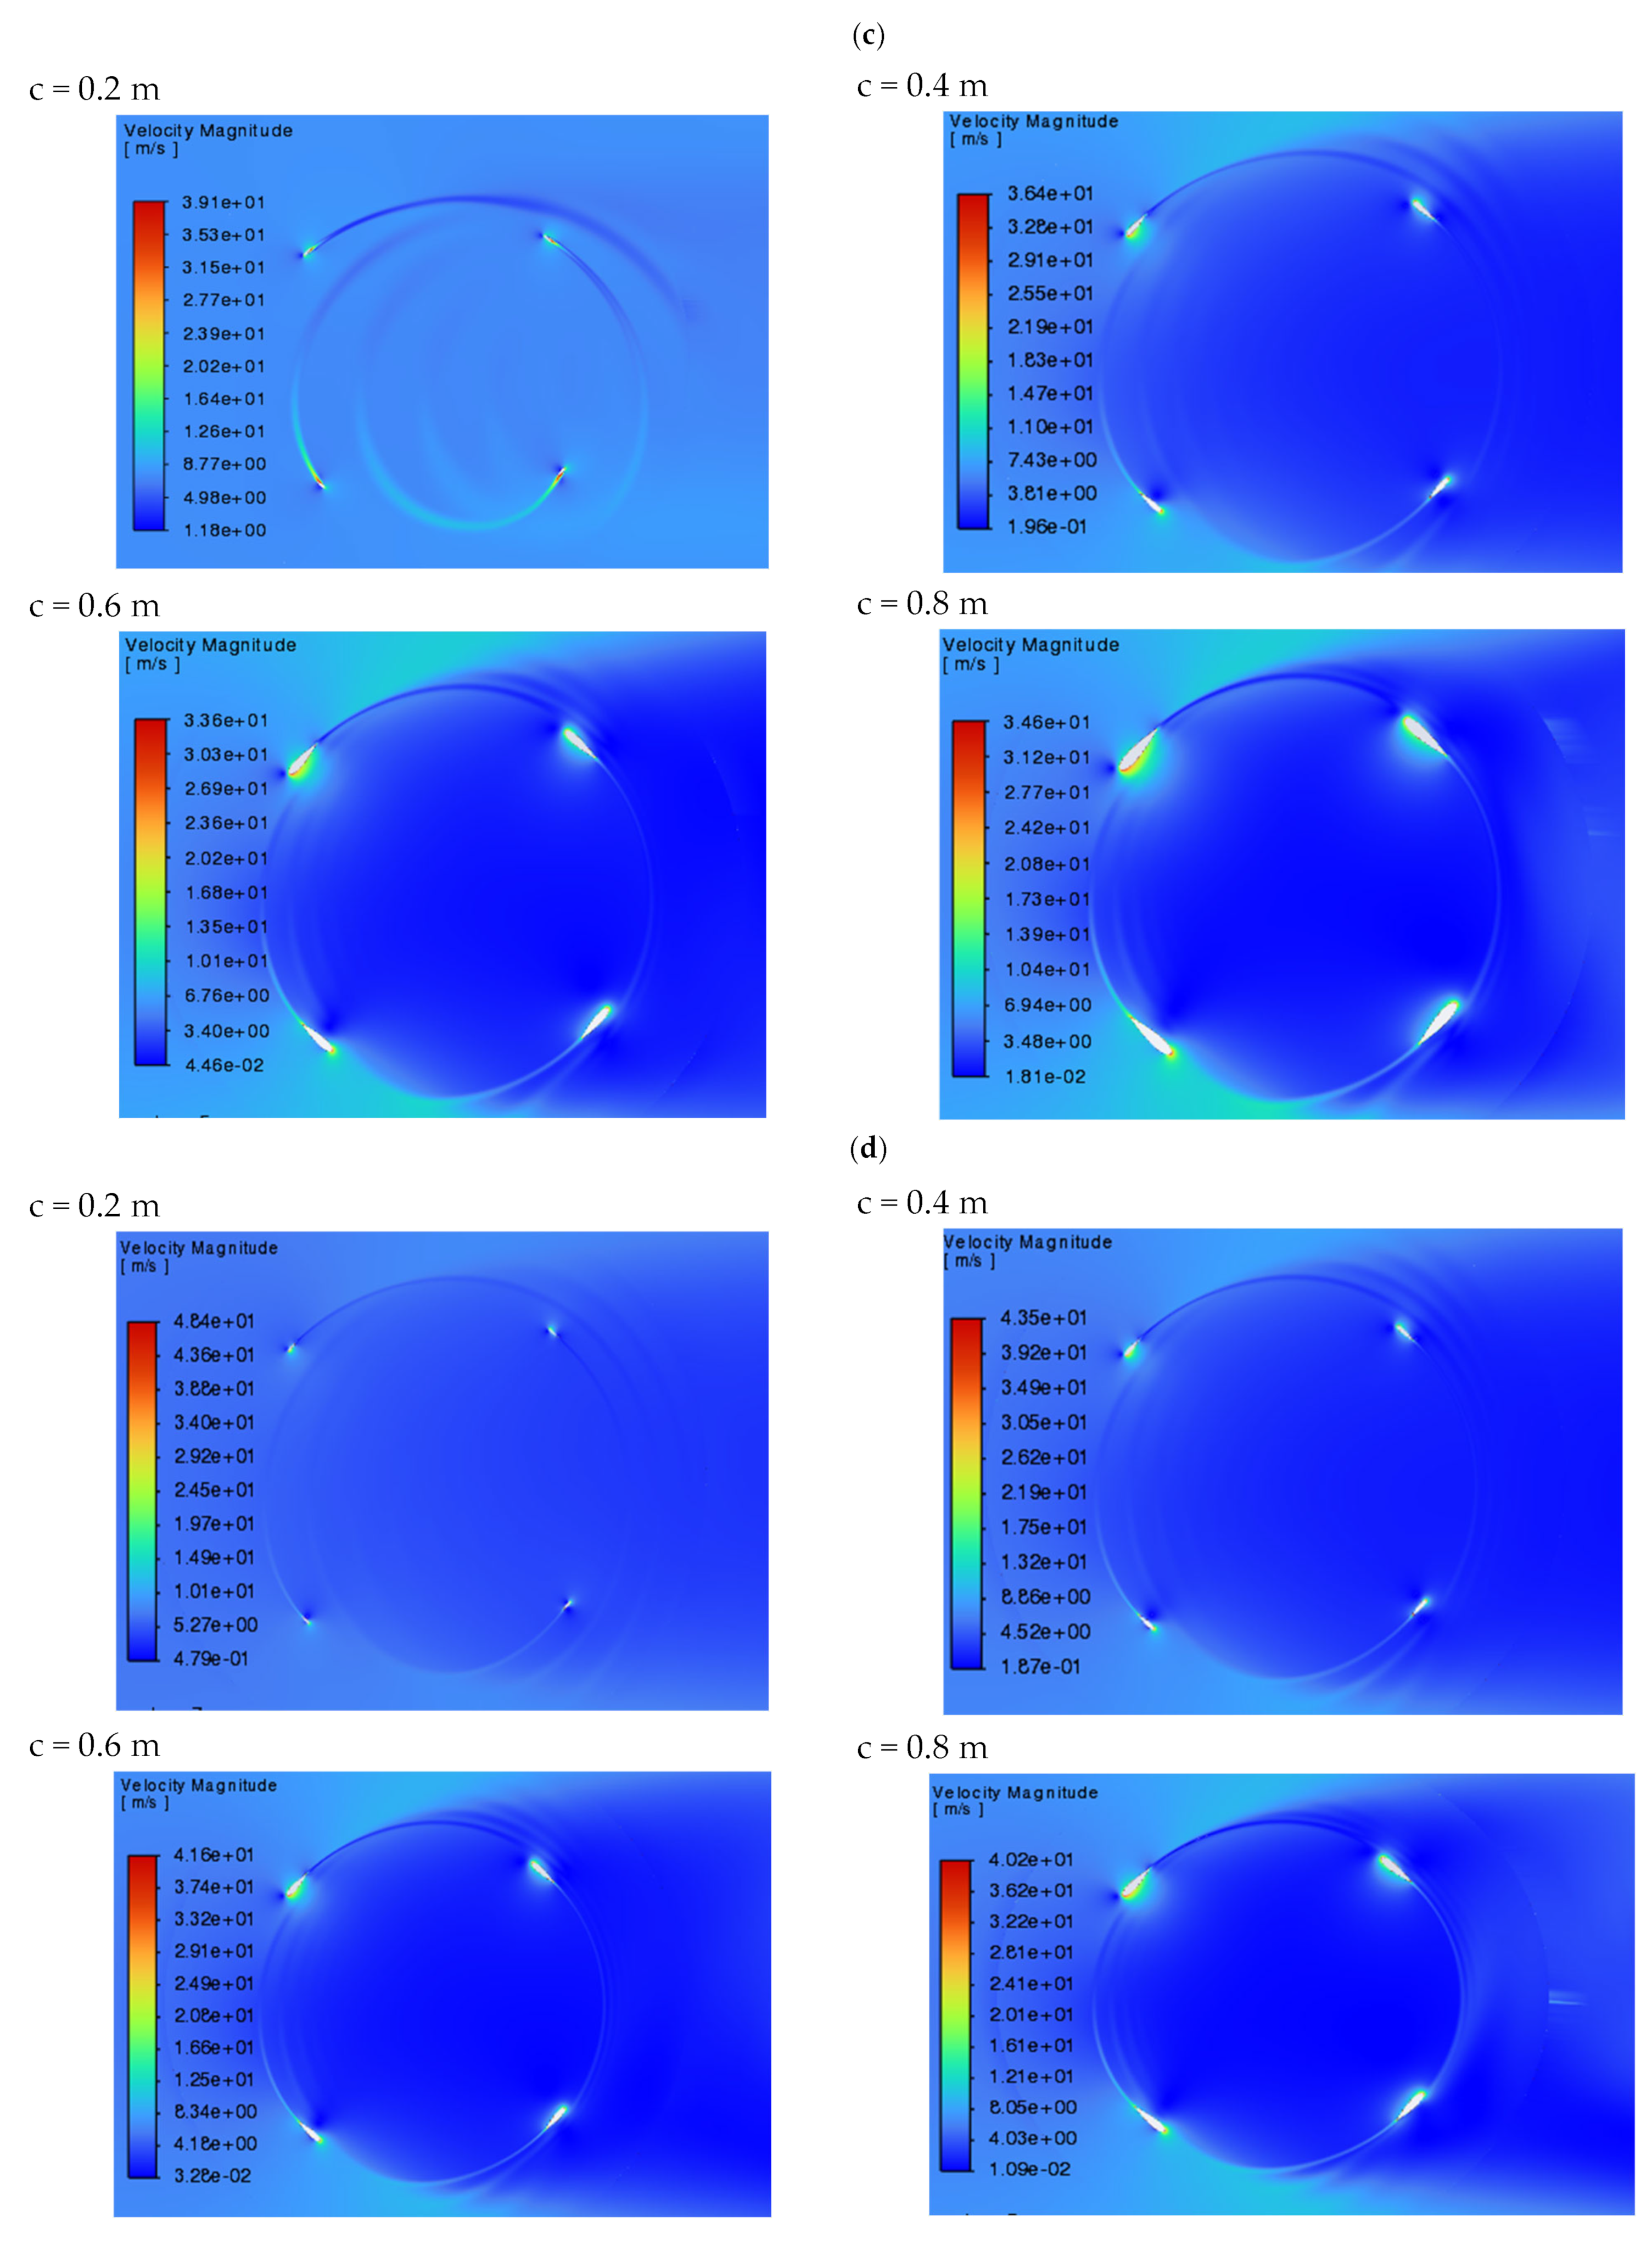
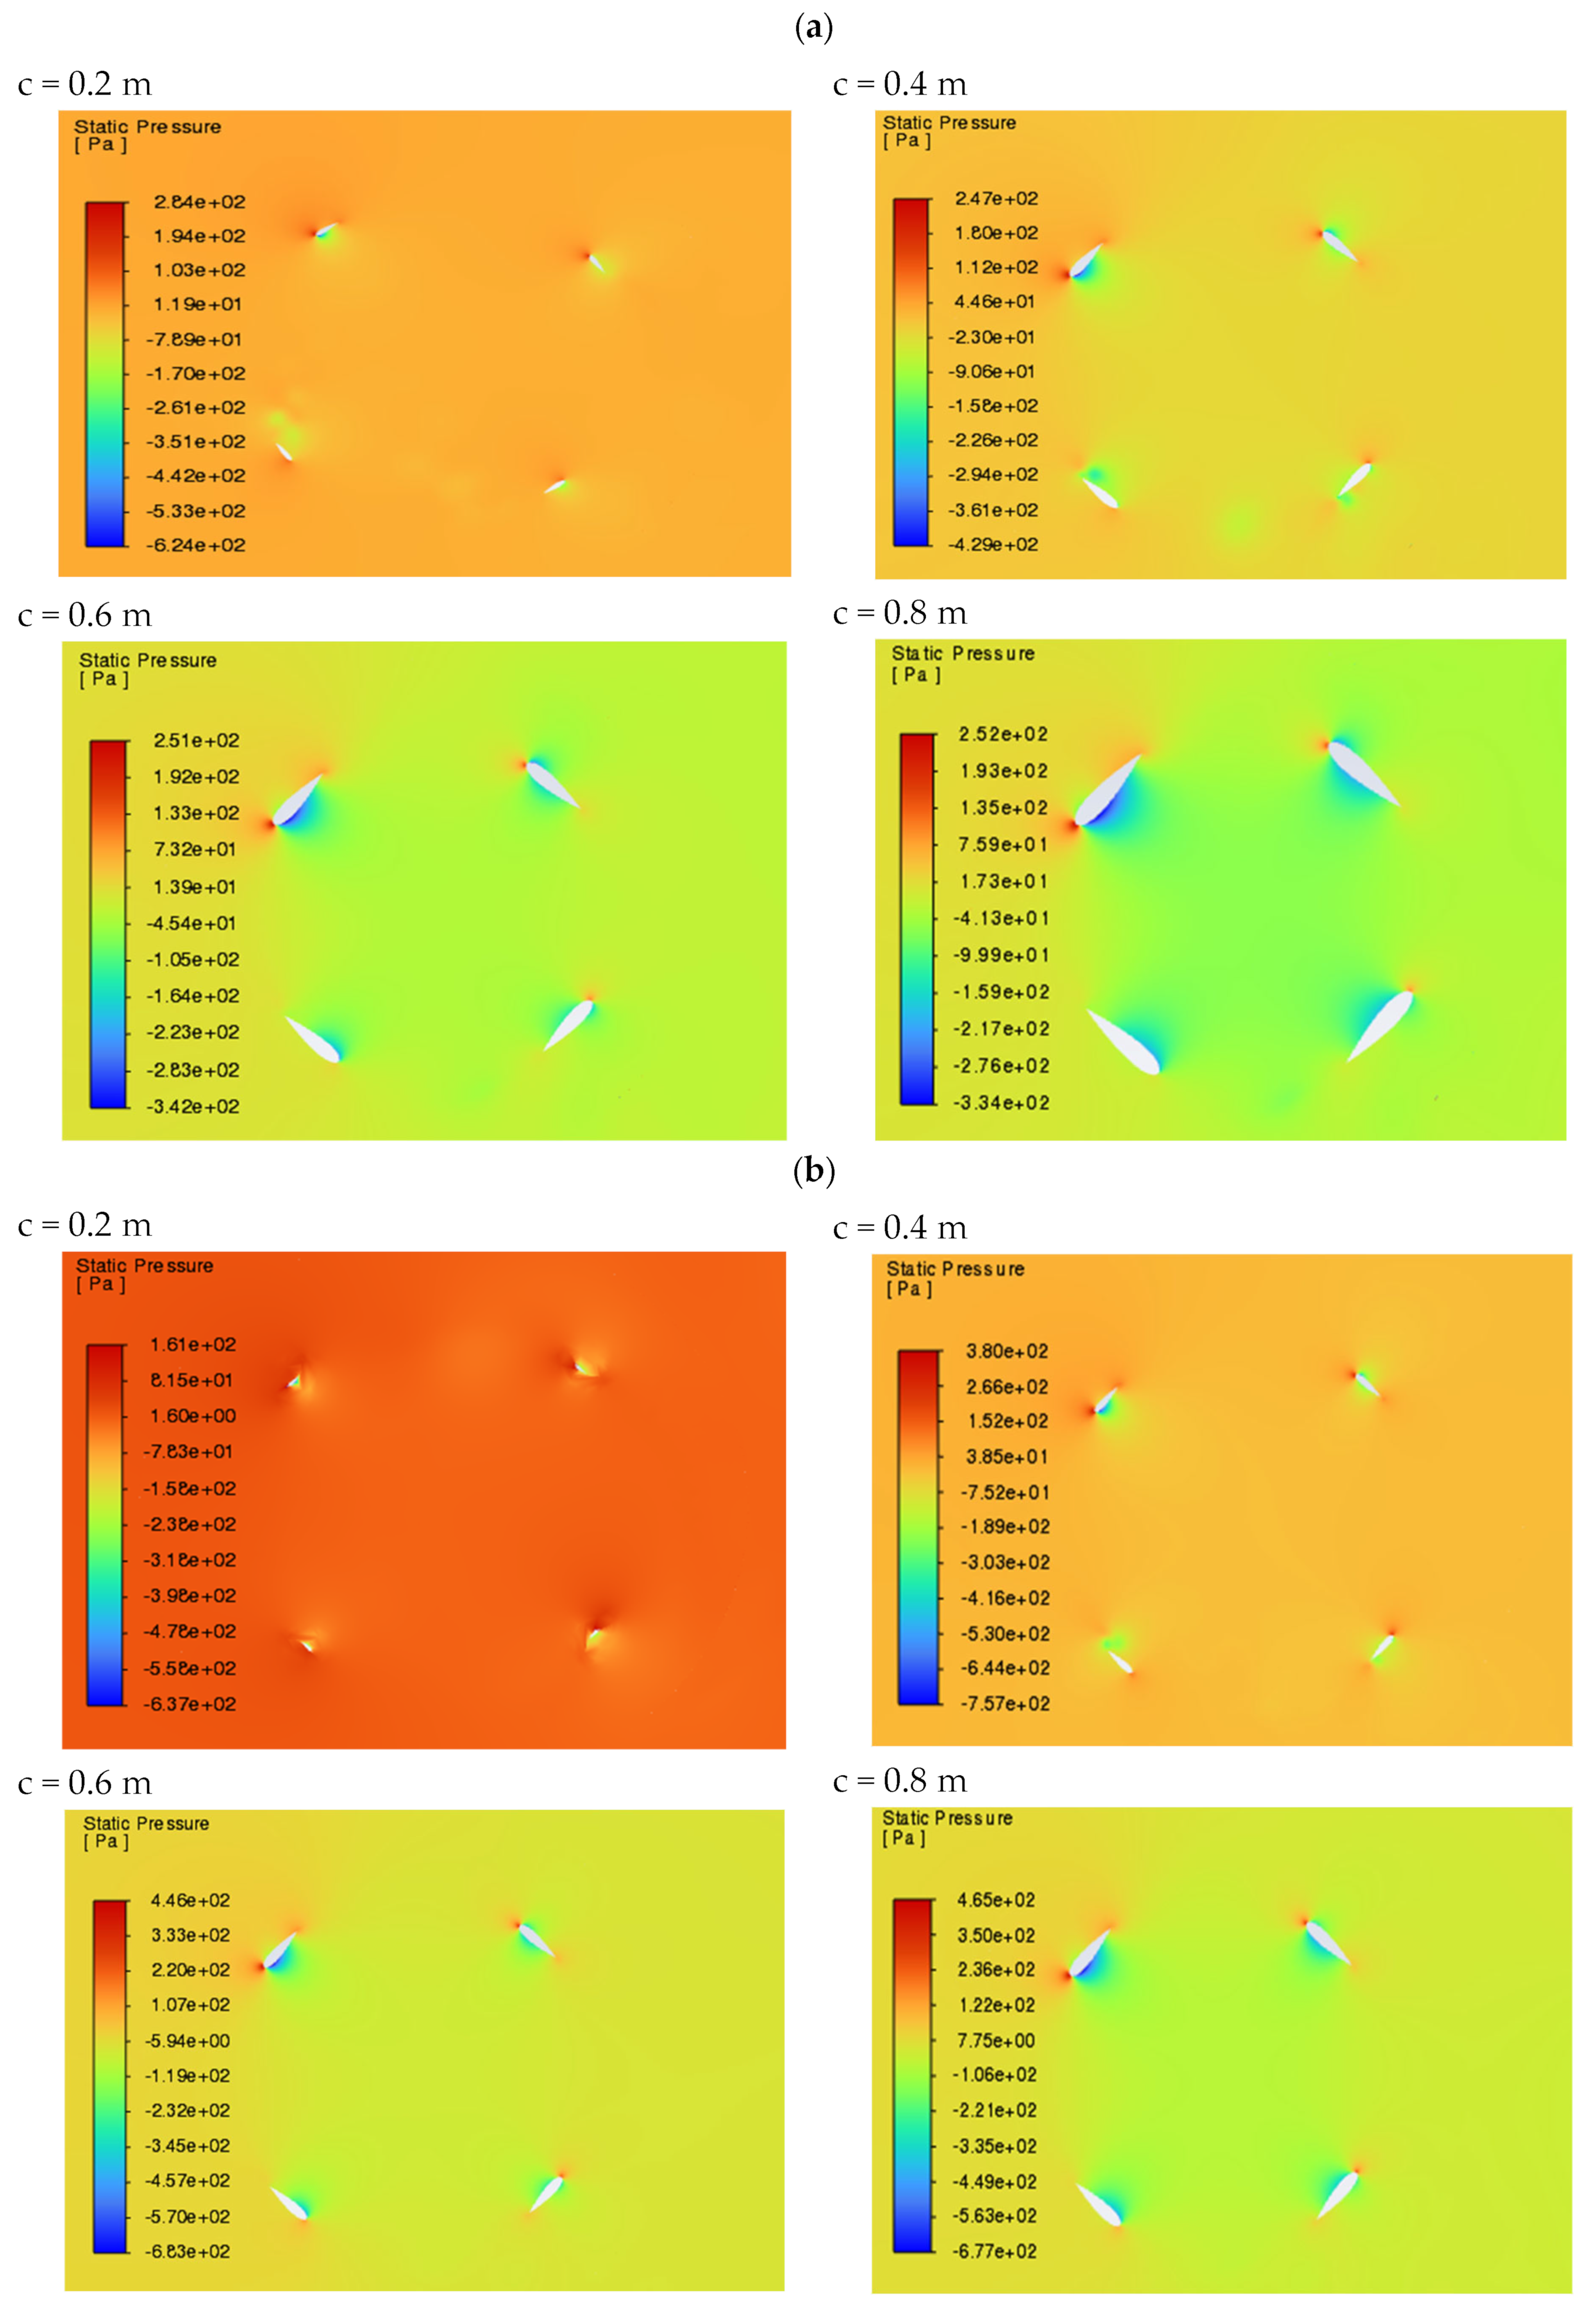
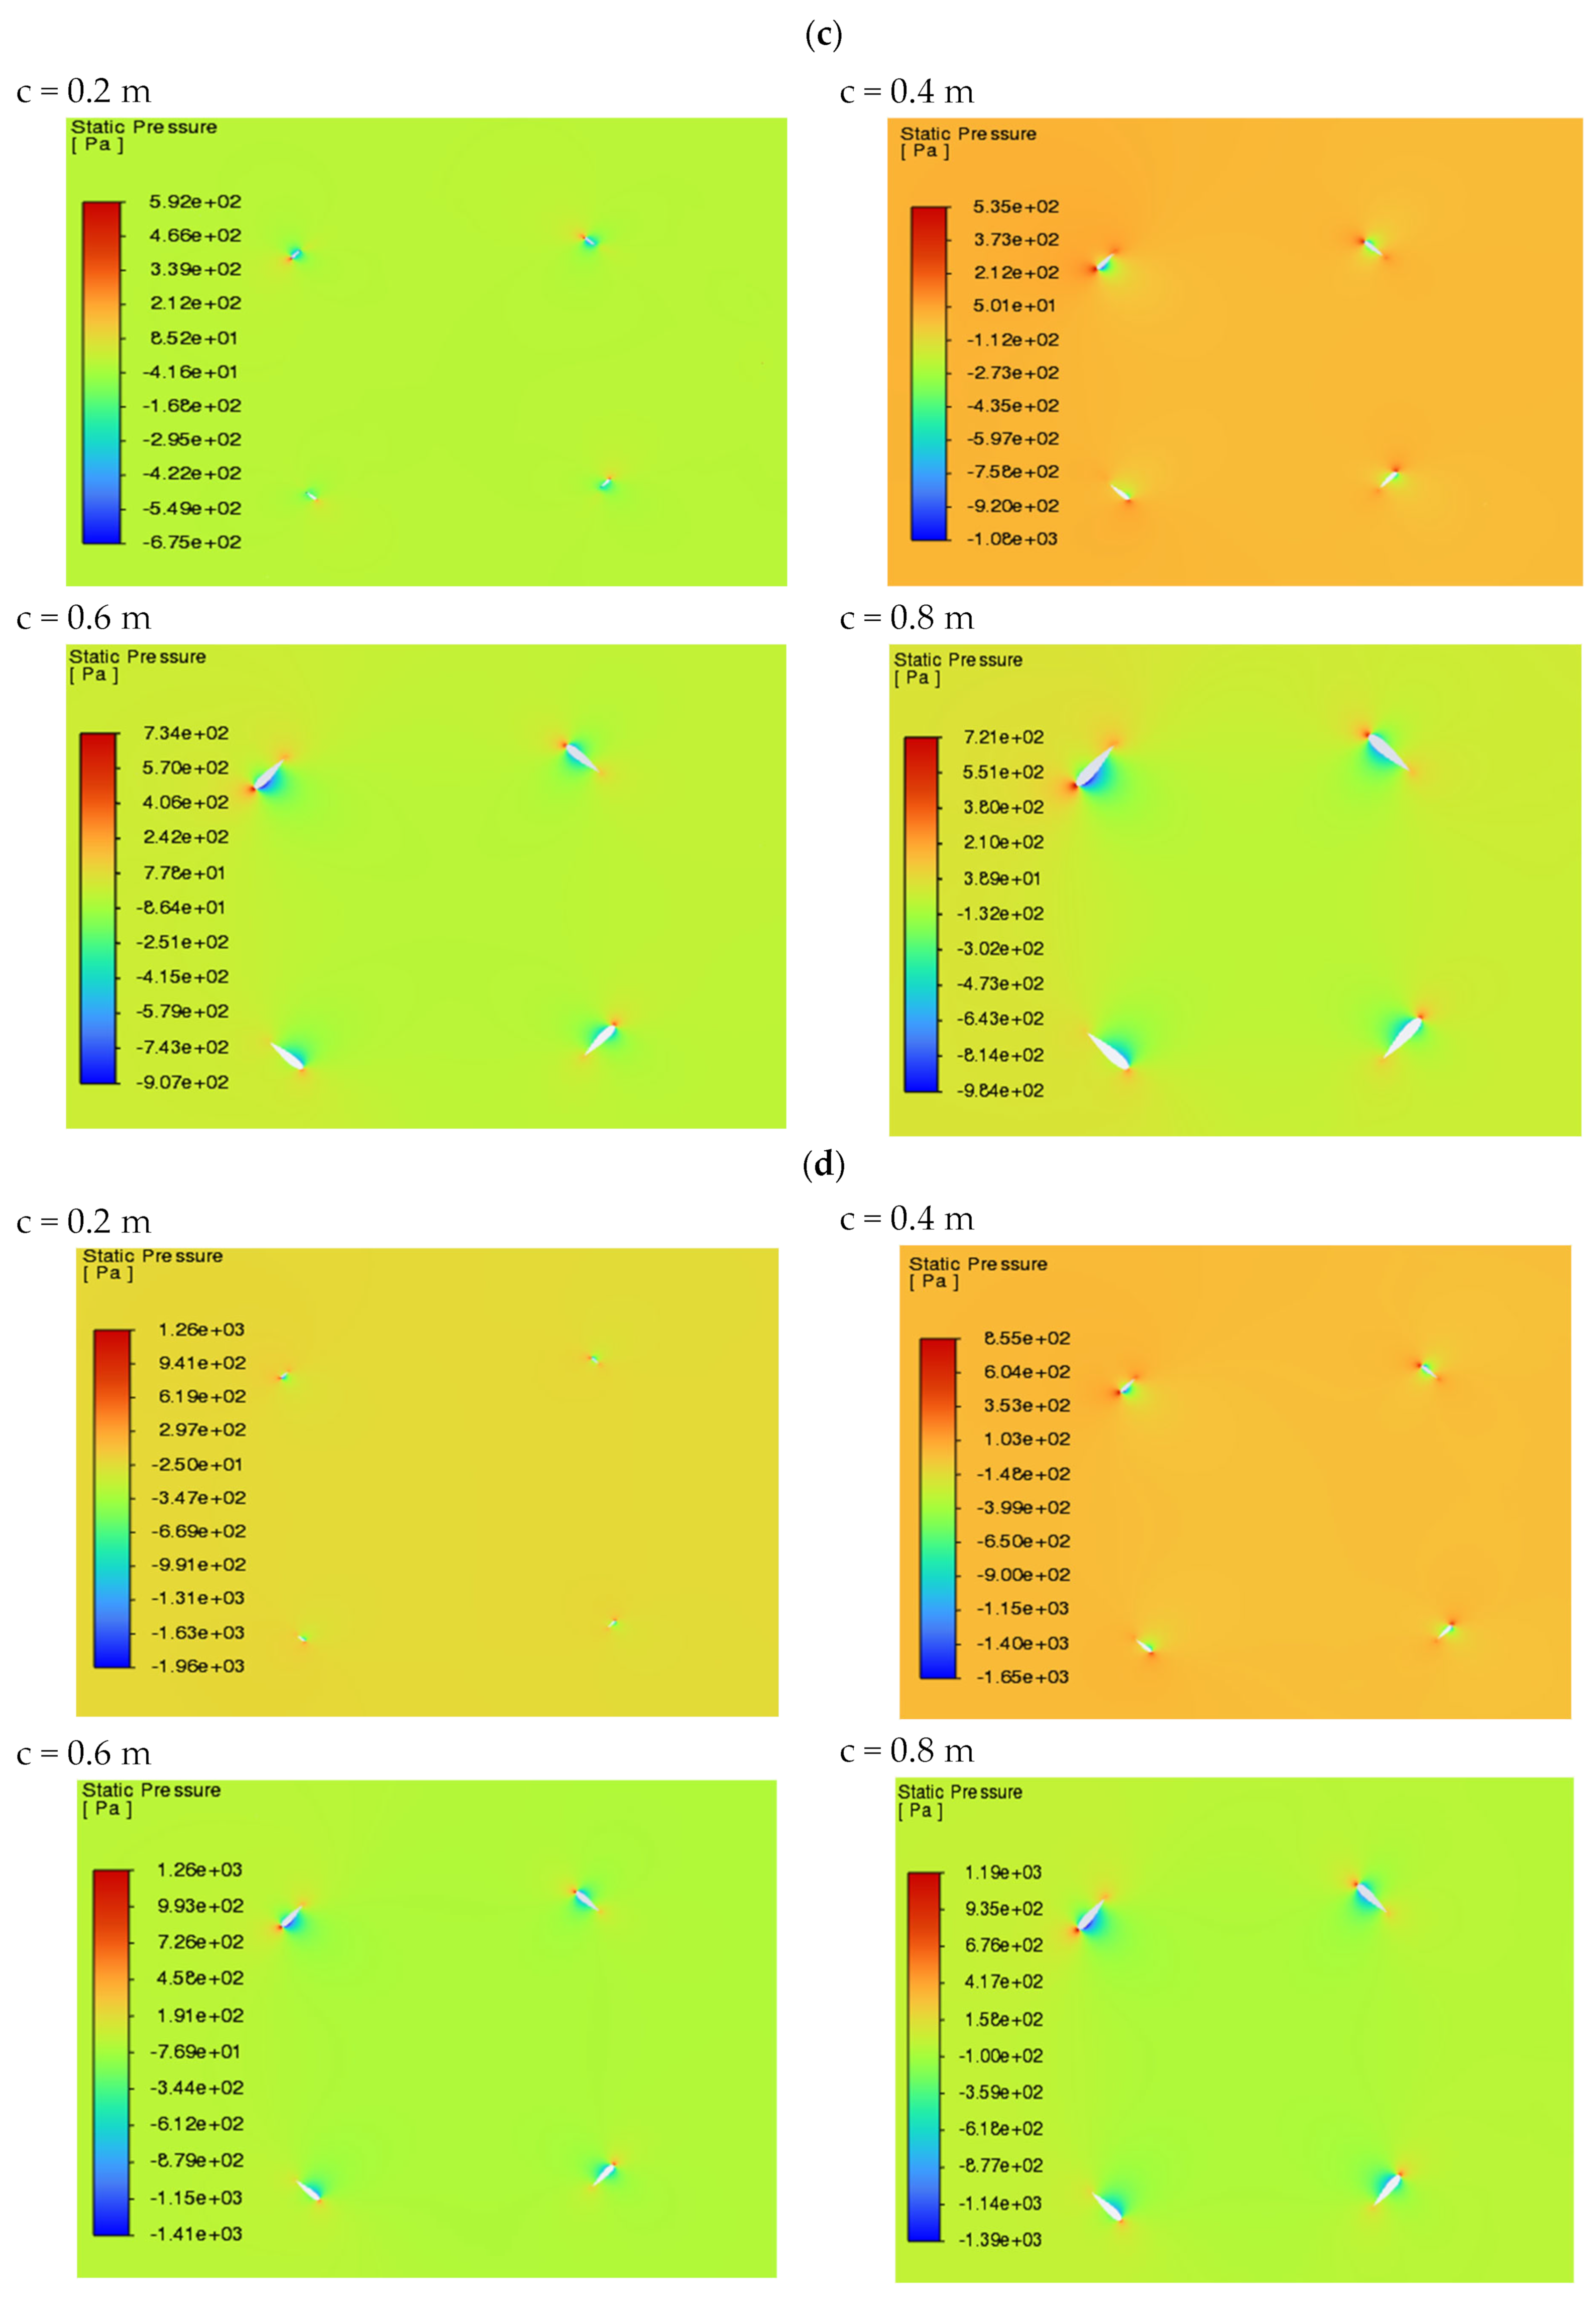
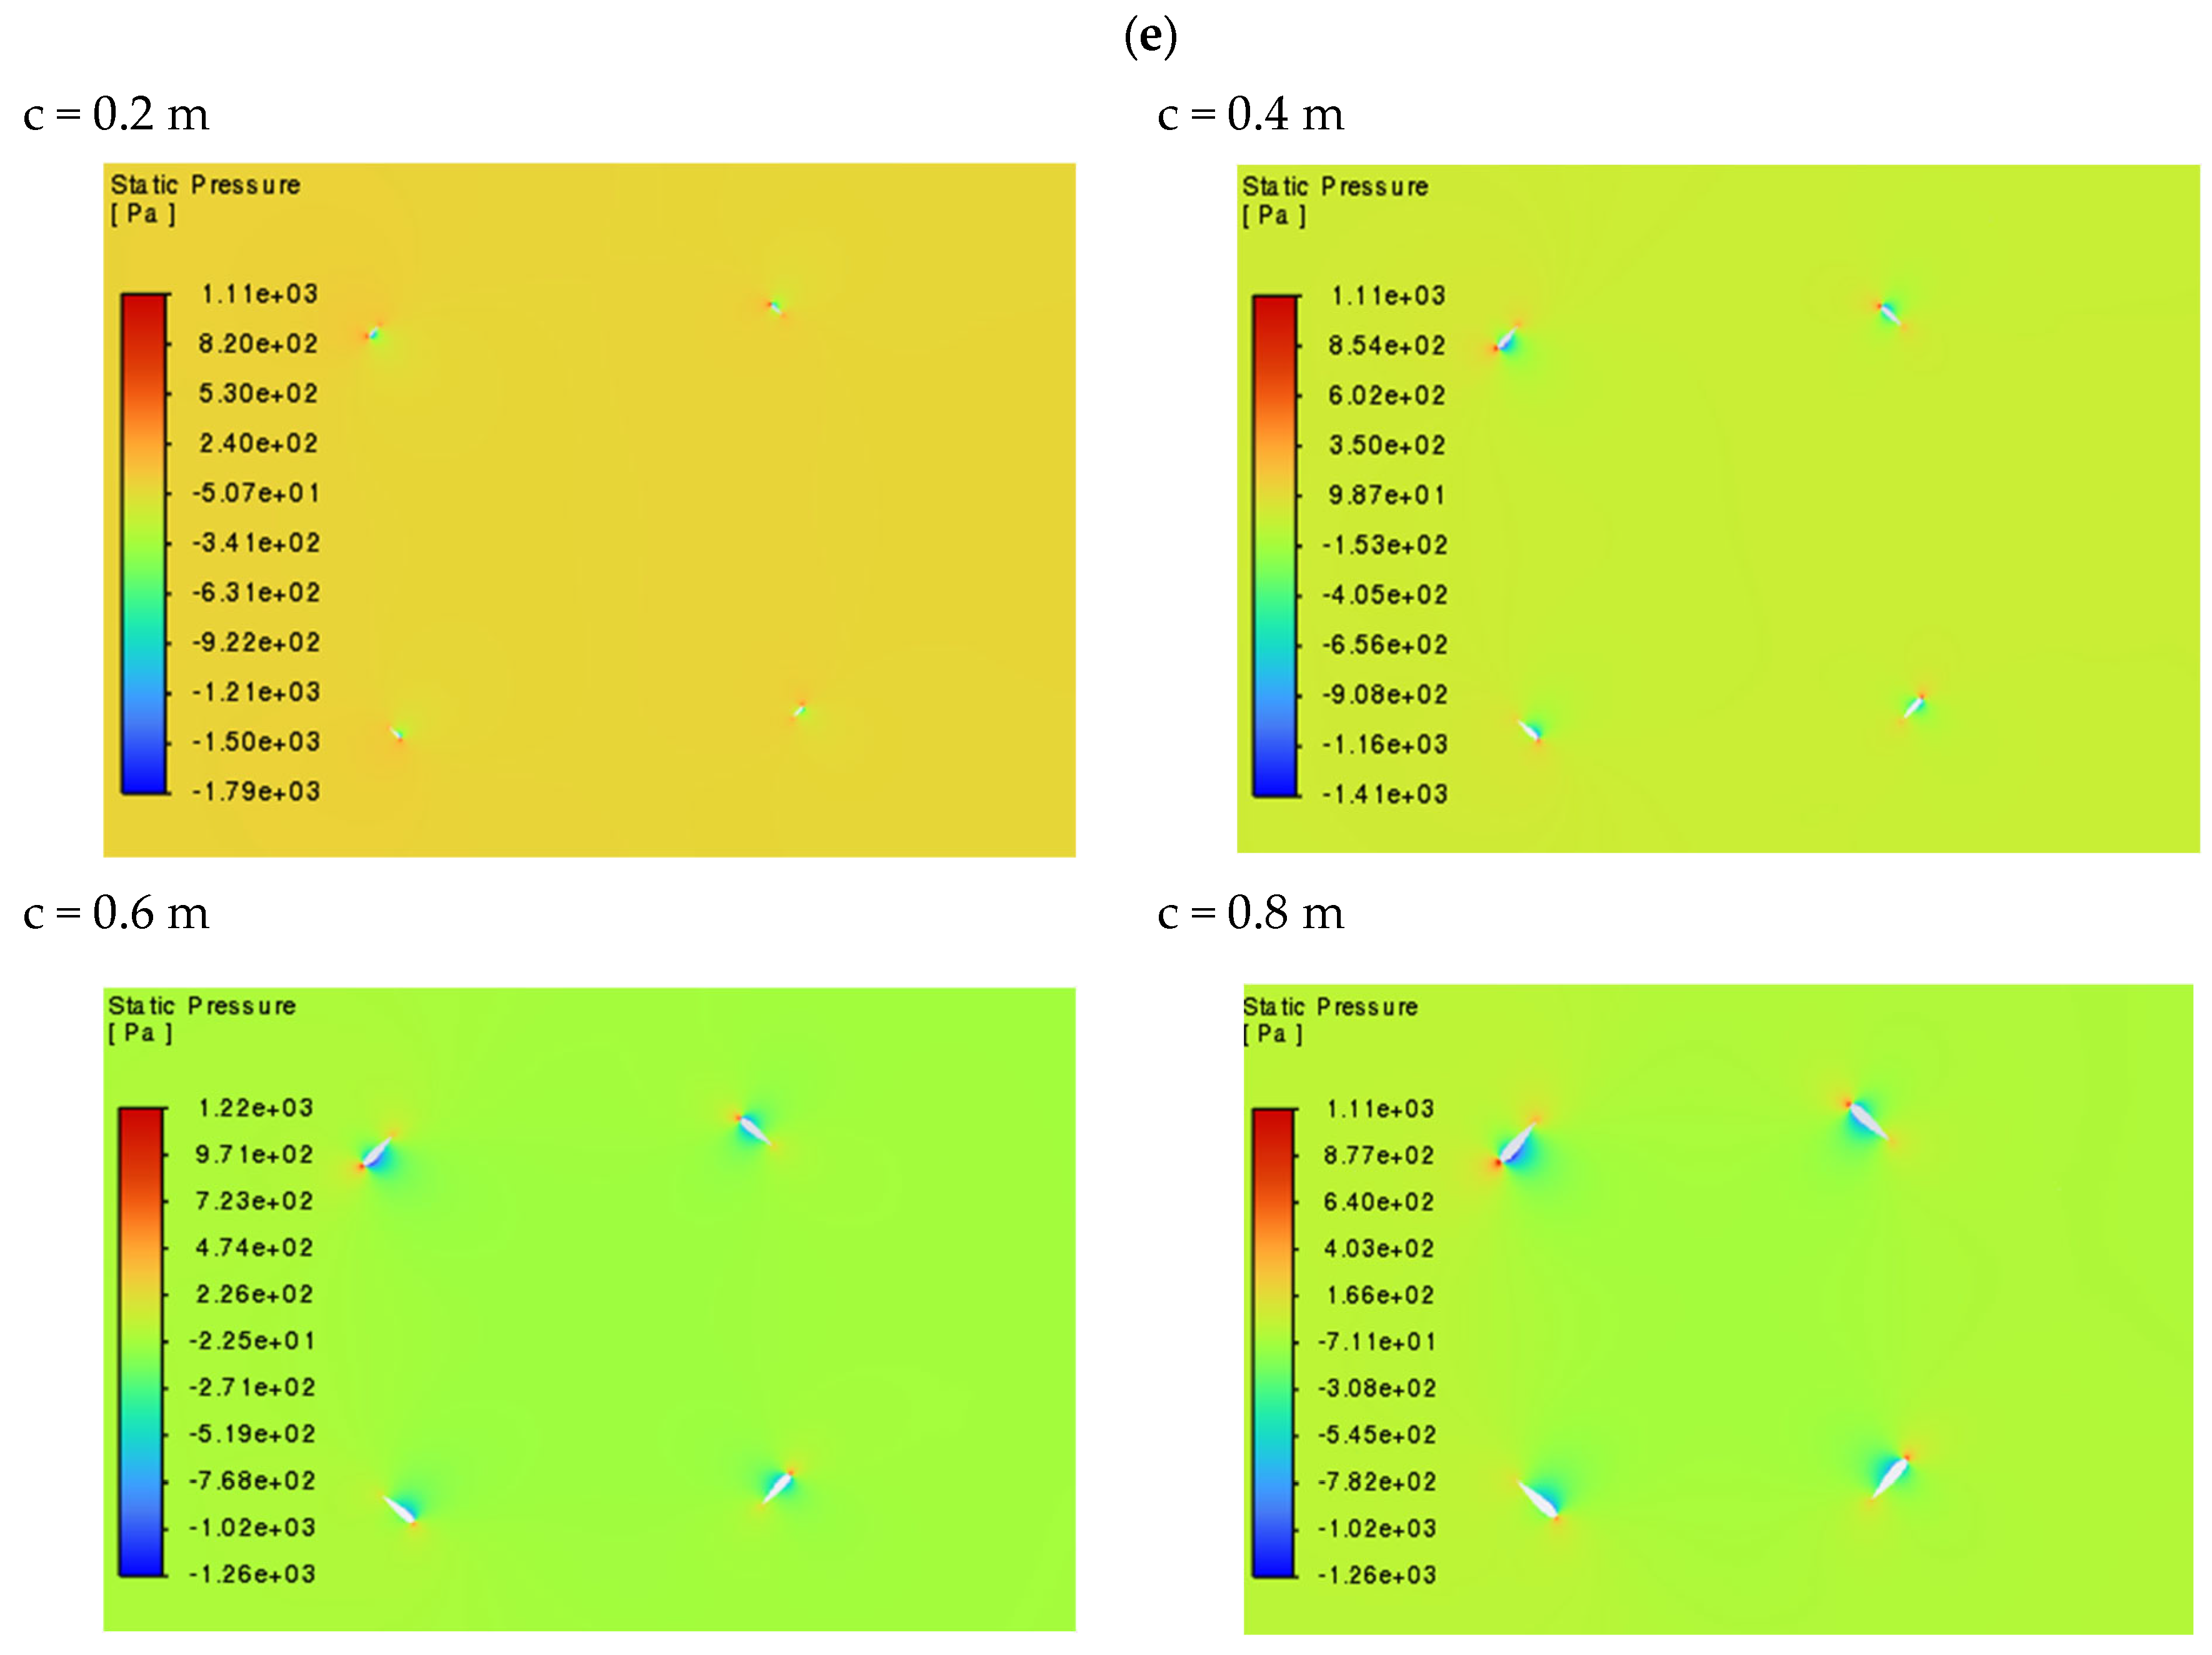
3.1. Analysis of Velocity, Pressure and Torque Fields
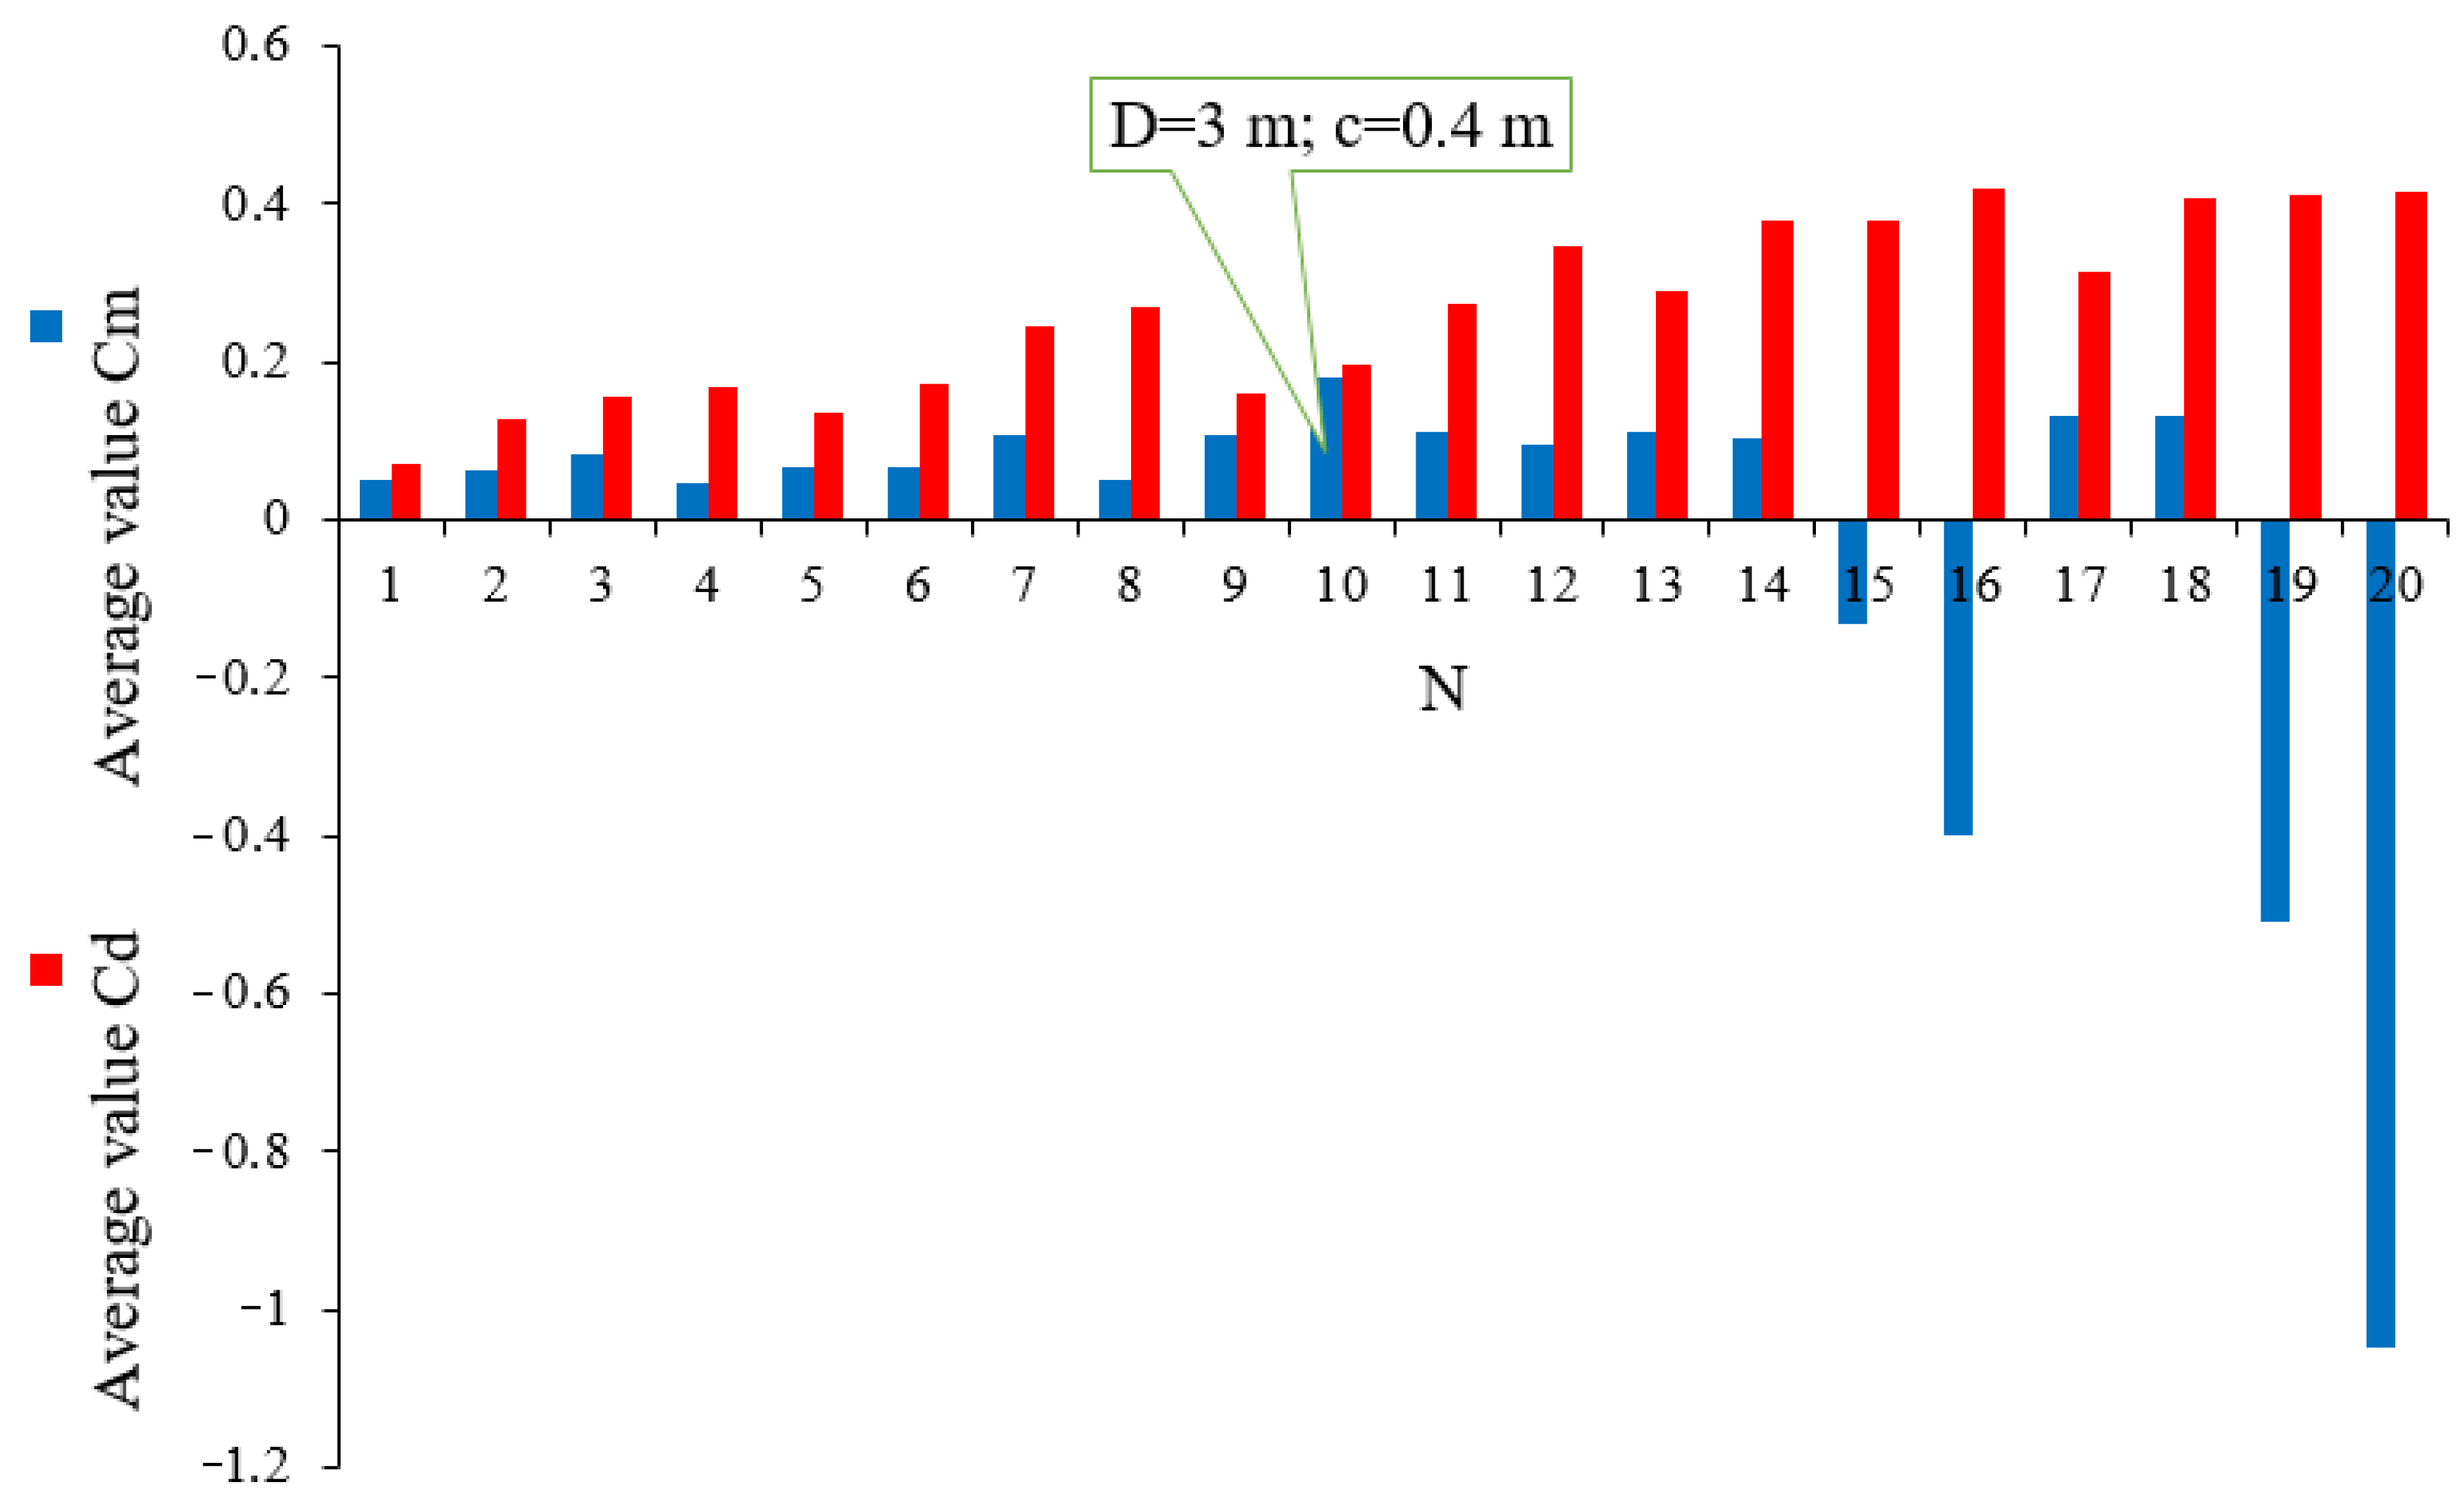
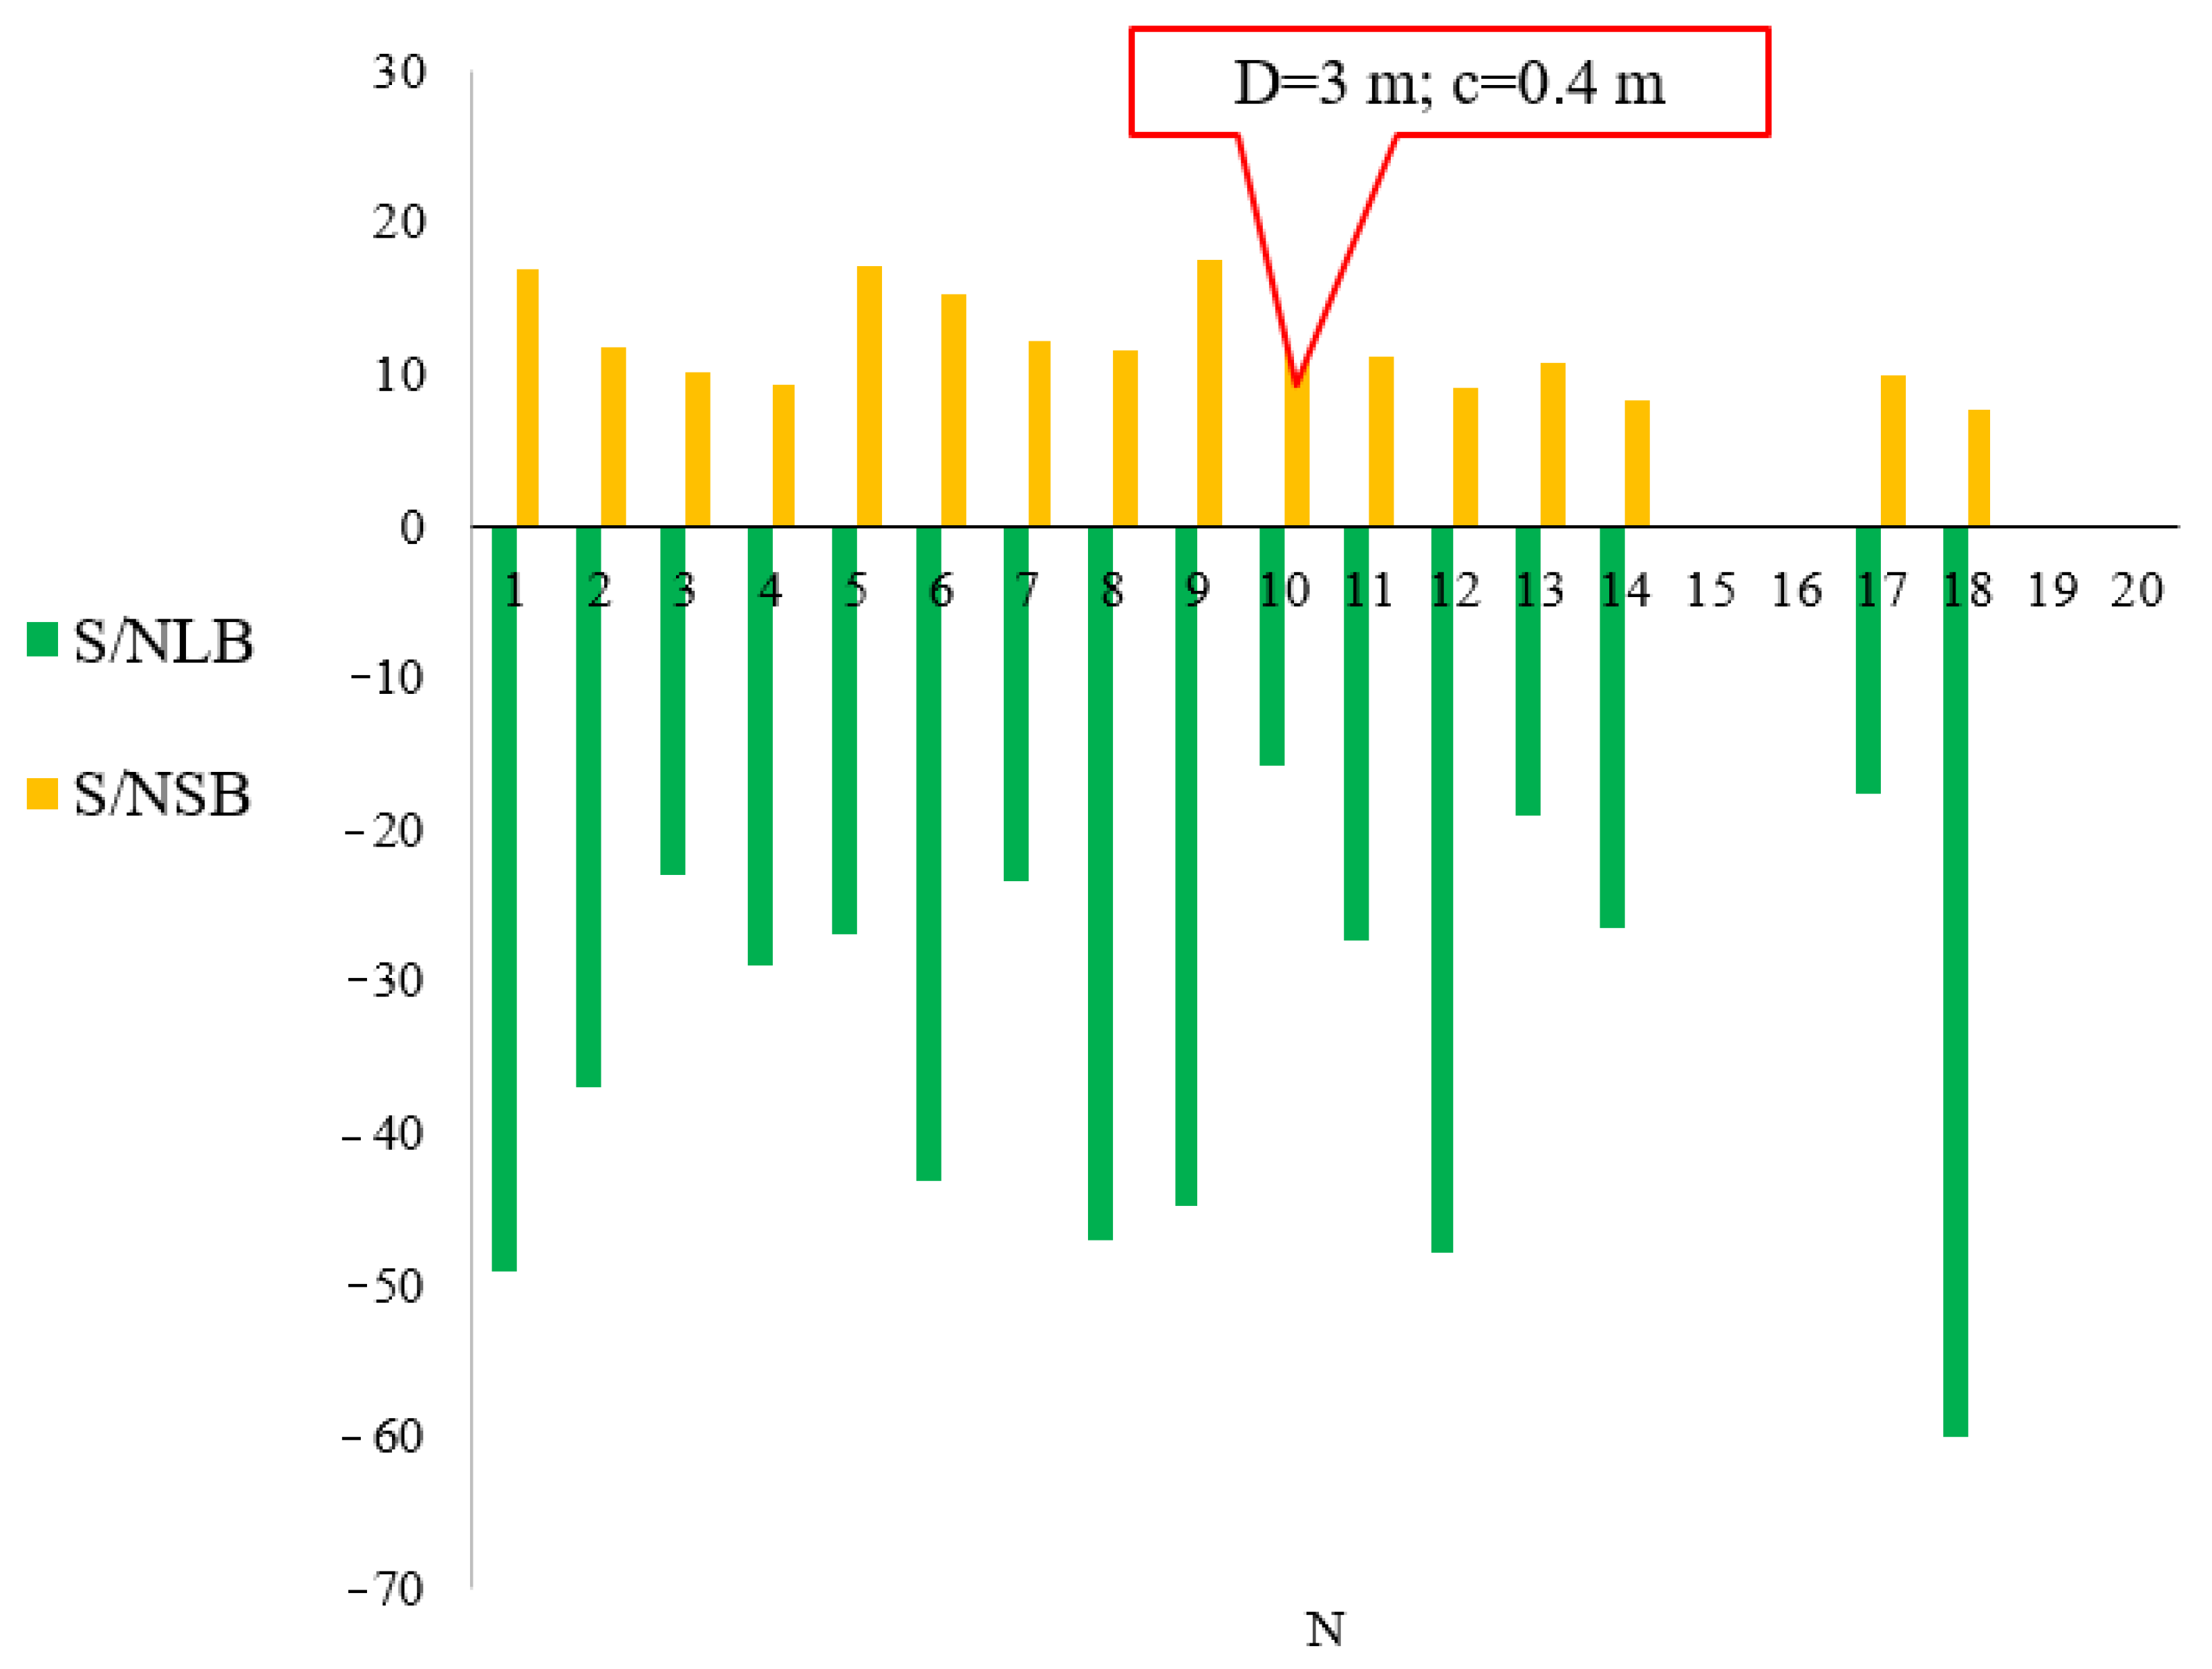
3.2. Evaluation of Aerodynamic Efficiency Using the Taguchi Method
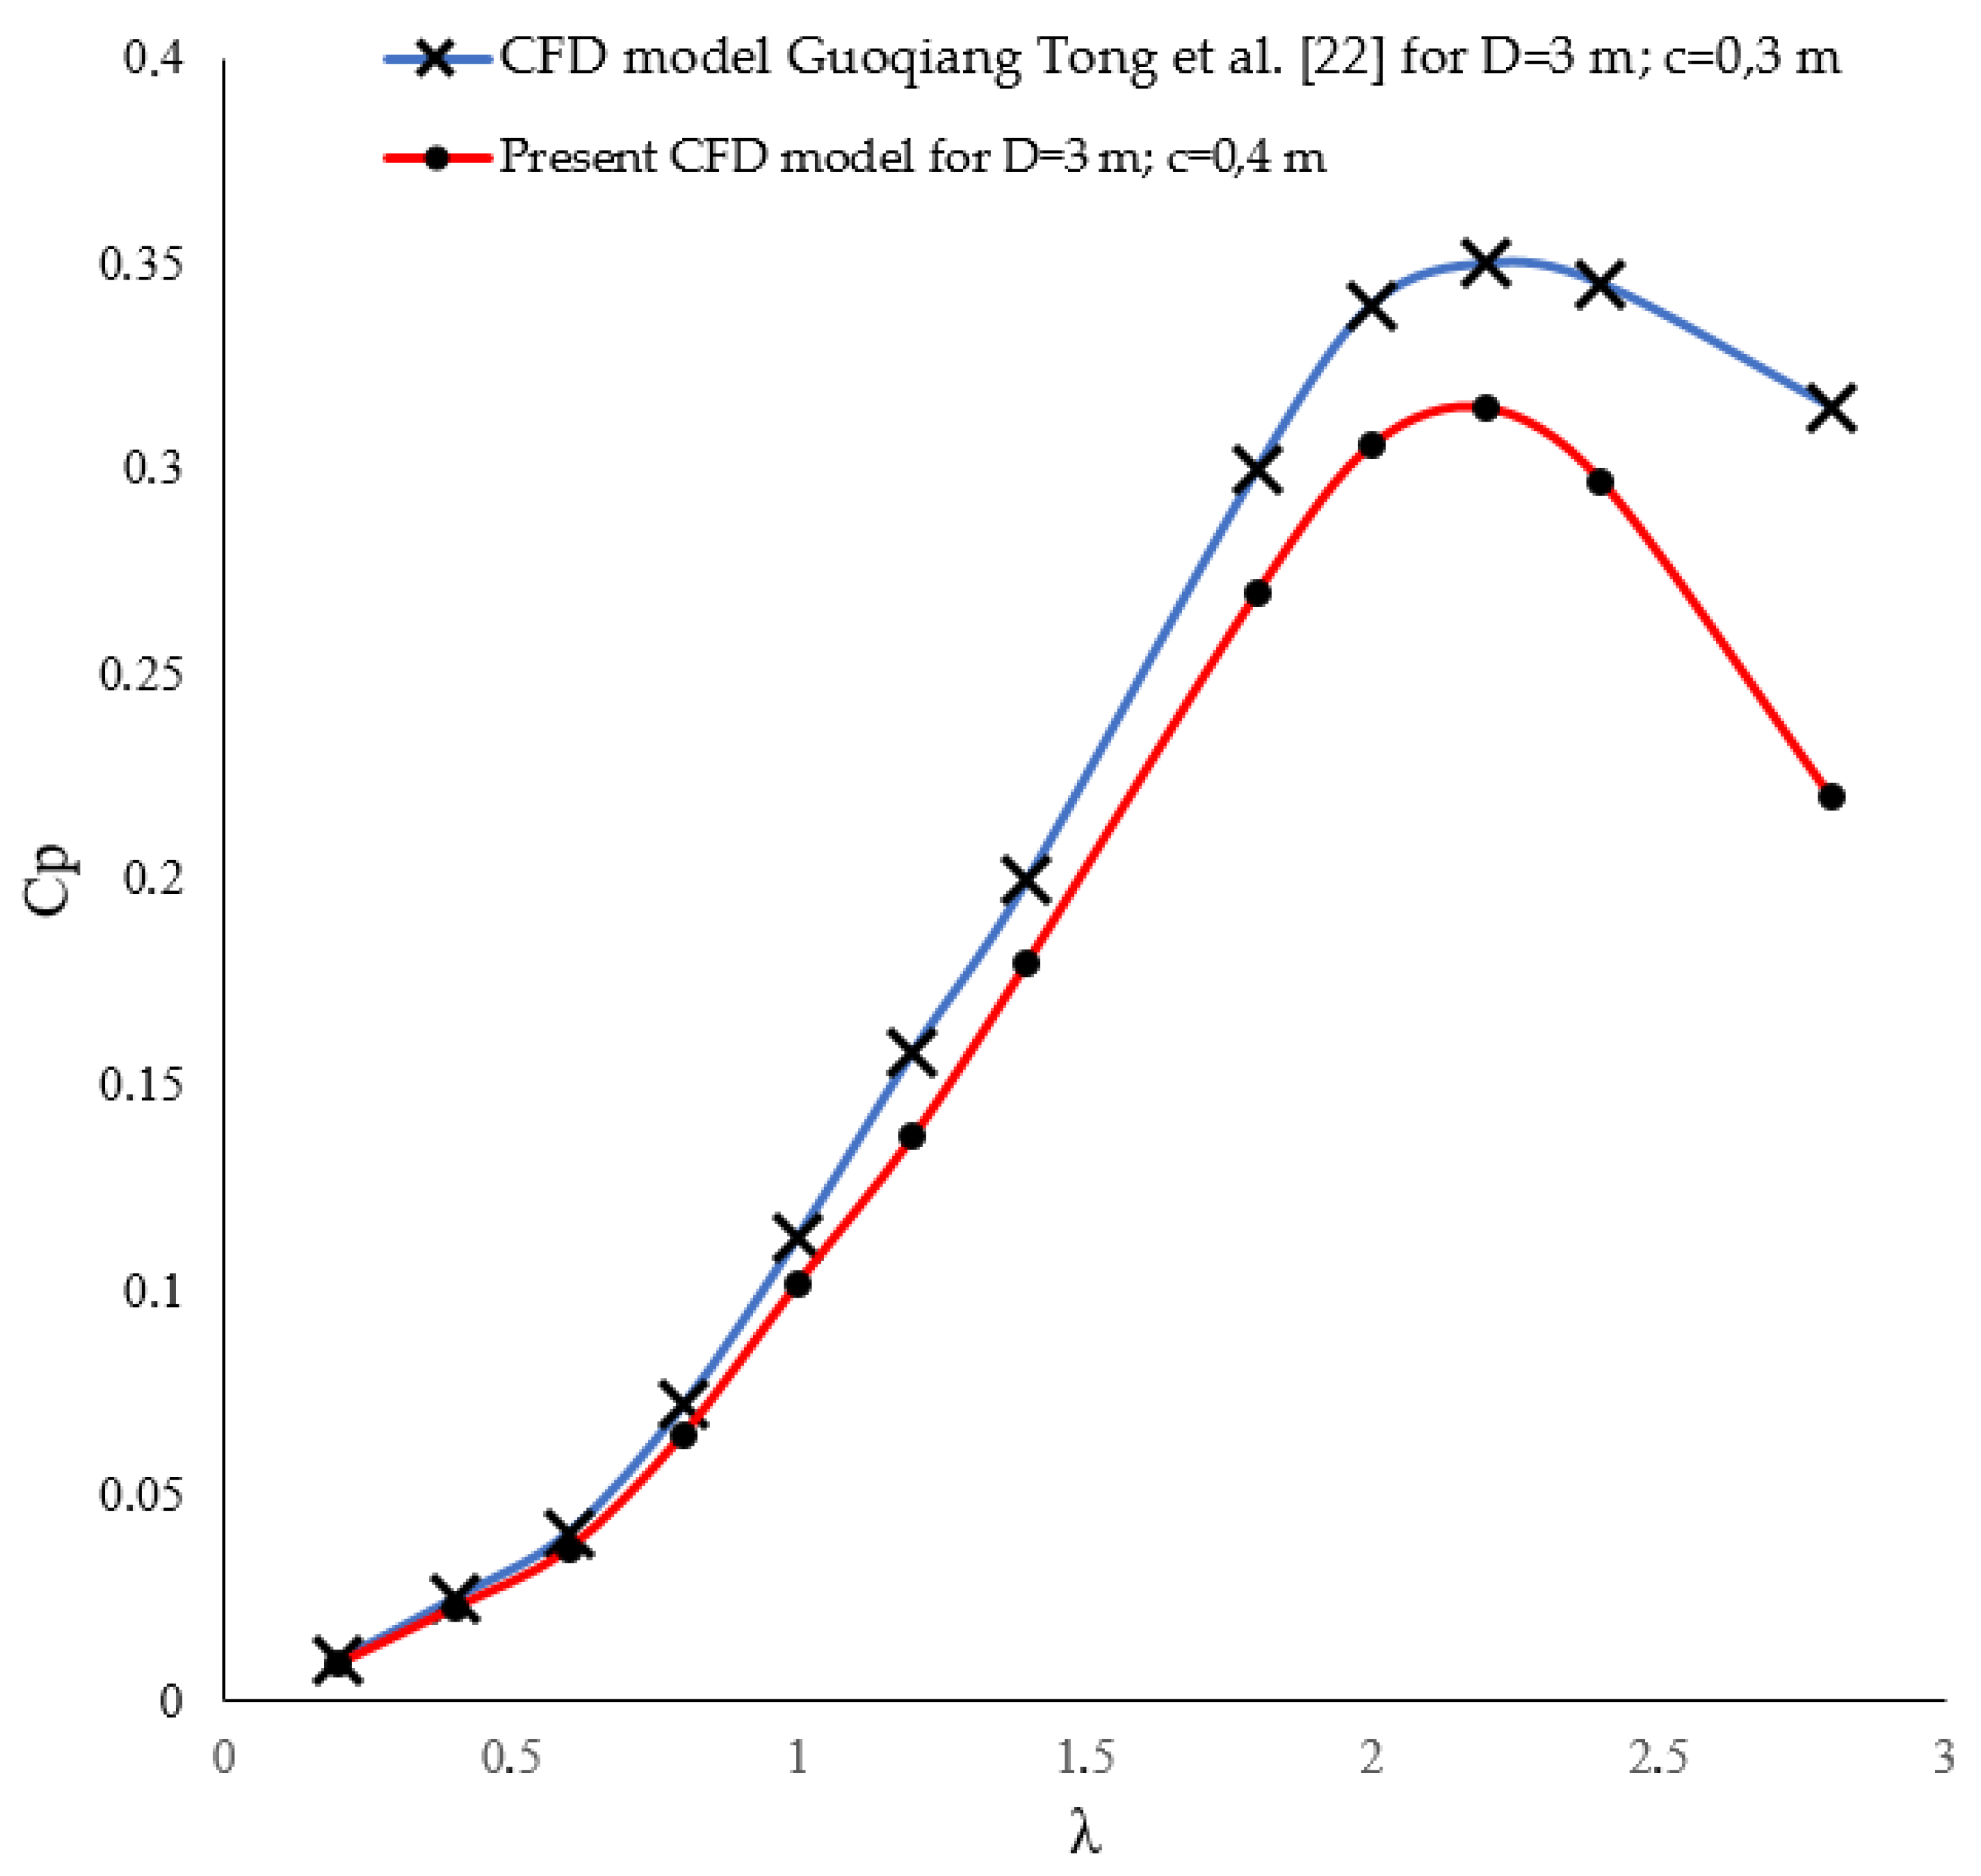
3.3. Model Validation
4. Conclusions
Author Contributions
Funding
Institutional Review Board Statement
Informed Consent Statement
Data Availability Statement
Conflicts of Interest
Abbreviation
| CFD | computational fluid dynamics |
| DMST | double-multiple streamtube |
| HAWT | horizontal axis wind turbine |
| NACA | National Advisory Committee for Aeronautics |
| RANS | Reynolds-averaged Navier–Stokes |
| SST | shear stress transport |
| TSR | tip speed ratio |
| VAWT | vertical axis wind turbine |
References
- Backwell, B. GWEC’s Global Wind Report 2024. 2024. Available online: https://www.gwec.net/gwec-news/wind-industry-installs-record-capacity-in-2024-despite-policy-instability (accessed on 13 March 2025).
- Kumar, Y.; Ringenberg, J.; Depuru, S.; Devabhaktuni, V.K.; Lee, W.; Nikolaidis, E.; Andersen, B.; Afjeh, A. Wind energy: Trends and enabling technologies. Renew. Sustain. Energy Rev. 2016, 53, 209–224. [Google Scholar] [CrossRef]
- Isataev, M.; Manatbayev, R.; Seydulla, Z.; Bektibai, B.; Kalassov, N. Study of Aerodynamic Characteristics of Asymmetrical Blades and a Wind-Driven Power Plant with a Vertical Axis of Rotation. Appl. Sci. 2024, 14, 11654. [Google Scholar] [CrossRef]
- Li, Y.; Zheng, Y.; Zhao, S.; Fenf, F.; Li, J.; Wang, N.; Bai, R. A review on aerodynamic characteristics of straight-bladed vertical axis wind turbines. Acta Aerodyn. Sin. 2017, 35, 368–382. [Google Scholar] [CrossRef]
- Barnes, A.; Marshall-Cross, D.; Hughes, B.R. Towards a standard approach for future Vertical Axis Wind Turbine aerodynamics research and development. Renew. Sustain. Energy Rev. 2021, 148, 111221. [Google Scholar] [CrossRef]
- Hand, B.; Cashman, A. A review on the historical development of the lift-type vertical axis wind turbine: From onshore to offshore floating application. Sustain. Energy Technol. Assess. 2020, 38, 100646. [Google Scholar] [CrossRef]
- Li, Y.; Zhao, S.; Qu, C.; Tong, G.; Feng, F.; Zhao, B.; Kotaro, T. Aerodynamic characteristics of Straight-bladed Vertical Axis Wind Turbine with a curved-outline wind gathering device. Energy Convers. Manag. 2020, 203, 112249. [Google Scholar] [CrossRef]
- Vivek, C.M.; Gopikrishnan, P.; Murugesh, R.; Mohamed, R.R. A review on vertical and horizontal axis wind turbine. Int. Res. J. Eng. Technol. 2017, 4, 247–250. [Google Scholar]
- Shen, Z.; Gong, S.; Lu, H.; Guo, W.; Chen, W. Investigation of the effect of pitch angle of double darrieus vertical axis wind turbine based on aerodynamic performance and entropy production theory. Ocean Eng. 2024, 311, 118930. [Google Scholar] [CrossRef]
- Roga, S.; Bardhan, S.; Kumar, Y.; Dubey, S.K. Recent technology and challenges of wind energy generation: A review. Sustain. Energy Technol. Assess. 2022, 52, 102239. [Google Scholar] [CrossRef]
- Johari, M.K.; Jalil, M.; Shariff, M.F.M. Comparison of horizontal axis wind turbine (HAWT) and vertical axis wind turbine (VAWT). Int. J. Eng. Technol. 2018, 7, 74–80. [Google Scholar] [CrossRef]
- Liu, J.; Lin, H.; Zhang, J. Review on the technical perspectives and commercial viability of vertical axis wind turbines. Ocean Eng. 2019, 182, 608–626. [Google Scholar] [CrossRef]
- Hand, B.; Kelly, G.; Cashman, A. Aerodynamic design and performance parameters of a lift-type vertical axis wind turbine: A comprehensive review. Renew. Sustain. Energy Rev. 2021, 139, 110699. [Google Scholar] [CrossRef]
- Karmakar, S.D.; Chattopadhyay, H. A review of augmentation methods to enhance the performance of vertical axis wind turbine. Sustain. Energy Technol. Assess. 2022, 53, 102469. [Google Scholar] [CrossRef]
- Zhao, Z.; Wang, D.; Wang, T.; Shen, W.; Liu, H.; Chen, M. A review: Approaches for aerodynamic performance improvement of lift-type vertical axis wind turbine. Sustain. Energy Technol. Assess. 2022, 49, 101789. [Google Scholar] [CrossRef]
- Mukhopadhyay, A.; Sharma, A.; Hossain, A.; Roy, S.; Singha, S.; Modak, D.; Gupta, A.K.; Shaw, A.; Sarkar, A.; Paul, N.; et al. A Review on the Effect of Different Performance Parameters of H-Darrieus Turbines. In Proceedings of the International Conference on Futuristic Advancements in Materials, Manufacturing and Thermal Sciences, Ahmedabad, India, 19–21 January 2024; Springer Nature: Singapore, 2024; pp. 195–204. [Google Scholar] [CrossRef]
- Akhlaghi, M.; Asadbeigi, M.; Ghafoorian, F. Novel CFD and DMST dual method parametric study and optimization of a Darrieus vertical axis wind turbine. J. Appl. Fluid Mech. 2023, 17, 205–218. [Google Scholar] [CrossRef]
- Yusri, H.F.M.; Ramsay, F.A.; Xuan, T.W.; Yong, N.Z.; Khai, P.M.; Didane, D.H.; Manshoor, B. 2D Numerical Simulation of H-type Darrieus Vertical-Axis Wind Turbine (VAWT). J. Des. Sustain. Environ. 2023, 5, 11–16. [Google Scholar]
- Wilberforce, T.; Alaswad, A. Performance analysis of a vertical axis wind turbine using computational fluid dynamics. Energy 2023, 263, 125892. [Google Scholar] [CrossRef]
- Rezaeiha, A.; Montazeri, H.; Blocken, B. Towards optimal aerodynamic design of vertical axis wind turbines: Impact of solidity and number of blades. Energy 2018, 165, 1129–1148. [Google Scholar] [CrossRef]
- Tirandaz, M.; Rezaeiha, A. Effect of airfoil shape on power performance of vertical axis wind turbines in dynamic stall: Symmetric Airfoils. Renew. Energy 2021, 173, 422–441. [Google Scholar] [CrossRef]
- Tong, G.; Li, Y.; Tagawa, K.; Feng, F. Effects of blade airfoil chord length and rotor diameter on aerodynamic performance of straight-bladed vertical axis wind turbines by numerical simulation. Energy 2023, 265, 126325. [Google Scholar] [CrossRef]
- Isataev, M.; Manatbayev, R.; Seydulla, Z.; Kalassov, N.; Yershina, A.; Baizhuma, Z. Experimental and computational study of the aerodynamic characteristics of a Darrieus rotor with asymmetrical blades to increase turbine efficiency under low wind velocity conditions. Appl. Syst. Innov. 2025, 8, 49. [Google Scholar] [CrossRef]
- Eltayeb, W.; Somlal, J.; Singh, A.R.; Alsaif, F. Enhancing darrieus wind turbine performance through varied plain flap configurations for the solar and wind tree. Sci. Rep. 2024, 14, 30014. [Google Scholar] [CrossRef]
- Shen, Z.; Gong, S.; Zuo, Z.; Chen, Y.; Guo, W. Darrieus vertical-axis wind turbine performance enhancement approach and optimized design: A review. Ocean Eng. 2024, 311, 118965. [Google Scholar] [CrossRef]
- Chen, L.; Yang, P.; Zhang, B.; Chen, L. Aerodynamic enhancement of Vertical-Axis wind turbines using Plain and Serrated Gurney flaps. Appl. Sci. 2023, 13, 12643. [Google Scholar] [CrossRef]
- Yershin, S.A.; Yershina, A.K.; Yershin, C.S.; Manatbayev, R.K. Wind Turbine. Patent of the Republic of Kazakhstan No. 31662. Bulletin No. 15, 2016. [Google Scholar]
- Sun, X.; Zhu, J.; Li, Z.; Sun, G. Rotation improvement of vertical axis wind turbine by offsetting pitching angles and changing blade numbers. Energy 2021, 215, 119177. [Google Scholar] [CrossRef]
- Rezaeiha, A.; Kalkman, I.; Blocken, B. Effect of pitch angle on power performance and aerodynamics of a vertical axis wind turbine. Appl. Energy 2017, 197, 132–150. [Google Scholar] [CrossRef]
- Safi, A.; Hamdan, M.O.; Elnajjar, E. Numerical investigation on the effect of rotation on impingement cooling of the gas turbine leading edge. Alex. Eng. J. 2020, 59, 3781–3797. [Google Scholar] [CrossRef]
- Almohammadi, K.M.; Ingham, D.B.; Ma, L.; Pourkashan, M. Computational fluid dynamics (CFD) mesh independency techniques for a straight blade vertical axis wind turbine. Energy 2013, 58, 483–493. [Google Scholar] [CrossRef]
- Menter, F.R. Two-equation eddy-viscosity turbulence models for engineering applications. AIAA J. 1994, 32, 1598–1605. [Google Scholar] [CrossRef]
- Chen, W.H.; Wang, J.S.; Chang, M.H.; Mutuku, J.K.; Hoang, A.T. Efficiency improvement of a vertical-axis wind turbine using a deflector optimized by Taguchi approach with modified additive method. Energy Convers. Manag. 2021, 245, 114609. [Google Scholar] [CrossRef]
- Azadani, L.N.; Saleh, M. Effect of blade aspect ratio on the performance of a pair of vertical axis wind turbines. Ocean Eng. 2022, 265, 112627. [Google Scholar] [CrossRef]
- ANSYS Inc. ANSYS Fluent Theory Guide. Release 2024 R1; ANSYS Inc.: Canonsburg, PA, USA, 2024. [Google Scholar]
- Khanjanpour, M.H.; Javadi, A.A. Optimization of the hydrodynamic performance of a vertical Axis tidal (VAT) turbine using CFD-Taguchi approach. Energy Convers. Manag. 2020, 222, 113235. [Google Scholar] [CrossRef]
- Peng, H.Y.; Liu, M.N.; Liu, H.J.; Lin, K. Optimization of twin vertical axis wind turbines through large eddy simulations and Taguchi method. Energy 2022, 240, 122560. [Google Scholar] [CrossRef]


| Parameter | Meaning |
|---|---|
| Aerodynamic profile | NACA 0021 |
| Rotor diameter D, m | 1.5–4 |
| Chord length c, m | 0.2–0.8 |
| Number of blades | 4 |
| Parameter | Meaning |
|---|---|
| Rotor diameter | D |
| Rotating area diameter | 1.5D |
| Distances from the rotor center to the velocity inlet | 20D |
| Distances from the rotor center to the pressure outlet | 40D |
| Distances from the rotor center to the symmetry walls | 10D |
| Parameter | Meaning |
|---|---|
| Wind speed, U | 8 m/s |
| Rotation frequency, | 100 rpm |
| Air density, ρ | 1.23 kg/m3 |
| Molecular viscosity, | 1.789 × 10⁻⁵ m2/s |
| Empirical coefficients (model constants), , , | 0.09; 0.075; 0.5532 [32] |
| Switching function, | varies from 0 to 1 [35] |
| Empirical constants of the SST model, ,, | 0.85; 0.5; 0.856 [32] |
| Mesh Level | Total Cells (×103) | Cm | Cp |
|---|---|---|---|
| Coarse | 400 | 0.1718 | 0.3436 |
| Medium | 600 | 0.1534 | 0.3068 |
| Fine | 800 | 0.1503 | 0.3006 |
| Test No. | Rotor Diameter D, m | Chord Length c, m |
|---|---|---|
| 1 | 1.5 | 0.2 |
| 2 | 1.5 | 0.4 |
| 3 | 1.5 | 0.6 |
| 4 | 1.5 | 0.8 |
| 5 | 2.25 | 0.2 |
| 6 | 2.25 | 0.4 |
| 7 | 2.25 | 0.6 |
| 8 | 2.25 | 0.8 |
| 9 | 3 | 0.2 |
| 10 | 3 | 0.4 |
| 11 | 3 | 0.6 |
| 12 | 3 | 0.8 |
| 13 | 3.75 | 0.2 |
| 14 | 3.75 | 0.4 |
| 15 | 3.75 | 0.6 |
| 16 | 3.75 | 0.8 |
| 17 | 4 | 0.2 |
| 18 | 4 | 0.4 |
| 19 | 4 | 0.6 |
| 20 | 4 | 0.8 |
| N | D, m | c, m | Average Cm Value | Average Cd Value | Cm/Cd | ||
|---|---|---|---|---|---|---|---|
| 1 | 1.5 | 0.2 | 0.050778932 | 0.069018 | 0.735735 | −49.1447 | 16.98327126 |
| 2 | 0.4 | 0.062635 | 0.127467 | 0.491382 | −36.9787 | 11.83366 | |
| 3 | 0.6 | 0.081099 | 0.154793 | 0.523919 | −22.9858 | 10.16032 | |
| 4 | 0.8 | 0.047308 | 0.168392 | 0.28094 | −28.8862 | 9.390334 | |
| 5 | 2.25 | 0.2 | 0.06516 | 0.135341 | 0.481451 | −26.7383 | 17.30525 |
| 6 | 0.4 | 0.066237811 | 0.17066 | 0.388127 | −43 | 15.30317 | |
| 7 | 0.6 | 0.105615 | 0.243987 | 0.432871 | −23.2597 | 12.23492 | |
| 8 | 0.8 | 0.051378 | 0.26912 | 0.190911 | −47.0095 | 11.6817 | |
| 9 | 3 | 0.2 | 0.108817 | 0.15878 | 0.685332 | −44.7695 | 17.6038 |
| 10 | 0.4 | 0.179685 | 0.196306 | 0.915331 | −15.7684 | 14.1405 | |
| 11 | 0.6 | 0.110579 | 0.273009 | 0.405038 | −27.2382 | 11.2576 | |
| 12 | 0.8 | 0.094196 | 0.344421 | 0.273491 | −47.8903 | 9.214197 | |
| 13 | 3.75 | 0.2 | 0.11134 | 0.2901 | 0.383799 | −19.0884 | 10.74493 |
| 14 | 0.4 | 0.102123 | 0.378801 | 0.269595 | −26.5002 | 8.431534 | |
| 15 | 0.6 | −0.13392 | 0.379914 | −0.3525 | x | x | |
| 16 | 0.8 | −0.4006 | 0.41975 | −0.95438 | x | x | |
| 17 | 4 | 0.2 | 0.132862 | 0.312407 | 0.425285 | −17.5532 | 10.10126 |
| 18 | 0.4 | 0.129829 | 0.407197 | 0.318836 | −59.9071 | 7.80367 | |
| 19 | 0.6 | −0.5074 | 0.410599 | −1.23576 | x | x | |
| 20 | 0.8 | −1.04973 | 0.416503 | −2.52034 | x | x |
Disclaimer/Publisher’s Note: The statements, opinions and data contained in all publications are solely those of the individual author(s) and contributor(s) and not of MDPI and/or the editor(s). MDPI and/or the editor(s) disclaim responsibility for any injury to people or property resulting from any ideas, methods, instructions or products referred to in the content. |
© 2025 by the authors. Licensee MDPI, Basel, Switzerland. This article is an open access article distributed under the terms and conditions of the Creative Commons Attribution (CC BY) license (https://creativecommons.org/licenses/by/4.0/).
Share and Cite
Kalassov, N.; Baizhuma, Z.; Manatbayev, R.; Yershina, A.; Isataev, M.; Kalassova, A.; Seidulla, Z.; Bektibay, B.; Amir, B. Integrated Approach to Aerodynamic Optimization of Darrieus Wind Turbine Based on the Taguchi Method and Computational Fluid Dynamics (CFD). Appl. Sci. 2025, 15, 5739. https://doi.org/10.3390/app15105739
Kalassov N, Baizhuma Z, Manatbayev R, Yershina A, Isataev M, Kalassova A, Seidulla Z, Bektibay B, Amir B. Integrated Approach to Aerodynamic Optimization of Darrieus Wind Turbine Based on the Taguchi Method and Computational Fluid Dynamics (CFD). Applied Sciences. 2025; 15(10):5739. https://doi.org/10.3390/app15105739
Chicago/Turabian StyleKalassov, Nurdaulet, Zhandos Baizhuma, Rustem Manatbayev, Ainakul Yershina, Muhtar Isataev, Aiida Kalassova, Zhanibek Seidulla, Birzhan Bektibay, and Bakyt Amir. 2025. "Integrated Approach to Aerodynamic Optimization of Darrieus Wind Turbine Based on the Taguchi Method and Computational Fluid Dynamics (CFD)" Applied Sciences 15, no. 10: 5739. https://doi.org/10.3390/app15105739
APA StyleKalassov, N., Baizhuma, Z., Manatbayev, R., Yershina, A., Isataev, M., Kalassova, A., Seidulla, Z., Bektibay, B., & Amir, B. (2025). Integrated Approach to Aerodynamic Optimization of Darrieus Wind Turbine Based on the Taguchi Method and Computational Fluid Dynamics (CFD). Applied Sciences, 15(10), 5739. https://doi.org/10.3390/app15105739