Article

Optimization of Airflow Organization in Bidirectional Air Supply Data Centers in China

1
School of Mechanical and Automotive Engineering, South China University of Technology, Guangzhou 510640, China
2
Guangzhou Institute of Modern Industrial Technology, Guangzhou 511458, China
3
Artificial Intelligence and Digital Economy Guangdong Provincial Laboratory (Guangzhou), Guangzhou 511442, China
*
Author to whom correspondence should be addressed.
Appl. Sci. 2025, 15(10), 5711; https://doi.org/10.3390/app15105711
Submission received: 3 April 2025 / Revised: 9 May 2025 / Accepted: 14 May 2025 / Published: 20 May 2025

Abstract

:
Optimizing airflow organization is essential for ensuring the energy-efficient and secure operation of data centers. To address common airflow distribution issues in air-cooled systems, such as uneven air supply and cooling capacity imbalance, this study investigates a bidirectional airflow data center room located in a hot-summer and warm-winter region. A computational fluid dynamics (CFD) model was developed based on field-measured data to analyze the airflow distribution characteristics and evaluate the existing thermal conditions. Three optimization strategies were systematically examined: (1) Installation of rack blanking panels, (2) cold aisle containment with varying degrees of closure, and (3) combined implementations of these measures. Performance evaluation was conducted using three thermal metrics: the Return Temperature Index (RTI), Supply Heat Index (SHI), and Rack Cooling Index (RCIHI). The results demonstrate that among individual optimization strategies, rack blanking panels achieved the most significant improvement, reducing SHI by 42.61% while effectively eliminating local hotspots. For combined optimization strategies, the rack blanking panels and fully contained cold aisle containment showed optimal performance, improving cooling utilization efficiency by 88.26%. The optimal retrofit solution for this data center is the rack blanking panels with fully contained cold aisle containment. When considering budget constraints, the secondary option would be rack blanking panels with cold aisle top-only containment. These findings provide practical guidance for energy efficiency improvements in similar data center environments.

1. Introduction

Data centers, serving as the core infrastructure of the digital industry, constitute a critical foundation for digital economic development [1]. With the accelerated advancement of emerging technology sectors, including 5G networks, cloud computing, and big data, data center scales continue to expand significantly. Projections indicate that by the end of 2025, China’s data center rack inventory will grow to 14 million racks, accompanied by an electricity consumption reaching 120 billion kWh [2].
The safe and continuous operation of data centers relies on cooling systems to remove heat from server rooms. Studies indicate that cooling systems account for up to 40% of a data center’s total energy consumption [3]. In recent years, new technologies like liquid cooling and natural cooling have been increasingly adopted to address the high energy consumption of cooling systems, owing to their significant energy-saving potential [4,5,6]. However, traditional air cooling methods remain dominant in existing data center facilities. The fundamental requirement for a 24/7 uninterrupted operation imposes stringent reliability demands on cooling systems. Furthermore, the implementation of new technologies is constrained by local environmental conditions and substantial initial investment costs for large-scale retrofits. Consequently, energy efficiency improvements in existing data centers continue to focus primarily on optimizing current airflow management systems [7]. These advanced cooling technologies are currently more suitable for newly constructed large-scale data center projects.
The extended cooling path in air-cooled systems often leads to airflow distribution issues, including uneven air supply, imbalance between cooling supply and demand, and cooling air loss, all of which reduce the energy efficiency of air conditioning systems [8,9]. Furthermore, as power density per rack continues to rise, the mixed deployment of various high-power IT equipment results in uneven heat load distribution both between and within racks. Under conventional air supply methods, insufficient cooling in high heat flux areas leads to elevated ambient temperatures, jeopardizing data center operational safety [10].
Operations personnel typically address local hotspots by either lowering supply air temperatures or increasing airflow rates, which further escalates cooling system energy consumption [11]. Therefore, optimizing airflow distribution to maximize cooling effectiveness is of paramount importance for ensuring both energy efficiency and operational safety in data centers [12].
Research on data center airflow optimization has primarily focused on three key aspects: improving airflow distribution uniformity, balancing airflow supply and demand, and reducing airflow losses [13]. To enhance airflow distribution uniformity, researchers have commonly employed strategies such as optimizing air conditioning unit layouts [14] and adjusting plenum geometric parameters [15,16,17]. Numerical simulations conducted by Nada S A demonstrated that arranging air conditioning units perpendicular to server rows significantly improves airflow uniformity through perforated floors while reducing hot air recirculation at the end racks and cold air bypassing at the middle racks [18]. Zhang M’s research further identified optimal plenum height ranges for different configurations: 1.0–1.2 m for open cold aisle designs, 0.6–0.8 m for cold aisle containment systems, and 0.4–0.6 m for hot aisle containment systems [19]. Some studies have proposed installing baffles in plenums to address insufficient airflow near air conditioning units [20], though these solutions introduce spatial constraints, increased airflow resistance, and potential maintenance challenges that limit their practical application.
In addressing the airflow supply–demand balance, Mohsenian G developed variable airflow panels installed beneath perforated floors that utilize pressure differentials between hot and cold aisles to regulate cooling delivery to different zones [21]. Wan J advanced this approach by creating active perforated floors with auxiliary fans that adjust airflow through variable fan speeds, enabling precise cooling distribution that improves server inlet temperature uniformity [22]. However, subsequent research has shown that the additional energy consumption from these active systems may outweigh the energy savings from chillers, while potentially creating vortices in upper rack regions that exacerbate hotspot formation [23].
Containment solutions, including cold aisle enclosure [24], rack airflow guides, and blanking panels [25], have proven effective in reducing airflow losses and optimizing temperature distribution. Sundaralingam V’s comprehensive testing demonstrated that side containment provides superior temperature uniformity under adequate airflow conditions, though partial containment performs worse than open configurations during airflow shortages [26]. Yuan X’s investigation of adjustable flexible baffles installed on rack doors and server exhaust areas confirmed their effectiveness in improving airflow distribution and reducing hotspot temperatures [27,28]. However, the implementation of airflow guides often compromises data center aesthetics and occupies valuable rack space needed for cabling, making blanking panels in unoccupied rack spaces the more widely adopted solution in practice [11].
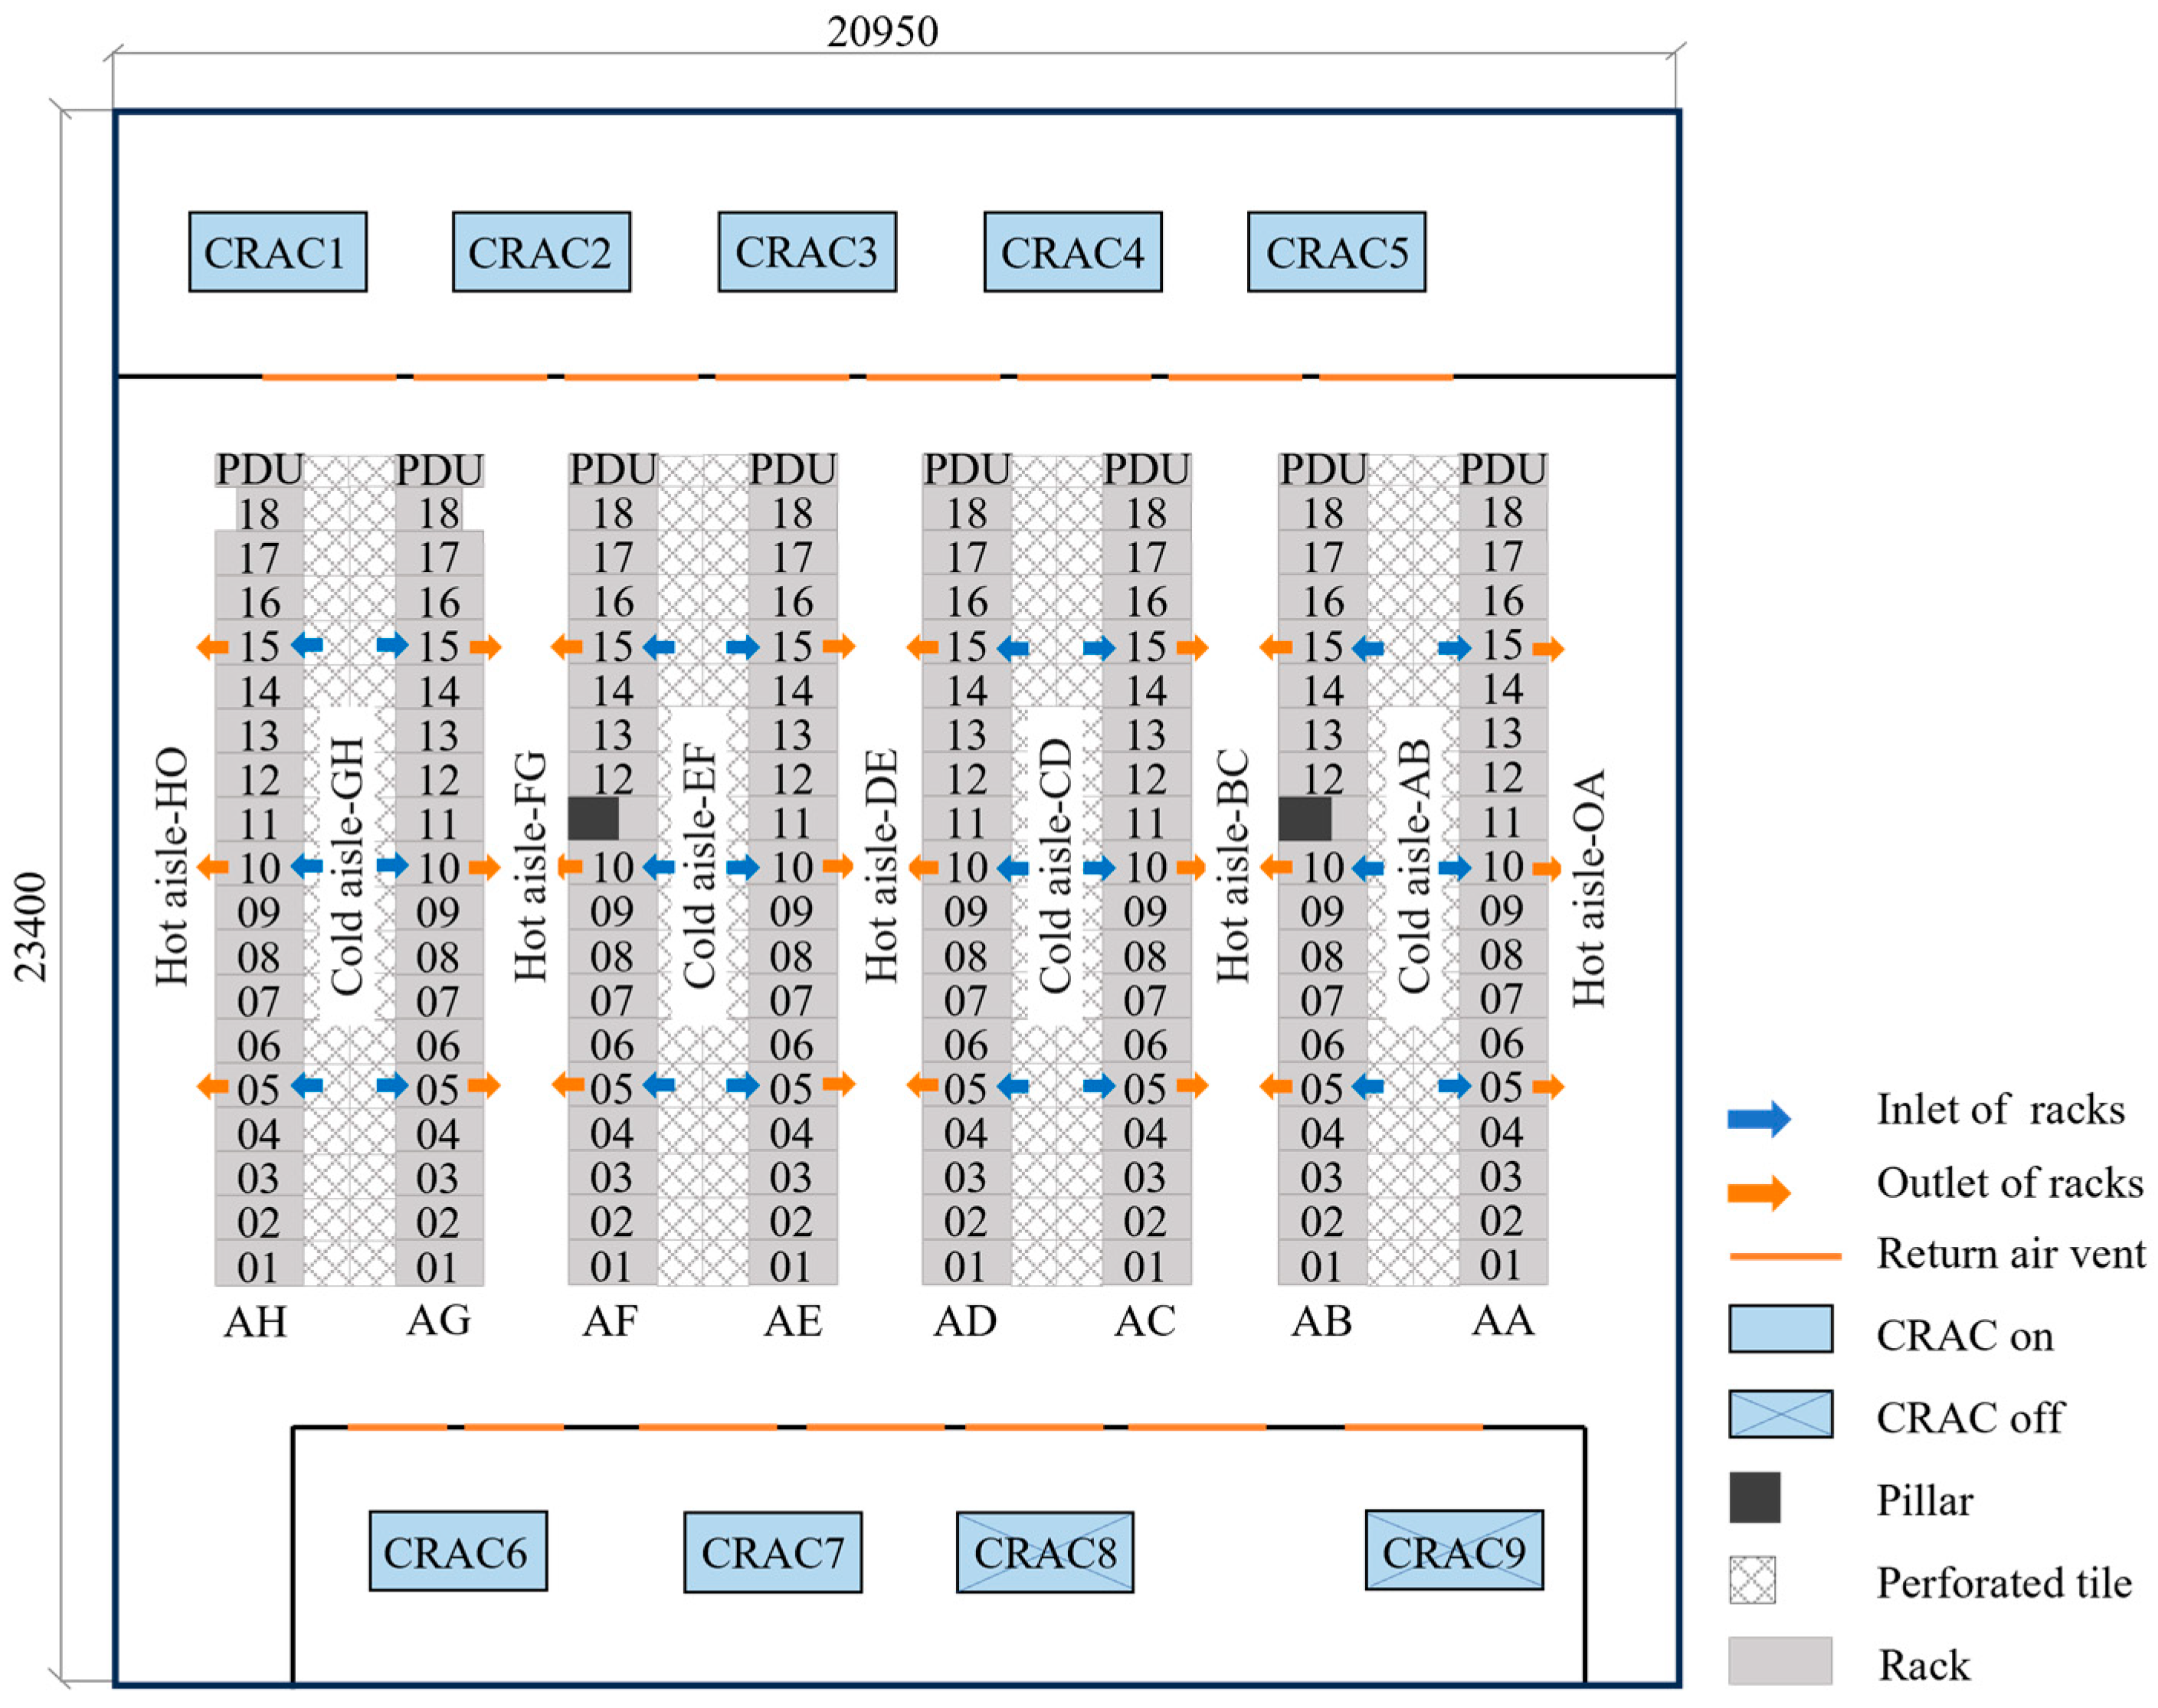
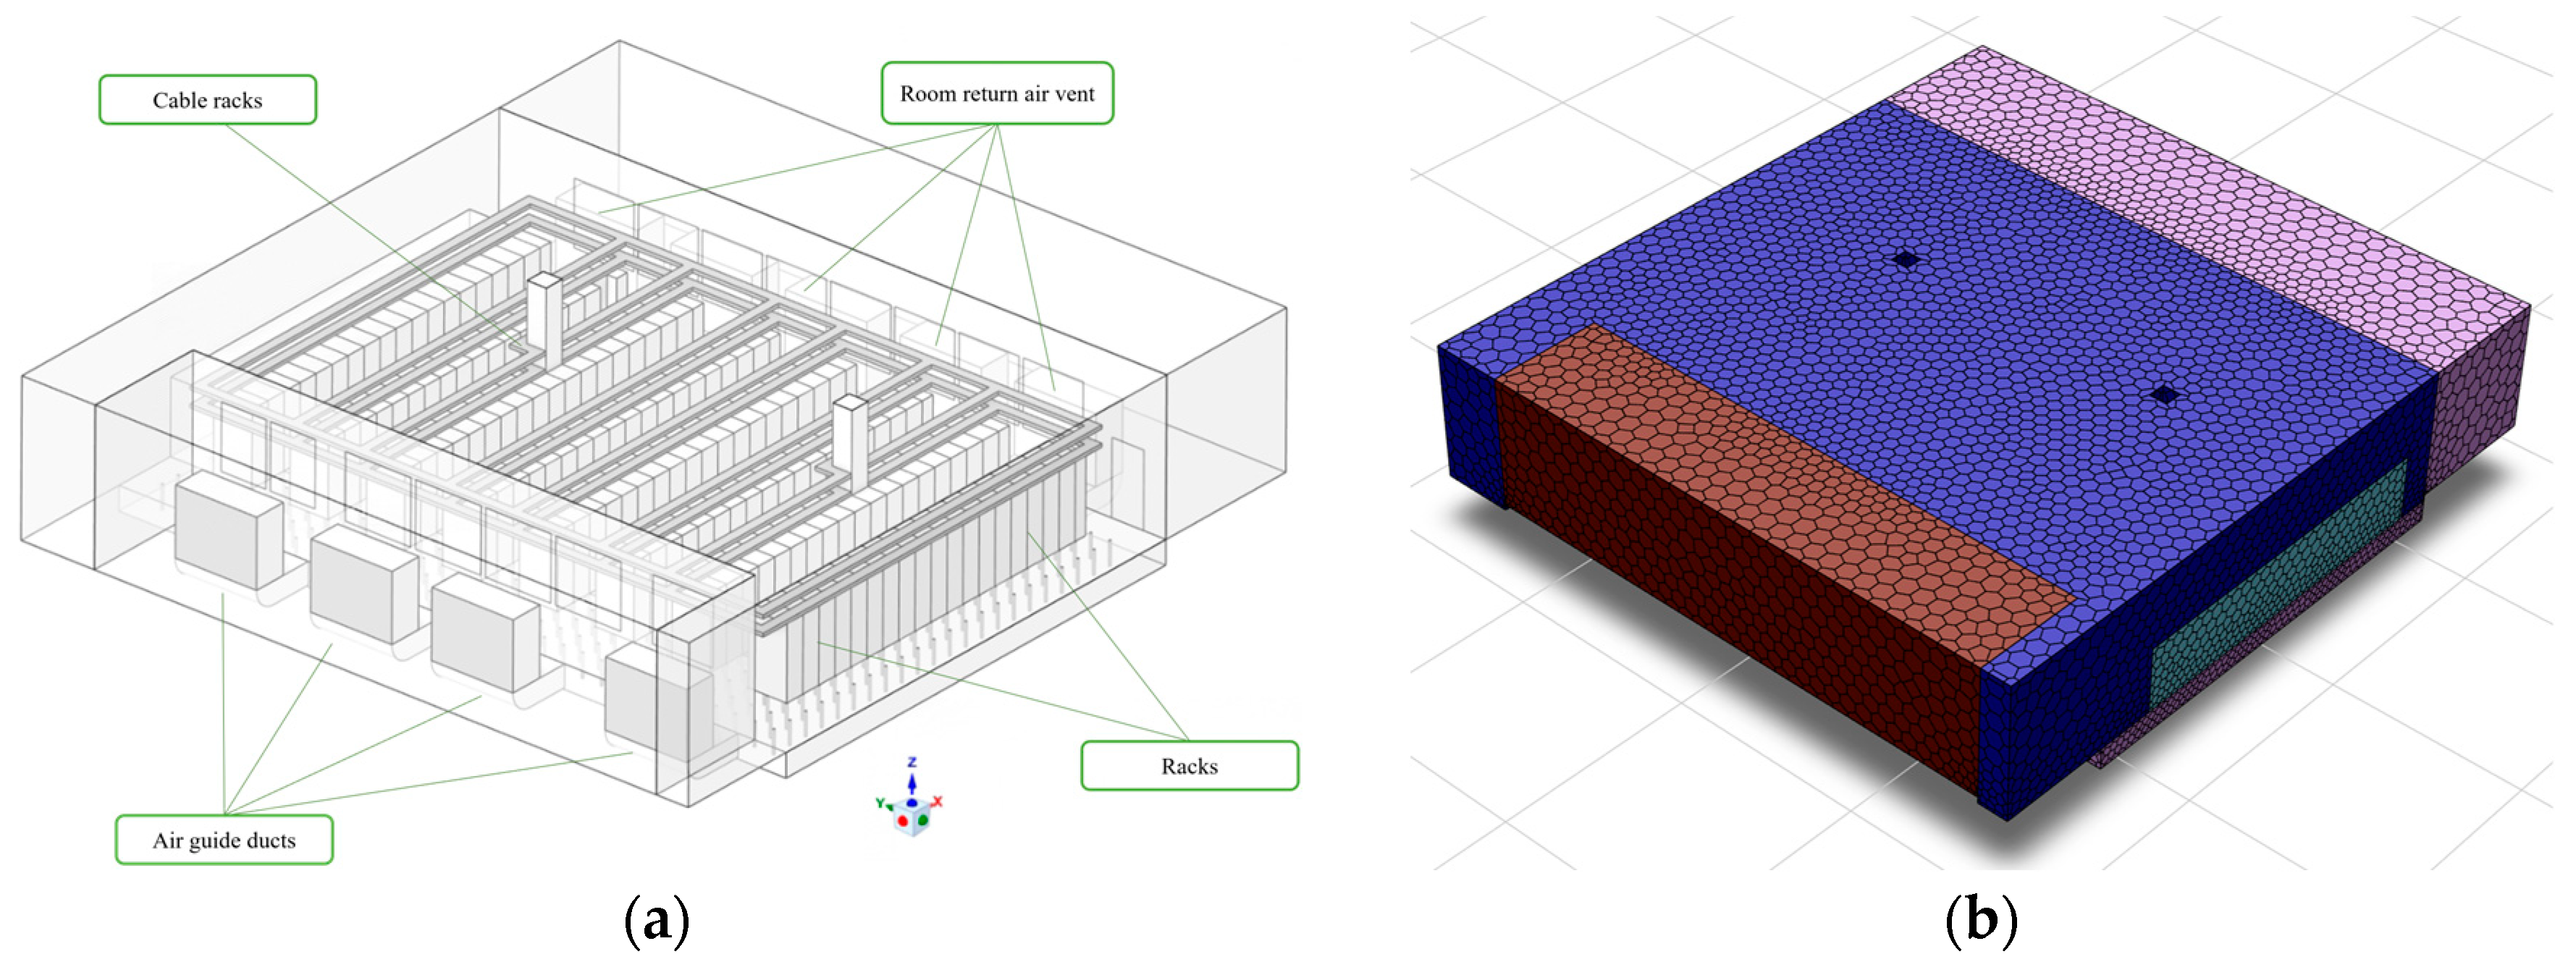
Numerous studies have been conducted to optimize data center airflow and improve thermal environments through experimental testing and numerical simulations. However, most research has focused on single optimization strategies, while combined approaches have received less attention. In operational scenarios, the thermal environment is influenced by multiple factors, including room layout, air conditioning air-flow patterns, server distribution, and heat density. To maintain continuous and stable operation, certain optimization methods prove difficult to implement, such as cooling system modifications or air conditioner layout adjustments. Therefore, ongoing research is still required for thermal environment optimization in existing data centers. A bidirectional airflow server room located in a hot-summer/warm-winter climate zone was selected for investigation in this study. CFD numerical simulations were combined with field measurements to establish a computational model based on actual heat load distributions. The thermal effects of rack blanking panels and cold aisle containment were systematically examined, including both individual implementations and combined strategies. This analysis was conducted to mitigate potential hotspot formation that could compromise equipment reliability. The obtained results provide operational optimization references for energy efficiency improvements in existing data center facilities.
This paper is organized as follows. In Section 2, the data center configuration and experimental methodology are described, with the numerical modeling approach being presented in detail. In Section 3, the numerical model is validated through field measurements, with the existing thermal conditions being completely characterized. In Section 4, optimization strategies are developed, and thermal performance improvements for each design scenario are systematically analyzed. The main research conclusions are summarized in Section 5.

2. Materials and Methods

2.1. Field Experiment

2.1.1. Overview of Data Centers

The data center is located in Guangzhou, Guangdong Province, China (23°10′ N, 113°45′ E). The room dimensions are 20.95 m (length) × 23.40 m (width) × 5.2 m (height), with a raised floor height of 0.7 m and a floor-to-ceiling clearance of 4.5 m. The IT equipment room covers an area of 502.3 m2, with a ceiling height of 4.5 m and a raised floor height of 0.7 m. The large air-conditioning room occupies 94.3 m2, while the small air-conditioning room measures 64.8 m2. The IT equipment room and the two adjacent air-conditioning rooms are separated by interior walls.
A total of nine Computer Room Air Conditioning (CRAC) units are installed on both sides of the data center, with seven units operating continuously and two units kept on standby. The airflow organization follows an underfloor supply and side-return configuration, where cold air is delivered into the raised-floor plenum of the IT equipment room through curved air ducts at the bottom of the CRAC units. Hot air is returned to the top of the CRAC units via return air openings in the interior walls. Each CRAC unit has a rated power of 6.4 kW and a rated airflow of 34,800 m3/h.
The data center houses 142 racks, arranged in eight rows. The servers inside the racks include 1 U, 2 U, 10 U, and 15 U configurations. A Power Distribution Unit (PDU) is installed at the end of each rack row. The racks are arranged in a cold aisle/hot aisle containment layout, with both cold and hot aisles having a width of 1.2 m. The perforated floor tiles in the cold aisles measure 0.6 m × 0.6 m, with a porosity of 36%. Figure 1 shows the overall layout of the data center.

2.1.2. Experimental Scheme

The design criteria require that the temperature in the cold aisle or cabinet air intake area of a data center should be maintained at 18–27 °C, with relative humidity ≤60% and fewer than 17,600,000 suspended particles per cubic meter with a diameter of ≥0.5 μm. This paper primarily focuses on temperature parameters because of the favorable humid environment and air quality in this data center [29].
Field measurements were conducted during stable operation periods of the data center. Due to equipment safety constraints, large-scale field testing could not be performed. Based on the on-site conditions, the AA and AH rack rows were selected as test subjects because they lacked empty racks and their exhaust vents faced the walls, minimizing temperature interference from other racks.
Figure 2a,b shows the distribution of temperature measuring points. Temperature measurements were taken at the inlet and outlet of the AA and AH rack rows using temperature sensors. The measurement points were positioned at heights of 0.5 m, 1.2 m, and 1.8 m above the floor, aligned with the rack centerline and 0.05 m away from the rack surface, totaling 72 temperature measurement points. Figure 2c shows the distribution of velocity measuring points. The airflow velocity through the perforated tiles in the AA and AH rows was obtained using an anemometer, totaling 144 measurement points.
The actual power consumption of each rack was acquired from the power distribution units (PDUs), while operational parameters such as the CRAC supply air temperature and fan demand were retrieved from the environmental control system. Table 1 shows the specifications of the testing instruments.

2.2. Numerical Simulation

2.2.1. Governing Equations

All fluid flow processes are governed by the conservation laws of mass, momentum, and energy. The corresponding mathematical models for these physical laws are given by the governing Equations (1)–(5).
For incompressible fluids, the mass conservation equation is expressed as follows [10]:
u x + v y + ω z = 0
The momentum conservation equations are formulated as follows [10]:
u t + u u x + v u y + ω u z = 1 ρ p x + μ ( 2 u x 2 + 2 u y 2 + 2 u z 2 ) + S u
v t + u v x + v v y + ω v z = 1 ρ p y + μ ( 2 v x 2 + 2 v y 2 + 2 v z 2 ) + S v
ω t + u ω x + v ω y + ω ω z = 1 ρ p z + μ ( 2 ω x 2 + 2 ω y 2 + 2 ω z 2 ) + S ω
The energy conservation equation is expressed as follows [10]:
ρ ( T t + u T x + v T y + ω T z = λ c p ( 2 T x 2 + 2 T y 2 + 2 T z 2 ) + S T
where ρ is the fluid density, kg/m3; u , υ , and ω represent the velocity vector components in the Cartesian coordinate system’s x, y, and z directions, respectively (m/s); p is the time-averaged pressure, Pa; and S u , S v , and S ω signify the generalized source terms in the Cartesian coordinate system. For incompressible homogeneous fluids, these terms can be neglected; T is temperature, K; λ is transfer coefficient, W/(m2·K); c p is specific heat capacity of air, J/(kg·K); and S T is the viscous dissipation term.
Due to the complex geometry, equipment layout, and boundary conditions in data centers, the airflow organization within server rooms typically exhibits turbulent flow characteristics. In numerical simulations of data center environments, the standard k-ε turbulence model demonstrates good applicability and has been widely adopted, as represented by Equations (6)–(8).
The transport equation for turbulent kinetic energy (k) is formulated as follows [30]:
ρ k t + ρ u i k x i = x i μ + μ t σ k k x i + G k + G b ρ ε
The transport equation for the turbulent dissipation rate (ε) is expressed as [30]:
ρ ε t + ρ u i ε x i = x i μ + μ t σ ε ε x i + C 1 ε ε k G k + C 3 ε G b C 2 ε ρ ε 2 k
where G k is turbulence kinetic energy production due to mean velocity gradients; G b is turbulence kinetic energy generation due to buoyancy; σ k is the turbulent Prandtl number for the k-equation; σ ε is the turbulent Prandtl number for the ε-equation; and C 1 ε , C 2 ε , and C 3 ε are empirical model constants.
Finally, the turbulent viscosity is expressed as [30]:
μ t = ρ C μ k 2 ε
where C μ is an empirical constant (standard value 0.09).

2.2.2. Simplification Assumptions

Full-scale three-dimensional modeling of the data center room was avoided to prevent excessive computational nodes and grid elements, which would significantly increase temporal costs. Figure 3a shows the original computer room model. The physical model was constructed using SpaceClaim, where all room geometries were simplified as cuboids to reduce simulation complexity. Structural columns and cable trays that may affect airflow distribution were modeled at their actual locations. To decrease computation time, the following assumptions were applied to the physical model:
(1) The data center enclosure was assumed to be well-sealed, with pressure variations small enough to satisfy the Boussinesq approximation.
(2) The airflow was treated as an incompressible fluid.
(3) The interior walls were considered thermally insulated, rendering heat transfer through building envelopes negligible.
(4) IT equipment power was modeled as time-invariant, with constant heat dissipation rates maintained throughout simulations.
Figure 3b presents the computational mesh. Polyhedral meshing was performed using the meshing module of ANSYS Fluent 2021R1, resulting in 6,972,368 total cells.

2.2.3. Boundary Conditions

The numerical model in this study was established based on the actual dimensions of the computer room, with boundary conditions consistent with those of the real data center. All walls were treated with a no-slip condition and set as adiabatic surfaces.
Figure 4 illustrates the boundary conditions of the rack model. According to the actual server arrangement characteristics, the internal space of the rack was partitioned using zero-thickness solid planes. The outer panel of the rack exhaust zone was modeled as a porous jump, while the equipment placement area was used to define the location and magnitude of heat sources in the data center.
For equipment zones without servers, the intake surface was configured as a porous jump boundary, and the exhaust surface was set as a free-flow interface to allow for unimpeded air passage. Any enclosed intake panels were specified as adiabatic walls. In populated equipment zones, the aggregated IT equipment power dissipation was represented as volumetric heat sources. Table 2 presents the measured power consumption for each rack. Table 3 summarizes all boundary conditions for the data center.

2.3. Thermal Metric

Three thermal performance metrics are commonly used to evaluate bypass airflow and recirculation in data centers: the Return Temperature Index (RTI), Supply Heat Index (SHI), and Rack Cooling Index (RCI). Among these, SHI can be applied for both room-level and row-level assessments. RTI assessed CRAC airflow adequacy, SHI evaluated cooling air supply efficiency, and RCIHI quantified compliance with ASHRAE thermal guidelines while reflecting rack cooling effectiveness and overall thermal health status. The mathematical definitions of these metrics are provided in Equations (9)–(11) [31,32].
RTI = Δ T CRAC Δ T IT × 100 %
SHI = δ Q δ Q + Q = j i m i c p ( ( T in s ) i , j T CRAC , supply ) ) j i m i c p ( ( T out s ) i , j T CRAC , supply ) )
RCI HI = [ 1 ( T in s T r , max ) T in s > T r , max ( T a , max T r , max ) n ] × 100 %
where Δ T CRAC is the average temperature difference between the supply and return air of the CRAC units, °C; Δ T IT is the average temperature difference between the inlet and exhaust air of server racks, °C; m i is the mass flow rate of inlet air to server racks, kg/s; c p is the specific heat capacity of air, J/(kg·°C); T in s is the inlet air temperature of server racks, °C; T out s is the outlet air temperature of server racks, °C; T r , max is the recommended upper limit temperature for the data room, 27 °C; T a , max is the allowable maximum temperature for the data rooms, 32 °C; and n is the number of server rack inlet openings.

3. Results

3.1. Model Validation

To validate whether the model meets engineering practice requirements, the floor outlet air velocity data at corresponding locations were obtained through numerical simulation. The actual floor outlet air flow rate was then calculated from the measured outlet velocity values, as shown in Equation (12).
Q = C 1 Q r β 3600
where Q is the actual air supply volume of the CRAC unitm3/s; C 1 is the flow coefficient, taken as 0.95 in this study; Q r is the rated airflow capacity, m3/h; and β is the fan speed demand, a dimensionless constant.
Figure 5a presents the airflow comparison at the perforated tiles in rows AA and AH. The simulated airflow rates demonstrate close agreement with measured data. The maximum observed deviation between simulated and measured floor airflow rates was 0.029 m3/s, with relative errors ranging from 0.25% to 16.17% and a mean relative error of 4.28%.
Figure 5b displays the temperature comparison at both the inlet and outlet of the server racks. Both simulated and measured temperatures exhibit consistent variation trends. For cabinet inlet temperatures, the maximum relative error is found to be between 0.28% and 8.33%, with an average of 3.11%. The outlet temperature comparison shows maximum relative errors ranging from 0.08% to 13.89%, with an average relative error of 2.92%.
To further evaluate model validity, the Mean Bias Error (MBE) and Root Mean Square Error (RMSE) metrics were introduced. Smaller MBE and RMSE values indicate higher model prediction accuracy. The calculation equations are shown in (13) and (14) [33].
MBE = 1 n i = 1 n ( y ^ i y i )
RMSE = 1 n i = 1 n ( y ^ i y i ) 2
where y ^ i represents the i-th simulated value, y i denotes the i-th measured value, and n is the number of data points.
The calculated MBE for floor airflow rate was −0.001 m3/s with an RMSE of 0.011 m3/s. For cabinet inlet temperature, the MBE reached 0.70 °C, and the RMSE was 0.92 °C. The outlet temperature showed an MBE of 0.67 °C and RMSE of 1.46 °C. All values remained within acceptable ranges.
Several factors contributed to the observed deviations. Personnel movement during measurements caused airflow disturbances. Additionally, simplifications were made in the CFD modeling process, including the omission of server cabling and internal cabinet structures. Despite these limitations, the simulated and measured values exhibited consistent trends for both airflow rates and temperatures. The developed data center model demonstrates sufficient accuracy for subsequent engineering simulations and design optimization studies.

3.2. Air Supply Characteristics

The airflow characteristics in the plenum chamber of the bidirectional air supply system are illustrated in Figure 5. As shown in Figure 5a, uneven velocity distribution is observed within the plenum chamber. The airflow streamlines exhibit turbulent patterns under this supply configuration. The CRAC supply air enters the plenum through air ducts at relatively high initial velocities that gradually decay, while non-supply zones maintain lower flow speeds. The airflow from CRAC6 (left side) diverges after colliding with opposing flows from CRAC1 and CRAC2 (right side), generating strong wall-adjacent vortices with their cores proximate to the left-side CRAC units exhibiting lower supply rates. Another air stream intertwines with terminal flows from CRAC2, CRAC3, and CRAC7. The collision between CRAC7 and CRAC3 flows, combined with entrained terminal flow from CRAC4, directs a consolidated stream toward the lower-left zone, simultaneously deflecting CRAC5 airflow toward the wall and forming mid-plenum vortices.
Figure 6b presents the pressure distribution within the plenum, revealing marked spatial heterogeneity. Under the current supply mode, the plenum develops both unidirectional and bidirectional supply zones. Unidirectional zones exhibit higher static pressure at distal regions (5–10 Pa) versus proximal areas near CRAC units. Bidirectional zones demonstrate pressure inversion due to flow collisions, with peak static pressures (6–14 Pa) at collision interfaces flanked by lower-pressure zones, creating steep pressure gradients.
Figure 7 presents the airflow distribution of perforated tiles in each row. Figure 7a shows the airflow distribution trends differ among cold aisles, while the two rows within the same cold aisle exhibit nearly identical variation patterns, indicating non-uniform airflow supply. Cold aisle AB demonstrates higher airflow rates at both ends and lower values in the middle, whereas cold aisles CD, EF, and GH display the opposite trend with higher central airflow and lower values at the ends.
Figure 7b reveals that despite supplemental airflow from other air conditioning units, the average airflow rates of rows AA, AB, AC, and AD in the unidirectional supply zone remain approximately 0.20 m3/s, lower than the 0.25 m3/s average in the bidirectional supply zone. Among these, row AD, closest to the bidirectional supply zone, exhibits the highest average airflow rate. Furthermore, the minimum airflow rates in rows AE and AF of the bidirectional supply zone drop to 0.14 m3/s, significantly below the zonal average, reflecting poor supply air uniformity.
A comparison between Figure 6 and Figure 7 demonstrates a positive correlation between perforated tile airflow rates and underfloor static pressure distribution. Higher static pressure corresponds to increased airflow supply, while abrupt airflow reductions coincide with low-pressure zones induced by vortices.

3.3. Flow Field Distribution

Figure 8 presents the velocity distribution of cross-sections at the front (x = 2.7 m), middle (x = 5.7 m), and rear (x = 8.7 m) of the baseline model. Under the original air supply configuration, the collision between bidirectional airflow from the air conditioning system results in inconsistent perforated tile airflow directions, leading to non-uniform air distribution and chaotic airflow organization, accompanied by severe mixing of cold and hot air. In cold aisles AB and CD, the vertical upward momentum of the airflow from perforated tiles is insufficient at the front, middle, and rear sections of the rack rows, causing the recirculation of server exhaust heat into the cold aisles and impairing cooling effectiveness. In the bidirectional supply zone, cold aisles CD and EF experience excessive airflow at the front section of the rack rows, where cold air escapes from the top of the aisles without fully cooling the servers. At the middle section, the supplied airflow is influenced by the hot exhaust passing through the racks, resulting in cooling capacity loss and temperature rise. At the rear section, insufficient air supply is observed, and due to the higher power consumption of rear servers, the increased exhaust airflow leads to significant hot air accumulation in the upper part of the room under buoyancy effects, further exacerbating hot air recirculation. Additionally, a portion of cold air bypasses the racks through unoccupied spaces and enters the hot aisles, contributing to cooling capacity wastage.

3.4. Temperature Distribution

Figure 9 displays the temperature contour plots at the lower (z = 0.5 m), middle (z = 1.2 m), and upper (z = 1.8 m) layers of the baseline model. The temperature distribution is observed to range between 19 °C and 32 °C. Horizontally, the ambient temperature on the left side is found to be consistently lower than that on the right side, resulting from the counter-flow pattern between cold and hot air streams. Vertically, a distinct thermal stratification is exhibited in the cold aisles. In the lower layer, where cold air supply remains relatively sufficient, the cold aisle temperatures are maintained at approximately 20 °C, with slightly elevated temperatures detected at both ends due to hot air recirculation. In the middle layer, temperature increases exceeding 24 °C are observed across extensive areas of cold aisles, attributed to hot air infiltration through unoccupied rack spaces and top gaps under pressure differentials. The upper layer demonstrates further reduction in temperature differentials between cold and hot aisles, with the characteristic blue zone in cold aisle C-AB nearly disappearing and approaching thermal equilibrium with adjacent hot aisles. It is concluded that the current configuration suffers from significant cold and hot air mixing and improper airflow management, leading to compromised cooling effectiveness for rack-mounted servers.

4. Airflow Organization Optimization

4.1. Airflow Optimization Strategies

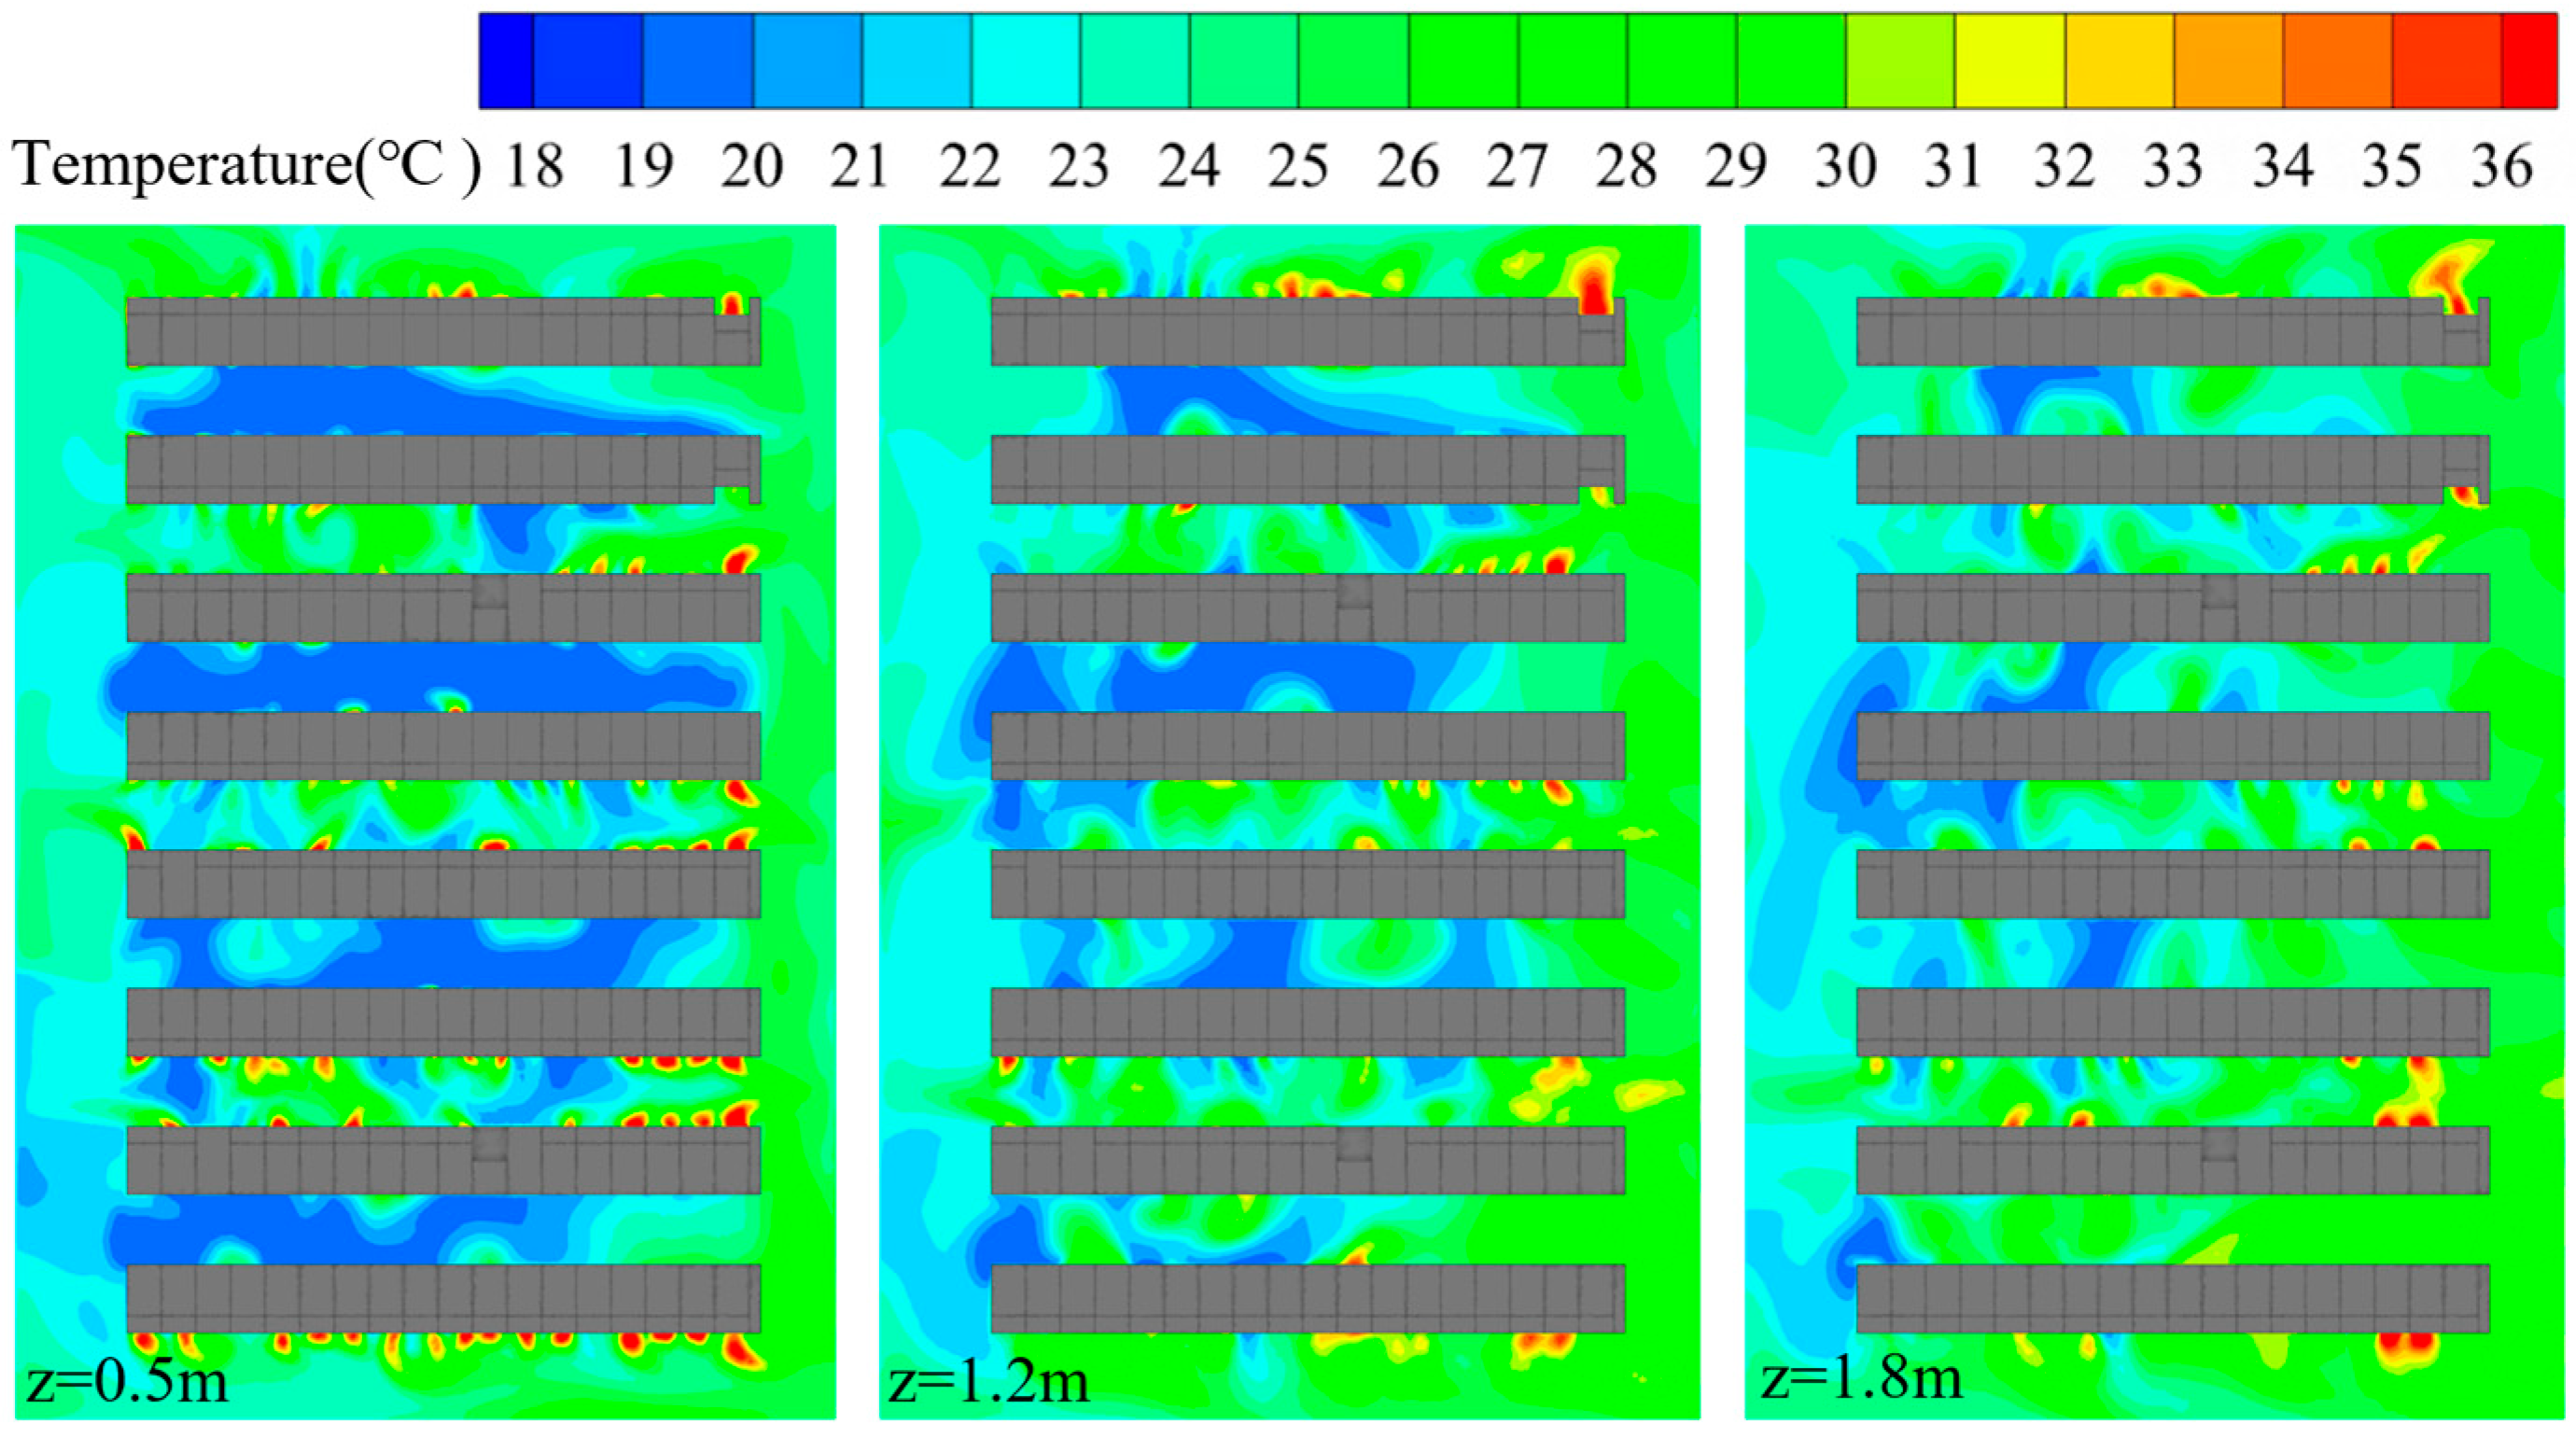
An analysis of the numerical simulation results in Section 3 reveals that the original data center exhibits non-uniform air supply, leading to severe thermal recirculation and cold air bypassing within server racks and cold aisles. These issues result in uneven temperature distribution at the rack inlets and the formation of numerous hotspots throughout the facility.
From a practical application perspective, this study proposes the airflow optimization strategies presented in 
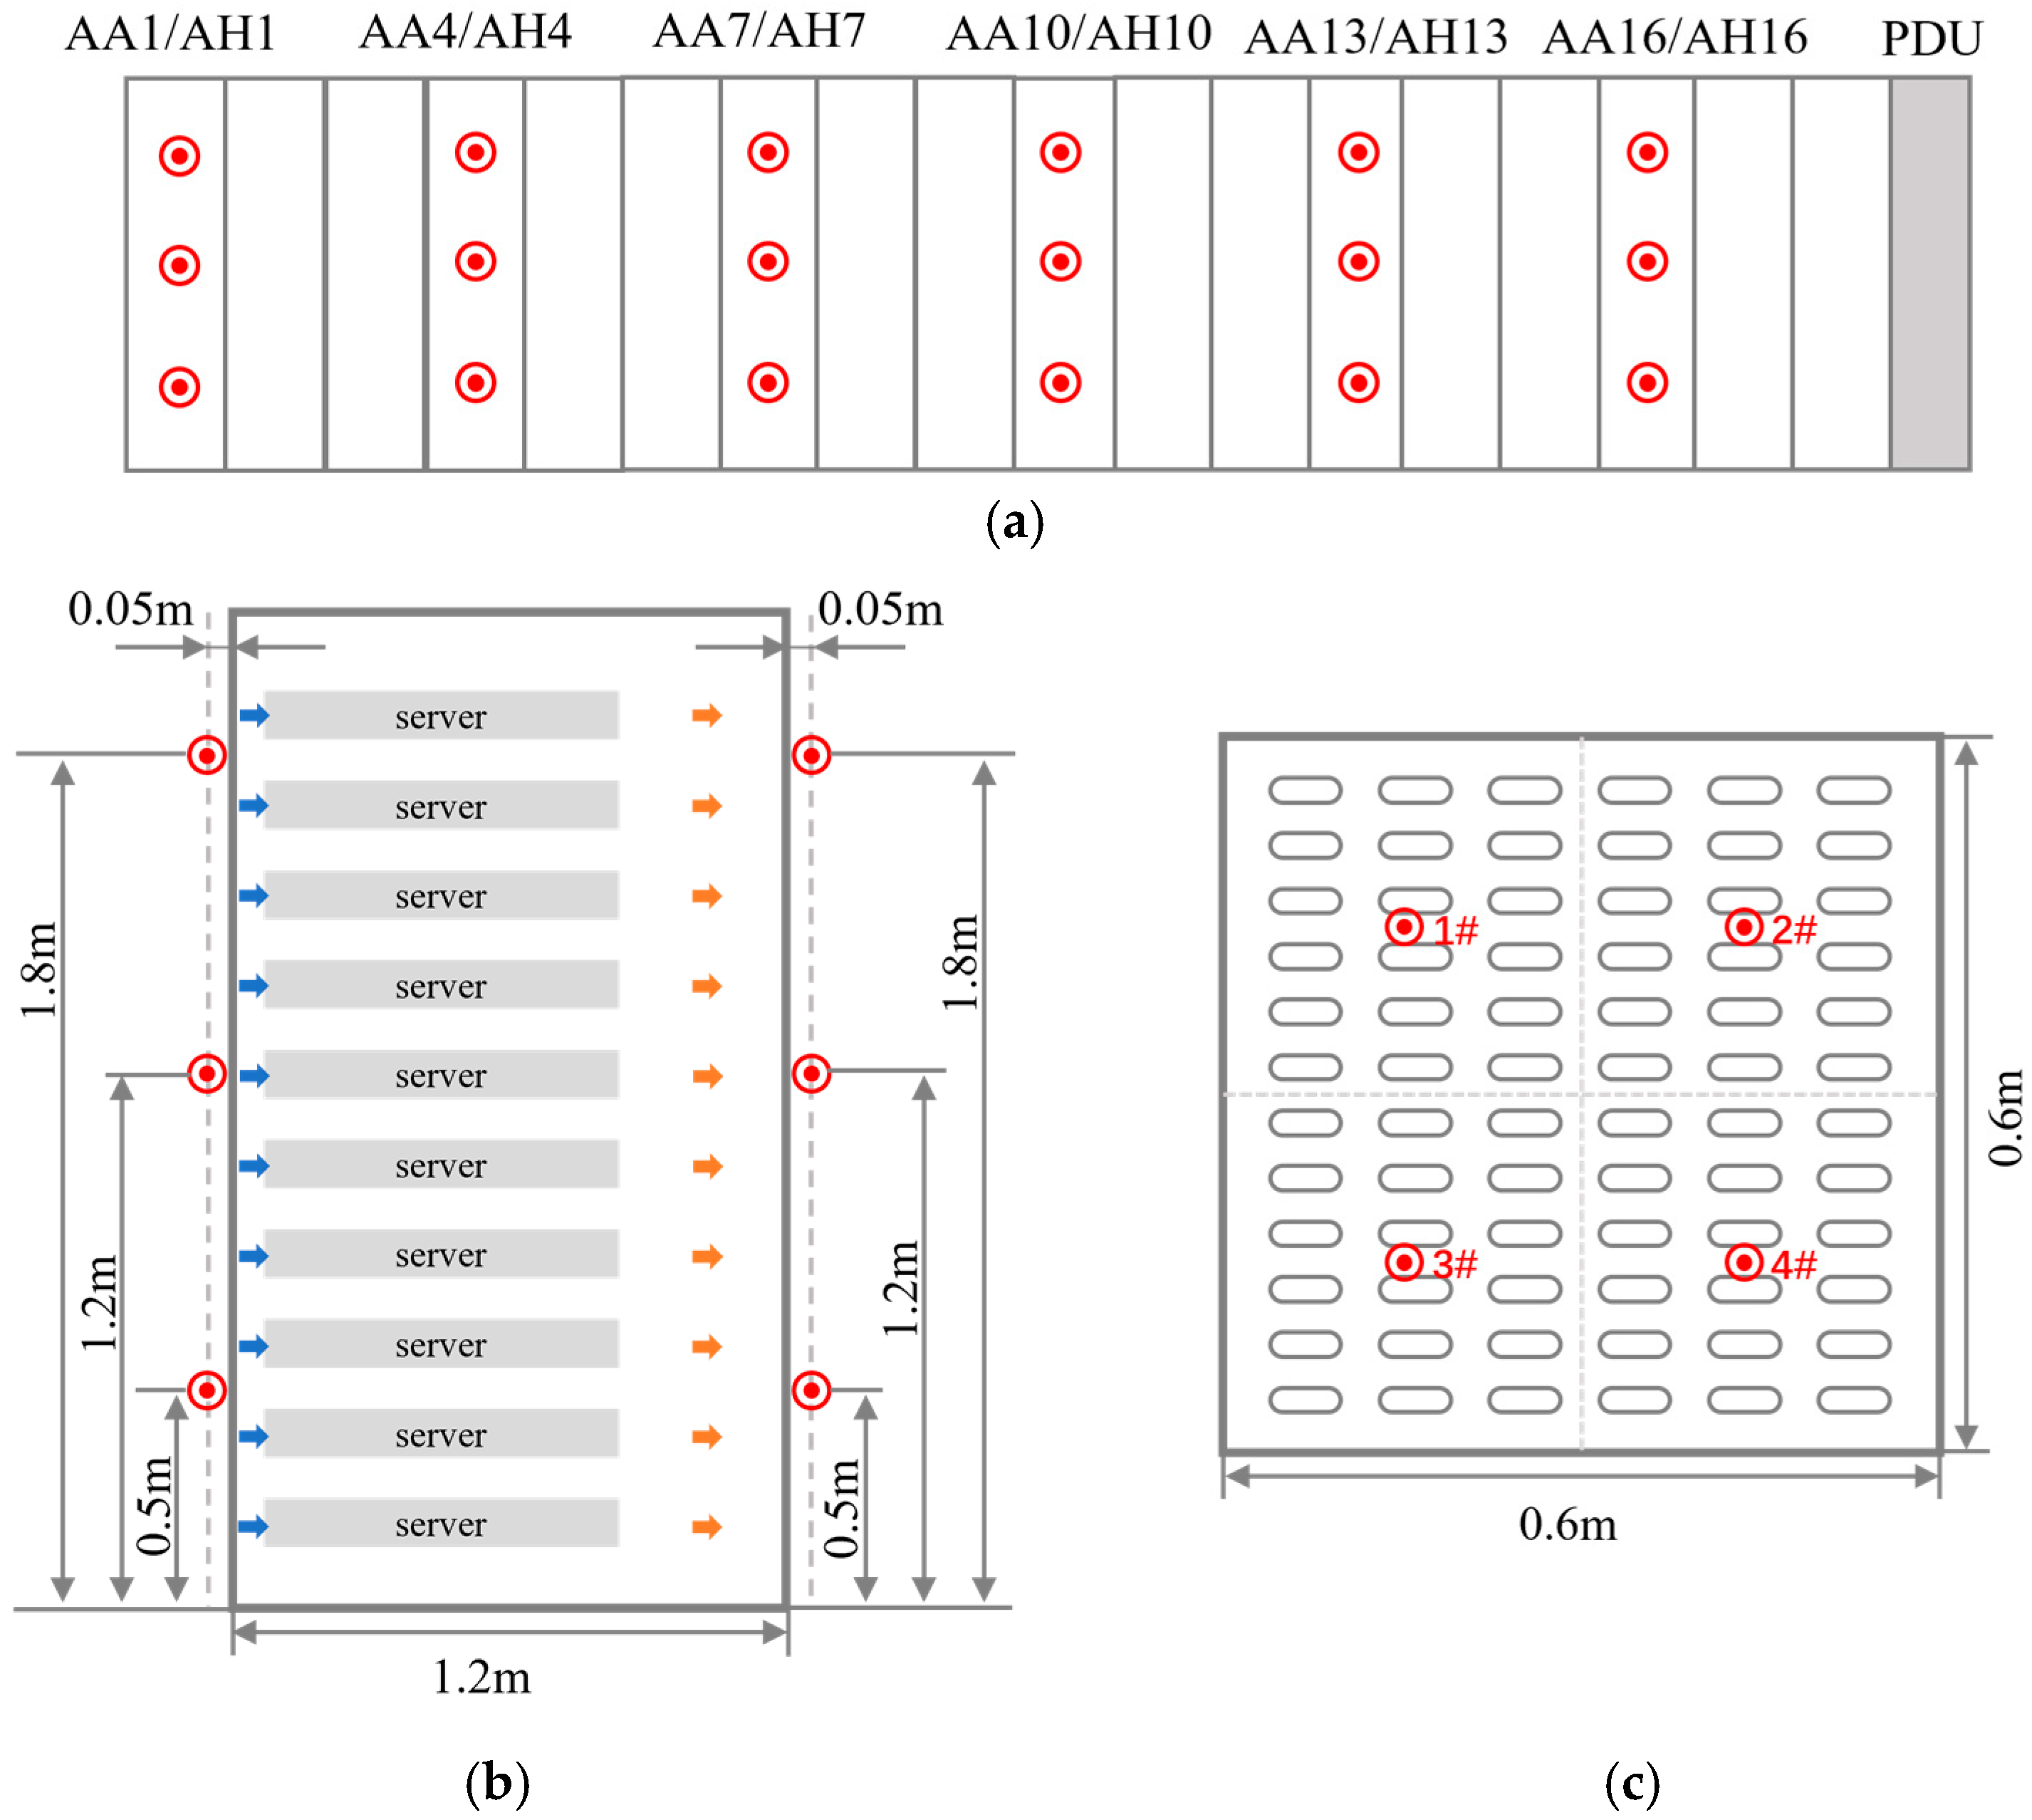
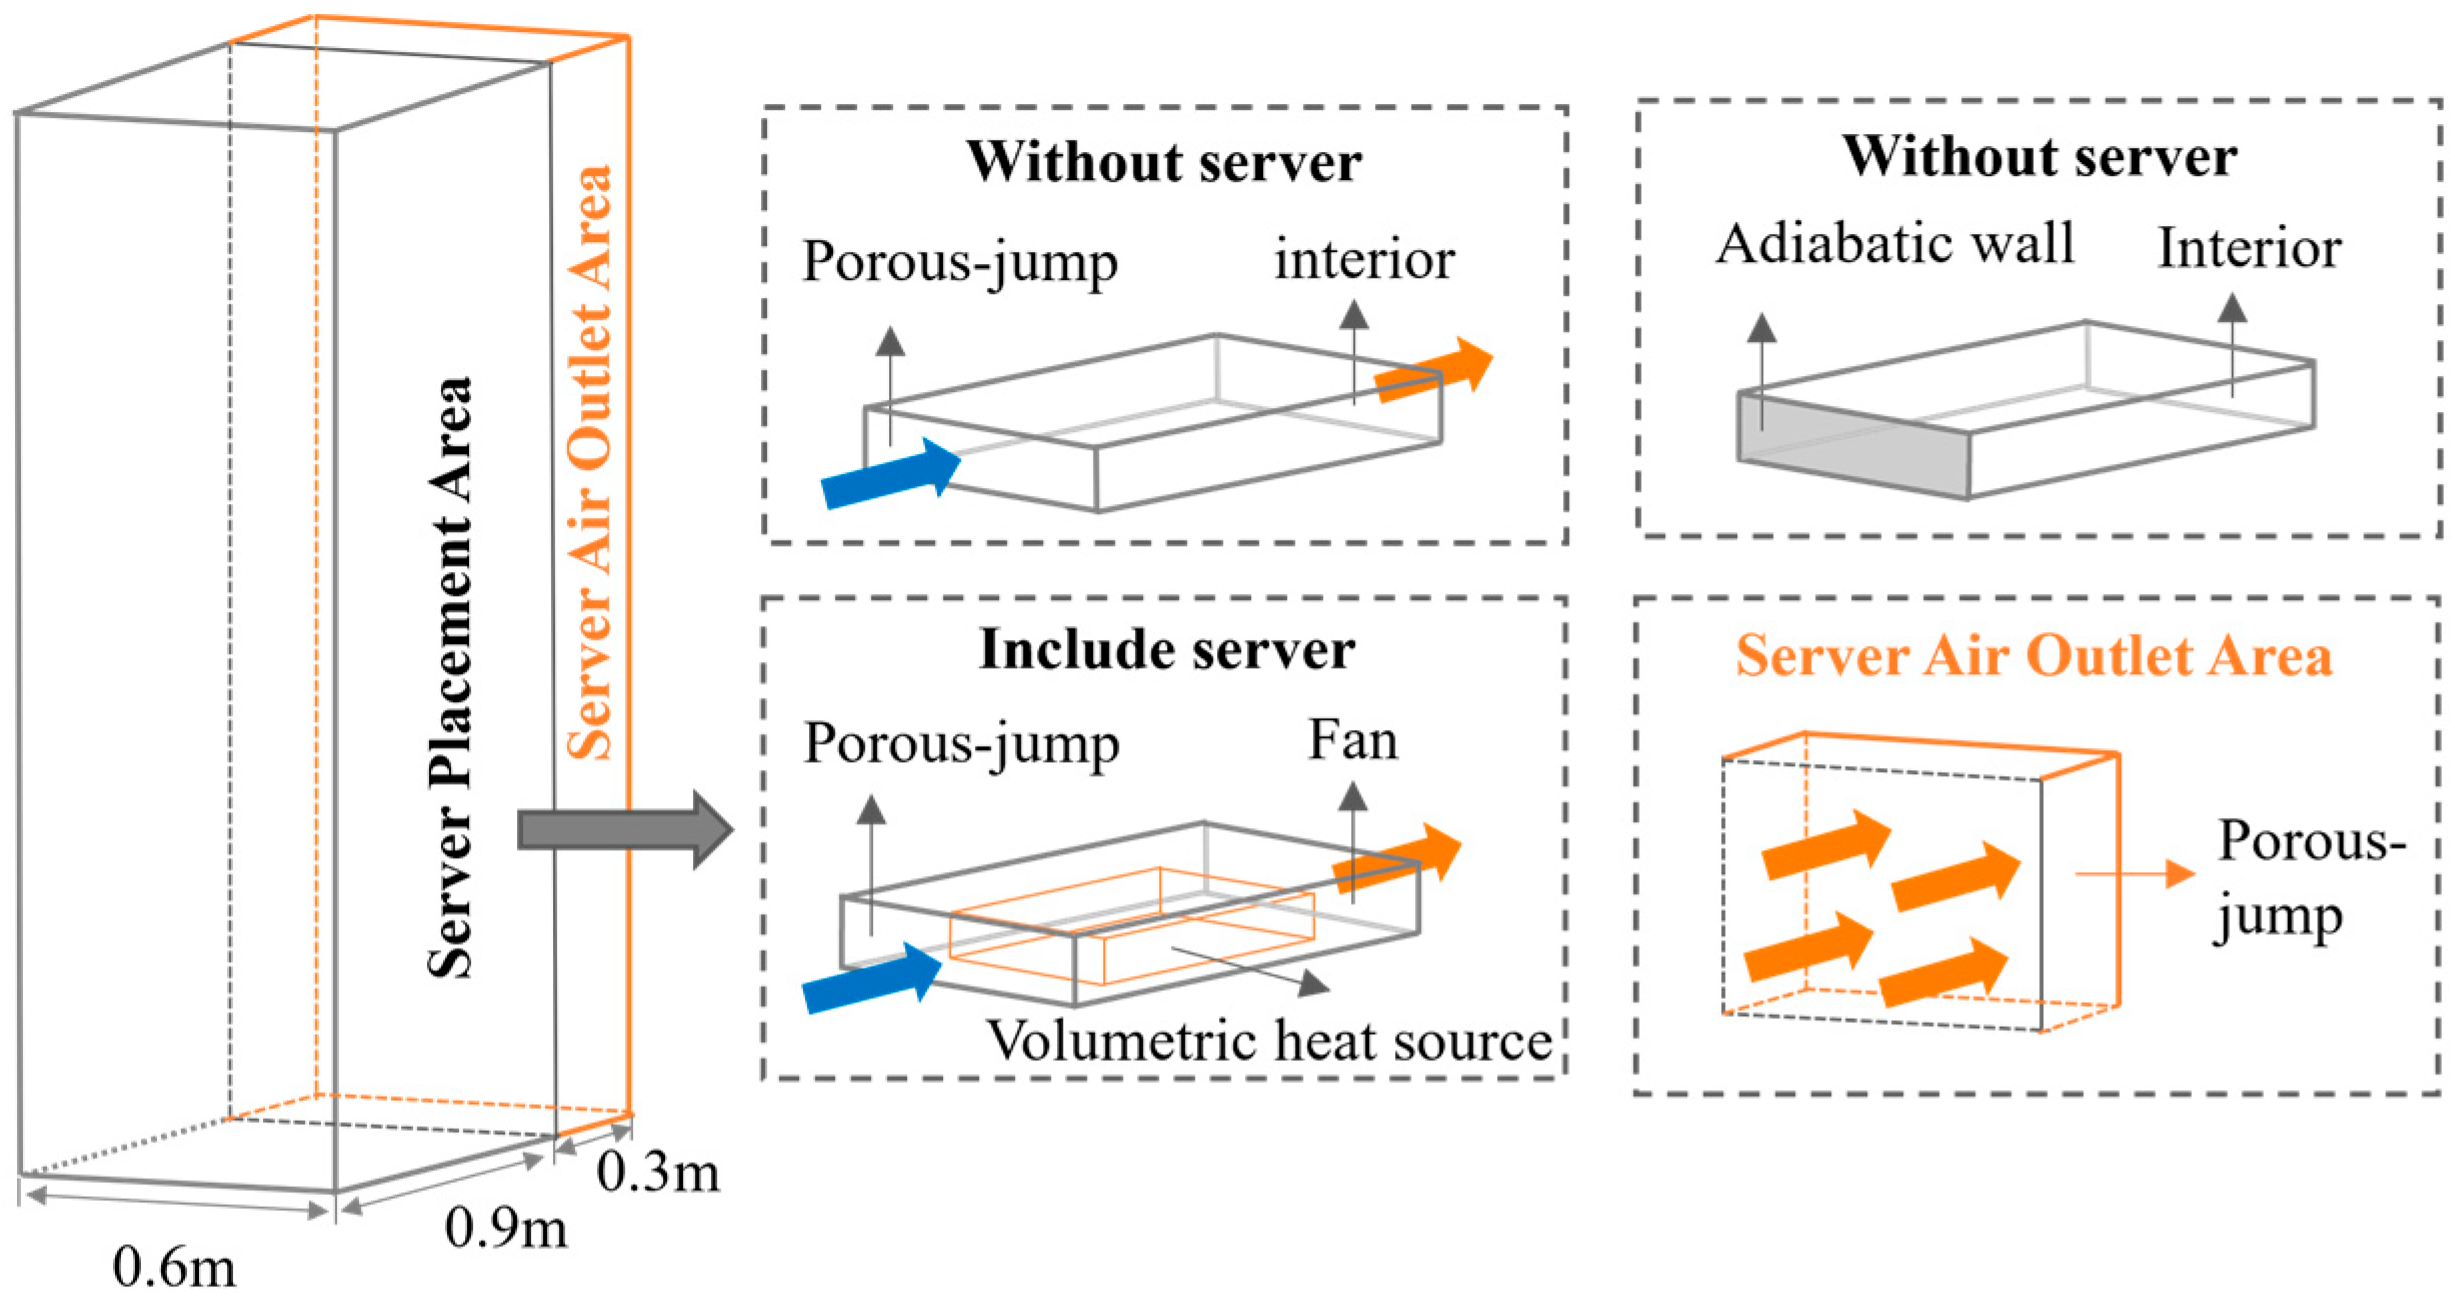
Table 4. In this data center, servers vary in type, specification, and physical dimensions. To standardize server arrangement, operational personnel position all servers close to the intake-side rails during installation, creating varying distances between server rear panels and exhaust-side rack doors. Consequently, when implementing the blanking panel strategy for unoccupied rack spaces, only the intake-side openings are sealed. All boundary conditions, including the air supply parameters of CRAC units and heat source configurations, remain consistent with the original model to ensure comparability.

4.2. Analysis of the Optimized Data Center Flow Field

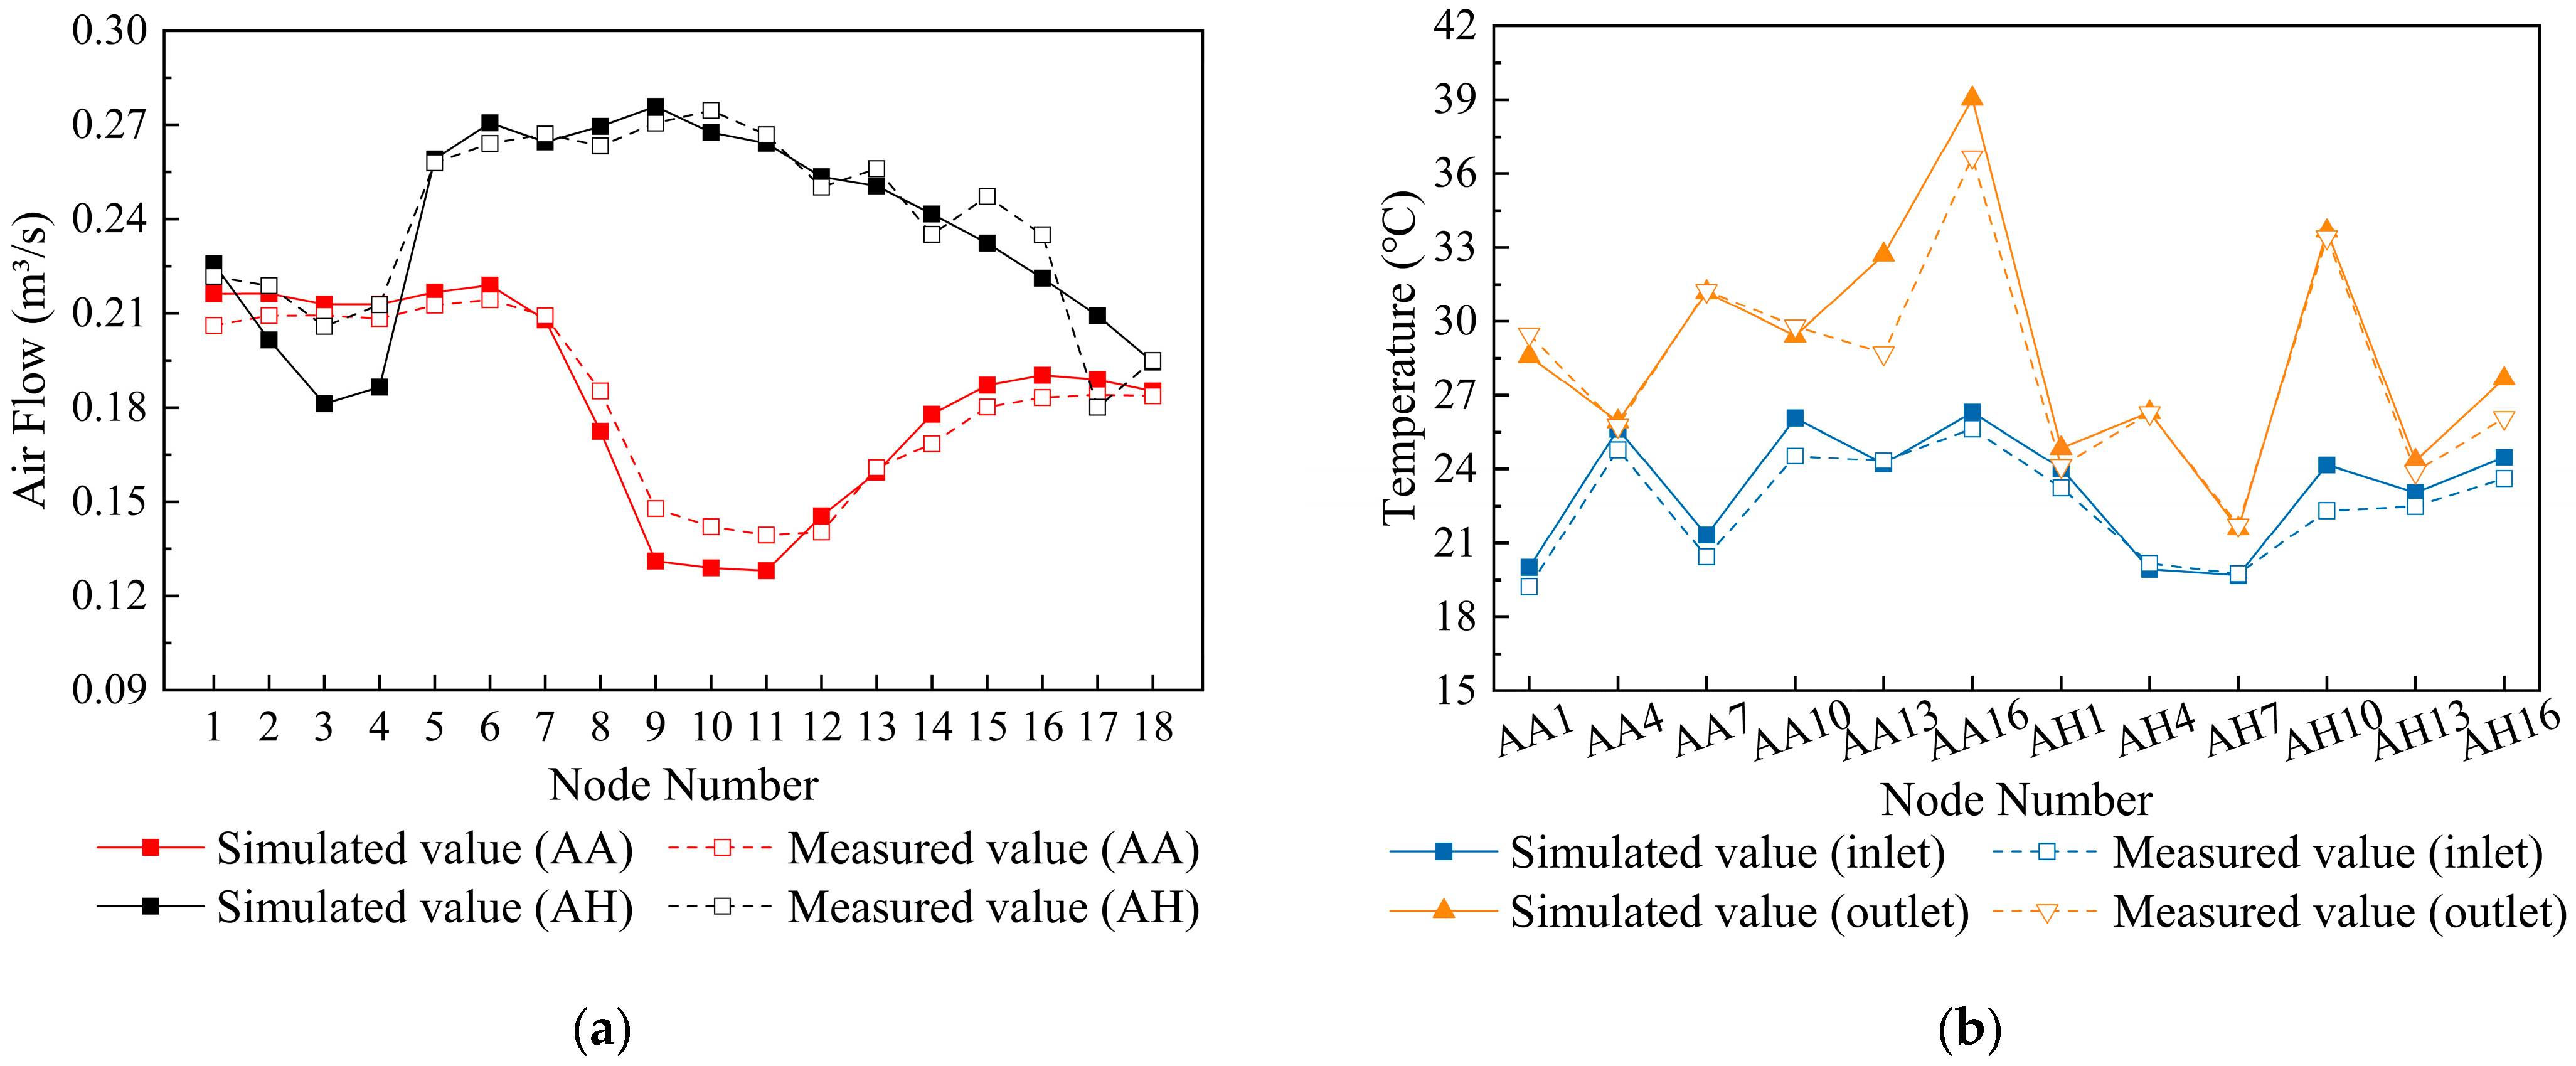
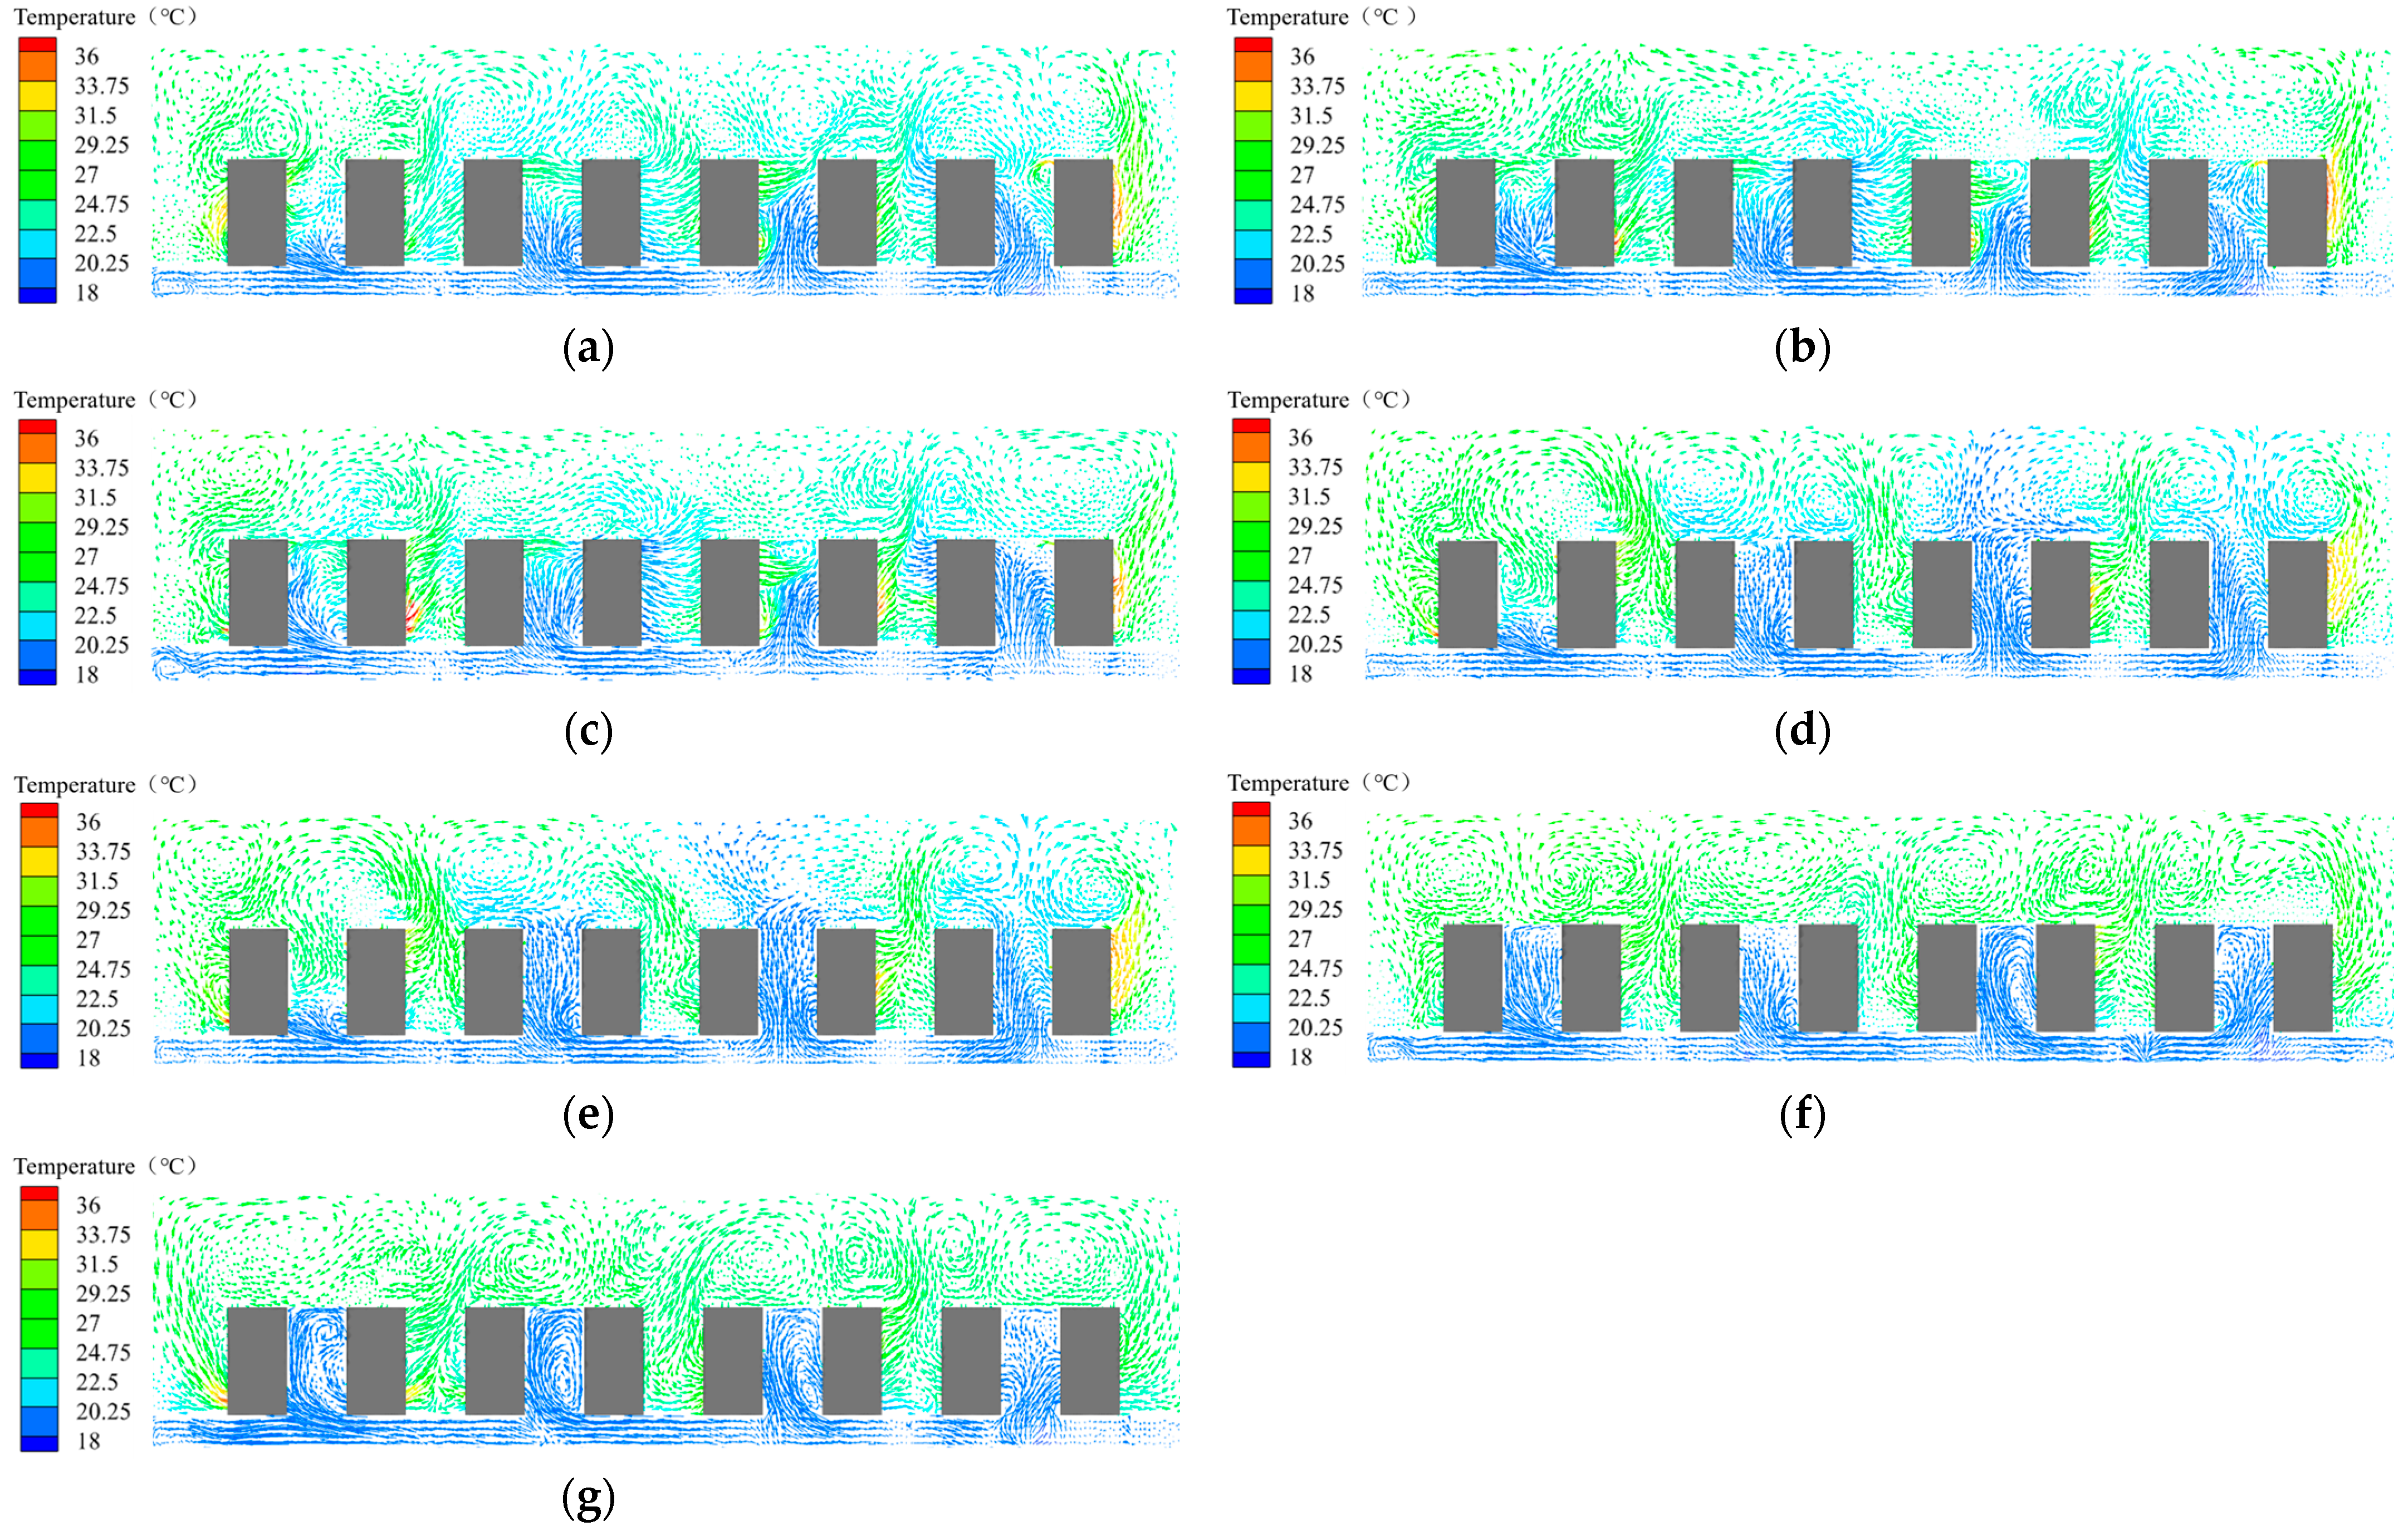
Figure 10 presents the velocity distributions at the mid-section (x = 5.7 m) of the rack rows under different optimization strategies compared with the baseline model.
Case1 demonstrates negligible influence on the airflow patterns in the central zone of the computer room.
Case2 effectively isolates the hot air recirculation from the aisle top while confining the rack-induced hot air reflux within the cold aisles. Concurrently, the cold airflow increases in both cold side aisles AB and GH at this cross-section, while excessive cold airflow in cold aisle CD bypasses into adjacent hot aisles through rack gaps.
Case3, when compared to Case2, shows no improvement in addressing the reflux issue through unoccupied rack spaces, with severe cold–hot air mixing persisting.
Case4 demonstrates that the underfloor air supply in cold aisles CD and EF is no longer obstructed by rack exhaust flows, enabling effective delivery to the aisle tops without significant temperature rise. However, excessive cold air escaping from the cold aisles mixes with hot air in the upper space, resulting in cooling capacity loss. Furthermore, cold aisle AB shows insufficient cold air supply, failing to effectively mitigate the hot air recirculation phenomenon in its upper section. In cold aisle GH, the vertical travel distance of perforated tile airflow increases, partially alleviating upper-level hot air recirculation and consequently improving cooling efficiency for upper rack servers. The blanking panel installation prevents localized recirculation of rack exhaust through rack gaps. Instead, the heated air rises to the ceiling under buoyancy effects, forming intense vortex fields when obstructed by the overhead structure.
In the combined optimization strategies, all configurations incorporate the blanking panel installation at rack intake sides, which effectively segregates the internal airflow paths between cold and hot streams within the server racks. This implementation results in more distinct airflow streamline distributions throughout the aisles.
Compared with Case4, Case5 demonstrates no significant improvement in airflow organization patterns, showing persistent hot air recirculation at the top of the racks in both cold aisle AB and cold aisle GH without observable mitigation.
Case6 effectively isolates the recirculated hot airflow from the upper sections of cold aisles AB and GH, enabling the unobstructed delivery of cold airflow to the mid–upper portions of the aisles, thereby achieving efficient server cooling. Furthermore, this solution addresses the cold airflow bypass issues at the tops of cold aisles CD and EF. The analysis reveals a reduction in floor-supplied airflow volume in cold aisle CD at this cross-section, while the excess cold air in cold aisle EF deflects upon reaching the aisle top and redistributes to other regions of the cold aisle.
Case7 achieves complete isolation between cold and hot air streams in the computer room. The pressure drop in the cold aisle increases, optimizing pressure distribution in the plenum. This enhancement improves cold airflow redistribution within the plenum, producing more uniform air supply distribution across aisles. As shown in Figure 10g, reduced airflow rates are measured at the floor vents in cold aisles EF and GH (bidirectional zone), while increased rates are recorded at vents in cold aisles AB and CD of the unidirectional airflow zone.

4.3. Analysis of the Optimized Data Center Temperature Distribution

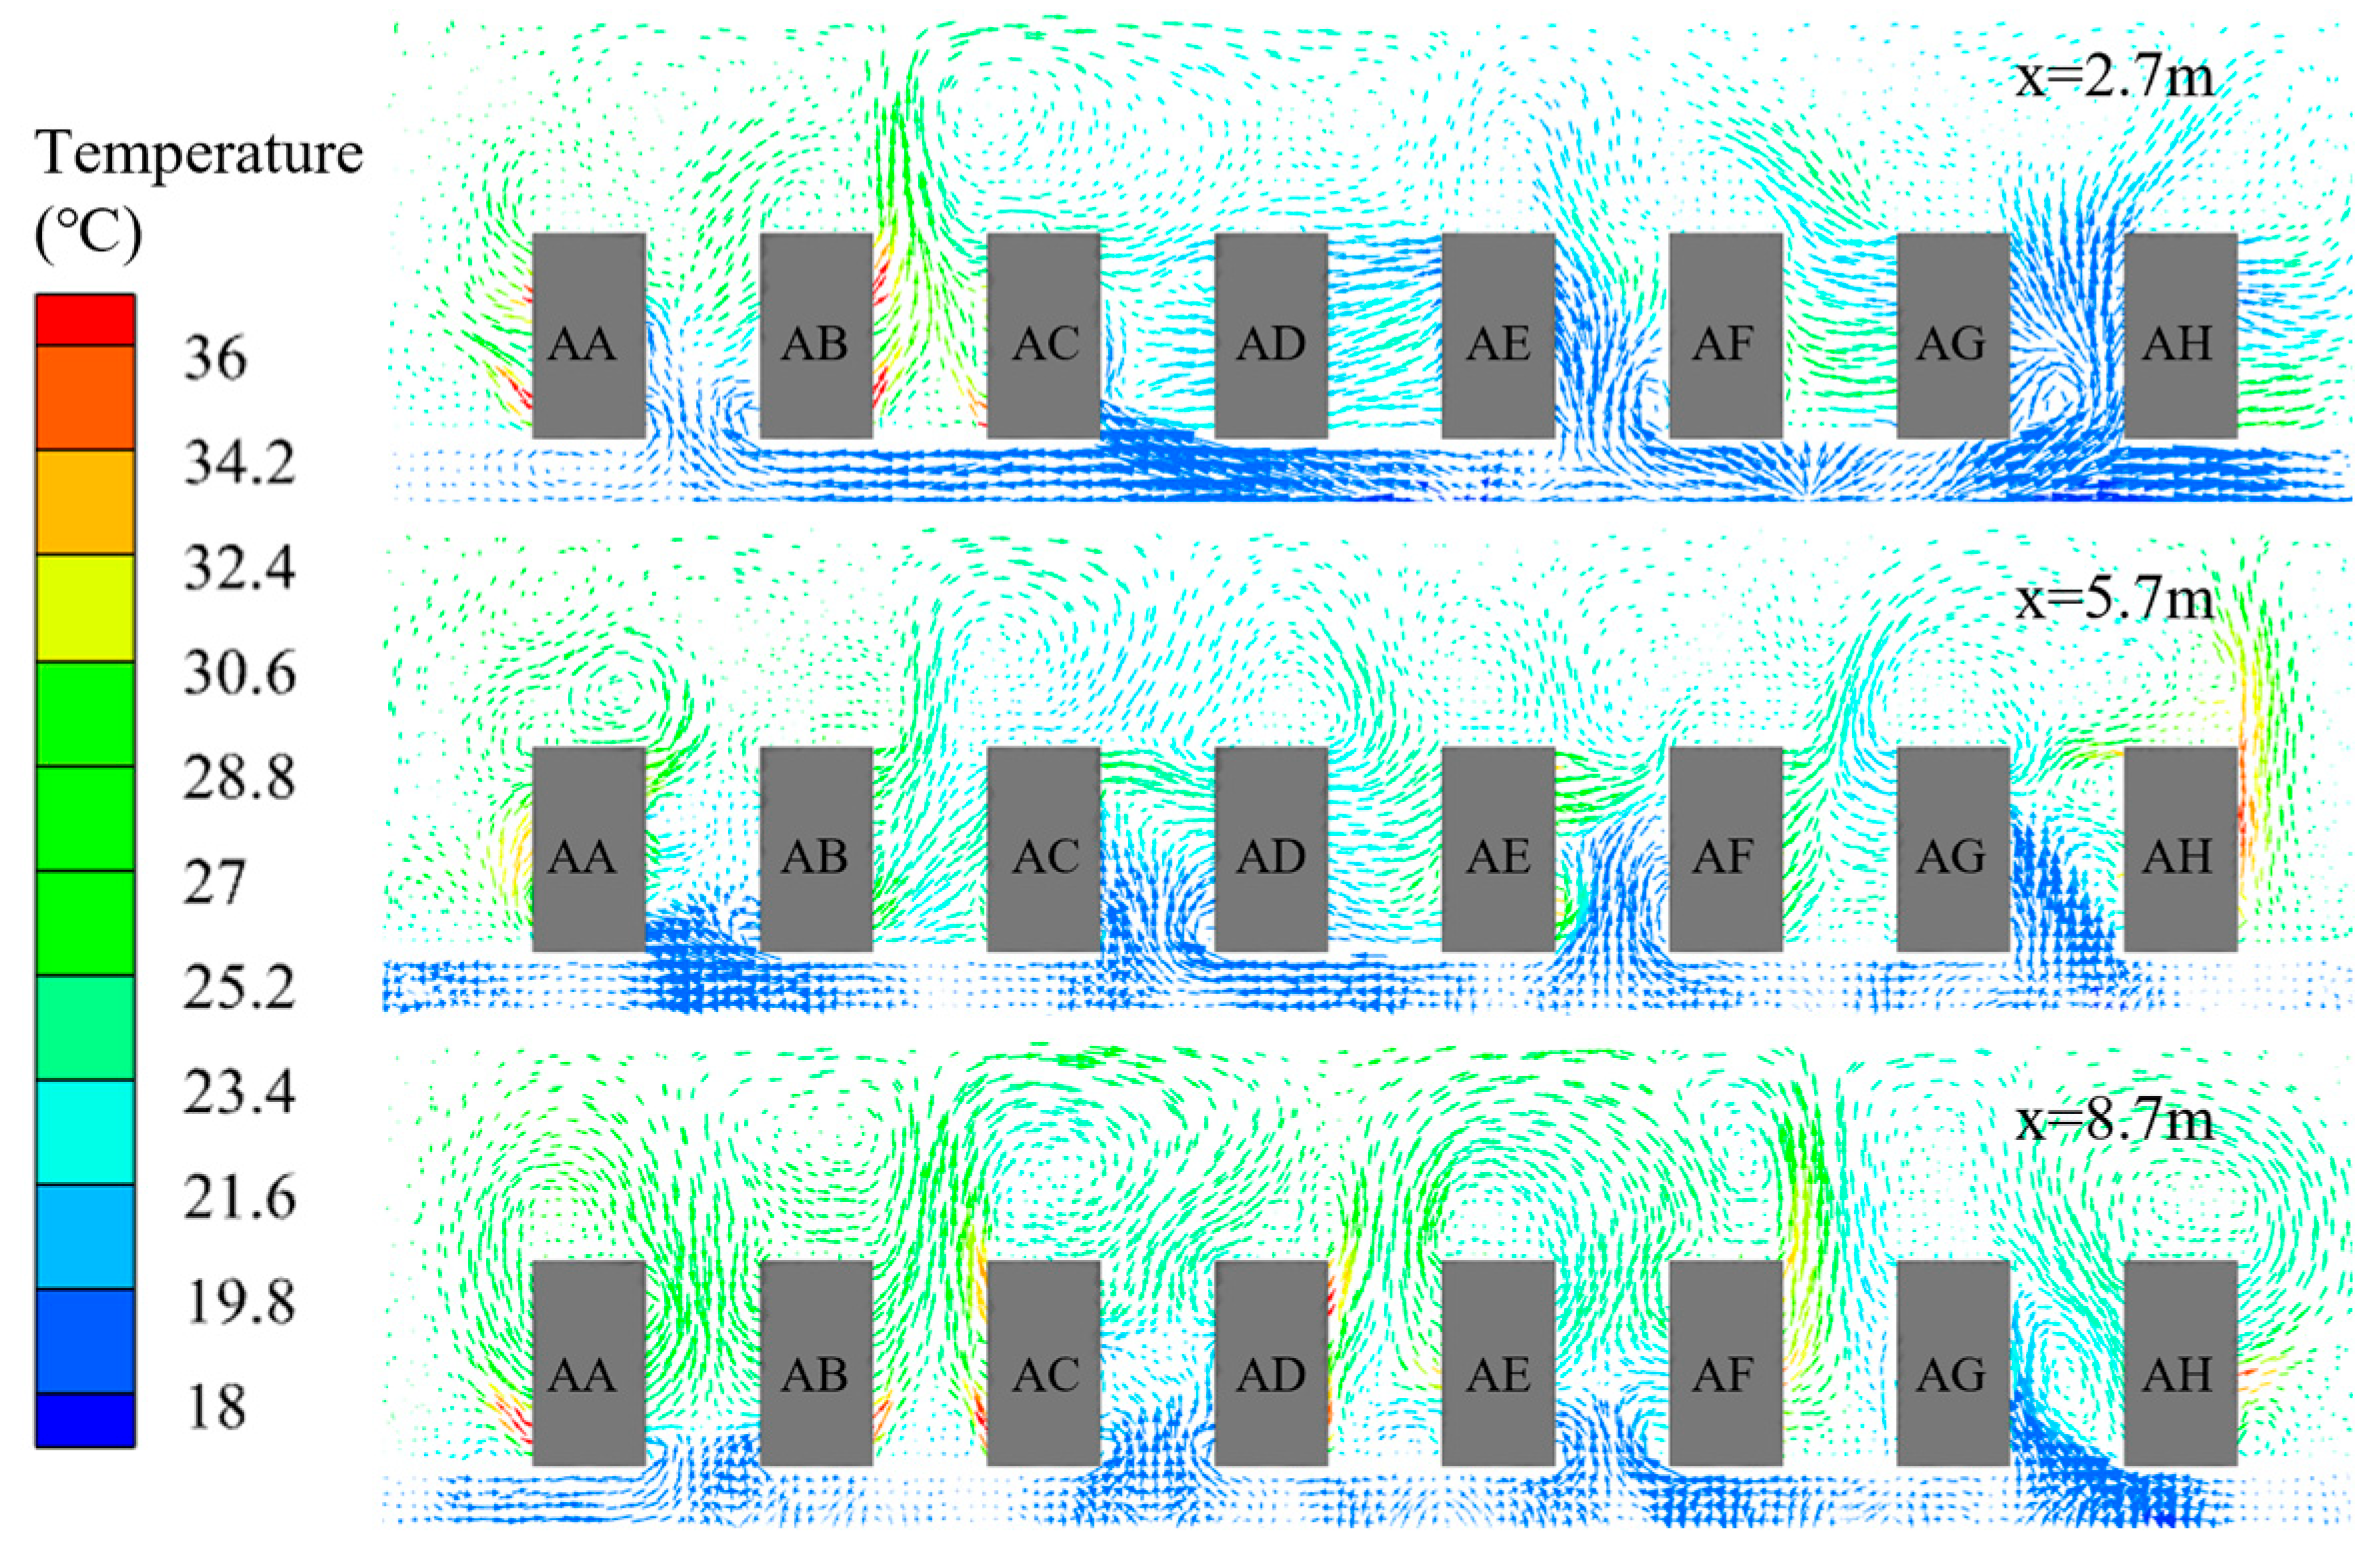
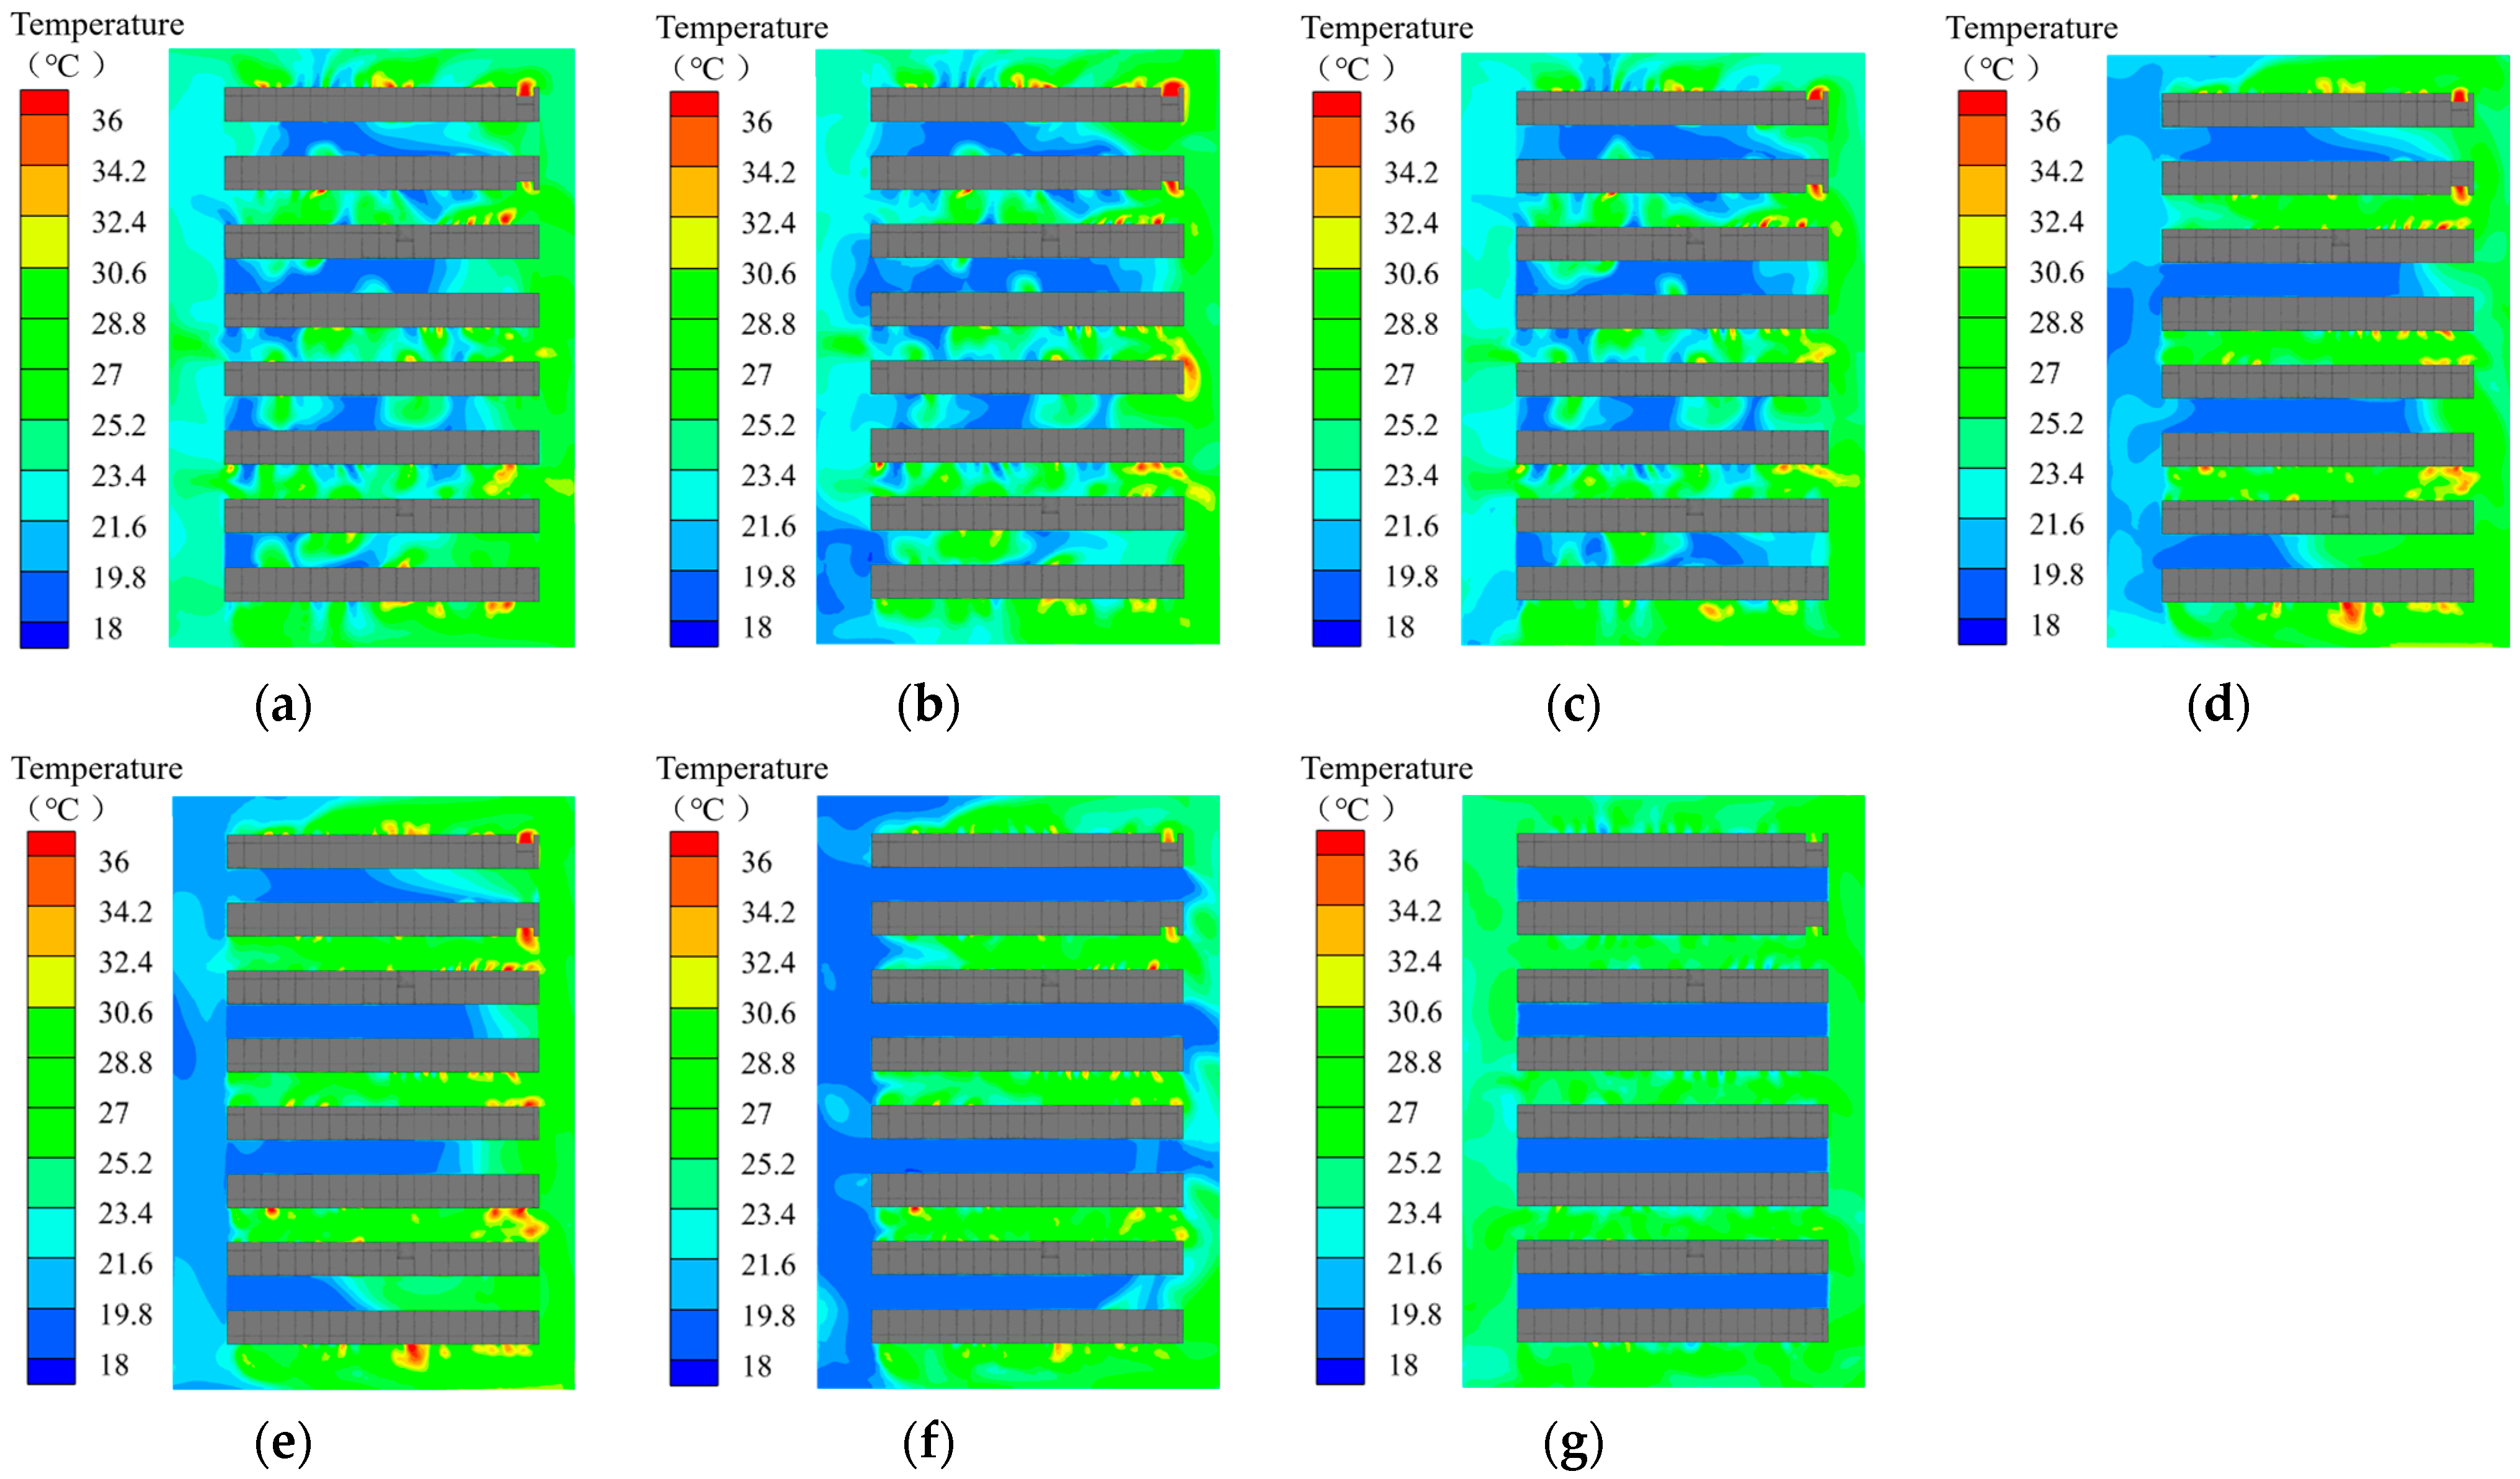
Figure 11 presents the temperature contour plots at the cross-section (z = 1.2 m) under different optimization strategies, while 
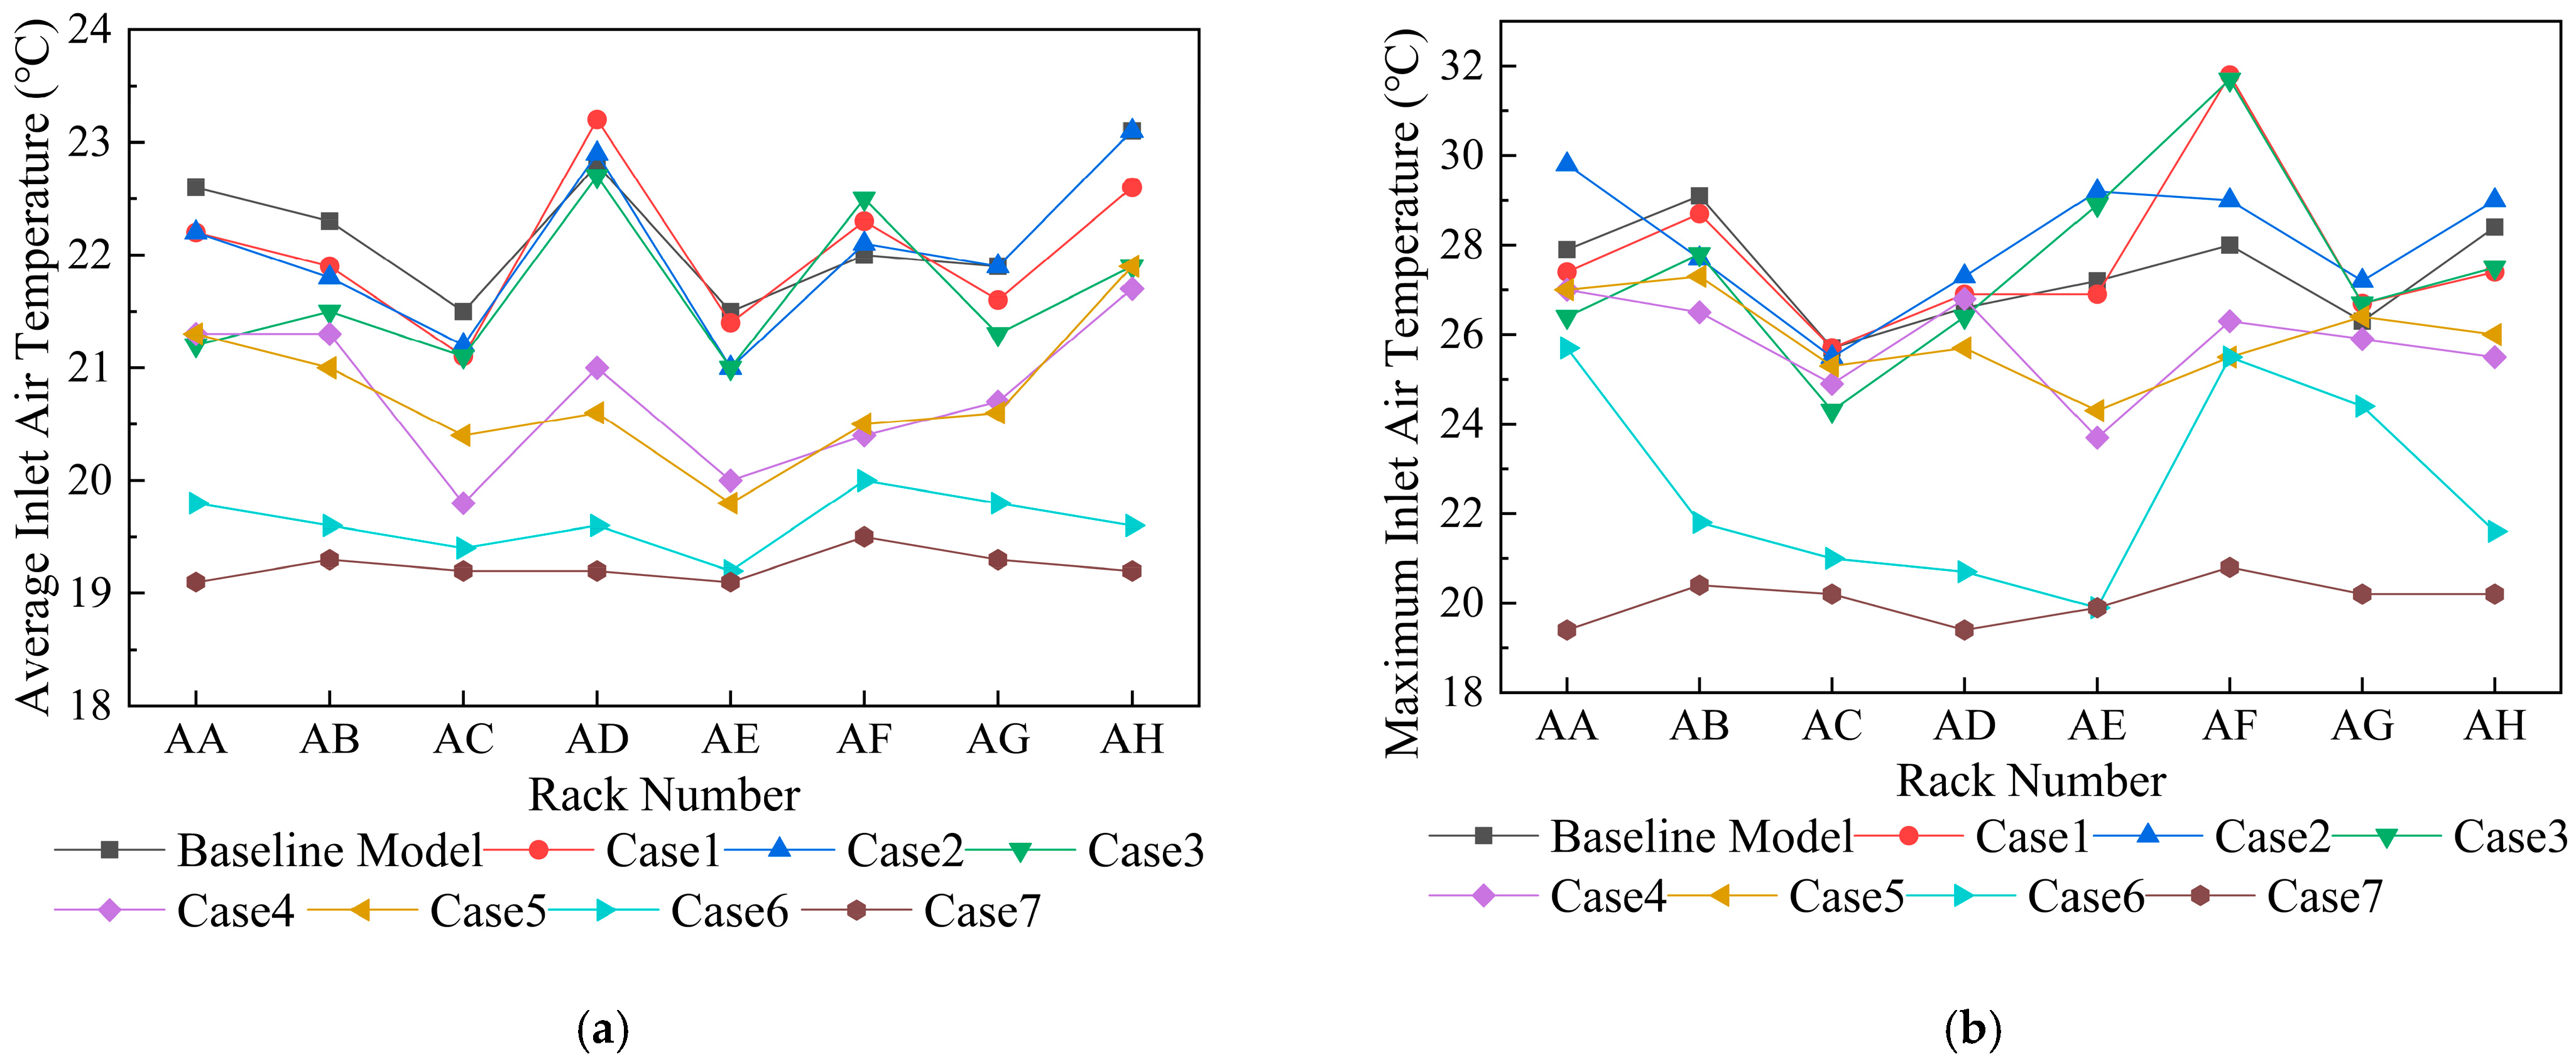
Figure 12 shows the average and maximum inlet air temperatures for each server rack row in both the baseline model and the optimized model.
A comparative analysis of Figure 11 and Figure 12 reveals that among the individual optimization strategies, Case1, Case2, and Case3 exhibit non-uniform temperature distributions and significant cold–hot air mixing.
Specifically, Case1 demonstrates a distinct temperature boundary on the left side of the cold aisle. Compared to the baseline model, this strategy achieves a 0.35 °C reduction in average server inlet temperatures for all rack rows except AD and AF. However, the high-temperature area expands at the left end of cold aisle EF, with the maximum inlet temperature reaching 32 °C for AF rack servers, indicating intensified hot air recirculation in localized zones.
In Case2, the bidirectional supply zone shows expanded blue low-temperature areas at this cross-section. However, compared with Scheme A, the average inlet air temperature of servers in this zone increases by 0.15 °C, indicating that the cold aisle top containment actually reduces the effective cooling capacity available for server cooling. In the unidirectional supply zone, the left side of cold aisle AB is almost entirely covered by high-temperature regions, with the maximum inlet air temperature of servers in row AA reaching 30 °C. This occurs because the underfloor-supplied cold air bypasses the servers and directly escapes from the cold aisle, causing the temperature in the return air zone to drop to approximately 20 °C.
In Case3, an overall expansion of the low-temperature zones within the cold aisles is observed, accompanied by a 0.6 °C reduction in the average server inlet temperature compared to the baseline configuration. However, intensified local thermal recirculation is identified in cold aisle EF, resulting in elevated maximum inlet temperatures for servers in row AE. Furthermore, both the average and peak inlet temperatures for servers in row AF are found to increase, with the maximum temperature reaching 32 °C, demonstrating comparable performance to Case1.
In Case4, the temperature field shows a distinct left—low/right—high non-uniform distribution pattern. Specifically, the return air temperature on the left side decreases to 21 °C, reducing the supply–return temperature differential to 2 °C. The cold air bypass-induced low-temperature zones in hot aisles are completely eliminated, leading to a significant reduction in average server inlet temperatures. However, localized high-temperature regions persist near the air conditioning units on the right side of rack rows, with maximum inlet temperatures exceeding 26 °C observed for servers in rows AA, AB, AD, and AF, suggesting potential hotspot risks.
In the combined optimization strategies, Case5 demonstrates no significant improvement in aisle temperature distribution, with large uncooled areas persisting at the right end of cold aisle AB in the unidirectional supply zone and cold aisle GH in the bidirectional supply zone.
In Case6, the return air temperature on the left side is further reduced, with cold aisles predominantly covered by blue zones, indicating significantly improved temperature uniformity. The average server inlet temperature decreases to 19.6 °C, although maximum inlet temperatures approaching 24 °C are still observed for servers in rows AA and AF. A significant reduction in exhaust air temperatures from high-power racks is achieved, indicating improved server cooling efficiency.
Case7 achieves complete physical segregation between cold and hot air streams, resulting in clearly defined thermal zones across the server room cross-section. Measurement data indicate that the average rack intake temperature remains consistently near the supply air temperature of 19 °C, with maximum intake temperatures staying at approximately 20 °C, maintaining a 7 °C safety margin below ASHRAE’s recommended upper limit of 27 °C. Under these conditions, the air conditioning setpoint temperature can be safely elevated to reduce cooling energy consumption while maintaining equipment cooling reliability.

4.4. Analysis of Thermal Environment Evaluation Metrics

Three thermal performance metrics—the Return Temperature Index (RTI), Supply Heat Index (SHI), and Rack Cooling Index (RCI)—are commonly employed to evaluate bypass airflow recirculation and mixing characteristics in data centers [7,31]. Notably, SHI can be applied for both room-level and row-level assessments [32]. 
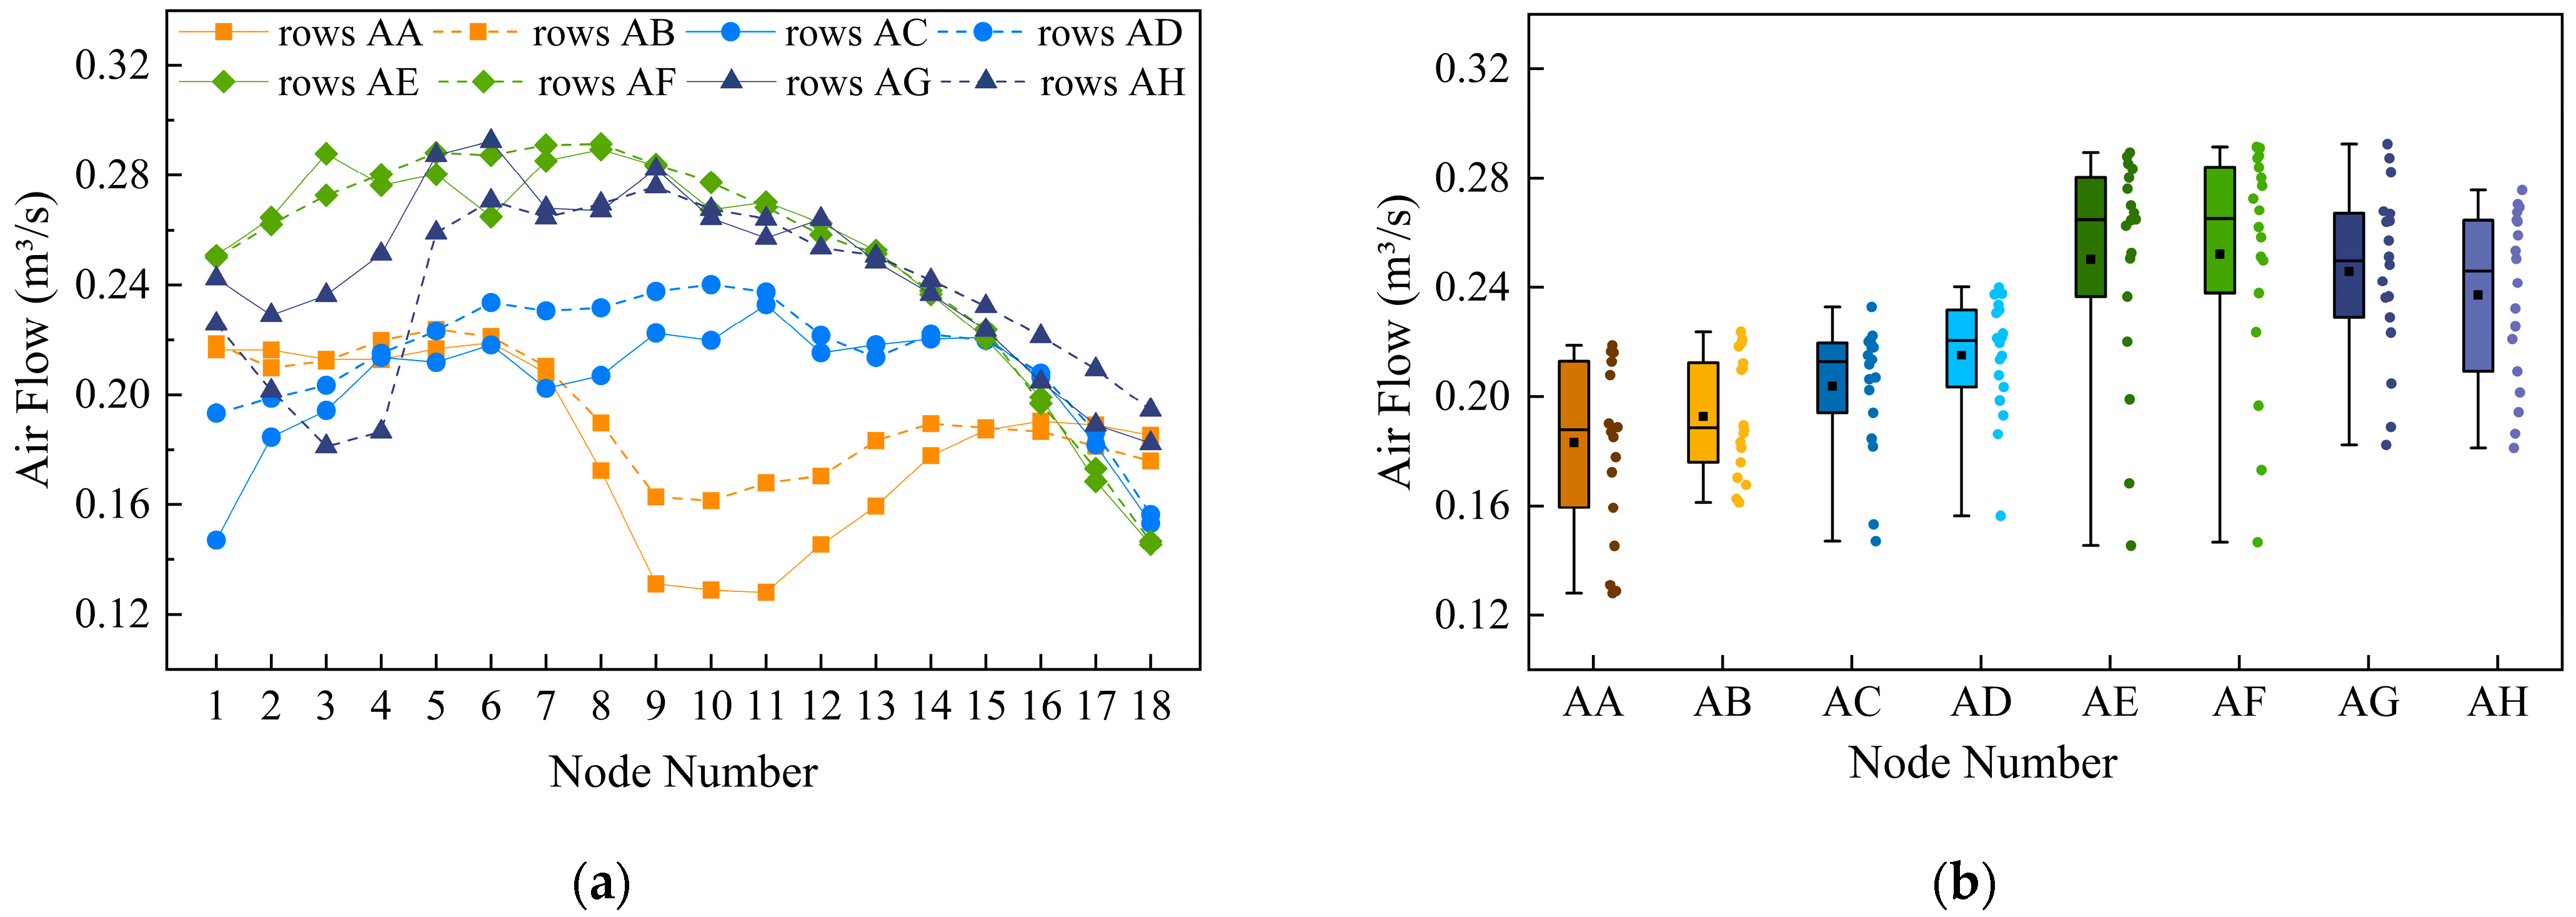
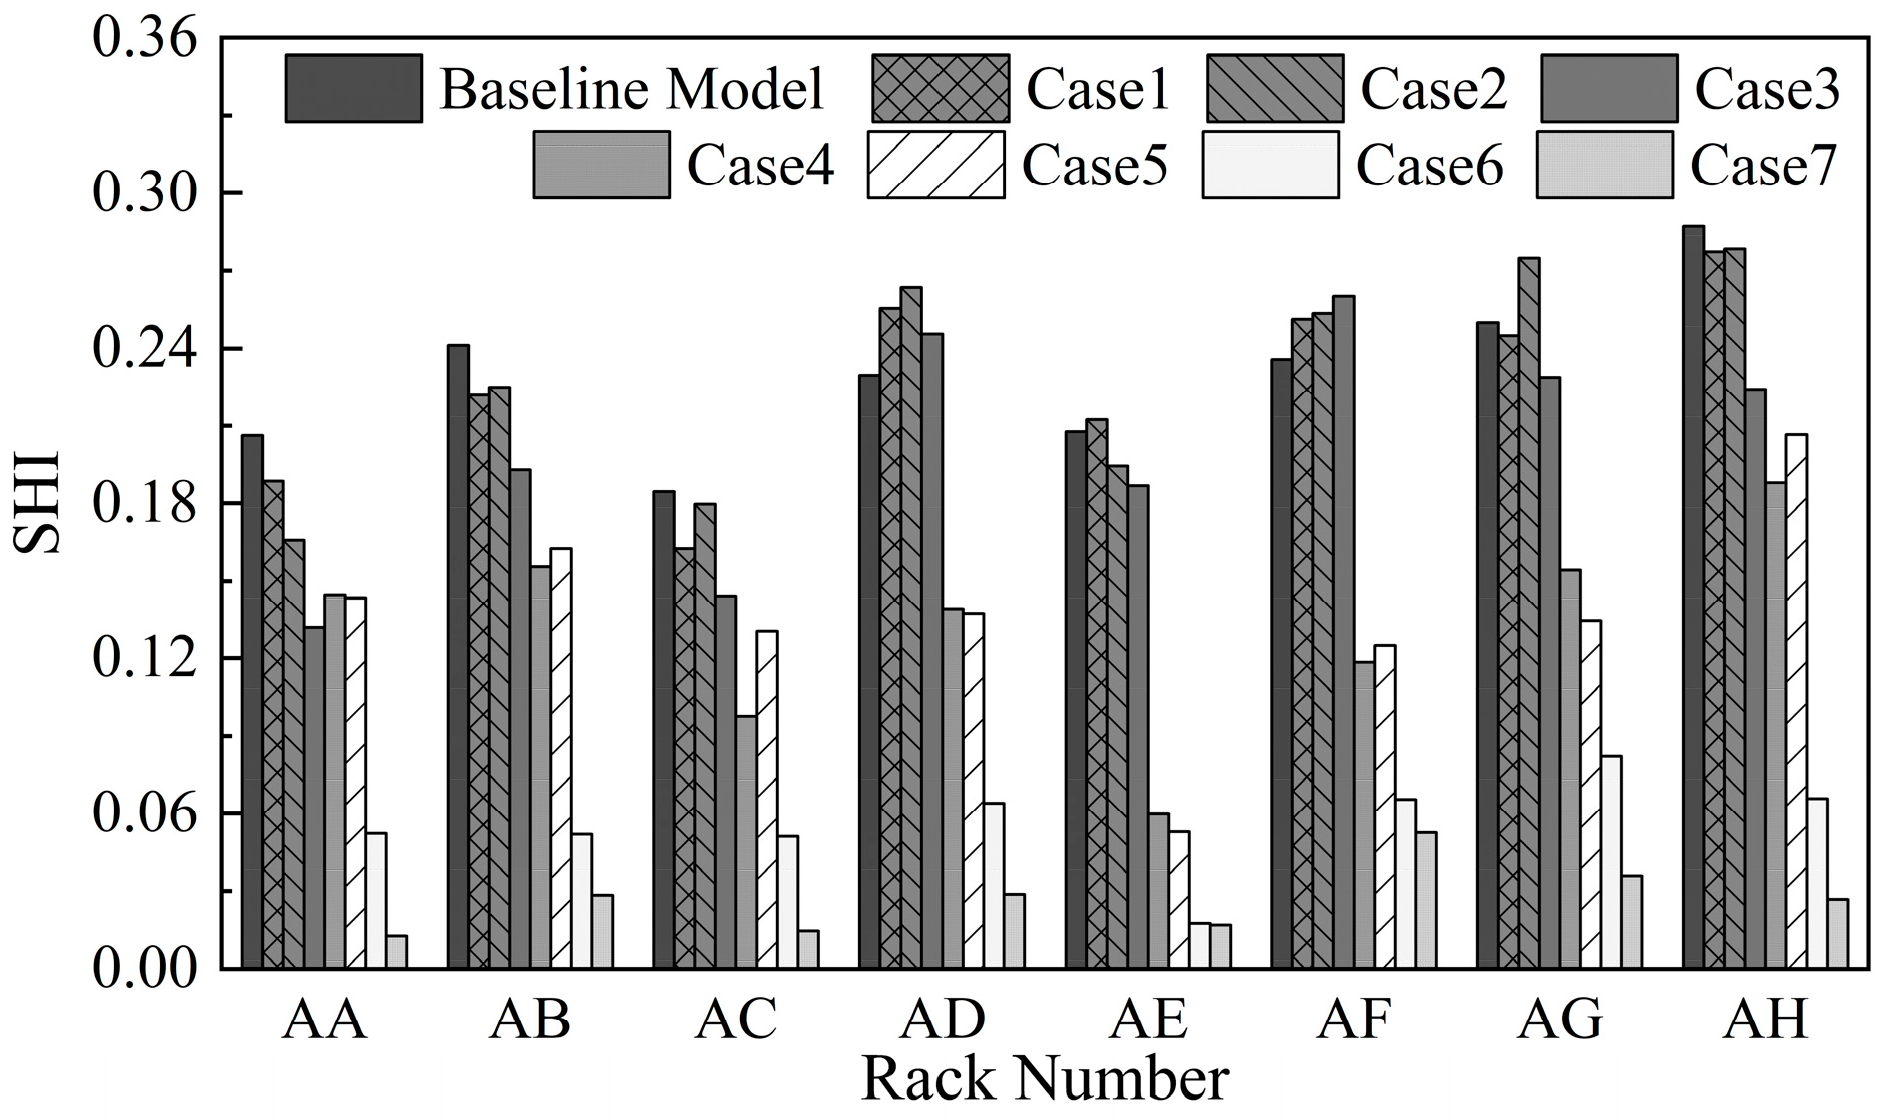
Figure 13 presents comparative SHI values for each rack row in the baseline and optimized configurations. The baseline model exhibits SHI values exceeding 0.2 for all rows except AC, indicating poor thermal conditions, with average SHI values of 0.215 and 0.245 for unidirectional and bidirectional supply zones, respectively.
Among individual optimization strategies, Case1, Case2, and Case3 demonstrate limited improvement in cooling utilization efficiency through partial or full aisle containment, while inadvertently increasing cooling loss during airflow delivery to servers in rows AD and AF, resulting in elevated SHI values. Case4 achieves significant reductions after implementing intake-side blanking panels on unoccupied rack spaces, with all row SHI values decreasing below 0.2—representing 46.9% and 37.7% reductions in bidirectional and unidirectional zones, respectively, compared to the baseline, establishing favorable thermal conditions.
For combined optimization strategies, Case5 shows regressed performance, with some rows (particularly AH at 0.206) exceeding Case4’s values. Both Case6 and Case7 achieve SHI values below 0.1 across all rows, indicating minimal air mixing and optimized cooling utilization efficiency.
Table 5 presents a comparative analysis of the overall thermal performance metrics between the baseline data center model and various optimization strategies. RTI < 1 across all configurations, indicating predominant cold air bypass with excessive air conditioning supply. Compared to the baseline model, strategies A and B demonstrate slight reductions in RTI, while Case3 exhibits a 1.78% RTI increase.
Following intake-side blanking panel implementation on unoccupied rack spaces, Case4, Case5, and Case6 demonstrate RTI reductions of 5.85%, 6.74%, and 3.94%, respectively, effectively mitigating hot air recirculation. Case7 achieves complete thermal separation (RTI = 1) with matched air conditioning and equipment temperature differentials.
All optimized strategies improve cooling utilization efficiency, with SHI reductions of 1.30% (Case1), 0.43% (Case2), 12.17% (Case3), 42.61% (Case4), 40.43% (Case4), 75.65% (Case6), and 88.26% (Case7) relative to the baseline. Prior to the implementation of rack blanking panels, the efficiency hierarchy becomes fully contained cold aisle containment > cold aisle door-only containment > cold aisle top-only containment. Following the implementation of rack blanking panels, the efficiency hierarchy becomes fully contained cold aisle containment > cold aisle top-only containment > cold aisle door-only containment. Under current operating conditions, Case4, Case5, Case6, and Case7 maintain RTI = 1, confirming compliance with ASHRAE thermal guidelines (inlet temperatures below recommended maximums) without localized hotspot risks.

5. Conclusions

This study investigates a bidirectional data center located in a hot-summer and warm-winter region, employing CFD numerical simulations combined with field measurements to analyze airflow characteristics and thermal environment features. Multiple practical retrofit solutions are proposed, with comparative evaluations conducted on their respective airflow patterns and cooling performance. The main research findings are summarized as follows:
(1) Under the current bidirectional air supply mode of the air conditioning system, the airflow distribution through perforated tiles exhibits distinct patterns characterized by either lower–middle/higher-end or higher–middle/lower-end configurations. The data center demonstrates excessive air supply from the cooling system, with cold air bypass dominating the overall airflow organization. However, severe mixing between cold and hot airflows is observed, resulting in imbalanced cooling capacity distribution and low cooling utilization efficiency.
(2) Among the individual optimization strategies, the rack blanking panel strategy demonstrates the most significant thermal environment improvement. Compared to the baseline model, it achieves 46.9% and 37.7% reductions in SHI values for racks in bidirectional and unidirectional supply zones, respectively, significantly enhancing cooling utilization efficiency. In contrast, cold aisle door-only containment, cold aisle top-only containment, and fully contained cold aisle containment show limited performance improvements with SHI reductions of 1.30%, 0.43%, and 12.17%, respectively, exhibiting minimal effects on cooling efficiency enhancement while increased SHI values are recorded in certain rack rows for these configurations.
(3) Among combined optimization strategies, the RCIHI is maintained at 1.0 across the computer room, indicating complete elimination of local hotspot risks. Rack blanking panels with fully contained cold aisle containment demonstrate superior thermal performance improvement compared to rack blanking panels with cold aisle top-only containment, which in turn outperforms rack blanking panels with cold aisle door-only containment. The implementation of rack blanking panels with full cold aisle containment achieves an SHI reduction to 0.027, corresponding to an 88.26% enhancement in cooling utilization efficiency.
(4) Among all optimization configurations, rack blanking panels with fully contained cold aisle containment demonstrate optimal performance improvement. However, full containment may potentially create negative pressure or fire safety concerns. The implementation of additional fire protection measures would further increase retrofit costs. Under budget constraints, rack blanking panels with cold aisle top-only containment represents the primary alternative, followed by rack blanking panels with cold aisle door-only containment as the secondary option.
This study validates the effectiveness of airflow optimization schemes in improving data center thermal environments, though certain limitations remain. Future work will focus on comprehensive lifecycle cost–benefit analysis, where an economic model incorporating initial investment, operational costs, and energy savings will be developed. Additionally, scalability analysis will be conducted to further validate the scheme’s applicability and return-on-investment period across different geographical locations and facility scales.

Author Contributions

Conceptualization, Y.W. and J.Y.; methodology, Y.W.; software, Y.W.; validation, Y.W. formal analysis, X.Z. and Y.W.; investigation, Y.W. and J.Y.; resources, J.Y.; data curation, Y.W. and J.Y.; writing—original draft preparation, Y.W.; writing—review and editing, X.Z. and Y.W.; visualization, X.Z. and Y.W.; supervision, J.Y. and X.Z.; project administration, J.Y.; funding acquisition, J.Y. All authors have read and agreed to the published version of the manuscript.

Funding

This research was funded by the Natural Science Foundation of Guangdong Province, grant number 2022A1515011128.

Institutional Review Board Statement

Not applicable.

Informed Consent Statement

Not applicable.

Data Availability Statement

The data presented in this study are available on request from the corresponding author due to the confidentiality requirements of the project.

Acknowledgments

The authors gratefully acknowledge Huang Xiaofei for her expert advice on data analysis.

Conflicts of Interest

The authors declare no conflicts of interest.

References

  1. Sulaman, M.; Yanchun, P.; Cosimo, M.; Yusen, L.; Muhammad, W. The Fourth Industrial Revolution and Environmental Efficiency: The Role of Fintech Industry. J. Clean. Prod. 2022, 381, 135196. [Google Scholar] [CrossRef]
  2. Shen, J.; Sun, D.J. Research on High-Quality Development of Computing Power Network: Practical Challenges, Institutional Foundations and Technological Supports. Artif. Intell. View 2024, 2, 20–31. [Google Scholar] [CrossRef]
  3. Rong, H.; Zhang, H.; Xiao, S.; Li, C.; Hu, C. Optimizing Energy Consumption for Data Centers. Renew. Sustain. Energy Rev. 2016, 58, 674–691. [Google Scholar] [CrossRef]
  4. Khalaj, A.H.; Halgamuge, S.K. A Review on Efficient Thermal Management of Air- and Liquid-Cooled Data Centers: From Chip to the Cooling System. Appl. Energy 2017, 205, 1165–1188. [Google Scholar] [CrossRef]
  5. Liu, Y.; Yang, X.; Li, J.; Zhao, X. Energy Savings of Hybrid Dew-Point Evaporative Cooler and Micro-Channel Separated Heat Pipe Cooling Systems for Computer Data Centers. Energy 2018, 163, 629–640. [Google Scholar] [CrossRef]
  6. Kanbur, B.B.; Wu, C.; Fan, S.; Duan, F. System-Level Experimental Investigations of the Direct Immersion Cooling Data Center Units with Thermodynamic and Thermoeconomic Assessments. Energy 2021, 217, 119373. [Google Scholar] [CrossRef]
  7. Lu, H.; Zhang, Z.; Yang, L. A Review on Airflow Distribution and Management in Data Center. Energy Build. 2018, 179, 264–277. [Google Scholar] [CrossRef]
  8. Lu, T.; Lü, X.; Remes, M.; Viljanen, M. Investigation of Air Management and Energy Performance in a Data Center in Finland: Case Study. Energy Build. 2011, 43, 3360–3372. [Google Scholar] [CrossRef]
  9. Tatchell-Evans, M.; Kapur, N.; Summers, J.; Thompson, H.; Oldham, D. An Experimental and Theoretical Investigation of the Extent of Bypass Air within Data Centres Employing Aisle Containment, and Its Impact on Power Consumption. Appl. Energy 2017, 186, 457–469. [Google Scholar] [CrossRef]
  10. Meng, X.; Zhou, J.; Zhang, X.; Luo, Z.; Gong, H.; Gan, T. Optimization of the Thermal Environment of a Small-Scale Data Center in China. Energy 2020, 196, 117080. [Google Scholar] [CrossRef]
  11. Zhao, R.; Du, Y.; Yang, X.; Zhou, Z.; Wang, W.; Yang, X. A Critical Review on the Thermal Management of Data Center for Local Hotspot Elimination. Energy Build. 2023, 297, 113486. [Google Scholar] [CrossRef]
  12. Chu, W.X.; Wang, C.C. CFD Investigation of Airflow Management in a Small Container Data Center. IEEE Trans. Compon. Packag. Manuf. Technol. 2019, 9, 2177–2188. [Google Scholar] [CrossRef]
  13. Jin, C.; Bai, X.; Yang, C. Effects of Airflow on the Thermal Environment and Energy Efficiency in Raised-Floor Data Centers: A Review. Sci. Total Environ. 2019, 695, 133801. [Google Scholar] [CrossRef]
  14. Min, W.; Sun, X.; Li, J. Simulation Study on the Influence of Air Supply Methods on Airflow Organization in Data Centers. Build. Sci. 2021, 37, 25–32. [Google Scholar] [CrossRef]
  15. Miao, Y.; Zhu, B.; Yue, T.; Lu, L. Review of Optimization Measures for Static Pressure Box in Data Centers. Build. Energy Effic. 2023, 51, 107–113. [Google Scholar] [CrossRef]
  16. Nada, S.A.; Said, M.A. Comprehensive study on the effects of plenum depths on air flow and thermal managements in data centers. Int. J. Therm. Sci. 2017, 122, 302–312. [Google Scholar] [CrossRef]
  17. Yu, F.; Chen, H.; Wang, W.; An, J. Optimization Strategies for Underfloor Air Distribution in a Small-Scale Data Center. Buildings 2025, 15, 428. [Google Scholar] [CrossRef]
  18. Nada, S.A.; Said, M.A. Effect of CRAC Units Layout on Thermal Management of Data Center. Appl. Therm. Eng. 2017, 118, 339–344. [Google Scholar] [CrossRef]
  19. Zhang, M.; Zhang, Z.; Hu, Y.; Geng, Y.; Huang, H.; Huang, Y. Effect of Raised Floor Height on Different Arrangement of Under-Floor Air Distribution Performance in Data Center. Procedia Eng. 2017, 205, 556–564. [Google Scholar] [CrossRef]
  20. Min, W.K.; Li, J.; Sun, X.Q.; Liao, S.G. Simulation Study on the Effect of Baffles on the Thermal Environment of Data Centers. Cryog. Supercond. 2021, 49, 52–59. [Google Scholar] [CrossRef]
  21. Mohsenian, G.; Khalili, S.; Sammakia, B. A design methodology for controlling local airflow delivery in data centers using air dampers. In Proceedings of the 2019 18th IEEE Intersociety Conference on Thermal and Thermomechanical Phenomena in Electronic Systems (ITherm), Las Vegas, NV, USA, 28–31 May 2019; pp. 905–911. [Google Scholar] [CrossRef]
  22. Wan, J.; Zhou, J.; Gui, X. Intelligent Rack-Level Cooling Management in Data Centers with Active Ventilation Tiles: A Deep Reinforcement Learning Approach. IEEE Intell. Syst. 2021, 36, 60–67. [Google Scholar] [CrossRef]
  23. Arghode, V.K.; Sundaralingam, V.; Joshi, Y. Air flow management in a contained cold aisle using active fan tiles for energy efficient data center operation. Heat Transf. Eng. 2015, 37, 246–256. [Google Scholar] [CrossRef]
  24. Chen, Y.X.; Liang, Z. Design and Optimization Analysis of Airflow Organization in Underfloor Ventilation Data Centers. Fluid. Mach. 2022, 50, 91–99. [Google Scholar]
  25. Wu, L.; Mao, R.; Wu, H.; Zhang, J.; Li, C.; Yi, X.; Huang, G.; Zhang, Z. Optimization of airflow organization in fan-wall data center via baffles. Appl. Therm. Eng. 2024, 244, 122745. [Google Scholar] [CrossRef]
  26. Arghode, V.K.; Sundaralingam, V.; Phelps, W.; Joshi, Y. Experimental characterization of various cold aisle containment configurations for data centers. J. Electron. Packag. 2013, 135, 011007. [Google Scholar] [CrossRef]
  27. Yuan, X.; Wang, Y.; Liu, J.; Xu, X.; Yuan, X. Experimental and numerical study of airflow distribution optimisation in high-density data centre with flexible baffles. Build. Environ. 2018, 140, 128–139. [Google Scholar] [CrossRef]
  28. Yuan, X.; Zhou, X.; Liu, J.; Wang, Y.; Kosonen, R.; Xu, X. Experimental and numerical investigation of an airflow management system in data center with lower-side terminal baffles for servers. Build. Environ. 2019, 155, 308–319. [Google Scholar] [CrossRef]
  29. GB 50174-2017; Code for Design of Electronic Information System Room. China Planning Press: Beijing, China, 2017.
  30. Ni, J.; Jin, B.W.; Zhang, B.; Wang, X.W. Simulation of Thermal Distribution and Airflow for Efficient Energy Consumption in a Small Data Centers. Sustainability 2017, 9, 664. [Google Scholar] [CrossRef]
  31. Chu, W.X.; Wang, C.C. A review on airflow management in data centers. Appl. Energy 2019, 240, 84–119. [Google Scholar] [CrossRef]
  32. Gong, X.M.; Zhang, Z.B.; Gan, S.X.; Niu, B.L.; Yang, L.; Xu, H.J.; Gao, M.F. A Review on Evaluation Metrics of Thermal Performance in Data Centers. Build. Environ. 2020, 177, 106907. [Google Scholar] [CrossRef]
  33. American Society of Heating, Refrigerating and Air-Conditioning Engineers (ASHRAE). Measurement of Energy, Demand, and Water Savings; ASHRAE Guideline 14; ASHRAE: Atlanta, GA, USA, 2014. [Google Scholar]
Figure 1. Layout of the computer room.
Applsci 15 05711 g001
Figure 2. Layout of measuring points. (a) Temperature measurement point distribution for rack rows (exemplified by Row AA). (b) Temperature measurement point distribution for single rack. (c) Velocity measurement points for perforated tile.
Applsci 15 05711 g002
Figure 3. Simulation model. (a) Baseline model; (b) mesh.
Applsci 15 05711 g003
Figure 4. Boundary conditions of the rack model.
Applsci 15 05711 g004
Figure 5. Comparison of measured and simulated values. (a) Airflow rates of perforated tiles; (b) temperature of the racks.
Applsci 15 05711 g005
Figure 6. Airflow distribution of plenum. (a) Streamline distribution; (b) pressure distribution.
Applsci 15 05711 g006
Figure 7. Airflow distribution of perforated tiles. (a) Line plot of airflow velocity distribution; (b) box plot of airflow velocity distributions.
Applsci 15 05711 g007
Figure 8. Velocity distribution of the baseline model.
Applsci 15 05711 g008
Figure 9. Temperature contour plots of the baseline model.
Applsci 15 05711 g009
Figure 10. Data center flow fields under different optimization strategies. (a) Case1; (b) Case2; (c) Case3; (d) Case4; (e) Case5; (f) Case6; (g) Case7.
Applsci 15 05711 g010
Figure 11. Data center temperature distribution under different optimization strategies. (a) Case1; (b) Case2; (c) Case3; (d) Case4; (e) Case5; (f) Case6; (g) Case7.
Applsci 15 05711 g011
Figure 12. Server inlet temperature. (a) Average inlet air temperatures for servers; (b) maximum inlet air temperatures for servers.
Applsci 15 05711 g012
Figure 13. Comparison of rack’s SHI across different airflow optimization strategies.
Applsci 15 05711 g013
Table 1. Summary of instruments.
NameRangeAccuracy
FLUKE 925 Wind speed recorder (FLUKE, Everett, DC, USA)0.40 m/s~25.00 m/s±0.01 m/s
FLUKE 971 Temperature recorder (FLUKE, Everett, DC, USA)−20 °C~60 °C±0.5 °C
Table 2. The measured power consumption of each rack (kW).
NumberAAABACADAEAFAGAH
13.41.33.43.41.51.00.60.6
23.42.8/ODF0.70.70.60.6
31.5ODF4.02.80.70.71.72.6
41.51.42.82.70.70.60.92.6
54.24.02.50.30.70.62.83.5
63.02.33.02.51.91.93.44.0
74.24.01.5/1.91.91.81.8
83.02.31.5/2.32.51.62.9
92.90.01.7///0.83.6
102.42.42.5/2.62.22.03.1
113.5/3.43.02.4/0.72.7
122.8ODF1.00.23.3ODF/1.5
132.82.50.50.53.83.60.80.3
140.10.10.20.2/3.40.10.1
152.12.64.03.33.33.91.51.6
164.33.93.02.42.32.91.31.8
174.34.04.03.63.13.10.10.1
182.42.82.92.52.42.44.04.0
Table 3. Boundary conditions for the data center.
ConstantsValuesType
CRAC supply air temperature19 °CVelocity inlet
CRAC supply air rate40~60%
CRAC return air/Pressure outlet
Server heat dissipationActual measurementsVolumetric heat source
Perforated tile porosity36%Porous jump model
Rack door porosity86%Porous jump model
walls/Adiabatic wall
Table 4. Airflow optimization strategies.
CategoryIndexOptimization Contents
Individual optimization strategiesCase1Cold aisle door-only containment
Case2Cold aisle top-only containment
Case3Fully contained cold aisle containment
Case4Rack blanking panels
Combined optimization strategiesCase5Rack blanking panels + Cold aisle door-only containment
Case6Rack blanking panels + Cold aisle top-only containment
Case7Rack blanking panels + Fully contained cold aisle containment
Table 5. Comparison of thermal metrics across different airflow optimization strategies.
Baseline ModelCase1Case2Case3Case4Case5Case6Case7
RTI 0.7860.7820.7840.8000.7400.7330.7551
SHI 0.2300.2270.2290.2020.1320.1370.0560.027
RCI HI 0.9920.9850.9720.9841111
Disclaimer/Publisher’s Note: The statements, opinions and data contained in all publications are solely those of the individual author(s) and contributor(s) and not of MDPI and/or the editor(s). MDPI and/or the editor(s) disclaim responsibility for any injury to people or property resulting from any ideas, methods, instructions or products referred to in the content.

